Embed Size (px)
Citation preview

Equity | India
Our Top 10 Value Picks
17 June, 2015
Retail Desk 1
Special Report
Our Top 10 picks for 3 years:
Company Name Recommended
Price (`)
Target
Price (`) Potential Upside (%)
Kitex Garments Ltd. 914 1,705 87%
Tata Elxsi Ltd. 1,117 2,167 94%
Kovai Medical Center & Hospital Ltd 560 1,118 100%
Eicher Motors Ltd. 19,297 36,957 92%
Wabco India Ltd. 5,406 10,474 94%
Repro India Ltd. 452 926 105%
Kajaria Ceramics Ltd. 760 1,330 75%
BASF India Ltd. 1,091 2,079 91%
Gulf Oil Lubricants India Ltd. 442 802 82%
United Spirits Ltd. 3,465 6,854 98%

Equity | India
Our Top 10 Value Picks 17 June, 2015
BUY
Retail Desk | Sales Note 2
CMP (`) Target (`)
914 1,705
Potential upside Absolute Rating
87% BUY
Market Info (as on 17th June 2015)
BSE Sensex 26,832.66
Nifty S&P 8,091.55
Stock Detail
BSE Group B
BSE Code 521248
NSE Code KITEX
Bloomberg Code KTG IN
Market Cap (`bn) 43.62
Free Float (%) 46%
52wk Hi/Lo 1009 / 220
Avg. Daily Volume (NSE) 286080
Face Value / Div. per share (`) 1.00 / 1.25
Shares Outstanding (mn) 47.5
Shareholding Pattern
Promoters FIIs DII Others
54.24 2.40 0.17 43.19
Financial Snapshot (`mn)
Y/E March FY15 FY16E FY17E FY18E
Net Sales 5,111 6,133 7,667 10,000
EBITDA 1,687 2,269 3,220 5,000
Net Profit 985 1,288 1,840 2,700
P/E(x) 44.1 33.7 23.6 16.1
ROE (%) 37.3 39.1 41.2 43.5
EPS 20.7 27.1 38.7 56.8
Share Price Performance
80
130
180
230
280
330
380
430
480
Jun-1
4
Jul-
14
Aug-1
4
Sep-1
4
Oct
-14
Nov-
14
Dec-
14
Jan-1
5
Feb-1
5
Mar-
15
Apr-
15
May-
15
Jun-1
5
Kitex Garments Ltd BSE SENSEX
Rel. Perf. 1Mth 3 Mths 6Mths 1Yr
Kitex (%) 5.2 71.5 71.7 286.5
Sensex (%) (3.6) (6.2) (0.4) 5.9
Source: Company data, Retail Research
Kitex Garments Ltd. - Company Snapshot
Kitex Garments Ltd. (KGL) is a Kochi based company which manufactures and exports infant
garments. It derives 85% of its revenues from sale of infant garments and remaining 15% of its
revenues by selling fabric to its unlisted firm Kitex Childrenswear Ltd (KCL). Company exports 90%
of its infant garments to US and remaining 10% to Europe. It has several big clientele namely
Gerber, Carter, Toys R Us, Mothercare and Jockey. It recently added two more clients Children’s
Place and Kohl’s in FY15. KGL along with KCL is the third infant manufacturer in the world with
0.55 mn pieces per day and aims to become number 1 infant wear manufacturer in the world in
next few years.
Investment Rationale
Phase 2 of Growth – Launching of own brand and Licensing of private labels
KGL is now eyeing for next phase of growth by acquiring licenses of few private labels in US and
also through launching of its own brand in US. Company is already negotiating with few private
labels for acquiring its licenses and expects to finalise couple of private labels by this fiscal year.
The sales from licenses of these private labels will start from FY16E onwards.
Company has already got the necessary clearances and approvals from US government for launching
its own brand in US. It has also registered its merchandising company “Kitex USA LLC” in US in
Q3FY15 and expects sales to start kicking in from FY16E from its own brand. Both these initiatives
will boost companies EBITDA margins significantly. Company expects to do $15mn sales in CY16E
and by 2020 they expect to clock in $100 mn sales from these two initiatives. Management expects
to reach 50% plus margins in next few years with these initiatives which is 1700 basis improvement
in its FY15 margins (~33%). This will significantly increase company’s bottom line going forward.
Doubling of turnover with minimal capital expenditures in next three years
KGL has outlined minimal capital expenditures of `100 to `150 mn a year for next three years as
major capital expenditure of `750 mn was undertaken in FY14 to replace the old machines with the
new ones. These will help in improving productivity and reducing wastage. Also the recently
replaced sewing machines will have increased speed from 6,000 stitches per hour to 9,000 stitches
per hour. All these efforts will lead to increased output thereby increasing the top line.
Management expects company to post `10 bn to `12 bn in top line in next three years with these
initiatives i.e. (Sales CAGR of 25%)
Key Risk : Merger of Kitex Garments Ltd. (KGL) and Kitex Childrenswear Ltd. (KCL)
Management plans to merge the unlisted entity KCL with itself in FY16E. It has already appointed
E&Y as an internal auditor for the merger. The company wants to merge both the companies
together because: 1. It wants to become number 1 infant wear company in the world. 2. Both the
company operates in same line of business – infant wear manufacturer. 3. Clients of both the
companies are more or less same. 4. Margins of both the companies are similar. 5. Capacities are
more or less same. 6. KCL holds 15% plus stake in KGL.
The swap ratio of the merger unknown, which can lead to substantial equity dilution in the listed
entity thereby dragging the eps lower and stretching the valuations higher
Valuation
At CMP of `914 , KGL is trading at 16.1x its FY18E EPS of `56.8 which is at an attractive valuation.
With 25% sales and 40% PAT CAGR (FY15- FY18E), debt free status by FY18E, strong margin
improvement (1700 basis points by FY18E) with sales from its own brand and licensing of private
labels and strong return ratios ( 40% plus ROE and ROCE both), We expect stock to trade at 30x
(0.75x PEG) its FY18E EPS of `56.8. We assign a BUY rating on the stock with a price target of
`1,705 in next three years which is more than 87% upside from current levels.
Equity | India
Our Top 10 Value Picks 17 June, 2015
BUY
Retail Desk | Sales Note 3
CMP (`) Target (`)
1,117 2,167
Potential upside Absolute Rating
94% BUY
Market Info (as on 17th June 2015)
BSE Sensex 26,832.66
Nifty S&P 8,091.55
Stock Detail
BSE Group A
BSE Code 500408
NSE Code TATAELXSI
Bloomberg Code TELX IN
Market Cap (`bn) 35.18
Free Float (%) 55%
52wk Hi/Lo 1,487 / 498
Avg. Daily Volume (NSE) 461133
Face Value / Div. per share (`) 10.00 / 9.00
Shares Outstanding (mn) 31.1
Shareholding Pattern
Promoters FIIs DII Others
44.95 8.16 3.31 43.58
Financial Snapshot (`mn)
Y/E March FY15 FY16E FY17E FY18E
Net Sales 8,494 10,618 13,803 18,000
EBITDA 1,773 2,336 3,175 4,500
Net Profit 1,020 1,327 1,794 2,700
P/E(x) 34.0 26.2 19.4 12.9
ROE (%) 36.0 39.3 42.2 45.5
EPS 32.8 42.6 57.6 86.7
Share Price Performance
80
100
120
140
160
180
200
220
240
260
280
Jun-1
4
Jul-
14
Aug-1
4
Sep-1
4
Oct
-14
Nov-
14
Dec-
14
Jan-1
5
Feb-1
5
Mar-
15
Apr-
15
May-
15
Jun-1
5
Tata Elxsi Ltd BSE SENSEX
Rel. Perf. 1Mth 3 Mths 6Mths 1Yr
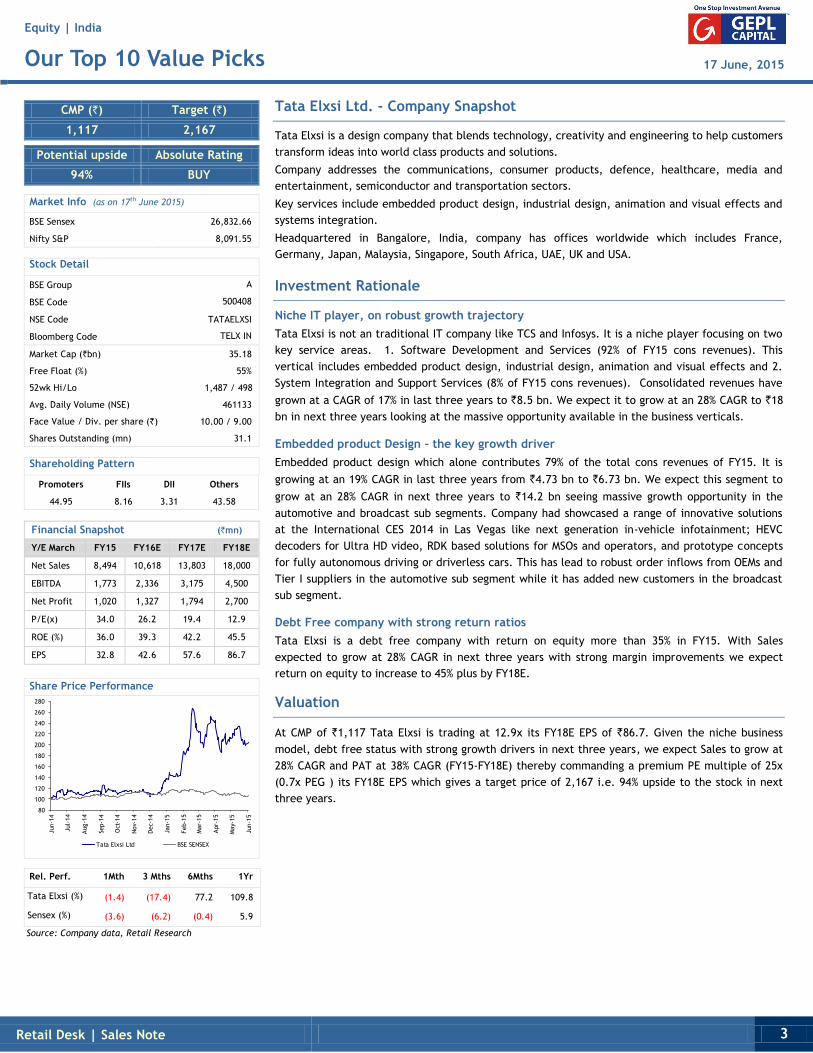
Tata Elxsi (%) (1.4) (17.4) 77.2 109.8
Sensex (%) (3.6) (6.2) (0.4) 5.9
Source: Company data, Retail Research
Tata Elxsi Ltd. - Company Snapshot
Tata Elxsi is a design company that blends technology, creativity and engineering to help customers
transform ideas into world class products and solutions.
Company addresses the communications, consumer products, defence, healthcare, media and
entertainment, semiconductor and transportation sectors.
Key services include embedded product design, industrial design, animation and visual effects and
systems integration.
Headquartered in Bangalore, India, company has offices worldwide which includes France,
Germany, Japan, Malaysia, Singapore, South Africa, UAE, UK and USA.
Investment Rationale
Niche IT player, on robust growth trajectory
Tata Elxsi is not an traditional IT company like TCS and Infosys. It is a niche player focusing on two
key service areas. 1. Software Development and Services (92% of FY15 cons revenues). This
vertical includes embedded product design, industrial design, animation and visual effects and 2.
System Integration and Support Services (8% of FY15 cons revenues). Consolidated revenues have
grown at a CAGR of 17% in last three years to `8.5 bn. We expect it to grow at an 28% CAGR to `18
bn in next three years looking at the massive opportunity available in the business verticals.
Embedded product Design – the key growth driver
Embedded product design which alone contributes 79% of the total cons revenues of FY15. It is
growing at an 19% CAGR in last three years from `4.73 bn to `6.73 bn. We expect this segment to
grow at an 28% CAGR in next three years to `14.2 bn seeing massive growth opportunity in the
automotive and broadcast sub segments. Company had showcased a range of innovative solutions
at the International CES 2014 in Las Vegas like next generation in-vehicle infotainment; HEVC
decoders for Ultra HD video, RDK based solutions for MSOs and operators, and prototype concepts
for fully autonomous driving or driverless cars. This has lead to robust order inflows from OEMs and
Tier I suppliers in the automotive sub segment while it has added new customers in the broadcast
sub segment.
Debt Free company with strong return ratios
Tata Elxsi is a debt free company with return on equity more than 35% in FY15. With Sales
expected to grow at 28% CAGR in next three years with strong margin improvements we expect
return on equity to increase to 45% plus by FY18E.
Valuation
At CMP of `1,117 Tata Elxsi is trading at 12.9x its FY18E EPS of `86.7. Given the niche business
model, debt free status with strong growth drivers in next three years, we expect Sales to grow at
28% CAGR and PAT at 38% CAGR (FY15-FY18E) thereby commanding a premium PE multiple of 25x
(0.7x PEG ) its FY18E EPS which gives a target price of 2,167 i.e. 94% upside to the stock in next
three years.
Equity | India
Our Top 10 Value Picks 17 June, 2015
BUY
Retail Desk | Sales Note 4
CMP (`) Target (`)
560 1,118
Potential upside Absolute Rating
100% BUY
Market Info (as on 17th June 2015)
BSE Sensex 26,832.66
Nifty S&P 8,091.55
Stock Detail
BSE Group T
BSE Code 523323
NSE Code KOVAI
Bloomberg Code KMC IN
Market Cap (`bn) 6.073
Free Float (%) 50%
52wk Hi/Lo 693 / 207
Avg. Daily Volume (BSE) 1476
Face Value / Div. per share (`) 10.00 / 1.00
Shares Outstanding (mn) 10.9
Shareholding Pattern
Promoters FIIs DII Others
50.02 0.33 -- 49.65
Financial Snapshot (`mn)
Y/E March FY15 FY16E FY17E FY18E
Net Sales 4,016 4,900 6,075 7,594
EBITDA 943 1,225 1,519 1,975
Net Profit 387 539 699 873
P/E(x) 15.8 11.4 8.8 7.0
ROE (%) 28.0 29.5 30.2 32.5
EPS 35.5 49.3 63.9 79.8
Share Price Performance
80
130
180
230
280
330
Jun-1
4
Jul-
14
Aug-1
4
Sep-1
4
Oct
-14
Nov-
14
Dec-
14
Jan-1
5
Feb-1
5
Mar-
15
Apr-
15
May-
15
Jun-1
5
Kovai Medical Center & Hospital Ltd BSE SENSEX
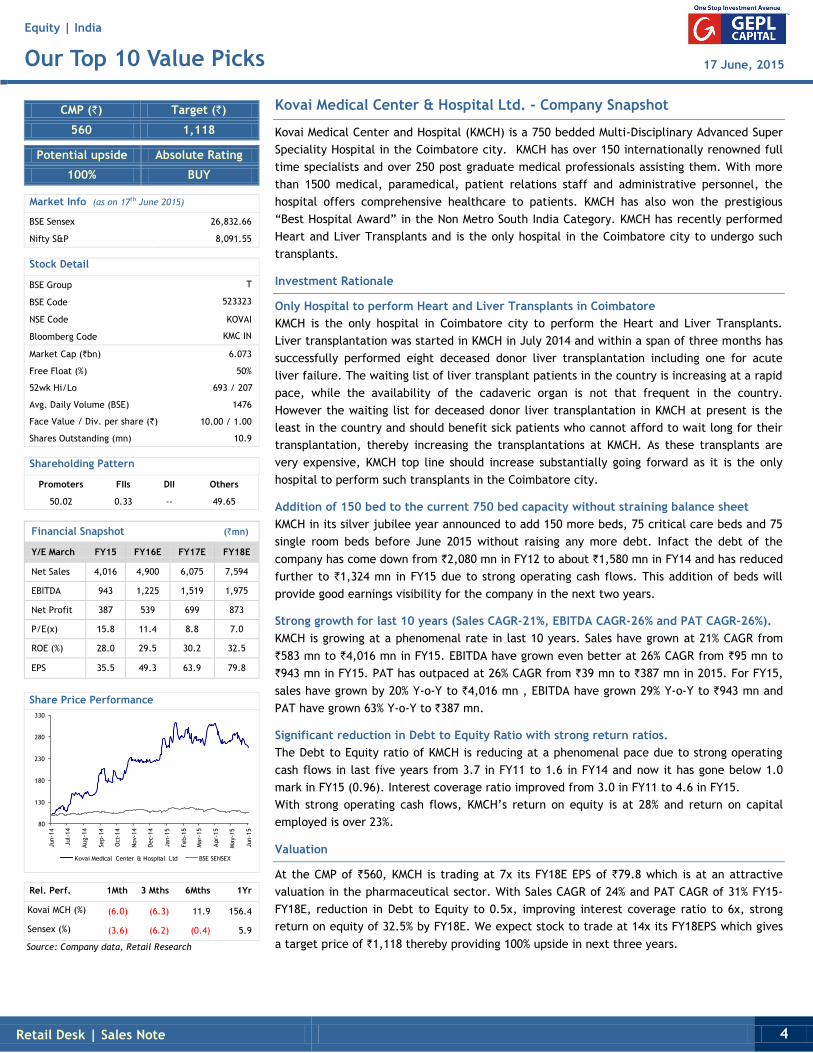
Rel. Perf. 1Mth 3 Mths 6Mths 1Yr
Kovai MCH (%) (6.0) (6.3) 11.9 156.4
Sensex (%) (3.6) (6.2) (0.4) 5.9
Source: Company data, Retail Research
Kovai Medical Center & Hospital Ltd. - Company Snapshot
Kovai Medical Center and Hospital (KMCH) is a 750 bedded Multi-Disciplinary Advanced Super
Speciality Hospital in the Coimbatore city. KMCH has over 150 internationally renowned full
time specialists and over 250 post graduate medical professionals assisting them. With more
than 1500 medical, paramedical, patient relations staff and administrative personnel, the
hospital offers comprehensive healthcare to patients. KMCH has also won the prestigious
“Best Hospital Award” in the Non Metro South India Category. KMCH has recently performed
Heart and Liver Transplants and is the only hospital in the Coimbatore city to undergo such
transplants.
Investment Rationale
Only Hospital to perform Heart and Liver Transplants in Coimbatore
KMCH is the only hospital in Coimbatore city to perform the Heart and Liver Transplants.
Liver transplantation was started in KMCH in July 2014 and within a span of three months has
successfully performed eight deceased donor liver transplantation including one for acute
liver failure. The waiting list of liver transplant patients in the country is increasing at a rapid
pace, while the availability of the cadaveric organ is not that frequent in the country.
However the waiting list for deceased donor liver transplantation in KMCH at present is the
least in the country and should benefit sick patients who cannot afford to wait long for their
transplantation, thereby increasing the transplantations at KMCH. As these transplants are
very expensive, KMCH top line should increase substantially going forward as it is the only
hospital to perform such transplants in the Coimbatore city.
Addition of 150 bed to the current 750 bed capacity without straining balance sheet
KMCH in its silver jubilee year announced to add 150 more beds, 75 critical care beds and 75
single room beds before June 2015 without raising any more debt. Infact the debt of the
company has come down from `2,080 mn in FY12 to about `1,580 mn in FY14 and has reduced
further to `1,324 mn in FY15 due to strong operating cash flows. This addition of beds will
provide good earnings visibility for the company in the next two years.
Strong growth for last 10 years (Sales CAGR-21%, EBITDA CAGR-26% and PAT CAGR-26%).
KMCH is growing at a phenomenal rate in last 10 years. Sales have grown at 21% CAGR from
`583 mn to `4,016 mn in FY15. EBITDA have grown even better at 26% CAGR from `95 mn to
`943 mn in FY15. PAT has outpaced at 26% CAGR from `39 mn to `387 mn in 2015. For FY15,
sales have grown by 20% Y-o-Y to `4,016 mn , EBITDA have grown 29% Y-o-Y to `943 mn and
PAT have grown 63% Y-o-Y to `387 mn.
Significant reduction in Debt to Equity Ratio with strong return ratios.
The Debt to Equity ratio of KMCH is reducing at a phenomenal pace due to strong operating
cash flows in last five years from 3.7 in FY11 to 1.6 in FY14 and now it has gone below 1.0
mark in FY15 (0.96). Interest coverage ratio improved from 3.0 in FY11 to 4.6 in FY15.
With strong operating cash flows, KMCH’s return on equity is at 28% and return on capital
employed is over 23%.
Valuation
At the CMP of `560, KMCH is trading at 7x its FY18E EPS of `79.8 which is at an attractive
valuation in the pharmaceutical sector. With Sales CAGR of 24% and PAT CAGR of 31% FY15-
FY18E, reduction in Debt to Equity to 0.5x, improving interest coverage ratio to 6x, strong
return on equity of 32.5% by FY18E. We expect stock to trade at 14x its FY18EPS which gives
a target price of `1,118 thereby providing 100% upside in next three years.
Equity | India
Our Top 10 Value Picks 17 June, 2015
BUY
Retail Desk | Sales Note 5
CMP (`) Target (`)
19,297 36,957
Potential upside Absolute Rating
92% BUY
Market Info (as on 17th June 2015)
BSE Sensex 26,832.66
Nifty S&P 8,091.55
Stock Detail
BSE Group A
BSE Code 505200
NSE Code EICHERMOT
Bloomberg Code EIM IN
Market Cap (`bn) 511.90
Free Float (%) 41%
52wk Hi/Lo 19,525 / 7,061
Avg. Daily Volume (NSE) 103568
Face Value / Div. per share (`) 10.00 / 50.00
Shares Outstanding (mn) 27.1
Shareholding Pattern
Promoters FIIs DII Others
54.98 22.07 6.07 16.88
Financial Snapshot (`bn)
Y/E March CY14 FY16E FY17E FY18E
Net Sales 87.4 163.8 215.3 262.1
EBITDA 11.2 23.9 33.9 44.8
Net Profit 6.2 16.6 23.7 31.3
P/E(x) 85.0 31.6 22.1 16.7
ROE (%) 24.5 45.1 48.8 48.7
EPS 227.1 611.4 874.7 1,154.9
Share Price Performance
80
100
120
140
160
180
200
220
240
260
280
Jun-1
4
Jul-
14
Aug-1
4
Sep-1
4
Oct
-14
Nov-
14
Dec-
14
Jan-1
5
Feb-1
5
Mar-
15
Apr-
15
May-
15
Jun-1
5
Eicher Motors Ltd BSE SENSEX
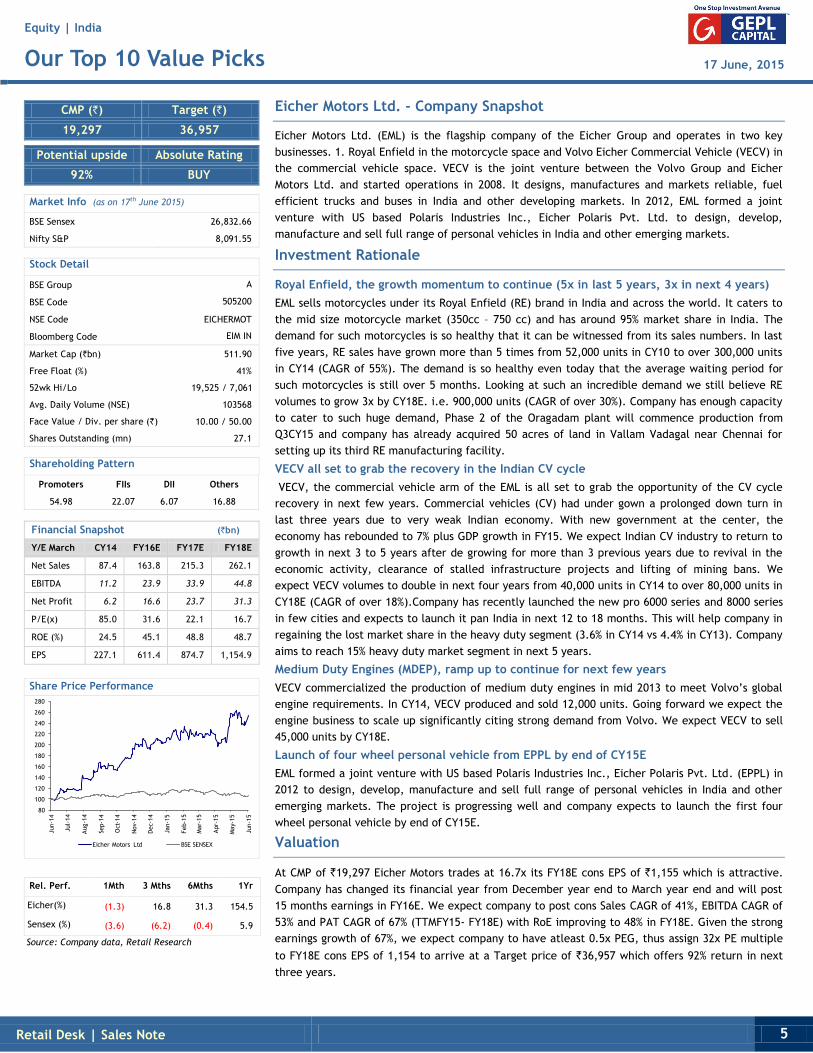
Rel. Perf. 1Mth 3 Mths 6Mths 1Yr
Eicher(%) (1.3) 16.8 31.3 154.5
Sensex (%) (3.6) (6.2) (0.4) 5.9
Source: Company data, Retail Research
Eicher Motors Ltd. - Company Snapshot
Eicher Motors Ltd. (EML) is the flagship company of the Eicher Group and operates in two key
businesses. 1. Royal Enfield in the motorcycle space and Volvo Eicher Commercial Vehicle (VECV) in
the commercial vehicle space. VECV is the joint venture between the Volvo Group and Eicher
Motors Ltd. and started operations in 2008. It designs, manufactures and markets reliable, fuel
efficient trucks and buses in India and other developing markets. In 2012, EML formed a joint
venture with US based Polaris Industries Inc., Eicher Polaris Pvt. Ltd. to design, develop,
manufacture and sell full range of personal vehicles in India and other emerging markets.
Investment Rationale
Royal Enfield, the growth momentum to continue (5x in last 5 years, 3x in next 4 years)
EML sells motorcycles under its Royal Enfield (RE) brand in India and across the world. It caters to
the mid size motorcycle market (350cc – 750 cc) and has around 95% market share in India. The
demand for such motorcycles is so healthy that it can be witnessed from its sales numbers. In last
five years, RE sales have grown more than 5 times from 52,000 units in CY10 to over 300,000 units
in CY14 (CAGR of 55%). The demand is so healthy even today that the average waiting period for
such motorcycles is still over 5 months. Looking at such an incredible demand we still believe RE
volumes to grow 3x by CY18E. i.e. 900,000 units (CAGR of over 30%). Company has enough capacity
to cater to such huge demand, Phase 2 of the Oragadam plant will commence production from
Q3CY15 and company has already acquired 50 acres of land in Vallam Vadagal near Chennai for
setting up its third RE manufacturing facility.
VECV all set to grab the recovery in the Indian CV cycle
VECV, the commercial vehicle arm of the EML is all set to grab the opportunity of the CV cycle
recovery in next few years. Commercial vehicles (CV) had under gown a prolonged down turn in
last three years due to very weak Indian economy. With new government at the center, the
economy has rebounded to 7% plus GDP growth in FY15. We expect Indian CV industry to return to
growth in next 3 to 5 years after de growing for more than 3 previous years due to revival in the
economic activity, clearance of stalled infrastructure projects and lifting of mining bans. We
expect VECV volumes to double in next four years from 40,000 units in CY14 to over 80,000 units in
CY18E (CAGR of over 18%).Company has recently launched the new pro 6000 series and 8000 series
in few cities and expects to launch it pan India in next 12 to 18 months. This will help company in
regaining the lost market share in the heavy duty segment (3.6% in CY14 vs 4.4% in CY13). Company
aims to reach 15% heavy duty market segment in next 5 years.
Medium Duty Engines (MDEP), ramp up to continue for next few years
VECV commercialized the production of medium duty engines in mid 2013 to meet Volvo’s global
engine requirements. In CY14, VECV produced and sold 12,000 units. Going forward we expect the
engine business to scale up significantly citing strong demand from Volvo. We expect VECV to sell
45,000 units by CY18E.
Launch of four wheel personal vehicle from EPPL by end of CY15E
EML formed a joint venture with US based Polaris Industries Inc., Eicher Polaris Pvt. Ltd. (EPPL) in
2012 to design, develop, manufacture and sell full range of personal vehicles in India and other
emerging markets. The project is progressing well and company expects to launch the first four
wheel personal vehicle by end of CY15E.
Valuation
At CMP of `19,297 Eicher Motors trades at 16.7x its FY18E cons EPS of `1,155 which is attractive.
Company has changed its financial year from December year end to March year end and will post
15 months earnings in FY16E. We expect company to post cons Sales CAGR of 41%, EBITDA CAGR of
53% and PAT CAGR of 67% (TTMFY15- FY18E) with RoE improving to 48% in FY18E. Given the strong
earnings growth of 67%, we expect company to have atleast 0.5x PEG, thus assign 32x PE multiple
to FY18E cons EPS of 1,154 to arrive at a Target price of `36,957 which offers 92% return in next
three years.
Equity | India
Our Top 10 Value Picks 17 June, 2015
BUY
Retail Desk | Sales Note 6
CMP (`) Target (`)
5,406 10,474
Potential upside Absolute Rating
94% BUY
Market Info (as on 17th June 2015)
BSE Sensex 26,832.66
Nifty S&P 8,091.55
Stock Detail
BSE Group B
BSE Code 533023
NSE Code WABCOINDIA
Bloomberg Code WIL IN
Market Cap (`bn) 103.20
Free Float (%) 25%
52wk Hi/Lo 6,038 / 2,813
Avg. Daily Volume (NSE) 7265
Face Value / Div. per share (`) 5.00 / 5.00
Shares Outstanding (mn) 18.9
Shareholding Pattern
Promoters FIIs DII Others
75.00 2.41 8.68 13.91
Financial Snapshot (`bn)
Y/E March FY15 FY16E FY17E FY18E
Net Sales 12.7 17.9 23.8 29.8
EBITDA 2.0 3.2 4.7 5.7
Net Profit 1.2 2.1 3.2 3.8
P/E(x) 85.0 50.1 32.6 26.8
ROE (%) 14.9 - - -
EPS 63.6 107.9 165.9 201.4
* Bloomberg consensus
Share Price Performance
80
100
120
140
160
180
200
220
240
Jun-1
4
Jul-
14
Aug-1
4
Sep-1
4
Oct
-14
Nov-
14
Dec-
14
Jan-1
5
Feb-1
5
Mar-
15
Apr-
15
May-
15
Jun-1
5
WABCO India Ltd BSE SENSEX
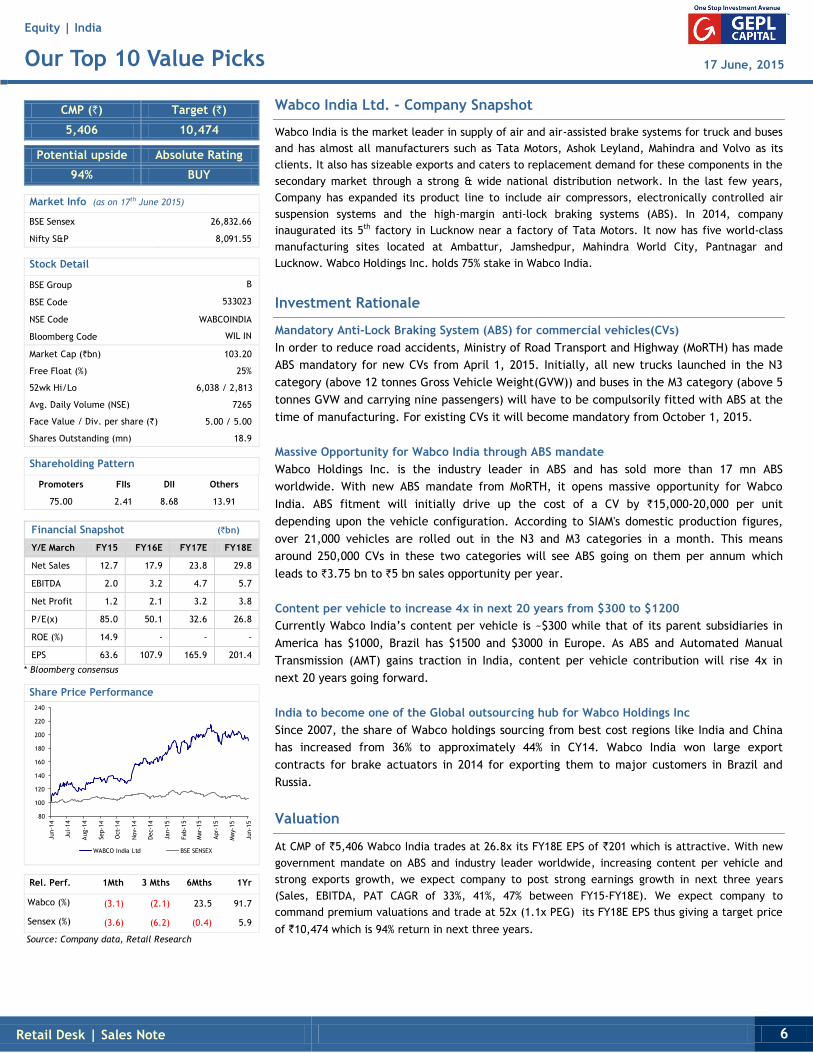
Rel. Perf. 1Mth 3 Mths 6Mths 1Yr
Wabco (%) (3.1) (2.1) 23.5 91.7
Sensex (%) (3.6) (6.2) (0.4) 5.9
Source: Company data, Retail Research
Wabco India Ltd. - Company Snapshot
Wabco India is the market leader in supply of air and air-assisted brake systems for truck and buses
and has almost all manufacturers such as Tata Motors, Ashok Leyland, Mahindra and Volvo as its
clients. It also has sizeable exports and caters to replacement demand for these components in the
secondary market through a strong & wide national distribution network. In the last few years,
Company has expanded its product line to include air compressors, electronically controlled air
suspension systems and the high-margin anti-lock braking systems (ABS). In 2014, company
inaugurated its 5th factory in Lucknow near a factory of Tata Motors. It now has five world-class
manufacturing sites located at Ambattur, Jamshedpur, Mahindra World City, Pantnagar and
Lucknow. Wabco Holdings Inc. holds 75% stake in Wabco India.
Investment Rationale
Mandatory Anti-Lock Braking System (ABS) for commercial vehicles(CVs)
In order to reduce road accidents, Ministry of Road Transport and Highway (MoRTH) has made
ABS mandatory for new CVs from April 1, 2015. Initially, all new trucks launched in the N3
category (above 12 tonnes Gross Vehicle Weight(GVW)) and buses in the M3 category (above 5
tonnes GVW and carrying nine passengers) will have to be compulsorily fitted with ABS at the
time of manufacturing. For existing CVs it will become mandatory from October 1, 2015.
Massive Opportunity for Wabco India through ABS mandate
Wabco Holdings Inc. is the industry leader in ABS and has sold more than 17 mn ABS
worldwide. With new ABS mandate from MoRTH, it opens massive opportunity for Wabco
India. ABS fitment will initially drive up the cost of a CV by `15,000-20,000 per unit
depending upon the vehicle configuration. According to SIAM's domestic production figures,
over 21,000 vehicles are rolled out in the N3 and M3 categories in a month. This means
around 250,000 CVs in these two categories will see ABS going on them per annum which
leads to `3.75 bn to `5 bn sales opportunity per year.
Content per vehicle to increase 4x in next 20 years from $300 to $1200
Currently Wabco India’s content per vehicle is ~$300 while that of its parent subsidiaries in
America has $1000, Brazil has $1500 and $3000 in Europe. As ABS and Automated Manual
Transmission (AMT) gains traction in India, content per vehicle contribution will rise 4x in
next 20 years going forward.
India to become one of the Global outsourcing hub for Wabco Holdings Inc
Since 2007, the share of Wabco holdings sourcing from best cost regions like India and China
has increased from 36% to approximately 44% in CY14. Wabco India won large export
contracts for brake actuators in 2014 for exporting them to major customers in Brazil and
Russia.
Valuation
At CMP of `5,406 Wabco India trades at 26.8x its FY18E EPS of `201 which is attractive. With new
government mandate on ABS and industry leader worldwide, increasing content per vehicle and
strong exports growth, we expect company to post strong earnings growth in next three years
(Sales, EBITDA, PAT CAGR of 33%, 41%, 47% between FY15-FY18E). We expect company to
command premium valuations and trade at 52x (1.1x PEG) its FY18E EPS thus giving a target price
of `10,474 which is 94% return in next three years.

Equity | India
Our Top 10 Value Picks 17 June, 2015
BUY
Retail Desk | Sales Note 7
CMP (`) Target (`)
452 926
Potential upside Absolute Rating
105% BUY
Market Info (as on 17th June 2015)
BSE Sensex 26,832.66
Nifty S&P 8,091.55
Stock Detail
BSE Group B
BSE Code 532687
NSE Code REPRO
Bloomberg Code REPR IN
Market Cap (`bn) 4.88
Free Float (%) 30%
52wk Hi/Lo 609 / 183
Avg. Daily Volume (NSE) 27362
Face Value / Div. per share (`) 10.00 / 10.00
Shares Outstanding (mn) 10.9
Shareholding Pattern
Promoters FIIs DII Others
69.62 0.27 1.98 28.13
Financial Snapshot (`mn)
Y/E March FY15 FY16E FY17E FY18E
Net Sales 3,951 5,034 6,476 8,419
EBITDA 409 755 1,101 1,684
Net Profit 197 378 518 842
P/E(x) 25.0 13.1 9.5 5.9
ROE (%) 9.6 12.5 17.5 23.0
EPS 18.1 34.6 47.5 77.2
Share Price Performance
80
130
180
230
280
330
Jun-1
4
Jul-
14
Aug-1
4
Sep-1
4
Oct
-14
Nov-
14
Dec-
14
Jan-1
5
Feb-1
5
Mar-
15
Apr-
15
May-
15
Jun-1
5
Repro India Ltd BSE SENSEX
Rel. Perf. 1Mth 3 Mths 6Mths 1Yr
Rapro (%) (13.3) 23.9 64.0 127.3
Sensex (%) (3.6) (6.2) (0.4) 5.9
Source: Company data, Retail Research
Repro India Ltd. - Company Snapshot
Repro India is a provider of content, print and fulfillment solutions to publishers, corporates,
education institutions and governments. They bring efficiencies to their customer’s value chain by
providing them a one stop solution to their needs, right from managing and repurposing content, to
printing and binding to delivery anywhere across the globe.
Company serves customers across four continents and is also certified for ISO 9001-2008, ISO 14000
– 2004, FSC, PEFC and SEDEX for their quality, environment & social compliance practices. They
also have been awarded the CAPEXIL Export Award for being India’s leading books exporter, for 5
years.
Investment Rationale
Decade relationship of Marquee customers
Repro India has key marquee customers like Oxford University Press, Pearson and Penguin since last
ten years. 80% of its customers give repeated business to the company with long term contracts
ranging from two to ten years. This gives company a good revenue visibility over a long period.
New Initiatives like RAPPLES and E-Tail are the new growth drivers going forward
Company has taken two new initiatives in order to accelerate growth in next few years. Company
has created a customized solution RAPPLES (Repro Applied Learning Solutions) which offers 360
degree mutli sensory learning experience with pre-loaded textbooks delivered on tablets. Company
has invested `220 mn in last two years in RAPPLES. For Publishers this will help to create, store
digitally, produce and reach their books to millions of children and for students, they will have
“Bagless” learning experience with the benefits of multimedia and interactions. Company has also
invested `30 mn in FY15 for the E-Tailing opportunity. Company has tied up with international and
Indian e-tailers enabling the listing of publishers titles on the e-tail site , giving customers global
titles with significantly reduced lead times and price.
Worst over for Exports, order visibility improving
Exports have de grown at an 28% CAGR in last three years from `2.2 bn to `1.14 bn. This was
mainly on account of postponement of the export orders due to Ebola crisis, elections, imposition
of import duty and devaluation of local currency in West Africa. Exports as % of total sales have
reduced from 58% in FY13 to 29% in FY15 thereby affecting total EBITDA margins which dipped
750bps to 10.4% in FY15 and PAT dipped to `1.97 bn. Nigeria is Ebola free, new government took
over recently on 29 May 2015 and import duty is also clarified. All these will help in getting new
export orders going forward. At start of FY16E, company has export order worth `260 mn versus
`15 mn at the beginning of last year. Company expects to execute these orders in Q1FY16E and is
hopeful of getting more orders from Nigeria going forward.
Domestic business: Moving from pure print to full service player
Company has been moving more and more customers from pure print to full services which include
Print on Demand, fulfillment and content creation in FY15. This has helped in improving domestic
EBITDA margins by 500bps from 9.2% to 14.2% in FY15. Going forward, company expects to move
more and more clients to full services thereby increasing margins.
Valuation
At CMP of `452, Repro India trades at 5.9x its FY18E EPS of `77.2 which is at an attractive
valuation. We expect revenues to grow significantly due to new initiatives taken by the company in
last two years and exports starting to contribute more to the topline, Margins improving due to
more export contribution and more customers in the domestic market moving to full services
thereby enhancing profitability in next three years. Stock should trade at 12x its FY18E EPS going
forward which leads to a target price of `926 in next three years thus providing a potential return
of 105%.
Equity | India
Our Top 10 Value Picks 17 June, 2015
BUY
Retail Desk | Sales Note 8
CMP (`) Target (`)
760 1,330
Potential upside Absolute Rating
75% BUY
Market Info (as on 17th June 2015)
BSE Sensex 26,832.66
Nifty S&P 8,091.55
Stock Detail
BSE Group A
BSE Code 500233
NSE Code KAJARIACER
Bloomberg Code KJC IN
Market Cap (`bn) 60.57
Free Float (%) 43%
52wk Hi/Lo 861 / 501
Avg. Daily Volume (NSE) 36471
Face Value / Div. per share (`) 2.00 /3.50
Shares Outstanding (mn) 79.4
Shareholding Pattern
Promoters FIIs DII Others
49.54 23.82 4.58 22.06
Financial Snapshot (`mn)
Y/E March FY15 FY16E FY17E FY18E
Net Sales 24,041 28,609 34,044 40,513
EBITDA 3,055 4,005 5,107 6,077
Net Profit 1,757 2,003 2,383 2,836
P/E(x) 33.4 28.6 24.0 20.0
ROE (%) 30.8 32.1 37.9 44.7
EPS 22.7 26.6 31.7 38.0
Share Price Performance
80
90
100
110
120
130
140
150
160
170
Jun-1
4
Jul-
14
Aug-1
4
Sep-1
4
Oct
-14
Nov-
14
Dec-
14
Jan-1
5
Feb-1
5
Mar-
15
Apr-
15
May-
15
Jun-1
5
Kajaria Ceramics Ltd BSE SENSEX
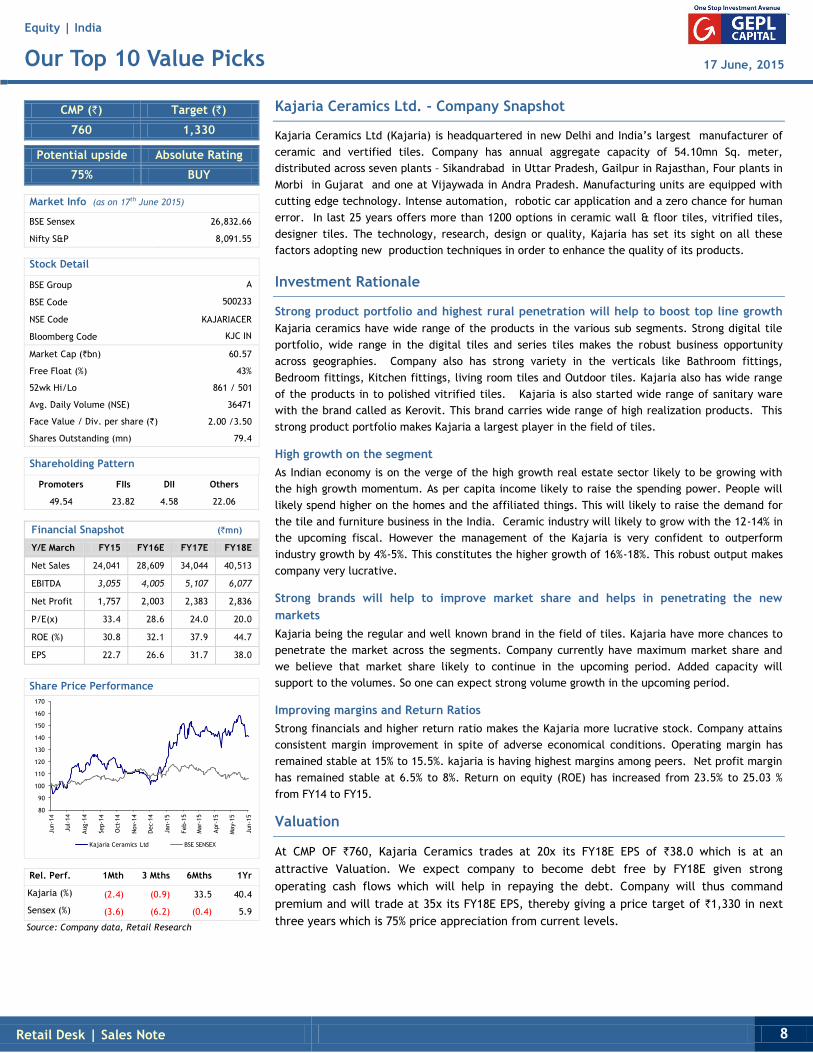
Rel. Perf. 1Mth 3 Mths 6Mths 1Yr
Kajaria (%) (2.4) (0.9) 33.5 40.4
Sensex (%) (3.6) (6.2) (0.4) 5.9
Source: Company data, Retail Research
Kajaria Ceramics Ltd. - Company Snapshot
Kajaria Ceramics Ltd (Kajaria) is headquartered in new Delhi and India’s largest manufacturer of
ceramic and vertified tiles. Company has annual aggregate capacity of 54.10mn Sq. meter,
distributed across seven plants – Sikandrabad in Uttar Pradesh, Gailpur in Rajasthan, Four plants in
Morbi in Gujarat and one at Vijaywada in Andra Pradesh. Manufacturing units are equipped with
cutting edge technology. Intense automation, robotic car application and a zero chance for human
error. In last 25 years offers more than 1200 options in ceramic wall & floor tiles, vitrified tiles,
designer tiles. The technology, research, design or quality, Kajaria has set its sight on all these
factors adopting new production techniques in order to enhance the quality of its products.
Investment Rationale
Strong product portfolio and highest rural penetration will help to boost top line growth
Kajaria ceramics have wide range of the products in the various sub segments. Strong digital tile
portfolio, wide range in the digital tiles and series tiles makes the robust business opportunity
across geographies. Company also has strong variety in the verticals like Bathroom fittings,
Bedroom fittings, Kitchen fittings, living room tiles and Outdoor tiles. Kajaria also has wide range
of the products in to polished vitrified tiles. Kajaria is also started wide range of sanitary ware
with the brand called as Kerovit. This brand carries wide range of high realization products. This
strong product portfolio makes Kajaria a largest player in the field of tiles.
High growth on the segment
As Indian economy is on the verge of the high growth real estate sector likely to be growing with
the high growth momentum. As per capita income likely to raise the spending power. People will
likely spend higher on the homes and the affiliated things. This will likely to raise the demand for
the tile and furniture business in the India. Ceramic industry will likely to grow with the 12-14% in
the upcoming fiscal. However the management of the Kajaria is very confident to outperform
industry growth by 4%-5%. This constitutes the higher growth of 16%-18%. This robust output makes
company very lucrative.
Strong brands will help to improve market share and helps in penetrating the new
markets
Kajaria being the regular and well known brand in the field of tiles. Kajaria have more chances to
penetrate the market across the segments. Company currently have maximum market share and
we believe that market share likely to continue in the upcoming period. Added capacity will
support to the volumes. So one can expect strong volume growth in the upcoming period.
Improving margins and Return Ratios
Strong financials and higher return ratio makes the Kajaria more lucrative stock. Company attains
consistent margin improvement in spite of adverse economical conditions. Operating margin has
remained stable at 15% to 15.5%. kajaria is having highest margins among peers. Net profit margin
has remained stable at 6.5% to 8%. Return on equity (ROE) has increased from 23.5% to 25.03 %
from FY14 to FY15.
Valuation
At CMP OF `760, Kajaria Ceramics trades at 20x its FY18E EPS of `38.0 which is at an
attractive Valuation. We expect company to become debt free by FY18E given strong
operating cash flows which will help in repaying the debt. Company will thus command
premium and will trade at 35x its FY18E EPS, thereby giving a price target of `1,330 in next
three years which is 75% price appreciation from current levels.
Equity | India
Our Top 10 Value Picks 17 June, 2015
BUY
Retail Desk | Sales Note 9
CMP (`) Target (`)
1,091 2,079
Potential upside Absolute Rating
91% BUY
Market Info (as on 17th June 2015)
BSE Sensex 26,832.66
Nifty S&P 8,091.55
Stock Detail
BSE Group B
BSE Code 500042
NSE Code BASF
Bloomberg Code BASF IN
Market Cap (`bn) 46.79
Free Float (%) 27%
52wk Hi/Lo 1,497 / 812
Avg. Daily Volume (NSE) 8820
Face Value / Div. per share (`) 10.00 / 4.00
Shares Outstanding (mn) 43.2
Shareholding Pattern
Promoters FIIs DII Others
73.33 0.79 5.98 19.90
Financial Snapshot (`mn)
Y/E March FY15 FY16E FY17E FY18E
Net Sales 47,058 56,470 70,587 91,763
EBITDA 1,330 2,823 5,647 11,012
Net Profit (67) 847 2,471 4,500
P/E(x) - 55.8 19.1 10.5
ROE (%) (5.8) 4.2 8.5 12.0
EPS (15.5) 19.6 57.1 104.0
Share Price Performance
80
90
100
110
120
130
140
150
160
170
180
Jun-1
4
Jul-
14
Aug-1
4
Sep-1
4
Oct
-14
Nov-
14
Dec-
14
Jan-1
5
Feb-1
5
Mar-
15
Apr-
15
May-
15
Jun-1
5
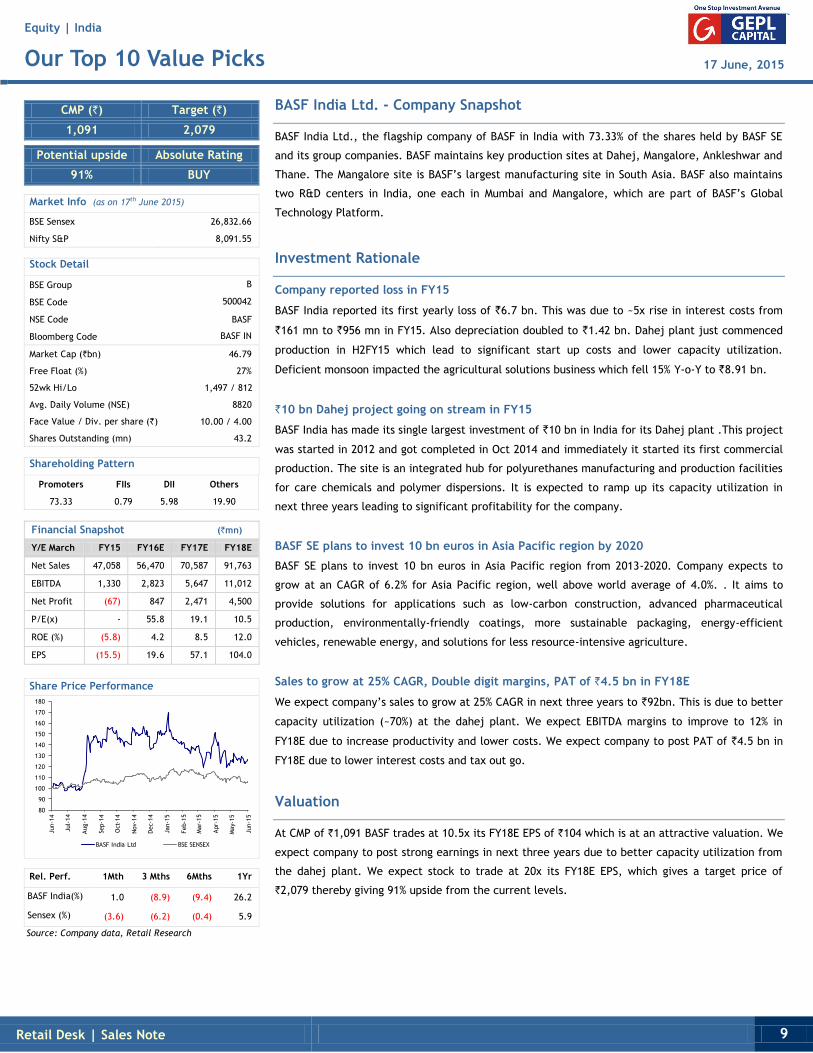
BASF India Ltd BSE SENSEX
Rel. Perf. 1Mth 3 Mths 6Mths 1Yr
BASF India(%) 1.0 (8.9) (9.4) 26.2
Sensex (%) (3.6) (6.2) (0.4) 5.9
Source: Company data, Retail Research
BASF India Ltd. - Company Snapshot
BASF India Ltd., the flagship company of BASF in India with 73.33% of the shares held by BASF SE
and its group companies. BASF maintains key production sites at Dahej, Mangalore, Ankleshwar and
Thane. The Mangalore site is BASF’s largest manufacturing site in South Asia. BASF also maintains
two R&D centers in India, one each in Mumbai and Mangalore, which are part of BASF’s Global
Technology Platform.
Investment Rationale
Company reported loss in FY15
BASF India reported its first yearly loss of `6.7 bn. This was due to ~5x rise in interest costs from
`161 mn to `956 mn in FY15. Also depreciation doubled to `1.42 bn. Dahej plant just commenced
production in H2FY15 which lead to significant start up costs and lower capacity utilization.
Deficient monsoon impacted the agricultural solutions business which fell 15% Y-o-Y to `8.91 bn.
`10 bn Dahej project going on stream in FY15
BASF India has made its single largest investment of `10 bn in India for its Dahej plant .This project
was started in 2012 and got completed in Oct 2014 and immediately it started its first commercial
production. The site is an integrated hub for polyurethanes manufacturing and production facilities
for care chemicals and polymer dispersions. It is expected to ramp up its capacity utilization in
next three years leading to significant profitability for the company.
BASF SE plans to invest 10 bn euros in Asia Pacific region by 2020
BASF SE plans to invest 10 bn euros in Asia Pacific region from 2013-2020. Company expects to
grow at an CAGR of 6.2% for Asia Pacific region, well above world average of 4.0%. . It aims to
provide solutions for applications such as low-carbon construction, advanced pharmaceutical
production, environmentally-friendly coatings, more sustainable packaging, energy-efficient
vehicles, renewable energy, and solutions for less resource-intensive agriculture.
Sales to grow at 25% CAGR, Double digit margins, PAT of `4.5 bn in FY18E
We expect company’s sales to grow at 25% CAGR in next three years to `92bn. This is due to better
capacity utilization (~70%) at the dahej plant. We expect EBITDA margins to improve to 12% in
FY18E due to increase productivity and lower costs. We expect company to post PAT of `4.5 bn in
FY18E due to lower interest costs and tax out go.
Valuation
At CMP of `1,091 BASF trades at 10.5x its FY18E EPS of `104 which is at an attractive valuation. We
expect company to post strong earnings in next three years due to better capacity utilization from
the dahej plant. We expect stock to trade at 20x its FY18E EPS, which gives a target price of
`2,079 thereby giving 91% upside from the current levels.
Equity | India
Our Top 10 Value Picks 17 June, 2015
BUY
Retail Desk | Sales Note 10
CMP (`) Target (`)
442 802
Potential upside Absolute Rating
82% BUY
Market Info (as on 17th June 2015)
BSE Sensex 26,832.66
Nifty S&P 8,091.55
Stock Detail
BSE Group B
BSE Code 538567
NSE Code GULFOILLUB
Bloomberg Code GOLI IN
Market Cap (`bn) 22.00
Free Float (%) 45%
52wk Hi/Lo 564 / 221
Avg. Daily Volume (NSE) 17029
Face Value / Div. per share (`) 2.00 / 2.00
Shares Outstanding (mn) 49.5
Shareholding Pattern
Promoters FIIs DII Others
59.95 12.36 10.55 17.14
Financial Snapshot (`mn)
Y/E March FY15 FY16E FY17E FY18E
Net Sales 9,675 11,516 14,049 17,561
EBITDA 1,294 1,555 1,967 2,459
Net Profit 775 1,003 1,247 1,588
P/E(x) 28.3 21.8 17.5 13.8
ROE (%) 41.4 53.1 57.9 57.6
EPS 15.6 20.3 25.2 32.1
Share Price Performance
80
100
120
140
160
180
200
220
240
Jul-
14
Aug-1
4
Sep-1
4
Oct
-14
Nov-
14
Dec-
14
Jan-1
5
Feb-1
5
Mar-
15
Apr-
15
May-
15
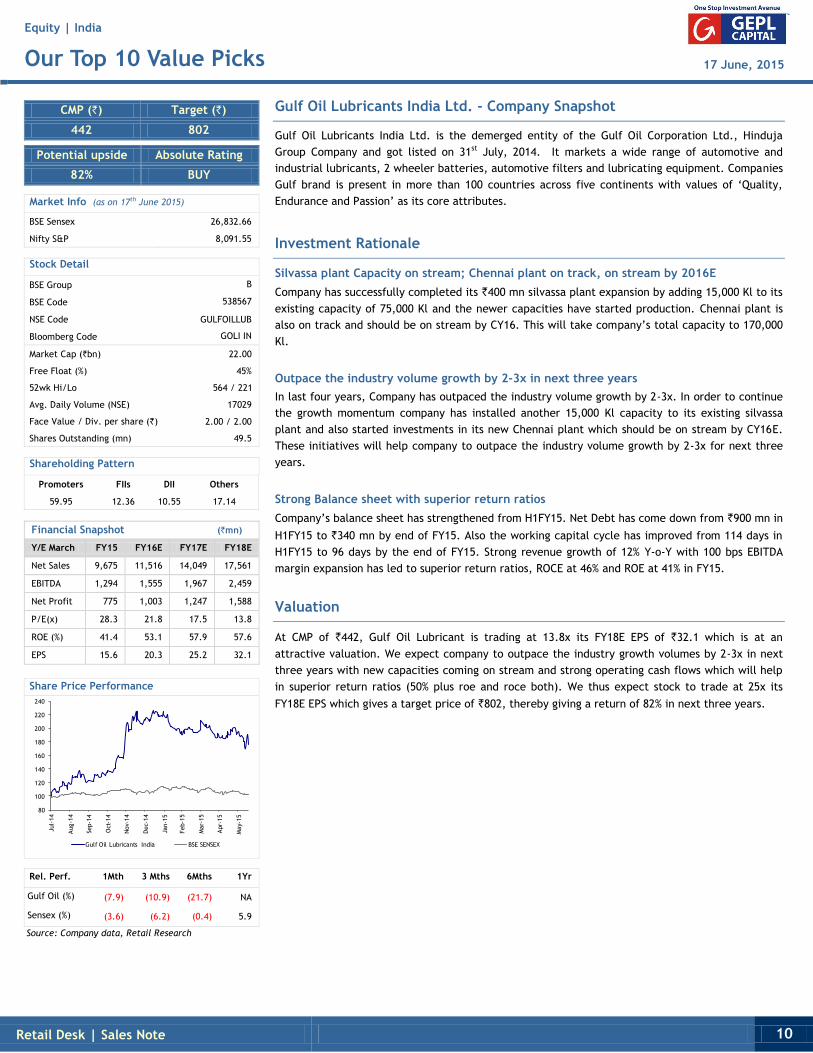
Gulf Oil Lubricants India BSE SENSEX
Rel. Perf. 1Mth 3 Mths 6Mths 1Yr
Gulf Oil (%) (7.9) (10.9) (21.7) NA
Sensex (%) (3.6) (6.2) (0.4) 5.9
Source: Company data, Retail Research
Gulf Oil Lubricants India Ltd. - Company Snapshot
Gulf Oil Lubricants India Ltd. is the demerged entity of the Gulf Oil Corporation Ltd., Hinduja
Group Company and got listed on 31st July, 2014. It markets a wide range of automotive and
industrial lubricants, 2 wheeler batteries, automotive filters and lubricating equipment. Companies
Gulf brand is present in more than 100 countries across five continents with values of ‘Quality,
Endurance and Passion’ as its core attributes.
Investment Rationale
Silvassa plant Capacity on stream; Chennai plant on track, on stream by 2016E
Company has successfully completed its `400 mn silvassa plant expansion by adding 15,000 Kl to its
existing capacity of 75,000 Kl and the newer capacities have started production. Chennai plant is
also on track and should be on stream by CY16. This will take company’s total capacity to 170,000
Kl.
Outpace the industry volume growth by 2-3x in next three years
In last four years, Company has outpaced the industry volume growth by 2-3x. In order to continue
the growth momentum company has installed another 15,000 Kl capacity to its existing silvassa
plant and also started investments in its new Chennai plant which should be on stream by CY16E.
These initiatives will help company to outpace the industry volume growth by 2-3x for next three
years.
Strong Balance sheet with superior return ratios
Company’s balance sheet has strengthened from H1FY15. Net Debt has come down from `900 mn in
H1FY15 to `340 mn by end of FY15. Also the working capital cycle has improved from 114 days in
H1FY15 to 96 days by the end of FY15. Strong revenue growth of 12% Y-o-Y with 100 bps EBITDA
margin expansion has led to superior return ratios, ROCE at 46% and ROE at 41% in FY15.
Valuation
At CMP of `442, Gulf Oil Lubricant is trading at 13.8x its FY18E EPS of `32.1 which is at an
attractive valuation. We expect company to outpace the industry growth volumes by 2-3x in next
three years with new capacities coming on stream and strong operating cash flows which will help
in superior return ratios (50% plus roe and roce both). We thus expect stock to trade at 25x its
FY18E EPS which gives a target price of `802, thereby giving a return of 82% in next three years.
Equity | India
Our Top 10 Value Picks 17 June, 2015
BUY
Retail Desk | Sales Note 11
CMP (`) Target (`)
3,465 6,854
Potential upside Absolute Rating
98% BUY
Market Info (as on 17th June 2015)
BSE Sensex 26,832.66
Nifty S&P 8,091.55
Stock Detail
BSE Group A
BSE Code 532432
NSE Code MCDOWELL-N
Bloomberg Code UNSP IN
Market Cap (`bn) 506.3
Free Float (%) 38%
52wk Hi/Lo 4080 / 2226
Avg. Daily Volume (NSE) 158447
Face Value / Div. per share (`) 10.00 / 2.50
Shares Outstanding (mn) 145.3
Shareholding Pattern
Promoters FIIs DII Others
58.87 24.04 4.19 12.90
Financial Snapshot (`bn)
Y/E March FY15 FY16E FY17E FY18E
Net Sales 91.6 103.4 119.0 136.5
EBITDA 8.5 12.9 16.9 22.0
Net Profit (16.9) 5.7 8.7 13.7
P/E(x)
92.4 57.4 35.4
ROE (%) (91.4) - - -
EPS (116.1) 37.5 60.3 97.9
* Bloomberg consensus
Share Price Performance
75
85
95
105
115
125
135
145
155
Jun-1
4
Jul-
14
Aug-1
4
Sep-1
4
Oct
-14
Nov-
14
Dec-
14
Jan-1
5
Feb-1
5
Mar-
15
Apr-
15
May-
15
Jun-1
5
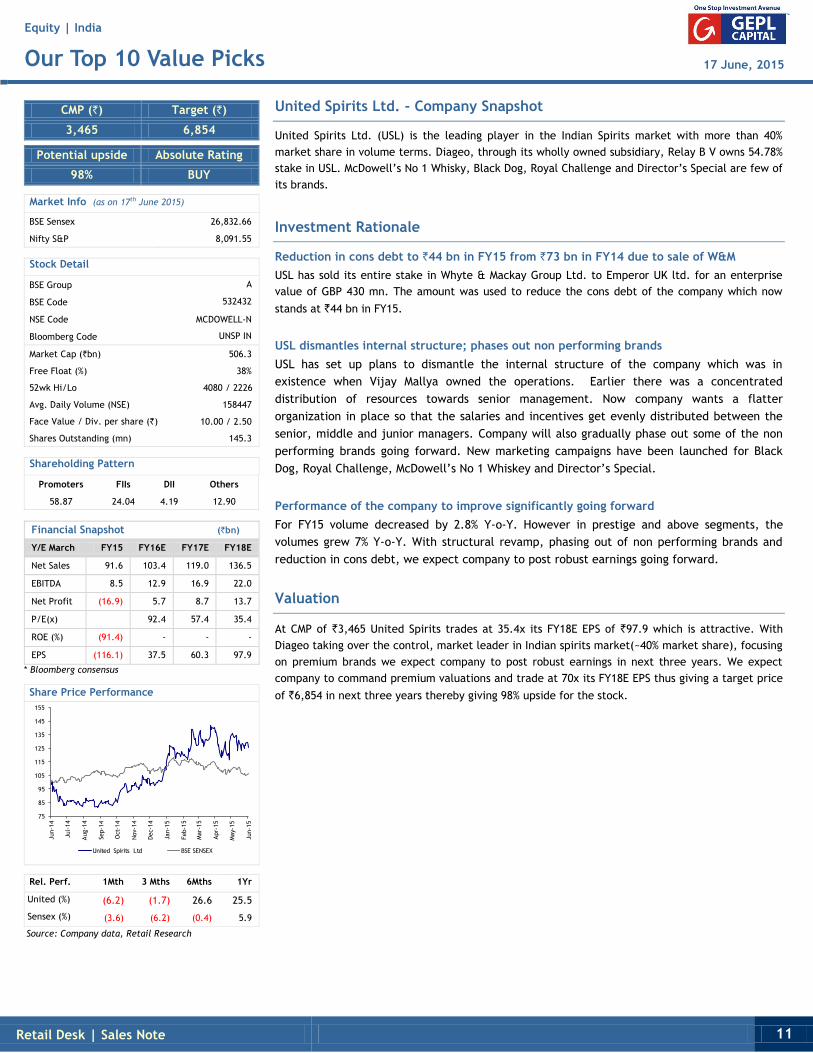
United Spirits Ltd BSE SENSEX
Rel. Perf. 1Mth 3 Mths 6Mths 1Yr
United (%) (6.2) (1.7) 26.6 25.5
Sensex (%) (3.6) (6.2) (0.4) 5.9
Source: Company data, Retail Research
United Spirits Ltd. - Company Snapshot
United Spirits Ltd. (USL) is the leading player in the Indian Spirits market with more than 40%
market share in volume terms. Diageo, through its wholly owned subsidiary, Relay B V owns 54.78%
stake in USL. McDowell’s No 1 Whisky, Black Dog, Royal Challenge and Director’s Special are few of
its brands.
Investment Rationale
Reduction in cons debt to `44 bn in FY15 from `73 bn in FY14 due to sale of W&M
USL has sold its entire stake in Whyte & Mackay Group Ltd. to Emperor UK ltd. for an enterprise
value of GBP 430 mn. The amount was used to reduce the cons debt of the company which now
stands at `44 bn in FY15.
USL dismantles internal structure; phases out non performing brands
USL has set up plans to dismantle the internal structure of the company which was in
existence when Vijay Mallya owned the operations. Earlier there was a concentrated
distribution of resources towards senior management. Now company wants a flatter
organization in place so that the salaries and incentives get evenly distributed between the
senior, middle and junior managers. Company will also gradually phase out some of the non
performing brands going forward. New marketing campaigns have been launched for Black
Dog, Royal Challenge, McDowell’s No 1 Whiskey and Director’s Special.
Performance of the company to improve significantly going forward
For FY15 volume decreased by 2.8% Y-o-Y. However in prestige and above segments, the
volumes grew 7% Y-o-Y. With structural revamp, phasing out of non performing brands and
reduction in cons debt, we expect company to post robust earnings going forward.
Valuation
At CMP of `3,465 United Spirits trades at 35.4x its FY18E EPS of `97.9 which is attractive. With
Diageo taking over the control, market leader in Indian spirits market(~40% market share), focusing
on premium brands we expect company to post robust earnings in next three years. We expect
company to command premium valuations and trade at 70x its FY18E EPS thus giving a target price
of `6,854 in next three years thereby giving 98% upside for the stock.
Equity | India
Our Top 10 Value Picks 17 June, 2015
BUY
Retail Desk | Sales Note 12
NOTES
GEPL CAPITAL Pvt Ltd
Reg Office: D-21 Dhanraj Mahal, CSM Marg, Colaba, Mumbai 400001
Analyst Certification
The following analysts hereby certify that their views about the companies and their securities discussed in this report are accurately expressed and that they have not received and will not receive direct or
indirect compensation in exchange for expressing specific recommendations or views in this report:
Disclaimer:
This message w/attachments (message) is intended solely for the use of the intended recipient(s) and may contain information that is privileged, confidential or proprietary. If you are not an intended recipient,
please notify the sender, and then please delete and destroy all copies and attachments, and be advised that any review or dissemination of, or the taking of any action in reliance on, the information contained
in or attached to this message is prohibited. Unless specifically indicated, this message is not an offer to sell or a solicitation of any investment products or other financial product or service, an official
confirmation of any transaction, or an official statement of Sender. All investments involve risks and investors should exercise prudence in making their investment decisions.
GEPL Capital makes no representation or warranty, express or implied, as to, and does not accept any responsibility or liability with respect to, the fairness, accuracy, completeness or correctness of any
information or opinions contained herein. GEPL Capital specifically prohibits redistribution of this material in whole or in part without the written permission of GEPL Capital and GEPL Capital accepts no liability
whatsoever for the actions of third parties in this regard.
Subject to applicable law, Sender may intercept, monitor, review and retain e-communications (EC) traveling through its networks/systems and may produce any such EC to regulators, law enforcement, in
litigation and as required by law. The laws of the country of each sender/recipient may impact the handling of EC, and EC may be archived, supervised and produced in countries other than the country in which
you are located. This message cannot be guaranteed to be secure or free of errors or viruses. Attachments that are part of this EC may have additional important disclosures and disclaimers, which you should
read. By messaging with Sender you consent to the foregoing. The disclosure contained in the reports produced by GEPL Capital shall be strictly governed by and construed in accordance with Indian law.