Embed Size (px)
Citation preview
Patterns and correlates of objectively measuredfree-living physical activity in adults in rural andurban CameroonFelix Assah,1,2 Jean Claude Mbanya,1 Ulf Ekelund,2 Nicholas Wareham,2
Soren Brage2
▸ Additional material ispublished online only. To viewplease visit the journal online(http://dx.doi.org/10.1136/jech-2014-205154).1Department of Public Health,Faculty of Medicine andBiomedical Sciences, Universityof Yaoundé I, Yaoundé,Cameroon2MRC Epidemiology Unit,University of Cambridge,Cambridge, UK
Correspondence toDr Felix Assah, Department ofPublic Health, Faculty ofMedicine and BiomedicalSciences, University ofYaoundé I, Yaoundé BP 8046,Cameroon;[email protected]
Received 24 October 2014Revised 28 January 2015Accepted 1 February 2015Published Online First4 April 2015
To cite: Assah F,Mbanya JC, Ekelund U,et al. J EpidemiolCommunity Health2015;69:700–707.
ABSTRACTBackground Urbanisation in sub-Saharan Africa ischanging lifestyles and raising non-communicable diseaseburden. Understanding the underlying pattern of physicalactivity and its correlates may inform preventiveinterventions. We examined correlates of objectively-measured physical activity in rural and urban Cameroon.Methods Participants were 544 adults resident in rural(W-156, M-89) or urban (W-189, M-110) regions.Physical activity was measured using individually-calibrated combined heart rate and movement sensingover seven continuous days. Sociodemographic data werecollected by self-report. Independent associations ofsociodemographic correlates with physical activity energyexpenditure (PAEE) or moderate-to-vigorous physicalactivity (MVPA) were analysed in multivariate regressionmodels.Results Rural dwellers were significantly more activethan their urban counterparts (PAEE: 58.0 vs 42.9 kJ/kg/day; MVPA: 107 vs 62 min/day; MVPA of 150 min/weekin >10 min bouts: 62 vs 39%) and less sedentary (923 vs1026 min/day); p<0.001. There was no significantseasonal difference (dry vs rainy) in activity in urbandwellers whereas in rural dwellers activity was higherduring dry seasons compared to rainy seasons (p<0.001).Age, obesity and education showed significant inverseassociations with activity. Urban dwellers who consideredthemselves adequately active were only as active as ruraldwellers who thought they were not adequately active.Conclusions This is the first study providing data onsociodemographic patterning of objectively-measuredphysical activity in rural and urban sub-Saharan Africa.Age, urban residence, obesity and higher educationallevel are important correlates of lower levels of physicalactivity. These suggest targets for public healthinterventions to improve physical activity in Cameroon.
INTRODUCTIONNon-communicable diseases (NCDs) are now theleading causes of death and disability in the world.1 Indeveloping countries this burden of NCDs adds to apersistent high burden of infections; constituting adouble disease burden despite limited healthcareresources. Physical inactivity is one of the fourcommon risk factors of this NCD burden, togetherwith unhealthy diet, smoking and excessive consump-tion of alcohol. Population physical activity levelshave been reported to be declining in developed anddeveloping countries.2–4 The decline in developingcountries may be due to urbanisation as demonstratedby a rural-to-urban negative gradient of physical activ-ity levels that have been reported in many studies
using self-report of activity,5 6 and as previouslyreported in this cohort using objective measurementof free-living activity.7 There is strong evidence thatphysical activity confers numerous health benefitsincluding reducing morbidity and mortality from car-diovascular diseases and cancers.8–10 Consequently,recommendations on physical activity for promotingand maintaining a healthy life have beenproposed.11 12
Physical activity is a complex behaviour thatinvolves an interaction between personal, interper-sonal, policy and environmental factors.13 14
Therefore, the design and implementation of appro-priate public health interventions for physical activitypromotion is a daunting task. Accurate and objectivemeasurement of free-living physical activity and itscorrelates would enable targeted and quantifiableinterventions. The current literature on physicalactivity in sub-Saharan Africa has mostly used self-reported assessment of physical activity,5 6 15–17
which is limited by recall bias and also restricted inthe dimensions and domains of activity measured.We carried out this study to describe patterns ofobjectively-measured free-living physical activityenergy expenditure (PAEE) and its underlying inten-sity distribution as time spent sedentary and inmoderate-to-vigorous physical activity (MVPA) inrural and urban Cameroon, and to examine someanthropometric and sociodemographic correlates ofactivity in this population.
METHODSThe methods used in this study have been reportedpreviously.7
Participants and settingParticipants for this study were 25–55 years old andrecruited from two urban areas (Yaoundé—thecapital city of the Centre region and of Cameroon,and Bamenda—the capital city of the North Westernregion) and two rural areas (Mbankomo and Bafut)in these same regions. A total of 651 volunteers(urban: N=348, mean age=37.9±9.1 years; rural:N=303, mean age=38.5±8.3 years) took part in thisstudy. Volunteers were provided detailed informationabout the study and invited to attend a testing sessionat their local hospital. Volunteers who had conditionsthat did not allow them to take part in exercisetesting according to study procedures were excluded.Ethical approval for the study was obtained from
the Cameroon National Ethics Committee. All par-ticipants provided signed informed consent.
Open AccessScan to access more
free content
700 Assah F, et al. J Epidemiol Community Health 2015;69:700–707. doi:10.1136/jech-2014-205154
Other topics on 10 July 2018 by guest. P
rotected by copyright.http://jech.bm
j.com/
J Epidem
iol Com
munity H
ealth: first published as 10.1136/jech-2014-205154 on 3 April 2015. D
ownloaded from
Sociodemographic dataAn interviewer-administered questionnaire was completed by allparticipants with sociodemographic variables recorded asreported. Smoking and alcohol drinking was recorded as ‘Yes’or ‘No’, with ex-smokers or ex-drinkers classified as ‘No’. Dataon frequency of drinking in four categories (<1 day/month,1–3 days/month, 1–4 days/week and >5 days/week) were alsocollected. Data on frequency of fruit and vegetable consumptionwas collected as times per day and/or times per week.
Occupational status was collected in four categories: employed,self-employed, non-paid work or unemployed/retired.Information was also collected on habitual occupational activityintensity in three categories with prompting from the interviewer:▸ Light; involving mainly sitting activities or standing without
additional effort, light cleaning, ironing, cooking, driving▸ Moderate; continuous walking, intense cleaning, sweeping,
brushing, gardening, light load carriage, painting, etc▸ Intense; carrying heavy loads, construction work, farming,
wood splitting, other similarly intense activities, etc.
Physical activity measurementFree-living physical activity was measured using a combinedheart rate and movement sensor (Actiheart, CambridgeNeurotechnology Ltd, Papworth, UK); with individual calibra-tion of the heart rate response to workload derived from a steptest.18 19 This test also provides an estimate of cardiorespira-tory fitness (VO2max). Free-living physical activity data wasrecorded continuously in 1 min epochs over seven continuousdays. The participants were requested to carry on with theirnormal habitual lifestyle, and wear the monitor at all timesexcept for showering, bathing or activities like swimming. Theminute-by-minute heart rate data was pre-processed,20 cali-brated using the step test response, and combined with acceler-ation in a branched equation model21 to calculate physicalactivity intensity time-series during free-living. From thesedata, average PAEE and distribution of intensity were sum-marised, while minimising diurnal bias. Participants with atleast 48 h of wear time were included in the analyses. The dis-tribution of intensity of activity was expressed as average dailytime spent at 19 different multiples of 1 MET, and summarisedin broad categories as time spent sedentary (<1.5 MET), timespent in light intensity physical activity (LPA, 1.5–3 MET), andtime spent in MVPA (>3 MET) in bouts from 1 to 10 min; 1MET is notionally the energy cost of the resting state of anindividual; for the present analyses, we used the standard valueof 3.5 mL O2/min/kg (∼71 J/min/kg) as multiplier.22 Adherenceto current physical activity guidelines12 was defined as accumu-lating at least 150 min/week of MVPA in bouts of at least10 min duration.
Participants were also asked, without any prompting from theinterviewer, to rate as “adequate” or “not adequate” their self-perceived level of habitual physical activity.
Anthropometry and clinical measuresHeight without shoes was measured using a standard rigid stadi-ometer. Waist and hip circumferences were measured to thenearest 0.1 cm using a D-loop non-stretch fibreglass tape. Bodyweight was measured using electronic clinical scales and bodycomposition using bioimpedance (Tanita TBF-531 scales, TanitaUK Ltd, Uxbridge, Middlesex, UK). Body mass index (BMI) wascategorised as normal: <25; overweight: ≥25 and <30; obese:≥30 kg/m2.
Calculations and statistical analysesAnalyses were carried out using STATA V.13.1 (StataCorp,College Station, Texas, USA). Where applicable, the level of stat-istical significance was considered at p<0.05.
Descriptive characteristics of the study sample are presentedstratified by rural/urban residential area and by sex. Studentt tests or χ2 tests were used to assess differences in means orproportions, respectively. Multivariate test (Wilk’s λ) was usedto test differences in means of intensity and bout distributionsof physical activity by urban/rural residential area (figure 1).
Associations between sociodemographic and anthropometricvariables and PAEE or MVPA were examined in multivariatelinear regression models. Multivariate logistic regression wasused to assess correlates of meeting/not meeting current activityguidelines. Regression models are presented separately for ruraland urban dwellers since our a priori aim was to understandcorrelates of physical activity in each setting. The regressionmodels therefore explored differences in the dependent variableacross levels or groups of independent variables, adjusted forage and sex, within the same residence.
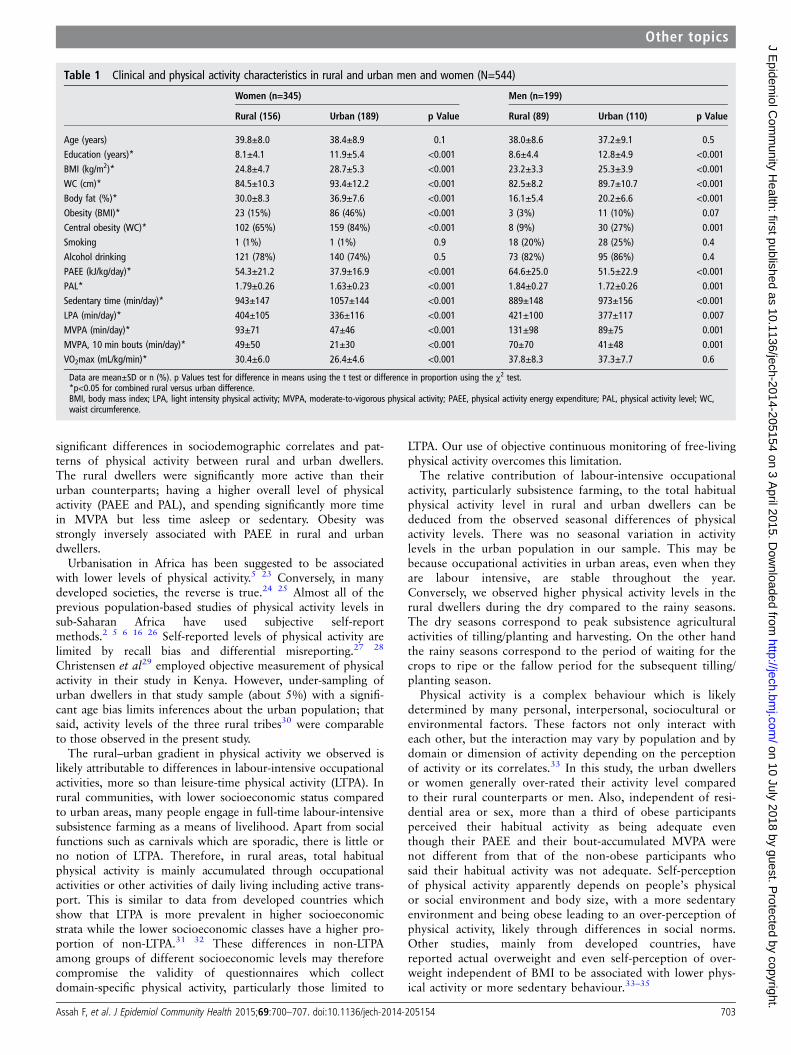
RESULTSA total of 544 individuals (199 men and 345 women, or 245rural and 299 urban dwellers) with valid physical activity dataare included in these analyses out of 651 volunteers who effect-ively participated. The mean (SD) duration of monitor wear was6.4 (1.5) days; more than 95% of participants wore monitor forat least 3.5 days (see supplementary figure S1). Table 1 presentsclinical and physical activity characteristics of the study sample,stratified by sex and residential site. Smoking was almost entirelya male habit, with 23% of men smoking compared to 1% ofwomen. Obesity (BMI ≥30 kg/m2) was significantly more preva-lent in women than men (32% vs 7%). Compared to ruraldwellers, urban dwellers had a significantly higher prevalence ofobesity (11% vs 32%) and also a higher fraction of body fat.
The rural participants spent on average almost 35% moreenergy being physically active compared to the urban dwellers(Mean±SD: 58±23.2 vs 42.9±20.4 kJ/kg/day, p<0.001). Thissignificant difference persisted after adjustment for age, sex,smoking, alcohol consumption, fruit and vegetable intake, bodyfat and education level. The rural dwellers spent significantlyless time sedentary (difference of 103 min/day), and more timein MVPA (44 min/day) compared to urban dwellers (p<0.001).In rural and urban dwellers, men had significantly higher PAEEcompared to women. Men spent significantly less time beingsedentary and more time in LPA and MVPA.
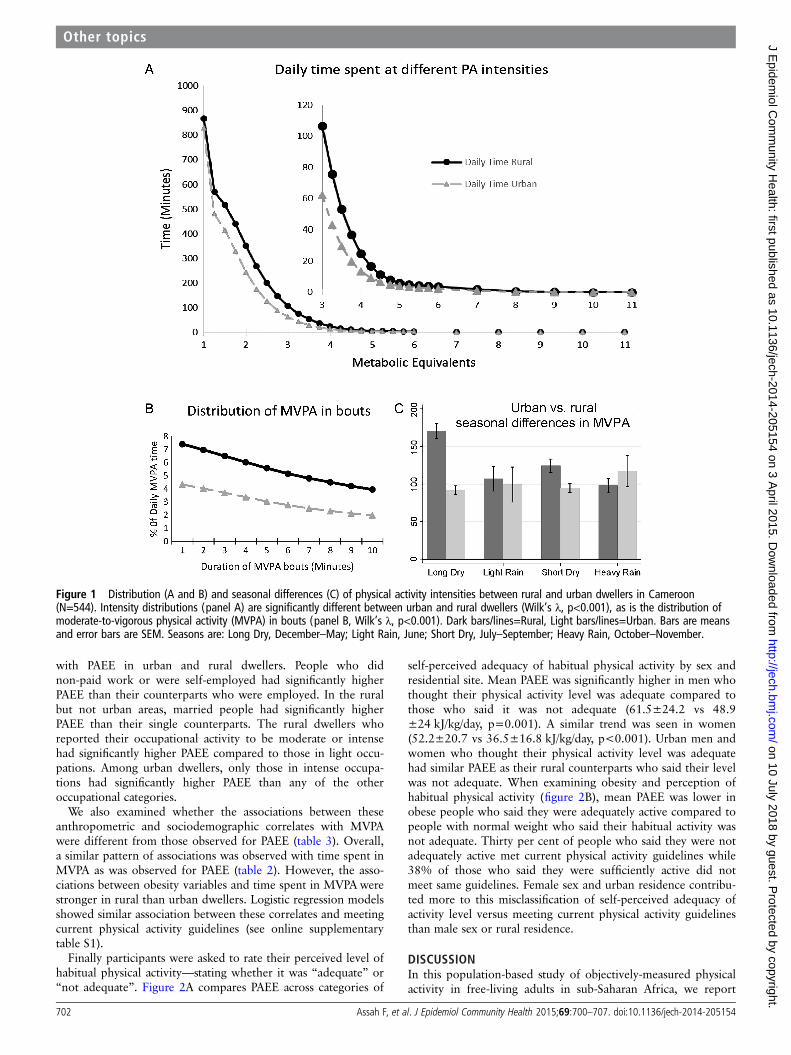
Rural dwellers compared to their urban counterparts spentmore time in physical activities of all intensities, and also at allminimum durations of bouts of MVPA (figure 1A, B); 62% ofrural and 39% of urban dwellers accumulated at least 150 min/week of MVPA in bouts of >10 min (p<0.001). There was nodifference in MVPA over the seasons in the urban dwellers(p=0.2); figure 1C. Meanwhile, in rural dwellers, MVPA (inbouts of >10 min or overall MVPA) was higher in the dry thanin the rainy seasons (p<0.001). This seasonal pattern of MVPAin the rural and urban dwellers was similar to that of PAEE, butthe reverse of sedentary time.
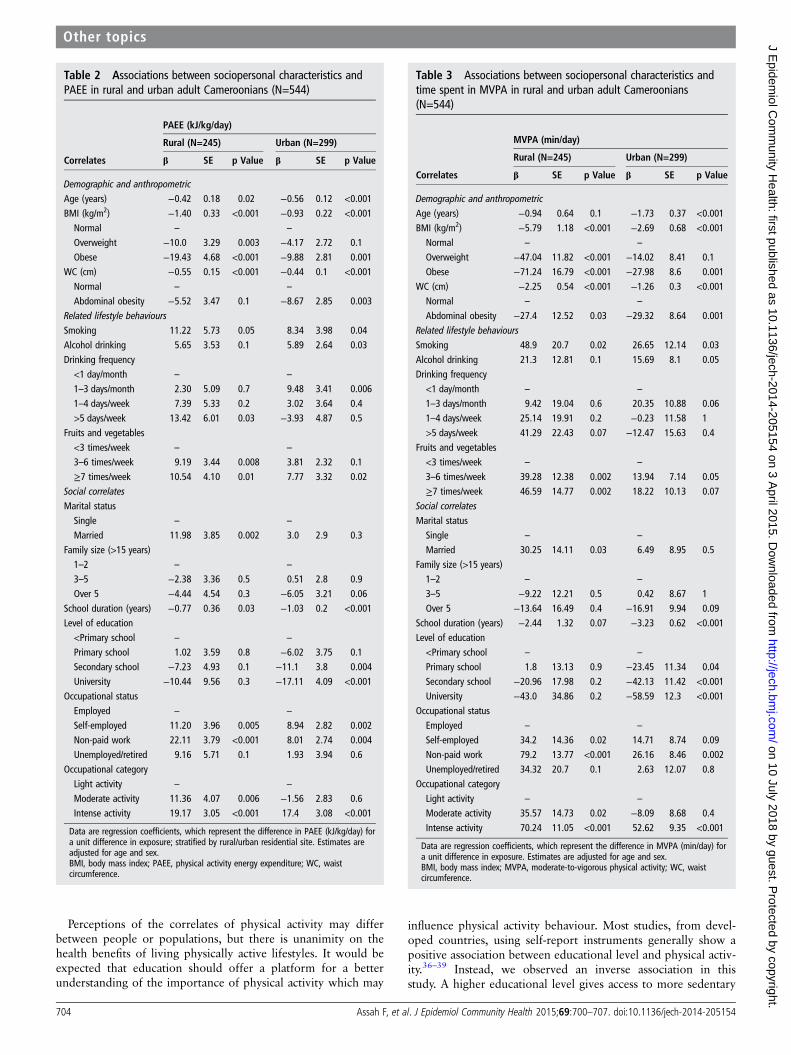
In multivariate linear models adjusted for age and sex, obesitywas strongly inversely associated with PAEE in rural and urbandwellers; p<0.05 (table 2).
Alcohol drinking and smoking were positively associated withPAEE, though of borderline statistical significance. Education(years spent in school) was significantly inversely associated
Assah F, et al. J Epidemiol Community Health 2015;69:700–707. doi:10.1136/jech-2014-205154 701
Other topics on 10 July 2018 by guest. P
rotected by copyright.http://jech.bm
j.com/
J Epidem
iol Com
munity H
ealth: first published as 10.1136/jech-2014-205154 on 3 April 2015. D
ownloaded from
with PAEE in urban and rural dwellers. People who didnon-paid work or were self-employed had significantly higherPAEE than their counterparts who were employed. In the ruralbut not urban areas, married people had significantly higherPAEE than their single counterparts. The rural dwellers whoreported their occupational activity to be moderate or intensehad significantly higher PAEE compared to those in light occu-pations. Among urban dwellers, only those in intense occupa-tions had significantly higher PAEE than any of the otheroccupational categories.
We also examined whether the associations between theseanthropometric and sociodemographic correlates with MVPAwere different from those observed for PAEE (table 3). Overall,a similar pattern of associations was observed with time spent inMVPA as was observed for PAEE (table 2). However, the asso-ciations between obesity variables and time spent in MVPA werestronger in rural than urban dwellers. Logistic regression modelsshowed similar association between these correlates and meetingcurrent physical activity guidelines (see online supplementarytable S1).
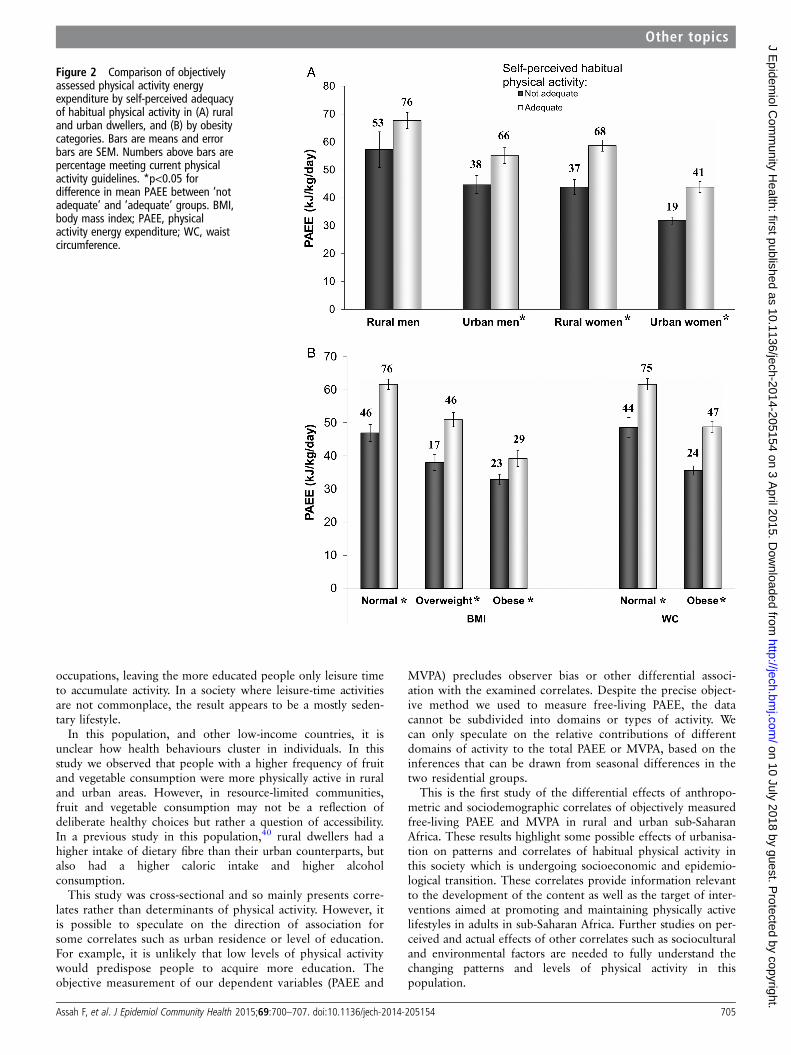
Finally participants were asked to rate their perceived level ofhabitual physical activity—stating whether it was “adequate” or“not adequate”. Figure 2A compares PAEE across categories of
self-perceived adequacy of habitual physical activity by sex andresidential site. Mean PAEE was significantly higher in men whothought their physical activity level was adequate compared tothose who said it was not adequate (61.5±24.2 vs 48.9±24 kJ/kg/day, p=0.001). A similar trend was seen in women(52.2±20.7 vs 36.5±16.8 kJ/kg/day, p<0.001). Urban men andwomen who thought their physical activity level was adequatehad similar PAEE as their rural counterparts who said their levelwas not adequate. When examining obesity and perception ofhabitual physical activity (figure 2B), mean PAEE was lower inobese people who said they were adequately active compared topeople with normal weight who said their habitual activity wasnot adequate. Thirty per cent of people who said they were notadequately active met current physical activity guidelines while38% of those who said they were sufficiently active did notmeet same guidelines. Female sex and urban residence contribu-ted more to this misclassification of self-perceived adequacy ofactivity level versus meeting current physical activity guidelinesthan male sex or rural residence.
DISCUSSIONIn this population-based study of objectively-measured physicalactivity in free-living adults in sub-Saharan Africa, we report
Figure 1 Distribution (A and B) and seasonal differences (C) of physical activity intensities between rural and urban dwellers in Cameroon(N=544). Intensity distributions (panel A) are significantly different between urban and rural dwellers (Wilk’s λ, p<0.001), as is the distribution ofmoderate-to-vigorous physical activity (MVPA) in bouts (panel B, Wilk’s λ, p<0.001). Dark bars/lines=Rural, Light bars/lines=Urban. Bars are meansand error bars are SEM. Seasons are: Long Dry, December–May; Light Rain, June; Short Dry, July–September; Heavy Rain, October–November.
702 Assah F, et al. J Epidemiol Community Health 2015;69:700–707. doi:10.1136/jech-2014-205154
Other topics on 10 July 2018 by guest. P
rotected by copyright.http://jech.bm
j.com/
J Epidem
iol Com
munity H
ealth: first published as 10.1136/jech-2014-205154 on 3 April 2015. D
ownloaded from
significant differences in sociodemographic correlates and pat-terns of physical activity between rural and urban dwellers.The rural dwellers were significantly more active than theirurban counterparts; having a higher overall level of physicalactivity (PAEE and PAL), and spending significantly more timein MVPA but less time asleep or sedentary. Obesity wasstrongly inversely associated with PAEE in rural and urbandwellers.
Urbanisation in Africa has been suggested to be associatedwith lower levels of physical activity.5 23 Conversely, in manydeveloped societies, the reverse is true.24 25 Almost all of theprevious population-based studies of physical activity levels insub-Saharan Africa have used subjective self-reportmethods.2 5 6 16 26 Self-reported levels of physical activity arelimited by recall bias and differential misreporting.27 28
Christensen et al29 employed objective measurement of physicalactivity in their study in Kenya. However, under-sampling ofurban dwellers in that study sample (about 5%) with a signifi-cant age bias limits inferences about the urban population; thatsaid, activity levels of the three rural tribes30 were comparableto those observed in the present study.
The rural–urban gradient in physical activity we observed islikely attributable to differences in labour-intensive occupationalactivities, more so than leisure-time physical activity (LTPA). Inrural communities, with lower socioeconomic status comparedto urban areas, many people engage in full-time labour-intensivesubsistence farming as a means of livelihood. Apart from socialfunctions such as carnivals which are sporadic, there is little orno notion of LTPA. Therefore, in rural areas, total habitualphysical activity is mainly accumulated through occupationalactivities or other activities of daily living including active trans-port. This is similar to data from developed countries whichshow that LTPA is more prevalent in higher socioeconomicstrata while the lower socioeconomic classes have a higher pro-portion of non-LTPA.31 32 These differences in non-LTPAamong groups of different socioeconomic levels may thereforecompromise the validity of questionnaires which collectdomain-specific physical activity, particularly those limited to
LTPA. Our use of objective continuous monitoring of free-livingphysical activity overcomes this limitation.
The relative contribution of labour-intensive occupationalactivity, particularly subsistence farming, to the total habitualphysical activity level in rural and urban dwellers can bededuced from the observed seasonal differences of physicalactivity levels. There was no seasonal variation in activitylevels in the urban population in our sample. This may bebecause occupational activities in urban areas, even when theyare labour intensive, are stable throughout the year.Conversely, we observed higher physical activity levels in therural dwellers during the dry compared to the rainy seasons.The dry seasons correspond to peak subsistence agriculturalactivities of tilling/planting and harvesting. On the other handthe rainy seasons correspond to the period of waiting for thecrops to ripe or the fallow period for the subsequent tilling/planting season.
Physical activity is a complex behaviour which is likelydetermined by many personal, interpersonal, sociocultural orenvironmental factors. These factors not only interact witheach other, but the interaction may vary by population and bydomain or dimension of activity depending on the perceptionof activity or its correlates.33 In this study, the urban dwellersor women generally over-rated their activity level comparedto their rural counterparts or men. Also, independent of resi-dential area or sex, more than a third of obese participantsperceived their habitual activity as being adequate eventhough their PAEE and their bout-accumulated MVPA werenot different from that of the non-obese participants whosaid their habitual activity was not adequate. Self-perceptionof physical activity apparently depends on people’s physicalor social environment and body size, with a more sedentaryenvironment and being obese leading to an over-perception ofphysical activity, likely through differences in social norms.Other studies, mainly from developed countries, havereported actual overweight and even self-perception of over-weight independent of BMI to be associated with lower phys-ical activity or more sedentary behaviour.33–35
Table 1 Clinical and physical activity characteristics in rural and urban men and women (N=544)
Women (n=345) Men (n=199)
Rural (156) Urban (189) p Value Rural (89) Urban (110) p Value
Age (years) 39.8±8.0 38.4±8.9 0.1 38.0±8.6 37.2±9.1 0.5Education (years)* 8.1±4.1 11.9±5.4 <0.001 8.6±4.4 12.8±4.9 <0.001BMI (kg/m2)* 24.8±4.7 28.7±5.3 <0.001 23.2±3.3 25.3±3.9 <0.001WC (cm)* 84.5±10.3 93.4±12.2 <0.001 82.5±8.2 89.7±10.7 <0.001Body fat (%)* 30.0±8.3 36.9±7.6 <0.001 16.1±5.4 20.2±6.6 <0.001Obesity (BMI)* 23 (15%) 86 (46%) <0.001 3 (3%) 11 (10%) 0.07Central obesity (WC)* 102 (65%) 159 (84%) <0.001 8 (9%) 30 (27%) 0.001Smoking 1 (1%) 1 (1%) 0.9 18 (20%) 28 (25%) 0.4Alcohol drinking 121 (78%) 140 (74%) 0.5 73 (82%) 95 (86%) 0.4PAEE (kJ/kg/day)* 54.3±21.2 37.9±16.9 <0.001 64.6±25.0 51.5±22.9 <0.001PAL* 1.79±0.26 1.63±0.23 <0.001 1.84±0.27 1.72±0.26 0.001Sedentary time (min/day)* 943±147 1057±144 <0.001 889±148 973±156 <0.001LPA (min/day)* 404±105 336±116 <0.001 421±100 377±117 0.007MVPA (min/day)* 93±71 47±46 <0.001 131±98 89±75 0.001MVPA, 10 min bouts (min/day)* 49±50 21±30 <0.001 70±70 41±48 0.001VO2max (mL/kg/min)* 30.4±6.0 26.4±4.6 <0.001 37.8±8.3 37.3±7.7 0.6
Data are mean±SD or n (%). p Values test for difference in means using the t test or difference in proportion using the χ2 test.*p<0.05 for combined rural versus urban difference.BMI, body mass index; LPA, light intensity physical activity; MVPA, moderate-to-vigorous physical activity; PAEE, physical activity energy expenditure; PAL, physical activity level; WC,waist circumference.
Assah F, et al. J Epidemiol Community Health 2015;69:700–707. doi:10.1136/jech-2014-205154 703
Other topics on 10 July 2018 by guest. P
rotected by copyright.http://jech.bm
j.com/
J Epidem
iol Com
munity H
ealth: first published as 10.1136/jech-2014-205154 on 3 April 2015. D
ownloaded from
Perceptions of the correlates of physical activity may differbetween people or populations, but there is unanimity on thehealth benefits of living physically active lifestyles. It would beexpected that education should offer a platform for a betterunderstanding of the importance of physical activity which may
influence physical activity behaviour. Most studies, from devel-oped countries, using self-report instruments generally show apositive association between educational level and physical activ-ity.36–39 Instead, we observed an inverse association in thisstudy. A higher educational level gives access to more sedentary
Table 2 Associations between sociopersonal characteristics andPAEE in rural and urban adult Cameroonians (N=544)
Correlates
PAEE (kJ/kg/day)
Rural (N=245) Urban (N=299)
β SE p Value β SE p Value
Demographic and anthropometricAge (years) −0.42 0.18 0.02 −0.56 0.12 <0.001BMI (kg/m2) −1.40 0.33 <0.001 −0.93 0.22 <0.001Normal – –
Overweight −10.0 3.29 0.003 −4.17 2.72 0.1Obese −19.43 4.68 <0.001 −9.88 2.81 0.001
WC (cm) −0.55 0.15 <0.001 −0.44 0.1 <0.001Normal – –
Abdominal obesity −5.52 3.47 0.1 −8.67 2.85 0.003Related lifestyle behavioursSmoking 11.22 5.73 0.05 8.34 3.98 0.04Alcohol drinking 5.65 3.53 0.1 5.89 2.64 0.03Drinking frequency<1 day/month – –
1–3 days/month 2.30 5.09 0.7 9.48 3.41 0.0061–4 days/week 7.39 5.33 0.2 3.02 3.64 0.4>5 days/week 13.42 6.01 0.03 −3.93 4.87 0.5
Fruits and vegetables<3 times/week – –
3–6 times/week 9.19 3.44 0.008 3.81 2.32 0.1≥7 times/week 10.54 4.10 0.01 7.77 3.32 0.02
Social correlatesMarital statusSingle – –
Married 11.98 3.85 0.002 3.0 2.9 0.3Family size (>15 years)1–2 – –
3–5 −2.38 3.36 0.5 0.51 2.8 0.9Over 5 −4.44 4.54 0.3 −6.05 3.21 0.06
School duration (years) −0.77 0.36 0.03 −1.03 0.2 <0.001Level of education<Primary school – –
Primary school 1.02 3.59 0.8 −6.02 3.75 0.1Secondary school −7.23 4.93 0.1 −11.1 3.8 0.004University −10.44 9.56 0.3 −17.11 4.09 <0.001
Occupational statusEmployed – –
Self-employed 11.20 3.96 0.005 8.94 2.82 0.002Non-paid work 22.11 3.79 <0.001 8.01 2.74 0.004Unemployed/retired 9.16 5.71 0.1 1.93 3.94 0.6
Occupational categoryLight activity – –
Moderate activity 11.36 4.07 0.006 −1.56 2.83 0.6Intense activity 19.17 3.05 <0.001 17.4 3.08 <0.001
Data are regression coefficients, which represent the difference in PAEE (kJ/kg/day) fora unit difference in exposure; stratified by rural/urban residential site. Estimates areadjusted for age and sex.BMI, body mass index; PAEE, physical activity energy expenditure; WC, waistcircumference.
Table 3 Associations between sociopersonal characteristics andtime spent in MVPA in rural and urban adult Cameroonians(N=544)
Correlates
MVPA (min/day)
Rural (N=245) Urban (N=299)
β SE p Value β SE p Value
Demographic and anthropometricAge (years) −0.94 0.64 0.1 −1.73 0.37 <0.001BMI (kg/m2) −5.79 1.18 <0.001 −2.69 0.68 <0.001Normal – –
Overweight −47.04 11.82 <0.001 −14.02 8.41 0.1Obese −71.24 16.79 <0.001 −27.98 8.6 0.001
WC (cm) −2.25 0.54 <0.001 −1.26 0.3 <0.001Normal – –
Abdominal obesity −27.4 12.52 0.03 −29.32 8.64 0.001Related lifestyle behavioursSmoking 48.9 20.7 0.02 26.65 12.14 0.03Alcohol drinking 21.3 12.81 0.1 15.69 8.1 0.05Drinking frequency<1 day/month – –
1–3 days/month 9.42 19.04 0.6 20.35 10.88 0.061–4 days/week 25.14 19.91 0.2 −0.23 11.58 1
>5 days/week 41.29 22.43 0.07 −12.47 15.63 0.4Fruits and vegetables<3 times/week – –
3–6 times/week 39.28 12.38 0.002 13.94 7.14 0.05≥7 times/week 46.59 14.77 0.002 18.22 10.13 0.07
Social correlatesMarital statusSingle – –
Married 30.25 14.11 0.03 6.49 8.95 0.5Family size (>15 years)1–2 – –
3–5 −9.22 12.21 0.5 0.42 8.67 1Over 5 −13.64 16.49 0.4 −16.91 9.94 0.09
School duration (years) −2.44 1.32 0.07 −3.23 0.62 <0.001Level of education<Primary school – –
Primary school 1.8 13.13 0.9 −23.45 11.34 0.04Secondary school −20.96 17.98 0.2 −42.13 11.42 <0.001University −43.0 34.86 0.2 −58.59 12.3 <0.001
Occupational statusEmployed – –
Self-employed 34.2 14.36 0.02 14.71 8.74 0.09Non-paid work 79.2 13.77 <0.001 26.16 8.46 0.002Unemployed/retired 34.32 20.7 0.1 2.63 12.07 0.8
Occupational categoryLight activity – –
Moderate activity 35.57 14.73 0.02 −8.09 8.68 0.4Intense activity 70.24 11.05 <0.001 52.62 9.35 <0.001
Data are regression coefficients, which represent the difference in MVPA (min/day) fora unit difference in exposure. Estimates are adjusted for age and sex.BMI, body mass index; MVPA, moderate-to-vigorous physical activity; WC, waistcircumference.
704 Assah F, et al. J Epidemiol Community Health 2015;69:700–707. doi:10.1136/jech-2014-205154
Other topics on 10 July 2018 by guest. P
rotected by copyright.http://jech.bm
j.com/
J Epidem
iol Com
munity H
ealth: first published as 10.1136/jech-2014-205154 on 3 April 2015. D
ownloaded from
occupations, leaving the more educated people only leisure timeto accumulate activity. In a society where leisure-time activitiesare not commonplace, the result appears to be a mostly seden-tary lifestyle.
In this population, and other low-income countries, it isunclear how health behaviours cluster in individuals. In thisstudy we observed that people with a higher frequency of fruitand vegetable consumption were more physically active in ruraland urban areas. However, in resource-limited communities,fruit and vegetable consumption may not be a reflection ofdeliberate healthy choices but rather a question of accessibility.In a previous study in this population,40 rural dwellers had ahigher intake of dietary fibre than their urban counterparts, butalso had a higher caloric intake and higher alcoholconsumption.
This study was cross-sectional and so mainly presents corre-lates rather than determinants of physical activity. However, itis possible to speculate on the direction of association forsome correlates such as urban residence or level of education.For example, it is unlikely that low levels of physical activitywould predispose people to acquire more education. Theobjective measurement of our dependent variables (PAEE and
MVPA) precludes observer bias or other differential associ-ation with the examined correlates. Despite the precise object-ive method we used to measure free-living PAEE, the datacannot be subdivided into domains or types of activity. Wecan only speculate on the relative contributions of differentdomains of activity to the total PAEE or MVPA, based on theinferences that can be drawn from seasonal differences in thetwo residential groups.
This is the first study of the differential effects of anthropo-metric and sociodemographic correlates of objectively measuredfree-living PAEE and MVPA in rural and urban sub-SaharanAfrica. These results highlight some possible effects of urbanisa-tion on patterns and correlates of habitual physical activity inthis society which is undergoing socioeconomic and epidemio-logical transition. These correlates provide information relevantto the development of the content as well as the target of inter-ventions aimed at promoting and maintaining physically activelifestyles in adults in sub-Saharan Africa. Further studies on per-ceived and actual effects of other correlates such as socioculturaland environmental factors are needed to fully understand thechanging patterns and levels of physical activity in thispopulation.
Figure 2 Comparison of objectivelyassessed physical activity energyexpenditure by self-perceived adequacyof habitual physical activity in (A) ruraland urban dwellers, and (B) by obesitycategories. Bars are means and errorbars are SEM. Numbers above bars arepercentage meeting current physicalactivity guidelines. *p<0.05 fordifference in mean PAEE between ‘notadequate’ and ‘adequate’ groups. BMI,body mass index; PAEE, physicalactivity energy expenditure; WC, waistcircumference.
Assah F, et al. J Epidemiol Community Health 2015;69:700–707. doi:10.1136/jech-2014-205154 705
Other topics on 10 July 2018 by guest. P
rotected by copyright.http://jech.bm
j.com/
J Epidem
iol Com
munity H
ealth: first published as 10.1136/jech-2014-205154 on 3 April 2015. D
ownloaded from
What is already known on this subject?
The health benefits of physical activity are widely known butresearch on physical activity and its correlates in developingcountries such as in sub-Saharan Africa is sparse. The fewavailable studies have mainly used self-reported physicalactivity, which may be skewed by recall bias. More studies usingobjective assessment of physical activity and its correlates areneeded for the elaboration of appropriate public healthinterventions to promote physical activity.
What this study adds?
This study provides data on objectively-measured physicalactivity and some sociodemographic correlates in free-livingadults in urban and rural settings in Cameroon. Rural dwellersare significantly more active than urban dwellers; having ahigher overall level of physical activity and less sedentary time.In rural and urban dwellers, female gender, obesity and level ofeducation are strongly inversely associated with overall level ofphysical activity as well as with meeting current physical activityguidelines. Self-perceived adequacy of physical activity levelappears to cluster in peers grouped by residence, gender orobesity. These data suggest that urban dwellers, women orobese individuals may benefit more from appropriate andtargeted physical activity interventions.
Twitter Follow Felix Assah at @feyboiz
Acknowledgements The authors thank Kate Westgate and Stefanie Mayle forassistance in processing combined sensing data.
Contributors FA designed the project, collected the data, conceived the hypothesisfor this manuscript, performed data analyses and drafted the manuscript. UE and SBprovided critical input for the conception of this manuscript and assisted with theediting. UE, SB, JCM and NW assisted with the project design and criticallyappraised the manuscript. All authors participated in the interpretation of the resultsand approved the final version of the manuscript.
Funding This research was supported by the Wellcome Trust (074786/Z/04/Z) andthe Medical Research Council Epidemiology Unit (MC_UU_12015/3).
Competing interests None.
Ethics approval Cameroon National Ethics Committee of the Ministry of PublicHealth.
Provenance and peer review Not commissioned; externally peer reviewed.
Open Access This is an Open Access article distributed in accordance with theterms of the Creative Commons Attribution (CC BY 4.0) license, which permitsothers to distribute, remix, adapt and build upon this work, for commercial use,provided the original work is properly cited. See: http://creativecommons.org/licenses/by/4.0/
REFERENCES1 World Health Organization. Global status report on noncommunicable diseases
2010. Geneva: World Health Organization, 2011.2 Kruger HS, Venter CS, Vorster HH. Physical inactivity as a risk factor for
cardiovascular disease in communities undergoing rural to urban transition:the THUSA study. Cardiovasc J S Afr 2003;14:16–23, quiz.
3 Caspersen CJ, Pereira MA, Curran KM. Changes in physical activity patterns in theUnited States, by sex and cross-sectional age. Med Sci Sports Exerc2000;32:1601–9.
4 Hallal PC, Andersen LB, Bull FC, et al. Global physical activity levels: surveillanceprogress, pitfalls, and prospects. Lancet 2012;380:247–57.
5 Mbalilaki JA, Hellenius ML, Masesa Z, et al. Physical activity and blood lipids inrural and urban Tanzanians. Nutr Metab Cardiovasc Dis 2007;17:344–8.
6 Sobngwi E, Mbanya JC, Unwin NC, et al. Physical activity and its relationship withobesity, hypertension and diabetes in urban and rural Cameroon. Int J Obes RelatMetab Disord 2002;26:1009–16.
7 Assah FK, Ekelund U, Brage S, et al. Urbanization, physical activity, and metabolichealth in sub-Saharan Africa. Diabetes Care 2011;34:491–6.
8 Manini TM, Everhart JE, Patel KV, et al. Daily activity energy expenditure andmortality among older adults. JAMA 2006;296:171–9.
9 Davey SG, Shipley MJ, Batty GD, et al. Physical activity and cause-specific mortalityin the Whitehall study. Public Health 2000;114:308–15.
10 Khaw KT, Jakes R, Bingham S, et al. Work and leisure time physical activityassessed using a simple, pragmatic, validated questionnaire and incidentcardiovascular disease and all-cause mortality in men and women: the EuropeanProspective Investigation into Cancer in Norfolk prospective population study. Int JEpidemiol 2006;35:1034–43.
11 Haskell WL, Lee IM, Pate RR, et al. Physical activity and public health: updatedrecommendation for adults from the American College of Sports Medicine and theAmerican Heart Association. Med Sci Sports Exerc 2007;39:1423–34.
12 Department of Health. At least five a week: evidence on the impact of physicalactivity and its relationship to health. A report from the Chief Medical Officer.London: Department of Health, 2004.
13 Bauman AE, Reis RS, Sallis JF, et al. Correlates of physical activity: why are somepeople physically active and others not? Lancet 2012;380:258–71.
14 King AC, Stokols D, Talen E, et al. Theoretical approaches to the promotion ofphysical activity: forging a transdisciplinary paradigm. Am J Prev Med2002;23:15–25.
15 Kruger HS, Venter CS, Vorster HH, et al. Physical inactivity is the major determinantof obesity in black women in the North West Province, South Africa: the THUSAstudy. Transition and health during urbanisation of South Africa. Nutrition2002;18:422–7.
16 Forrest KY, Bunker CH, Kriska AM, et al. Physical activity and cardiovascular riskfactors in a developing population. Med Sci Sports Exerc 2001;33:1598–604.
17 Oyeyemi AL, Oyeyemi AY, Jidda ZA, et al. Prevalence of physical activity amongadults in a metropolitan Nigerian city: a cross-sectional study. J Epidemiol2013;23:169–77.
18 Brage S, Brage N, Franks PW, et al. Reliability and validity of the combined heartrate and movement sensor Actiheart. Eur J Clin Nutr 2005;59:561–70.
19 Brage S, Ekelund U, Brage N, et al. Hierarchy of individual calibration levels forheart rate and accelerometry to measure physical activity. J Appl Physiol2007;103:682–92.
20 Stegle O, Fallert SV, Mackay DJ, et al. Gaussian process robust regression for noisyheart rate data. IEEE Trans Biomed Eng 2008;55:2143–51.
21 Brage S, Brage N, Franks PW, et al. Branched equation modeling of simultaneousaccelerometry and heart rate monitoring improves estimate of directly measuredphysical activity energy expenditure. J Appl Physiol 2004;96:343–51.
22 Ainsworth BE, Haskell WL, Herrmann SD, et al. 2011 Compendium of physicalactivities: a second update of codes and MET values. Med Sci Sports Exerc2011;43:1575–81.
23 Sobngwi E, Mbanya JC, Unwin NC, et al. Development and validation of aquestionnaire for the assessment of physical activity in epidemiological studies inSub-Saharan Africa. Int J Epidemiol 2001;30:1361–8.
24 Parks SE, Housemann RA, Brownson RC. Differential correlates of physical activity inurban and rural adults of various socioeconomic backgrounds in the United States.J Epidemiol Community Health 2003;57:29–35.
25 Wilcox S, Castro C, King AC, et al. Determinants of leisure time physical activity inrural compared with urban older and ethnically diverse women in the United States.J Epidemiol Community Health 2000;54:667–72.
26 Sodjinou R, Agueh V, Fayomi B, et al. Obesity and cardio-metabolic risk factors inurban adults of Benin: relationship with socio-economic status, urbanisation, andlifestyle patterns. BMC Public Health 2008;8:84.
27 Lagerros YT, Lagiou P. Assessment of physical activity and energyexpenditure in epidemiological research of chronic diseases. Eur J Epidemiol2007;22:353–62.
28 Shephard RJ. Limits to the measurement of habitual physical activity byquestionnaires. Br J Sports Med 2003;37:197–206.
29 Christensen DL, Friis H, Mwaniki DL, et al. Prevalence of glucose intolerance andassociated risk factors in rural and urban populations of different ethnic groups inKenya. Diabetes Res Clin Pract 2009;84:303–10.
30 Christensen DL, Faurholt-Jepsen D, Boit MK, et al. Cardiorespiratory fitness andphysical activity in Luo, Kamba, and Maasai of rural Kenya. Am J Hum Biol2012;24:723–9.
31 Ford ES, Merritt RK, Heath GW, et al. Physical activity behaviors in lower and highersocioeconomic status populations. Am J Epidemiol 1991;133:1246–56.
32 Marshall SJ, Jones DA, Ainsworth BE, et al. Race/ethnicity, social class, andleisure-time physical inactivity. Med Sci Sports Exerc 2007;39:44–51.
33 Atlantis E, Barnes EH, Ball K. Weight status and perception barriers to healthyphysical activity and diet behavior. Int J Obes (Lond) 2008;32:343–52.
34 Yancey AK, Simon PA, McCarthy WJ, et al. Ethnic and sex variations in overweightself-perception: relationship to sedentariness. Obesity 2006;14:980–8.
706 Assah F, et al. J Epidemiol Community Health 2015;69:700–707. doi:10.1136/jech-2014-205154
Other topics on 10 July 2018 by guest. P
rotected by copyright.http://jech.bm
j.com/
J Epidem
iol Com
munity H
ealth: first published as 10.1136/jech-2014-205154 on 3 April 2015. D
ownloaded from
35 Ball K, Crawford D, Owen N. Too fat to exercise? Obesity as a barrier to physicalactivity. Aust N Z J Public Health 2000;24:331–3.
36 Schmitz K, French SA, Jeffery RW. Correlates of changes in leisure timephysical activity over 2 years: the Healthy Worker Project. Prev Med1997;26:570–9.
37 Macera CA, Ham SA, Yore MM, et al. Prevalence of physical activity in the UnitedStates: Behavioral Risk Factor Surveillance System, 2001. Prev Chronic Dis2005;2:A17.
38 Pan SY, Cameron C, Desmeules M, et al. Individual, social, environmental, andphysical environmental correlates with physical activity among Canadians:a cross-sectional study. BMC Public Health 2009;9:21.
39 Steffen LM, Arnett DK, Blackburn H, et al. Population trends in leisure-time physicalactivity: Minnesota Heart Survey, 1980–2000. Med Sci Sports Exerc2006;38:1716–23.
40 Mennen LI, Mbanya JC, Cade J, et al. The habitual diet in rural and urbanCameroon. Eur J Clin Nutr 2000;54:150–4.
Assah F, et al. J Epidemiol Community Health 2015;69:700–707. doi:10.1136/jech-2014-205154 707
Other topics on 10 July 2018 by guest. P
rotected by copyright.http://jech.bm
j.com/
J Epidem
iol Com
munity H
ealth: first published as 10.1136/jech-2014-205154 on 3 April 2015. D
ownloaded from