Embed Size (px)
Citation preview
STUDIES ON BIOLOGY AND SELECTED CONTROL
MEASURES OF WEEDY RICE (Oryza sativa complex) IN RICE CULTIVATION
by
ZAINAL ABIDIN BIN HJ. ABDUL HAMID
Thesis submitted in fulfilment of the requirements
for the degree of DOCTOR OF PHILOSOPHY
February 2008

ii
ACKNOWLEDGEMENT
In the name of Allah, the most merciful, the most compassionate. I
praise Allah the Almighty, for giving me the health, peace of mind and strength
to persevere and continue in my struggle for success.
This study would not have been made possible but for the advice, help
and cooperation of various individuals. First and foremost, I would like to
express my sincere appreciation to my respected main Supervisor, Professor
Dr. Hj. Mashhor Mansor and to my co-Supervisor Dr. Hj. Azmi Man (Mardi,
Bertam) for their endless help and guidance, encouragement, enthusiasm and
unfailing support extended throughout the whole process of completing my
thesis. I would also like to take this opportunity to express my gratitude to
Universiti Sains Malaysia for all facilities provided to enable me in conducting
the field and plant house studies.
My deep indebtness to the Malaysian Government under Education
Ministry for its generous offer of sponsorship during my study at Universiti
Sains Malaysia. I would like to express my gratefulness to the Director of
Muda Agricultural Development Authority (MADA) and his staff for giving their
support and cooperation throughout the duration of my studies. I am indebted
to all the many farmers who had spent time and their invaluable participation
made this study possible especially Hj. Ibrahim Shaari for providing study sites
and cooperation during the study period.
To all members of the Electron microscopy unit, Ms Jamilah, Mr Johari
and Mr Ganesh, Mr Saadon, Mr Muthu and Mr Nordin, thank you for your

iii
patience and guidance in the laboratory and fields works. Last but not least, I
wish to thank all those who in one way or another contributed to the
completion of this thesis.
Finally, this thesis is especially dedicated to my beloved family, for their
sacrifice, love and understanding during my study.
iv
TABLE OF CONTENTS
Page
Acknowledgements ii
Table of Contents Iv
List of Tables viii
List of Figures xiii
List of Plates xviii
Abstrak xx
Abstract
xxii
CHAPTER 1 – GENERAL INTRODUCTION
1.1 INTRODUCTION 1.1.1 General Background of the Study 1.1.2 Approaches and Objectives of the Study
1
1 7
CHAPTER 2 – LITERATURE REVIEW
2.1 WEED ECOLOGY 2.1.1 Changing of weed community 2.1.2 Soil and longevity of seedbank
10
10 14
2.2 WEED BIOLOGY 2.2.1 Roles of weed biology 2.2.2 Genetic diversity in weedy rice (O. sativa complex) 2.2.3 Weed competitiveness 2.2.4 Yield loss due to weeds
20
20 20 22 25
2.3 WEEDY RICE (Oryza sativa complex) 2.3.1 Biology and distribution
28
28 2.3.2 Dormancy and germination 2.3.3 Economic importance of weeds
36 38
v
2.4 MANAGEMENT AND CULTURAL PRACTICES OF WEEDS 2.4.1 Principles of weed management
38
38 2.4.2 Selection for control method 40 2.4.3 Effectiveness of using herbicides 41 2.4.4 Nitrogen fertilizer effectiveness 43 2.4.5 Seedbed preparation 45 2.4.6 Water management 46 2.4.7 Approaches for Integrated Weed Management 48 CHAPTER 3 – ECOLOGICAL STUDY
52
3.1 WEED SURVEY IN MUDA RICEFIELDS
52
3.1.1 Introduction 52 3.1.2 Materials and Methods 54 3.1.3 Results 58 3.1.3.1 Survey on O. sativa complex distribution in the Muda area
58
3.1.3.2 Weed distribution in the Muda ricefields area during main season 2003 to off-season 2005
62
3.1.4 Discussion 74 3.2 SEASONAL VARIATION IN THE WEED SEEDBANK OF
COMMON WEED SPECIES
78
3.2.1 Introduction 78 3.2.2 Materials and Methods 81
3.2.3 Results 3.2.3.1 Seeds emergence
84 84
3.2.3.2 Weed species density in the soil seedbank 3.2.3.3 Weed species composition in the soil
seedbank
86 87
3.2.4 Discussion 99 3.2.4.1 Weed species density in the soil seedbank
3.2.4.2 Weed species composition in the soil seedbank
99 100
3.3 EFFECT OF CULTURAL PRACTICES ON WEEDY RICE
POPULATION AND RICE YIELD PRODUCTION
106
3.3.1 Introduction 106 3.3.2 Materials and Methods 107
3.3.3 Results 3.3.3.1 Farmers’ profile
111 111
3.3.3.2 Land preparation 113 3.3.3.3 Distribution of weedy rice 115 3.3.3.4 Productivity – grain and yield components 123
3.3.4 Discussion 125
vi
CHAPTER 4 – BIOLOGICAL STUDY 131 4.1 LIFE CYCLE AND MORPHOLOGICAL CHARACTERISTICS
OF WEEDY RICE
131
4.1.1 Introduction 131 4.1.2 Materials and Methods 133 4.1.3 Results 137
4.1.3.1 Morphological and topographical characteristics of weedy rice
137
4.1.3.2 Growth pattern of weedy rice 145 4.1.4 Discussion 154
4.1.4.1 Morphological and topographical characteristics of weedy rice
154
4.1.4.2 Growth pattern of weedy rice 158 4.2 STUDIES ON PLANT DEMOGRAPHY OF WEEDY RICE
162
4.2.1 Introduction 162 4.2.2 Materials and Methods 164 4.2.3 Results 167 4.2.4 Discussion 173 4.3 THE EFFECT OF REDOX POTENTIAL ON THE GERMINATION AND GROWTH OF WEEDY RICE
176
4.3.1 Introduction 176 4.3.2 Materials and Methods 178 Experiment 1: Laboratory Experiment 178 Experiment 2: Plant house Experiment 181 Experiment 3: Field Experiment 183 4.3.3 Results 184 Experiment 1: Laboratory Experiment 184 Experiment 2: Plant house Experiment 190 Experiment 3: Field Experiment 192 4.3.4 Discussion 195 CHAPTER 5 – CONTROL AND MANAGEMENT OF WEEDY RICE
202
5.1 INFLUENCE OF FLOODING ON WEEDY RICE EMERGENCE AND GROWTH
202
5.1.1 Introduction 202 5.1.2 Materials and Methods 204 5.1.3 Results 206 5.1.3.1 Seed germination 206 5.1.3.2 Plant growth 209 5.1.4 Discussion
216
vii
5.2 THE EFFECTS OF NITROGEN ON RICE YIELD
219
5.2.1 Introduction 219 5.2.2 Materials and Methods 221 5.2.3 Results 224 5.2.3.1 Vegetative growth of rice plants 224 5.2.3.2 Yield components and rice yield 235 5.2.4 Discussion 239 5.3 FARMERS’ ATTITUDE AND PERCEPTION ON WEED MANAGEMENT
244
5.3.1 Introduction 244 5.3.2 Materials and Methods 246 5.3.2.1 The study area 246 5.3.2.2 Sampling and instruments 246 5.3.3 Results 251 5.3.3.1 Farmer respondents’ demographic profile 254 5.3.3.2 Weed management 264 5.3.4 Discussion 271
CHAPTER 6 – GENERAL DISCUSSION
271
6.1 Ecological and Biological Study 271
6.1.1 Distribution of weed species in the Muda rice granary area
271
6.1.2 Control and weed management 275 6.2 Recommendation for further research
280
BIBLIOGRAPHY
283
APPENDICES
311
1 Analysis of total organic nitrogen in soil Semi-Micro Kjedahl Digestion
311
2 Analysis of total phosphorus
314
3 Analysis potassium 317
4 Analysis of nitrogen from plant samples: A semi-micro Kjeldahl methods
318
5 SEM Tissue Preparation Schedule (HMDS Technique)
321
6 Questionnaire form
323
7 List of published papers from 2003-2006 329
viii
LIST OF TABLES
Page
Table 2.3.1
Undesirable characteristics of weedy rice including evolutional characteristics in rice production in Malaysia
34
Table 3.1.1 Occurrence and distribution of weed species in the Muda area from 2/2003 to 1/2005 season
63
Table 3.1.2 Comparison of relative density, relative dominance, relative frequency and importance value index on dominance of weed species in ricefields during rice growing period in Muda area for four consecutive seasons (2/2003 to 1/2005 seasons)
64
Table 3.1.3 Comparison of relative density, relative dominance, relative frequency and importance value index on dominance of weed species in ricefields during rice growing period in Muda area for four consecutive seasons (2/2003 to 1/2005 seasons)
67
Table 3.1.4 Rate scale of I.V. on weed species in ricefields during rice growing period in Muda area from 2/2003 to 1/2005 season
68
Table 3..1.5
Cluster nodes values for the weeds species 71
Table 3..1.6
Cluster nodes values 73
Table 3.2.1
Cluster nodes values 96
Table 3.2.2
Cluster nodes values 98
Table 3.3.1 Comparison of rice varieties in five study sites in Kampung Tandop, Guar Chempedak, Kedah for four consecutive seasons
112
Table 3.3.2 Comparison of crop establishment methods in five study sites in Kampung Tandop, Guar Chempedak, Kedah for four consecutive seasons
112
Table 3.3.3 Lists of farmers’ cultural practices on reducing weeds population in ricefields in Kampung Tandop, Guar Chempedak, Kedah
114
ix
Table 3.3.4 Comparison of grain yield (expected yield) in the five study sites in Kampung Tandop, Guar Chempedak, Kedah for four consecutive seasons
124
Table 3.3.5 Comparison of grain yield (actual yield) in the five study sites in Kampung Tandop, Guar Chempedak, Kedah for four consecutive seasons
124
Table 4.1.1 Comparison of growth pattern of weedy rice sown in plant house condition
147
Table 4.1.2 Summary of roughness present on the leaf surface
156
Table 4.2.1 Life table of the weedy rice (Oryza sativa complex) treated without nitrogen planted in plant house
169
Table 4.2.2 Values of Lx, Tx, and ex (mean expectation of life)
169
Table 4.2.3 Life table of the weedy rice (Oryza sativa complex) treated with 150kg N/ha planted in plant house
170
Table 4.2.4 Values of Lx, Tx, and ex (mean expectation of life)
170
Table 5.1.2
Percentage (%) of O. sativa complex seed emergence under different times and depths of flooding
207
Table 5.1.2 Effect of plant heights (cm) of O. sativa complex under different times and depths of flooding
210
Table 5.1.3 Effect of root lengths (cm) of O. sativa complex under different times and depths of flooding
211
Table 5.1.4 Effect of dry weight (g) of roots of O. sativa complex under different times and depths of flooding
213
Table 5.1.5 Effect of dry weight (g) of shoots of O. sativa complex under different times and depths of flooding
214
x
Table 5.1.6 Effect of total dry weight (g) of O. sativa complex under different times and depths of flooding
215
Table 5.2.1 Plant height of rice as affected by nitrogen fertilization and weedy rice competition at 30 DAS
226
Table 5.2.2 Tiller numbers of rice as affected by nitrogen fertilization and weedy rice competition at 30 DAS
226
Table 5.2.3 Chlorophyll contents of rice leaves as affected by nitrogen fertilization and weedy rice competition at 30 DAS
227
Table 5.2.4 Plant height of rice as affected by nitrogen fertilization and weedy rice competition at 60 DAS
227
Table 5.2.5 Tiller number of rice as affected by nitrogen fertilization and weedy rice competition at 60 DAS
228
Table 5.2.6 Chlorophyll contents of rice leaves as affected by nitrogen fertilization and weedy rice competition at 60 DAS
228
Table 5.2.7 Plant heights of rice as affected by nitrogen fertilization and weedy rice competition at harvest
229
Table 5.2.8 Tiller numbers of rice as affected by nitrogen fertilization and weedy rice competition at harvest
229
Table 5.2.9 Chlorophyll contents of rice as affected by nitrogen fertilization and weedy rice competition at harvest
230
Table 5.2.10 Dry weights of rice straw as affected by nitrogen fertilization and weedy rice competition at harvest
232
Table 5.2.11 Dry weights of rice plant as affected by nitrogen fertilization and weedy rice competition at harvest
232
xi
Table 5.2.12 Nitrogen contents of rice as affected by nitrogen fertilization and weedy rice competition at harvest
234
Table 5.2.13 Number of panicles per plant as affected by nitrogen fertilization and weedy rice competition at harvest
236
Table 5.2.14 Percentage (%) of filled grain of rice as affected by nitrogen fertilization and weedy rice competition at harvest
236
Table 5.2.15 Weights of 1000 grains of rice as affected by nitrogen fertilization and weedy rice competition at harvest
237
Table 5.2.16 Grain yield of rice as affected by nitrogen fertilization and weedy rice competition at different rates of nitrogen fertilization
237
Table 5.3.1 Detail number of farmers distributions out of 244 farmers from 27 localities of Mada area
253
Table 5.3.2 Frequency distribution of farmers’ demographic profile of the surveyed farmers (total respondents = 244)
253
Table 5.3.3 Frequency of farmers’ cultural practices on reducing weeds population cited in 244 interviews in ricefields in Muda area
255
Table 5.3.4 The most dominant herbicide usages based on 244 farms’ surveyed in the Muda area, Kedah
256
Table 5.3.5 Farmers perception of important dominant weeds species out of 244 farms’ surveyed in the Muda area, Kedah
257
Table 5.3.6 Farmers perception of important dominant weeds species resistant out of 244 farms’ surveyed in the Muda area, Kedah
257
Table 5.3.7 Comparison of means of the different aged groups across rice yield during main season 2004 (2/2004)
259
Table 5.3.8 Cross tabulation between Age and Grain Yield for 1/2005 season
259
xii
Table 5.3.9 Cross tabulation between Age and Grain Yield for 1/2004 season
260
Table 5.3.10 Cross tabulation between Age and Grain Yield for 2/2004 season
260
Table 5.3.11 Cross tabulation between age and the highest yield achieved
261
Table 5.3.12 Grain yield among farmers as for three consecutive season in Muda areas
261
Table 5.3.13 Farmers’ perception of the general identification method of weedy rice
263
xiii
LIST OF FIGURES
Page
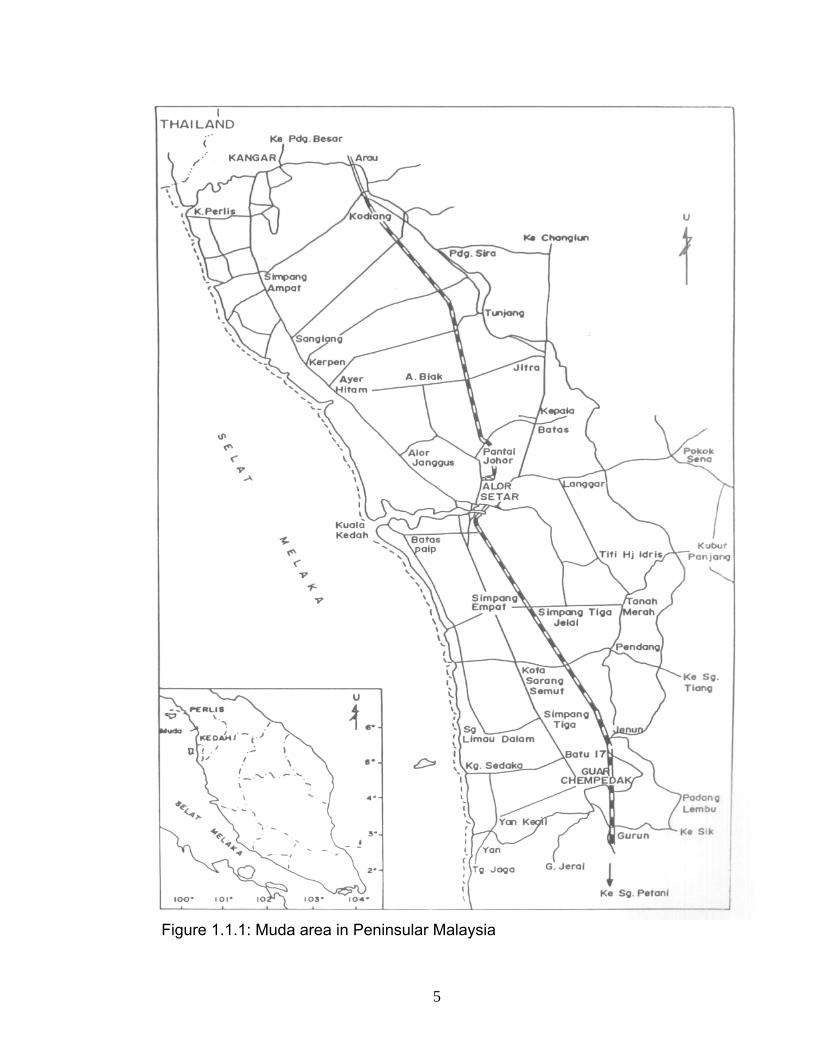
Figure 1.1.1
Muda area in Peninsular Malaysia
5
Figure 2.1.1 Diagrammatic flow chart for the dynamics of the population of weed seed bank in the soil
17
Figure 2.2.1 Interacting forces in weed-crop competition
24
Figure 2.3.1 Geographical distribution of weedy rice (Oryza sativa complex ) in the world (adapted from Baki, 2005)
33
Figure 2.4.1 Research strategy for the development of an integrated weed management system
51
Figure 3.1.1 Map of sampling sites at Muda area
55
Figure 3.1.2 Percentage of area infested by weedy rice (Oryza sativa complex) in Muda area from 1993 to 2004 (Mada’s data)
59
Figure 3.1.3 Area infested pattern by weedy rice during 12 year (1993-2004) in Muda area (source: Mada’s data)
60
Figure 3.1.4 Mean monthly rainfall distribution in Muda area from 1993 to 2004
60
Figure 3.1.5 Rainfall distribution in Muda area in 1996 and 2004
61
Figure 3.1.6 Importance value of five dominance weeds species in Muda area during period studied (main season 2003/04, off-season 2004, main season 2004/05 and off-season 2005)
69
Figure 3.1.7 A dendrogram resulting from cluster analysis of theweed pecies distribution. The most similar weedspecies are clustered together
72
Figure 3.1.8 Dendrogram of the cluster analysis for the difference planting season in Muda area for four consecutive seasons
73
Figure 3.2.1 Number of seedlings of eight dominant weed species from Kampung Tandop, Yan, Kedah ricefields soils (from 5 sampling sites) for four consecutive seasons
85
xiv
Figure 3.2.2 Number of individual seedlings of each species at every temporal observations which germinated from soil seedbank at Kampung Tandop, Guar Chempedak, Kedah for four consecutive seasons (season 1/2004 to 2/2005)
88
Figure 3.2.3a Average number of individuals and total accumulation of dominant weed seed germination from Kampung Tandop, Yan, Kedah ricefield for off-season 2004 (1/2004) (mean of 5 replications)
90
Figure 3.2.3b Average number of individuals and total accumulation of dominant weed seed germination from Kampung Tandop, Yan, Kedah ricefield for main-season 2004 (2/2004) (mean of 5 replications)
91
Figure 3.2.3c Average number of individuals and total accumulation of dominant weed seed germination from Kampung Tandop, Yan, Kedah ricefield for off-season 2005 (1/2005) (mean of 5 replications)
92
Figure 3.2.3d Average number of individuals and total accumulation of dominant weed seed germination from Kampung Tandop, Yan, Kedah ricefield for main-season 2005 (1/2005) (mean of 5 replications)
93
Figure 3.2.4 Importance value (%) of eight common weed species which were found in the soil seedbank at Kampung Tandop, Guar Chempedak, Yan, Kedah ricefield
95
Figure 3.2.5 A dendrogram resulting from cluster analysis (UPGMA) of the common weed seedlings in soil seedbank using Pearson’s similarity coefficient
96
Figure 3.2.6 PCA biplot of distribution of weed seeds emergence and growing seasons based on the scores Eigenvalues
97
Figure 3.2.7 Dendogram representing an unweighted pair group mean cluster analysis (UPGMA) for weed species and planting seasons in soil seedbank. The most similar seasons are clustered together
98
Figure 3.3.1 Map of the five sampling sites in Kampung Tandop, Guar Chempedak. A, B, C, D, and E represents the study sites
110
xv
Figure 3.3.2(a) Comparison crop establishment method on distribution of weedy rice for four consecutive seasons
116
Figure 3.3.2(b) Comparison crop establishment method on distribution of weedy rice for four consecutive seasons
117
Figure 3.3.2(c) Comparison crop establishment method on distribution of weedy rice for four consecutive seasons
118
Figure 3.3.2(d) Comparison crop establishment method on distribution of weedy rice for four consecutive seasons
119
Figure 3.3.2(e) Comparison crop establishment method on distribution of weedy rice for four consecutive seasons
120
Figure 3.3.3 Distribution of weedy rice panicles/m2 for 50 sampling points from Kampung Tandop, Yan, Kedah ricefields for four consecutive seasons (season 1/2004 to 2/2005)
121
Figure 3.3.4 Comparison the distribution of weedy rice panicles among the farmers for four consecutive seasons. Vertical bars represent ±S.E
122
Figure 4.1.1 Comparison of tiller production of variants of weedy rice planted in plant house condition. Vertical bars represent ±S.E
149
Figure 4.1.2 Linear regression of number of tiller production by variants of weedy rice
150
Figure 4.1.3 Comparison of plant height of variants of weedy rice planted in plant house condition. Vertical bars represent ±S.E
151
Figure 4.1.4 Relationship between plant heights of weedy rice variants and days after seeding
152
xvi
Figure 4.1.5 Schematic representation of the life cycle of weedy rice (open panicle variant). A = seed; B = pregerminated seed (3-8 days after seeding, DAS); C = 2-3 leaf-stage (7-10 DAS), D = 1-2 tillers stage (15-20 DAS), E = active tillering stage (25-30 DAS), F = maximum tillering/booting stage (40 – 50 DAS), G = Heading stage (55-60 DAS), H = Flowering/maturation stage (60-95 DAS). A-E = Vegetative phase; E-F = Reproductive phase; F-H = Ripening phase
153
Figure 4.2.1 Life expectancies (ex) for weedy rice. Vertical bars represent ±S.E
171
Figure 4.2.2 Survivorship curves for population of weedy rice. Vertical bars represent ±S.E
171
Figure 4.2.3 Diagrammatic life-table for weedy rice which was treated with (A) 0 kg N/ha and (B) 150 kg N/ha, in plant house condition. By convention, rectangles represent stages of the life-cycle; inverted triangles represent transition probabilities between stages and the diamonds represent seed production
179
Figure 4.3.1 The physical set up of the redox potential experiment under room condition. Redox potential and dissolved oxygen reading were taken from A, B, and C for both tubes
185
Figure 4.3.2 (A and B)
Changes of redox potential readings taken at the surface; middle surface; bottom from substrate. Vertical bars represent ±S.E. A = aerobic condition, B = anaerobic condition
186
Figure 4.3.3 Changes in redox potential and dissolved oxygen. Vertical bars represent ±S.E
187
Figure 4.3.4 Changes of redox potential and plant growth under Vertical bars represent ±S.E Vertical bars represent ±S.E. (A) aerobic and (B) anaerobic condition
188
Figure 4.3.5 Relationship between redox potential (mV) and dissolved oxygen (mg/L)
191
Figure 4.3.6 Canges in redox potential of difference water depth planted in plant house condition. Vertical bars represent ±S.E
191
xvii
Figure 4.3.7
Changes in dissolved oxygen of difference water depth planted in plant house condition. Vertical bars represent ±S.E
193
Figure 4.3.8 Changes of redox potential, dissolved oxygen, pH and water temperature during rainy season for five field plots in Guar Chempedak, Yan, Kedah. Vertical bars represent ±S.E
194
Figure 4.3.9 Changes of redox potential, dissolved oxygen, pH and water temperature during dry season for five field plots in Guar Chempedak, Yan, Kedah. Vertical bars represent ±S.E
194
Figure 5.1.1 Effect of water depth and time of flooding on seed emergence and total dry weight of weedy rice at 28 DAS
208
Figure 5.2.1 Chlorophyll content of the leaves of rice plant and weedy rice at different rates of nitrogen fertilization
230
Figure 5.2.2 Dry weights of the plants of rice and weedy rice at different rates of nitrogen fertilization
233
Figure 5.2.3 Nitrogen contents of rice plant and weedy rice at different rates of nitrogen fertilization
234
Figure 5.3.1 Map of sampling sites based on MADA-localities in the Muda rice granary area
247
Figure 5.3.2 The structure of the questionnaire
252
Figure 6.1
Diagrammatic presentation of the life cycle of weedy rice-crop association, illustrating the temporal development of the surface and buried seedbanks in the soil with respect to direct seeded rice
277
Figure a
Sketch of Markham apparatus 313
xviii
LIST OF PLATES
Page
Plate 2.3.1 Serious infestation of weedy rice in Guar Chempedak, Yan, Kedah’s ricefield
35
Plate 2.3.2 Lodging caused by weedy rice infestation in Guar Chempedak, Yan, Kedah’s ricefield
35
Plate 4.1.1 Variants of weedy rice which are used in the study. A = open panicle, non-pigmented; B= compact panicle, pigmented; and C = awned, close panicle, non-pigmented
134
Plate 4.1.2 Scanning electron micrographs of weedy rice shows morphological of seed surface with microhairs. (a) Cultivated rice (MR219) (b) Open panicle (c) Compact panicle (d) Awn. Bar = 200 µm
138
Plate 4.1.3 Scanning electron micrographs show of morphological of weedy rice seed glume. (a) Cultivated rice (MR219) (b) Open panicle (c) Compact panicle (d) Awn. Bar = 100 µm
139
Plate 4.1.4 Morphological of seed surface with gemmate papillae regularly arranged. Close-up of parallel rows of tubercles/trichomes. (a) Cultivated rice (MR219) (b) Open panicle (c) Compact panicle (d) Awn. Bar = 10 µm
140
Plate 4.1.5 Morphological of seed surface with gemmate papillae regularly arranged. Close-up of parallel rows of tubercles/trichomes. (a) Cultivated rice (MR219) (b) Open panicle (c) Compact panicle (d) Awn. Bar = 10 µm
141
Plate 4.1.6 Morphological of adaxial leaf surface views of weedy rice, with epicuticular cell layers which is covered waxes and microhairs/spines shatteringly locate and the rows of silica knobs can be distinctly seen. (a) Cultivated rice (MR219) (b) Open panicle (c) Compact panicle (d) Awn. Bar = 20 µm
142

xix
Plate 4.1.7 Morphological of weedy rice abaxial coleoptile surface sizes with the parallel rows of various of papillae stomata and microhairs, and generally covered with wax. (a) Cultivated rice (MR219) (b) Open panicle (c) Compact panicle (d) Awn. Bar = 10 µm
143
Plate 4.1.8 Morphological structure of weedy rice stomata on abaxial surface covered with the dense wax deposits and with many silica knobs excluded the surface of guard cells. Four knobs except (c) locate at the four corners of peristomatal rims. (a) Cultivated rice (MR219) (b) Open panicle (c) Compact panicle (d) Awn. Bar = 2µm
144
xx
KAJIAN BIOLOGI DAN KAEDAH KAWALAN TERPILIH PADI ANGIN (Oryza sativa kompleks) DALAM PENANAMAN PADI
ABSTRAK
Survei lapangan telah dilakukan mulai 2003 sehingga 2005 dalam
tempoh empat musim berturut-turut menunjukkan terdapat 44 spesis rumpai
daripada 29 genera yang tergolong dalam 18 famili dicatatkan di kawasan
Muda. Lapan belas spesies daripadanya adalah jenis berdaun lebar, 12
rusiga, 9 rumput dan 5 tumbuhan akuatik. Hierarki bagi lima rumpai yang
dominan berdasarkan nilai kepentingan adalah seperti berikut: Oryza sativa
complex (padi angin) > Echinochloa crus-galli > Ludwigia hyssopifolia >
Fimbristylis miliaceae > Ischaemum rugosum. Kajian bank benih mendapati
sejumlah 577 benih berupaya bercambah yang menyamai 3337 benih m-2
(33.37 juta benih ha-1) dalam musim 1/2004, 979 (5659 benih m-2 atau 56.59
juta benih ha-1) dalam musim 2/2004, 928 benih (5364 benih m-2 atau 53.64
juta benih m-2) dalam musim 1/2005 dan 471 benih (2722 benih m-2 atau
27.22 juta benih m-2) dalam musim 2/2005. Kaedah tabur dalam air mampu
mengawal serangan padi angin dan seterusnya meningkatkan pengeluaran
hasil. Purata bilangan tangkai padi angin berkurangan semasa di luar musim
(1/2004) dan semasa musim utama 2004(2/2004), berkurangan sebanyak
15.55% bilangan tangkai padi angin. Purata hasil yang dijangkakan dan hasil
sebenar adalah sama bagi semua sawah padi terpilih untuk empat musim
berturut-turut. Semasa musim 2/2004 hingga 1/2005 dan musim 1/2005
hingga musim 2/2005, hasil kasar padi masing-masing meningkat sebanyak
6.02% dan 7.94%. Nama-nama varian padi angin adalah: janggut dan tidak
berwarna; tangkai terbuka dan tidak berwarna dan tangkai tertutup dan
xxi
berwarna diambil dari Guar Chempedak menunjukkan bentuk pertumbuhan
dan perbezaan anatomi yang agak sama terutamanya bagi varian tangkai
tertutup dan berwarna. Padi angin melengkap kitar hidupnya dalam masa 85-
95 hari selepas bercambah. Berdasarkan kajian demografi tumbuhan, kadar
penghasilan biji dengan nitrogen adalah 368 biji/tangkai (8464 biji/pokok) dan
tanpa nitrogen sebanyak 255 biji/tangkai (2295 biji/pokok). Keputusan dari
kajian keupayaan redoks, menunjukkan bahawa nilai keupayaan redoks
berkurangan terhadap kedalaman. Berdasarkan dari aspek kawalan dan
pengurusan rumpai, padi angin dapat dikawal secara efektif apabila diberi
takungan air sedalam 5.0 hingga 10.0 cm pada umur 0 hingga 7 hari lepas
cambah. Tanah yang lembap dan tepu membolehkan padi angin berupaya
bermandiri dan tumbuh. Kajian kadar nitrogen yang berbeza menunjukkan
bahawa saingan padi angin mengurangkan pertumbuhan dan komponen-
komponen hasil: bilangan tangkai pokok-1 (59.93% kepada 40.07%); peratus
pengisian biji (57.68% kepada 42.32%); berat 1000 biji (51.87% kepada
48.13%); dan hasil padi (57.70% kepada 42.32%). Keputusan menunjukkan
bahawa 150 – 200 kg ha-1 merupakan kadar baja yang disyorkan. Keputusan
dari survei petani yang terlibat membuktikan bahawa para petani mempunyai
pengetahuan dan pengalaman yang baik dalam aktiviti-aktiviti pertanian untuk
mengawal rumpai terutamanya padi angin. Walau bagaimanapun, mereka
masih kurang berpengetahuan terhadap pemilihan dan penggunaan herbisid.
Tambahan pula, kebanyakan mereka menghadapi masalah yang hampir
sama iaitu ketidakcukupan air semasa penyediaan tanah di dalam sawah
mereka.

xxii
STUDIES ON BIOLOGY AND SELECTED CONTROL MEASURES OF WEEDY RICE (Oryza sativa complex) IN RICE CULTIVATION
ABSTRACT
Field survey which was conducted from 2003 to 2005 over four
consecutive seasons showed that 44 weeds species in 29 genera belonging
to 18 families were recorded in the Muda ricefield. Of these, 18 species were
broadleaves, 12 sedges, 9 grasses and 5 aquatic plants. The hierarchy of five
dominant weed species based on important value (I.V.) was as follows: Oryza
sativa complex (weedy rice) > Echinochloa crus-galli > Ludwigia hyssopifolia >
Fimbristylis miliaceae > Ischaemum rugosum. Soil seedbank study showed
that a total of 577 seeds germinated which equal to 3337 seed m-2 (33.37
million seed ha-1) in 1/2004 season, 979 seeds (5659 seed m-2 or 56.59 million
seed ha-1) in 2/2004 season, 928 seeds (5364 seed m-2 or 53.64 million seed
m-2) in 1/2005 season and 471 seeds (2722 seed m-2 or 27.22 million seed m-
2) in 2/2005 season. Water seeding method was able to control weedy rice
infestation and subsequently produced higher yield. The average number of
weedy rice panicles was greatly reduced during off-season (season 1/2004)
and during main season 2004 (season 2/2004) the rate decreased by 15.55%
number of weedy rice panicles. Average expected and actual yield were
relatively similar for all selected farm lands for four consecutive seasons.
During season 2/2004 to 1/2005 and season 1/2005 to season 2/2005, the
gross yields increased by 6.02%, and 7.94%, respectively. The variants of
weedy rice, namely; awn and non-pigmented; open panicle and non-
pigmented and compact panicle and pigmented collected from Guar
xxiii
Chempedak showed that growth pattern and anatomical differences were
quite similar particularly on compact panicle and pigmented variant. Weedy
rice completes its life cycle within 85–95 days after emergence. Based on
plant demography study, under treatment of 150 kg N/ha, the rate of seed
production from all survival adult individuals was 368 seeds per panicle (8464
seeds per plant) and without N was 255 seeds per panicle (2295 seeds per
plant). Result from redox potential study, showed that the values of redox
potential decreased with depth. Based on the control and weed management
aspect, the species could be suppressed with the flooding from 5.0 to 10.0 cm
water depth at 0 and 7 days after emergence (DAE). Moist and saturated soils
favored the survival and growth of weedy rice. Different rates of nitrogen were
tested and the result demonstrated that the competition of weedy rice in rice
caused reduction of growth and yield components: number of panicles plant-1
(59.93% to 40.07%); percentages of filled grains (57.68% to 42.32%); weight
of 1000 grains (51.87% to 48.13%); and rice yield (57.70% to 42.32%). The
results showed that 150 – 200 kg ha-1 is recommended to fertilize. Result from
the farm’s survey indicated that the farmers who participated in the study had
good knowledge and experience of agricultural practices to control weeds
especially weedy rice. However, they still lack sufficient knowledge on
herbicide selection and application. Besides, the majority of them has almost
similar problem in their fields which is insufficient water during land
preparation.
CHAPTER 1
GENERAL INTRODUCTION
1.1 INTRODUCTION
1.1.1 General Background of the Study
Rice (Oryza sativa L.) is also known as paddy rice is one of the most
important crops in the world (Chang and Luh, 1991). It is a major staple food
for more than two-third of the world’s population (Kim et al., 2005), where
human activities have led to growing of rice in more than 100 countries across
a south to north span from 40oS to 53oN latitude covered the areas from sea
level to altitudes of more than 2 500m (Grist, 1986; Chang, 2003). This food
grains is primary calorific source which accounts for one-third or more of
caloric intake. It provided up to 80% of the calorific intake of nearly three
billion people in Asia, Africa and South America. In Asia, it provided an
average of 32% total calorie uptake (Maclean et al., 2002). As such, it is the
most important crop worldwide, particularly in developing countries, where
more than 90% of the world’s rice is grown and consume (Kim et al., 2005).
More than 90% of the world’s rice is produced and consumed in Asia. In order
to meet the demographic demand, the yield of rice production will need to be
increased by 35% before 2010 despite a decrease in land, labour and water
available for agriculture. IRRI (1989) stated that the demand for rice is
projected to increase by 60% over the next 30 years. Then, by 2020, four

2
billion people, or more than half of the world population will depend on rice as
a food. Besides, the world’s annual rice production will have to increase 70%
by the year 2030 to keep up with the demands of a growing population (Xiao
et al., 1996). This extra production must be met from existing land resources
through improved productivity of both transplanted and direct seeded system
and through sustainable agricultural practices to ensure long-term food supply
as well.
Historically, it is believed rice is an ancient grain crop which has been
cultivated for thousand of years. Rice belongs to the genus Oryza, tribe
Oryzeae, subfamily Oryzoideae, and family Poaceae. Generally, there are two
cultivated rice species namely, Oryza sativa L. (common rice world widely
grown in the humid tropics and temperate zones) and O. glaberrima Steud.
(endemic to West and Central Africa), belong to the sativa complex and are
diploids with the AA genome (Veasey et al., 2004). The name of genus Oryza
is derived from the Greek, meaning ‘of oriental region’ whereas sativa, means
‘sown’ in Latin and glaberrima, means ‘smooth’ and free of hairs (Catling,
1992). Asian cultivated rice has evolved into three eco-geographic races;
indica, japonica and javanica. Indica cultivars constitute the majority of rice
production worldwide, with estimation of about 80%. Besides these cultivated
species, the genus Oryza includes approximately 20 wild species (Chang,
1976; Morishima, 1984; Vaughan, 1994; Mackill, 1995) or 21 wild species
(Veasey et al., 2004). The cultivated rice known today is believed to have
occurred via mutations that resulted in awnless, non-shattering grains, and
3
selection for favorable characteristics by the early agricultural inhabitants of
Asia (Holm et al., 1997). The lineage of cultivated rice is also believed to
originate from the wild perennial O. rufipogon which became O. nivara and
eventually, O. sativa was derived (Chang, 1976).
Although originally domesticated in Asia, the exact site of origin is
uncertain. However, Chang (1976) reported that cultivated rice has been used
as food in Thailand since 5000 B.C., but O. glaberrima was first domesticated
by the Africans around 1500 B.C.. Moreover, Grist (1986) noted that rice was
first domesticated in the area between northern India and Pacific coast
adjoining Vietnam and China. The cultivated rice believed to have originated in
South-east Asia, particularly India and Indo-China, where the richest diversity of
cultivated forms has been recorded (Grist, 1986; Catling, 1992). In addition,
Catling (1992) and Maclean et al. (2002) also reported that the Asian rice
culture was established in northern India, Thailand (discovered at Non Nok Tha
in the Korat area) and eastern China around 7000 years ago. Then, it spread
and diversified to form two ecological groups, Indica and Japonica northwards
in Asia. From the mainland of the continent it also spread south and east
through the Malay archipelago with the flow of human culture (Vaughan, 1991).
Therefore, in Southeast Asia rice was introduced by the Deutero-Malays when
they immigrated into this region about 1599 B.C.
Currently in Malaysia, agricultural areas covered 4.64 million hectares
and approximately 14% (622,500 ha) of these areas are dedicated to rice
4
cultivation (Itoh, 1991b). The area planted with rice in Peninsular Malaysia
is about 402,800 ha., while in Sabah and Sarawak is about 200,000 ha.
(Itoh, 1991b). There are eight granary areas as permanent rice producing areas
(Itoh, 1991a; 1991b). Muda area which covers 98,860 ha of wet ricefields is the
single largest rice granary area in Malaysia. Kuan et al. (1991) and Morooka
(1992) reported that this rice granary contributed approximately 25% of total
national rice production (Figure 1.1.1). In Malaysia, rice production is not
parallel with the increment of country’s population (Maclean et al., 2002). The
country needs about 1.85 million t/ha (tons per hectares) of rice a year in
order to fulfill domestic demands. Its resources are from local output of 65% to
70% and additionally from Thailand, Vietnam, Pakistan and India with 30% to
35% but our country can only produce rice yield about 1.2 million tons per
hectares. Due to this, increasing rice production will continue to be an important
agenda for Malaysia. Therefore, the Department of Agriculture stressed that in
order to stop the import of rice from other countries is to increase rice yield to
10 t/ha. In order to achieve sufficient self-consumption of rice, this project had
begun in year 2002 as to increase the rice production in Malaysia.
In rice cultures, many constraints are faced by the farmers in
gaining high yield. Weeds are a constant problem in all rice-growing areas
especially in direct seeded rice . For example, for the past 10 to 15 years in
Southeast Asia, there has been a significant shift in the rice production system
from transplanting methods to direct seeding methods of which wet seeding
(pregerminated seed usually broadcast on puddle soil) has been the main
5
Figure 1.1.1: Muda area in Peninsular Malaysia
6
method adopted in Malaysia, Thailand, Philippines and Vietnam. This is
mainly due to labour shortage and increasing labour cost. The advantages of
using this system are able to use modern early rice maturing varieties as well
as integrated harvesting activities (Moody, 1995).
According to Wah (1998) the proportion of direct seeded land under rice
cultivation is believed to be highest in Peninsular Malaysia amongst all the
Asian countries and then followed by Thailand, Vietnam (fast adopting this
cultural change), Indonesia and Philippines. Direct seeding in other parts of
Southeast Asia is thus being practiced to a considerable degree although its
proportion to the corresponding total rice area under cultivation is lesser as
compared with the Peninsular Malaysia. Generally, direct seeded rice includes
both dry and wet seeded methods. In Malaysia, research on direct seeding was
first initiated in the early 1970s. In the Muda area, direct seeding method was
started in early 1980s. Ho et al. (1999) reported that among the various
reasons cited by farmers on the adoption of direct seeding were to overcome
shortage of labour, to reduce cost of production, to try new technique of
planting and water management problem would not arise.
The demand of transplanting, manual weeding and increasing of labour
have encouraged the move to direct seeding in irrigated and rainfed lowlands.
Weeds become a major issue in this system because rice and weeds emerge
at the same time. Weed control by flooding is quite difficult in seedling rice
when it is not managed properly. In recent years in Malaysia, weedy rice
7
(Oryza sativa complex) had been emerging as a serious weed in rice. O. sativa
complex infestation result in yield loss, harvesting problems, and quality loss
through discount. The occurrence of weedy rice was first detected in the
southern part of the Muda area in 1990. It was identify that direct-seeding had
promoted the spread of weedy rice (Ho et al., 1999). As a result, the history and
current status of weedy rice has been reviewed extensively (Watanabe et al.,
2000; Azmi et al., 2005). The weed severely infested the fields of direct seeded
rice in the Muda area (Md. Zuki et al., 1995; Md. Zuki et al., 1996; Bakar et
al., 2000). Therefore, it has been considered as the most dominant and
troublesome in most growing areas throughout the world (Watanabe et al.,
2000).
1.1.2 Approaches and Objectives of the Study
So far the literature on weedy rice studies is still limited. Based on
morphological characters of weedy rice, it resembles cultivated rice and
therefore difficult to differentiate between weedy rice and cultivated rice. As a
result, basic information on this species is needed particularly in deciding an
integrated weed management in direct seeded rice. Ecological and biological
approaches are mainly focused in order to obtain a specific method which is
ecologically and economically sound to farmers in the region. Therefore,
knowledge of these approaches is the fundamental concept to enhance the
success of weed management and contribute to gain insight into the
mechanisms of weed control methods.
8
Based on the above problem statements, the study was conducted at
ricefield of MADA (Muda Agricultural Development Authority), Guar
Chempedak and laboratory as well as the plant house of the School of
Biological Sciences, Universiti Sains Malaysia, Penang. Scientific discussion for
these aspects was presented separately and could be contributed to the
farmers and researchers for a good alternative in order to reduced the weeds
and gaining high yield to fulfill our needs.
The objectives of this study are to determine:
(a) weedy rice infestation in Muda rice granaries in Peninsular Malaysia;
(b) the population of weed seedbank in the soils with special reference to
weedy rice seedbank;
(c) the effects of crop establishment methods and agronomic practices
among farmers on weedy rice population and rice yield productions;
(d) the biology of weedy rice (life table, growth pattern and life cycle);
(e) the physical and environment parameters that trigger the occurrence of
the species with respect to redox potential;
9
(f) the influence of flooding on weedy rice emergence and growth at
different times and depths of flooding;
(g) the degree of weedy rice competition in direct seeded rice under different
nitrogen application rates;
(h) farmers’ attitude and perception on weed management with respect to
weedy rice infestation.
Scientific comments on the above aspects will be discussed separately
in the following topics. This research was conducted so that the data collected
can be used as guide to give the best alternative in controlling and managing
weeds particularly weedy rice, generally in Malaysia and specifically in the
Muda area.
10
CHAPTER 2
LITERATURE REVIEW
2.1 WEED ECOLOGY 2.1.1 Changing of weed community
Weeds are plants growing where they are not wanted in particular areas.
It is widely known that weeds have been efficiently established in a site
because of its ideal characteristics. Example of these characteristics are ability
to survive unfavorable growing condition, competitive ability, high reproductive
capacity, rapid and spontaneous growth, appearing without being sown and
aggressiveness. When a group of weeds has successfully established in the
environment, the crop species together with other organisms including humans
and animals will interact with each other to form a particular agro-ecosystem
community. Thus, Akobundu (1987) believe that weed ecology is associated
with the growth characteristics, adaptations and survival mechanisms of weeds
that enable them to conquer environmental resources, and successfully
colonize new habitats.
Weed population shifts are due to the changes in the individual
organisms that make up the population of a locality. This is often caused by
changes in weed management practices (Mortimer, 1996; Rao, 2000). A
farmer and an individual field play a role in adapting the subsequent changes.
Similar findings have been reported in rice fields where weeds are dynamic and
11
they changed in abundance and dominance according to changes in the rice
agroecosystem (De Datta, 1981; Azmi, 1994; Tomita et al., 2003; Karim et al.,
2004; Begum et al., 2005a; 2005b). Furthermore, Kim et al. (1983) stated
that the occurence of weed vegetation of a particular area is determined with
biotic (plants, microorganism) and abiotic (temperature, edaphic and climatic
conditions) factors. The occurrence of weed vegetation is strongly affected by
cultural practices such as irrigation, fertilizer, cultivar grown, tillage, herbicide
used and crop rotation (Rao, 2000; Poggio et al., 2004). Edaphic factors such
as soil physical structure, pH, nutrient and moisture status also strongly affect
the weed vegetation. Ho (1998) also stated that the weed distribution is always
affected by human and environmental factors. The weed spectrum and the
degree of infestation in the rice agroecosystem are often determined by the
types of rice culture (irrigated, rainfed lowland, upland, deepwater, and tidal
wetland), crop establishment method (transplanted or direct seeded), moisture
regime (irrigated and rainfed), land preparation (lowland or upland) and cultural
practices (flooding, fertilizer application, cultivar types) (De Datta, 1981).
Mercado (1979), Zanin et al. (1997), Poggio et al. (2004) and Yin et al. (2005)
added that, the plant composition of the biosphere keeps on changing
particularly in cultivated areas. There are also major factors that influences
weed population in rice fields such as control method used, rice cultivar planted
and changes in soil and water management (De Datta, 1988). The continuous
adoption of any particular rice production practice frequently causes a shift in
dominance of the weed population.
12
Switching from transplanted to direct seeded rice cultivation has
changed the population, distribution and intensity of weeds abruptly (Azmi and
Baki, 1995). Thus, groups of species which grow in the same area must
possess common environmental tolerance which enables them to survive the
hazards of the area. There may however be different strategic solutions which
accomplish the same tolerances. In this case, weed community must also differ
in ways which permit them to escape from an exclusive struggle for existence.
The widespread adoption of direct seeding has occurred changes in weeds
flora (from predominance of broadleaved weeds and sedges in transplanted
crop to the more competitive grasses in direct seeding (Azmi and Hussin, 1995;
Azmi et al., 2000; Bakar et al., 2000; Karim et al., 2004; Begum et al., 2005a;
2005b).
Studies of these cases have been carried out by several researchers
in Muda area showed that in early 1970s during direct seeding technique being
introduced (less than 1% of cultivation area), there are 21 species in 13 families
was recorded (Watanabe et al., 1996; Watanabe et al., 1999). The sequence
of hierarchy according to the dominance weeds are Monochoria vaginalis >
Ludwigia hyssofolia > Fimbrystylis miliaceae > Cyperus difformis (Ho and Md.
Zuki, 1988). In the first season 1989 (82% of the Muda area), 57 species of
weeds in 28 families was recorded. The most troublesome weeds are
Echinochloa crus-galli > Leptochloa chinensis > F. miliaceae > Marsilia crenata
> M. vaginalis (Ho and Itoh, 1991). Azmi et al. (1993) indicated that the most
dominant weed species are Echinochloa crus-galli > F. miliaceae > L. chinensis
13
> Scirpus grossus. M. vaginalis > E. crus-galli > Bacopa rotundifolia > Cyperus
iria > L. chinensis (Azmi, 1994). Pane (1997) and (Pane et al., 1998) recorded
the highest weed species are L. chinensis > F. miliaceae > E. crus-galli > L.
octovalvis. Whereas, Begum et al. (2005a; 2005b) observed the weed
vegetation in terms of percentage field infestation were O. sativa complex
(weedy rice) > L. chinensis > E. crus-galli > I. rugosum > F. miliaceae > L.
hyssipoflia. Thus, widespread transformation of rice cultivation method from
manual transplanting to direct seeding has created a rapid change in weed
spectrum in Muda area. Changing of distribution of weeds species has
occurred problems to select the suitable management of weeds on how to
overcome this problem. Recently, weedy rice (Oryza sativa complex) is
considered a new weed species has established and emerging threat to rice
production in certain rice areas of Peninsular Malaysia (Azmi et al., 1994).
Weedy rice infestation was indicated as early as in 1988 in Projek Barat Laut
Selangor (PBLS) and Muda area in 1990 (Azmi and Abdullah, 1998).
Generally, the existing of several weeds from different habitats varied in
term of growth strategy in order to survive with other species. Most plant
ommunities exhibit both vertical and horizontal differentiation. For example,
different species occur at various height above ground and also distributed
differently along the ground surface (Radosevich and Holt, 1984). Kershaw
and Looney (1985) also mentioned that pattern in vegetation is the spatial
arrangement of individuals of a different species. This phenomenon consists of
morphological pattern controlled by its morphological characteristics, for
14
example roots, shoots and rhizomes with respect to its growth development,
environmental pattern developed in vegetation in response to a general and
overall variation of one of the major environmental factors and producers a
pattern of density distribution and sociological pattern caused by the effect of
an individual on environment which can be quite independent of the age of the
individual. Knowledge about the weed community emergence pattern could
suggest planting dates for annual crops with limited herbicide option that may
minimize weed interference and also benefit growth simulation models that
have been developed for crops grown in this region (Kiniry et al., 1992).
Indeed, management and planning of weeds program are associated with
planting activities. Weeds control program is not only to eradicate weeds
species but it might be changed their distribution and relationship between
species due to disturb their nature ecology, competition interaction, weeds
suppression as well as form of growth development in community.
2.1.2 Soil and longevity of seedbank
Most agricultural soils contain a large reservoir of weed seeds which
germinate over time (Navie et al., 2004). The number and type of seeds in the
reservoir are determined by a field’s cropping history, edaphic characteristics
(moisture-holding capacity and pH), past weed control practices, tillage and
land preparation practices, rate of germination and seedling growth of each
species (Zimdahl et al., 1988).
15
Reservoir of weed seeds also known as the soil seedbank of plant
community contributes significantly to the ability of that community to
regenerate and to the distribution pattern of the vegetation, while the seed
production of the vegetation influenced the composition and abundance of the
seedbank. The soil seedbank is a product of the past and represents the
potential future of the aboveground plant community (Swanton and Booth,
2004). As a result, seedbanks are very important to the ecology of communities
and to recruitment of species, particularly those that rely mostly or totally on
non-vegetative means of reproduction (Navie et al., 1996). Thill et al. (1985)
and Zamora and Thill (1989) also stated that the soil seedbanks are
important components of vegetation dynamics affecting both ecosystem
resistance and resilience caused of the viable seeds on the soil surface and in
the soil for many years comprised an enormous reservoir of dormant and
nondormant seeds. Furthermore, an important element in seedbank dynamics
is seedbank depletion (Westerman, 2003; van Mourik et al., 2005),
unsuccessful germination (Grundy et al., 2003), seed movement (Lonsdale,
1993; Colbach et al., 2000; Forcela, 2003) and seed mortality as a result of
ageing and attack by pathogens (Lonsdale, 1993; Forcela, 2003). The soil
seedbank divided into surface seedbank (active seedbank) and buried
seedbank (dormant seedbank). Rao (2000) stated that seedbanks are
composed of numerous species belonging to three groups. The first group
includes a few dominant species accounting for 70 to 90% of total seedbank.
These species represent most of the weed problems in a cropping system. The
second group of species comprising 10 to 20% of the seedbank, generally
16
includes those adapted to the geographic area however not to current
production practices. The third group accounts for a small percentage of the
total seed and includes recalcitrant seeds from previous seedbanks of the
previous crop (Wilson et al., 1988). This group undergoes constant change due
to seed dispersal by humans, other animals, wind and water. Buhler et al.
(1997) mentioned that weed seedbank characteristic influence both the weed
populations that occur in a field and the success of weed management. Weeds
produce a lot of seed. Most of the seeds entering the seedbank come from
annual weeds (Rao, 2000). New seeds may enter the seedbank through many
sources, but the largest source is plants producing seed within the field
(Cavers, 1983). Mortimer (1990) stated that comparatively there are between
100 and 1000 seeds m-2 in forest soils, 100 and 1000000 m-2 in grassland and
arable soils 1000 and 100 000 m-2. Generally, the size of seedbank in
agricultural land ranges from near zero to as much as 1 million seed m-2
(Fenner, 1987). Many processes are involved in the generation and regulation
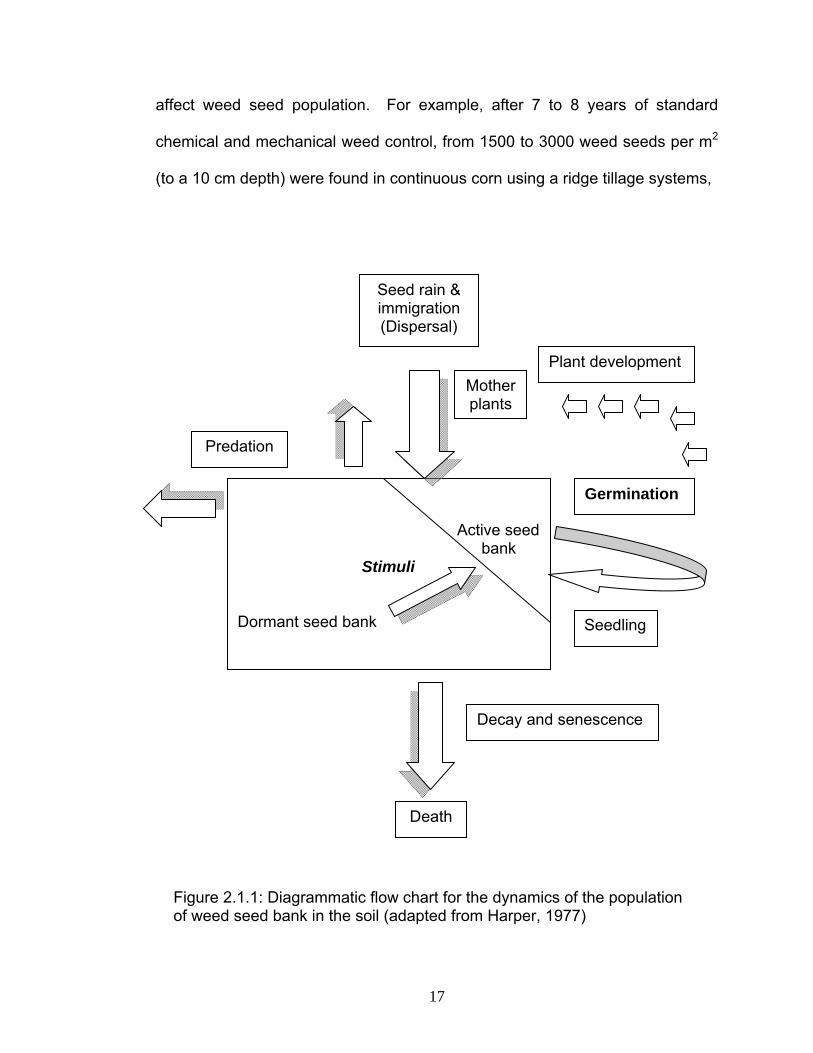
of the seedbank in the soil as illustrated in Figure 2.1.1.
Management practices have major impacts on these processes
(Mulugeta and Stoltenberg, 1997a; 1997b; Webster et al., 2003). Evidently,
farming practices influence the quantities of seeds returned to and removed
from the soil. Therefore, cultural practices can have a substantial effect on
species composition and seed density in agricultural fields. In addition,
depending on agronomic management practices used (tillage), buried seed
stays viable for several years and different types of tillage systems also may
17
affect weed seed population. For example, after 7 to 8 years of standard
chemical and mechanical weed control, from 1500 to 3000 weed seeds per m2
(to a 10 cm depth) were found in continuous corn using a ridge tillage systems,
Figure 2.1.1: Diagrammatic flow chart for the dynamics of the population of weed seed bank in the soil (adapted from Harper, 1977)
Active seed bank Stimuli Dormant seed bank
Germination
Mother plants
Plant development
Seed rain & immigration (Dispersal)
Seedling
Predation
Decay and senescence
Death
18
while about two-third fewer seeds were found in conventionally tilled corn
(Forcell and Lindstrom, 1988).
The seedbank is a function of the longevity of seeds in the soil and
determined by the inherent viability of seeds and dormancy mechanisms
(Maillet, 1991). According to the field survey, weed seeds at a density of
712,228 – 930,910 seeds/m² were recorded in the soil of direct seeded
ricefields in the Muda area (Ismail et al., 1995). Considerable longevity of seeds
is a widespread characteristic. Some seeds could be buried up to 10” (26 cm)
deep and do not surface for years. Therefore, seed longevity and seedling
emergence are important biological characteristics for an eradication program
because seed longevity determines the number of years required to repeat
eradication treatments while seedling emergence determines when to apply
eradication treatments. For example, weed seed population in ricefields were
the highest (about 793,000/m) even greater than in the other two plantation
crops. These seeds had a high germination rate of about 80% (Ismail, 1989).
In Brazil, de Avila et al. (2000) reported that red rice (Oryza sativa complex) is
one of the most important weeds of lowland rice, causing yield and quality
losses and rendering land usable for rice production due to the buildup of a
persistent seed bank. It has seed longevity in the soil. Seed longevity in the
soil is ecotype-dependent and is also affected by burial depth, soil type and
moisture, and dormancy density as well (Noldin, 2000).
19
Concerning the study of seedbank, there are many reports on
agricultural and silvicultural in applied fields. However, there is limited
information on the ecology of seeds and seedling which is very useful weapon
to analyze the structure and succession of plant communities (Holzner, 1982).
Therefore, an in depth study on ecology of weeds weedy rice have to proceed
particularly on management of its seed bank during pre-planting period
(Watanabe et al., 1999; Abdullah and Mohamed, 2002). In Korea, Pyon et al.
(2000) stated that 2.7% - 3.7% emergence of cultivated rice and 17.0% -
26.3% emergence of weedy rice occurred during planting before winter.
Besides, emergence percentages were higher at shallower depth than in deep
soil. Weedy rice can be emerged (60% and 100% germination) at the 9 cm
water depth but cultivated rice did not emerge at the same depth.
Although seed of many weed species have the potential for long-term
survival in the seed bank, most seeds have a short life span (Murdoch and
Ellis, 1992). Factors accounting for the loss of weeds in the soil include
germination, decay, predation, and physical movement. The relative importance
of these mechanisms varies with species and environmental conditions (Buhler
et al., 1997). Anderson (1996) also indicated that some seeds will be lost to
predation by insects, arthropods, rodents, and birds.
20
2.2 WEED BIOLOGY
2.2 1 Roles of weed biology
Weeds are group of plants of which are neither desirable nor economical
values to surroundings. They have special characteristic such as tolerance to
environmental changes, production of large numbers of seeds and high
competitive ability (Ismail, 1989), rapid growth through vegetative phase to
flowering, discontinuous germination (internally controlled) and great longevity
of seed (Monaco et al., 2002). Therefore, an understanding of the biology of
weed is very useful due to improve weed management strategies. In the rice
cropping system, knowledge on the biological identification (morphology and
anatomy), distribution and life cycle as well as ecological aspect should be
taken into consideration during planning on how to decrease the population of
weeds.
2.2.2 Genetic diversity in weedy rice (O. sativa complex)
The evolution of weeds is a complex phenomenon. Baker (1974) and
De Wet and Harlan (1975) discussed the weeds evolve within the man-made
habitats in three principal ways: (a) from wild colonizers through selection
toward adaptation to continuous habitat disturbance; (b) as derivatives of
hybridization between wild and cultivated races of domestic species; and (c)
from abandoned domesticates through selection towards a less intimate
21
association with man. Moreover, Mortimer (1990) has reviewed that the
evolution of weeds may be seen at three levels: (a) speciation; genetic change
in a taxon and the evolution of a species with characters favouring growth in
disturbed an unpredictable habitat; (b) race formation in which locally adapted
races of a weed species occur; and (c) crop mimicry where the association of
crop and weed is so intimately associated with man that it has led to the
evolution of mimetic weeds. Weedy rice is considered to have various origins.
Weedy rice found in regions where no wild rice occurs is probably derivatives of
cultigens.
Weedy rice usually involves hybridization and/or selection of shattering
types within the primary gene pools of the two rice cultigens, O. sativa and O.
glaberrima, and their close relatives that share the AA genome (Vaughan,
1994; Vaughan et al., 2001). However, Abdullah et al. (1996a; 1996b) reported
that there are two possible ways that weedy rice in the Malaysian granaries
evolved from cultivated rice either by spontaneous mutation of genes
controlling shattering or by hybridizing among cultivars and subsequent
selection favoring shattering phenotypes.
According to Azmi and Abdullah (1998), the origin of weedy rice has
been very speculative because of two reasons. Firstly, the grain features of
weedy rice and its variant strains are similar to the modern cultivated rice and
secondly, a similar observation of annual weedy types or intermediate types
(genotypes believed to be natural hybrids) has been reported in countries.
22
Based on these reasons, there are indications that gene(s) introgression has
taken place in the past between cultivated rice and O. rufipogon, a wild rice
commonly found in the Muda area. DNA analysis using randomly amplified
polymorphic DNA (RAPD) markers confirmed that the genetic structure of
weedy rice plants was also of close similarity to cultivated rice, shows that the
Malaysian weedy rice could have originated from cultivated rice (Vaughan et
al., 1995a; 1995b; Abdullah et al., 1996a; 1996b).
In Surinam, Watanabe et al. (2000) recognized two types of weedy rice;
one type was resulting from dropped seeds from previous harvests and red
rice. Whereas in Korea, Tang and Morishima (1997), found that weedy rice
strains may be originated from wild vs. cultivated type variation and from indica-
japonica variation. Generally, weedy rice is a hybrid between wild rice and
cultivated rice. Several studies have done concerning with the origin of weedy
rice (Noldin, 2000; Sato, 2000; Song et al., 2002; Chen et al., 2004; Arrieta-
Espinoza et al., 2005).
2.2.3 Weed competitiveness
In general, among annual weeds, broadleaved weeds are more competitive
than are grass weeds (Anderson, 1996). Competition between weeds and rice
is a negative interaction that minimizes rice yield. The degree of competition is
closely associated to the life cycle of the crop. Keeping annual crops weed-free
during the first third of their life cycle is critical, since that is the period when
23
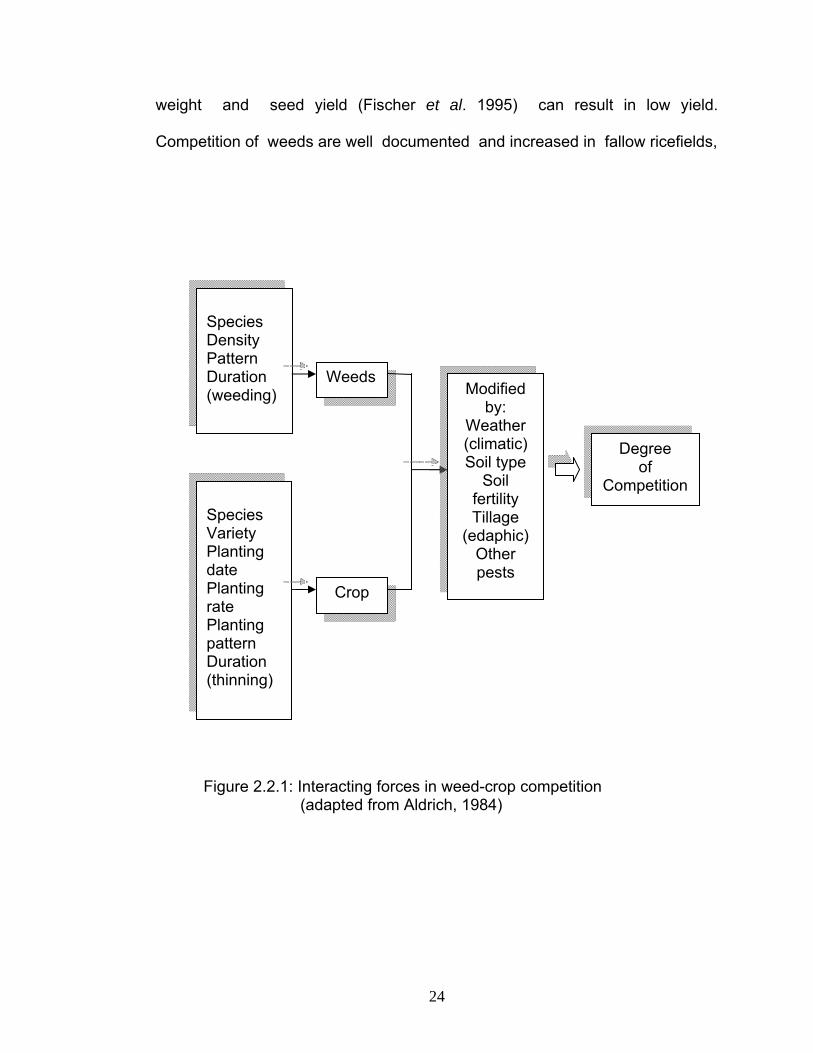
weed competition is the most damaging (De Datta, 1981). Competition that
occurs later in the crop life cycle usually results in minimal yield loss, although
seeds from late-season weed infestations can become a problem in
subsequent crops. Competitive ability of rice is measured in terms of weed
effects on yield and other plant characters that contribute to yield. In any case it
is clear that weeds reduce yields by competing with the crops for light, water
and nutrients as well as by exerting a negative influence through (active or
passive) emission of different substances (Holzner, 1982). Weed competition
is complicated because of several factors affected and influenced by the
degree of competition encountered by weeds and crop, a s shown in Figure
2.2.1. Aldrich (1984) and Akobundu (1987) mentioned the competitive
interactions are influence by several morphological and physiological
characteristics of the crop and the weed species, related to rate of growth, leaf
area development and light absorption capacity of the leaves.
Generally, competition begins as soon as the root system of one plant
invades a feeding area of another (Pavkycheno, cited in Radosevich and Holt,
1984). According to De Datta (1981) the greatest competition occurs when the
plants are similar in their growth habit, for example root growth and foliage
characteristics because they make nearly the same demands on the
environment. Weed competition is more severe during the early stage of plant
growth where difficult to distinguish between some grasses and rice plants
(Chandler, 1979). Reduction in height, tiller number, leaf area, dry weight shoot
24
weight and seed yield (Fischer et al. 1995) can result in low yield.
Competition of weeds are well documented and increased in fallow ricefields,
Figure 2.2.1: Interacting forces in weed-crop competition
(adapted from Aldrich, 1984)
Species Density Pattern Duration (weeding)
Species Variety Planting date Planting rate Planting pattern Duration (thinning)
Weeds
Crop
Modified by:
Weather (climatic) Soil type
Soil fertility Tillage
(edaphic) Other pests
Degree of
Competition