Embed Size (px)
DESCRIPTION
http://www.energyfromthorium.com/pdf/ORNL-TM-5781.pdf
Citation preview
OR NL/TM-5781
f i w7y
Corrosion of Several Metals in Supercritical Steam at 538OC
H. E. McCoy B. McNabb
Printed in the United States of America. Available from National Technical Information Service
U.S. Department of Commerce
Price: Printed Copy $4,510; Microfiche $3.00 5285 Port Royal Road, Springfield, Virginia 22161
e-
. %*
$-
This report was prepared as an account of work sponsored by the United States Government. Neither the United States nor the Energy Research and Development Administration/United States Nuclear Regulatory Commission, nor any of their employees, nor any of their contractors, subcontractors, or their employees, makes any warranty, express or implied, or assumes any legal liabilityor responsibilityforthe accuracy, completeness or usefulness of any information, apparatus. product or process disclosed, or represents that its use would not infringe privately owned rights.
t
Contract No. W-7405-eng-26
METALS AND CERAMICS DIVISION
c
ORNL/TM-5781 Distribution Category UC-76
CORROSION OF SEVERAL METALS IN SUPERCRITICAL STEAM AT 538's c,
H. E. McCoy and B. McNabb
Date Published: May 1977
OAK RIDGE NATIONAL LABORATORY Oak Ridge, Tennessee 37830
operated by UNION CARBIDE CORPORATION
for the EXERGY RESEARCH AND DEVELOPMENT ADMINISTRATION
W LIISTRJBUTIUN OF .THIS OOCUMENT IS UNLIMITED

CONTENTS
'=e ,* i
A F S T R A C T . . . . . . . . . . . . . . . . . . . . . . . . . . . . . . 1 INTRODUCTION . . . . . . . . . . . . . . . . . . . . . . . . . . . . 1 EXPERIMENTAL DETAILS . . . . . . . . . . . . . . . . . . . . . . . . 2
TestFacility... . . . . . . . . . . . . . . . . . . . . . . 2
Evaluation . . . . . . . . . . . . . . . . . . . . . . . . . . 4
Errors . . . . . . . . . . . . . . . . . . . . . . . . . . . . 6
Experimental Observations . . . . . . . . . . . . . . . . . . . 6
Low-Alloy Ferritic Steels . . . . . . . . . . . . . . . . . . . 6
Test Materials . . . . . . . . . . . . . . . . . . . . . . . . 4
HastelloyN.. . . . . . . . . . . . . . . . . . . . . . . . . 10 Stainless Steels . . . . . . . . . . . . . . . . . . . . . . . 17 Other Alloys . . . . . . . . . . . . . . . . . . . . . . . . . 20
Tube Burst Results -Hastelloy N . . . . . . . . . . . . . . . 24
SUMMARY . . . . . . . . . . . . . . . . . . . . . . . . . . . . . . 27
ACKNOWLEDGMENTS . . . . . . . . . . . . . . . . . . . . . . . . . . 28
REFERENCES . . . . . . . . . . . . . . . . . . . . . . . . . . . . . . 28
APPENDIX.. . . . . . . . . . . . . . . . . . . . . . . . . . . . . 33
iii

. t'
CI _. . I
CORROSION OF SEVERAL METALS IN SUPERCRITICAL STEAM AT 538OC
H. E. McCoy and B. McNabb
ABSTRACT
The corrosion of several iron- and nickel-base alloys in supercritical steam at 24.1 MPa (3500 psi) and 538OC has been measured to 7.92 X lo7 sec (22,000 hr). The experiments were carried out in TVA's 3ull Run Steam Plant. Corrosion was measured almost entirely by weight change and visual appearance; a few samples were evaluated by more descriptive analytical techniques. The corrosion rates of low-alloy ferritic steels containing from 1.1 to 8.7% Cr and 0.5 to 1.0% Mo differed by less than a factor of 2 in steam. Hastelloy N were evaluated and found to corrode at about equivalent rates. Of the alloys studied, the lowest weight gain in 3.6 X lo7 sec (10,000 hr) was 0.01 mg/cm2 for Inconel 718 and the highest 10 mg/cm2 for the low- alloy ferritic steels.
Several modified compositions of
INTRODUCTION
This study was motivated by the need of the Molten-Salt Reactor Hastelloy N has Program for a material for use in steam generators.
excellent compatibility with molten fluoride salts, but it failed prematurely in a simulated superheated steam environment. Thus, our program emphasized Hastelloy N, but included a total of over 80 alloys, mostly iron and nickel base. Because of our program to modify the chemical composition of Hastelloy N to obtain better resistance to embrittlement by irradiation and the fission product tellurium, several alloys with compositions slightly different from that of standard Hastelloy N were included in the study.
The tests were conducted in TVA's Bull Run Steam Plant in supercritical steam at 24.1 MPa (3500 psi) and 538OC. included test times up to 5 . 4 X lo7 sec (15,000 hr) and the data were reported previously. A second test period covered an additional 2.52 X lo7 sec (7000 hr) on many of the same test coupons and extended the total exposure time to 7.92 X lo7 sec (22,000 hr).. Since the Molten Salt Reactor Program has again been discontinued, the results of the total steam corrosion will be presented in this report. Although the discussion will deal only with alloys selected to illustrate several Smportant characteristics of steam corrosion, compositions and weight changes of all materials under investigation will be listed.
One test period
1
2
EXPERIMENTAL DETAILS
Test Facility
The facility used in this study is located in TVA’s Bull Run Steam Plant.3 This is a coal-fired plant with a supercritical steam cycle and a power generation capability of 980 MW. located about 5.49 m (18 ft) upstream from the turbine. The steam is extremely clean at this location containing less than 1 ppb 02, less than 5 ppb Cu, less than 3 ppb Na, less than 15 ppb SiOn, and less than 6 ppb Fe. oxygen, and the pH was controlled at 9.40 to 9.45 with ammonia. The electrical conductivity of the steam condensate is usually less than 3 x io-’ S2.cm-l.
The facility is
Hydrazine is added to the feed water to scavenge
Although the stream was generally very pure, during at least one 1.44 X lo7 sec (4000 hr) period the level of impurities was significantly higher. 0.5 mg/cm2. Bull Run engineers pointed out that several condenser tube leaks had occurred in the previous year of operation, whereas in earlier years, few if any condenser leaks occurred. cooling water in the condensers is at higher pressure than the condensing steam, untreated cooling water is introduced into the steam system hot well when a leak occurs. condenser tubes, most of the specimens lost weight for a brief period. Perturbations in the weight change data due to this phenomenon will be pointed out as the data are presented.
During this period all specimens gained very close to
Since the
After replacement of
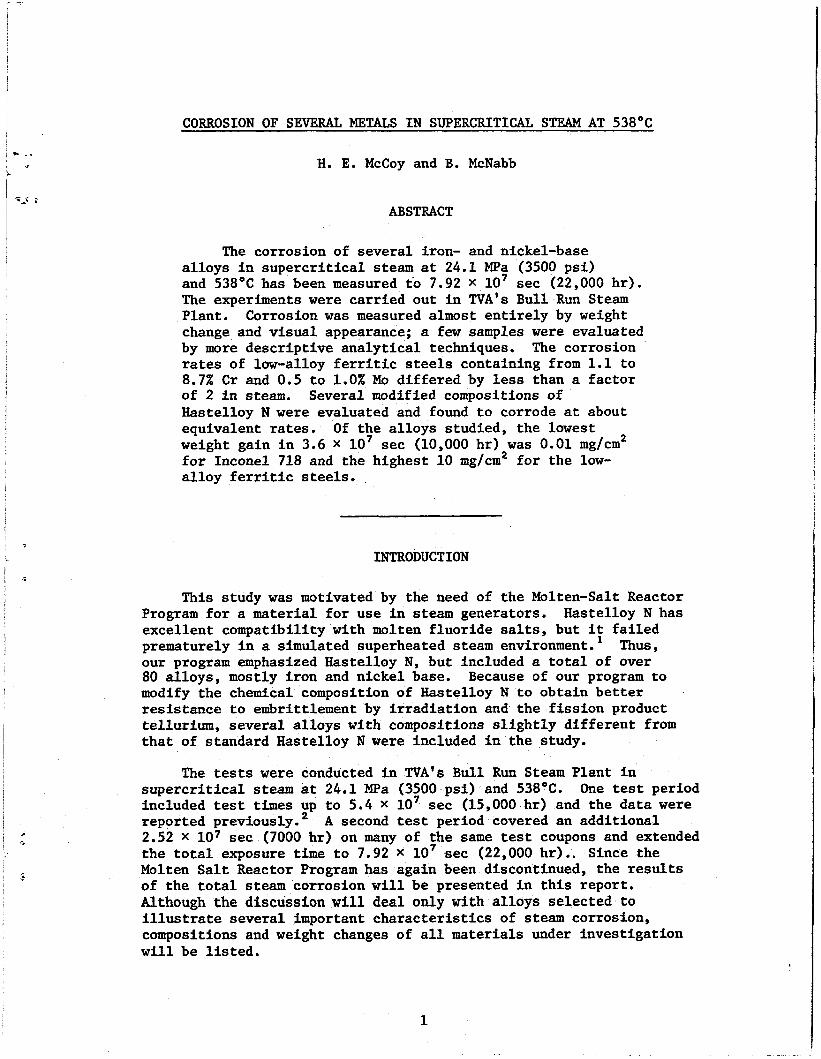
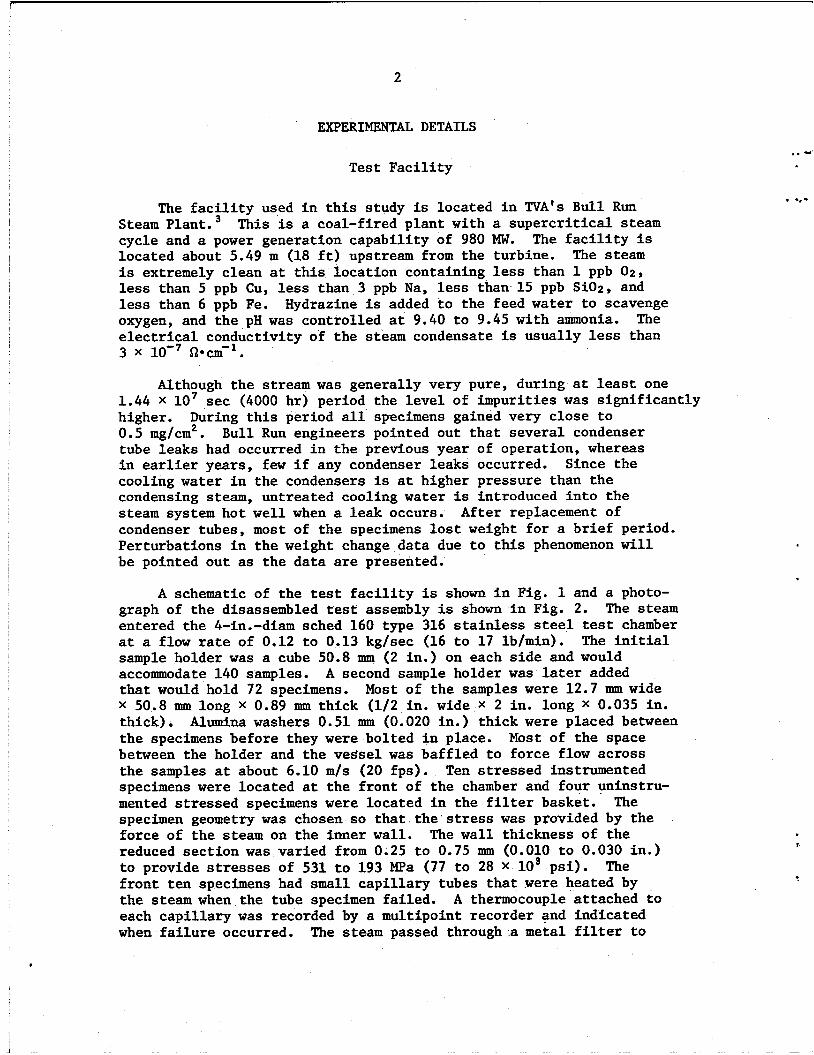
A schematic of the test facility is shown in Fig. 1 and a photo- graph of the disassembled test assembly is shown in Fig. 2. The steam entered the 4-in.-diam sched 160 type 316 stainless steel test chamber at a flow rate of 0.12 to 0.13 kg/sec (16 to 17 lb/min). sample holder was a cube 50.8 mm (2 in.) on each side and would accommodate 140 samples. that would hold 72 specimens. X 50.8 mm long X 0.89 mm thick (1/2 in. wide X 2 in. long X 0.035 in. thick). Alumina washers 0.51 mm (0.020 in.) thick were placed between the specimens before they were bolted in place. Most of the space between the holder and the vessel was baffled t o force flow across the samples at about 6.10 m/s (20 fps). Ten stressed instrumented specimens were located at the front of the chamber and four uninstru- mented stressed specimens were located in the filter basket. specimen geometry was chosen so that the stress was provided by the force of the steam on the inner wall. The wall thickness of the reduced section was varied from 0.25 to 0.75 mm (0.010 to 0.030 in.) to provide stresses of 531 to 193 MPa (77 to 28 X lo3 psi). The front ten specimens had small capillary tubes that were heated by the steam when the tube specimen failed. each capillary was recorded by a multipoint recorder and indicated when failure occurred. The steam passed thr0ugh.a metal filter to
The initial
A second sample holder was later added Most of the samples were 12.7 mm wide
The
A thermocouple attached to
. .*-
z ..
3
ORNL-OWG 68-3995R2
RE TFUINSDUCER 3500 psig IO00 OF.
16-17 Ik/min
II I SAMPLE HMER I SAMPLE VESSEL
FLOW RESTRICTER
CAPILL TUBE
TUBE BURSTSPECIMEN (TYP. 10) WATER OUT CONDENSER
RETURN TO CONDENSATE STORAGE
Fig. 1. Schematic of Test Facility Double-Walled Tube-Burst Specimen.
ARY
Fig. 2. Photograph of the Steam Corrosion Chamber After 19,000 hr of Exposure. in the filter (foreground), the two groups of unstressed specimens, and the 10 instrumented stressed specimens. The stressed specimens have an outside diameter of 25 mm (1 in.) and a length of 76 mm (3 in.).
Features to note are the stressed but unlnstrumented specimens
4
trap scale before it entered the small diameter flow restrictor. restrictor reduced the steam pressure to near atmospheric pressure before reaching the condenser. condensate storage.
The
The condensate was returned to i c .
Test Materials
Chemical analyses of the test materials are given in Table 1. Alloys The first six alloys were commercial production materials.
LC, MC, and NC were small melts of 2 1/4 Cr-1 Mo steel with variations in carbon content, and alloy 72768 is a commercial heat of 2 1/4 Cr- 1 Mo steel. The other alloys down to "Hastelloy N modifications" were commercial production heats. laboratory melts. 50- to 100-lb melts that were vacuum melted and fabricated by commercial vendors. Hastelloy N heats 2477, 5065, 5067, 5085, 5095, 5101, and Ml566 were large commercial heats of standard Hastelloy N.
Heats 185 through 237 were 2-lb Hastelloy N heats 21541 through 73008 were small
All alloys were rolled to 0.89 m (0.035 in.) thick sheet. The rolling was done cold with intermediate anneals for softening; the finish of the exposed sample surface was generally typical of cold- rolled sheet. Samples were sheared, cleaned in acetone and alcohol, and annealed in argon for 1 hr at 927OC (the low-alloy ferritic steels), 1 hr at 1038OC (the stainless steels), or 1 hr at 1177OC (all other alloys).
Evaluation
Generally only weight change measurements were made. However, the samples were also examined visually for evidence of spalling, oxide color, etc. More extensive evaluation was carried out on a few specimens, including metallography to determine depth of oxide penetration and electron microprobe scans of oxide-metal interfaces to determine the compositions of the oxide and the metal beneath the oxide.
The stressed specimens were removed every 1000 hr for examination. Measurements were made of the inside diameter of each tube with a die test gage. strain-time plot for each specimen. replaced before the assembly was returned to Bull Run. failed tubes were subjected to metallographic examination.
In this way several points were obtained on the Any failed specimens were
Some of the
5
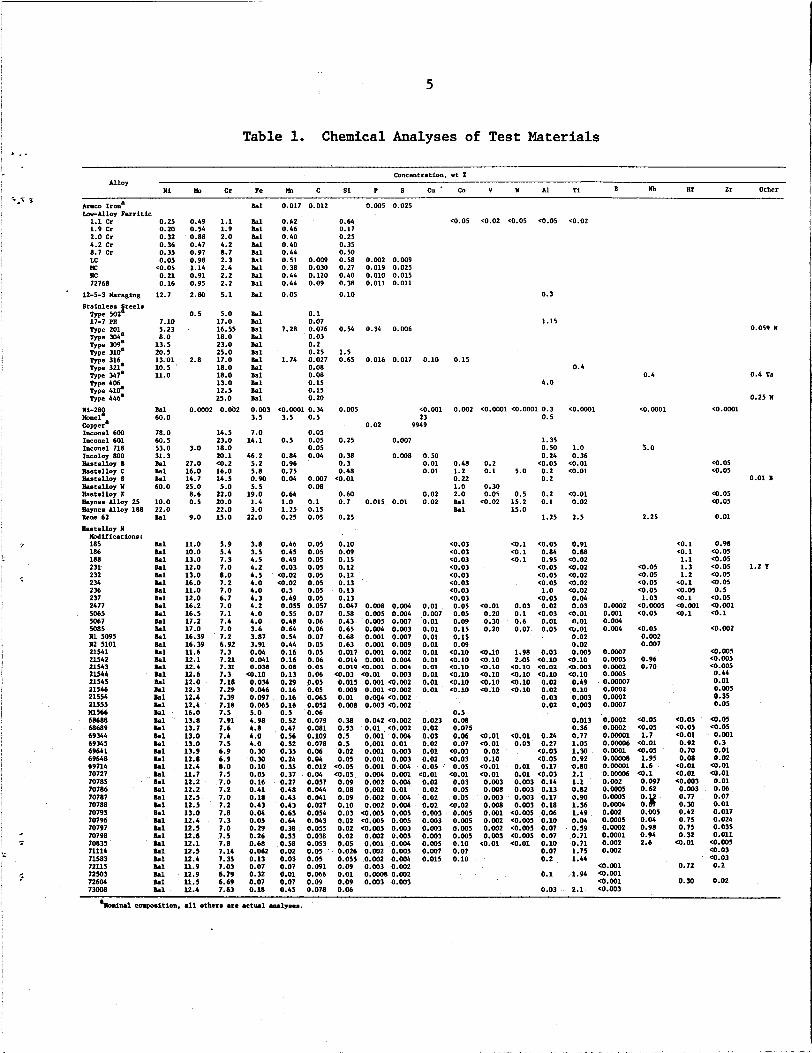
Table 1. Chemical Analyses of Test Materials ..
Concentration. wt X
Ni h Cr le Ih C Si P S Cu' Co V V A1 T i 8 Nb €If Zr Other
h l
k l h l k l k l h l k l h l k l la1 k l
h l k l BO1 k l h l h l h l h l h l h 1 h l h l 0.003 3.5
7.0 14.1
0.017 0.012
0.L2 0.46 0.40 0.40 0.44 0.51 0.009 0.38 0.030 0.44 0.120 0.44 0.09 0.05
0.1 0.07
0.03 0.2 0.25
0.08 0.08 0.15 0.15 0.20
7.28 0.076
1.74 0.027
0.005 0.025 LorNloy Ferritic 1.1 cr 0.25 1.9 Cr 0.20 2.0 Cr 0.32
0.49 1.1 0.54 1.9 0.88 2.0 0.47 5.2 0.97 8.7 0.98 2.3 1.14 2.4 0.91 2.2 0.95 2.2
2.80 5.1
0.5 5.0 17.0 16.55 18.0 23.0 25.0
2.8 17.0 18.0 18.0 13.0 12.5 25.0
o.Ooo2 0.002
0.64 0.17 0.25 0.35 0.50 0.58 0.27 0.40 0.38 0.10
O S 4
1.5 0.65
0.005
0.25
c0.05
0.15
0.002
0.48 1.2 0.22 1.0 2.0 k l k 1
<0.03 <0.03 (0.03 <0.03 <0.03 (0.03 c0.03 (0.03 0.05 0.05 0.09 0.15 0.15 0.09 (0.10 (0.10 -3.10 (0.10 (0.10 eo.10
0.5 0.08 0.075 0.06 0.07
(0.03 (0 .03 0.05
(0 . 01 0.03 0.05 0.05 (0.02 0.005 0.005 0.005 0.005 0.10 0.07 0.10
CO.02 CO.05 e0.05 <0.02
0.4
~0.0001
1.0 0.36 <0.01 (0.01
(0.01 0.02
2.5
0.91 0.88 (0.02 <0.02 <0.02 <0.02 (0 .02 0.04 0.03 (0.01
(0.01 0.02 0.02 0.005 (0.10 <0.003 (0.10 0.49 0.10 0.003 0.003
0.013 0.36
0.01
4.2 Cr 8.7 cr u: IC nc 72768
12-5-3 Haraging stainles. Steel. Type 502. 17-7 PB Type 201 Type 300. Type 309. Type 310' m e 316 Type 321' Type 347. Type 406 Type 410. Type 446'
ai-289 m m i Copper. Inconel 600 Illconel 601 Inconel 718 Inwloy 800 8.*t*lloy B Eastelloy C Baste11oy s Easte1loy Y Bastelloy I kynes Alloy 25 Baynes Alloy 188 Rem 62
0.36 0.35 0.05
<0.05 0.21 0.16 12.7
7.10 5.23 8.0 13.5 20.5 13.01 10.5 11.0
h l 60.0
78.0 60.5 53.0 31.3 k 1 h l h 1 60.0
10.0 22.0 h l
k l k 1 k l h l k l h l h l h l h l h l h l h l h l h l h 1 h l h 1 h 1 h l -1 h l h l In1 k l h l k l h l h l h 1 -1 h l h l h l k l h l k l h l k l h l h 1 h l h 1 h l k l k l h l
0.002 0.009 0.019 0.025 0.010 0.015 0.011 0.011
0.3
1.15 0.34 0.006 0.059 I
0.4 Ta
0.25 N
0.01 B
1.2 I
0.016 0.017 0.10
0.4 4.0
<0.0001 <0.0001 0.3 0.5
<0.0001 0.34 3.5 0.5
0.05 0.5 0.05
n ns
<0.001 23
0.02 9949
<0.0001 <0.0001
c0.05 C0.05
(0 .05 c0.05
0.01
0.98 (0.05 <0.05 <0.05 (0.05 c0.05 0.5
c0.05 <0.001 <O.l
<0.002
co.005 <0.005 <0.005 0.45 0.01 0.005 0.35 0.05
a.05 C0.05 0.001 0.3 0.01 0.02 c0.01 (0.01 0.01 0.06 0.07 0.01 0.017 0.024 0.035 0.011 <0.005 (0.03 (0.03 0.2
0.02
14.5 23.0 18.0 20.1 (0.2 16.0 14.5
5.0 22.0 20.0 22.0 15.0
5.9 5.4 7.3 7.0 8.0 7.2 7.0 6.7 7.0 7.1 7.4 7.0 7.2 6.92 7.3 7.21 7.31 7.3 7.18 7.29 7.39 7.18 7.5 7.91 7.6 7.4 7.5 6.9 6.9 8.0 7.5 7.0 7.2 7.0 7.2 7.8 7.3 7.0 1.5 7.8 7.14 7.35 7.03 6.79 6.69 7.63
0.007 1.35 0.50 0.24 CO.05
5.0 0.2 0.2
3.0
27.0 16.0 14.7 25.0 8.6 0.5
9.0
11.0 10.0 13.0 12.0 13.0 16.0 11.0 12.0 16.2 16.5 17.2 17.0 16.39 16.39 11.6 12.1 12.4 12.6 12.0 12.3 12.4 12.4 16.0 13.8 13.7 13.0 13.0 13.9 12.8 12.4 11.7 12.2 12.2 12.5 12.5 13.0 12.4 12.5 12.8 12.1 12.3 12.4 11.9 12.9 11.5 12.4
3.0 -.-- 46.2 0.84 0.04 0.38 0.008 0.50 5.2 0.96 0.3 0.01 5.8 0.75 0.48 0.01 0.90 0.04 0.007 <0.01
0.2 0.1
0.30 0.05 co.02
(0 . 01 0.20 0.30 0.20
(0.10 (0.10 (0.10 (0.10 (0.10 <o .10
a.01 (0.01 0.02 0.10 (0.01 <0.01 0.003
0.003 0.008 0.001 0.002 0.002 0.003
0.008
(0.01
0.5 0.2 15.2 0.1 15.0
1.25 2.25 Eastelloy N hdifieations: 185 3.8
3.5 4.5 4.2 4.5 4.0 4.0 4.3 4.2 4.0 4.0 3.6 3.87 3.91 0.04 0.041 0.0%
0.034 0.046 0.097 0.065 5.0 4.98 4.8 4.0 4.0 0.30 0.30 0.10 0.05 0.16 0.41 0.18 0.43 0.04 0.05 0.29 0.26 0.68 0.062 0.13 0.07 0.32 0.07 0.18
(0.10
0.46 0.55 0.49 0.03 co.02 a.02 0.5 0.49 0.055 0.55 0.48 0.64 0.54 0.44 0.16 0.16 0.08 0.13 0.29 0.16 0.16 0.16 0.5 0.52 0.47 0.56 0.32 0.35 0.24 0.35 0.37 0.27 0.48 0.43 0.43 0.63 0.64 0.u) 0.53 0.58 0.02 0.03 0.07 0.01 0.07 0.45
0.05 0.05 0.05 0.05 0.05 0.05 0.05 0.05 0.057 0.07 0.06 0.06 0.07 0.05 0.05 0.06 0.05 0.06 0.05 0.05 0.065 0.052 0.06 0.079 0.081 0.109 0.078 0.06 0.04 0.012 0.04 0.057 0.044 0.041 0.027 0.054 0.043 0.055 0.038 0.053 0.05 0.05 0.091 0.066 0.09 0.078
0.10 0.09 0.15 0.12 0.12 0.13 0.13 0.13 0.047 0.58 0.53 0.65 0.68 0.63 0.017 0.014 0.019
0.015 0.009 0.01 0.008
a.03
(0.1 (0.05 cO.1 0.84 (0.1 0.95
<0.05 (0.05 (0.05 1.0
e.nr
<O.l c0.1 1.1
<0.05 1.3 (0.05 1.2 <0.05 <O.l <0.05 <0.05 1.03 <O.l
0.0002 <o.Ooo5 <0.001 0.001 co.05 (0.1 0.004 0.004 (0.05
0.002 0.007
0.0007 0.0005 0.96 O.wO2 0.70 0.0005 0.00007 0.m2 0.0002 0.0007
~~~
186 188
0.008 0.005 0.005 0.004 0.001 0.001 0.001 0.001 (0.001 (0 . 01 0.001 0.001 O m 4 0.003
0.004 0.004 0.007 0.003 0.007 0.009 0.002 0.004 0.004 0.003
<o . 002 <O.002 <0.002 <0.002
0.01 0.007 0.01 0.01 0.01 0.01 0.01 0.01 0.01 0.01 0.01 0.01
_.__ 0.03 0.02 0.1 (0.03 0.6 0.01 0.07 0.05
1.98 0.03 2.05 (0.10 (0.10 <0.02 (0.10 (0.10 . . -. . . _. <0.10 0.02 <0.10 0.02
0.03 0.02
21554 21551
68688 68689 69344 69345 69641 69648 69714 70727 70785 70786 70787 70788 70795 70796 70797 70798
1 70835 71114 71583 72115 72503 72604 73008
111566 o.ow2 (0.05 (0.05 o.Ooo2 <0.05 (0.05 O.oooO1 1.7 (0.01 0.00006 (0.01 0.92 0.0001 (0.05 0.70 0.00008 1.95 0.08 0.00001 1.6 <0.01 0.00006 (0.1 (0.01 0.002 0.097 (0.003 0.0005 0.62 0.003
0.77
0.002 0.005 0.52 0.0005 0.04 0.75 0.0002 0.98 0.75 0.0001 0.94 0.32 0.002 2.6 (0.01 0.002
::E 3 0.30
0.38 0.53 0.5 0.5 0.02 0.05 co.05 (0.05 0.09 0.08 0.09 0.10 0.03 0.02 0.02 0.02 0.05 0.026 0.053 0.09 0.01 0.09 0.06
0.042 <0.002 0.01 <O.002
0.023 0.02 0.03 0.02 0.01 0.02 0.05 (0.01 0.02 0.02 0.02 0.02 0.003 0.003 0.003 0.003 0.005 0.007 0.015
(0.01 0.24 0.03 0.27
(0.03
. . ._ . . . . 0.001 0.004 0.001 0.01 0.001 0.003 0.001 0.003 0.001 0.004 0.004 0.001 0.002 0.004 0.002 0.01 0.002 0.004 0.002 0.004 (0.005 0.005 (0.005 0.005 <0.005 0.003 0.002 0.005 0.001 0.004 0.002 0.005 0.002 0.004 0.003 0.002 O.Ooo8 0.002 0.003 0.003
0.77 1.05 1.30 0.92 0.80 2.1 1.1 0.82 0.90 1.36 1.49 0.04 0.59 0.71 I
0.71 1.75 1
1.44 (0.001
1.94 (0.001 (0.001
0.03 2.1 c0.003
.... co.05
0.01 0.17 0.01 (0.03 0.003 0.14 0.003 0.13 0.003 0.17 0.003 0.18
(0.005 0.06 co.005 0.10 (0.005 0.07 (0.005 0.07 co.01 0.10
0.07 0.2
0.72
0.30 0.1
6
Errors
The specimens were weighed on a standard four-place balance with an accuracy of +0.0001 g. The specimens had surface areas of 12 to 14 cm2, so the uncertainty in weight corresponded to almost 0.01 mg/cm2. This error does not include small pieces of loose material that may have been adhering to the specimen or small amounts of oxide that may have been knocked off during disassembly. these sources of error, but they are likely still present.
Efforts were made to minimize
The stresses imposed on the tube burst specimens were affected by uncertainties in tube dimensions. was about 50,0127 mm (+0.0005 in.). was 0.254 mm (0.010 in.), this uncertainty introduced an error in the stress of +5%. uncertainty was about 52%.
The uncertainty in the wall thickness When the nominal wall thickness
When the wall thickness was 0.762 mm (0.030 in.), this
Experimental Observations
Weight gain results on all materials tested in steam are given in the Appendix.
Low-Alloy Ferritic Steels
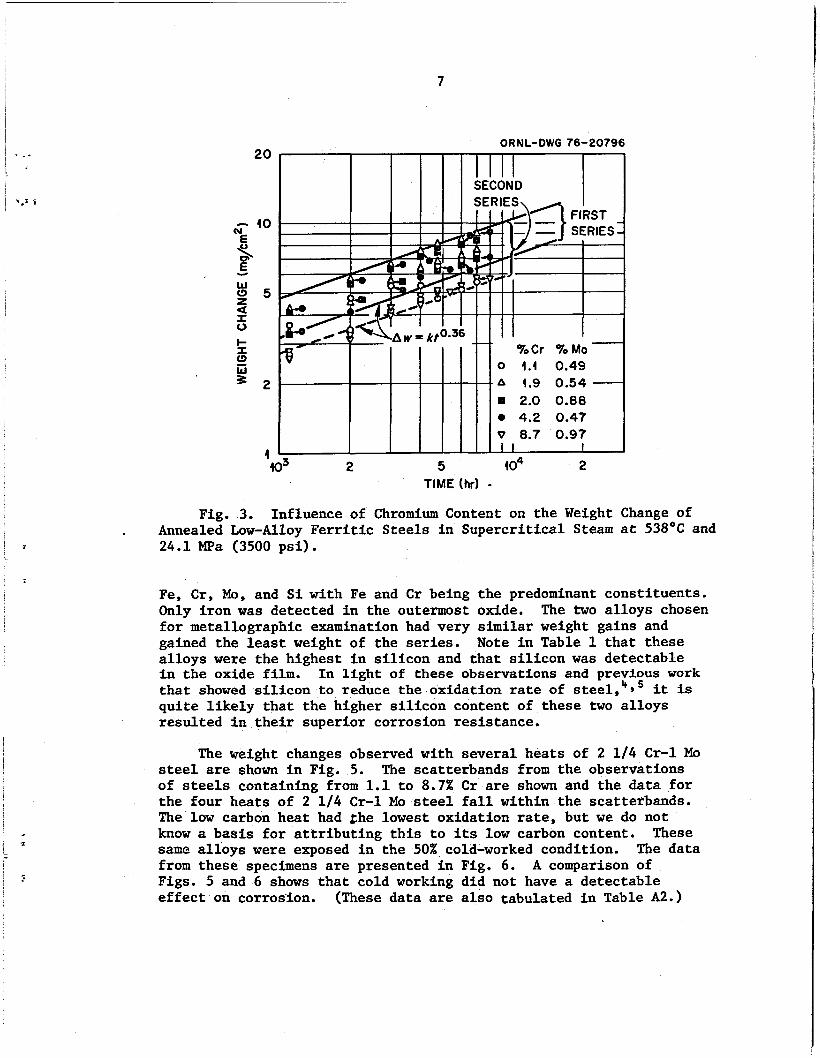
Five alloys containing from 1.1 to 8.7% Cr and 0.5 to 1.0% Mo (Table 1) were exposed to steam for 14,000 hr at 538°C and these results were presented previously* and are shown in Table Al. were lost during the one year in which the program was inactive, and it was necessary to begin testing with a new group of specimens. specimens were exposed 7000 hr, and the data for the second series are shown in Fig. 3 along with the scatterband for the first series. extremes of the scatterband for the first series were defined by alloys containing 1.1% Cr (lowest weight gain) and 1.9% Cr (highest weight grain). These same alloys are near the extremes for the second series, and the data from the two series generally agree very well.
These specimens
These
The
The behavior in air was vastly different from that noted in steam. 8.7% Cr had begun to spall, and after 13,000-hr exposure all alloys had lost weight.
After only 1000-hr exposure all alloys except the one containing
2
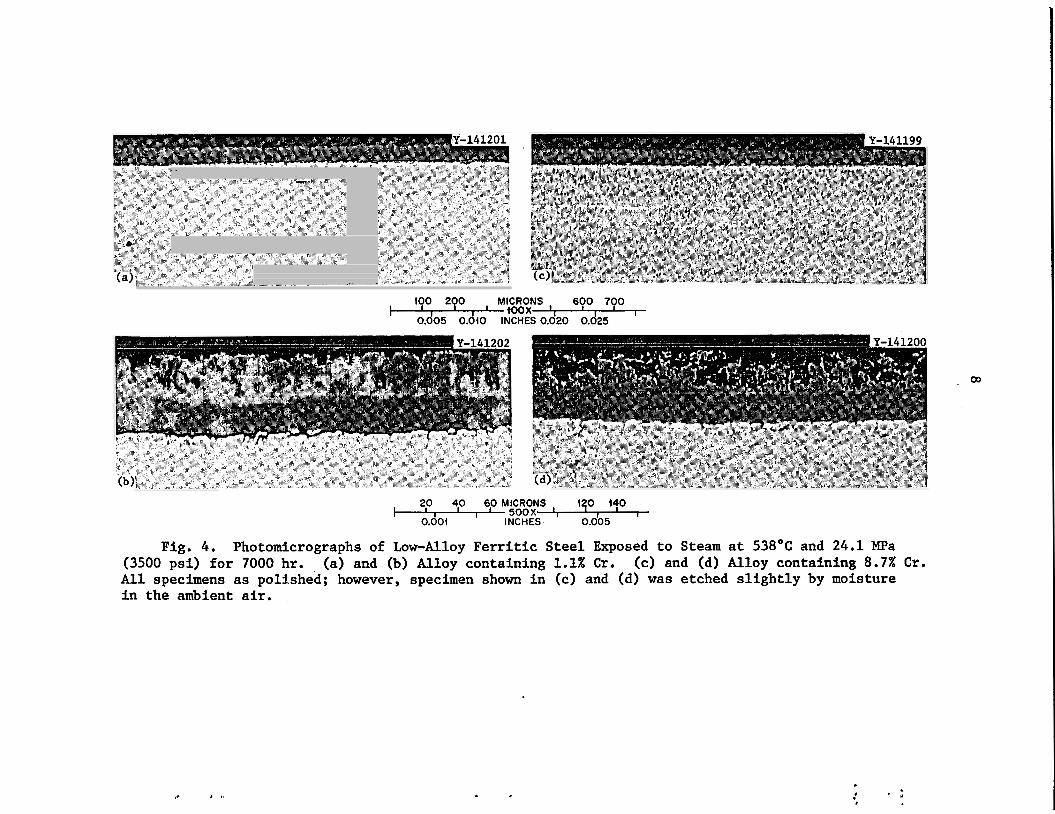
Two samples from the steam series were examined metallographically and typical photomicrographs are shown in Fig. 4. The microstructures of the specimen containing 1.1 and 8.7% Cr were quite similar. oxide, which consists of two distinct layers had a total thickness of about 50 pm. depth of about 10 pm. the oxide layer nearest the metal contained detectable quantities of
The
The microstructure of the metal surface was altered to a Microprobe scans of these specimens showed that
. ..
5 5 %
7
7
ORNL-DWG 76-20796 20
- 40 (u
$ CI
W
2
0 c I
- 5
1
0 4.4 0.49 A 4.9 0.54 H 2.0 0.88 0 4.2 0.47
2 g 2
1 403 2 5 2
TIME (hr) - Fig. 3. Influence of Chromium Content on the Weight Change of
. Annealed Low-Alloy F e r r i t i c Steels i n Supercr i t ica l Steam a t 538OC and 24.1 MPa (3500 ps i ) .
Fe, C r , Mo, and S i with Fe and C r being the predominant const i tuents . Only i ron was detected i n the outermost oxide. The two a l loys chosen f o r metallographic examination had very similar weight gains and gained the least weight of the series. Note i n Table 1 tha t these a l loys w e r e the highest i n s i l i c o n and tha t s i l i c o n w a s detectable i n the oxide film. t ha t showed s i l i c o n t o reduce the oxidation rate of it is qui te l i k e l y tha t the higher s i l i c o n content of these two a l loys resu l ted i n t h e i r superior corrosion resis tance.
In l i g h t of these observations and previous w o r k
The weight changes observed with several heats of 2 1/4 Cr -1 Mo steel are shown i n Fig. 5. of steels containing from 1.1 t o 8.7% C r are shown and the data f o r the four heats of 2 1 / 4 Cr-1 Mo steel f a l l within the scatterbands. The l o w carbon heat had $he lowest oxidation rate, but we do not know a bas i s f o r a t t r i b u t i n g t h i s t o i t s low carbon content. These same a l loys were exposed i n the 50% cold-worked condition. The data from these specimens are presented i n Fig. 6. Figs. 5 and 6 shows t ha t cold working did not have a detectable e f f e c t on corrosion. (These data are a l s o tabulated i n Table A2.)
The scatterbands from the observations
A comparison of
. .
... .
too 200 MICRONS 600 700
0.005 0.040 INCHES 0.620 0.d25 1- toox ' I
60 MICRONS 130 140
G i F - + I E E x S I t O.Ob5 I
Fig. 4. Photomicrographs of Low-Alloy Ferritic Steel Exposed to Steam at 538OC and 24.1 MPa (3500 p s i ) for 7000 hr. All specimens as polished; however, specimen shown in (c) and (d) was etched slightly by moisture in the ambient air.
(a) and (b) Alloy containing 1.1% Cr. ( c ) and (d) Alloy containing 8.7% Cr.
9
24.1 MPa (3500 psi).
QRNL-DWG 76-20798
J FIRST
5 to4 2 TIME (hr)
the Cold-Worked Condition Exposed to Steam at 538'C and 24.1 MPa (3500 psi). Fig. 6. Weight Changes of Several Heats of 2 1/4 Cr-1 Mo Steel in
10
Photomicrographs of three specimens of the 2 1/4 Cr-1 Mo steel are shown in Fig. 7. The three specimens examined were (1) standard alloy (heat 72768), annealed and air cooled, (2) standard alloy, cold worked 50%, and (3) normal carbon (NC) alloy, annealed and air cooled. The oxides on all three specimens were very similar to each other and to the alloys shown in Fig. 4. two layers and had an overall thickness of about 50 pm. underneath the oxide was affected to a depth of 10 pm or less. microprobe spectral analysis showed that the oxide on each specimen nearest the metal contained detectable quantities of Fe, Cr, Mo, and Si with Fe and Cr being the major constituent. The outermost oxide layer contained only iron in detectable concentrations.
The oxide consisted of The specimen
Electron
Hastelloy N
The weight changes of four heats of Hastelloy N exposed in steam are shown in Fig. 8. The variation among the four heats is about the same as the variation noted for duplication specimens of heat 5065. One of the heats, 2477, was vacuum melted, and the other three were air melted. The vacuum-melted heat was much lower in silicon and manganese than the air-melted heats, but this had no detectable effect on the corrosion rate in steam. After the first 4000-hr exposure, the weight change can be described by an equation of the form
where AW is the weight gain in mg/cm2, t is the time in hr, and K is a constant. The perturbation in rate after 15,000 hr is thought to be due to the condenser leaks in the plant and the attendant higher impurity levels in the steam. rate of corrosion decreased.
After the leaks were repaired, the
Some Hastelloy N specimens from heat 5065 were given various surface treatments before exposure to steam. Six samples were solution annealed. Two of these were tested in the as-rolled and solution- treated condition, two others were electropolished, and two were abraded with 400 grit paper before exposure. the weight changes were least for the electropolished material, inter- mediate for the as-rolled samples, and greatest for the abraded samples. a more complex way, the weight changes are qualitatively proportional to the "true" surface area.
Figure 9 shows that
Although the corrosion process may have been affected in
' .
... .
. . . . .
100 200 MICRONS 600 700
0.605 O h 0 INCHES 0.020 0.625 ' I 1oox 1,
Fig. 7. Photomicrographs of 2 1/4 Cr-1 Mo
60 MICRONS 150 140 I
0.005 I
Steel Exposed 7000 hr to Supercritical Steam at 538OC and 24.1 MPa (3500-psi). (c) and (d) Heat 72768, cold worked 50%. As polished.
(a) and (b) Heat 72768, annealed at 927OC and air cooled. (e) and (f) Heat NC annealed at 927OC and air cooled.
12
0.02
0.04
ORNL-DWG 1 3 - 4 1 4 0 R
0 ABRADED - 400 GRIT
~
0.1 T I I I I I I I I I I
TIME ( h r ) ro3 2 5 ro4 2
Fig. 8. Weight Changes of Several Heats of Annealed Hastelloy N Exposed to S u p e r c r i t i c a l Steam at 538OC and 24.1 MPa (3500 p s i ) .
0.5
0.2 5 \
w a
I 0
z 0.4 a
t- I 12 $ 0.05
ANNEALED '$+FkD 0 ELECTROPOLISHED
* AS ROLLED
ORNL-DWG 73-4135R
Fig. 9. Effect of Surface Finish on the Corro- sion of Hastelloy N (Heat 5065) in Steam at 538OC and 24.1MPa (3500 psi).
to3 2 5 to4 2 TIME ( h r )
~
, . . , .
13
One specimen was cold worked 50% and tested with an as-rolled surface. the annealed specimen with an as-rolled surface. Thus, cold working appears to have very little effect on the corrosion of Hastelloy N in steam. This is in agreement with the results of a prior study in which nickel-base alloys were noted to be less affected by cold working than high chromium steels.
The corrosion rate of this specimen was very near that of
6
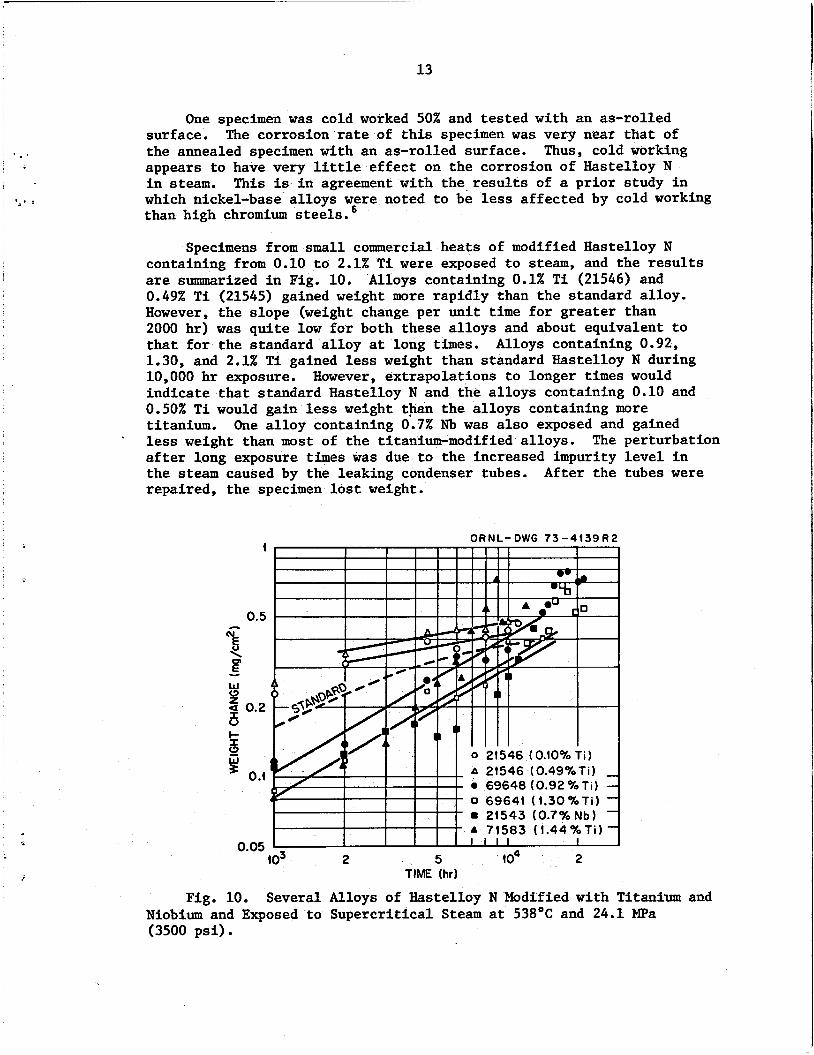
Specimens from small commercial heats of modified Hastelloy N containing from 0.10 to 2.1% Ti were exposed to steam, and the results are summarized in Fig. 10. 0.49% Ti (21545) gained weight more rapidly than the standard alloy. However, the slope (weight change per unit time for greater than 2000 hr) was quite low for both these alloys and about equivalent to that for the standard alloy at long times. 1.30, and 2.1% Ti gained less weight than standard Hastelloy N during 10,000 hr exposure. indicate that standard Hastelloy N and the alloys containing 0.10 and 0.50% Ti would gain less weight than the alloys containing more titanium. less weight than most of the titanium-modified alloys. after long exposure times was due to the increased impurity level in the steam caused by the leaking condenser tubes. repaired, the specimen lost weight.
Alloys containing 0.1% Ti (21546) and
Alloys containing 0.92,
However, extrapolations to longer times would
One alloy containing 0.7% Nb was also exposed and gained The perturbation
After the tubes were
ORNL- DWG 73 -41 39 R 2
0.5
% €!
2 2 0.2
!?
* 0.1
\
CI
W
0
(3 W
0.05 lo3 2 5 2
TIME (hr)
Fig. 10. Several Alloys of Hastelloy N Modified with Titanium and Niobium and Exposed to Supercritical Steam at 538OC and 24.1 MPa (3500 psi).
14
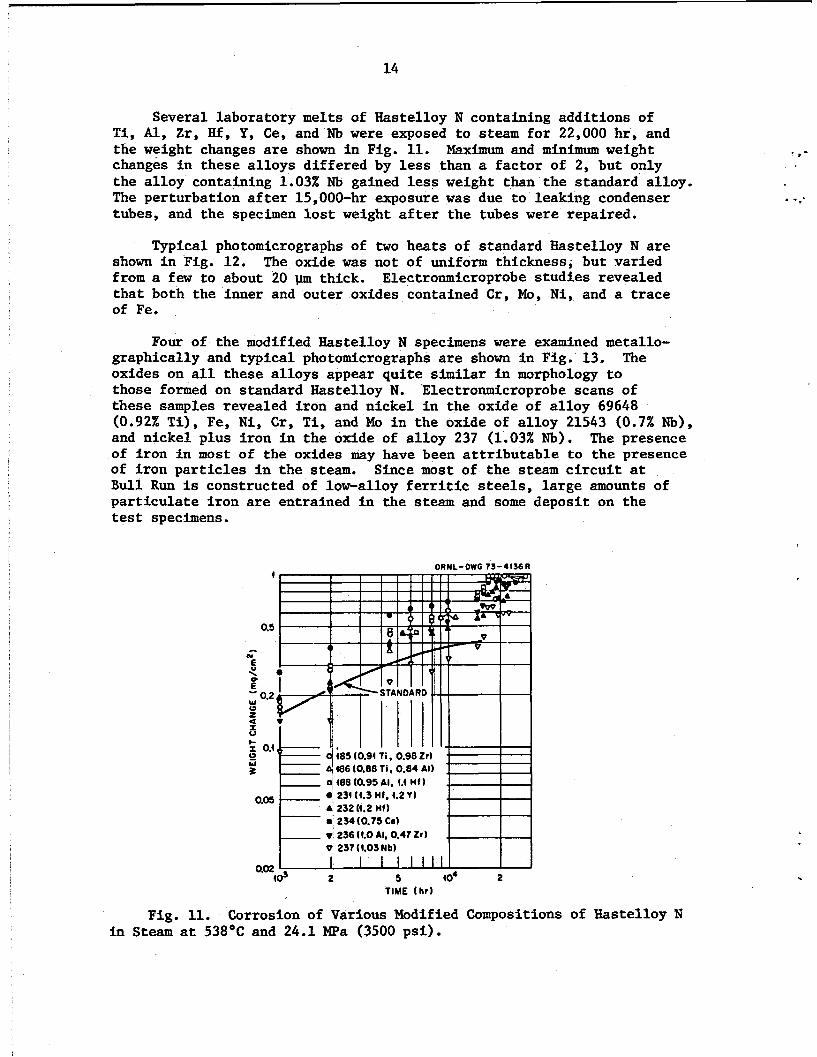
Several laboratory melts of Hastelloy N containing additions of
Maximum and minimum weight T i , Al, Z r , H f , Y, Ce, and Nb w e r e exposed t o steam f o r 22,000 hr, and the weight changes are shown i n Fig. 11. changes i n these a l loys differed by less than a fac tor of 2, but only the a l loy containing 1.03% Nb gained less weight than the standard alloy. The perturbation a f t e r 15,000-hr exposure w a s due t o leaking condenser tubes, and the specimen l o s t weight a f t e r the tubes w e r e repaired.
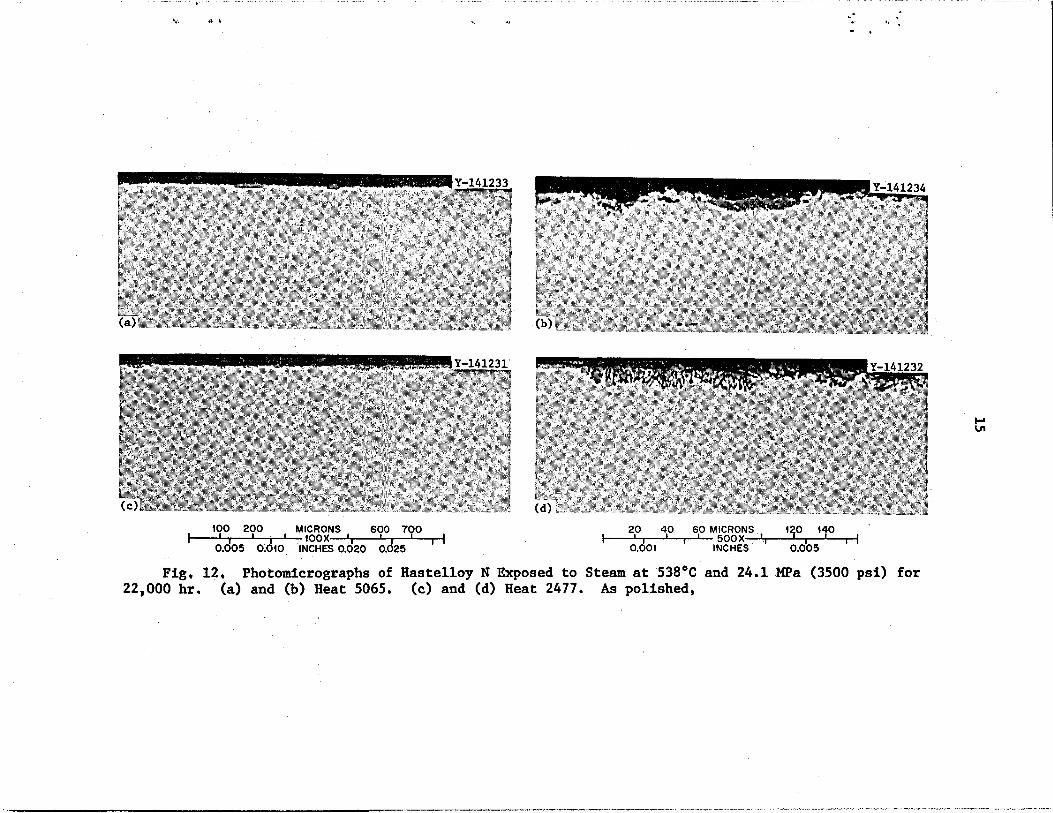
Typical photomicrographs of two heats of standard Hastelloy N are shown i n Fig. 12. The oxide was not of uniform thickness, but varied from a few t o about 20 thick. Electronmicroprobe s tudies revealed t h a t both the inner and outer oxides contained C r , Mo, N i , and a trace of Fe.
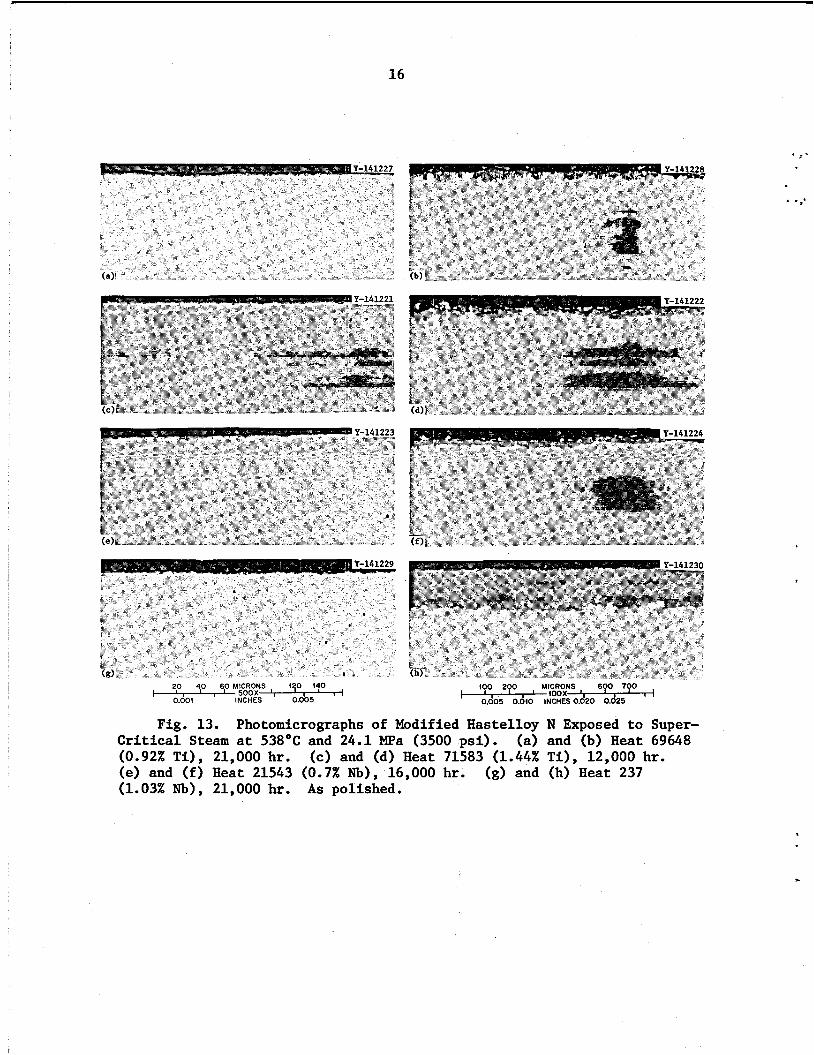
Four of the modified Hastelloy N specimens were examined metallo- graphically and typical photomicrographs are shown i n Fig. 13. The oxides on a l l these a l loys appear qu i te similar i n morphology t o those formed on standard Hastelloy N. Electronmicroprobe scans of these samples revealed i ron and nickel i n the oxide of a l loy 69648 (0.92% T i ) , Fe, N i , C r , T i , and Mo i n the oxide of a l loy 21543 (0.7% Nb) , and nickel plus i ron i n the oxide of a l loy 237 (1.03% Nb). The presence of i ron i n most of the oxides may have been a t t r i bu tab le t o the presence of i ron pa r t i c l e s i n the steam. Since most of t he steam c i r c u i t a t Bull Run is constructed of low-alloy f e r r i t i c steels, la rge amounts of par t icu la te i ron are entrained i n the steam and some deposit on the test specimens.
ORNL-DWG 73-4136R 4
0.5
1
N E Y P - 0.2 w (3 2 4 I 0 c I 0.f 0 s W
0.05
a 234 (0.75 C d w 236 (f.0 AI, 0.47 Zr) v 237(4.03Nb)
0.02 to3 2 5 404 2
TIME ( h r l
Fig. 11. Corrosion of Various Modified Compositions of Eastelloy N i n Steam a t 538OC and 24.1 MPa (3500 ps i ) .
-.- I .*-
.
"~ . . . . . " . . . . ... .....I. ..... ..-... - .- -
! e' . " j l
coo 200 MICRONS 600 700 60 MICRONS cgo 140 I I I ei?--+l::::s 'I 0.005
' foox.-] 0.005 0.640 INCHES 0.020 0.025
Fig, 12, Photomicrographs of Hastelloy N Exposed to Steam at 538OC and 24.1 MPa (3500 psi) for 22,000 hr. (a) and (b) Heat 5065. (c) and (d) Heat 2477. As polished,
16
. - -
(00 200 MICRONS 600 790 ' IOOX ' ' ' 0.605 0.dtO INCHES 0.620 0.625 I
. .*.
Fig. 13. Photomicrographs of Modified Hastelloy N Exposed to Super- Critical Steam at 538OC and 24.1 MPa (3500 psi). (0.92% Ti), 21,000 hr. (e) and (d) Heat 71583 (1.44% Ti), 12,000 hr. (e) and (f) Heat 21543 (0.7% Nb), 16,000 hr. (1.03% Nb), 21,000 hr. As polished.
(a) and (b) Heat 69648
(g) and (h) Heat 237
17
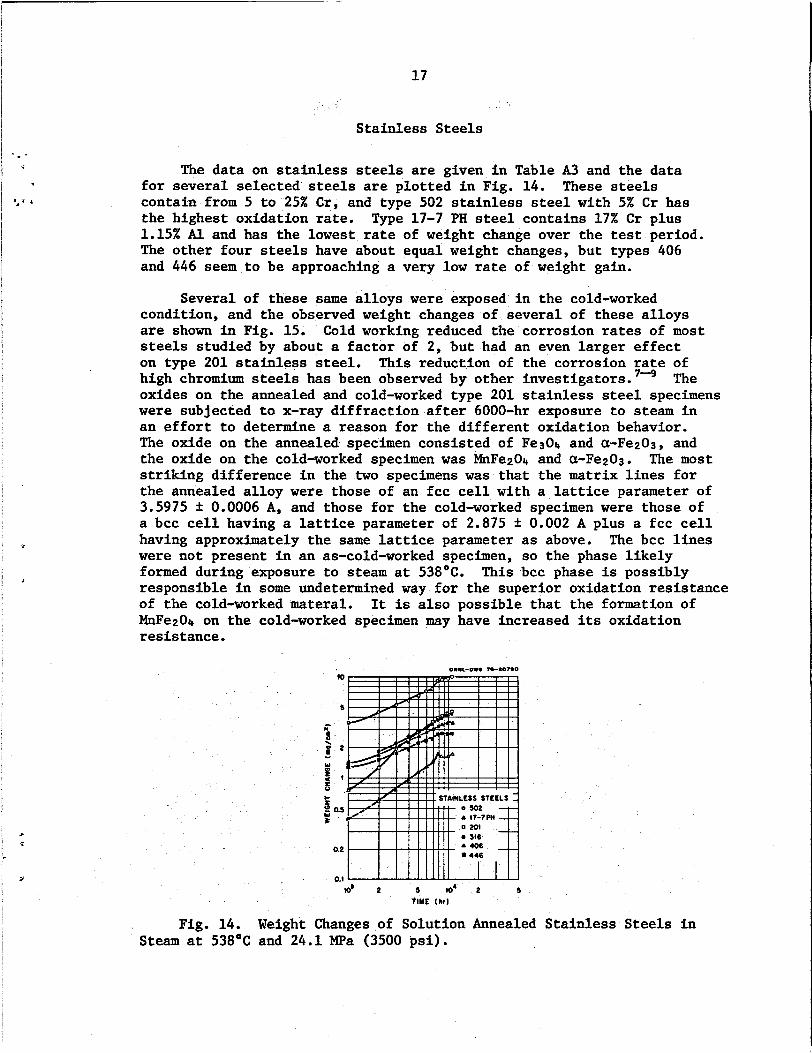
Stainless Steels
,
F
The data on stainless steels are given in Table A3 and the data for several selected steels are plotted in Fig. 14. contain from 5 to 25% Cr, and type 502 stainless steel with 5% Cr has the highest oxidation rate. Type 17-7 PH steel contains 17% Cr plus 1.15% AI. and has the lowest rate of weight change over the test period. The other four steels have about equal weight changes, but types 406 and 446 seem to be approaching a very low rate of weight gain.
These steels
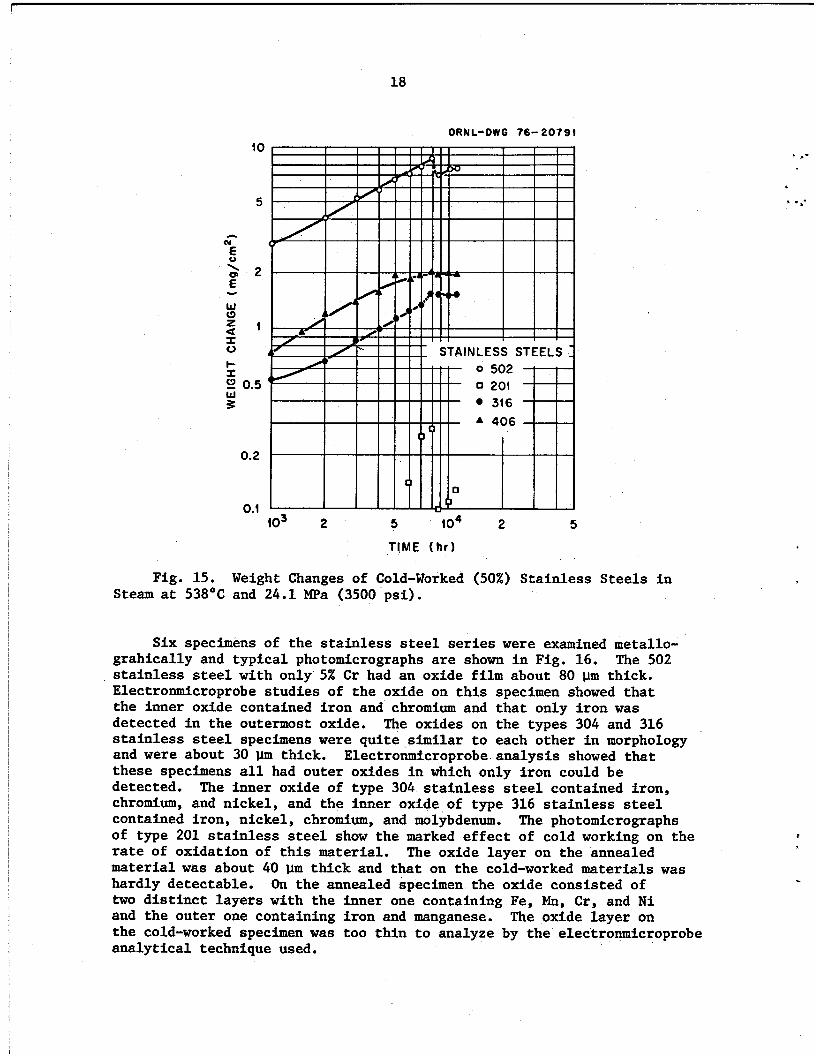
Several of these same alloys were exposed in the cold-worked condition, and the observed weight changes of several of these alloys are shown in Fig. 15. steels studied by about a factor of 2, but had an even larger effect on type 201 stainless steel. high chromium steels has been observed by other investigators. 74 The oxides on the annealed and cold-worked type 201 stainless steel specimens were subjected to x-ray diffraction after 6000-hr exposure to steam in an effort to determine a reason for the different oxidation behavior. The oxide on the annealed specimen consisted of Fe301, and cr-Fe203, and the oxide on the cold-worked specimen was MnFe201, and a-FezO3. The most striking difference in the two specimens was that the matrix lines for the annealed alloy were those of an fcc cell with a lattice parameter of 3.5975 f 0.0006 A, and those for the cold-worked specimen were those of a bcc cell having a lattice parameter of 2.875 k 0.002 A plus a fcc cell having approximately the same lattice parameter as above. The bcc lines were not present in an as-cold-worked specimen, so the phase likely formed during exposure to steam at 538OC. responsible in some undetermined way for the superior oxidation resistance of the cold-worked materal. MnFe201, on the cold-worked specimen may have increased its oxidation resistance.
Cold working reduced the corrosion rates of most
This reduction of the corrosion rate of
This bcc phase is possibly
It is also possible that the formation of
Oll*L-ouo m-?.OT.O
5
*^ 5 \ - t 2
!#(
V c !? 0.5 % W
a2
0.f m' 2 5 to4 2 5
TIME lhr l
Fig. 14. Weight Changes of Solution Annealed Stainless Steels in Steam at 538OC and 24.1 MPa (3500 psi).
18
ORNL-DWG 16- 2079f
10
5
A (u
E
E
V
2 2
a 2 1
Y
W (3
r 0 I- X
W '3 0.5 9
0.2
0.1
Fig. 15. Weight Changes of Cold-Worked (50%) Stainless Steels in Steam at 538OC and 24.1 MPa (3500 psi).
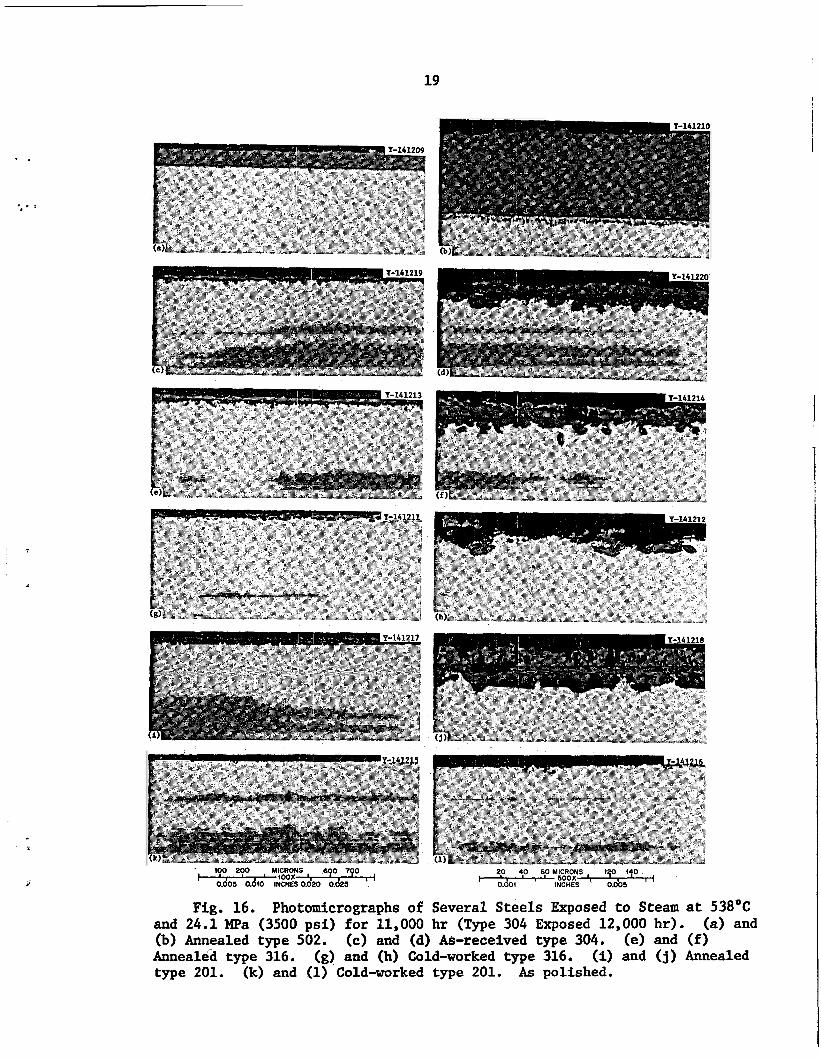
Six specimens of the stainless steel seriee were examined metallo- grahically and typical photomicrographs are shown in Fig. 16. stainless steel with only 5% Cr had an oxide film about 80 pm thick. Electronmicroprobe studies of the oxide on this specimen showed that the inner oxide contained iron and chromium and that only iron was detected in the outermost oxide. stainless steel specimens were quite similar t o each other in morphology and were about 30 Frm thick. these specimens all had outer oxides in which only iron could be detected. chromium, and nickel, and the inner oxide of type 316 stainless steel contained iron, nickel, chromium, and molybdenum. of type 201 stainless steel show the marked effect of cold working on the rate of oxidation of this material. material was about 40 vm thick and that on the cold-worked materials was hardly detectable. two distinct layers with the inner one containing Fe, Mn, Cr, and Ni and the outer one containing iron and manganese. The oxide layer on the cold-worked specimen was too thin to analyze by the electronmicroprobe analytical technique used.
The 502
The oxides on the types 304 and 316
Electronmicroprobe analysis showed that
The inner oxide of type 304 stainless steel contained iron,
The photomicrographs
The oxide layer on the annealed
On the annealed specimen the oxide consisted of
I
.
. .
.* . :
19
100 200 MICRONS
Fig. 16. Photomicrographs of Several Steels Exposed to Steam at 538OC and 24.i MPa (3500 psi) for 11,000 hr (Type 304 Exposed 12,000 hr). (b) Annealed type 502. Annealed type 316. type 201. (k) and (1) Cold-worked type 201. As polished.
(a) and (c) and (d) As-received type 304. (e) and (f)
(i) and (3) Annealed (g) and (h) Cold-worked type 316.
20
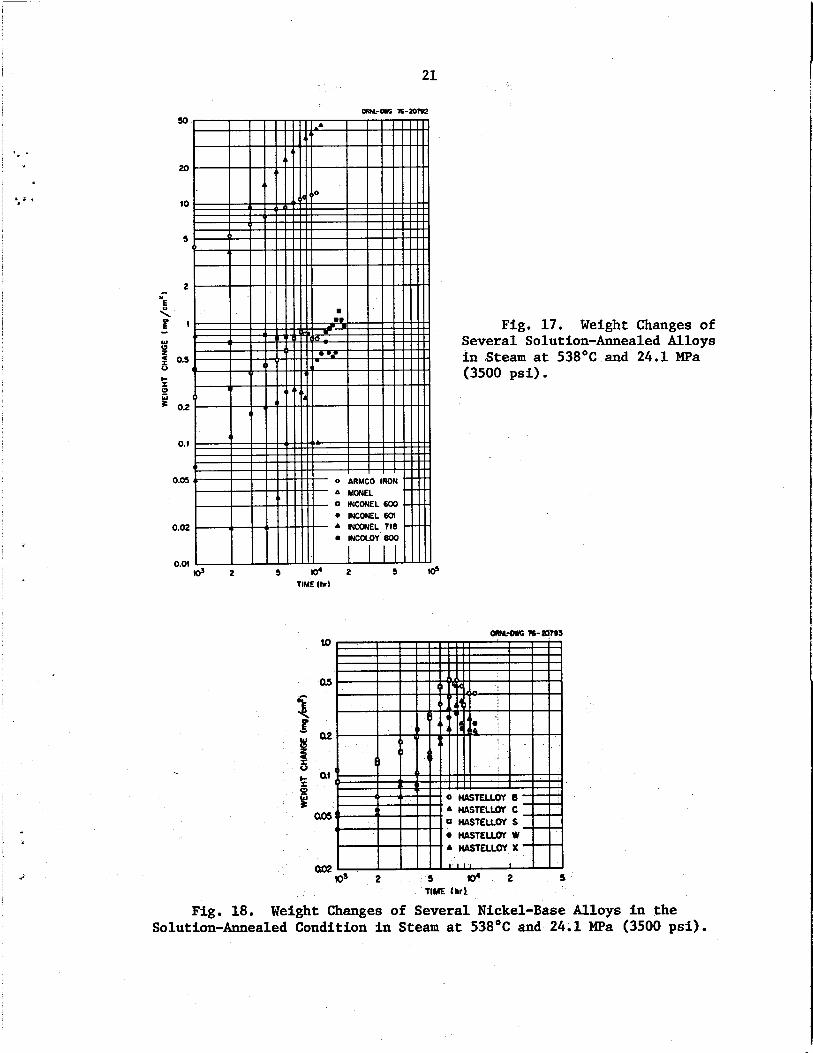
Other Alloys
Several other alloys were exposed to steam and their weight changes are shown in Figs. 17 through 20. In Fig. 17 the behavior of Armco iron, Monel, Incoloy 800, and several nickel-base alloys is shown. Monel and Armco iron gained weight at a very high rate whereas Inconel 718 gained weight at a very slow rate. Inconel 600 fell at an intermediate level of weight gain, and Inconel 601 fell at a lower level. gained weight at a relatively high rate for the first 2000 hr, but the rate rapidly decreased to where the rate was proportional to time to about the one tenth power.
Incoloy 800
The weight changes of several Hastelloys are shown in Fig. 18 and the data cover about one-half log cycle. These alloys contain from 0.2% Cr (Hastelloy B) to 22% Cr (Hastelloy X), but the differences in weight change are not simply inversely proportional to the chromium content.
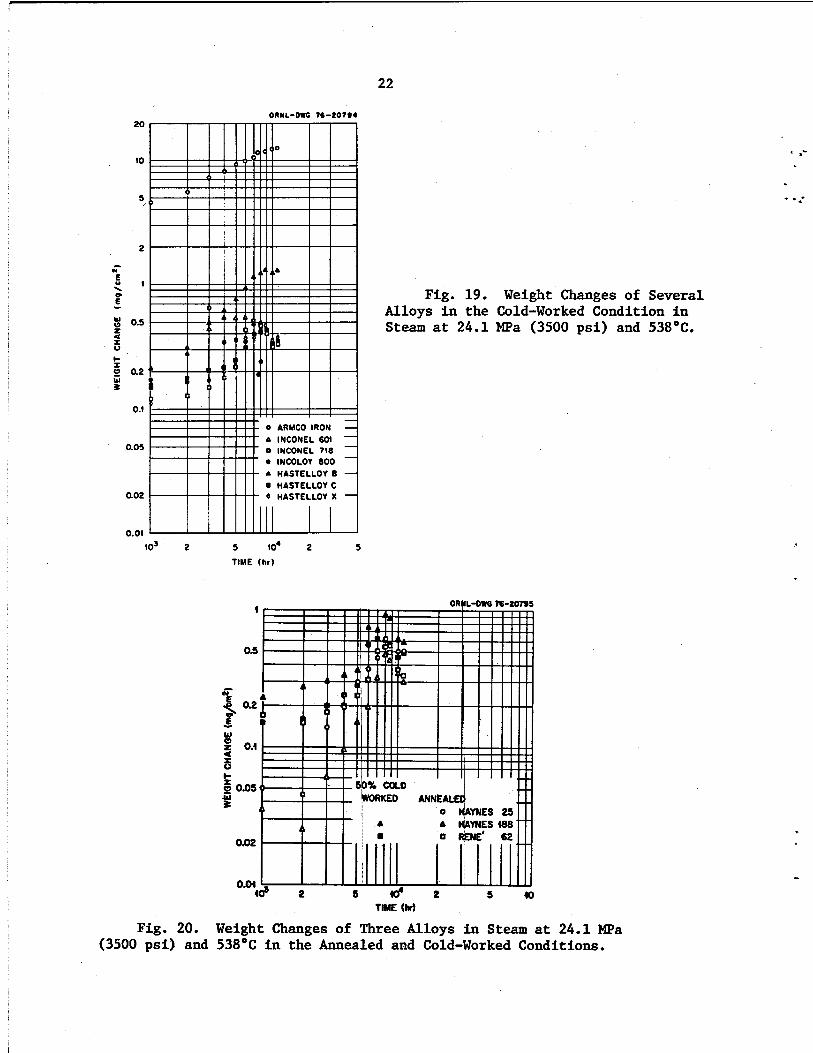
The weight changes of several alloys in the cold-worked condition are shown in Fig. 19. By comparison with the annealed data in Figs. 17 and 18, some assessment can be made of the effects of cold working. working caused Hastelloy B to gain weight at a faster rate and slightly reduced the weight gain of Incoloy 800. The weight gain of Inconel 718 appeared to be increased slightly by cold working, but the values are still so low that inaccuracies in weighing make this conclusion rather tenuous. The weight gained in the first 1000 hr was increased by cold working for several of the Hastelloys, but the rate slowed to where weight changes were about equivalent after a few thousand hours for annealed and cold-worked material.
Cold
The weight changes of three alloys in the annealed and cold-worked conditions are shown in Fig. 20. rapidly in the cold-worked condition than in the annealed condition, but the difference was quite small after 10,000-hr exposure. changes of all these alloys were quite low.
Haynes Alloy 188 gained weight more
The weight
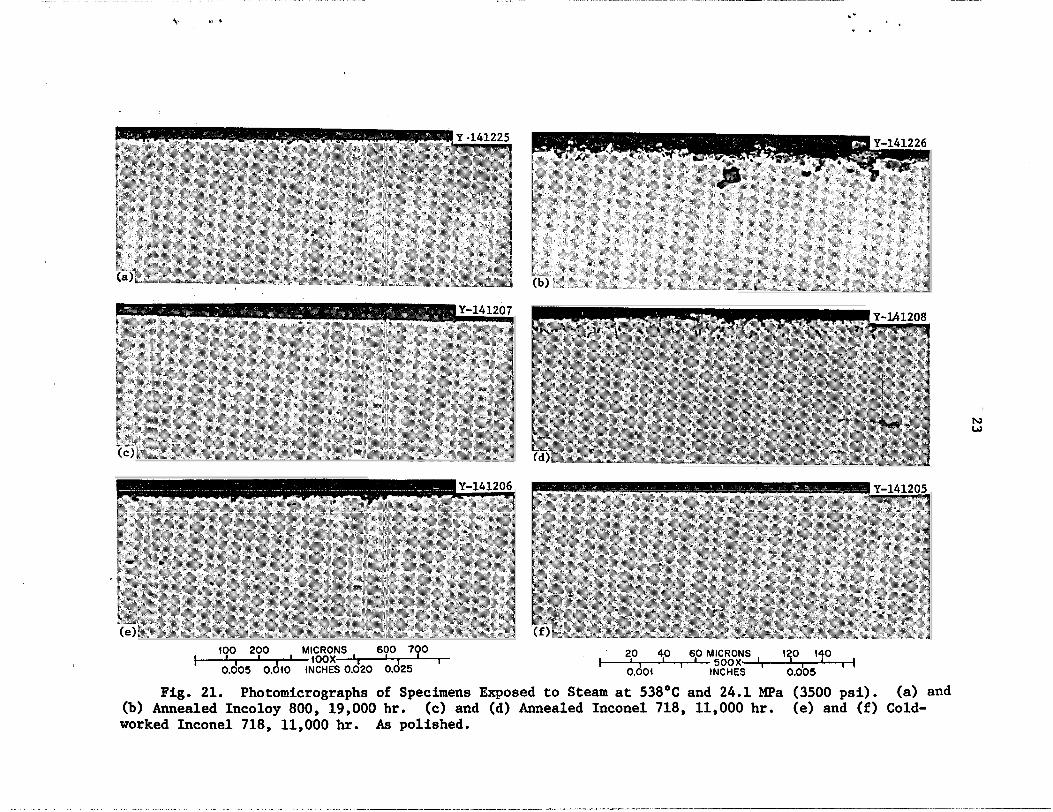
Three specimens from this series were examined metallographically and typical photomicrographs are shown in Fig. 21. very irregular oxide with the thickness in some areas as much as 10 pm. Examination by the electron microprobe showed that the inner oxide contained iron, nickel, and chromium, and that the outer oxide contained only iron in detectable quantities. with the observations of Tilborg and Linde. l o condition formed a subsurface reaction product to a depth of about 15 pm during exposure to steam, but this product was not present in the material cold worked prior to exposure. analyzed on the annealed specimen, but analysis of the oxide on the cold-worked specimen revealed the presence of iron, nickel, and chromium.
Incoloy 800 had a
This is in qualitative agreement Inconel 718 in the annealed
The oxide was too thin t o be
21
20
10
S
I-
P W
0.2
0.1
0.05
0.02
0.W
Fig. 17. Weight Changes of Several Solution-Annealed Alloys in Steam at 538OC and 24.1 MPa (3500 psi).
I w ' 2 5 TIME Lhr).
Fig. 18. Weight Changes of Several Nickel-Base Alloys in the Solution-Annealed Condition in Steam at 538'C and 24.1 MPa (3500 psi).
20
10
5,
2
0.5 z a 0
c I
u
r
0 0.2
s
0.1
0.05
0.02
0.01
22
O W L - D I G 76-20794
. *-
- .-
Fig. 19. Alloys in the Steam at 24.1
Weight Changes of Several Cold-Worked Condition in MPa (3500 psi) and 538OC.
10' 2 5 to4 2 5 TIME (hr)
1
0.5
N^ + Q2 - W W
I 0 c
W
2 0.4 a
6 0.05
B
0.02
OB4 I
Fig. 20. Weight Changes of Three Alloys in Steam at 24.1 MPa (3500 psi) and 538OC in the Annealed and Cold-Worked Conditions.
. . . . . . . . . . . . . . . . - ...... . - . ......... .- ri .
. I
I00 200 MICRONS 600 700
0.005 0.040 INCHES 0.620 0.d25 }- lOOX ' 1
40 60 MICRONS 130 140
O.Ob5 I
Fig. 21. Photomicrographs of Specimens Exposed to Steam at 538°C and 24.1 MPa (3500 psi). (a) and (b) Annealed Incoloy 800, 19,000 hr. worked Inconel 718, 11,000 hr. As polished.
(c) and (d) Annealed Inconel 718, 11,000 hr. (e) and ( f ) Cold-
24
80
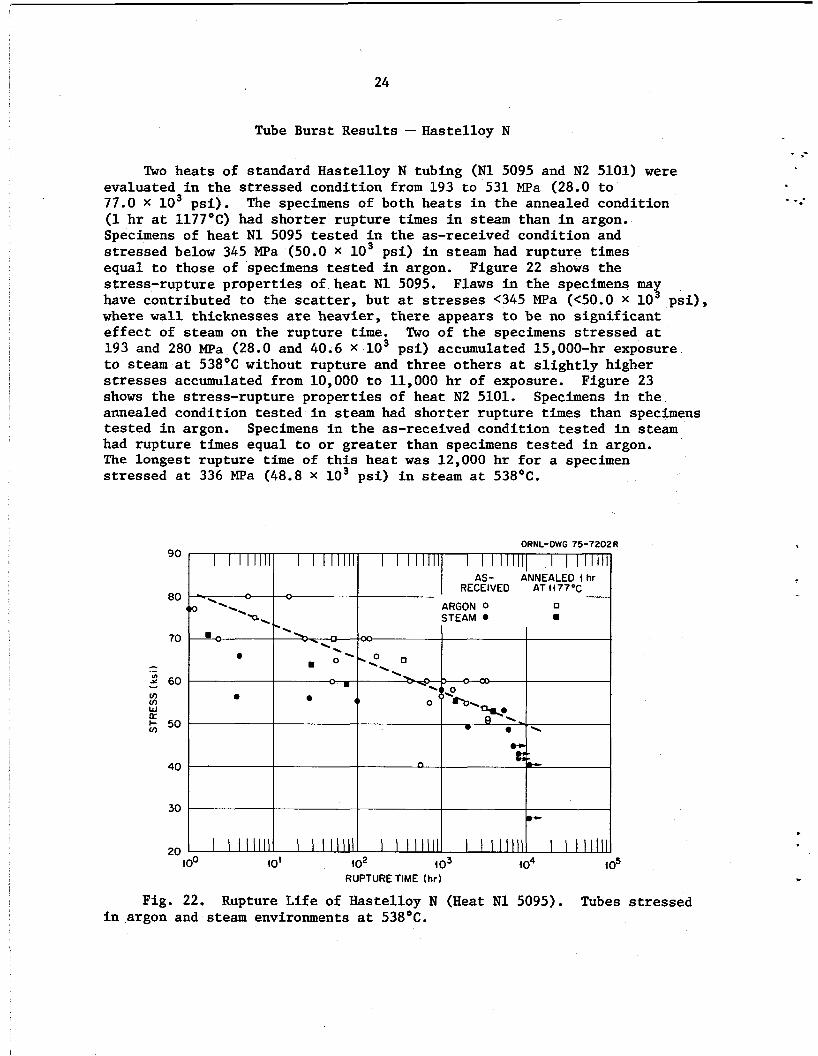
Tube Burst Results - Hastelloy N
I r AS- ANNEALED f hr
.. RECEIVED AT4477OC - (W ARGON 0 0 -\
--\\
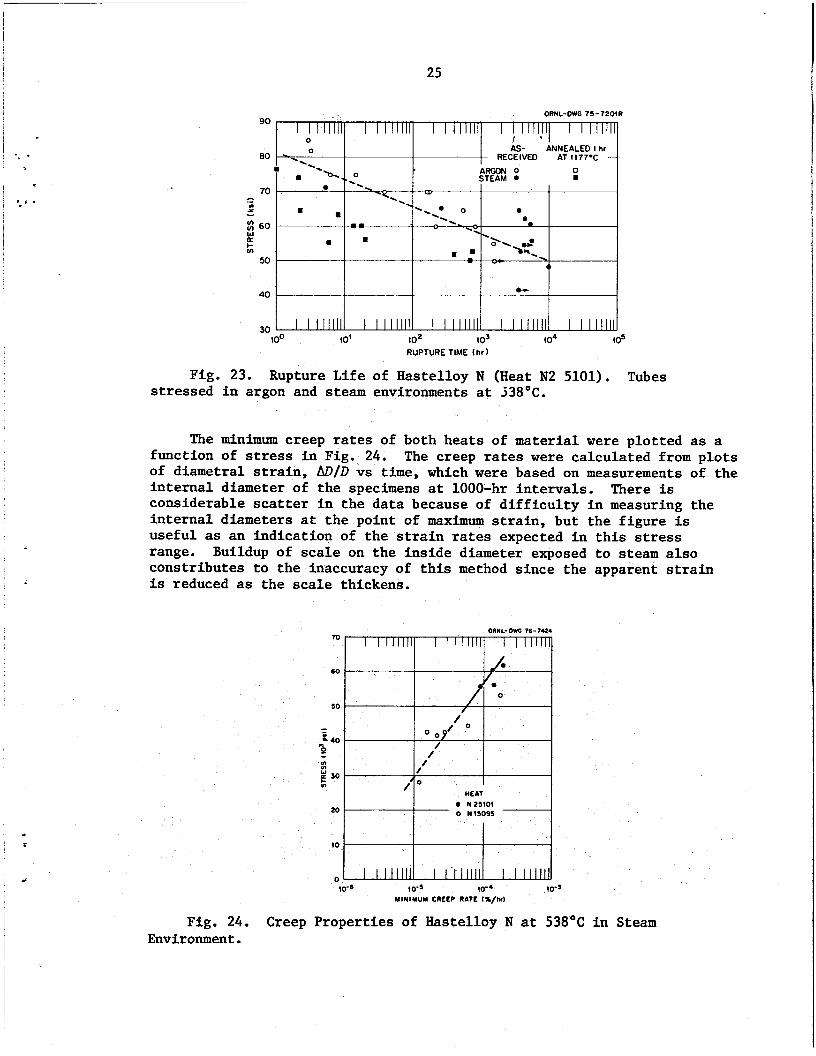
Two heats o f standard Hastelloy N tubing ( N 1 5095 and N2 5101) were evaluated i n t h e s t r e s sed condition from 193 t o 531 MPa (28.0 t o 77.0 X l o3 ps i ) . (1 h r a t 1177OC) had shor t e r rup ture t i m e s i n steam than i n argon. Specimens of hea t N 1 5095 t e s t e d i n t h e as-received condition and s t r e s sed below 345 MPa (50.0 X l o3 ps i ) i n steam had rupture t i m e s equal t o those of specimens t e s t e d i n argon. Figure 22 shows t h e s t ress - rupture proper t ies of hea t N 1 5095. Flaws i n t h e specimens may have contributed t o t h e scatter, but a t stresses <345 MPa (C50.0 X l o 3 p s i ) , where w a l l thicknesses are heavier, t h e r e appears t o be no s i g n i f i c a n t e f f e c t of steam on the rupture t i m e . Two of t h e specimens s t r e s sed a t 193 and 280 MPa (28.0 and 40.6 X l o 3 ps i ) accumulated 15,000-hr exposure t o steam a t 538OC without rupture and th ree o the r s a t s l i g h t l y higher stresses accumulated from 10,000 t o 11,000 h r of exposure. Figure 23 shows t h e s t ress - rupture proper t ies of heat N2 5101. annealed condition t e s t ed i n steam had shor t e r rup ture times than specimens t e s t ed i n argon. had rupture t i m e s equal t o o r g rea t e r than specimens t e s t e d i n argon. The longest rup ture t i m e of t h i s hea t w a s 12,000 h r f o r a specimen s t r e s sed at 336 MPa (48.8 x l o 3 ps i ) i n s t e a m a t 538OC.
The specimens of both hea t s i n t h e annealed condition
Specimens i n t h e
Specimens i n t h e as-received condition t e s t ed i n steam
30
20
*
I I IIII I I 1 1 1 1 1 I I I 1 1 1 1 1 I I I11111 I 1 I 1 1 1 1 1
RUPTURE TIME (hr)
Fig. 22. Rupture L i f e of Hastelloy N (Heat N 1 5095). Tubes s t r e s s e d i n argon and steam environments a t 538OC.
25
90
70
60
50
P
IIIIII I I iiilir 0 I '
AS- ANNEALED t hr =.O RECEtVED AT tt77OC -
m -. ARGON 0 0 m m ' a , O STEAM 0 0 -.--. - . -
u-% 0 0 -. 0 - - --.- m m 0
- ." m . -3. 02
m . _ _ h.\ - "-
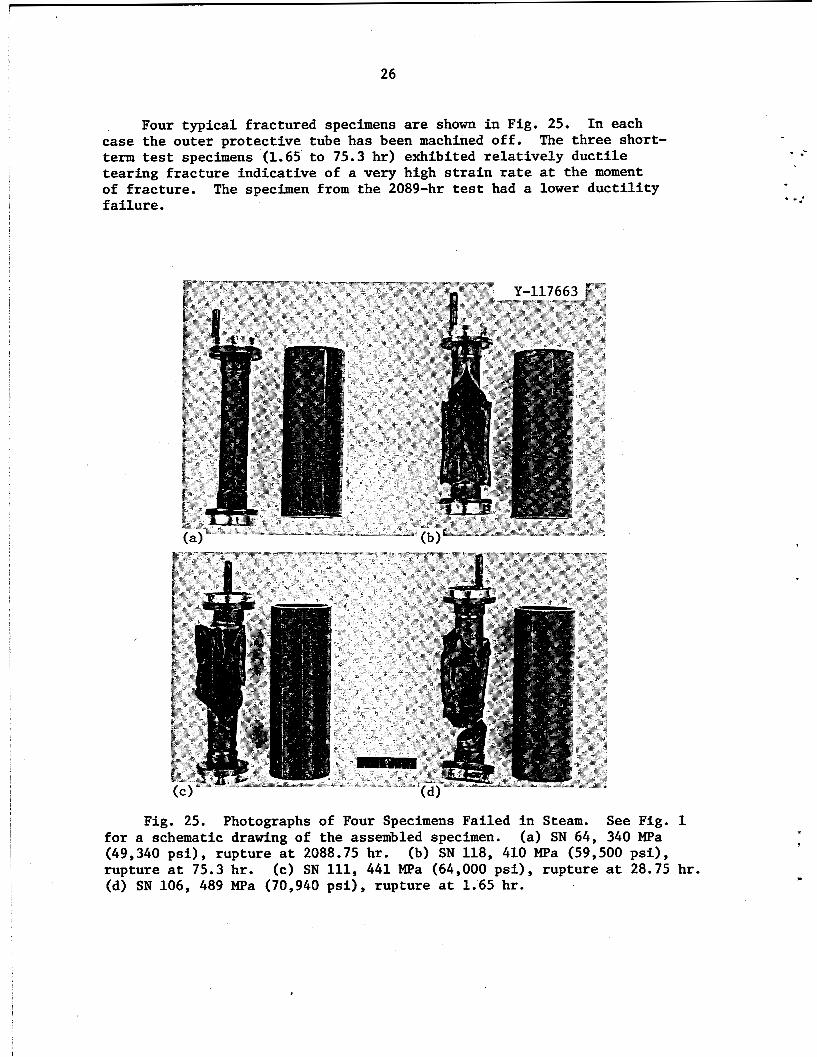
The minimum creep rates of both heats of material were plot ted as a function of stress i n Fig. 24. The creep rates w e r e calculated from p lo t s of diametral s t r a in , AD/D vs time, which w e r e based on measurements of the in t e rna l diameter of the specimens a t 1000-hr intervals . considerable scatter i n the data because of d i f f i c u l t y i n measuring the in t e rna l diameters a t the point of maximum s t r a in , but the f igure is useful as an indication of the s t r a i n rates expected i n t h i s stress range. constributes t o the inaccuracy of t h i s method s ince the apparent s t r a i n is reduced as the scale thickens.
There is
Buildup of scale on the ins ide diameter exposed t o steam a l so
0 N25IO1 0 N15095
to-3 io-. 10-1 MINIMUM CREEP RATE 1%/hrl
Fig. 24, Creep Properties of Hastelloy N a t 538OC i n Steam Environment.
26
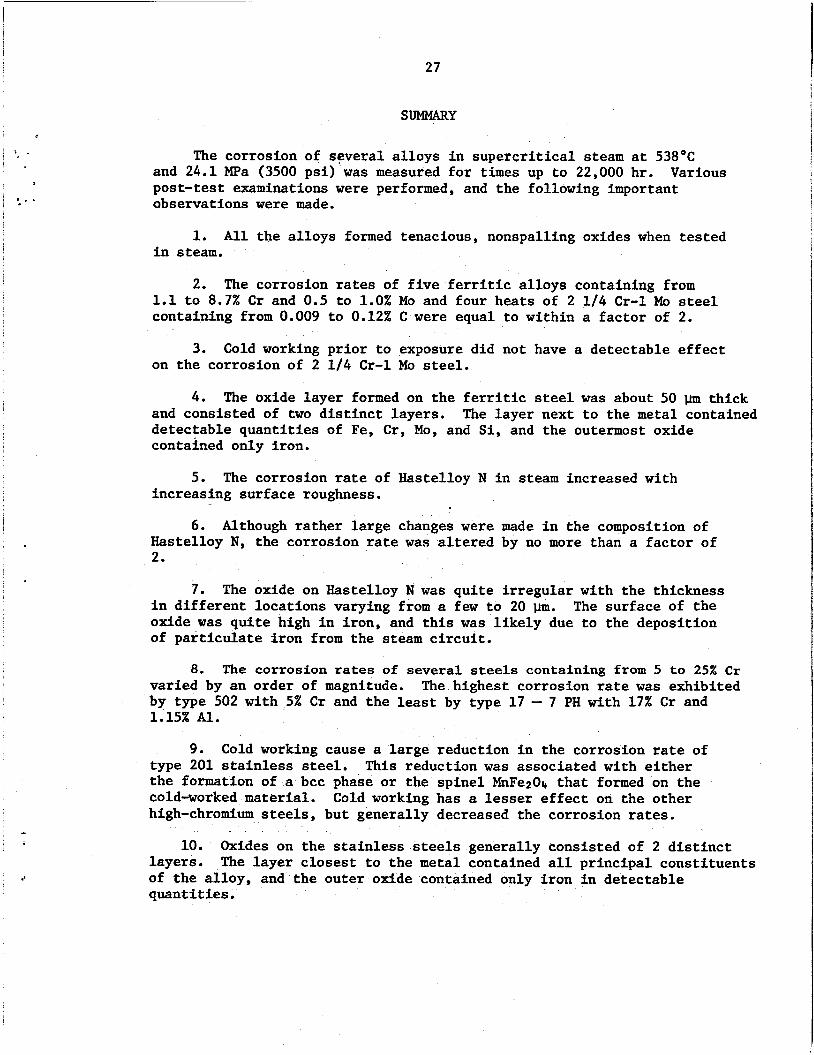
. Four t y p i c a l f rac tured specimens are shown i n Fig. 25. I n each case t h e ou te r p ro tec t ive tube has been machined o f f . term test specimens (1.65 t o 75.3 h r ) exhibited r e l a t i v e l y d u c t i l e t ea r ing f r a c t u r e ind ica t ive of a very high s t r a i n rate a t t h e moment of f r ac tu re . f a i l u r e .
The t h r e e short-
The specimen from t h e 2089-hr test had a lower d u c t i l i t y
Fig. 25. Photographs of Four Specimens Fa i led i n Steam. See Fig. 1 f o r a schematic drawing of t he assembled specimen. (a) SN 64, 340 MPa (49,340 p s i ) , rup ture a t 2088.75 hr. rup ture a t 75.3 hr. (d) SN 106, 489 MPa (70,940 p s i ) , rup ture a t 1.65 hr.
(b) SN 118, 410 MPa (59,500 p s i ) , (c) SN 111, 441 MPa (64,000 p s i ) , rup ture a t 28.75 hr.
.-
..*
J
27
SUMMARY
i . " . , I
c
The corrosion of several a l loys i n supercr i t ica l steam a t 538OC and 24.1 MPa (3500 ps i ) was measured fo r t i m e s up to 22,000 hr. post-test examinations were performed, and the following important observations were made.
Various
1. A l l the a l loys formed tenacious, nonspalling oxides when tes ted i n steam.
2. The corrosion rates of f i v e f e r r i t i c a l loys containing from 1.1 t o 8.7% C r and 0.5 t o 1.0% Mo and four heats of 2 1 / 4 C r - 1 Mo steel containing from 0.009 t o 0.12% C were equal t o within a fac tor of 2.
3. Cold working pr ior t o exposure did not have a detectable e f f ec t on the corrosion of 2 1 / 4 C r - 1 Mo steel.
4. The oxide layer formed on the f e r r i t i c steel was about 50 pm thick and consisted of two d i s t i n c t layers. detectable quant i t ies of Fe, C r , Mo, and S i , and the outermost oxide contained only iron.
The layer next t o the metal contained
5. The corrosion rate of Hastelloy N i n steam increased with increasing surface roughness.
6 . Hastelloy N, the corrosion rate w a s a l t e r ed by no more than a fac tor of 2.
Although ra ther large changes w e r e made i n the composition of
7. The oxide on Hastelloy N w a s qu i te i r regular with the thickness i n d i f fe ren t locat ions varying from a few t o 20 um. The surface of the oxide was qui te high i n iron, and t h i s was l i ke ly due t o the deposition of par t icu la te i ron from the steam c i r cu i t .
8. The corrosion rates of several steels containing from 5 to 25% C r The highest corrosion rate w a s exhibited varied by an order of magnitude.
by type 502 with 5% C r and the least by type 1 7 - 7 PH with 17% C r and 1.15% A l .
9 . Cold working cause a la rge reduction i n the corrosion rate of type 201 s t a in l e s s steel. the formation of a bcc phase or the sp ine l MnFe201, t ha t formed on the cold-worked material. high-chromium steels, but generally decreased the corrosion rates.
This reduction w a s associated with e i t h e r
Cold working has a lesser e f f ec t on the other
10. layers. of t he al loy, and the outer oxide contained only i ron i n detectable quant i t ies .
Oxides on the s t a in l e s s steels generally consisted of 2 d i s t i n c t The layer c loses t t o the metal contained a l l pr incipal const i tuents
28
11. Several iron- and nickel-base alloys were tested. Inconel 718 had the lowest weight gains, and Incoloy 800 had the lowest corrosion rate with a dependence on (time) '.
12. The inner oxide on Incoloy 800 contained iron, nickel, and chromium, and the outer oxide contained only iron in detectable quantities. The oxide on Inconel 718 contained iron, nickel, and chromium.
13. Inconel 718 in the annealed condition formed a subsurface reaction product to a depth of about 15 pm, but this product was not present in the cold-worked material.
14. Although some small difference existed in the behavior of annealed and cold-worked nickel-base alloys, the effects were reasonably small.
15. The stress-rupture properties of Hastelloy N were lower in steam than in argon at short rupture times, but were equivalent at long rupture times.
ACKNOWLEDGMENTS
The authors are indebted to TVA for allowing this test facility to be placed in the Bull Run Steam Plant. P. Wade, C. F. Dye, R. C. Bishop, and C. S. Voles of TVA were very helpful in the day-to-day operation of the facility. W. H. Farmer, the electron microprobe work was performed by R. S. Crouse, the drawings were prepared by the ORNL Graphic Arts Department, and the manuscript was prepared by J. L. Bishop of the Metals and Ceramics Division Reports Office. The authors are grateful to J. P. Hammond, J. C. Griess, and C. R. Brinkman for their technical review of the manuscript.
The metallography in this report was prepared by
REFERENCES
1. C. N. Spalaris et al., Materials for NucZear Superheater AppZications, GEAP-3875 (1962).
2. H. E. McCoy and B. McNabb, Corrosion of Several Iron- and NickeZ- Base AZZoys i n Supercriticat Steam a t 1000°F, ORNL/TM-4552 (1974).
3. Tennessee Valley Authority, The BUZZ Run Steam P k n t , TVA Technical Report 38, Knoxville, Tennessee, 1967.
4. W. E. Ruther, R. R. Schlueter, R. H. Lee, and R. K. Hart, "Corrosion Behavior of Steels and Nickel Alloys in Superheated Steam," Corros6m 22: 147 (1966).
29
5. Par L. Grall, "Les aciers inoxydables et les alliages a base de nickel Etude de leurs propri6ties de resistance a la corrosion dans la vepeur surchauffce, Bull. Inform. Sei. Tech. 139: 19 (1969).
6. S. Leistikow, H. V. Berg, and E. Pott, Long-The Corrosion Studies on Austen<tic C r - N i SteeZ and Nickel-Base Alloys in Superheated Steam (620 C, 1 ai%), with Special Attention to the Behuvior of Cold-Formed MateSaZs Smfaces, Report KFK-1301, Karlsruhe Nuclear Research Center (February 1971).
7. Societe d'Etudes, de Recherdhes et d'Applications pour I'Industrie, Brussels, Studies of Steel Corrosion i n High Temperature Water and Steam, Final Report. No. I, June 16, 19624ctober 31, 1965, Report EURAEC-1581 (1965).
8. W. E. Ruther and U. S . Greenberg, J. Electrochem. SOC. 111: 1116- 1121 (1964).
9. J. P. Hammond, P. Patriarca, G. M. Slaughter, and W. A. Maxwell, "Corrosion of Incoloy 800 and Nickel-Base Alloy Weldments in Steam," Weld. J . (MCiami) 52(6): 268-s-280-s (June 1973).
10. P. J. van Tilborg, and A. van der Linde, Corrosion of Inconel-625 Hasteltoy X280 and Incozoy-800 i n 550-750°C Superheated Steam, Report RCN-109, Reactor Centrum Nederland, Pettern, The Netherlands (October 1969).

APPENDIX
Collected Weight Change Data for Various Metals and Alloys Exposed to Supercritical Steam at 24.1 MPa (3500 p s i ) and 538OC

.
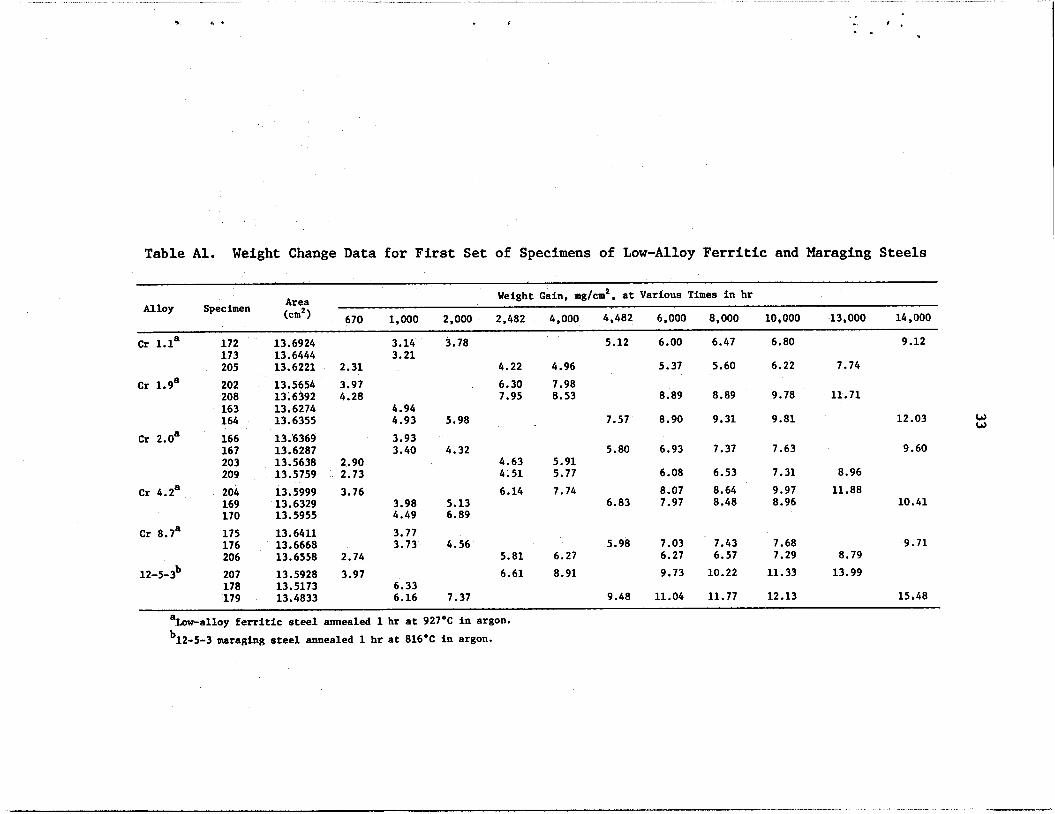
Table Al. Weight Change Data for First Set of Specimens of Low-Alloy Ferritic and Maraging Steels
Weight Gain, mg/cm2, at Various Times in hr Area
(Cm2) 670 1,000 2,000 2,482 4,000 4,482 6,000 8,000 10,000 13,000 14,000 Alloy Specimen
Cr 1.1~ 172 13.6924 3.14 3.78 5.12 6.00 6.47 6.80 9.12 173 13.6444 3.21 205 13.6221 2.31 4.22 4.96 5.37 5.60 6.22 7.74
Cr 1.9~ 202 13.5654 3.97 208 13.6392 4.28 163 13.6274 164 13.6355
4.94 4.93 5.98
6.30 7.98 7.95 8.53 8.89 8.89 9.78 11.71
7.57 8.90 9.31 9.81 w w 12.03
Cr 2.0~ 166 13.6369 3.93 167 13.6287 3.40 4.32 5.80 6.93 7.37 7.63 9.60 203 13.5638 2.90 4.63 5.91 209 13.5759 2.73 4.51 5.77 6.08 6.53 7.31 8.96
Cr 4.2a 204 13.5999 3.76 6.14 7.74 8.07 8.64 9.97 11.88 169 13.6329 3.98 5.13 6.83 7.97 8.48 8.96 10.41 170 13.5955 4.49 6.89
Cr 8.7a 175 13.6411 3.77 176 13.6668 3.73 4.56 5.98 7.03 7.43 7.68 9.71 206 13.6558 2.74 5.81 6.27 6.27 6.57 7.29 8.79
13.99 6.61 8.91 9.73 10.22 11.33 12-5-3b 207 13.5928 3.97 178 13.5173 6.33 179 13.4833 6.16 7.37 9.48 11.04 11.77 12.13 15~48
Low-alloy ferritic steel annealed 1 hr at 927OC In argon. a
b12-5-3 maraging steel annealed 1 hr at 816OC in argon.

34
- * -
Table A2. Weight Change Data for Second S e t of Specimens of Low-Alloy Ferritic and Maraging Steels
Weight Gain, mg/cm2, at Various Times in hr Area (cm2) 1100 2000 3000 4000 4700 6000 7000
Alloy Conditiona Specimen
u: LC u: Lc MC
MC MC NC NC NC NC
72768 72768 72768 72768 Cr 1.1 Cr 1.1 Cr 1.1 Cr 1.1 Cr 1.9 Cr 1.9 Cr 1.9 Cr 1.9 Cr 2.0 Cr 2.0 Cr 2.0 Cr 2.0 Cr 4.2 Cr 4.2 Cr 4.2 Cr 4.2 Cr 8.7 Cr 8.7 Cr 8.7 Cr 8.7
nc
12-5-3 12-5-3 12-5-3 12-5-3
A 481 A 482 B 483 B 484 A 489 A 490 B 491 B 492 A 485 A 486 B 487 B 488 A 517 A 518 B 519 B 520 A 493 A 494 B 495 B 496 A 497 A 498 B 499 B 500 A 501 A 502 B 503 B 504 A 505 A 506 B 507 B 508 A 509 A 510 B 511 B 512 A 513 A 514 C 515 C 516
13.9030 13.8512 13.9548 13.8130 13.6378 13.8373 13.9548 13.8650 13.7092 13.6301 13.5783 13.7993 13.6437 13.6165 13.6956 13.7200 11.0218 13.7718 13.4363 13.6437 13.7611 13.7337 13.8159 13.9780 13.7365 13.6573 13.7092 13c 7092 13.6845 13.6301 13.7337 13.5130 13.7092 13.5621 13.7092 13.7611 13.6546 13.7993 13.5016 13.6325
2.88 2.75 2.68 2.75 3.20 4.08 2.96 3.77 3.08 3.96 3.31 4.18 2.92 2.96 2.96 2.85 3.84 3.75 2.69 3.62 3.55 4.35 3.42 4.29 3.14 4.14 3.49 4.09
4.45 4.30 3.35 3.03 3.05 2.63 2.58 6.14 5.97 3.63 3.43
3.84
3.40 3.42 3.39 3.53 4.16 5.43 3.86 5.14 3.85 5.10 4.35 5.41
3.59 3.65 3.69 3.59 4.81 4.97 3.45 4.74 4.69 5.78 4.63 5.74 4.20 5.37 4.72 5.49 4.47 5.72 5.65 4.13 3.67 3.70 3.26 3.21 7.60 7.31 4.87 4.64
4.10 4.14 4.19 4.28 4.99 6.15 4.64 5.91 4.52 6.02 5.22 .6.15 4.52 4.52 4.64 4.61 5.63 5.56 4.11 5.39 5.55 6.60 5.57 6.58 4.99 6.20 5.63 6.37 5.61 6.58 6.49 5.30 4.14 4.17 4.15 4.04 9.40 9.26 6.65 6.39
4.88 4.84 4.86 4.98 5.73 7.00 5.35 6.82 5.18 6.88 5.99 6.93 5.07 5.10 5.28 5.20 6.33 6.24 4.67 5.39 6.25 7.38 6.31 7.48 5.56 6.91 6.22 7.15 6.26 7.34 7.36 5.97 4.79 4.82 4.73 4.61 10.7 10.5 7.86 7.66
4.98 4.99 5.04 5.14 5.91 7.46 5.50 7.34 5.30 7.22 6.17 7.40 5.32 5.37 5.54 5.45 6.47 6.70 4.79 6.47 6.41 7.78 6.49 8.00 5.70 7.37 6.34 7.59 6.64 7.75 7.83 6.37 5.08 5.12 5.05 4.91 11.3 11.1 8.39 8.18
5.34 5.35 5.45 5.60 6.37 8.35 5.96 7.90 5.70 7.21 6.67 7.88 5.56 5.60 5.80 5.70 6.92 7.17 5.15 6.90 6.88 8.32 6.99 8.59 6.07 7.89 6.74 8.10 6.85 8.18 8.47 6.70 5.41 5.45 5.33 5.18 12.0 11.8 9.04 8.80
5.72 5.73 5.82 6.03 6.85 9.01 6.39 8.38 6.12 7.41 7.17 8.23 5.90 5.95 6.16 6.08 6.58 6.90 5.51 7.34 7.33 8.70 7.52 8.96 6.40 7.94 7.25 8.43 7.15 8.48 8.93 7.10 5.65 5.72 5.70 5.55 12.7 12.5 9.79 9.56
aA = Cold worked, B = annealed 1 hr at 927OC in argon, and C = annealed 1 hr at 816'C in argon.
.
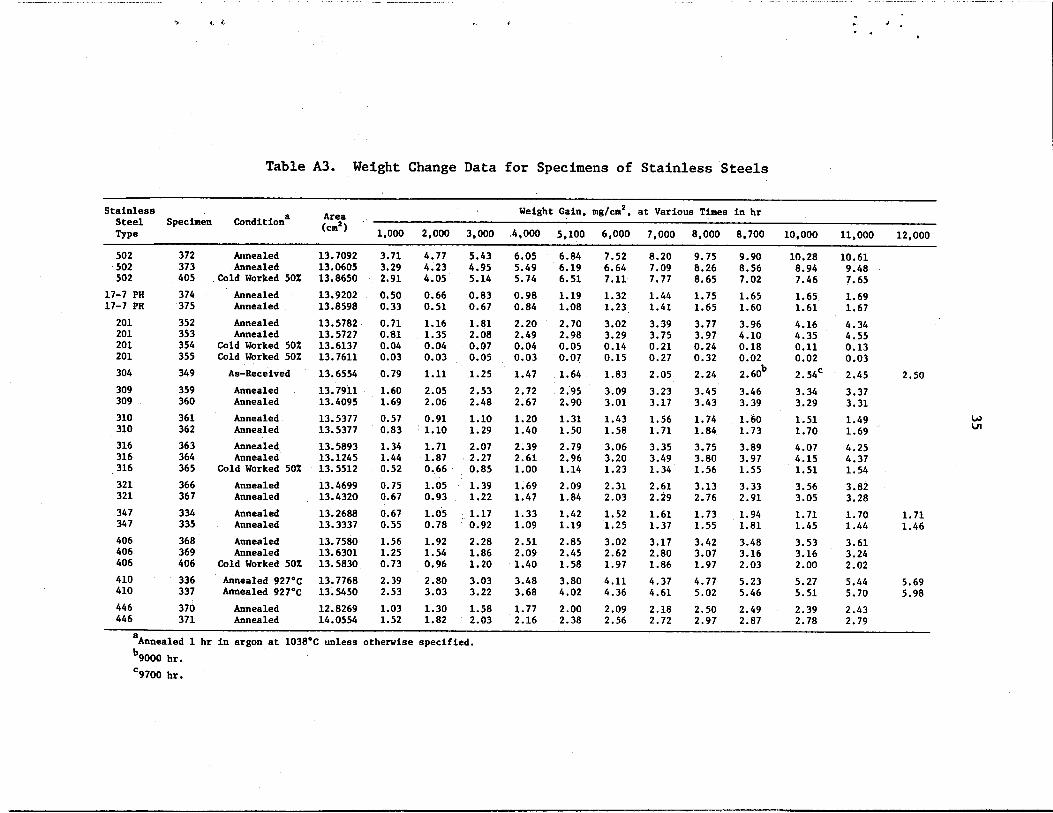
Table A3. Weight Change Data for Specimens of Stainless Steels
Weight Gain, mg/cm2. at Various Times in hr Area Stainless Steel Specimen Conditiona 5 P e (cm2) 1.000 2,000 3,000 ,4,000 5,100 6,000 7,000 8,000 8,700 10,000 11,000 12,000
502 502 502
17-7 PH 17-7 PH 201 201 201 201 304 309 309 310 310 316 316 316 321 321 347 347 406 406 406 410 410 446 446
372 373 405 374 375 352 353 354 355 34 9 359 360 361 362 363 364 365 366 367 334 335 368 369 406 336 337 370 371
Annealed Annealed
Cold Worked 50% Annealed Annealed Annealed Annealed
Cold Worked 50% Cold Worked 50% As-Received Annealed Annealed Annealed Annealed Annealed Annealed
Cold Worked 50% Annealed Annealed Annealed Annealed Annealed Annealed
Cold Worked 50% Annealed 927-C Annealed 927-c Annealed Annealed
13.7092 13.0605 13.8650 13.9202 13.8598 13.5782 13.5727 13.6137 13.7611 13.6554 13.7911 13.4095 13.5377 13.5377 13.5893 13.1245 13.5512 13.4699 13.4320 13.2688 13.3337 13.7580 13.6301 13.5830 13.7768 13.5450 12.8269 14.0554
3.71 4.77 5.43 6.05 6.84 7.52 8.20 9.75 9.90 10.28 10.61 8.94 9.48 3.29 4.23 4.95 5.49 6.19 6.64 7.09 8.26 8.56
2.91 4.05 5.14 5.74 6.51 7.11 7.77 8.65 7.02 7.46 7.65 1.65 1.69 0.50 0.66 0.83 0.98 1.19 1.32 1.44 1.75 1.65
0.33 0.51 0.67 0.84 1.08 1.23 1.41 1.65 1.60 1.61 1.67 0.71 1.16 1.81 2.20 2.70 3.02 3.39 3.73 3.96 4.16 4.34 0.81 1.35 2.08 2.49 2.98 3.29 3.75 3.97 4.10 4.35 4.55 0.04 0.04 0.07 0.04 0.05 0.14 0.21 0.24 0.18 0.11 0.13
0.02 0.03 0.03 0.03 0.05 0.03 0.07 0.15 0.27 0.32 0.02 0.79 1.11 1.25 1.47 1.64 1.83 2.05 2.24 2.60 2.54‘ 2.45 2.50 1.60 2.05 2.53 2.72 2.95 3.09 3.23 3.45 3.46 3.34 3.37
3.29 3.31 1.69 2.06 2.48 2.67 2.90 3.01 3.17 3.43 3.39 1.51 1.49 0.57 0.91 1.10 1.20 1.31 1.43 1.56 1.74 1.60 1.70 1.69 0.83 1.10 1.29 1.40 1.50 1.58 1.71 1.84 1.73
1.34 1.71 2.07 2.39 2.79 3.06 3.35 3.75 3.89 4.07 4.25 1.44 1.87 2.27 2.61 2.96 3.20 3.49 3.80 3.97 4.15 4.37
1.51 1.54 0.52 0.66 0.85 1.00 1.14 1.23 1.34 1.56 1.55 3.56 3.82 0.75 1.05 1.39 1.69 2.09 2.31 2.61 3.13 3.33 3.05 3.28 0.67 0.93 1.22 1.47 1.84 2.03 2.29 2.76 2.91
0.67 1.05 1.17 1.33 1.42 1.52 1.61 1.73 1.94 1.71 1.70 1.71 0.55 0.78 0.92 1.09 1.19 1.25 1.37 1.55 1.81 1.45 1.44 1.46 1.56 1.92 2.28 2.51 2.85 3.02 3.17 3.42 3.48 3.53 3.61
3.16 3.24 1.25 1.54 1.86 2.09 2.45 2.62 2.80 3.07 3.16 2.00 2.02 0.73 0.96 1.20 1.40 1.58 1.97 1.86 1.97 2.03
2.39 2.80 3.03 3.48 3.80 4.11 4.37 4.77 5.23 5.27 5.44 5.69 2.53 3.03 3.22 3.68 4.02 4.36 4.61 5.02 5.46 5.51 5.70 5.98 1.03 1.30 1.58 1.77 2.00 2.09 2.18 2.50 2.49 2.39 2.43 1.52 1.82 2.03 2.16 2.38 2.56 2.72 2.97 2.87 2.78 2.79
w cn
aAnnealed 1 hr in argon at 1038-C unless otherwise specified. b9000 hr. ‘9700 hr.
I
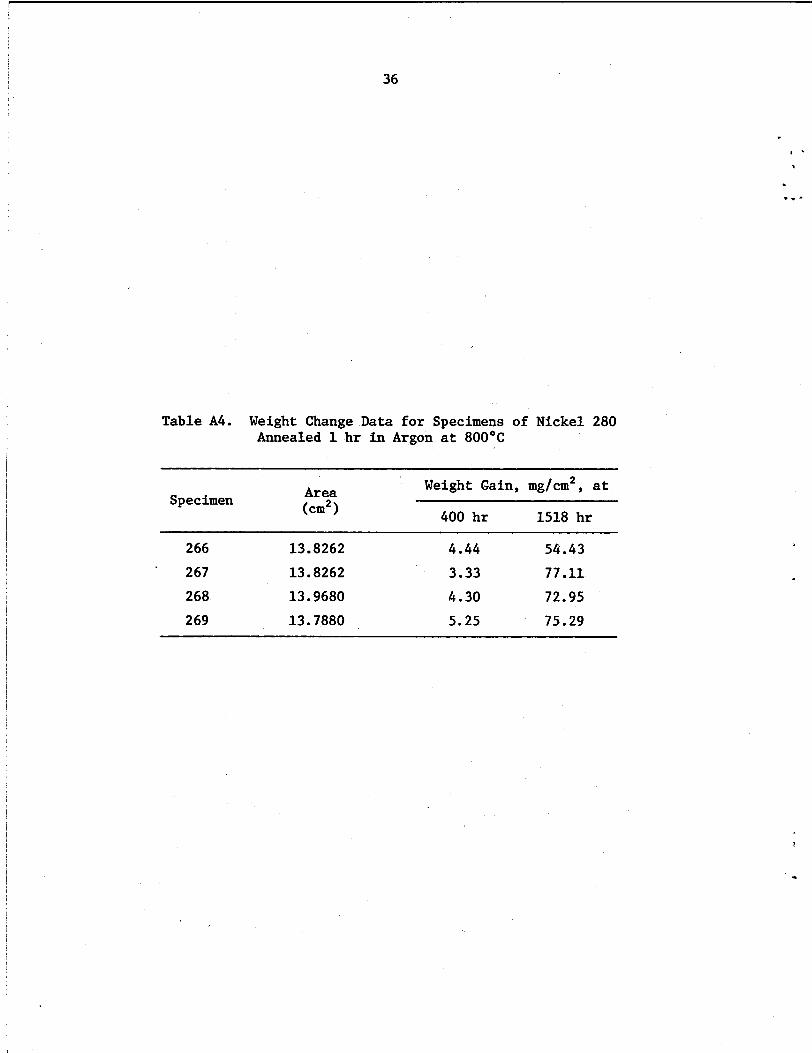
Table A4. Weight Change Data for Specimens of Nickel 280 Annealed 1 hr in Argon at 8OOOC
36
Specimen Area (em2 1
' Weight Gain, mg/cm2, at
400 hr 1518 hr
266 . 267
268 2 69
13.8262 13.8262 13.9680 13.7880
4.44 3.33 4.30 5.25
54.43 77.11 72.95 75.29
-.-
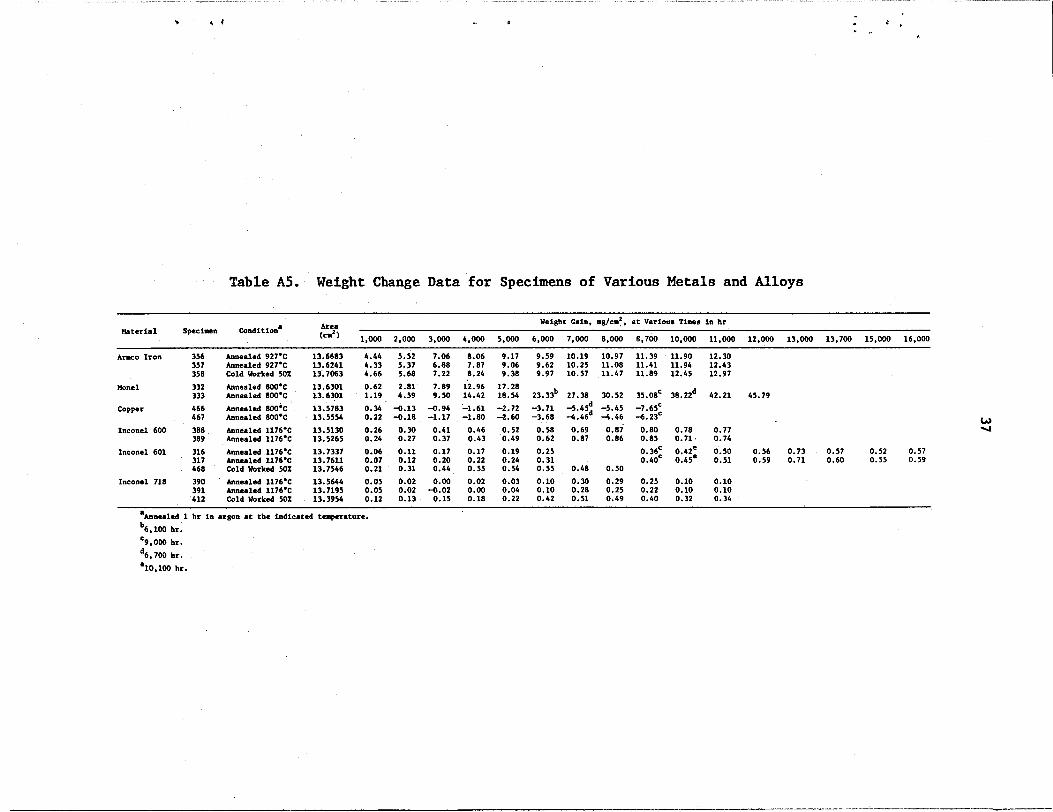
Table A5. Weight Change Data for Specimens of Various Metals and Alloys
Weight Gain. mglcmf. at Varioua Times in hr Area
(m') 1,OOO 2.000 3,000 4,000 5,000 6,000 7.000 8,000 8,700 10,000 11,000 12.000 13,000 13.700 15,000 16.000 Material Specimen Condition'
~~
AKO Iron 356 Annealed 927.C 13.6683 4.44 5.52 7.06 8.06 9.17 9.59 10.19 10.97 11.39 11.90 12.30 357 Annealed 927.C 13.6241 4.33 5.37 6.88 7.87 9.06 9.62 10.25 11.08 11.41 11.94 12.43 358 Cold Worked 50% 13.7063 b.66 5.68 7.22 8.24 9.38 9.97 10.57 11.47 11.89 12.45 12.97
none1 332 Annealed 800.C 13.6301 0.62 2.81 7.89 12.96 17.28 333 Annealed 800.C 13.6301 1.19 4.59 9.50 14.42 18.54 23.3P 27.38 30.52 35.08' 38.22' 42.21 45.79
Copper hb6 Annealed 800.C 13.5783 0.34 -0.13 -0.9b -1.61 -2.72 -3.71 -5.45d -5.45 -7.65' 467 Annealed 800.C 13.5554 0.22 -0.18 -1.17 -1.80 -2.60 -3.68 4.46' 4.46 4.23'
Inconel 600 388 Annealed 1176.C 13.5130 0.26 0.30 0.41 0.46 0.52 0.58 0.69 0.87 0.80 0.78 0.77 389 Annealed 1176.C 13.5265 0.24 0.27 0.37 0.43 0.49 0.62 0.87 0.86 0.85 0.71 0.74
Inconel 601 316 Annealed 1176% 13.7337 0.06 0.11 0.17 0.17 0.19 0.25 0.36' 0.42' 0.50 0.56 0.73 0.57 0.52 0.57 317 Annealed 1176% 13.7611 0.07 0.12 0.20 0.22 0.24 0.31 0.40' 0.45' 0.51 0.59 0.71 0.60 0.55 0.59 468 Cold Worked 50% 13.7546 0.21 0.31 0.44 0.55 0.54 0.55 0.48 0.50
Inconel 718 390 Annealed 1176.C 13.5644 0.05 0.02 0.00 0.02 0.03 0.10 0.30 0.29 0.25 0.10 0.10 391 Annealed 1176.C 13.7195 0.05 0.02 -0.02 0.00 0.04 0.10 0.28 0.25 0.22 0.10 0.10 412 Cold Worked 50% 13.3954 0.12 0.13 0.15 0.18 0.22 0.42 0.51 0.49 0.40 0.32 0.34
'Annealed 1 hr in arpn at the indicated temperature. b6,1M) hr. c9.000 hr.
d6,700 hr. elO.lOO hr.
w
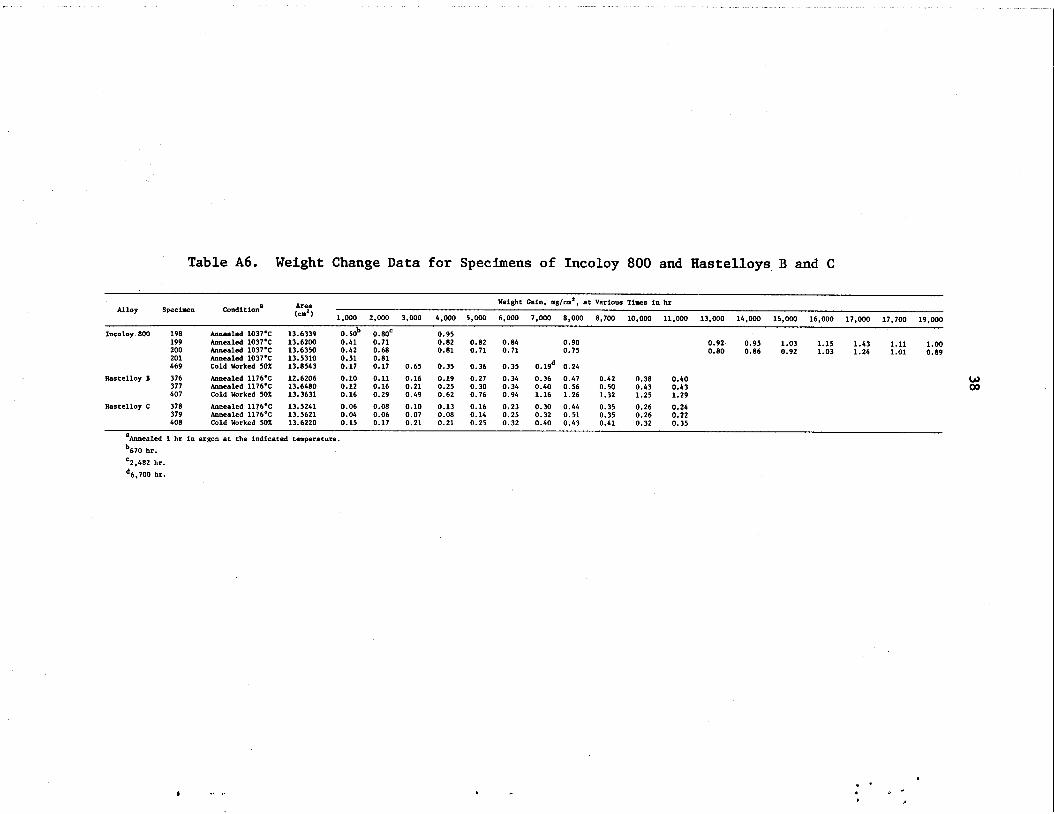
Table A6. Weight Change Data fo r Specimens of Incoloy 800 and Hastelloys B and C
~~~~~
Weight Gain, mg/cm', at Various Times in hr Area ('I0') 1,000 2,000 3,000 4.000 5,000 6.000 7.000 8,000 8,700 10.000 11.000 13.000 14,000 15.000 16.000 17,000 17,700 19,000
Alloy Specimen Conditiona
Ineolov 800 198 Annealed 1037% 13.6339 O.5Ob 0.80' 0.95 199 Annealed 1037.C 13.6200 0.41 0.71 0.82 0.82 0.84 0.90 200 Annealed 1037.C 13.6350 0.42 0.68 0.81 0.71 0.71 0.75 201 Annealed 1037.C 13.5310 0.51 0.81 469 Cold Worked 50% 13.8543 0.17 0.17 0.65 0.35 0.36 0.35 O.lgd 0.24
Ihstelloy I) 376 Annealed 1176.C 12.6206 0.10 0.11 0.16 0.19 0.27 0.34 0.36 0.47 0.42 0.38 0.40 377 Annealed 1176.C 13.6480 0.12 0.16 0.21 0.25 0.30 0.34 0.40 0.56 0.50 0.43 0.43 407 Cold Worked 50% 13.3631 0.16 0.29 0.49 0.62 0.76 0.94 1.16 1.26 1.32 1.25 1.29
0.92 0.95 1.03 1.15 1.43 1.11 1.00 0.80 0.86 0.92 1.03 1.24 1.01 0.89
Hastelloy C 378 Annealed 1176.C 13.5241 0.06 0.08 0.10 0.13 0.16 0.23 0.30 0.44 0.35 0.26 0.24 379 Annealed 1176-C 13.5621 0.04 0.06 0.07 0.08 0.14 0.25 0.32 0.51 0.35 0.26 0.22 408 Cold Worked 50% 13.6220 0.15 0.17 0.21 0.21 0.25 0.32 0.40 0.43 0.41 0.32 0.35
'Annealed 1 hr in argon at the indicated temperature. b670 hr. '2,482 hr. d6,700 hr.
4 .! ,.
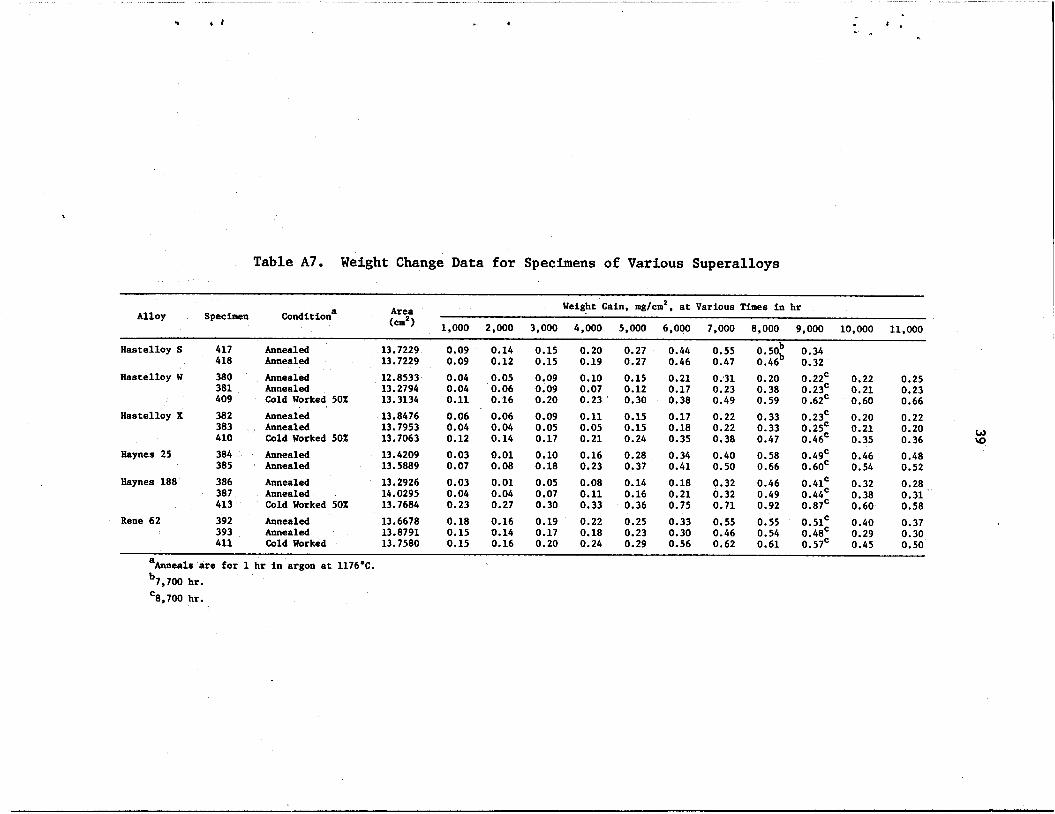
Table A7. Weight Change Data for Specimens of Various Superalloys
Weight Gain, mg/cm2. at Various Times in hr Area (cm2) 1,000 2,000 3.000 4,000 5.000 6,000 7,000 8,000 9,000 10,000 11,000
Alloy Specimen Conditiona
Hastelloy S 417 Annealed 13.7229 0.09 0.14 0.15 0.20 0.27 0.44 0.55 0.50b 0.34 418 Annealed 13.7229 0.09 0.12 0.15 0.19 0.27 0.46 0.47 0.46b 0.32
Hastelloy W 380 Annealed 12.8533 0.04 0.05 0.09 0.10 0.15 0.21 0.31 0.20 0.22' 0.22 0.25 381 Annealed 13.2794 0.04 0.06 0.09 0.07 0.12 0.17 0.23 0.38 0.23' 0.21 0.23 409 Cold Worked 50% 13.3134 0.11 0.16 0.20 0.23 0.30 0.38 0.49 0.59 0.62' 0.60 0.66
Hastelloy X 382 Annealed 13.8476 0.06 0.06 0.09 0.11 0.15 0.17 0.22 0.33 0.23' 0.20 0.22 383 Annealed 13.7953 0.04 0.04 0.05 0.05 0.15 0.18 0.22 0.33 0.25' 0.21 0.20
Haynes 25 384 Annealed 13.4209 0.03 0.01 0.10 0.16 0.28 0.34 0.40 0.58 0.49' 0.46 0.48 385 Annealed 13.5889 0.07 0.08 0.18 0.23 0.37 0.41 0.50 0.66 0.60' 0.54 0.52
Haynes 188 386 Annealed 13.2926 0.03 0.01 0.05 0.08 0.14 0.18 0.32 0.46 0.41' 0.32 0.28 387 Annealed 14.0295 0.04 0.04 0.07 0.11 0.16 0.21 0.32 0.49 0.44' 0.38 0.31 413 Cold Worked 50% 13.7684 0.23 0.27 0.30 0.33 0.36 0.75 0.71 0.92 0.87' 0.60 0.58
Rene 62 392 Annealed 13.6678 0.18 0.16 0.19 0.22 0.25 0.33 0.55 0.55 0.51' 0.40 0.37 393 Annealed 13.8791 0.15 0.14 0.17 0.18 0.23 0.30 0.46 0.54 0.48' 0.29 0.30 411 Cold Worked 13.7580 0.15 0.16 0.20 0.24 0.29 0.56 0.62 0.61 0.57' 0.45 0.50
w 410 Cold Worked 50% 13.7063 0.12 0.14 0.17 0.21 0.24 0.35 0.38 0.47 0.46' 0.35 0.36 \o
~~
a
b7,700 hr. '8,700 hr.
Anneals are for 1 hr in argon at 1176.C.
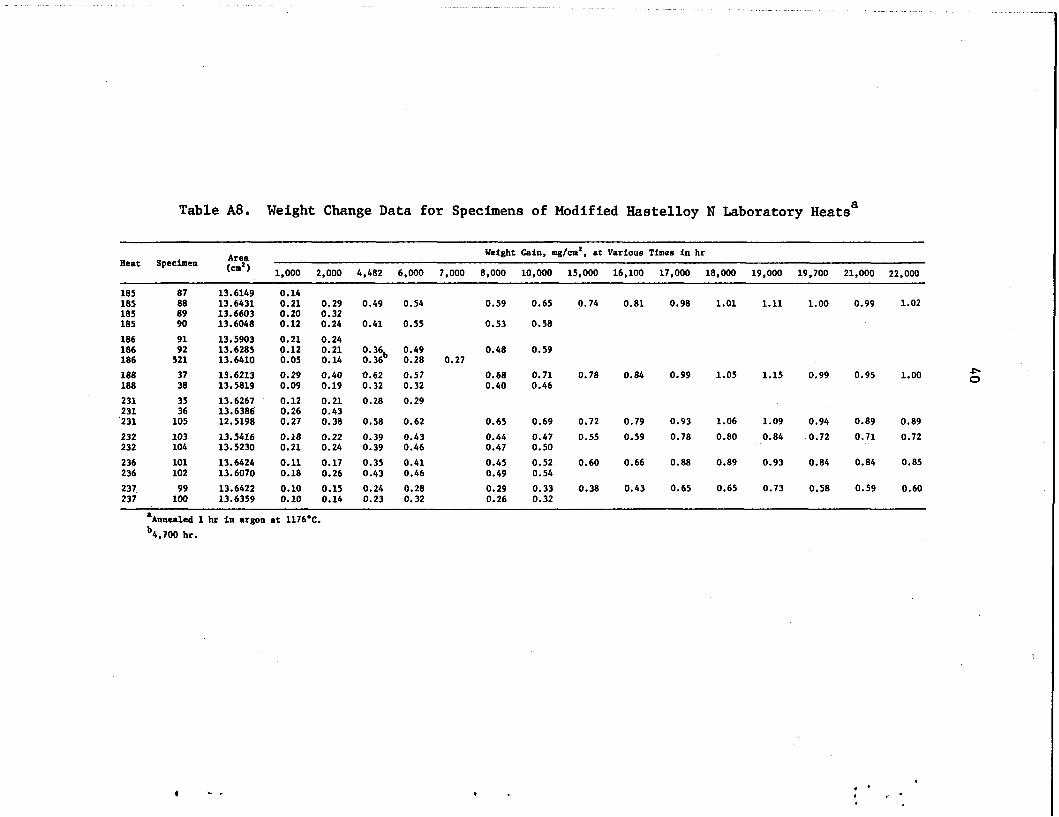
Table A8. Weight Change Data for Specimens of Modified Hastelloy N Laboratory Heatsa
Weight Gain, mg/cm2, at Various Times in hr neat Specimen Area
(cm2) 1,000 2.000 4.482 6.000 7,000 8,000 10,000 15,000 16,100 17,000 18.000 19.000 19,700 21,000 22.000
185 87 13.6149 0.14 185 88 13.6431 0.21 0.29 0.49 0.54 0.59 0.65 0.74 0.81 0.98 1.01 1.11 1.00 0.99 1.02 185 89 13.6603 0.20 0.32 185 90 13.6048 0.12 0.24 0.41 0.55 0.53 0.58 186 91 13.5903 0.21 0.24 186 92 13.6285 0.12 0.21 0.36 0.49 0.48 0.59 186 521 13.6410 0.05 0.14 O.3Sb 0.28 0.27 188 37 13.6213 0.29 0.40 0.62 0.57 0.68 0.71 0.78 0.84 0.99 1.05 1.15 0.99 0.95 1.00 188 38 13.5819 0.09 0.19 0.32 0.32 0.40 0.46 231 35 13.6267 0.12 0.21 0.28 0.29 231 36 13.6386 0.26 0.43 '231 105 12.5198 0.27 0.38 0.58 0.62 0.65 0.69 0.72 0.79 0.93 1.06 1.09 0.94 0.89 0.89 232 103 13.5416 0.18 0.22 0.39 0.43 0.44 0.47 0.55 0.59 0.78 0.80 0.84 0.72 0.71 0.72 232 104 13.5230 0.21 0.24 0.39 0.46 0.47 0.50 236 101 13.6424 0.11 0.17 0.35 0.41 0.45 0.52 0.60 0.66 0.88 0.89 0.93 0.84 0.84 0.85 236 102 13.6070 0.18 0.26 0.43 0.46 0.49 0.54 237 99 13.6422 0.10 0.15 0.24 0.28 0.29 0.33 0.38 0.43 0.65 0.65 0.73 0.58 0.59 0.60 237 100 13.6359 0.10 0.14 0.23 0.32 0.26 0.32
c. 0
aAmealed 1 hr in argon at 1176.C. b4,?00 hr.
*
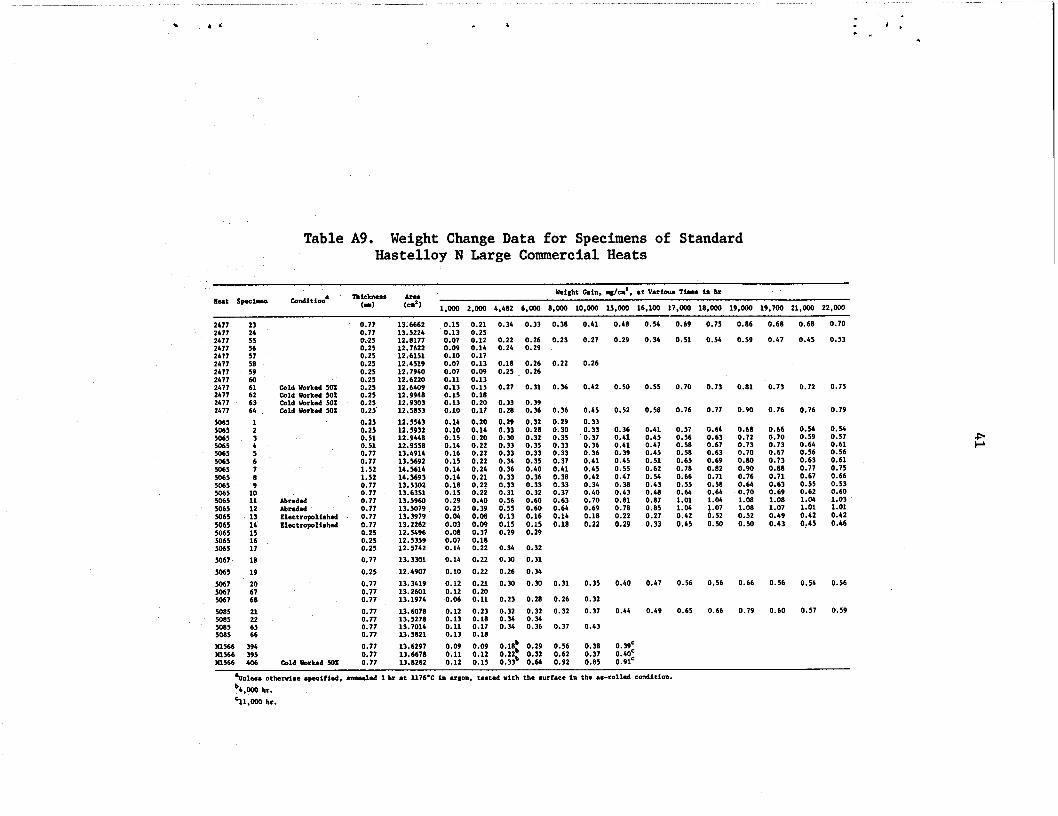
Table A9. Weight Change Data for Specimens of Standard Hastelloy N Large Commercial Heats
BeaL speciwn conditi.ma nlicknes* Are. weight oain. mgln’. l t various mu. in hr
(I) (cd) 1.W W-JO 4,462 6.W ho00 lO.OW lS.ooO 16.100 27.000 16.000 19.000 29.~~0 21,000 22,~~)
2477 2477 2477 2477 2477 2477 2477 1477 1477 2477 2477 2477 5065 5065 SO6S 506s 506s 506s 506s SO65 5065 SO65 5065 5065 506s 5065 506s 5065 sws 5067 506s 5067 SO67 5067 5065 500s soss 5015
1s 19 20
:: 21 22
:: 111566 394 111566 395 111566 406
23 24 5s 56 s7 S8 59 60 61
:: 64
: 3 4
:
: 9
10 11 12 13 14 15 16 17
cold "orbed so7i cold worked 50% Cold IbLed 50% cold worked 50%
Ahxded Abraded Eleelropolishrd Elactropolishcd
0.77 0.77 0.25 0.2s 0.25 0.25 0.25 0.25 0.25 0.25 0.25 0.25' 0.2s 0.25 0.51 0.51 0.77 0.77 1.S 1.52 0.77 0.77 0.77 0.77 0.77 0.11 0.25 0.25 0.25 0.77 0.25 0.77 0.77 0.77 0.77 0.77 0.77 0.77 0.77 0.77
Cold Worked 50% 0.77
13.6662 0.15 0.21 13.5224 0.13 0.25 12.8177 0.07 0.12 12.7622 0.09 0.14 12.6151 0.10 0.17 12.4519 0.07 0.13 12.7940 0.07 0.09 12.6220 0.11 0.13 12.6409 0.13 0.1s 12.9946 0.15 0.16 12.9303 0.13 0.20 12.SSS3 0.10 0.17 12.5543 12.5932 12.944s 12.9558 13.4914 13.5692 14.5614 14.5693 13.5302 13.63Sl 13.5960 13.5079 13.3979 13.2262 12.5496 12.5359 12.5742 13.3301 12.4907 13.3419 13.2601 13.1974 13.6076 13.5276 13.7014 13.5S21 13.6297 13.6676 13.S262
0.14 0.20 0.10 0.14 0.15 0.20 0.14 0.22 0.16 0.22 0.15 0.22 0.14 0.24 0.14 0.21 0.16 0.22 0.15 0.22 0.29 0.40 0.2s 0.39 0.04 0.08 0.03 0.09 0.08 0.37 0.07 0.1s 0.14 0.22 0.14 0.22 0.10 0.22 0.12 0.21 0.12 0.20 0.06 0.11 0.12 0.23 0.13 0.10 0.11 0.17 0.13 0.1s 0.09 0.05 0.166
0.2Zb 0.29 0.56 0.30
0.11 0.12 0.12 0.15 0.33b
0.32 0.62 0.37 0.64 0.92 0.65
0.34 0.33 0.36
0.22 0.26 0.24 0.29
0.16 0.26 0.25 0.26
0.23
0.41 0.4s 0.54 0.69 0.75 O.S6 0.60 0.66 0.70
0.27 0.29 0.34 0.51 0.54 0.59 0.47 0.45 0.53
0.22 0.26
0.27 0.31 0.36 0.42 0.50 0.55 0.70 0.73 0.111 0.73 0.72 0.75
0.33 0.39 0.26 0.36 0.29 0.32 0.33 0.20 0.30 0.32 0.33 0.35 0.33 0.33
0.35 2: 0.40 0.33 0.36 0.33 0.33 0.31 0.32 0,56 0.60 0.55 0.60 0.13 0.16 0.15 0.15 0.29 0.29
0.36 0.29 0.30 0.35 0.33 0.33 0.37 0.41 0.38 0.33 0.37 0.63 0.64 0.14 0.16
0.45 0.33 0.33 0.37 0.36 0.36 0.41 0.45 0.42 0.34 0.40 0.70 0.69 0.18 0.22
0.52 0.58 0.76 0.77 0.90 0.76 0.76 0.79
0.36 0.41 0.57 0.64 0.66 0.66 0.41 0.45 0.56 0.63 0.72 0.70 0.41 0.47 0.58 0.67 0.73 0.73 0.39 0.4s o.ss 0.63 0.70 0.67 0.45 0.51 0.65 0.69 0.80 0.73 0.55 0.62 0.76 0.82 0.90 0.88 0.47 0.54 0.66 0.71 0.76 0.71 0.38 0.43 0.55 0.58 0.64 0.63 0.43 0.4s 0.64 0.64 0.70 0.69 0.61 0.67 1.01 1.04 1.08 1.08 0.78 0.85 1.04 1.07 1.08 1.07 0.22 0.27 0.42 6.52 0.52 0.49 0.29 0.33 0.45 0.50 0.50 0.43
0.64 0.56 0.63 0.17 0.67 0.55 0.62 1.04 1.01 0.42 0.4s
o.s4 0.57 0.61 0.56 0.61 0.75 0.66 0.53 0.60 1.03 1.01 0.42 0.46
0.34 0.32 0.34 0.31 0.26 0.34 0.30 0.30
0.23 0.20 0.32 0.32 0.34 0.34 0.34 0.36
0.31 0.35
0.26 0.32 0.32 0.37
0.37 0.43
0.40 0.47 0.56 0.56 0.66 0.56 0.54 O.S6
0.44 0.49 0.65 0.66 0.79 0.60 0.57 0.59
0.39e 0.40C 0.91=
=Onlese othenri*..ge~ified. .nn..bd 1 hr .t 1176-C in .r6o". tc.tcd with the mrt.ca in the .s-rolled condition. b4,0W hr. =ll,OOO hr.
E
. . ~. . .~ . . ... . . . .. . . , . ~ . . . . . - .
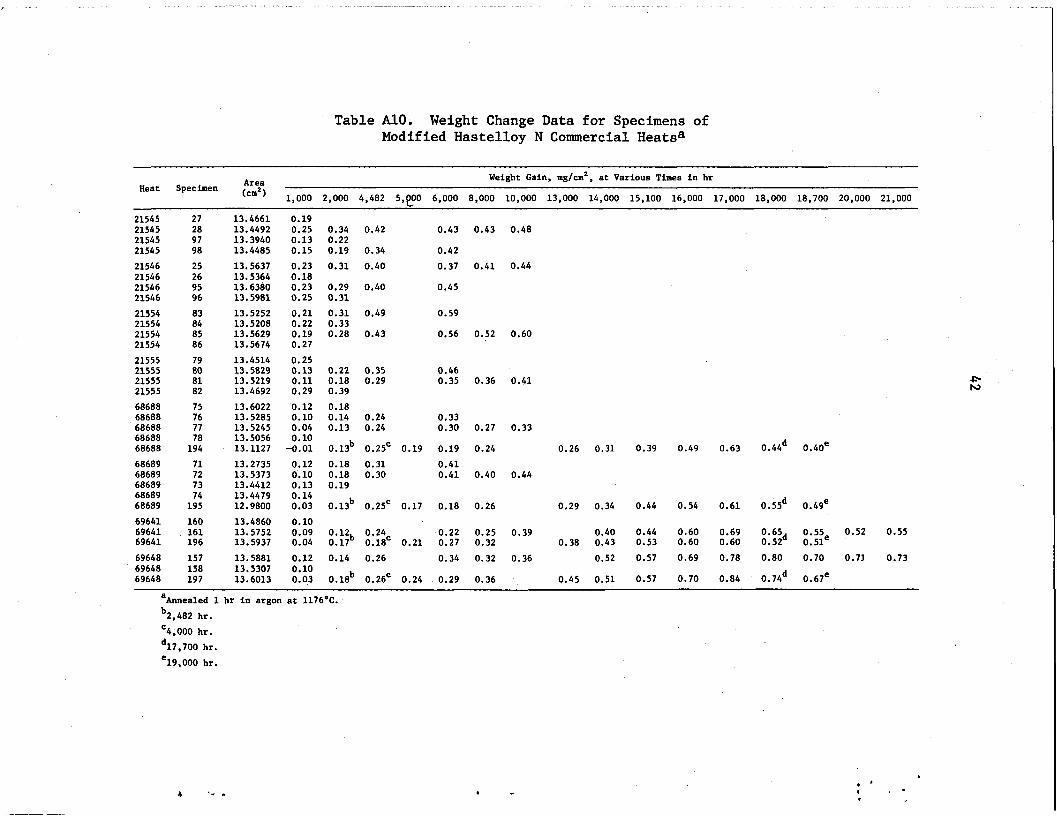
Table A10. Weight Change Data for Specimens of Modified Hastelloy N Commercial Heatsa
Weight Gain, mgfcm', at Various Times i n hr
1,000 2,000 4.482 5,900 6,000 8.000 10,000 13,000 14,000 15,100 16,000 17.000 18,000 18.700 20.000 21,000 Area (Cm2)
Heat Specimen
21545 21545 21545 21545 21546 21546 21546 21546 21554 21554 21554 21554 21555 21555 21555 21555 68688 68688 68688 68688 68688 68689 68689 68689 68689 68689 69641 69641 69641 69648 69648 69648
27 28 97 98 25 26 95 96 83 84 85 86 79 80 81 82 75 76 77 78 194 71 72 73 74 195 160 161 196 157 158 197
13.4661 13.4492 13.3940 13.4485 13.5637 13.5364 13.6380 13.5981 13.5252 13.5208 13.5629 13.5674 13.4514 13.5829 13.5219 13.4692 13.6022 13.5285 13.5245 13.5056 13.1127 13.2735 13.5373 13.4412 13.4479 12.9800 13.4860 13.5752 13.5937 13.5881 13.f307 13.6013
0.19 0.25 0.34 0.42 0.43 0.43 0.13 0.22 0.15 0.19 0.34 0.42 0.23 0.31 0.40 0.37 0.41 0.18 0.23 0.29 0.40 0.45 0.25 0.31 0.21 0.31 0.49 0.59 0.22 0.33 0.19 0.28 0.43 0.56 0.52 0.27 0.25 0.13 0.22 0.35 0.46 0.11 0.18 0.29 0.35 0.36 0.29 0.39 0.12 0.18 0.10 0.14 0.24 0.33 0.04 0.13 0.24 0.30 0.27 0.10 -0.01 0.13b 0.25' 0.19 0.19 0.24 0.12 0.18 0.31 0.41 0.10 0.18 0.30 0.41 0.40 0.13 0.19 0.14 0.03 0.13b 0.25' 0.17 0.18 0.26 0.10 0.09 0.12 0.24 0.22 0.25 0.04 0.17b 0.18' 0.21 0.27 0.32 0.12 0.14 0.26 0.34 0.32 0.10 0.03 O.Mb 0.26' 0.24 0.29 0.36
0.48
0.44
0.60
0.41
0.33
0.26
0.44
0.29
0.39
0.36 0.38
0.45
0.31 0.39 0.49
0.34 0.44 0.54
0.40 0.44 0.60 0.43 0.53 0.60 0.52 0.57 0.69
0.51 0.57 0.70
0.63 0.44' 0.40e
0.61 0.5Sd 0.4ge
0.69 0.65 0.55 0.52 0.55 0.60 0.52d 0.51e 0.78 0.80 0.70 0.71 0.73
0.84 0.74' 0.67e
aAnnealed 1 hr in argon at 1176OC. b2,482 hr. '4.000 hr. '17,700 hr. e19,000 hr.
.
43
i
.. 1
Table All. Weight Change Data for Specimpns of Modified Hastelloy N Commercial Heats
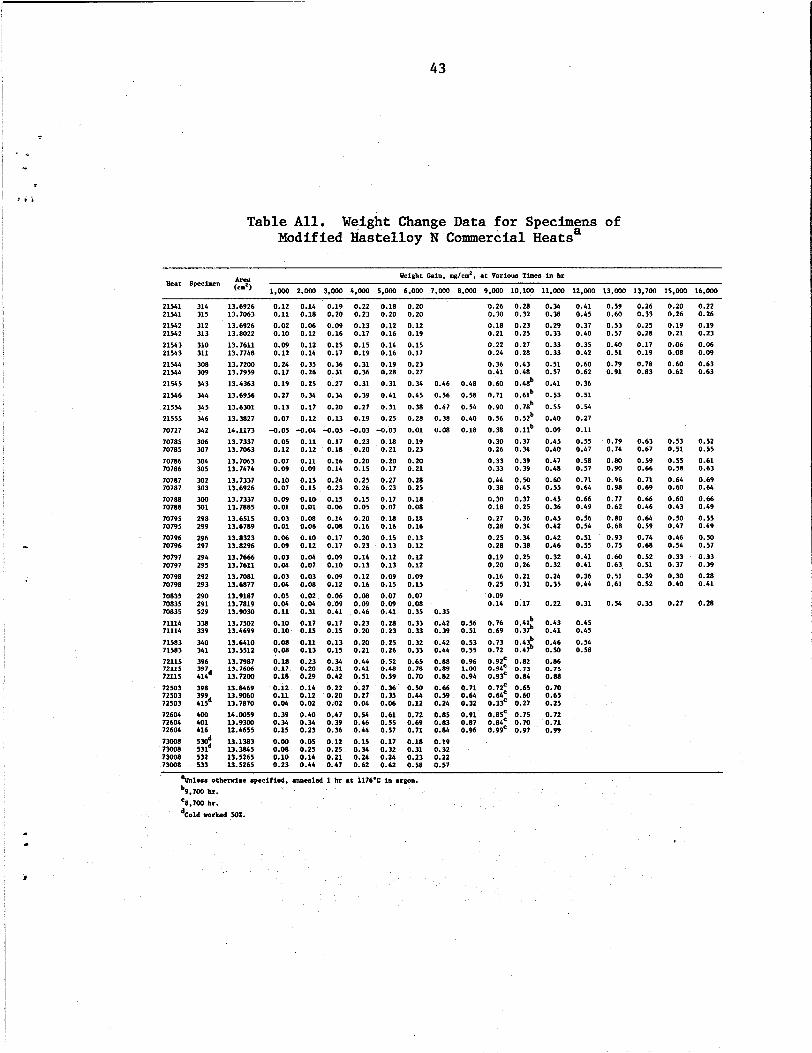
Weight Gain. pslcmz, a t Various Times i n hr wc Specimen
1,000 2,000 3.000 4.000 5.000 6.000 7,000 8.MKI 9.000 10,100 11.000 12,000 13.000 13,700 15,000 16,000
21541 21541 21542 21542 21543 21543 21544 21544 21545 21546 21554 21555 70727 70785 70785 70786 70786 70787 70787 70788 70788 70795 70795 70796 70796 70797 70797 70798 70798 70835 70835 70835 71114 71114 71583 71583 72115 72115 72115 72503 72503 72503 72604 72604 72604 73008 73008 73008 73008
314 315 312 313 310 311 308 309 343 344 345 346 342 306 307 304 305 302 303 300 301 298 299 296 297 294 295 292 293 290 291 529 338 339 340 341 396
:::d 398 399 41Sd 400 401 416
531d 532 533
5Md
13.6926 13.7063 13.6926 13.8022 13.7611 13.7748 13.7200 13.7959 13.4363 13.6956 13.6301 13.3827 14.1173 13.7337 13.7063 13.7063 13.7474 13.7337 13.6926 13.7337 13.7885 13.6515 13.6789 13.8323 13.8296 13.7666 13.7611 13.7081 13.6877 13.9187 13.7819 13.9030 13.7502 13.4699 13.6410 13.5512 13.7987 13.7606 13.7200 13.8469 13.9060 13.7870 14.0059 13.93W 12.4655 13.1383 13.3845 13.5265 13.5265
0.05 0.11 0.12 0.12 0.07 0.11 0.09 0.09 0.10 0.15 0.07 0.15 0.09 0.10 0.01 0.01 0.03 0.08 0.01 0.06 0.06 0.10 0.09 0.12 0.03 0.04 0.04 0.07 0.03 0.03 0.04 0.08 0.05 0.02 0.04 0.04 0.11 0.31 0.10 0.17 0.10 0.15 0.08 0.11 0.08 0.13 0.18 0.23 0.17 0.20 0.18 0.29 0.12 0.14 0.11 0.12 0.04 0.02
0.12 0.14 0.19 0.11 0.18 0.20 0.02 0.06 0.09 0.10 0.12 0.16 0.09 0.12 0.15 0.12 0.14 0.17 0.24 0.35 0.36 0.17 0.26 0.31 0.19 0.25 0.27 0.27 0.34 0.34 0.13 0.17 0.20 0.07 0.12 0.13
-0.05 -0.04 -0.05
0.39 0.40 0.34 0.34 0.15 0.23 0.00 0.05 0.08 0.25 0.10 0.14 0.23 0.44
0.17 0.18
0.16 0.14 0.24 0.23 0.15 0.06 0.14 0.08 0.17 0.17 0.09 0.10 0.09 0.12 0.06 0.09 0.bl 0.17 0.15 0.13 0.15 0.34 0.31 0.42 0.22 0.20 0.02 0.17 0.39 0.36 0.12 0.25 0.21 0.47
0.23 0.20 0.20 0.15 0.25 0.26 0.15 0.05 0.20 0.16 0.20 0.23 0.14 0.13 0.12 0.16 0.08 0.09 0.46 0.23 0.20 0.20 0.21 0.44 0.41 0.51 0.27 0.27 0.04 0.Y 0.46 0.54 0.15 0.34 0.24 0.62
0.22 0.18 0.20 0.26 0.23 0.20 0.20 0.30 0.13 0.12 0.12 0.18 0.17 0.16 0.19 0.21 0.15 0.14 0.15 0.22 0.19 0.16 0.17 0.24 0.31 0.19 0.23 0.36 0.36 0.28 0.27 0.41 0.31 0.31 0.34 0.46 0.48 0.60 0.39 0.41 0.45 0.56 0.58 0.71 0.27 0.31 0.38 0.47 0.54 0.90 0.19 0.25 0.28 0.38 0.40 0.56 -0.03 -0.03 0.01 0.08 0.18 0.38
0.18 0.19 0.21 0.23 0.20 0.20 0.17 0.21 0.27 0.28 0.23 0.25 0.17 0.18 0.07 0.08 0.18 0.18 0.16 0.16 0.15 C.13 0.13 0.12 0.12 0.12 0.13 0.12 0.09 0.09 0.15 0.15 0.07 0.07 0.09 0.08 0.41 0.35 0.35 0.28 0.33 0.42 0.56 0.23 0.33 0.39 0.51 0.25 0.32 0.42 0.53 0.26 0.33 0.44 0.55 0.52 0.65 0.88 0.96 0.411 0.711 0.89 1.00 0.19 0.70 0.82 0.94 0.36 0.50 0.66 0.71 0.35 0,44 0.59 0.64 0.06 0.12 0.24 0.32 0.61 0.72 0.85 0.91 0.55 0.69 0.83 0.87 0.57 0.71 0.84 0.96 0.17 0.18 0.19 0.32 0.31 0.32 0.24 0.23 0.22 0.62 0.58 0.57
0.28 0.32 0.23 0.25 0.27 0.28 0.43 0.48 O.4ab 0.61b 0.7sb 0.52b 0.lP
0.34 0.38 0.29 0.33 0.33 0.33 0.51 0.57 0.41 0.53 0.55 0.40 0.09
0.30 0.37 0.45 0.26 0.34 0.40 0.33 0.39 0.47 0.33 0.39 0.48 0.44 0.50 0.60 0.38 0.45 0.55 0.30 0.37 0.45 0.18 0.25 0.36 0.27 0.36 0.45 0.28 0.34 0.42 0.25 0.34 0.42 0.28 0.38 0.16 0.19 0.25 0.32 0.20 0.26 0.32 0.16 0.21 0.24 0.25 0.31 0.35 0.09 0.14 0.17 0.22
0.41 0.59 0.45 0.60 0.37 0.53 0.40 0.57 0.35 0.40 0.42 0.51 0.60 0.79 0.62 0.91 0.36 0.51 0.54 0.27 0.11 0.55 0.47 0.58 0.57 0.71 0.64 0.66 0.49 0.56 0.54 0.51 0.55 0.41 0.41 0.36 0.44
0.31
0.76 0.4t 0.43 0.45 0.69 0.37 0.41 0.45 0.73 0.4% 0.46 0.54 0.72 0.57 0.50 0.58 0 92' 0 82 0.06 0194' 0:73 0.75 0.93' 0.84 0.88 0.7ZC 0 65 0.70 0.64' 0160 0.65 0.33' 0.27 0.25
0.85' 0.75 0.72 0 84' 0.70 0.71 0:99' 0.97 0.99
0.79 0.74 0.80 0.90 0.96 0.98 0.77 0.62 0.80 0.68 0.93 0.75 0.60 0.63, 0.51 0.61
0.54
0.26 0.20 0.22 0.33 0.26 0.26 0.25 0.19 0.19 0.28 0.21 0.23 0.17 0.06 0.06 0.19 0.08 0.09
0.78 0.60 0.63 0.83 0.62 0.63
0.63 0.67 0.59 0.66 0.71 0.69 0.66 0.46 0.64 0.59 0.74 0.68 0.52 0.51 0.39 0.52
0.35
0.53 0.51 0.55 0.58 0.64 0.60 0.60 0.43 0.50 0.47 0.46 0.54 0.33 0.37 0.30 0.40
0.27
0.52 0.55 0.61 0.63 0.69 0.64 0.66 0.49 0.55 0.49 0.50 0.57 0.33 0.39 0.28 0.41
0.28
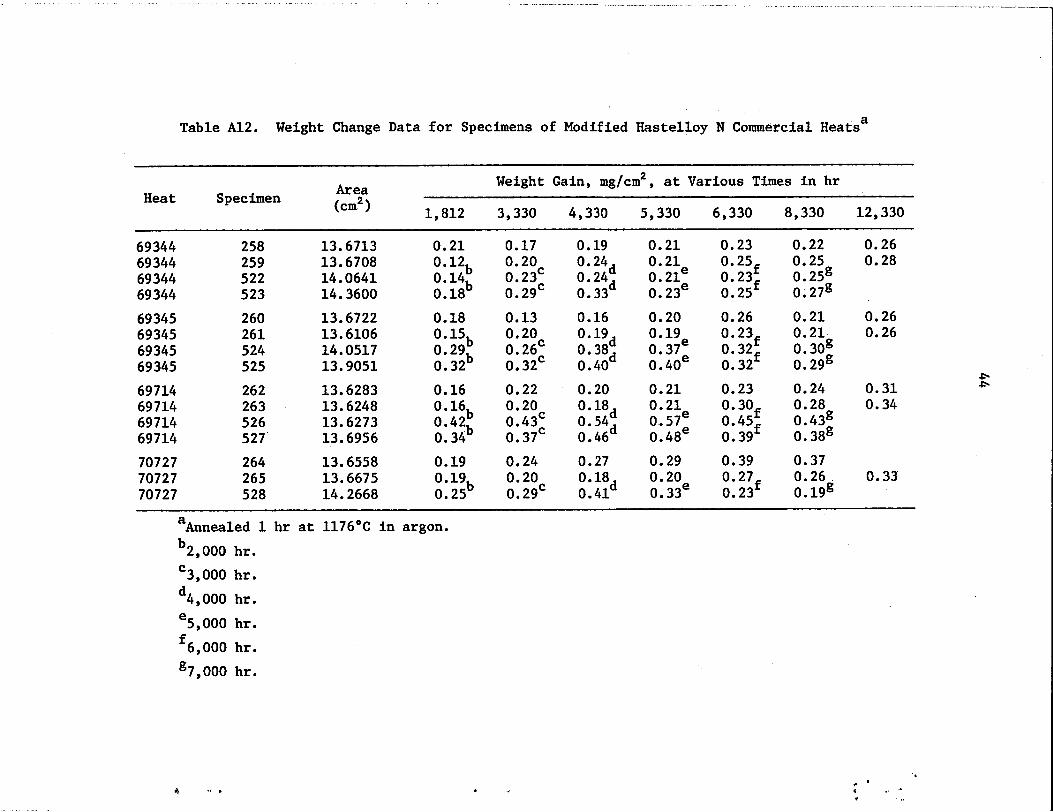
Table A12. Weight Change Data f o r Specimens of Modified Hastelloy N Commercial Heatsa
Weight Gain, mg/cm2, a t Various Times i n h r Area (cm2 1 1,812 3,330 4,330 5,330 6,330 8,330 12,330
Heat Specimen
-
69344 69344 69344 69344
69345 69345 69345 69345
69714 69714 69714 69714
70727 70727 70727
258 259 522 523
260 261 524 525
262 263 526 527
264 265 528
13.6713 13.6708 14.0641 14.3600
13.6722 13.6106 14.0517 13.9051
13.6283 13.6248 13.6273 13.6956
13.6558 13.6675 14.2668
0.21 0. 12b 0. 14b 0.18
0.18 0.15b 0. 2gb 0.32
0.16 0. 16b 0.42b 0.34
0.19
0.25 0.1gb
0.17 0.20 0.23' 0.29'
0.13
0. 26c 0.32
0.22 0.20 0.43; 0.37
0.24
0.29
0. 2OC
0. 2OC
0.19 0. 24d 0. 24d 0.33
0.16
0.21 0.23 0. 21e 0. 25f 0. 21e 0.23, 0.23 0.25'
0.20 0. lgd 0. l g e 0. 38d 0. 37e 0.40 0.40
0.20 0. 18d 0. 54d 0.46
0.27 0. 18d 0.41
0.21 0. 21e 0.57, 0.48
0.29 0.20 0. 33e
0.26 0. 23f 0.32, 0. 32L
0.23 0. 30f 0.45f 0.39
0.39 0. 27f 0.23
0.22 0.26 0.25 0.28 0. 25g 0. 27g 0.21 0.26 0.21 0.26 0. 30g 0. 2gg
0.24 0.31 0.28 0.34 0.43g 0. 38g
0.37 0.26 0.33 0.198
a
b2,000 hr.
3,000 hr .
d4, 000 h r . 5,000 hr . e
f6,000 hr.
'7,000 h r .
Annealed 1 hr a t 1176OC i n argon.
C
45
s
d
1-2 3.
4-18. 19. 20. 21. 22. 23. 24. 25. 26. 27. 28. 29. 30. 31. 32. 33. 34. 35. 36. 37. 38. 39.
4042.
INTERNAL
Central Research Library Document Reference Section Laboratory Records Department Laboratory Records, ORNL RC ORNL Patent Office R. J. Beaver C. R. Brinkman W. D. Burch D. A. Canonico J. V. Cathcart J. H. Coobs R. H. Cooper, Jr. W. R. Corwin W. B. Cottrell J. H. DeVan J. R. DiStefano R. G. Donnelly J. R. Engel M. H. Fontana G. M. Goodwin R. J. Gray J. C. Griess J. P. Hammond w. 0. Harms M. R. Hill
DISTRIBUTION
43. 44. 45. 46. 47. 48. 49. 50. 51. 52. 53. 54.
55-64. 65.
66-75. 76-78.
79. 80. 81. 82. 83. 84. 85. 86. 87.
ORMJTM-5781 Distribution Category UC-76
F. J. Homan W. R. Huntley €I. Inouye P. R. Kasten J. R. Keiser J. F. King R. T. King R. L. Klueh A. L. Lotts R. E. MacPherson W. R. Martin (Y-12) R. W. McClung H. E. McCoy C. J. McHargue B. McNabb, Jr. L. E. McNeese P. Patriarca T. K. Roche W. E. Sallee H. C. Savage M. D. Silverman G. M. Slaughter D. B. Trauger J. R. Weir W. A. Maxwell (consultant)
EXTERNAL DISTRIBUTION
8849. ERDA OAK RIDGE OPERATIONS OFFICE, P.O. Box E, Oak Ridge, TN 37830 Director, Reactor Division Research and Technical Support Division
90-91. ERDA DIVISION OF NUCLEAR RESEARCH AND APPLICATION, Washington, DC 20545 Director
92-205. ERDA TECHNICAL INFORMATION CENTER, Office of Information Services, P.O. Box 62, Oak Ridge, TN 37830 For distribution as shown in TID-4500 Distribution Category, UC-76 (Molten Salt Reactor Technology).
t U S GOVERNMENT PRINTING OFFICE: 1977-748-189/52