Embed Size (px)
Citation preview
Int J Clin Exp Med 2018;11(7):6662-6673www.ijcem.com /ISSN:1940-5901/IJCEM0051331
Original Article Histopathology and urinary metabonomics reveal the role of dietary salt on the pathogenesis of fructose-induced kidney injury
Xiangli Li1, Lingyu Zhang1, Yongxia Yang2, Dong Wu3, Wensheng Liu3, Xing Li3, Zhiqiang Su3, Haojia Chen3, Lijing Wang1, Lingyun Zheng2
1Vascular Biology Research Institute of School of Basic Courses, 2School of Basic Courses, 3School of Public Health, Guangdong Pharmaceutical University, Guangzhou 510006, Guangdong, P. R. China
Received February 20, 2017; Accepted May 3, 2017; Epub July 15, 2018; Published July 30, 2018
Abstract: Although increasing evidence demonstrates that dietary salt is involved in hypertension induced by high fructose levels (HF), it is not known how dietary salt plays a role in kidney injury caused by HF. Therefore, we inves-tigated the effects of different diets on abnormal renal histology and urinary metabolites. SD rats were randomly divided into five groups: a normal diet (0.5% NaCl, w/w); a high-salt diet (HS; 8% NaCl); 10% fructose in water (HF; w/v); high-salt diet and 10% fructose water (HF-HS); and low-salt diet (LS; 0.07% NaCl) with 10% fructose water (HF-LS). Eight weeks of the HF diet induced marked glomerular hypertrophy (PAS-staining), podocyte injury (desmin), tubular damage and inflammatory cell infiltration. However, the HS diet produced glomerular sclerosis (α-SMA) and podocyte injury. Importantly, metabonomic analysis showed that compared with the normal diet, the HS diet elicited the urinary excretion of trimetlylamine oxide (TMAO) and hippurate (urinary microbial cometabolites), whereas high fructose primarily affected the activity of the tricaboxylic acid (TCA) cycle. Notably, switching to LS diet halted the pro-gression of HF-induced renal injuries. Further, the excretion of TMAO and hippurate from HF-LS rats was significantly reduced compared with normal rats, whereas the HF+HS diet promoted excretion. Our findings indicate that dietary salt is involved in renal injury induced by HF, probably by affecting gut microbiota activity.
Keywords: Dietary salt, high fructose water, renal injury, urinary metabonomics, urinary metabolites
Introduction
Renal interstitial fibrosis involves various patho-genic processes, including interstitial hyper-cellularity, matrix accumulation, and atrophy of epithelial structures, which lead to a loss of normal function and renal failure [1]. Moreover, interstitial fibrosis is the strongest morphologi-cal predictor of clinical outcomes and is the most tightly linked variable to disease progres-sion [2]. Although most renal diseases originate from glomerular injuries such as diabetic nephropathy, interstitial involvement indicates a more ominous outcome [3]. The relationship between excessive sodium intake in the mod-ern diet and cardiovascular risk factors, partic-ularly hypertension, volume overload and chronic kidney disease (CKD), has been exten-sively investigated [4-6]. Recent research has revealed that high salt intake may enhance the
production of transforming growth factor-β (TGF-β) and lead to renal fibrosis [7]. Meanwhile, compelling evidence implicates the increased consumption of both fructose and salt in our daily diet [8]. High fructose intake is believed to play a role in the increasing epidemic of meta-bolic disorders [9]. The administration of high fructose to rats led to afferent arteriolar thick-ening, glomerular hypertension, glomerular hypertrophy, renal inflammation, tubulointersti-tial injury and cortical vasoconstriction [10]. Both salt [11, 12] and fructose [13-15] can be absorbed in the small intestine and kidney prox-imal tubule via different mechanisms. Previous studies have shown that a high fructose diet significantly decreases the daily excretion of chloride and sodium in the rat kidney [16]. Recent studies in rodents have also demon-strated that increased dietary fructose intake stimulates salt absorption in the small intestine
Urinary metabonomics and fructose-induced kidney injury
6663 Int J Clin Exp Med 2018;11(7):6662-6673
Figure 1. Representative urine (A: Normal, B: HF, C: HS, D: HF+HS, E: HF+LS) at the end of the 8th week. Keys: 1. 2-hydroxybutyrate; 2. isoleucine; 3. leucine; 4. valine; 5. lactate; 6. alanine; 7. acetate; 8. N-acetylglycoprotein; 9. glutamine; 10. acetone; 11. acetoacetate; 12. succinate; 13. α-KG; 14. citrate; 15. DMA; 16. DMG; 17. creatine; 18. creatinine; 19. tyrosine; 20. N-acetylcarnitine; 21. choline; 22. PC; 23. GPC; 24. taurine; 25. TMAO; 26. betaine; 27. α-glucose; 28. β-glucose; 29. glycine; 30. glycerol; 31. phosphoethanolamine; 32. hippurate; 33. N-metylnicotin-amide; 34. fumarate; 35. tryptophan; 36. phenylalanine; 37. uridine; 38. formate.
and renal proximal tubules, resulting in a state of salt overload and hypertension [17]. However, the role of salt in the pathogenesis of renal inju-ry associated with high fructose is still unclear. Therefore, in the present study, we investigate the link between histopathologic changes and urinary metabonomic profiles in rats treated with high-fructose water and a high- or low-salt diet to understand the underlying mechanism of renal injury.
Materials and methods
Animals and treatments
Eight-week-old male Sprague-Dawley (SD) rats (180-200 g) were obtained from Guangdong Medical Laboratory Animal Center (permit number: SCXK (YUE) 2008-0002). All animal procedures were approved by the animal care and use committees at the Guangdong Phar-
maceutical University, and the rats were ex- posed to a 12-h light/dark cycle at 22 ± 2°C for 2 weeks with free access to food and water in a pathogen-free facility. Rats were randomly divided into five groups: (i) group Normal (n=10) was fed a normal diet (0.5 NaCl, w/w); (ii) group HS (n=10) was fed a high-salt diet [18] (8% NaCl, w/w, online Supplementary Material); (iii) group HF (n=10) received a high-fructose water (10% fructose in water, w/v) and normal salt diet (0.5% NaCl; w/w); (iv) group HF+HS (n=10) was fed a high-fructose water and high-salt diet; and (v) group HF+LS (n=10) received a high-fructose water and low-salt diet (0.07% NaCl, w/w). After 8 weeks on the diets, the rats were placed in metabolic cages, and 24-h urine samples were collected. The collection contain-er was disinfected with 1% sodium azide (50 µL) before urine collection. All samples were stored at 80°C for NMR determination. Organs
Urinary metabonomics and fructose-induced kidney injury
6664 Int J Clin Exp Med 2018;11(7):6662-6673
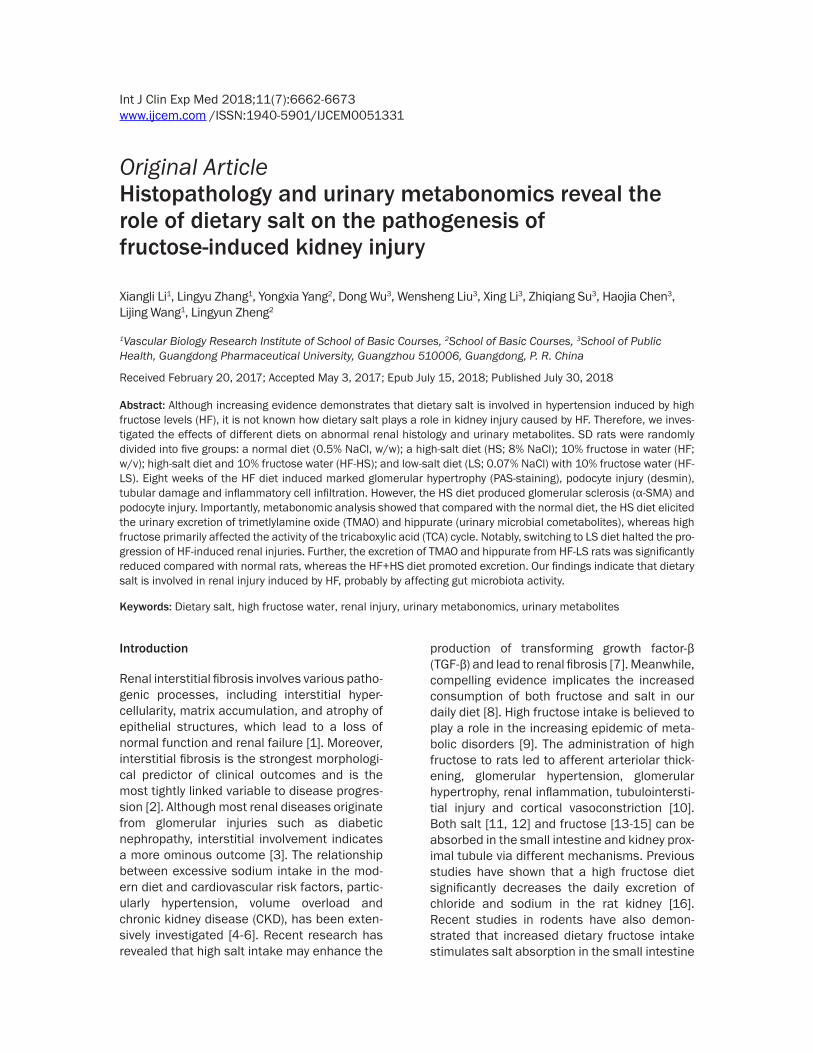
Figure 2. Effect of high fructose or high salt on the histology of renal glomerular and interstitial injuries. Representa-tive images from the normal diet group (n=10), high-fructose water group (n=10) and high-salt diet group (n=10) after 8 weeks. A: Hematoxylin-Eosin and Periodic acid-Schiff staining. B: Massion-staining and immunohistological staining. C: Relative numbers of damaged glomeruli in 100 randomly-selected glomeruli. D: Relative numbers of damaged tubules in 100 randomly-selected tubules. E: Quantification of the PAS-positive area. F: Quantification of the Masson-positive area. G: Relative expression of α-SMA in the kidney. H: Relative expression of desmin in the kid-ney. HF: High-fructose; HS: high-salt. Data are the mean ± SEM. *P<0.05; **P<0.01; ***P<0.001. NS: no significance.
were dissected under sodium pentobarbital anesthesia (60 mg/kg, i.p.).
Histological assessment
Kidney tissues fixed with 10% paraformalde-hyde were embedded in paraffin. Kidney sec-tions (3 μm) were stained with periodic acid-Schiff (PAS) to measure glomerulosclerotic injury and mesangial expansion and with Masson’s trichrome to assess the glomerular and tubulointerstitial ECM accumulation. Me- sangial area and ECM accumulation (percent-age of glomerular area) were evaluated from digital pictures of glomeruli (20 glomeruliper kidney peranimal) using the Image-Pro Plus 6.0 software (Media Cybernetics, Bethesda, MD, USA) [19]. To evaluate glomerular hypertrophy
(glomerular diameter), an area containing approximately 25-30 glomeruli per kidney sec-tion was measured in the Image-Pro Plus soft-ware [20]. Glomerulosclerotic injury was graded based on the severity of glomerular damage.
Immunohistochemistry
Rehydrated paraffin-embedded sections were blocked in 5% of BSA, 5% of donkey serum and 0.01% of sodium azide in PBS buffer for 4 h in a humidity chamber. Following a brief rinse, sections were incubated with 1:100 of rabbit anti-α-SMA (Abcam) overnight in humidity chambers at 4°C. Then, the sections were washed with PBS buffer and incubated with 1:200 of the appropriate secondary antibody. All primary and secondary antibodies were di-
Urinary metabonomics and fructose-induced kidney injury
6665 Int J Clin Exp Med 2018;11(7):6662-6673
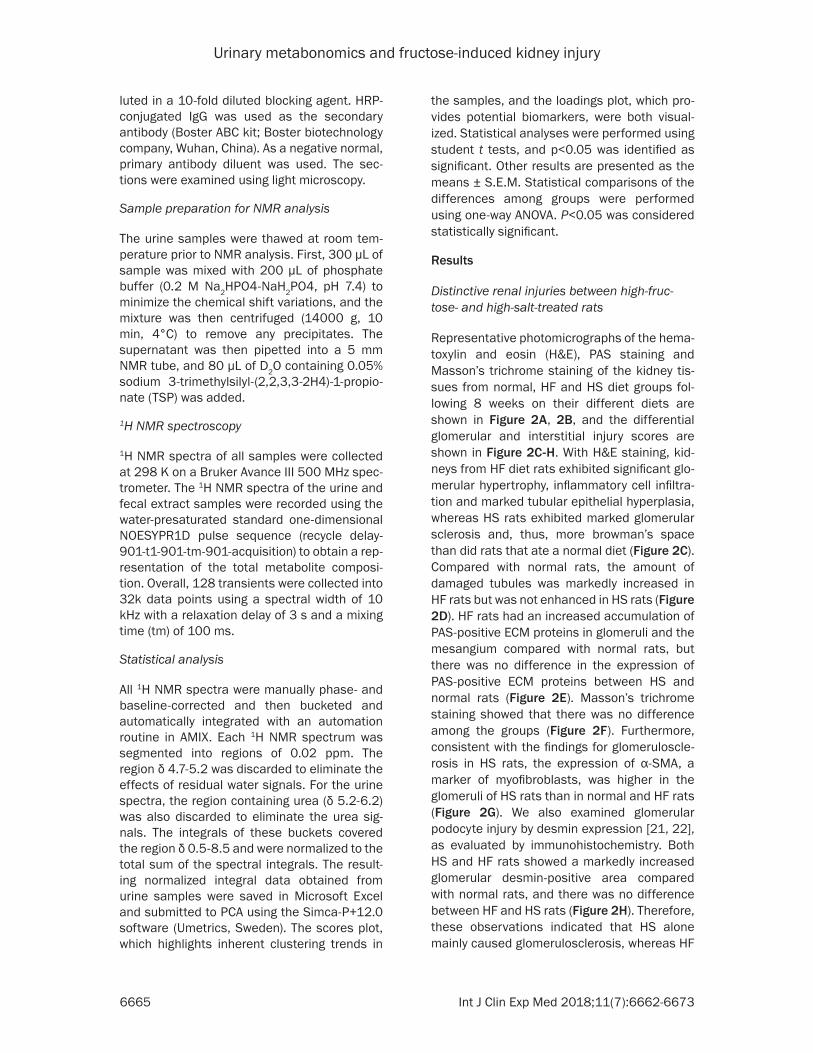
luted in a 10-fold diluted blocking agent. HRP-conjugated IgG was used as the secondary antibody (Boster ABC kit; Boster biotechnology company, Wuhan, China). As a negative normal, primary antibody diluent was used. The sec-tions were examined using light microscopy.
Sample preparation for NMR analysis
The urine samples were thawed at room tem-perature prior to NMR analysis. First, 300 µL of sample was mixed with 200 µL of phosphate buffer (0.2 M Na2HPO4-NaH2PO4, pH 7.4) to minimize the chemical shift variations, and the mixture was then centrifuged (14000 g, 10 min, 4°C) to remove any precipitates. The supernatant was then pipetted into a 5 mm NMR tube, and 80 µL of D2O containing 0.05% sodium 3-trimethylsilyl-(2,2,3,3-2H4)-1-propio-nate (TSP) was added.
1H NMR spectroscopy
1H NMR spectra of all samples were collected at 298 K on a Bruker Avance III 500 MHz spec-trometer. The 1H NMR spectra of the urine and fecal extract samples were recorded using the water-presaturated standard one-dimensional NOESYPR1D pulse sequence (recycle delay-901-t1-901-tm-901-acquisition) to obtain a rep-resentation of the total metabolite composi-tion. Overall, 128 transients were collected into 32k data points using a spectral width of 10 kHz with a relaxation delay of 3 s and a mixing time (tm) of 100 ms.
Statistical analysis
All 1H NMR spectra were manually phase- and baseline-corrected and then bucketed and automatically integrated with an automation routine in AMIX. Each 1H NMR spectrum was segmented into regions of 0.02 ppm. The region δ 4.7-5.2 was discarded to eliminate the effects of residual water signals. For the urine spectra, the region containing urea (δ 5.2-6.2) was also discarded to eliminate the urea sig-nals. The integrals of these buckets covered the region δ 0.5-8.5 and were normalized to the total sum of the spectral integrals. The result-ing normalized integral data obtained from urine samples were saved in Microsoft Excel and submitted to PCA using the Simca-P+12.0 software (Umetrics, Sweden). The scores plot, which highlights inherent clustering trends in
the samples, and the loadings plot, which pro-vides potential biomarkers, were both visual-ized. Statistical analyses were performed using student t tests, and p<0.05 was identified as significant. Other results are presented as the means ± S.E.M. Statistical comparisons of the differences among groups were performed using one-way ANOVA. P<0.05 was considered statistically significant.
Results
Distinctive renal injuries between high-fruc-tose- and high-salt-treated rats
Representative photomicrographs of the hema-toxylin and eosin (H&E), PAS staining and Masson’s trichrome staining of the kidney tis-sues from normal, HF and HS diet groups fol-lowing 8 weeks on their different diets are shown in Figure 2A, 2B, and the differential glomerular and interstitial injury scores are shown in Figure 2C-H. With H&E staining, kid-neys from HF diet rats exhibited significant glo-merular hypertrophy, inflammatory cell infiltra-tion and marked tubular epithelial hyperplasia, whereas HS rats exhibited marked glomerular sclerosis and, thus, more browman’s space than did rats that ate a normal diet (Figure 2C). Compared with normal rats, the amount of damaged tubules was markedly increased in HF rats but was not enhanced in HS rats (Figure 2D). HF rats had an increased accumulation of PAS-positive ECM proteins in glomeruli and the mesangium compared with normal rats, but there was no difference in the expression of PAS-positive ECM proteins between HS and normal rats (Figure 2E). Masson’s trichrome staining showed that there was no difference among the groups (Figure 2F). Furthermore, consistent with the findings for glomeruloscle-rosis in HS rats, the expression of α-SMA, a marker of myofibroblasts, was higher in the glomeruli of HS rats than in normal and HF rats (Figure 2G). We also examined glomerular podocyte injury by desmin expression [21, 22], as evaluated by immunohistochemistry. Both HS and HF rats showed a markedly increased glomerular desmin-positive area compared with normal rats, and there was no difference between HF and HS rats (Figure 2H). Therefore, these observations indicated that HS alone mainly caused glomerulosclerosis, whereas HF
Urinary metabonomics and fructose-induced kidney injury
6666 Int J Clin Exp Med 2018;11(7):6662-6673
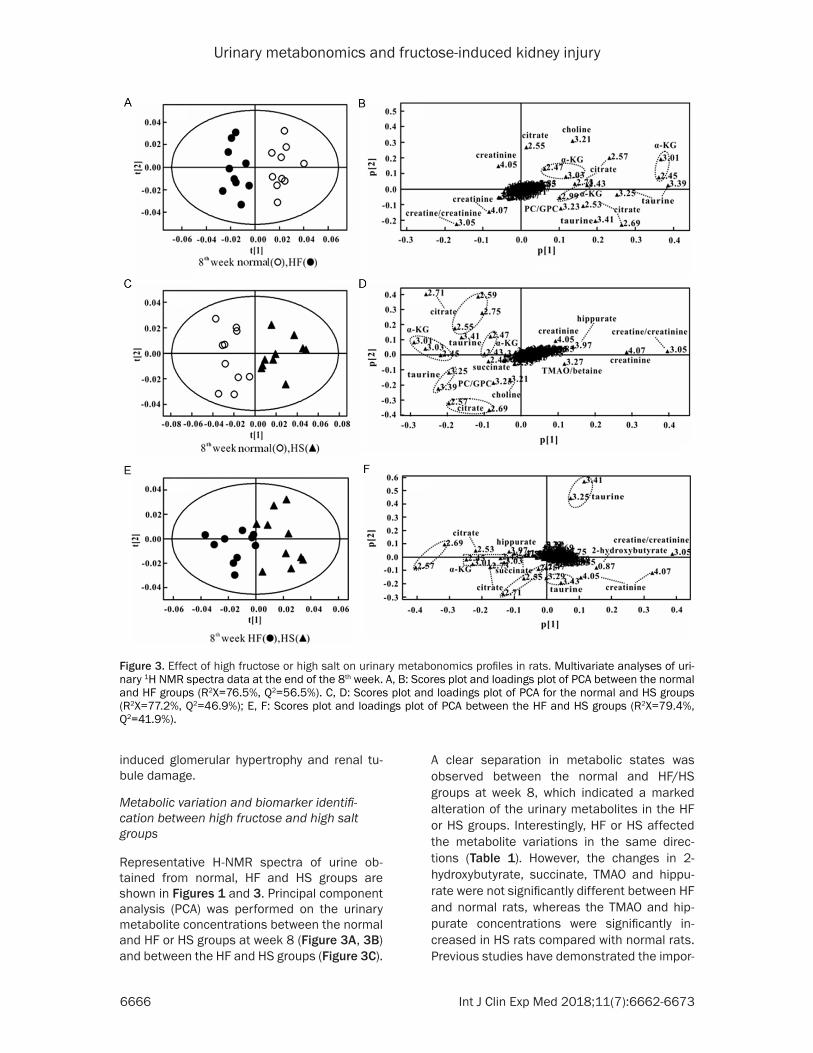
Figure 3. Effect of high fructose or high salt on urinary metabonomics profiles in rats. Multivariate analyses of uri-nary 1H NMR spectra data at the end of the 8th week. A, B: Scores plot and loadings plot of PCA between the normal and HF groups (R2X=76.5%, Q2=56.5%). C, D: Scores plot and loadings plot of PCA for the normal and HS groups (R2X=77.2%, Q2=46.9%); E, F: Scores plot and loadings plot of PCA between the HF and HS groups (R2X=79.4%, Q2=41.9%).
induced glomerular hypertrophy and renal tu- bule damage.
Metabolic variation and biomarker identifi-cation between high fructose and high salt groups
Representative H-NMR spectra of urine ob- tained from normal, HF and HS groups are shown in Figures 1 and 3. Principal component analysis (PCA) was performed on the urinary metabolite concentrations between the normal and HF or HS groups at week 8 (Figure 3A, 3B) and between the HF and HS groups (Figure 3C).
A clear separation in metabolic states was observed between the normal and HF/HS groups at week 8, which indicated a marked alteration of the urinary metabolites in the HF or HS groups. Interestingly, HF or HS affected the metabolite variations in the same direc-tions (Table 1). However, the changes in 2- hydroxybutyrate, succinate, TMAO and hippu-rate were not significantly different between HF and normal rats, whereas the TMAO and hip-purate concentrations were significantly in- creased in HS rats compared with normal rats. Previous studies have demonstrated the impor-
Urinary metabonomics and fructose-induced kidney injury
6667 Int J Clin Exp Med 2018;11(7):6662-6673
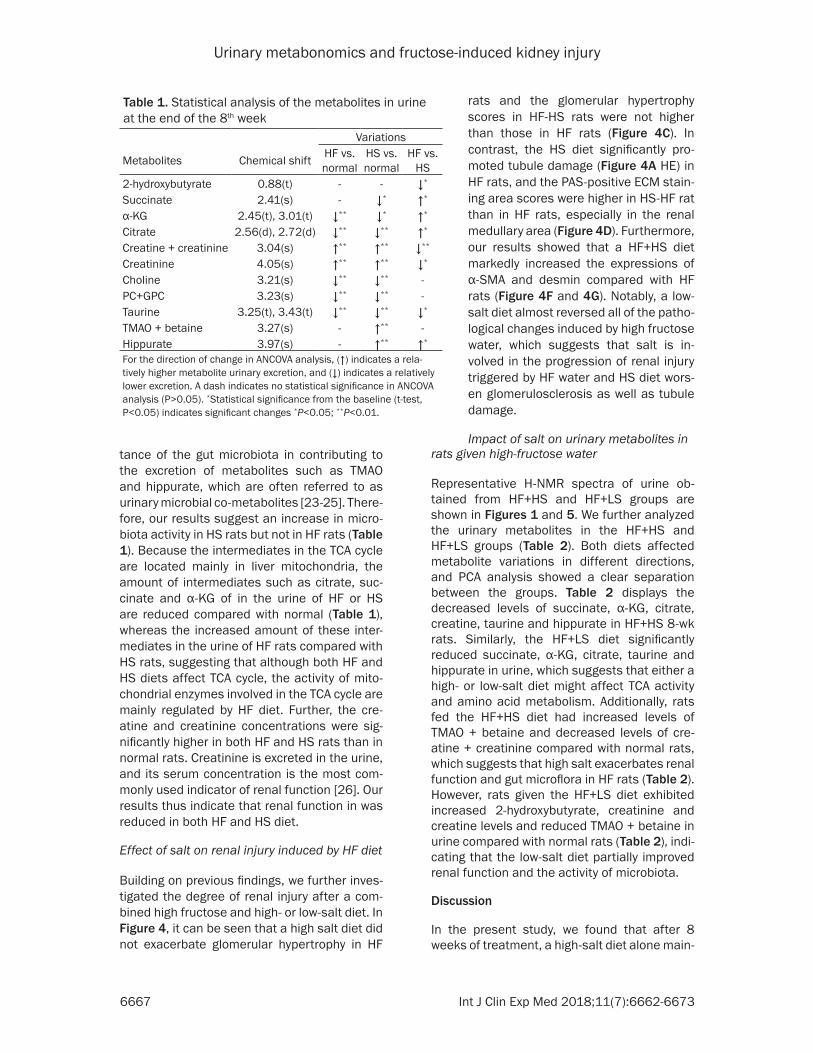
Table 1. Statistical analysis of the metabolites in urine at the end of the 8th week
Variations
Metabolites Chemical shift HF vs. normal
HS vs. normal
HF vs. HS
2-hydroxybutyrate 0.88(t) - - ↓*
Succinate 2.41(s) - ↓* ↑*
α-KG 2.45(t), 3.01(t) ↓** ↓* ↑*
Citrate 2.56(d), 2.72(d) ↓** ↓** ↑*
Creatine + creatinine 3.04(s) ↑** ↑** ↓**
Creatinine 4.05(s) ↑** ↑** ↓*
Choline 3.21(s) ↓** ↓** -PC+GPC 3.23(s) ↓** ↓** -Taurine 3.25(t), 3.43(t) ↓** ↓** ↓*
TMAO + betaine 3.27(s) - ↑** -Hippurate 3.97(s) - ↑** ↑*
For the direction of change in ANCOVA analysis, (↑) indicates a rela-tively higher metabolite urinary excretion, and (↓) indicates a relatively lower excretion. A dash indicates no statistical significance in ANCOVA analysis (P>0.05). *Statistical significance from the baseline (t-test, P<0.05) indicates significant changes *P<0.05; **P<0.01.
tance of the gut microbiota in contributing to the excretion of metabolites such as TMAO and hippurate, which are often referred to as urinary microbial co-metabolites [23-25]. There- fore, our results suggest an increase in micro-biota activity in HS rats but not in HF rats (Table 1). Because the intermediates in the TCA cycle are located mainly in liver mitochondria, the amount of intermediates such as citrate, suc-cinate and α-KG of in the urine of HF or HS are reduced compared with normal (Table 1), whereas the increased amount of these inter-mediates in the urine of HF rats compared with HS rats, suggesting that although both HF and HS diets affect TCA cycle, the activity of mito-chondrial enzymes involved in the TCA cycle are mainly regulated by HF diet. Further, the cre-atine and creatinine concentrations were sig-nificantly higher in both HF and HS rats than in normal rats. Creatinine is excreted in the urine, and its serum concentration is the most com-monly used indicator of renal function [26]. Our results thus indicate that renal function in was reduced in both HF and HS diet.
Effect of salt on renal injury induced by HF diet
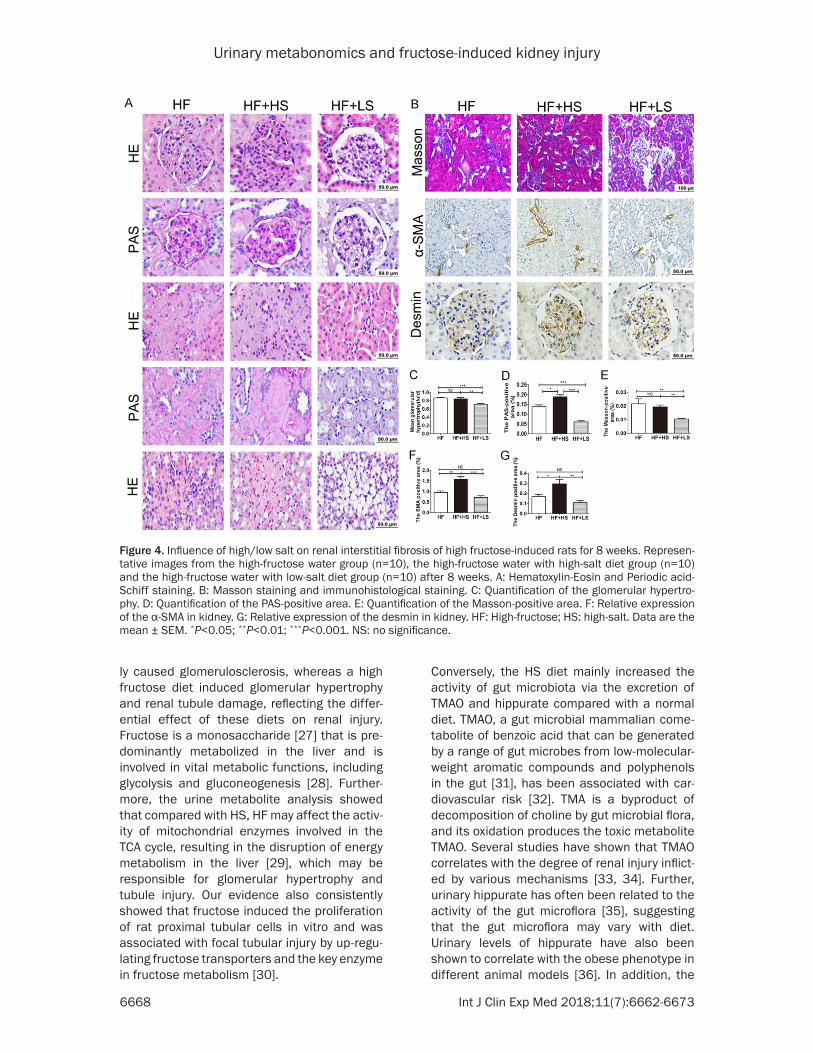
Building on previous findings, we further inves-tigated the degree of renal injury after a com-bined high fructose and high- or low-salt diet. In Figure 4, it can be seen that a high salt diet did not exacerbate glomerular hypertrophy in HF
rats and the glomerular hypertrophy scores in HF-HS rats were not higher than those in HF rats (Figure 4C). In contrast, the HS diet significantly pro-moted tubule damage (Figure 4A HE) in HF rats, and the PAS-positive ECM stain-ing area scores were higher in HS-HF rat than in HF rats, especially in the renal medullary area (Figure 4D). Furthermore, our results showed that a HF+HS diet markedly increased the expressions of α-SMA and desmin compared with HF rats (Figure 4F and 4G). Notably, a low-salt diet almost reversed all of the patho-logical changes induced by high fructose water, which suggests that salt is in- volved in the progression of renal injury triggered by HF water and HS diet wors-en glomerulosclerosis as well as tubule damage.
Impact of salt on urinary metabolites in rats given high-fructose water
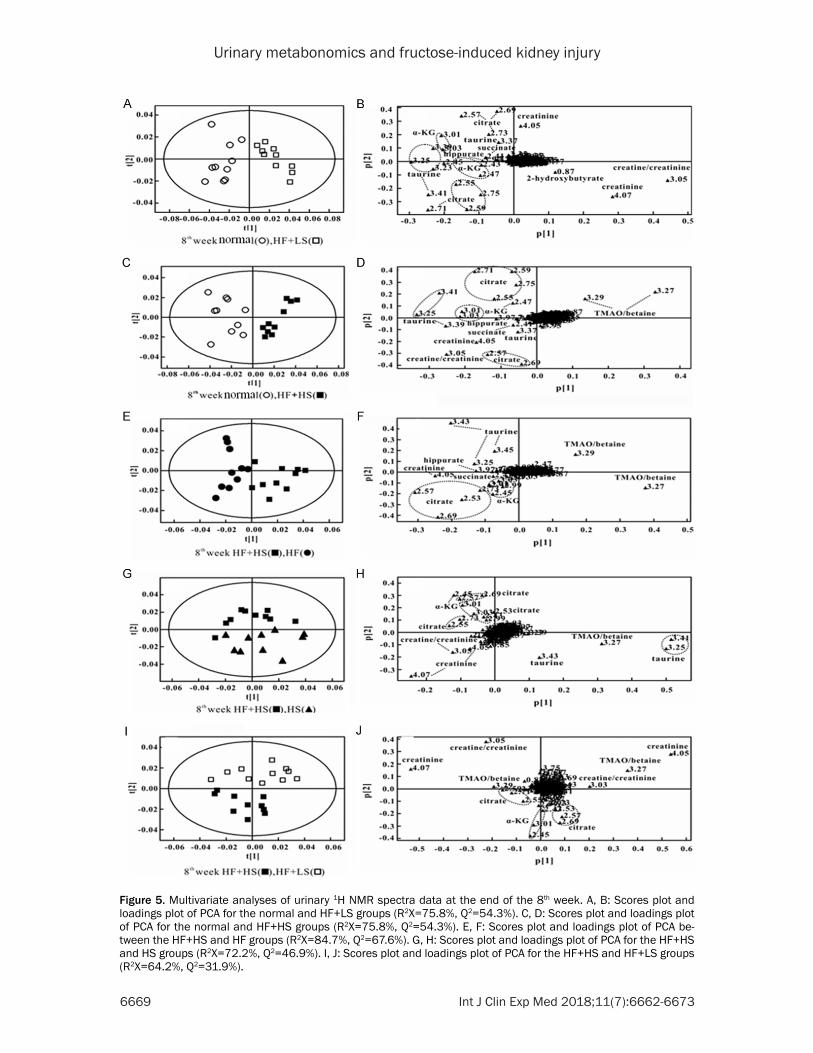
Representative H-NMR spectra of urine ob- tained from HF+HS and HF+LS groups are shown in Figures 1 and 5. We further analyzed the urinary metabolites in the HF+HS and HF+LS groups (Table 2). Both diets affected metabolite variations in different directions, and PCA analysis showed a clear separation between the groups. Table 2 displays the decreased levels of succinate, α-KG, citrate, creatine, taurine and hippurate in HF+HS 8-wk rats. Similarly, the HF+LS diet significantly reduced succinate, α-KG, citrate, taurine and hippurate in urine, which suggests that either a high- or low-salt diet might affect TCA activity and amino acid metabolism. Additionally, rats fed the HF+HS diet had increased levels of TMAO + betaine and decreased levels of cre-atine + creatinine compared with normal rats, which suggests that high salt exacerbates renal function and gut microflora in HF rats (Table 2). However, rats given the HF+LS diet exhibited increased 2-hydroxybutyrate, creatinine and creatine levels and reduced TMAO + betaine in urine compared with normal rats (Table 2), indi-cating that the low-salt diet partially improved renal function and the activity of microbiota.
Discussion
In the present study, we found that after 8 weeks of treatment, a high-salt diet alone main-
Urinary metabonomics and fructose-induced kidney injury
6668 Int J Clin Exp Med 2018;11(7):6662-6673
Figure 4. Influence of high/low salt on renal interstitial fibrosis of high fructose-induced rats for 8 weeks. Represen-tative images from the high-fructose water group (n=10), the high-fructose water with high-salt diet group (n=10) and the high-fructose water with low-salt diet group (n=10) after 8 weeks. A: Hematoxylin-Eosin and Periodic acid-Schiff staining. B: Masson staining and immunohistological staining. C: Quantification of the glomerular hypertro-phy. D: Quantification of the PAS-positive area. E: Quantification of the Masson-positive area. F: Relative expression of the α-SMA in kidney. G: Relative expression of the desmin in kidney. HF: High-fructose; HS: high-salt. Data are the mean ± SEM. *P<0.05; **P<0.01; ***P<0.001. NS: no significance.
ly caused glomerulosclerosis, whereas a high fructose diet induced glomerular hypertrophy and renal tubule damage, reflecting the differ-ential effect of these diets on renal injury. Fructose is a monosaccharide [27] that is pre-dominantly metabolized in the liver and is involved in vital metabolic functions, including glycolysis and gluconeogenesis [28]. Further- more, the urine metabolite analysis showed that compared with HS, HF may affect the activ-ity of mitochondrial enzymes involved in the TCA cycle, resulting in the disruption of energy metabolism in the liver [29], which may be responsible for glomerular hypertrophy and tubule injury. Our evidence also consistently showed that fructose induced the proliferation of rat proximal tubular cells in vitro and was associated with focal tubular injury by up-regu-lating fructose transporters and the key enzyme in fructose metabolism [30].
Conversely, the HS diet mainly increased the activity of gut microbiota via the excretion of TMAO and hippurate compared with a normal diet. TMAO, a gut microbial mammalian come-tabolite of benzoic acid that can be generated by a range of gut microbes from low-molecular-weight aromatic compounds and polyphenols in the gut [31], has been associated with car-diovascular risk [32]. TMA is a byproduct of decomposition of choline by gut microbial flora, and its oxidation produces the toxic metabolite TMAO. Several studies have shown that TMAO correlates with the degree of renal injury inflict-ed by various mechanisms [33, 34]. Further, urinary hippurate has often been related to the activity of the gut microflora [35], suggesting that the gut microflora may vary with diet. Urinary levels of hippurate have also been shown to correlate with the obese phenotype in different animal models [36]. In addition, the
Urinary metabonomics and fructose-induced kidney injury
6669 Int J Clin Exp Med 2018;11(7):6662-6673
Figure 5. Multivariate analyses of urinary 1H NMR spectra data at the end of the 8th week. A, B: Scores plot and loadings plot of PCA for the normal and HF+LS groups (R2X=75.8%, Q2=54.3%). C, D: Scores plot and loadings plot of PCA for the normal and HF+HS groups (R2X=75.8%, Q2=54.3%). E, F: Scores plot and loadings plot of PCA be-tween the HF+HS and HF groups (R2X=84.7%, Q2=67.6%). G, H: Scores plot and loadings plot of PCA for the HF+HS and HS groups (R2X=72.2%, Q2=46.9%). I, J: Scores plot and loadings plot of PCA for the HF+HS and HF+LS groups (R2X=64.2%, Q2=31.9%).
Urinary metabonomics and fructose-induced kidney injury
6670 Int J Clin Exp Med 2018;11(7):6662-6673
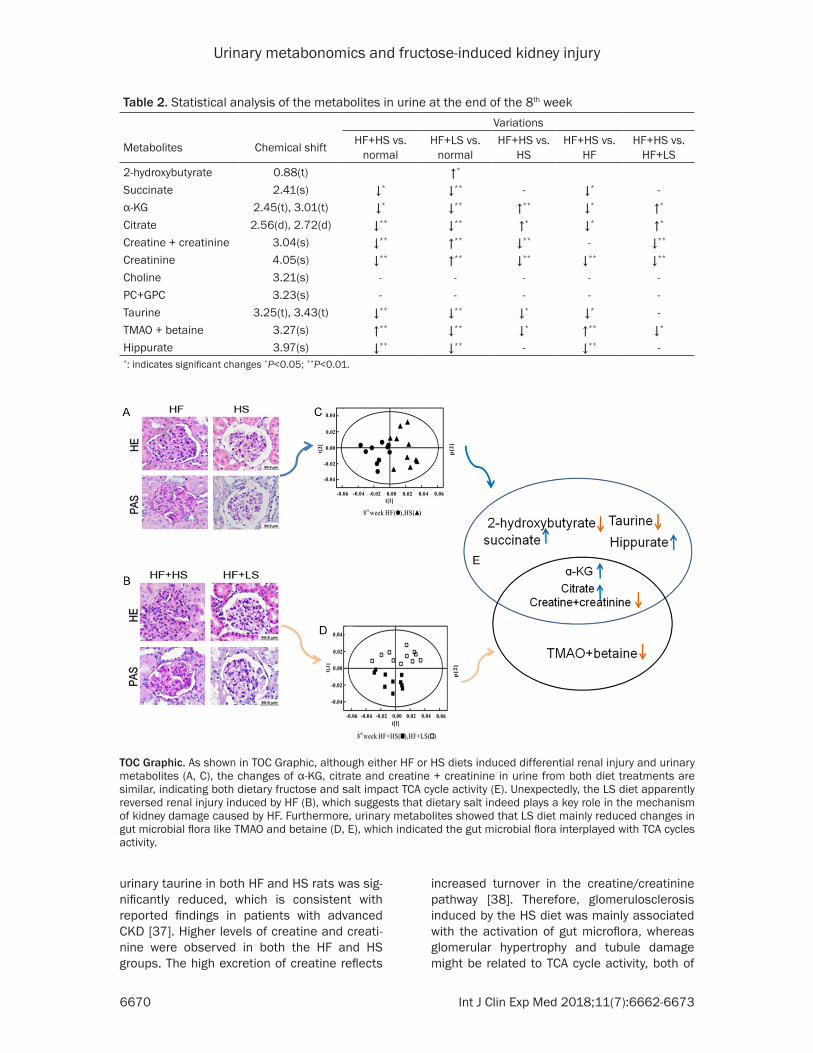
Table 2. Statistical analysis of the metabolites in urine at the end of the 8th weekVariations
Metabolites Chemical shift HF+HS vs. normal
HF+LS vs. normal
HF+HS vs. HS
HF+HS vs. HF
HF+HS vs. HF+LS
2-hydroxybutyrate 0.88(t) ↑*
Succinate 2.41(s) ↓* ↓** - ↓* -α-KG 2.45(t), 3.01(t) ↓* ↓** ↑** ↓* ↑*
Citrate 2.56(d), 2.72(d) ↓** ↓** ↑* ↓* ↑*
Creatine + creatinine 3.04(s) ↓** ↑** ↓** - ↓**
Creatinine 4.05(s) ↓** ↑** ↓** ↓** ↓**
Choline 3.21(s) - - - - -PC+GPC 3.23(s) - - - - -Taurine 3.25(t), 3.43(t) ↓** ↓** ↓* ↓* -TMAO + betaine 3.27(s) ↑** ↓** ↓* ↑** ↓*
Hippurate 3.97(s) ↓** ↓** - ↓** -*: indicates significant changes *P<0.05; **P<0.01.
TOC Graphic. As shown in TOC Graphic, although either HF or HS diets induced differential renal injury and urinary metabolites (A, C), the changes of α-KG, citrate and creatine + creatinine in urine from both diet treatments are similar, indicating both dietary fructose and salt impact TCA cycle activity (E). Unexpectedly, the LS diet apparently reversed renal injury induced by HF (B), which suggests that dietary salt indeed plays a key role in the mechanism of kidney damage caused by HF. Furthermore, urinary metabolites showed that LS diet mainly reduced changes in gut microbial flora like TMAO and betaine (D, E), which indicated the gut microbial flora interplayed with TCA cycles activity.
urinary taurine in both HF and HS rats was sig-nificantly reduced, which is consistent with reported findings in patients with advanced CKD [37]. Higher levels of creatine and creati-nine were observed in both the HF and HS groups. The high excretion of creatine reflects
increased turnover in the creatine/creatinine pathway [38]. Therefore, glomerulosclerosis induced by the HS diet was mainly associated with the activation of gut microflora, whereas glomerular hypertrophy and tubule damage might be related to TCA cycle activity, both of
Urinary metabonomics and fructose-induced kidney injury
6671 Int J Clin Exp Med 2018;11(7):6662-6673
which exacerbate renal injury. Indeed, HS+HF rats showed marked tubule damage, glomeru-lar podocyte injury and pathological fibrosis changes compared with HF rats. Urinary metab-olite variation analysis showed that the HF+HS diet affected the intermetabolites of the TCA cycles and a toxic metabolite of gut microflora. The creatine and creatinine concentrations in this group were lower than those in the normal group, suggesting decreased kidney function. However, the LS diet significantly reversed most of the pathological changes induced by the HF treatment. Rats fed the HF+LS diet had increased 2-hydroxybutyrate, creatinine and creatine levels and reduced TMAO + betaine levels in urine compared with normal rats, indi-cating that the low-salt diet improved renal function and the activity of microbiota. Fur- thermore, with the HF+HS diet, metabonomic analysis indicated that gut microbiota might be interact with the activity of enzymes in the TCA cycle and corporately regulated the pathogen-esis of kidney injury.
In summary, as shown in TOC Graphic, although either HF or HS diet induced differential renal injury and urinary metabolites (Toc Graphic A, C), the changes of α-KG, citrate and creatine + creatinine in urine from both diet treatments showed similar variations compared with the normal diet, indicating both dietary fructose and salt impacted on TCA cycle activity (Toc Graphic E). Unexpectedly, the LS diet appar-ently reversed renal injury induced by HF (Toc Graphic B), which suggests that dietary salt indeed plays a key role in the mechanism of kidney damage caused by HF. Furthermore, uri-nary metabolites showed that LS diet mainly reduced metabolite changes in gut microbial flora like TMAO and betaine (Toc Graphic D-E), which indicated the gut microbial flora inter-played with TCA cycles activity. However, we need to further investigate the underlying mechanism of how gut microbial flora involved in regulating the enzymes activity in TCA cycle.
Acknowledgements
This work was supported by the National Natural Science Foundation of China (No. 31471290 to L.J.W., No. 31571178 to L.Y.Z.) and Science and Technology Planning Project of Guangdong Province, China (No. 51343072 to L.J.W., No. 2014A030304064 to L.Y.Z.).
Disclosure of conflict of interest
None.
Address correspondence to: Lijing Wang, Vascular Biology Research Institute of School of Basic Cour- ses, Guangdong Pharmaceutical University, 280 Wai Huan Dong Lu, Guangzhou Higher Education Mega Center, Guangzhou 510006, Guangdong, P. R. China. Tel: 86-20-39352331; Fax: 86-20-393523- 97; E-mail: [email protected]; Linyun Zheng, School of Basic Courses, Guangdong Pharmaceuti- cal University, 280 Wai Huan Dong Lu, Guangzhou Higher Education Mega Center, Guangzhou 5100- 06, Guangdong, P. R. China. Tel: 86-20-39352198; Fax: 86-20-39352397; E-mail: [email protected]
References
[1] Barnes JL, Gorin Y. Myofibroblast differentia-tion during fibrosis: role of NAD(P)H oxidases. Kidney Int 2011; 79: 944-956.
[2] Schwartz MM, Korbet SM, Rydell J, Borok R, Genchi R. Primary focal segmental glomerular sclerosis in adults: prognostic value of histo-logic variants. Am J Kidney Dis 1995; 25: 845-852.
[3] Risdon RA, Sloper JC, De Wardener HE. Rela-tionship between renal function and histologi-cal changes found in renal-biopsy specimens from patients with persistent glomerular ne-phritis. Lancet 1968; 2: 363-366.
[4] Essig M, Escoubet B, de Zuttere D, Blanchet F, Arnoult F, Dupuis E, Michel C, Mignon F, Men-tre F, Clerici C, Vrtovsnik F. Cardiovascular re-modelling and extracellular fluid excess in ear-ly stages of chronic kidney disease. Nephrol Dial Transplant 2008; 23: 239-248.
[5] Suckling RJ, He FJ, Macgregor GA. Altered di-etary salt intake for preventing and treating diabetic kidney disease. Cochrane Database Syst Rev 2010; 12: CD006763.
[6] Pimenta E, Gaddam KK, Oparil S, Aban I, Hu-sain S, Dell’Italia LJ, Calhoun DA. Effects of di-etary sodium reduction on blood pressure in subjects with resistant hypertension: results from a randomized trial. Hypertension 2009; 54: 475-481.
[7] Shen B, Hagiwara M, Yao YY, Chao L, Chao J. Salutary effect of kallistatin in salt-induced re-nal injury, inflammation, and fibrosis via anti-oxidative stress. Hypertension 2008; 51: 1358-1365.
[8] Soleimani M. Dietary fructose, salt absorption and hypertension in metabolic syndrome: to-wards a new paradigm. Acta Physiol (Oxf) 2011; 201: 55-62.
Urinary metabonomics and fructose-induced kidney injury
6672 Int J Clin Exp Med 2018;11(7):6662-6673
[9] Johnson RJ, Segal MS, Sautin Y, Nakagawa T, Feig DI, Kang DH, Gersch MS, Benner S, San-chez-Lozada LG. Potential role of sugar (fruc-tose) in the epidemic of hypertension, obesity and the metabolic syndrome, diabetes, kidney disease, and cardiovascular disease. Am J Clin Nutr 2007; 86: 899-906.
[10] Sanchez-Lozada LG, Tapia E, Jimenez A, Bau-tista P, Cristobal M, Nepomuceno T, Soto V, Avila-Casado C, Nakagawa T, Johnson RJ, Her-rera-Acosta J, Franco M. Fructose-induced metabolic syndrome is associated with glomer-ular hypertension and renal microvascular damage in rats. Am J Physiol Renal Physiol 2007; 292: F423-429.
[11] Seidler U, Rottinghaus I, Hillesheim J, Chen M, Riederer B, Krabbenhoft A, Engelhardt R, Wie-mann M, Wang Z, Barone S, Manns MP, Solei-mani M. Sodium and chloride absorptive de-fects in the small intestine in Slc26a6 null mice. Pflugers Arch 2008; 455: 757-766.
[12] Soleimani M. Expression, regulation and the role of SLC26 Cl-/HCO3- exchangers in kidney and gastrointestinal tract. Novartis Found Symp 2006; 273: 91-102.
[13] Shu R, David ES, Ferraris RP. Dietary fructose enhances intestinal fructose transport and GLUT5 expression in weaning rats. Am J Physi-ol 1997; 272: G446-453.
[14] Corpe CP, Basaleh MM, Affleck J, Gould G, Jess TJ, Kellett GL. The regulation of GLUT5 and GLUT2 activity in the adaptation of intestinal brush-border fructose transport in diabetes. Pflugers Arch 1996; 432: 192-201.
[15] Helliwell PA, Richardson M, Affleck J, Kellett GL. Stimulation of fructose transport across the intestinal brush-border membrane by PMA is mediated by GLUT2 and dynamically regu-lated by protein kinase C. Biochem J 2000; 350: 149-154.
[16] Singh AK, Amlal H, Haas PJ, Dringenberg U, Fussell S, Barone SL, Engelhardt R, Zuo J, Se-idler U, Soleimani M. Fructose-induced hyper-tension: essential role of chloride and fructose absorbing transporters PAT1 and Glut5. Kid-ney Int 2008; 74: 438-447.
[17] Soleimani M, Alborzi P. The role of salt in the pathogenesis of fructose-induced hyperten-sion. Int J Nephrol 2011; 2011: 392708.
[18] Liu Y, Rafferty TM, Rhee SW, Webber JS, Song L, Ko B, Hoover RS, He B, Mu S. CD8+ T cells stimulate Na-Cl co-transporter NCC in distal convoluted tubules leading to salt-sensitive hy-pertension. Nat Commun 2017; 8: 14037.
[19] Jha JC, Gray SP, Barit D, Okabe J, El-Osta A, Namikoshi T, Thallas-Bonke V, Wingler K, Szyn-dralewiez C, Heitz F, Touyz RM, Cooper ME, Schmidt HH, Jandeleit-Dahm KA. Genetic tar-geting or pharmacologic inhibition of NADPH
oxidase nox4 provides renoprotection in long-term diabetic nephropathy. J Am Soc Nephrol 2014; 25: 1237-1254.
[20] Lassila M, Seah KK, Allen TJ, Thallas V, Thom-as MC, Candido R, Burns WC, Forbes JM, Calkin AC, Cooper ME, Jandeleit-Dahm KA. Ac-celerated nephropathy in diabetic apolipopro-tein e-knockout mouse: role of advanced glyca-tion end products. J Am Soc Nephrol 2004; 15: 2125-2138.
[21] Rafiq K, Noma T, Fujisawa Y, Ishihara Y, Arai Y, Nabi AH, Suzuki F, Nagai Y, Nakano D, Hitomi H, Kitada K, Urushihara M, Kobori H, Kohno M, Nishiyama A. Renal sympathetic denervation suppresses de novo podocyte injury and albu-minuria in rats with aortic regurgitation. Circu-lation 2012; 125: 1402-1413.
[22] Nishiyama A, Kobori H, Konishi Y, Morikawa T, Maeda I, Okumura M, Kishida M, Hamada M, Nagai Y, Nakagawa T, Ohashi N, Nakano D, Hi-tomi H, Imanishi M. Mineralocorticoid receptor blockade enhances the antiproteinuric effect of an angiotensin II blocker through inhibiting podocyte injury in type 2 diabetic rats. J Phar-macol Exp Ther 2010; 332: 1072-1080.
[23] Holmes E, Li JV, Marchesi JR, Nicholson JK. Gut microbiota composition and activity in relation to host metabolic phenotype and disease risk. Cell Metab 2012; 16: 559-564.
[24] Lees HJ, Swann JR, Wilson ID, Nicholson JK, Holmes E. Hippurate: the natural history of a mammalian-microbial cometabolite. J Pro-teome Res 2013; 12: 1527-1546.
[25] Martin FP, Wang Y, Sprenger N, Yap IK, Lundst-edt T, Lek P, Rezzi S, Ramadan Z, van Bladeren P, Fay LB, Kochhar S, Lindon JC, Holmes E, Nicholson JK. Probiotic modulation of symbi-otic gut microbial-host metabolic interactions in a humanized microbiome mouse model. Mol Syst Biol 2008; 4: 157.
[26] Zhang ZH, Wei F, Vaziri ND, Cheng XL, Bai X, Lin RC, Zhao YY. Metabolomics insights into chron-ic kidney disease and modulatory effect of rhu-barb against tubulointerstitial fibrosis. Sci Rep 2015; 5: 14472.
[27] Sigman-Grant M, Morita J. Defining and inter-preting intakes of sugars. Am J Clin Nutr 2003; 78: 815S-826S.
[28] Wolf G. The effect of fasting and fructose and glucose infusion on gluconeogenesis and tri-ose phosphate flux in rats in vivo. Nutr Rev 1995; 53: 299-301.
[29] Sun YJ, Wang HP, Liang YJ, Yang L, Li W, Wu YJ. An NMR-based metabonomic investigation of the subacute effects of melamine in rats. J Pro-teome Res 2012; 11: 2544-2550.
[30] Nakayama T, Kosugi T, Gersch M, Connor T, Sanchez-Lozada LG, Lanaspa MA, Roncal C, Perez-Pozo SE, Johnson RJ, Nakagawa T. Di-
Urinary metabonomics and fructose-induced kidney injury
6673 Int J Clin Exp Med 2018;11(7):6662-6673
etary fructose causes tubulointerstitial injury in the normal rat kidney. Am J Physiol Renal Physiol 2010; 298: F712-720.
[31] Nicholson JK, Holmes E, Wilson ID. Gut micro-organisms, mammalian metabolism and per-sonalized health care. Nat Rev Microbiol 2005; 3: 431-438.
[32] Wang Z, Klipfell E, Bennett BJ, Koeth R, Levi-son BS, Dugar B, Feldstein AE, Britt EB, Fu X, Chung YM, Wu Y, Schauer P, Smith JD, Allayee H, Tang WH, DiDonato JA, Lusis AJ, Hazen SL. Gut flora metabolism of phosphatidylcholine promotes cardiovascular disease. Nature 2011; 472: 57-63.
[33] Hauet T, Gibelin H, Godart C, Eugene M, Car-retier M. Kidney retrieval conditions influence damage to renal medulla: evaluation by proton nuclear magnetic resonance (NMR) pectros-copy. Clin Chem Lab Med 2000; 38: 1085-1092.
[34] Hauet T, Gibelin H, Richer JP, Godart C, Eugene M, Carretier M. Influence of retrieval condi-tions on renal medulla injury: evaluation by proton NMR spectroscopy in an isolated per-fused pig kidney model. J Surg Res 2000; 93: 1-8.
[35] Holmes E, Li JV, Athanasiou T, Ashrafian H, Nicholson JK. Understanding the role of gut microbiome-host metabolic signal disruption in health and disease. Trends Microbiol 2011; 19: 349-359.
[36] Calvani R, Miccheli A, Capuani G, Tomassini Miccheli A, Puccetti C, Delfini M, Iaconelli A, Nanni G, Mingrone G. Gut microbiome-derived metabolites characterize a peculiar obese uri-nary metabotype. Int J Obes (Lond) 2010; 34: 1095-1098.
[37] Posada-Ayala M, Zubiri I, Martin-Lorenzo M, Sanz-Maroto A, Molero D, Gonzalez-Calero L, Fernandez-Fernandez B, de la Cuesta F, Laborde CM, Barderas MG, Ortiz A, Vivanco F, Alvarez-Llamas G. Identification of a urine me-tabolomic signature in patients with advanced-stage chronic kidney disease. Kidney Int 2014; 85: 103-111.
[38] Wyss M, Kaddurah-Daouk R. Creatine and cre-atinine metabolism. Physiol Rev 2000; 80: 1107-1213.
Urinary metabonomics and fructose-induced kidney injury
1
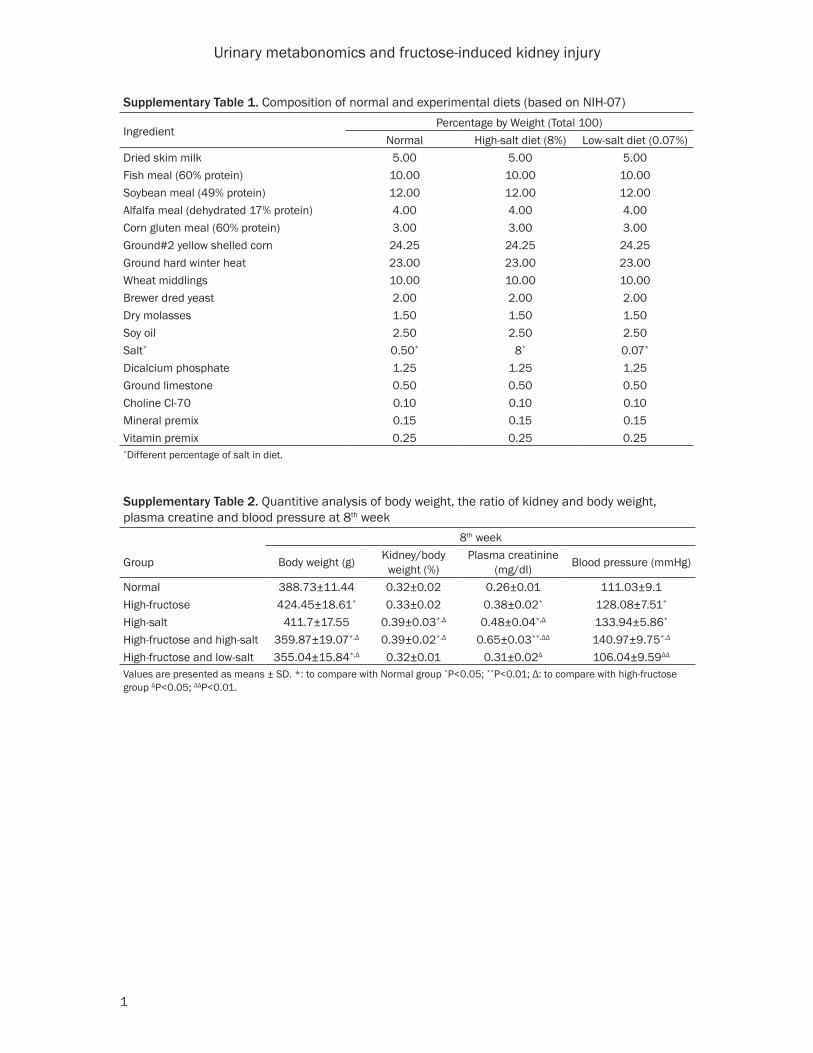
Supplementary Table 1. Composition of normal and experimental diets (based on NIH-07)
IngredientPercentage by Weight (Total 100)
Normal High-salt diet (8%) Low-salt diet (0.07%)Dried skim milk 5.00 5.00 5.00Fish meal (60% protein) 10.00 10.00 10.00Soybean meal (49% protein) 12.00 12.00 12.00Alfalfa meal (dehydrated 17% protein) 4.00 4.00 4.00Corn gluten meal (60% protein) 3.00 3.00 3.00Ground#2 yellow shelled corn 24.25 24.25 24.25Ground hard winter heat 23.00 23.00 23.00Wheat middlings 10.00 10.00 10.00Brewer dred yeast 2.00 2.00 2.00Dry molasses 1.50 1.50 1.50Soy oil 2.50 2.50 2.50Salt* 0.50* 8* 0.07*
Dicalcium phosphate 1.25 1.25 1.25Ground limestone 0.50 0.50 0.50Choline Cl-70 0.10 0.10 0.10Mineral premix 0.15 0.15 0.15Vitamin premix 0.25 0.25 0.25*Different percentage of salt in diet.
Supplementary Table 2. Quantitive analysis of body weight, the ratio of kidney and body weight, plasma creatine and blood pressure at 8th week
8th week
Group Body weight (g) Kidney/body weight (%)
Plasma creatinine (mg/dl) Blood pressure (mmHg)
Normal 388.73±11.44 0.32±0.02 0.26±0.01 111.03±9.1High-fructose 424.45±18.61* 0.33±0.02 0.38±0.02* 128.08±7.51*
High-salt 411.7±17.55 0.39±0.03*,Δ 0.48±0.04*,Δ 133.94±5.86*
High-fructose and high-salt 359.87±19.07*,Δ 0.39±0.02*,Δ 0.65±0.03**,ΔΔ 140.97±9.75*,Δ
High-fructose and low-salt 355.04±15.84*,Δ 0.32±0.01 0.31±0.02Δ 106.04±9.59ΔΔ
Values are presented as means ± SD. *: to compare with Normal group *P<0.05; **P<0.01; Δ: to compare with high-fructose group ΔP<0.05; ΔΔP<0.01.