Embed Size (px)
Citation preview
JOURNAL OF CHEMICAL PHYSICS VOLUME 119, NUMBER 3 15 JULY 2003
Origin of particle clustering in a simulated polymer nanocompositeand its impact on rheology
Francis W. Starra) and Jack F. DouglasPolymers Division and Center for Theoretical and Computational Materials Science,National Institute of Standards and Technology, Gaithersburg, Maryland 20899
Sharon C. GlotzerDepartments of Chemical Engineering and Materials Science and Engineering, University of Michigan,Ann Arbor, Michigan 48109
~Received 19 February 2003; accepted 15 April 2003!
Many nanoparticles have short-range interactions relative to their size, and these interactions tend tobe ‘‘patchy’’ since the interatomic spacing is comparable to the nanoparticle size. For a dispersionof such particles, it is nota priori obvious what mechanism will control the clustering of thenanoparticles, and how the clustering will be affected by tuning various control parameters. To gaininsight into these questions, we perform molecular dynamics simulations of polyhedralnanoparticles in a dense bead–spring polymer melt under both quiescent and steady shearconditions. We explore the mechanism that controls nanoparticle clustering and find that thecrossover from dispersed to clustered states is consistent with the predictions for equilibriumparticle association or equilibrium polymerization, and that the crossover does not appear to matchthe expectations for first-order phase separation typical for binary mixtures in the region of the phasediagram where we can equilibrate the system. At the same time, we cannot rule out the possibilityof phase separation at a lower temperature. Utilizing the existing framework for dynamic clusteringtransitions offers the possibility of more rationally controlling the dispersion and properties ofnanocomposite materials. Finally, we examine how nanocomposite rheology depends on the state ofequilibrium clustering. We find that the shear viscosity for dispersed configurations is larger thanthat for clustered configurations, in contrast to expectations based on macroscopic colloidaldispersions. We explain this result by the alteration of the polymer matrix properties in the vicinityof the nanoparticles. We also show that shear tends to disperse clustered nanoparticle configurationsin our system, an effect particularly important for processing. ©2003 American Institute ofPhysics. @DOI: 10.1063/1.1580099#
omicn-
ntrieme
hegt. AnoonThclela
testhela-y-tem-,no-
icleay
ob-
ds-
itesom
aid
ns,troltiseow
I. INTRODUCTION
The rapidly expanding study of organic/inorganic nancomposite materials offers the possibility of substantial iprovements in material properties, ranging from mechanto electrical properties, with only very small amounts of iorganic additive dispersed in an organic matrix.1–3 Disper-sion of nanoparticles—such as platelike nanoclays, natubes, or polyhedral nanoparticles—into a polymeric macan have a tremendous impact on the properties of polymmaterials. Unfortunately, it often has proved difficult to forstable dispersions of nanoparticles in polymer matricslowing the rate of progress.
The proper characterization of these materials is furtcomplicated by the fact that the physically relevant lenscales range from macroscopic to molecular dimensionsa result, simulations, or an analytic solution, of model nasystems that provide insight into basic scientific questiand processes are an important tool to be exploited.experimental complications that make quantifying partidispersion challenging pose no barrier to molecular simu
a!Present address: Department of Physics, Wesleyan University, MiddletCT 06459. Electronic mail: [email protected]
1770021-9606/2003/119(3)/1777/12/$20.00
Downloaded 03 Jul 2003 to 129.6.153.90. Redistribution subject to AIP
--al
o-xric
s,
rhs-se
-
tions, which offer direct access to the particle coordinafrom which the state of dispersion can be obtained andmolecular factors that control dispersion elucidated. Simutions thus provide an opportunity to quantify how thermodnamic and processing variables or parameters, such asperatureT, loadingf, particle–polymer interaction strengthand shear, affect the state of dispersion and the bulk nacomposite properties. Moreover, we expect that the partclustering strongly affects nanocomposite properties and mbe an example of ubiquitous clustering phenomena—asserved in natural materials~e.g., wool, silk, cotton!, biologi-cal systems~e.g., actin and fibrin!, and traditional condensephase materials~e.g., thermo-reversible gels, colloidal supensions, equilibrium polymerization!.4–7 Hence it is valu-able to analyze how clustering properties of nanocomposfit in this broad range of systems, so that knowledge frthese seemingly unrelated systems can be integrated tothe development of new nanostructured materials.
Given the range of possible nanoparticle interactiothere are a variety of possible mechanisms that might conthe clustering and dispersion of nanoparticles. It is noapriori clear whether nanoparticle clustering should arfrom ordinary phase separation~first-order for noncriticaln,
7 © 2003 American Institute of Physics
license or copyright, see http://ojps.aip.org/jcpo/jcpcr.jsp
as,ocaye
lepr
degi
anla
lt
lero
icl
tem
diurWthogtio
uos
nsin
plelibreprieheics
iboh-
aradofne
sout-a a
andeencific
ep-un-e
ahe-ture
s ofr-lvegeicss.e-
try,cesosa-s ofea-r-on
s of
areedhe
ter
achtral
silyrredthe
the
a
1778 J. Chem. Phys., Vol. 119, No. 3, 15 July 2003 Starr, Douglas, and Glotzer
concentrations! as is common in binary mixtures, or fromdynamic clustering, as in the self-organization of micelle8
that does not involve any thermodynamic discontinuity,from some other unexpected mechanism. Simulationhelp to distinguish the mechanism for dispersion in such stems, within the limitation of the model complexity and thtime and length scales accessible.
Previous simulations have elucidated the detaichanges in structure and dynamics that occur near a nanoticle surface9–12 and possible mechanisms foreinforcement,13 and theoretical approaches used to mocolloidal systems have been adapted to predict morpholoof claylike nanocomposites.14 Building on these works, wefocus our attention on characterizing particle dispersionbulk composite properties using molecular dynamics simutions of model nanoparticles embedded in a dense meunentangled polymers. To capture the qualitative effectsatomic structure, the model nanoparticle consists of a coltion of force sites bonded together to form an icosahedparticle, whose diameter is roughly equal to the radiusgyration of the surrounding chains. This model nanopartresembles a C60 ‘‘Buckyball,’’ but with fewer facets. Weprobe the effect off, T, and interaction strength on the staof particle dispersion. In doing so, we use specific heat, cobined with the potential energy, as a reliable metric to incate the state of dispersion; similar experimental measments may also be sensitive to particle clustering.carefully characterize the particle clustering to determinemechanism of dispersion. Our results suggest that the crover between clustered and dispersed states is not analoto the phase separation of a binary mixture, which we ranalize by comparing with C60 and colloidal systems.15,16Thenanoparticles appear to undergo a reversible and contincrossover from dispersed to clustered states. The featurethe clustering, such as the specific heat behavior, are cotent with the theoretical predictions made for the clustertransition that occurs in equilibrium polymerization,17 pro-viding a link between nanocomposite dispersion and simthermoreversible clustering transitions. By shearing equirium systems where the nanoparticles are initially clusteor dispersed, we show how shear effects the state of dission, and hence the positions of the clustering boundaWe also find that significant differences in viscosity of tnanocomposite only appear at relatively high loading, whwe speculate may be related to geometrical considerationthe nanoparticle filler.
We organize the paper as follows: In Sec. II we descrthe details of the simulation model and method. We focusquantifying the factors that affect dispersion and the mecnism controlling clustering in Sec. III. In Sec. IV we consider the effects of shear on the nanocomposite and thesulting rheological properties.
II. SIMULATIONS
We perform molecular dynamics simulations of nanopticles in a dense polymer melt. We use a well-studied bespring model18–20 which models polymers as chainsmonomers. All monomer pairs interact via a Lennard-Jo~LJ! potentialULJ that has been truncated at 2.5s, wheres is
Downloaded 03 Jul 2003 to 129.6.153.90. Redistribution subject to AIP
rn
s-
dar-
les
d-
ofofc-alfe
--e-ee
ss-ous-
usofis-g
r-d
er-s.
hof
ena-
re-
-–
s
the length scale parameter of the LJ potential, and shiftedthat the potential and force both smoothly vanish at the coff. Bonded monomers along a chain are connected vifinitely extensible, nonlinear elastic~FENE! spring potential,
UFENE~r !52k~R02/2!ln„12~r /R0!2
…, ~1!
wherer is the distance between neighboring monomers,k530 andR051.5 are adjustable parameters that have bchosen as in Ref. 9. Since we do not aim to study a spepolymer, we use reduced units in whichm5s5«51 ~« isthe LJ energy parameter andm is the monomer mass!. Simi-larly, the length is in units ofs, the time in units ofsAm/«,and the temperature in units of«/kB (kB is Boltzmann’s con-stant!. In a number of the figures, we use error bars to rresent the statistical uncertainty in the calculations; thesecertainties are obtained from fluctuations of the timaverages.
In prior work,9 a single nanoparticle was modeled ascollection of 356 LJ particles bonded together in an icosadral geometry. This geometry was chosen in order to capgeneral features typical of both traditional filler particles,1,21
such as a primary carbon black particle, and nanoparticlepolyhedral geometry.2,22–25 To study many such nanopaticles in a dense melt at a reasonable loading would invoO(105) particles, and hence would require extremely laramounts of CPU time, particularly given the slow dynaminvolved in clustering or dispersing of the nanoparticleWhile this is feasible for a few select systems, it would sverely limit the scope of parameters we can explore.
As a compromise, we maintain icosahedral geomebut use only 13 LJ particles—one at each of the 12 vertiof the icosahedron, and one at the center. The resulting ichedron has a diameter approximately equal to the radiugyration of the chains comprising the melt. Assuming a rsonable value fors'1 nm, this corresponds to a nanopaticle with an approximate diameter of 3 nm. The interactistrength between nanoparticle sites is«pp52, and the inter-action strength between the particle sites and monomerthe chains«mp is varied to explore the role of polymer–nanoparticle interactions on clustering. Similar resultspossible by holding polymer–nanoparticle interactions fixwhile varying the interactions between nanoparticles. Tdominant factor controlling clustering is the ratio«mp/«pp;however, the details will depend on which parameis varied.
To maintain the icosahedral shape, the particle at evertex is bonded to the 5 neighboring vertices and the cenparticle via a harmonic spring potential,
Uharm5kr 02/2~r /r 021!2. ~2!
Between vertices, we take the bond strengthk560 and thepreferred bond lengthr 0 we take to be the minimum of theforce-shifted Lennard-Jones potential, approximately 21/6.We choose the harmonic potential because it allows to eachoose the preferred bond distance to equal the prefeLennard-Jones distance, further ensuring the stability oficosahedral shape. For bonds between the vertices andcentral particle, we use Eq.~2! with the same value ofk, butto maintain the geometry of the icosahedron we use
license or copyright, see http://ojps.aip.org/jcpo/jcpcr.jsp
-.7sdfe
1779J. Chem. Phys., Vol. 119, No. 3, 15 July 2003 Particle clustering in a polymer composite
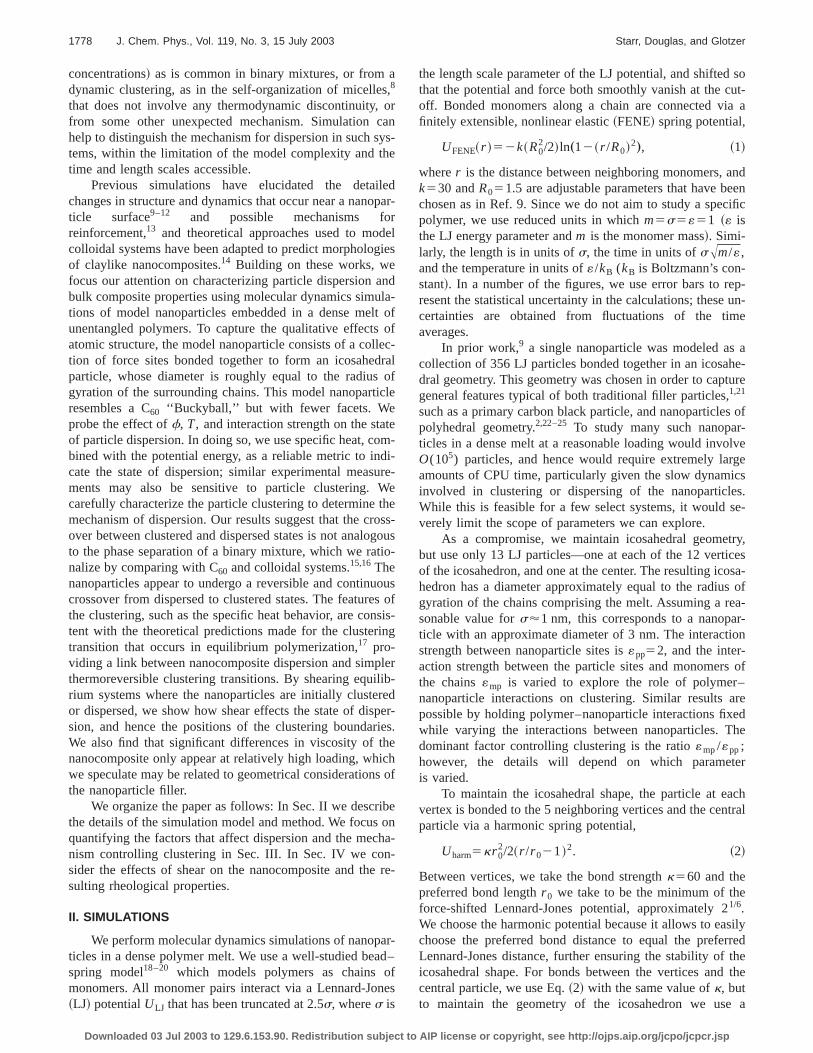
FIG. 1. ~Color! Color map of thevalue of the nanoparticle potential energy for a test monomer a distance 1from the particle center. Low energy iblue, and high energy is red. The reregions coincide with the location othe particles at the vertices, while th‘‘sticky’’ blue regions correspond tocenters of faces of the nanoparticle.
o
e
ncsslotepainn
saericluir-
vebil
04
hanh
he
o-to
dlyin
ili-la-
for
uili-ofr-ionareer,d ton re-
ible
slightly smaller preferred bond length, equal to the radiusthe sphere circumscribed around the icosahedronr 0851/4(1012A5)1/2r 0 . The resulting particles have somflexibility, but are largely rigid.
While these particles are highly symmetric, the preseof discrete force sites at the vertices results in ‘‘patchineof the nanoparticle surface, as illustrated in Fig. 1 by a comap of the potential between the nanoparticle and amonomer a distance of 1.7 from the center of the nanoticle. We expect such patchiness for real nanoparticles sthe interatomic spacing of the constituent atoms of the naparticle is significant compared with its size. For the icohedral nanoparticles we model, this leads to a relative enminimum when a monomer of a chain or other nanopartapproaches the center of a face of the icosahedron. Liqwith such directional interactions often exhibit rich clusteing and association properties, as we will report here. Githe polyhedral structure and van der Waals interactionstween nanoparticles, we expect their properties to be simto those of C60 Buckyballs.
We simulate systems with 400 chains ofM510 mono-mers each~a total ofN54000 monomers! containing 15, 32,64, or 125 nanoparticles, corresponding to a loading 0.,f,0.289; we definef[Np /(N1Np), whereNp is thetotal number of force sites comprising the nanoparticles. Tsystems are prepared by first equilibrating the pure melt,subsequently growing cavities with cubic symmetry throug
Downloaded 03 Jul 2003 to 129.6.153.90. Redistribution subject to AIP
f
e’’rstr-ceo--gyeds
ne-ar
6
ed-
out the melt into which the nanoparticles are inserted. Tsystem is then allowed to relax to temperatureT52.0 andpressureP51.0, where the desiredP andT are obtained byusing the simple Berendsen scaling method.27 We choose arelatively highT because the time scale on which the nanparticles cluster or disperse is extremely long comparedthe diffusion time of the monomers, which increases rapiwith decreasingT. From this equilibration phase, we obtathe average densityr& at aT51 andP51.
We run subsequent production simulations at a fixedr,corresponding tor& obtained in the constant pressure equbration step. Hence, the results we report are NVT simutions with ^P&NVT51.0, andT is controlled using the Nose–Hoover method ~details below!. These equilibratedconfigurations are also used as starting configurationsdifferent T at the samef and«mp; we must repeat both thethermal and pressure relaxation to achieve the new eqbrated state. Equilibration typically requires a minimum107 time steps even at highT, because the dynamics of paticle clustering or dispersion are extremely slow. Productruns to gather thermodynamic or dynamic propertiestypically just as long, and sometimes significantly longsince large fluctuations near the crossover from disperseclustered states require very large data samples to obtailiable time averages.
The equations of motion are integrated via the reversreference system propagator algorithm~rRESPA!, a multiple
license or copyright, see http://ojps.aip.org/jcpo/jcpcr.jsp
o
nrcth-
cet
iu
ous
stulsib
es
acnncb
erisewanntisiza
, p
iclpale
ix-
onif-isrr
n
ainoce
en-
n-
iall
ustdg
, re-
our
ow a
thetail
ons
s-tions,
e-
a-lying
rgyle
ate
1780 J. Chem. Phys., Vol. 119, No. 3, 15 July 2003 Starr, Douglas, and Glotzer
time step algorithm to improve simulation speed;26 we use abasic time step of 0.002, and use a velocity Verlet versionrRESPA with the forces separated into bonded~fast! andnonbonded~slow! components. For each update of the nobonded forces, there are three updates of the bond foThe temperature in production runs is controlled usingNose–Hoover method.27 We select the ‘‘mass’’ of the thermostatQ56NT/v2 where v5234.09 is the intrinsic fre-quency obtained from a theoretical calculation for a facentered cubic LJ system,28 a natural frequency for the heabath. To study the effects of shear, we use a nonequilibrmolecular dynamics~NEMD! algorithm that solves theSLLOD equations of motion for a system under planar Cette flow.29 We limit ourselves to relatively low shear rateg&0.5 since larger shear rates require a very small timeto avoid breaking polymer bonds, which causes the simtion to be unstable. Such effects can also be avoided by ua stronger coupling constant in the FENE bond potential,this again requires the use of very small time steps.30 TheNEMD runs vary in length from 23106 at high shear rateswhere viscosity fluctuations are small, to 107 time steps atlow shear rates where long runs are needed to reliablymate viscosity.
III. NANOPARTICLE DISPERSION
A. Quantifying dispersion
The state of dispersion is affected by a number of ftors, including particle loading, interparticle interactions, atemperature. Before we can explore the relative importaof these control parameters, we first must have a reliametric to determine the state of dispersion. Indeed, a genreliable, and simple measurement of particle dispersionsignificant experimental barrier to the development of nnanoparticle materials. In the context of simulations, we cnot solve this problem, but we can offer some insights iquantities that are significantly affected by the state of dpersion. Below, we show that dispersion can be characterboth by structural criteria, such as scattering functions,well as thermodynamic measures, such as specific heattentially accessible to experiments.
The most obvious way to determine the state of partdispersion is visual; since we have direct access to theticle coordinates, we can easily visualize the nanoparticwithout the distraction of the surrounding polymer matrWhile this is the ‘‘ultimate’’ test we use, our aim is to identify a simple and reliable measure of particle dispersiGiven that the morphology of the system is significantly dferent for clustered and dispersed states, one possibilityuse an explicit measure of structure, such as the pair colation functiong(r ) or the structure factorS(q) ~which arerelated via a Fourier transform!. While we will consider thebehavior of such measures, our goal is to use a singlemerical value representative of the degree of clustering.
Computer simulations of simple liquids have shown ththe potential energyU is strongly sensitive to changeslocal packing.31 Simulation offers the advantage that the ptential energy, including the components due to each spein the system, is readily available. As the degree of disp
Downloaded 03 Jul 2003 to 129.6.153.90. Redistribution subject to AIP
f
-es.e
-
m
-
epa-ngut
ti-
-de
leic,a
-o-edso-
er-s
.
.
toe-
u-
t
-iesr-
sion changes, the most significant changes in potentialergy are expected in the particle–particleUpp and monomer–particleUmp components ofU, which reflect the differencein the number of particle–particle or particle–monomer cotacts in the system. We will focus onUpp, sensitive to thenumber of particle–particle contacts. To remove trivchanges inUpp due to changingf we focus on the potentiaenergy per force siteupp[Upp/Np .
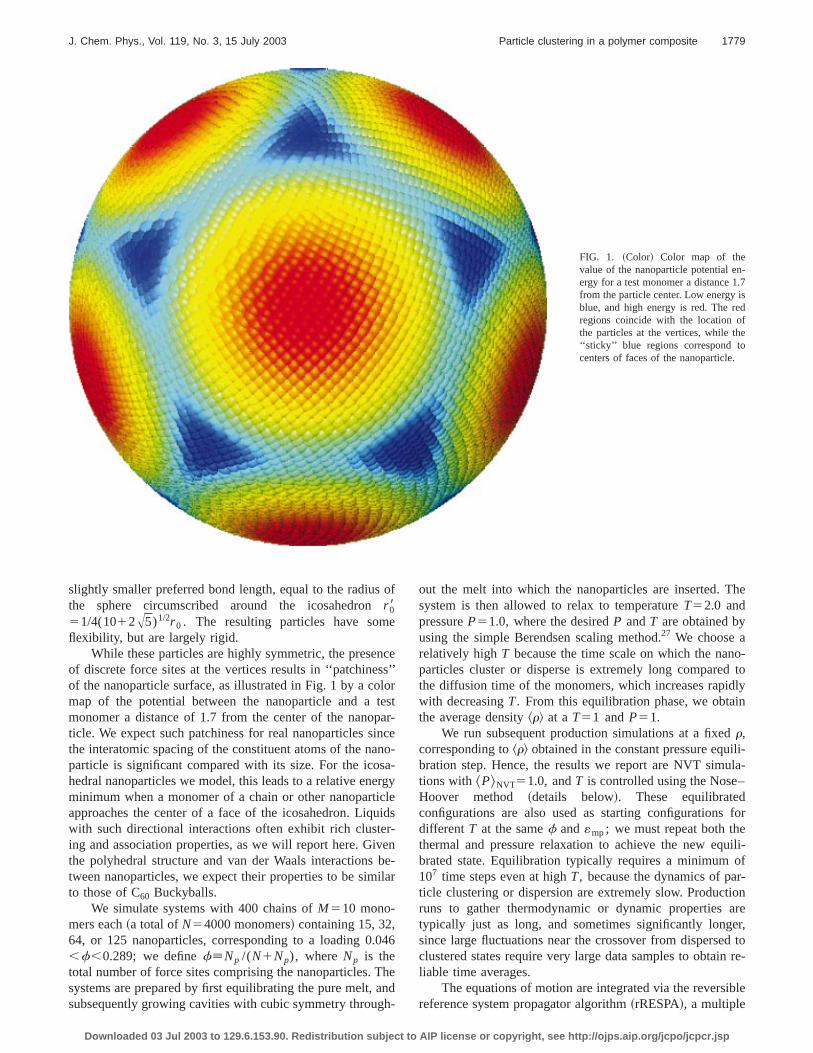
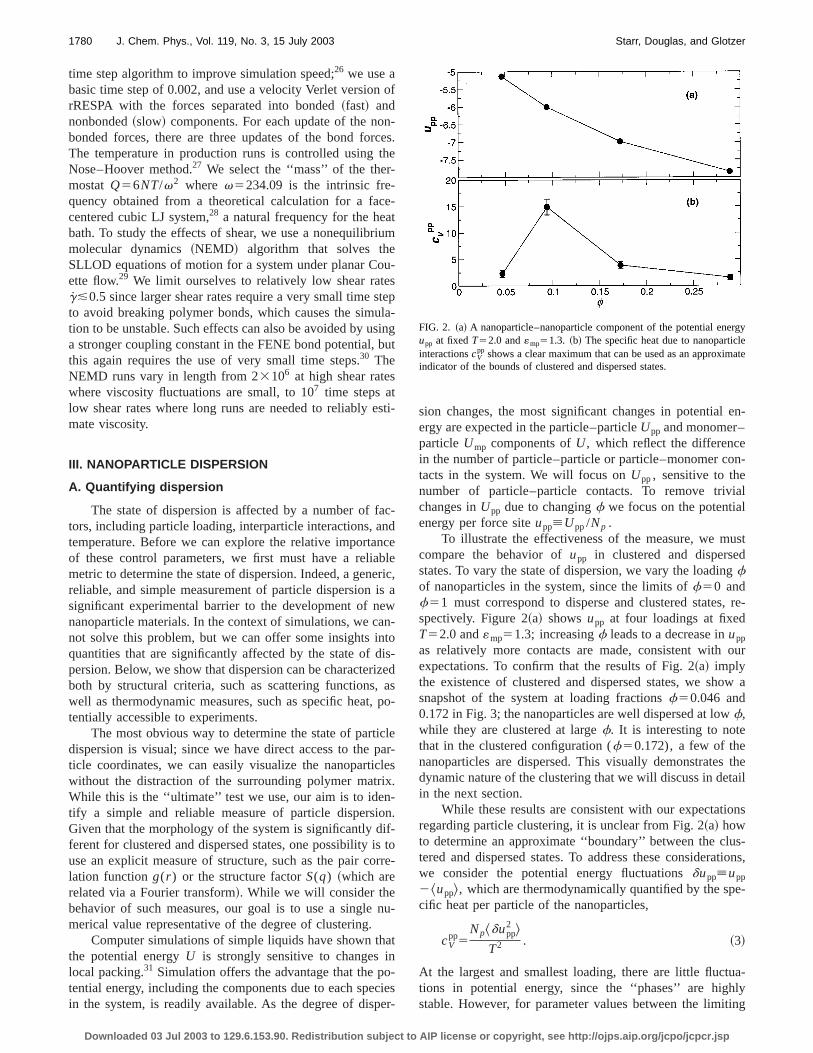
To illustrate the effectiveness of the measure, we mcompare the behavior ofupp in clustered and dispersestates. To vary the state of dispersion, we vary the loadinfof nanoparticles in the system, since the limits off50 andf51 must correspond to disperse and clustered statesspectively. Figure 2~a! showsupp at four loadings at fixedT52.0 and«mp51.3; increasingf leads to a decrease inupp
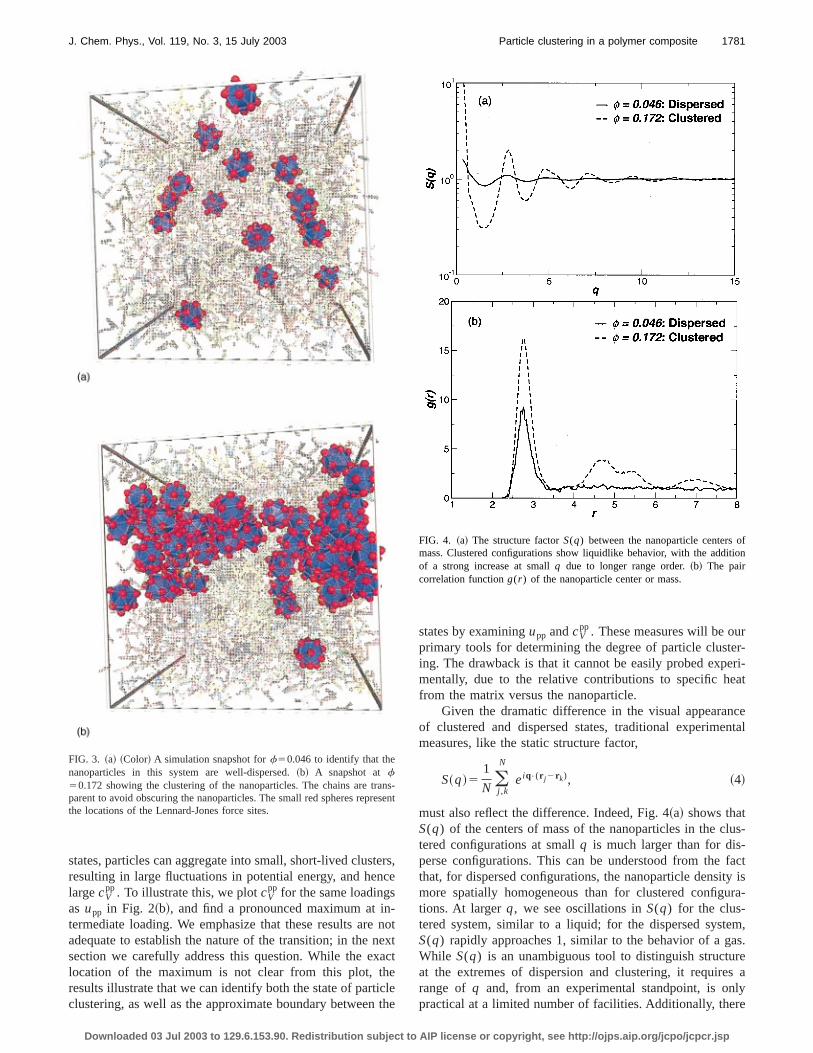
as relatively more contacts are made, consistent withexpectations. To confirm that the results of Fig. 2~a! implythe existence of clustered and dispersed states, we shsnapshot of the system at loading fractionsf50.046 and0.172 in Fig. 3; the nanoparticles are well dispersed at lowf,while they are clustered at largef. It is interesting to notethat in the clustered configuration (f50.172), a few of thenanoparticles are dispersed. This visually demonstratesdynamic nature of the clustering that we will discuss in dein the next section.
While these results are consistent with our expectatiregarding particle clustering, it is unclear from Fig. 2~a! howto determine an approximate ‘‘boundary’’ between the clutered and dispersed states. To address these considerawe consider the potential energy fluctuationsdupp[upp
2^upp&, which are thermodynamically quantified by the spcific heat per particle of the nanoparticles,
cVpp5
Np^dupp2 &
T2 . ~3!
At the largest and smallest loading, there are little fluctutions in potential energy, since the ‘‘phases’’ are highstable. However, for parameter values between the limit
FIG. 2. ~a! A nanoparticle–nanoparticle component of the potential eneupp at fixedT52.0 and«mp51.3. ~b! The specific heat due to nanoparticinteractionscV
pp shows a clear maximum that can be used as an approximindicator of the bounds of clustered and dispersed states.
license or copyright, see http://ojps.aip.org/jcpo/jcpcr.jsp
tenc
-
neae
iclt
rer-eri-at
cental
us-
facty isra-
m,as.res alye
anes
oftion
1781J. Chem. Phys., Vol. 119, No. 3, 15 July 2003 Particle clustering in a polymer composite
states, particles can aggregate into small, short-lived clusresulting in large fluctuations in potential energy, and helargecV
pp. To illustrate this, we plotcVpp for the same loadings
as upp in Fig. 2~b!, and find a pronounced maximum at intermediate loading. We emphasize that these results areadequate to establish the nature of the transition; in thesection we carefully address this question. While the exlocation of the maximum is not clear from this plot, thresults illustrate that we can identify both the state of partclustering, as well as the approximate boundary between
FIG. 3. ~a! ~Color! A simulation snapshot forf50.046 to identify that thenanoparticles in this system are well-dispersed.~b! A snapshot atf50.172 showing the clustering of the nanoparticles. The chains are trparent to avoid obscuring the nanoparticles. The small red spheres reprthe locations of the Lennard-Jones force sites.
Downloaded 03 Jul 2003 to 129.6.153.90. Redistribution subject to AIP
rs,e
notxtct
ehe
states by examiningupp andcVpp. These measures will be ou
primary tools for determining the degree of particle clusting. The drawback is that it cannot be easily probed expmentally, due to the relative contributions to specific hefrom the matrix versus the nanoparticle.
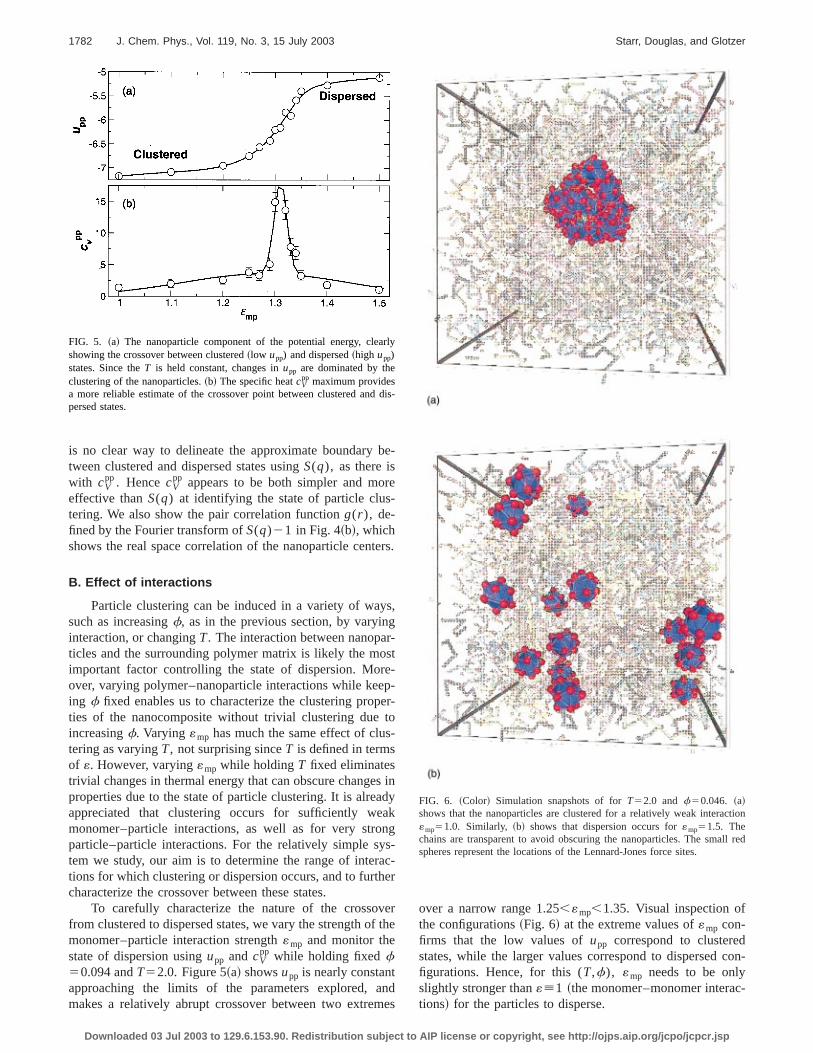
Given the dramatic difference in the visual appearanof clustered and dispersed states, traditional experimemeasures, like the static structure factor,
S~q!51
N (j ,k
N
eiq•(r j 2rk), ~4!
must also reflect the difference. Indeed, Fig. 4~a! shows thatS(q) of the centers of mass of the nanoparticles in the cltered configurations at smallq is much larger than for dis-perse configurations. This can be understood from thethat, for dispersed configurations, the nanoparticle densitmore spatially homogeneous than for clustered configutions. At largerq, we see oscillations inS(q) for the clus-tered system, similar to a liquid; for the dispersed systeS(q) rapidly approaches 1, similar to the behavior of a gWhile S(q) is an unambiguous tool to distinguish structuat the extremes of dispersion and clustering, it requirerange of q and, from an experimental standpoint, is onpractical at a limited number of facilities. Additionally, ther
s-ent
FIG. 4. ~a! The structure factorS(q) between the nanoparticle centersmass. Clustered configurations show liquidlike behavior, with the addiof a strong increase at smallq due to longer range order.~b! The paircorrelation functiong(r ) of the nanoparticle center or mass.
license or copyright, see http://ojps.aip.org/jcpo/jcpcr.jsp
b
re-
te
ysgr-sepeto
s-
sadan
ysace
vef t
nm
con-
-
rl
d
tion
ll red
1782 J. Chem. Phys., Vol. 119, No. 3, 15 July 2003 Starr, Douglas, and Glotzer
is no clear way to delineate the approximate boundarytween clustered and dispersed states usingS(q), as there iswith cV
pp. HencecVpp appears to be both simpler and mo
effective thanS(q) at identifying the state of particle clustering. We also show the pair correlation functiong(r ), de-fined by the Fourier transform ofS(q)21 in Fig. 4~b!, whichshows the real space correlation of the nanoparticle cen
B. Effect of interactions
Particle clustering can be induced in a variety of wasuch as increasingf, as in the previous section, by varyininteraction, or changingT. The interaction between nanopaticles and the surrounding polymer matrix is likely the moimportant factor controlling the state of dispersion. Morover, varying polymer–nanoparticle interactions while keeing f fixed enables us to characterize the clustering propties of the nanocomposite without trivial clustering dueincreasingf. Varying «mp has much the same effect of clutering as varyingT, not surprising sinceT is defined in termsof «. However, varying«mp while holdingT fixed eliminatestrivial changes in thermal energy that can obscure changeproperties due to the state of particle clustering. It is alreappreciated that clustering occurs for sufficiently wemonomer–particle interactions, as well as for very stroparticle–particle interactions. For the relatively simple stem we study, our aim is to determine the range of intertions for which clustering or dispersion occurs, and to furthcharacterize the crossover between these states.
To carefully characterize the nature of the crossofrom clustered to dispersed states, we vary the strength omonomer–particle interaction strength«mp and monitor thestate of dispersion usingupp and cV
pp while holding fixedf50.094 andT52.0. Figure 5~a! showsupp is nearly constantapproaching the limits of the parameters explored, amakes a relatively abrupt crossover between two extre
FIG. 5. ~a! The nanoparticle component of the potential energy, cleashowing the crossover between clustered~low upp) and dispersed~high upp)states. Since theT is held constant, changes inupp are dominated by theclustering of the nanoparticles.~b! The specific heatcV
pp maximum providesa more reliable estimate of the crossover point between clustered andpersed states.
Downloaded 03 Jul 2003 to 129.6.153.90. Redistribution subject to AIP
e-
rs.
,
t--r-
iny
kg--r
rhe
des
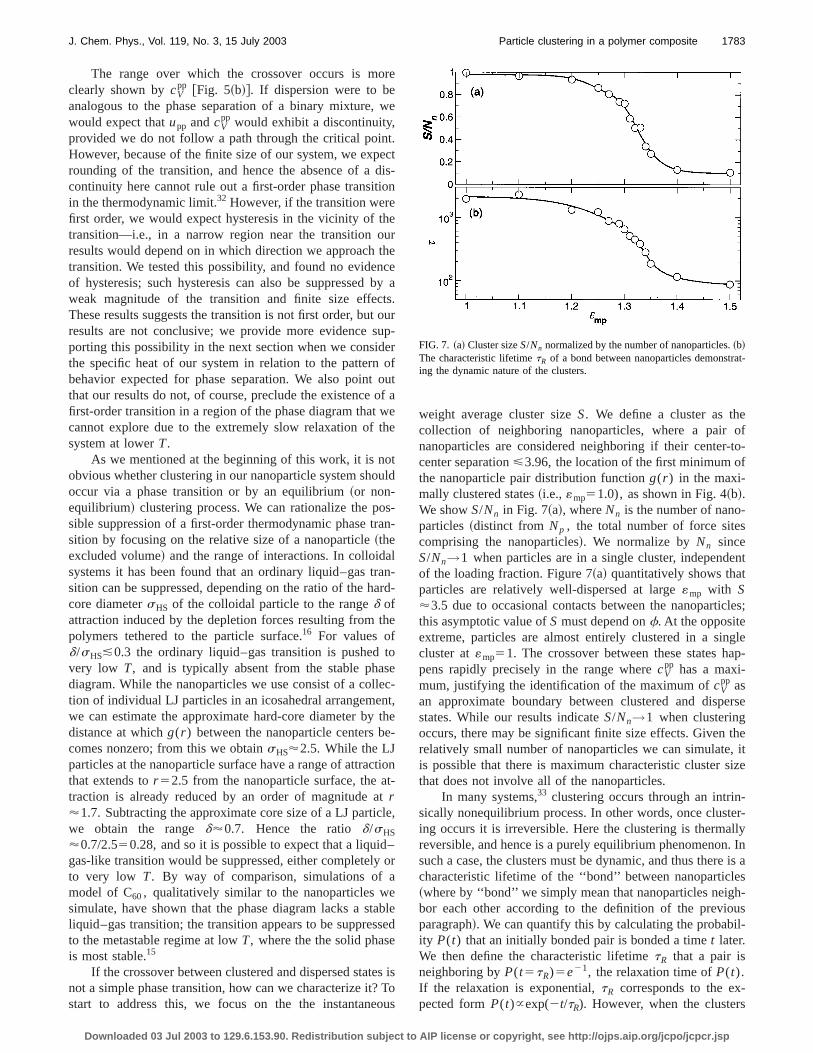
over a narrow range 1.25,«mp,1.35. Visual inspection ofthe configurations~Fig. 6! at the extreme values of«mp con-firms that the low values ofupp correspond to clusteredstates, while the larger values correspond to dispersedfigurations. Hence, for this (T,f), «mp needs to be onlyslightly stronger than«[1 ~the monomer–monomer interactions! for the particles to disperse.
y
is-
FIG. 6. ~Color! Simulation snapshots of forT52.0 and f50.046. ~a!shows that the nanoparticles are clustered for a relatively weak interac«mp51.0. Similarly, ~b! shows that dispersion occurs for«mp51.5. Thechains are transparent to avoid obscuring the nanoparticles. The smaspheres represent the locations of the Lennard-Jones force sites.
license or copyright, see http://ojps.aip.org/jcpo/jcpcr.jsp
or
w
t.edtio
heuthcbtsoueooowth
otu
osra
alraa
th
toselent
e
tit-t
cl
–yaetasse
esT
o
eof-to-f
s
entt
les;
gleap-
erse
the, itize
-er-lly. In
e is aesh-usil-
-s
at-
1783J. Chem. Phys., Vol. 119, No. 3, 15 July 2003 Particle clustering in a polymer composite
The range over which the crossover occurs is mclearly shown bycV
pp @Fig. 5~b!#. If dispersion were to beanalogous to the phase separation of a binary mixture,would expect thatupp andcV
pp would exhibit a discontinuity,provided we do not follow a path through the critical poinHowever, because of the finite size of our system, we exprounding of the transition, and hence the absence of acontinuity here cannot rule out a first-order phase transiin the thermodynamic limit.32 However, if the transition werefirst order, we would expect hysteresis in the vicinity of ttransition—i.e., in a narrow region near the transition oresults would depend on in which direction we approachtransition. We tested this possibility, and found no evidenof hysteresis; such hysteresis can also be suppressedweak magnitude of the transition and finite size effecThese results suggests the transition is not first order, butresults are not conclusive; we provide more evidence sporting this possibility in the next section when we considthe specific heat of our system in relation to the patternbehavior expected for phase separation. We also pointthat our results do not, of course, preclude the existencefirst-order transition in a region of the phase diagram thatcannot explore due to the extremely slow relaxation ofsystem at lowerT.
As we mentioned at the beginning of this work, it is nobvious whether clustering in our nanoparticle system shooccur via a phase transition or by an equilibrium~or non-equilibrium! clustering process. We can rationalize the psible suppression of a first-order thermodynamic phase tsition by focusing on the relative size of a nanoparticle~theexcluded volume! and the range of interactions. In colloidsystems it has been found that an ordinary liquid–gas tsition can be suppressed, depending on the ratio of the hcore diametersHS of the colloidal particle to the ranged ofattraction induced by the depletion forces resulting frompolymers tethered to the particle surface.16 For values ofd/sHS&0.3 the ordinary liquid–gas transition is pushedvery low T, and is typically absent from the stable phadiagram. While the nanoparticles we use consist of a coltion of individual LJ particles in an icosahedral arrangemewe can estimate the approximate hard-core diameter bydistance at whichg(r ) between the nanoparticle centers bcomes nonzero; from this we obtainsHS'2.5. While the LJparticles at the nanoparticle surface have a range of attracthat extends tor 52.5 from the nanoparticle surface, the atraction is already reduced by an order of magnitude ar'1.7. Subtracting the approximate core size of a LJ partiwe obtain the ranged'0.7. Hence the ratiod/sHS
'0.7/2.550.28, and so it is possible to expect that a liquidgas-like transition would be suppressed, either completelto very low T. By way of comparison, simulations ofmodel of C60, qualitatively similar to the nanoparticles wsimulate, have shown that the phase diagram lacks a sliquid–gas transition; the transition appears to be suppreto the metastable regime at lowT, where the the solid phasis most stable.15
If the crossover between clustered and dispersed statnot a simple phase transition, how can we characterize it?start to address this, we focus on the the instantane
Downloaded 03 Jul 2003 to 129.6.153.90. Redistribution subject to AIP
e
e
ctis-n
reey a.urp-rfutf aee
ld
-n-
n-rd-
e
c-t,he-
on
e,
or
bleed
iso
us
weight average cluster sizeS. We define a cluster as thcollection of neighboring nanoparticles, where a pairnanoparticles are considered neighboring if their centercenter separation<3.96, the location of the first minimum othe nanoparticle pair distribution functiong(r ) in the maxi-mally clustered states~i.e., «mp51.0), as shown in Fig. 4~b!.We showS/Nn in Fig. 7~a!, whereNn is the number of nano-particles~distinct from Np , the total number of force sitecomprising the nanoparticles!. We normalize byNn sinceS/Nn→1 when particles are in a single cluster, independof the loading fraction. Figure 7~a! quantitatively shows thaparticles are relatively well-dispersed at large«mp with S'3.5 due to occasional contacts between the nanoparticthis asymptotic value ofS must depend onf. At the oppositeextreme, particles are almost entirely clustered in a sincluster at«mp51. The crossover between these states hpens rapidly precisely in the range wherecV
pp has a maxi-mum, justifying the identification of the maximum ofcV
pp asan approximate boundary between clustered and dispstates. While our results indicateS/Nn→1 when clusteringoccurs, there may be significant finite size effects. Givenrelatively small number of nanoparticles we can simulateis possible that there is maximum characteristic cluster sthat does not involve all of the nanoparticles.
In many systems,33 clustering occurs through an intrinsically nonequilibrium process. In other words, once clusting occurs it is irreversible. Here the clustering is thermareversible, and hence is a purely equilibrium phenomenonsuch a case, the clusters must be dynamic, and thus thercharacteristic lifetime of the ‘‘bond’’ between nanoparticl~where by ‘‘bond’’ we simply mean that nanoparticles neigbor each other according to the definition of the previoparagraph!. We can quantify this by calculating the probabity P(t) that an initially bonded pair is bonded a timet later.We then define the characteristic lifetimetR that a pair isneighboring byP(t5tR)5e21, the relaxation time ofP(t).If the relaxation is exponential,tR corresponds to the expected formP(t)}exp(2t/tR). However, when the cluster
FIG. 7. ~a! Cluster sizeS/Nn normalized by the number of nanoparticles.~b!The characteristic lifetimetR of a bond between nanoparticles demonstring the dynamic nature of the clusters.
license or copyright, see http://ojps.aip.org/jcpo/jcpcr.jsp
-
rsesilibgv
ggpth
icha
dte
oengr-
roica
.rale
ghfa
tal-ty
can
on,
dis-
rom
t-taryed,-
ity-
ofth ,
1784 J. Chem. Phys., Vol. 119, No. 3, 15 July 2003 Starr, Douglas, and Glotzer
are longer lived,P(t) ~not shown! tends to be better described by a stretched exponentialP(t)}exp(2t/tR)b. Figure7~b! shows tR increases dramatically when large clustestart to form, buttR remains finite even when nanoparticlare nearly completely clustered, demonstrating the equrium nature of the clustering. Similar equilibrium clusterinhas been documented for dipolar fluids in the absence ofder Waals attractions.34
We calculate the clustering behavior at fixedT52.0 withvariable«mp for additional values off by monitoringupp andcV
pp. For eachf, we define the approximate boundary«mp*between clustered and dispersed states by the value of«mp
wherecVpp is maximum. In this way, we obtain the clusterin
boundary in the («mp, f! plane. Figure 8 shows the resultin‘‘clustering diagram.’’ We find that the boundary has an aproximate exponential shape. The inset of Fig. 8 shows
f;exp~2E0 /«mp* !, ~5!
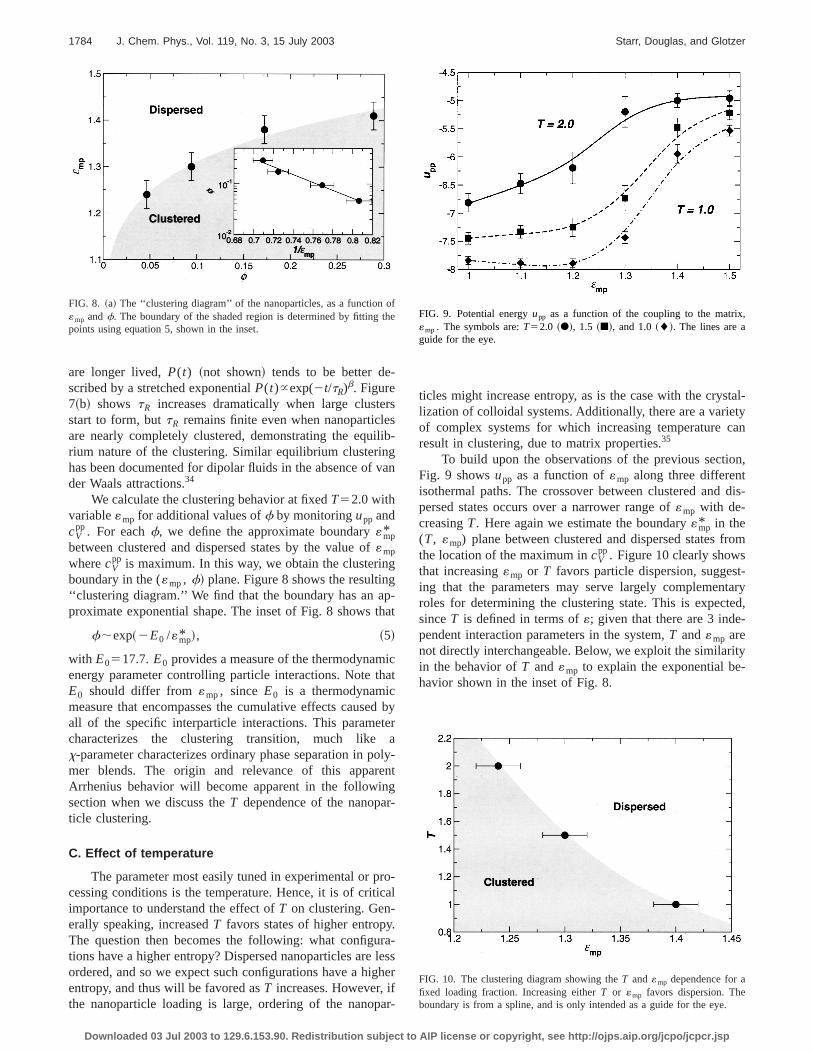
with E0517.7.E0 provides a measure of the thermodynamenergy parameter controlling particle interactions. Note tE0 should differ from«mp, since E0 is a thermodynamicmeasure that encompasses the cumulative effects causeall of the specific interparticle interactions. This paramecharacterizes the clustering transition, much likex-parameter characterizes ordinary phase separation in pmer blends. The origin and relevance of this apparArrhenius behavior will become apparent in the followinsection when we discuss theT dependence of the nanopaticle clustering.
C. Effect of temperature
The parameter most easily tuned in experimental or pcessing conditions is the temperature. Hence, it is of critimportance to understand the effect ofT on clustering. Gen-erally speaking, increasedT favors states of higher entropyThe question then becomes the following: what configutions have a higher entropy? Dispersed nanoparticles areordered, and so we expect such configurations have a hientropy, and thus will be favored asT increases. However, ithe nanoparticle loading is large, ordering of the nanop
FIG. 8. ~a! The ‘‘clustering diagram’’ of the nanoparticles, as a function«mp andf. The boundary of the shaded region is determined by fittingpoints using equation 5, shown in the inset.
Downloaded 03 Jul 2003 to 129.6.153.90. Redistribution subject to AIP
-
an
-at
t
byr
aly-t
-l
-sser
r-
ticles might increase entropy, as is the case with the cryslization of colloidal systems. Additionally, there are a varieof complex systems for which increasing temperatureresult in clustering, due to matrix properties.35
To build upon the observations of the previous sectiFig. 9 showsupp as a function of«mp along three differentisothermal paths. The crossover between clustered andpersed states occurs over a narrower range of«mp with de-creasingT. Here again we estimate the boundary«mp* in the(T, «mp) plane between clustered and dispersed states fthe location of the maximum incV
pp. Figure 10 clearly showsthat increasing«mp or T favors particle dispersion, suggesing that the parameters may serve largely complemenroles for determining the clustering state. This is expectsinceT is defined in terms of«; given that there are 3 independent interaction parameters in the system,T and«mp arenot directly interchangeable. Below, we exploit the similarin the behavior ofT and«mp to explain the exponential behavior shown in the inset of Fig. 8.
eFIG. 9. Potential energyupp as a function of the coupling to the matrix«mp. The symbols are:T52.0 ~d!, 1.5 ~j!, and 1.0~l!. The lines are aguide for the eye.
FIG. 10. The clustering diagram showing theT and«mp dependence for afixed loading fraction. Increasing eitherT or «mp favors dispersion. Theboundary is from a spline, and is only intended as a guide for the eye.
license or copyright, see http://ojps.aip.org/jcpo/jcpcr.jsp
ofcleusnes
nalrnaygi
inrs
f tly
oetthep
nc
ethw
re
or
c
thede-
f theg
ith-
ingealcha-pro-nytrol
-he
the
0
s to
ingib-on-
en
fints
1785J. Chem. Phys., Vol. 119, No. 3, 15 July 2003 Particle clustering in a polymer composite
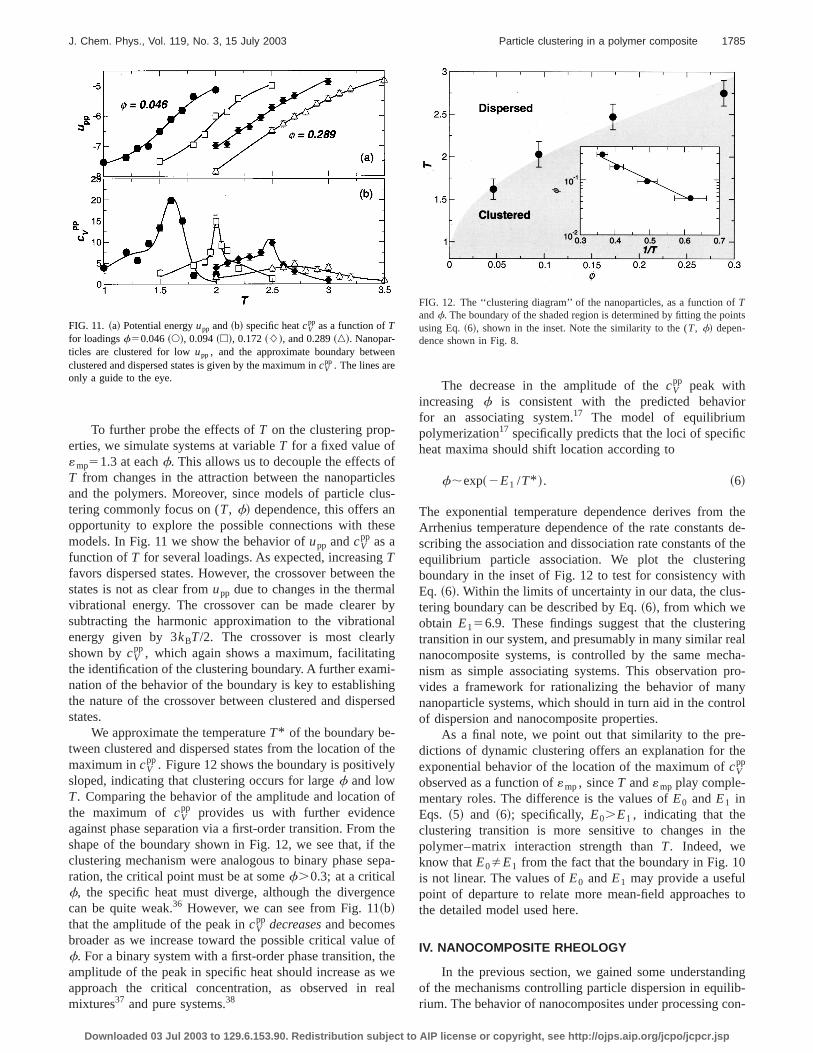
To further probe the effects ofT on the clustering prop-erties, we simulate systems at variableT for a fixed value of«mp51.3 at eachf. This allows us to decouple the effectsT from changes in the attraction between the nanopartiand the polymers. Moreover, since models of particle cltering commonly focus on (T, f! dependence, this offers aopportunity to explore the possible connections with thmodels. In Fig. 11 we show the behavior ofupp andcV
pp as afunction ofT for several loadings. As expected, increasingTfavors dispersed states. However, the crossover betweestates is not as clear fromupp due to changes in the thermvibrational energy. The crossover can be made clearesubtracting the harmonic approximation to the vibratioenergy given by 3kBT/2. The crossover is most clearlshown bycV
pp, which again shows a maximum, facilitatinthe identification of the clustering boundary. A further examnation of the behavior of the boundary is key to establishthe nature of the crossover between clustered and dispestates.
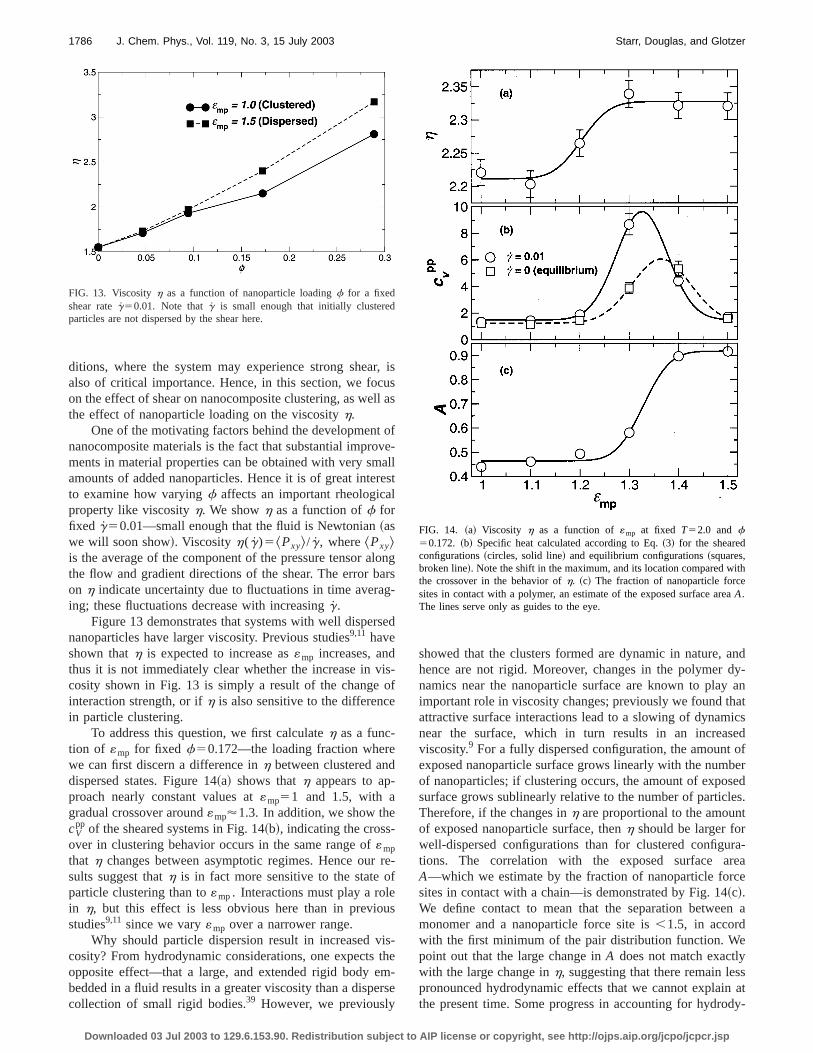
We approximate the temperatureT* of the boundary be-tween clustered and dispersed states from the location omaximum incV
pp. Figure 12 shows the boundary is positivesloped, indicating that clustering occurs for largef and lowT. Comparing the behavior of the amplitude and locationthe maximum of cV
pp provides us with further evidencagainst phase separation via a first-order transition. Fromshape of the boundary shown in Fig. 12, we see that, ifclustering mechanism were analogous to binary phase sration, the critical point must be at somef.0.3; at a criticalf, the specific heat must diverge, although the divergecan be quite weak.36 However, we can see from Fig. 11~b!that the amplitude of the peak incV
pp decreasesand becomesbroader as we increase toward the possible critical valuf. For a binary system with a first-order phase transition,amplitude of the peak in specific heat should increase asapproach the critical concentration, as observed inmixtures37 and pure systems.38
FIG. 11. ~a! Potential energyupp and~b! specific heatcVpp as a function ofT
for loadingsf50.046~s!, 0.094~h!, 0.172~L!, and 0.289~n!. Nanopar-ticles are clustered for lowupp , and the approximate boundary betweclustered and dispersed states is given by the maximum incV
pp . The lines areonly a guide to the eye.
Downloaded 03 Jul 2003 to 129.6.153.90. Redistribution subject to AIP
s-
e
the
byl
-ged
he
f
heea-
e
ofee
al
The decrease in the amplitude of thecVpp peak with
increasing f is consistent with the predicted behavifor an associating system.17 The model of equilibriumpolymerization17 specifically predicts that the loci of specifiheat maxima should shift location according to
f;exp~2E1 /T* !. ~6!
The exponential temperature dependence derives fromArrhenius temperature dependence of the rate constantsscribing the association and dissociation rate constants oequilibrium particle association. We plot the clusterinboundary in the inset of Fig. 12 to test for consistency wEq. ~6!. Within the limits of uncertainty in our data, the clustering boundary can be described by Eq.~6!, from which weobtain E156.9. These findings suggest that the clustertransition in our system, and presumably in many similar rnanocomposite systems, is controlled by the same menism as simple associating systems. This observationvides a framework for rationalizing the behavior of mananoparticle systems, which should in turn aid in the conof dispersion and nanocomposite properties.
As a final note, we point out that similarity to the predictions of dynamic clustering offers an explanation for texponential behavior of the location of the maximum ofcV
pp
observed as a function of«mp, sinceT and«mp play comple-mentary roles. The difference is the values ofE0 andE1 inEqs. ~5! and ~6!; specifically, E0.E1 , indicating that theclustering transition is more sensitive to changes inpolymer–matrix interaction strength thanT. Indeed, weknow thatE0ÞE1 from the fact that the boundary in Fig. 1is not linear. The values ofE0 andE1 may provide a usefulpoint of departure to relate more mean-field approachethe detailed model used here.
IV. NANOCOMPOSITE RHEOLOGY
In the previous section, we gained some understandof the mechanisms controlling particle dispersion in equilrium. The behavior of nanocomposites under processing c
FIG. 12. The ‘‘clustering diagram’’ of the nanoparticles, as a function oTandf. The boundary of the shaded region is determined by fitting the pousing Eq.~6!, shown in the inset. Note the similarity to the (T, f! depen-dence shown in Fig. 8.
license or copyright, see http://ojps.aip.org/jcpo/jcpcr.jsp
r,ull
t ova
rel
loag
se
isoe
ed
rof
u
istm
er
anddy-
anaticsed
ofbersedes.t
ra-reace
n a
e
ssat
dy-
ith
a
1786 J. Chem. Phys., Vol. 119, No. 3, 15 July 2003 Starr, Douglas, and Glotzer
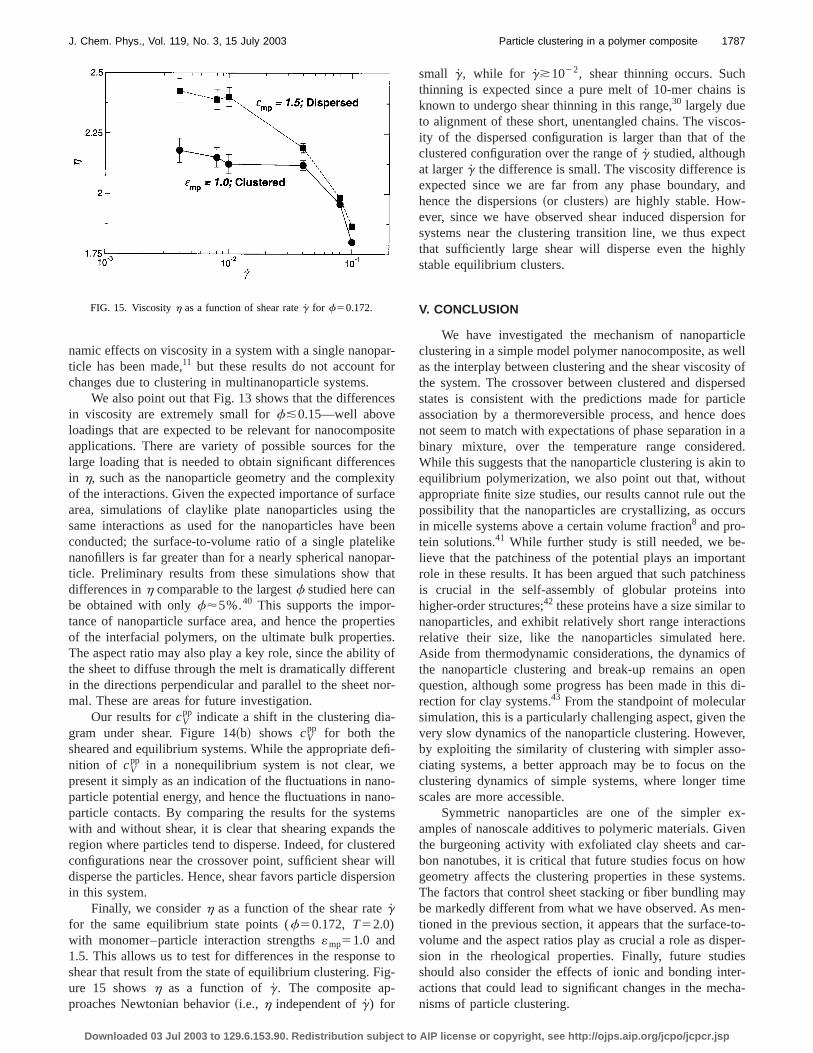
ditions, where the system may experience strong sheaalso of critical importance. Hence, in this section, we focon the effect of shear on nanocomposite clustering, as wethe effect of nanoparticle loading on the viscosityh.
One of the motivating factors behind the developmennanocomposite materials is the fact that substantial improments in material properties can be obtained with very smamounts of added nanoparticles. Hence it is of great inteto examine how varyingf affects an important rheologicaproperty like viscosityh. We showh as a function off forfixed g50.01—small enough that the fluid is Newtonian~aswe will soon show!. Viscosityh(g)5^Pxy&/g, where^Pxy&is the average of the component of the pressure tensor athe flow and gradient directions of the shear. The error bon h indicate uncertainty due to fluctuations in time averaing; these fluctuations decrease with increasingg.
Figure 13 demonstrates that systems with well dispernanoparticles have larger viscosity. Previous studies9,11 haveshown thath is expected to increase as«mp increases, andthus it is not immediately clear whether the increase in vcosity shown in Fig. 13 is simply a result of the changeinteraction strength, or ifh is also sensitive to the differencin particle clustering.
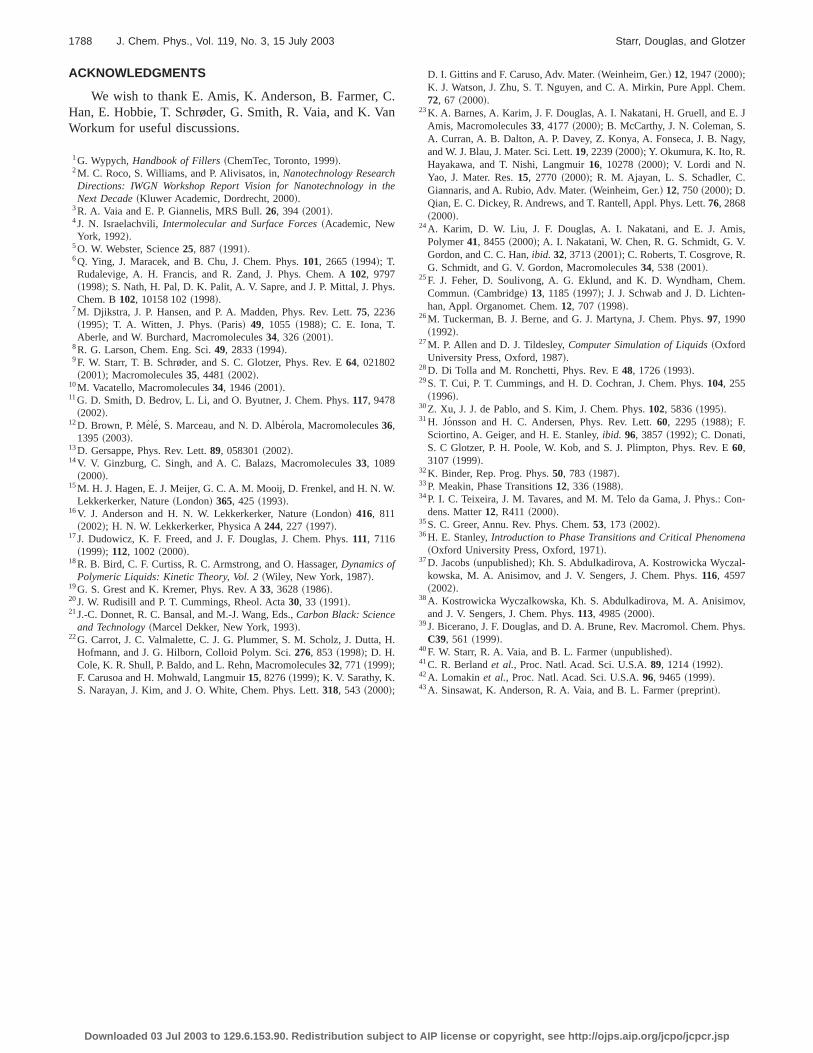
To address this question, we first calculateh as a func-tion of «mp for fixed f50.172—the loading fraction wherwe can first discern a difference inh between clustered andispersed states. Figure 14~a! shows thath appears to ap-proach nearly constant values at«mp51 and 1.5, with agradual crossover around«mp'1.3. In addition, we show thecV
pp of the sheared systems in Fig. 14~b!, indicating the cross-over in clustering behavior occurs in the same range of«mp
that h changes between asymptotic regimes. Hence oursults suggest thath is in fact more sensitive to the stateparticle clustering than to«mp. Interactions must play a rolein h, but this effect is less obvious here than in previostudies9,11 since we vary«mp over a narrower range.
Why should particle dispersion result in increased vcosity? From hydrodynamic considerations, one expectsopposite effect—that a large, and extended rigid body ebedded in a fluid results in a greater viscosity than a dispcollection of small rigid bodies.39 However, we previously
FIG. 13. Viscosityh as a function of nanoparticle loadingf for a fixedshear rateg50.01. Note thatg is small enough that initially clusteredparticles are not dispersed by the shear here.
Downloaded 03 Jul 2003 to 129.6.153.90. Redistribution subject to AIP
issas
fe-llst
ngrs-
d
-f
e-
s
-he-
se
showed that the clusters formed are dynamic in nature,hence are not rigid. Moreover, changes in the polymernamics near the nanoparticle surface are known to playimportant role in viscosity changes; previously we found thattractive surface interactions lead to a slowing of dynamnear the surface, which in turn results in an increasviscosity.9 For a fully dispersed configuration, the amountexposed nanoparticle surface grows linearly with the numof nanoparticles; if clustering occurs, the amount of exposurface grows sublinearly relative to the number of particlTherefore, if the changes inh are proportional to the amounof exposed nanoparticle surface, thenh should be larger forwell-dispersed configurations than for clustered configutions. The correlation with the exposed surface aA—which we estimate by the fraction of nanoparticle forsites in contact with a chain—is demonstrated by Fig. 14~c!.We define contact to mean that the separation betweemonomer and a nanoparticle force site is,1.5, in accordwith the first minimum of the pair distribution function. Wpoint out that the large change inA does not match exactlywith the large change inh, suggesting that there remain lepronounced hydrodynamic effects that we cannot explainthe present time. Some progress in accounting for hydro
FIG. 14. ~a! Viscosity h as a function of«mp at fixed T52.0 and f50.172. ~b! Specific heat calculated according to Eq.~3! for the shearedconfigurations~circles, solid line! and equilibrium configurations~squares,broken line!. Note the shift in the maximum, and its location compared wthe crossover in the behavior ofh. ~c! The fraction of nanoparticle forcesites in contact with a polymer, an estimate of the exposed surface areA.The lines serve only as guides to the eye.
license or copyright, see http://ojps.aip.org/jcpo/jcpcr.jsp
aor
e
sthcexiacthbelika
ha
-rtso
eno
-
ee
nonmthr
wrs
ig
his
cos-he
isand
forectly
icleell
y ofrsed
icledoesin aed.to
uttheurs
-antnesstotonsre.of
pens di-rtheer,-the
me
x-venar-owms.ay
en--to-per-eser-ha-
1787J. Chem. Phys., Vol. 119, No. 3, 15 July 2003 Particle clustering in a polymer composite
namic effects on viscosity in a system with a single nanopticle has been made,11 but these results do not account fchanges due to clustering in multinanoparticle systems.
We also point out that Fig. 13 shows that the differencin viscosity are extremely small forf&0.15—well aboveloadings that are expected to be relevant for nanocompoapplications. There are variety of possible sources forlarge loading that is needed to obtain significant differenin h, such as the nanoparticle geometry and the compleof the interactions. Given the expected importance of surfarea, simulations of claylike plate nanoparticles usingsame interactions as used for the nanoparticles haveconducted; the surface-to-volume ratio of a single platenanofillers is far greater than for a nearly spherical nanopticle. Preliminary results from these simulations show tdifferences inh comparable to the largestf studied here canbe obtained with onlyf'5%.40 This supports the importance of nanoparticle surface area, and hence the propeof the interfacial polymers, on the ultimate bulk propertieThe aspect ratio may also play a key role, since the abilitythe sheet to diffuse through the melt is dramatically differin the directions perpendicular and parallel to the sheet nmal. These are areas for future investigation.
Our results forcVpp indicate a shift in the clustering dia
gram under shear. Figure 14~b! shows cVpp for both the
sheared and equilibrium systems. While the appropriate dnition of cV
pp in a nonequilibrium system is not clear, wpresent it simply as an indication of the fluctuations in naparticle potential energy, and hence the fluctuations in naparticle contacts. By comparing the results for the systewith and without shear, it is clear that shearing expandsregion where particles tend to disperse. Indeed, for clusteconfigurations near the crossover point, sufficient sheardisperse the particles. Hence, shear favors particle dispein this system.
Finally, we considerh as a function of the shear rategfor the same equilibrium state points (f50.172, T52.0)with monomer–particle interaction strengths«mp51.0 and1.5. This allows us to test for differences in the responseshear that result from the state of equilibrium clustering. Fure 15 showsh as a function ofg. The composite ap-proaches Newtonian behavior~i.e., h independent ofg) for
FIG. 15. Viscosityh as a function of shear rateg for f50.172.
Downloaded 03 Jul 2003 to 129.6.153.90. Redistribution subject to AIP
r-
s
iteestyeeener-t
ies.ftr-
fi-
-o-se
edillion
to-
small g, while for g*1022, shear thinning occurs. Sucthinning is expected since a pure melt of 10-mer chainsknown to undergo shear thinning in this range,30 largely dueto alignment of these short, unentangled chains. The visity of the dispersed configuration is larger than that of tclustered configuration over the range ofg studied, althoughat largerg the difference is small. The viscosity differenceexpected since we are far from any phase boundary,hence the dispersions~or clusters! are highly stable. How-ever, since we have observed shear induced dispersionsystems near the clustering transition line, we thus expthat sufficiently large shear will disperse even the highstable equilibrium clusters.
V. CONCLUSION
We have investigated the mechanism of nanopartclustering in a simple model polymer nanocomposite, as was the interplay between clustering and the shear viscositthe system. The crossover between clustered and dispestates is consistent with the predictions made for partassociation by a thermoreversible process, and hencenot seem to match with expectations of phase separationbinary mixture, over the temperature range considerWhile this suggests that the nanoparticle clustering is akinequilibrium polymerization, we also point out that, withoappropriate finite size studies, our results cannot rule outpossibility that the nanoparticles are crystallizing, as occin micelle systems above a certain volume fraction8 and pro-tein solutions.41 While further study is still needed, we believe that the patchiness of the potential plays an importrole in these results. It has been argued that such patchiis crucial in the self-assembly of globular proteins inhigher-order structures;42 these proteins have a size similarnanoparticles, and exhibit relatively short range interactiorelative their size, like the nanoparticles simulated heAside from thermodynamic considerations, the dynamicsthe nanoparticle clustering and break-up remains an oquestion, although some progress has been made in thirection for clay systems.43 From the standpoint of moleculasimulation, this is a particularly challenging aspect, givenvery slow dynamics of the nanoparticle clustering. Howevby exploiting the similarity of clustering with simpler associating systems, a better approach may be to focus onclustering dynamics of simple systems, where longer tiscales are more accessible.
Symmetric nanoparticles are one of the simpler eamples of nanoscale additives to polymeric materials. Githe burgeoning activity with exfoliated clay sheets and cbon nanotubes, it is critical that future studies focus on hgeometry affects the clustering properties in these systeThe factors that control sheet stacking or fiber bundling mbe markedly different from what we have observed. As mtioned in the previous section, it appears that the surfacevolume and the aspect ratios play as crucial a role as dission in the rheological properties. Finally, future studishould also consider the effects of ionic and bonding intactions that could lead to significant changes in the mecnisms of particle clustering.
license or copyright, see http://ojps.aip.org/jcpo/jcpcr.jsp
C.a
hthe
ys
.
, H
m.
. J.gy,
s,..
m.-
on-
a
,
hys.
1788 J. Chem. Phys., Vol. 119, No. 3, 15 July 2003 Starr, Douglas, and Glotzer
ACKNOWLEDGMENTS
We wish to thank E. Amis, K. Anderson, B. Farmer,Han, E. Hobbie, T. Schrøder, G. Smith, R. Vaia, and K. VWorkum for useful discussions.
1G. Wypych,Handbook of Fillers~ChemTec, Toronto, 1999!.2M. C. Roco, S. Williams, and P. Alivisatos, in,Nanotechnology ResearcDirections: IWGN Workshop Report Vision for Nanotechnology inNext Decade~Kluwer Academic, Dordrecht, 2000!.
3R. A. Vaia and E. P. Giannelis, MRS Bull.26, 394 ~2001!.4J. N. Israelachvili,Intermolecular and Surface Forces~Academic, NewYork, 1992!.
5O. W. Webster, Science25, 887 ~1991!.6Q. Ying, J. Maracek, and B. Chu, J. Chem. Phys.101, 2665 ~1994!; T.Rudalevige, A. H. Francis, and R. Zand, J. Phys. Chem. A102, 9797~1998!; S. Nath, H. Pal, D. K. Palit, A. V. Sapre, and J. P. Mittal, J. PhChem. B102, 10158 102~1998!.
7M. Djikstra, J. P. Hansen, and P. A. Madden, Phys. Rev. Lett.75, 2236~1995!; T. A. Witten, J. Phys.~Paris! 49, 1055 ~1988!; C. E. Iona, T.Aberle, and W. Burchard, Macromolecules34, 326 ~2001!.
8R. G. Larson, Chem. Eng. Sci.49, 2833~1994!.9F. W. Starr, T. B. Schrøder, and S. C. Glotzer, Phys. Rev. E64, 021802~2001!; Macromolecules35, 4481~2002!.
10M. Vacatello, Macromolecules34, 1946~2001!.11G. D. Smith, D. Bedrov, L. Li, and O. Byutner, J. Chem. Phys.117, 9478
~2002!.12D. Brown, P. Mele, S. Marceau, and N. D. Albe´rola, Macromolecules36,
1395 ~2003!.13D. Gersappe, Phys. Rev. Lett.89, 058301~2002!.14V. V. Ginzburg, C. Singh, and A. C. Balazs, Macromolecules33, 1089
~2000!.15M. H. J. Hagen, E. J. Meijer, G. C. A. M. Mooij, D. Frenkel, and H. N. W
Lekkerkerker, Nature~London! 365, 425 ~1993!.16V. J. Anderson and H. N. W. Lekkerkerker, Nature~London! 416, 811
~2002!; H. N. W. Lekkerkerker, Physica A244, 227 ~1997!.17J. Dudowicz, K. F. Freed, and J. F. Douglas, J. Chem. Phys.111, 7116
~1999!; 112, 1002~2000!.18R. B. Bird, C. F. Curtiss, R. C. Armstrong, and O. Hassager,Dynamics of
Polymeric Liquids: Kinetic Theory, Vol. 2~Wiley, New York, 1987!.19G. S. Grest and K. Kremer, Phys. Rev. A33, 3628~1986!.20J. W. Rudisill and P. T. Cummings, Rheol. Acta30, 33 ~1991!.21J.-C. Donnet, R. C. Bansal, and M.-J. Wang, Eds.,Carbon Black: Science
and Technology~Marcel Dekker, New York, 1993!.22G. Carrot, J. C. Valmalette, C. J. G. Plummer, S. M. Scholz, J. Dutta
Hofmann, and J. G. Hilborn, Colloid Polym. Sci.276, 853 ~1998!; D. H.Cole, K. R. Shull, P. Baldo, and L. Rehn, Macromolecules32, 771~1999!;F. Carusoa and H. Mohwald, Langmuir15, 8276~1999!; K. V. Sarathy, K.S. Narayan, J. Kim, and J. O. White, Chem. Phys. Lett.318, 543 ~2000!;
Downloaded 03 Jul 2003 to 129.6.153.90. Redistribution subject to AIP
n
.
.
D. I. Gittins and F. Caruso, Adv. Mater.~Weinheim, Ger.! 12, 1947~2000!;K. J. Watson, J. Zhu, S. T. Nguyen, and C. A. Mirkin, Pure Appl. Che72, 67 ~2000!.
23K. A. Barnes, A. Karim, J. F. Douglas, A. I. Nakatani, H. Gruell, and EAmis, Macromolecules33, 4177~2000!; B. McCarthy, J. N. Coleman, SA. Curran, A. B. Dalton, A. P. Davey, Z. Konya, A. Fonseca, J. B. Naand W. J. Blau, J. Mater. Sci. Lett.19, 2239~2000!; Y. Okumura, K. Ito, R.Hayakawa, and T. Nishi, Langmuir16, 10278 ~2000!; V. Lordi and N.Yao, J. Mater. Res.15, 2770 ~2000!; R. M. Ajayan, L. S. Schadler, C.Giannaris, and A. Rubio, Adv. Mater.~Weinheim, Ger.! 12, 750~2000!; D.Qian, E. C. Dickey, R. Andrews, and T. Rantell, Appl. Phys. Lett.76, 2868~2000!.
24A. Karim, D. W. Liu, J. F. Douglas, A. I. Nakatani, and E. J. AmiPolymer41, 8455~2000!; A. I. Nakatani, W. Chen, R. G. Schmidt, G. VGordon, and C. C. Han,ibid. 32, 3713~2001!; C. Roberts, T. Cosgrove, RG. Schmidt, and G. V. Gordon, Macromolecules34, 538 ~2001!.
25F. J. Feher, D. Soulivong, A. G. Eklund, and K. D. Wyndham, CheCommun.~Cambridge! 13, 1185~1997!; J. J. Schwab and J. D. Lichtenhan, Appl. Organomet. Chem.12, 707 ~1998!.
26M. Tuckerman, B. J. Berne, and G. J. Martyna, J. Chem. Phys.97, 1990~1992!.
27M. P. Allen and D. J. Tildesley,Computer Simulation of Liquids~OxfordUniversity Press, Oxford, 1987!.
28D. Di Tolla and M. Ronchetti, Phys. Rev. E48, 1726~1993!.29S. T. Cui, P. T. Cummings, and H. D. Cochran, J. Chem. Phys.104, 255
~1996!.30Z. Xu, J. J. de Pablo, and S. Kim, J. Chem. Phys.102, 5836~1995!.31H. Jonsson and H. C. Andersen, Phys. Rev. Lett.60, 2295 ~1988!; F.
Sciortino, A. Geiger, and H. E. Stanley,ibid. 96, 3857~1992!; C. Donati,S. C Glotzer, P. H. Poole, W. Kob, and S. J. Plimpton, Phys. Rev. E60,3107 ~1999!.
32K. Binder, Rep. Prog. Phys.50, 783 ~1987!.33P. Meakin, Phase Transitions12, 336 ~1988!.34P. I. C. Teixeira, J. M. Tavares, and M. M. Telo da Gama, J. Phys.: C
dens. Matter12, R411~2000!.35S. C. Greer, Annu. Rev. Phys. Chem.53, 173 ~2002!.36H. E. Stanley,Introduction to Phase Transitions and Critical Phenomen
~Oxford University Press, Oxford, 1971!.37D. Jacobs~unpublished!; Kh. S. Abdulkadirova, A. Kostrowicka Wyczal-
kowska, M. A. Anisimov, and J. V. Sengers, J. Chem. Phys.116, 4597~2002!.
38A. Kostrowicka Wyczalkowska, Kh. S. Abdulkadirova, M. A. Anisimovand J. V. Sengers, J. Chem. Phys.113, 4985~2000!.
39J. Bicerano, J. F. Douglas, and D. A. Brune, Rev. Macromol. Chem. PC39, 561 ~1999!.
40F. W. Starr, R. A. Vaia, and B. L. Farmer~unpublished!.41C. R. Berlandet al., Proc. Natl. Acad. Sci. U.S.A.89, 1214~1992!.42A. Lomakin et al., Proc. Natl. Acad. Sci. U.S.A.96, 9465~1999!.43A. Sinsawat, K. Anderson, R. A. Vaia, and B. L. Farmer~preprint!.
license or copyright, see http://ojps.aip.org/jcpo/jcpcr.jsp