Embed Size (px)
Citation preview
6th International Conference on Thermophysical and
Mechanical Properties of Advanced Materials
&
8th Rostocker Symposium on Thermophysical
Properties for Technical Thermodynamics 22-24 September 2019
Altin Yunus Resort & Thermal Hotel, Cesme - Izmir / Turkey
Organizers:
Ege University
Department of
Mechanical
Engineering,
Izmir - Turkey
Dokuz Eylul
University
Department of
Mechanical
Engineering,
Izmir - Turkey
University of
Rostock
Institute of
Technical
Thermodynmaics
Rostock -
Germany
Azerbaijan
Technical
University,
Baku -
Azerbaijan
IMS Polymers,
Izmir - Turkey
Abstracts & Full Text
Proceedings
THERMAM 2019
6th Int. Conf.: Thermophysical and Mechanical Properties of Advanced Materials (THERMAM)
8thRostocker Int. Conf.: Thermophysical Properties for Technical Thermodynamics
22-24 September 2019, Çeşme, İzmir, Turkey
II
Prof. Dr. Şebnem Tavman
Ege University
Food Eng. Department
35100 Bornova/Izmir -Turkey
E-mail: [email protected]
Prof. Dr. Ing. habil Dr. h.c Egon Hassel
University of Rostock
Department of Technical Thermodynamics
Albert-Einstein-Str. 2
18051 Rostock, Germany
Dr. Javid Safarov
University of Rostock
Department of Technical Thermodynamics
Albert-Einstein-Str. 2
18051 Rostock, Germany
s. Aytakin Guluzade
Azerbaijan Technical University,
H. Javid Avn. 25, AZ1073 Baku, Azerbaijan
Dr. Alpaslan Turgut
Dokuz Eylul University
Mechanical Eng. Department
35397 Tinaztepe- Buca/Izmir – Turkey
Dr. Mehmet Sarikanat
Ege University
Mechanical Eng. Department
35100 Bornova/Izmir -Turkey
Prof. Dr. Yoldas Seki
Dokuz Eylul University
Chemistry Department
35397 Tinaztepe- Buca/Izmir – Turkey
Dr. Lutfiye Altay
Ege University
Mechanical Eng. Department
35100 Bornova/Izmir -Turkey
Mr. Akın İşbilir
IMS Polymers, Turkey
Tuba Evgin
Dokuz Eylul University
Mechanical Eng. Department
35397 Tinaztepe- Buca/Izmir – Turkey
Sena Gülen
Ege University
Mechanical Eng. Department
35100 Bornova/Izmir -Turkey
ORGANIZING COMMITTEE
CHAIR:
ORGANIZING COMMITTEE:
CONGRESS SECRETARY

6th Int. Conf.: Thermophysical and Mechanical Properties of Advanced Materials (THERMAM)
8thRostocker Int. Conf.: Thermophysical Properties for Technical Thermodynamics
22-24 September 2019, Çeşme, İzmir, Turkey
III
Vagif ABBASOV, Azerbaijan National Academy of Sciences, Azerbaijan
Yusif ALIYEV, Azerbaijan State Pedagogical University, Azerbaijan
Lütfiye ALTAY, Ege University, Turkey
Burak ATAKAN, University of Duisburg-Essen, Germany
Yıldırım AYDOGDU, Gazi University, Turkey
Lala AZIZOVA, Azerbaijan Technical University, Azerbaijan
Dominique BAILLIS, INSA de Lyon, France
Heng BAN, University of Pittsburgh, USA
Rachid BENNACER, Ecole normale supérieure Paris-Saclay / ECAM-EPMI Cergy, France
Jerzy BODZENTA, Silesian University of Technology, Poland
Vlastimil BOHAC, Slovak Academy of Sciences, Slovakia
Mihai BRANZEI, Polytechnic University of Bucharest, Romania
Mihai CHIRTOC, University of Reims Champagne-Ardenne, France
Carolina COTTA, Federal University of Rio De Janeiro, Brazil
Renato M. COTTA, Federal University of Rio De Janeiro, Brazil
Özge Andiç Çakır, Ege University, Turkey
Barbaros CETIN, Bilkent University, Turkey
Mustafa Turhan COBAN, Ege University, Turkey
Ege Anıl DILER, Ege University, Turkey
Mehmet Akif EZAN, Dokuz Eylul University, Turkey
Olivier FUDYM, CNRS Office for Brazil and the South Cone, Brazil
Barış Oğuz GURSES, Ege University, Turkey
Ulviyya HASANOVA, Baku State University, Azerbaijan
Egon HASSEL, University of Rostock, Germany
Nicolas HORNY, University of Reims Champagne-Ardenne, France
Daryush ILA, Fayetteville State University, USA
Rasim IPEK , Ege University, Turkey
Johan JACQUEMIN, Université Francois Rabelais, France
Haluk E. KARACA, University of Kentucky, USA
SCIENTIFIC COMMITEE
6th Int. Conf.: Thermophysical and Mechanical Properties of Advanced Materials (THERMAM)
8thRostocker Int. Conf.: Thermophysical Properties for Technical Thermodynamics
22-24 September 2019, Çeşme, İzmir, Turkey
IV
Ziya Haktan KARADENIZ, Izmir Kâtip Çelebi University, Turkey
Ramazan KARAKUZU, Dokuz Eylül University, Turkey
Ozan KARAMAN, İzmir Katip Çelebi University, Turkey
Cevdet KAYNAK, Middle East Technical University, Turkey
Boris KOSOY, Odessa National Academy of Food Technologies, Ukraine
Mohammed LACHI, University of Reims, France
Mohammed LAHCINI, Cadi Ayyad University, Morocco
Najib LARAQI, Université Paris Nanterre, France
Mehmet MUTLU, TOBB University of Economics and Technology , Turkey
Igor NOVAK, Slovak Academy of Sciences, Slovakia
Maria OMASTOVA, Slovak Academy of Sciences, Slovakia
Helcio R. B. ORLANDE, Federal University of Rio De Janeiro, Brazil
Kemal Levend PARNAS, TED University , Turkey
Mourad REBAY, University of Reims Champagne-Ardenne, France
Javid SAFAROV, University of Rostock, Germany
Necdet SAGLAM, Hacettepe University, Turkey
Mehmet SARIKANAT, Ege University, Turkey
Yoldaş SEKI, Dokuz Eylul University, Turkey
Kutlay SEVER, Izmir Kâtip Çelebi University, Turkey
Mehmet Özgür SEYDIBEYOGLU, İzmir Katip Çelebi University, Turkey
Mahi R. SINGH, Western University, Canada
Aylin SENDEMIR, Ege University, Turkey
Sebnem TAVMAN, Ege University, Turkey
Alper TASDEMIRCI, İzmir Institute of Technology, Turkey
Masahide TERAZIMA, Kyoto University, Japan
Alpaslan TURGUT, Dokuz Eylul University, Turkey
Hasan YILDIZ , Ege University, Turkey
Kadir YURDAKOC, Dokuz Eylul University, Turkey
THERMAM is a multi–disciplinary international conference on all aspects of advanced materials
The Organizing Committe
22-24 September 2019, Çeşme, İzmir, Turkey
6th Int. Conf.: Thermophysical and Mechanical Properties of Advanced Materials (THERMAM)
8thRostocker Int. Conf.: Thermophysical Properties for Technical Thermodynamics
stimulating field with this conference.
We wish you a very pleasant, joyful, interesting and stimulating conference “THERMAM 2019” at
the Altin Yunus Resort & Thermal Hotel, Cesme - Izmir, Turkey and hope you enjoy exchanging
and sharing the latest results in interdisciplinary research on material science and engineering.
including their synthesis, fabrication, thermal and mechanical characterization, applications and
impacts on nature and technology. This conference aims to highlight the most important results of
high-quality research and scientific developments as well as explore relevant and interesting topics
for the future. It covers broad range of topics related to thermodynamics and heat transfer
processes, energy conversion, functional materials, innovative material solutuions to ecosystem
and environmental changes, etc.
This conference is taking a leading role to bridge the gap between advanced materials and their
industrial applications by attracting numerous chemists, physicists and scientists from diverse
fields. THERMAM conference which is associated with the transfer of knowledge and technology
through university-industry relationships will provide numerous benefits to researchers, scientists,
universities, and companies.
Within this conference we want to bring together international scientists and engineers who work
in the very broad field of “Thermophysical and Mechanical Properties of Advanced Materials”.
This is a very interesting and modern field of research that will provide opportunities for the
development of innovative products and future technologies. It covers experimental and theoretical
new results for thermophysical properties, new measurement techniques and their applications,
molecular modeling with new theoretical insights, applications which show the improvement done
with the described research for thermophysical properties and mechanical properties all for
materials like nanofluids, nanocomposites, alternative solvents, metals, alloys, ceramics,
composites, functional composite materials etc.
We want to foster lively discussions and future international collaborations on this important and
PREFACE
6th Int. Conf.: Thermophysical and Mechanical Properties of Advanced Materials (THERMAM)
8thRostocker Int. Conf.: Thermophysical Properties for Technical Thermodynamics
22-24 September 2019, Çeşme, İzmir, Turkey
VI
CONTENTS
ORGANIZING COMMITTEE .............................................................................................. II
CONGRESS SECRETARY .................................................................................................... II
SCIENTIFIC COMMITEE .................................................................................................. III
PREFACE ................................................................................................................................ V
ABSTRACTS ........................................................................................................................... X
KEYNOTE ABSTRACTS ....................................................................................................... 1
Grooved Heat Pipes: Modeling, Experimentation and Applications ...................................................... 1
Experimental-Theoretical Parametric Analysis in Micro Scale Transport Phenomena: Application to
Biodiesel Synthesis in Micro Reactors .................................................................................................... 2
The Models With Accounted Disturbance Effects For the Measurement of Thermophysical Properties
of Materials by Transient Methods.......................................................................................................... 3
Computational Modeling of Foam Effective Thermal Properties/ Review And Recent Advances ........ 4
Hybrid Integral Transforms in Nonlinear Heat and Mass Transfer ......................................................... 5
Newer, Simple and Effective Approaches for Predicting Viscosity of Binary, Ternary and
Multicomponent Liquid Mixtures ........................................................................................................... 6
Inverse Method Based on Analytical Transfer Functions to Study a Thermomechanical Problem ........ 7
Thermophysical Properties of Ionic Liquids at High Pressures and Temperatures ................................. 8
ORAL ABSTRACTS ............................................................................................................... 9
Determination of the Optimum Operating Parameters of a Cascade Cooling System Using the R245fa
(1,1,1,3,3- Pentafluoropropane) Refrigerant ......................................................................................... 10
Effect Of Fullerenes C60 On Heat Capacity, Density, Thermal Conductivity And Viscosity Of Tetralin ........... 11
Temperature And Concentration Dependencies Of Density And Viscisity For The Fullerene C60
Solutions In O-Xylene ........................................................................................................................... 12
Thermal Diffusivity Measurements of Phase Change Materials in the Liquid Phase for Latent Thermal
Energy Storage ...................................................................................................................................... 13
Heating Characteristics of Cherry Juice in an Inductive Heat Exchanger............................................. 14
Characteristics of Free Surface Vortex Flows Under Effects of Rotation and Buoyant- Thermocapillary
Convection ............................................................................................................................................ 15
6th Int. Conf.: Thermophysical and Mechanical Properties of Advanced Materials (THERMAM)
8thRostocker Int. Conf.: Thermophysical Properties for Technical Thermodynamics
22-24 September 2019, Çeşme, İzmir, Turkey
VII
Study Of Thermophysical Properties of Carbonate Stones by Means of the Pulse Transient Technique
and Analysis of the Effects of Thermal Heat Resistance and Heat Capacity of Heat Source Accounted
in Slab Model. ....................................................................................................................................... 16
Impact of the Temperature Over 100°C on the Drying Kinetics, Thermophysical and Transport
Properties of Dried Apple ...................................................................................................................... 17
Usage Possibility of Grape Pomace in Compound Chocolate Instead of Sugar, Whey and Milk: Effect
on Thermal and Rheological Properties ................................................................................................ 18
Non-Linear Model Predictive Control of a Vapor Compression Refrigeration Cycle .......................... 19
DNA Nanobundles as Smart Drug Carriers .......................................................................................... 20
Simulation and Design Optimization of Al Alloy Wheels Subjected to Biaxial Fatigue Loading ....... 21
Numerical Investigation and Optimization of Dynamic Cornering Fatigue Behaviour and Natural
Frequency of Aluminium Alloy Wheels ............................................................................................... 22
The Effect of MGO Concentration on Physical Properties of MGO Thin Films .................................. 23
Development of Textile Reinforced Flexible Thermoplastic Laminates for Impact Resistance ........... 24
Theoretical Prediction of the Contact Angle Independent from the Volume Effect ............................. 25
On the Validity of Mass Flow Rate Equation for Nanofluid Based Single Phase Natural Circulation Mini
Loops ..................................................................................................................................................... 26
Sound Insulation Performance of Chemically Foamed Low-Density Polyethylene Thermoplastics
Materials ................................................................................................................................................ 27
Ballistic and Impact Performance of Honeycomb Core Aluminum Sandwich Panels with Epoxy Based
Syntactic Foam Infill ............................................................................................................................. 29
Sound Insulation Performance of Honeycomb Core Aluminum Sandwich Panels with Flexible Epoxy
Based Foam Infill .................................................................................................................................. 30
Enhanced Thermal Conductivity and Photo-Thermal Conversion in Carbon Black Nanopowder Loaded
Organic Phase Change Material ............................................................................................................ 31
Continuously Fed Evaporating Cylindrical Water Blocks for Electronics Cooling Applications ........ 32
Preparation of Compositions Based on Modified Epoxide Oligomer with GO and Investigation of Their
Physical-Mechanical Proporties ............................................................................................................ 33
Thermodynamic Analysis of a New PV/T Hybrid Food Drying System .............................................. 34
Industrial Manufacturing of Wood Plastic Composites from Municipal Bulky Plastic and Wood Wastes .......... 35
Effect of Silica Particle Size and Filler Rate on the Fracture Properties of Epoxy Resin Composite ... 36
Determination of Thermal Conductivity of Carbon Filled Polymeric Composite Plates for Compact Plate
Heat Exchangers .................................................................................................................................... 37
Magnetic Nanofluid Flow in a Microchannel by an External Magnetic Field ...................................... 38
6th Int. Conf.: Thermophysical and Mechanical Properties of Advanced Materials (THERMAM)
8thRostocker Int. Conf.: Thermophysical Properties for Technical Thermodynamics
22-24 September 2019, Çeşme, İzmir, Turkey
VIII
Investigating the Preform Binder Effects on Thermo-Mechanical Properties of Composite Panels for
Wind Blade Applications ...................................................................................................................... 39
Magnetization Behavior of Fe3O4 – Water And Fe2O3 – Water Magnetic Nanofluids ......................... 40
Influence of Film Thickness on Electromechanical Properties of Cellulose-Graphene Ionic Polymer
Composite Films.................................................................................................................................... 41
The Effect of Woven Glass On HDPE Composite Materials ................................................................ 42
Investigation of Thermal, Mechanical and Flame Retardance Properties of Flame Retarded Polyamide
Composites for Railway Applications ................................................................................................... 43
Development of Energy Efficiency High Polymeric Composite Material for Building Applications .. 44
Investigation of Thermal and Mechanical Properties of Synthetic Graphite Filled PBT Composites .. 45
Effect of Iron Powder on Mechanical and Thermal Properties of Polyester Based Composites .......... 46
Determination of Thermal and Rheological Properties of Collagen Protein ......................................... 47
Thermal and Mechanical Behaviour of Graphene Loaded Graphite/PPS Composites ......................... 48
Measurement of Viscosity and Specific Heat of Nanofluids of Practical Interest ................................ 49
Rubber Based Functionally Graded Syntactic Foams Under Multiple Quasi Static Compression Loading ......... 50
POSTER ABSTRACTS ......................................................................................................... 51
Energetic-Exergetic Evaluations of Ohmic Thawing Process Applied at Different Voltage Gradients 51
Use of Surface Enhanced Raman Spectroscopy as a Tool for Detection of 6-Mono Acetyl Morphine (6-
MAM) .................................................................................................................................................... 52
Effect of Grape Pomace Usage in Chocolate Spread Formulatıon on Textural and Rheologıcal Propertıes ........ 53
Rational Technology for Producing Cement From Opoka-Like Rocks of Uzbekistan ......................... 54
3D Modeling of The Crystallization Surface PbSe in the Ternary Systems Ag-Pb-Se and Cu-Pb-Se with
Bayesian Uncertainty Analysis ............................................................................................................. 55
Temperature Dependence of the Reaction of Electrophilic Addition of Acyl Chlorides to Allyl Chloride .......... 56
Quantum Chemical Studies of Some Diamine Derivatives: Theoretical Investigation ........................ 57
Sers Based LFIA for Detection of Pathogen Bacteria in Nanotechnology ........................................... 58
The Effect of Annealing Temperature on the Structural and Optical Properties of CuO Nanoparticles59
Thermal Proporties of New Composite Materials Based on Date Palm Waste .................................... 60
Study of Antimicrobial Properties Substances Synthesized Based on Dimethyl 4-Hydroxy-4-Methyl-
2- (4-Methylphenyl) -6-Oxocyclohexane-1,3-Dicarboxylate ................................................................ 61
Mechano-Chemical Modification of Wastes of Polystyrene with Polyvinyl Chloride ......................... 63
Fabrication and Characterization of Natural Fiber Reinforced Thermoplastic Composites ................. 64
Recent Technologies on Refrigeration Systems: a Novel Design to Enhance the Performance of the
Vapor Compression System .................................................................................................................. 65
6th Int. Conf.: Thermophysical and Mechanical Properties of Advanced Materials (THERMAM)
8thRostocker Int. Conf.: Thermophysical Properties for Technical Thermodynamics
22-24 September 2019, Çeşme, İzmir, Turkey
IX
The Study of Aluminium and Chrome Based New Bimetallic Catalytic Complex .............................. 66
FULL TEXTS ......................................................................................................................... 67
Comparison of Energy and Exergy Performances of Parabolic Solar Trough Collector of Molten Salt
and 100 Bar Air ..................................................................................................................................... 68
Thermodynamic Analysis and 3D Modeling of Systems Ag-Pb-Se and Cu-Pb-Se on Liquidus PbSe
Using the Positions of Fuzzy Systems................................................................................................... 82
Numerical Investigation and Optimization of Dynamic Cornering Fatigue Behaviour and Natural
Frequency of Aluminium Alloy Wheels ............................................................................................... 87
Simulation and Design Optimization of Al Alloy Wheels Subjected to Biaxial Fatigue Loading ....... 99
Investigating the Preform Binder Effects on Thermo-Mechanical Properties of Composite Panels for
Wind Blade Applications .................................................................................................................... 109
The Effect of Woven Glass on HDPE Composite Materials ............................................................... 116
Magnetization Behavior of Fe3O4 – Water and Fe2O3 – Water Magnetic Nanofluids ..................... 120
Thermodynamic and Thermophysical Properties of Humid air by Using Cubic Peng-Robinson EOS .............. 124
Thermodynamic and Thermophysical Properties of Humid Exhaust Gases by Using Cubic Peng-
Robinson EOS ..................................................................................................................................... 153
Hybrid Integral Transforms in Nonlinear Heat and Mass Transfer ..................................................... 180
Determination of Thermal and Rheological Properties of Collagen Protein ....................................... 201
Thermodynamic Analysis of a New PV/T Hybrid Food Drying System ............................................ 208
Measurement of Viscosity and Specific Heat of Nanofluids of Practical Interest .............................. 215
INDEX ................................................................................................................................... 228
6th Int. Conf.: Thermophysical and Mechanical Properties of Advanced Materials (THERMAM)
8thRostocker Int. Conf.: Thermophysical Properties for Technical Thermodynamics
22-24 September 2019, Çeşme, İzmir, Turkey
X
ABSTRACTS
6th Int. Conf.: Thermophysical and Mechanical Properties of Advanced Materials (THERMAM)
8thRostocker Int. Conf.: Thermophysical Properties for Technical Thermodynamics
22-24 September 2019, Çeşme, İzmir, Turkey
1
KEYNOTE ABSTRACTS
Grooved Heat Pipes: Modeling, Experimentation and Applications
Assoc. Prof. Dr. Barbaros Çetina
aMETU-Bilkent Heat Pipe Technologies Research Group İ.D. Bilkent University
Benefiting from phase change heat transfer phenomenon, heat pipes are viable tool for heat dissipation purposes in a wide range of disciplines, from space applications to thermal management of electronic components. The main advantage of heat pipes over conventional cooling methods is their ability to transfer significant amounts of heat with small temperature gradients. Due to the fact that most designs do not contain any moving and serviceable parts, the necessity of repair and maintenance is avoided, which enables the operation of these devices with high reliability. More specifically, grooved heat pipes have the additional advantages of ease of fabrication and numerical modeling due to less complicated geometry. The complex interaction of evaporation, condensation phenomena and the dominant effect of capillary forces on the motion of the liquid, in addition to the multi-dimensional heat conduction in the solid walls requires a comprehensive modeling for the performance of heat pipes. Despite the fact that heat pipes have been in use and production for a long time, complex heat transfer mechanisms still necessitate further research both on modeling and experimentation. In this talk, challenges on modeling and experimentation of grooved heat pipes will be discussed, and some common and current applications will be demonstrated.
6th Int. Conf.: Thermophysical and Mechanical Properties of Advanced Materials (THERMAM)
8thRostocker Int. Conf.: Thermophysical Properties for Technical Thermodynamics
22-24 September 2019, Çeşme, İzmir, Turkey
2
Experimental-Theoretical Parametric Analysis in Micro Scale Transport Phenomena: Application to Biodiesel Synthesis in Micro Reactors
Carolina P. NAVEIRA-COTTAa,b
aLaboratory of Nano & Microfluidics and Microsystems - LabMEMS bMechanical Eng. Dept and Eng. of Nanotechnology Dept. – Federal University of Rio de Janeiro – UFRJ, Rio de Janeiro,
RJ, Brazil E-mail: [email protected]
The scale reduction in mechanical fabrication has been permitting the miniaturization of thermal and fluids processing devices, such as in the case of micro-heat exchangers and micro-reactors. Novel experimental, modelling and simulation approaches have been required to explain deviations of the heat and mass transfer behaviour in micro-systems, when compared to predictions by classical macro-scale phenomena correlations. Inverse problem analysis then plays a major role in the identification of parameters and functions, besides the estimation of system states themselves. This lecture presents the hybrid numerical-analytical-experimental approach in dealing with direct-inverse problems solutions, which includes improved lumped-differential formulations for the mathematical model, hybrid numerical-analytical integral transform solution of the direct problem, and inverse analysis via Bayesian inference with the Approximation Error Model, in combination with the previously mentioned approaches. An application dealing with the design, characterization, fabrication and testing of micro-reactors for continuous biodiesel synthesis is selected to illustrate the unified hybrid framework and its success in the proposed parametric analysis. Keywords: Hybrid methods; Integral transforms; Convection-diffusion-reaction; Heat and mass transfer, Bayesian Inference, Biodiesel synthesis; Microreactors.
6th Int. Conf.: Thermophysical and Mechanical Properties of Advanced Materials (THERMAM)
8thRostocker Int. Conf.: Thermophysical Properties for Technical Thermodynamics
22-24 September 2019, Çeşme, İzmir, Turkey
3
The Models With Accounted Disturbance Effects For the Measurement of Thermophysical Properties of Materials by Transient Methods
Vlastimil BOHÁČa, Rupali TIWARIa, Peter DIEŠKAb, Viliam VRETENÁRa,
a Institute of Physics, Slovak Academy of Sciences, Dúbravská cesta 9, 85101 Bratislava, Slovakia
b Institute of Nuclear and Physical Engineering, Faculty of Electrical Engineering and Information Technology,
STU in Bratislava Ilkovičova 3, 812 19 Bratislava 1, Slovakia
E-mail: [email protected]
Thermophysical properties of different classes of new developed materials are one of high research interests supported by the technology. The demand of increased number of the measurements as well as the small sample dimensions creates the force on effectivity of the measurement apparatuses. The development of the transient methods was invoked by higher measurement speed in comparison with classical stationary methods that require relatively large samples and thus the longer time for the measurement. Principle of transient methods is based on the generation of the heat by point/ball, line or plane heat source that in many cases serve also as the sensor for the temperature response (one probe methods). The temperature response to the heat pulse should be recorded by means of thermocouple placed apart of the heat source. In this case we have two probe methods. Typical time for the temperature stabilization in between subsequent measurements ranges form 5-15 minutes for metals up to 5-8 hours for non-homogeneous building or insulation materials. The sample size ranges from several mm up to 10-15 cm. The transient methods developed at the Thermophysics laboratory at IP SAS uses the series of models that has been derived for the most common specimen geometries in 1D, 2D and 3D dimensions. The models account the semi-infinitively large specimens, the slab samples having final thickness and finally the cylindrical and cuboid shape of specimens. The influences of the heat sink blocks situated at both ends of the specimen setup were added. Heat sinks exchangers serve for the temperature stabilization of the sample before the measurement and its temperature is defined as one of the boundary condition. For the real experimental arrangements the different disturbance effects exists that influence thermal field development inside the specimen setup. They are represented by heat capacity of the probe/heater and sample body, as well as by sample free surface. The onset of the temperature response is influenced by non-ideal heat source having real heat capacity as well as with the thermal contact resistance at the interface in between the heat source/probe and specimen body. This effect causes the delay in onset of the temperature response. For the long time measurements and for the limited specimen size the effects at the free sample surface known as the heat loss effect appears. This effect lowers the temperature response because the generated heat flux is divided in between axial and radial direction. The influence of the heat flux in radial direction has been solved by adding heat transfer coefficient from the sample surface to the surrounding. This effect should be suppressed by increasing the sample geometry only, but it is not possible in many cases. The paper discusses the transient models accounting influences of the disturbing effects illustrated by analysis of the experimental results. The methodology of the model testing and data analysis helps to suppress the uncertainty of the estimated thermophysical parameters. Keywords: transient methods, thermal properties, sensitivity coefficients, uncertainty, disturbing effects Acknowledgements: This work was supported by the Scientific Grant Agency VEGA grant No. 2/0192/17 “Development of sensors and measurement methods for transient techniques for the measurement of thermophysical properties of materials and their application for seasonal storage of heat energy”
6th Int. Conf.: Thermophysical and Mechanical Properties of Advanced Materials (THERMAM)
8thRostocker Int. Conf.: Thermophysical Properties for Technical Thermodynamics
22-24 September 2019, Çeşme, İzmir, Turkey
4
Computational Modeling of Foam Effective Thermal Properties/ Review And Recent Advances
Dominique Baillisb, Rémi Coquarda ,
aEC2-MODELISATION, Villeurbanne, France bINSA-Lyon, LaMCoS, Villeurbanne, France
Email: [email protected];
In most of the numerous industrial applications of highly porous cellular foams, their thermal behavior is a major concern. An accurate knowledge of the heat transfer mechanisms occurring in these materials is thus of primary importance. Due to their high porosity, heat transfer in foams is a combination of heat conduction (through both solid and fluid phases) and radiation transport. These two modes of heat transfer are coupled and strongly depend on the density, the morphology of the porous structure, the temperature and the thermo-optical properties of the constituents. Therefore, an exhaustive modeling of thermal behavior of Polymer Foams requires cutting-edge numerical methods for the computation of the conductive and radiative properties in close relation with their porous structure at the local scale. Such numerical approaches can be build on: X-Ray Tomographic characterizations of real foam samples to reconstruct very faithfully the cellular morphologies of the foam investigated Numerical generation methods using the Voronoi approaches to create 3-D finite elements meshes of the porous structure of existing foams. Based on our long time expertise in the field [1-5], we will present advances in computational modeling of foam effective thermal properties. A special emphasis will be put on the influence of the structural parameters. Note that these latest numerical developments have been incorporated in a freshly developed software, named MODelia and edited by EC2-Modelisation company.
Keywords: polymer foams; semi-transparent medium; equivalent thermal conductivity; thermal radiation
References
[1] R. Coquard, D. Baillis, “Modeling of heat transfer in low-density EPS foams”, J. Heat Transf. (2006), vol. 128,
pp. 538-549.
[2] R. Coquard, D. Baillis, “Radiative and conductive thermal properties of foams”, in: A. Ochsner, G.E. Murch,
M. de Lemos (Eds.), “Thermal Properties of Cellular and Porous Materials”, Wiley-VCH, Weinheim, 2008, pp.
343-384.
[3] Coquard, R., Baillis and Maire, E.,“Numerical Investigation of the Radiative Properties of Polymeric Foams
from Tomographic Images”. Journal of Thermophysics and heat Transfer (2010), Vol. 24, pp. 647-657,
[4] Coquard, R., Baillis and Cunsolo, S., “Effective Conductivity of Voronoi's closed and open cell Foams -
Analytical laws and numerical results”. Journal of Material Sciences - Special Section: Macroporous Materials
(2017), vol. 52, pp. 11146-11167
[5] Cunsolo, S., Coquard, R., Baillis, D., & Bianco, N. « Radiative properties modeling of open cell solid foam:
Review and new analytical law”. International Journal of Thermal Sciences (2016), vol. 104, pp.122-134.
6th Int. Conf.: Thermophysical and Mechanical Properties of Advanced Materials (THERMAM)
8thRostocker Int. Conf.: Thermophysical Properties for Technical Thermodynamics
22-24 September 2019, Çeşme, İzmir, Turkey
5
Hybrid Integral Transforms in Nonlinear Heat and Mass Transfer
Renato M. COTTAa,b,c
aGeneral Directorate of Nuclear and Technological Development – DGDNTM Brazilian Navy, Rio de Janeiro, RJ, Brazil
bLaboratory of Nano- and Microfluidics and Microsystems – LabMEMS Mechanical Engineering Dept., POLI & COPPE/UFRJ
cInterdisciplinary Nucleus for Social Development - NIDES/CT Universidade Federal do Rio de Janeiro, Cidade Universitária,
Cx. Postal 68503,Rio de Janeiro, RJ, CEP 21945-970, Brazil
E-mail: [email protected]
A hybrid analytical-numerical method known as the Generalized Integral Transform Technique (GITT), first proposed in the mid 80´s, has been gradually advanced to handle various classes of nonlinear problems in transport phenomena, including fluid flow, heat and mass transfer. The aim of this hybrid approach is to offer robust, precise, and cost-effective simulations in convection-diffusion problems, combining analytical eigenfunction expansions with numerical solutions of the nonlinear transformed ordinary differential systems. The present lecture provides a general overview of the methodology, which is based on the classical integral transform approach, generalized to handle a priori non-transformable problems, such as in the case of nonlinear formulations. Particular attention is given to recent extensions on the GITT, including the adoption of nonlinear eigenvalue problems in the proposed expansions, with a resulting convergence enhancement effect. Also, the relative merits of the hybrid method in handling inverse problems for properties and functions identification are briefly discussed. Finally, recent applications involving membrane metal extraction, direct contact membrane distillation, microfluidic redox flow batteries, and flow in partially saturated soils are more closely considered. Keywords: Hybrid methods; Integral transforms; Convection-diffusion; Heat and mass transfer; Liquid supported membrane extraction; Direct contact membrane distillation; Membraneless redox flow batteries; Flow in unsaturated porous media.
6th Int. Conf.: Thermophysical and Mechanical Properties of Advanced Materials (THERMAM)
8thRostocker Int. Conf.: Thermophysical Properties for Technical Thermodynamics
22-24 September 2019, Çeşme, İzmir, Turkey
6
Newer, Simple and Effective Approaches for Predicting Viscosity of Binary, Ternary and Multicomponent Liquid Mixtures
RANJAN DEY, FRSC, Ph.D.
DEPT. OF CHEMISTRY, BITS PILANI K K BIRLA GOA CAMPUS, ZUARINAGAR, GOA, INDIA – 403726
Liquid state properties are very useful in chemical analysis where a knowledge of thermodynamic and transport properties of binary and multicomponent systems is essential in petrochemical, pharmaceutical and chemical industries for design calculations. Data on aforementioned properties of liquids and liquid mixtures play a critical role in getting an in depth knowledge of intermolecular forces and in testing the various theories which attempt to estimate the mixture properties. VISCOSITY is considered as one of the most important physical properties for calculations related to fluid flow followed by thermal conductivity and diffusivity. Literature survey reveals that it is very challenging and difficult task to develop a model which is successfully able to predict viscosity of binary and higher order liquid mixtures over a range of temperature with reasonably good predictive capability and efficacy. This arises from the fact that viscosity values are highly sensitive to temperature and concentration variation. Over the past few years, we have developed a few new and basic approaches, predictive in nature, for evaluating viscosity of binary, ternary and higher order liquid mixtures. All of these approaches employ the properties of pure components, making their usage very simple yet with good degree of accuracy. The recently developed volume fraction approach has been used, for the first time(Journal of Molecular Liquids, 265, 356-360,2018)to the best of our knowledge, for predicting viscosity of 200 binary, 25 ternary and some quaternary liquid mixtures with a very good agreement with experimental findings. References :
(1) Molecular Interaction studies based on transport, thermodynamic and excess properties of aniline and alkanol mixtures at varying temperatures, M. Swetha Sandhya, Piyashi Biswas, N.R. Vinary, K. Sivakumar, Ranjan Dey, Journal of Molecular Liquids, 278, 219-225 (2019).
(2) A Novel and effective approach for viscosity prediction of binary and multicomponent liquid mixtures, Ranjan Dey and Piyashi Biswas, Journal of Molecular Liquids, 265, 356-360 (2018).
(3) Two new models for viscosity prediction of binary, ternary and higher order liquid mixtures, Akanksha Saini, Shahswat Verma, Aditya Harshvardhan and Ranjan Dey, RSC Advances, 6, 113657–113662(2016).
(4) A Modified Frenkel Approach for Viscometric Prediction of Binary and Multicomponent Liquid Mixtures, Ranjan Dey, Akanksha Saini and Hardik Hingorani, RSC Advances, 6, 43838-43(2016).
6th Int. Conf.: Thermophysical and Mechanical Properties of Advanced Materials (THERMAM)
8thRostocker Int. Conf.: Thermophysical Properties for Technical Thermodynamics
22-24 September 2019, Çeşme, İzmir, Turkey
7
Inverse Method Based on Analytical Transfer Functions to Study a Thermomechanical Problem
Najib LARAQIa, Jean-Gabriel BAUZINa
aUniversité Paris Nanterre, Laboratoire Thermique Interfaces Environnement (LTIE)
EA 4415, 50 rue de Sèvres, 92410 Ville d’Avray – France
An inverse thermomechanical methodology is presented in this communication. We developed an analytical solution to determine the transfer function between the temperature and the mechanical deformation of a solid. We consider a rod which is heated at its end. The deformation is measured far
from the heated surface for discrete time intervals using strain gauge. We apply a deconvolution product for those measurements to identify the temperature of the heated surface. By this way, it is no longer necessary to know the temperature field to solve the thermomechanical problem. We show that the inversion procedure can be applied successfully even in situations of noised measurements by using the Tikhonov regularization method. Lastly, the surface temperature identified from the deformation measurements is compared to a temperature measurement. The same experimental device is used to identify the coefficient of thermal expansion and the thermal diffusivity.
6th Int. Conf.: Thermophysical and Mechanical Properties of Advanced Materials (THERMAM)
8thRostocker Int. Conf.: Thermophysical Properties for Technical Thermodynamics
22-24 September 2019, Çeşme, İzmir, Turkey
8
Thermophysical Properties of Ionic Liquids at High Pressures and Temperatures
Javid Safarova,b, Aytakin Guluzadec, Gulyaz Abdullayevac, Khagani Suleymanlic, Abilgani Aliyevc, Mahir Bashirovc, Egon Hassela
a Institute of Technical Thermodynamics, University of Rostock, Albert-Einstein-Str. 2, D-18059 Rostock, Germany.
b FVTR GmbH, Joachim-Jungius-Straße 9, D-18059 Rostock, Germany. c Department of Heat Energy, Azerbaijan Technical University, H. Javid Avn. 25, AZ-1073 Baku, Azerbaijan.
E-mail: [email protected]
Typical room temperature ionic liquids (ILs) are liquid salts at wide range ambient temperatures, are ideal solvents for green chemistry, clean synthesis and can be used in many cyclic processes. They are composed of bulky ions, have negligible vapor pressure, non-flammable, no cavitation at high tension, low melting point, high solvating capacity, low compressibility, high ionic conductivity etc., which make them attractive for practical applications. During the many years, various ILs were investigated using the different quality of substance, measuring methods etc. The quality of ILs at the first years of study also were not enough investigated. This problem played negative role during the experimental investigations. At the results, many different experimental results were obtained by the various authors and uncertainties of these investigations have big deviation between of them. In this work, we will present thermophysical properties of various ILs up to p = 140 MPa and over a temperature range T = (273.15 to 413.15) K together with a fundamental literature analysis:
1-ethyl-3-methylimidazolium tetrafluoroborate, [EMIM][BF4]. 1-hexyl-3-methylimidazolium tetrafluoroborate, [HMIM][BF4]. 1-ethyl-3-methylimidazolium trifluoromethanesulfonate, [EMIM][TFO]; 1-butyl-3-methylimidazolium hexafluorophosphate [BMIM][PF6]; 1-butyl-3-methylimidazolium trifluoromethanesulfonate, [BMIM][TFO].
Density ρ measurements were carried out using an Anton-Paar DMA HPM vibration-tube densimeter in the high-pressure region and an Anton-Paar DSA 5000M model at ambient pressure, respectively, with an estimated experimental relative combined standard uncertainty of Δρ/ρ = ± (0.01 to 0.08) %. Additionally, heat capacity and viscosity at p = 0.101 MPa and at temperatures T = (273.15 to 413.15) K were measured using a differential scanning calorimeters (Δcp/cp = ±0.5 %), Anton Paar SVM 3000 Stabinger (Δη/η = ± 0.35 %) and Rheometer MCR 302 (Δη/η = ±1 %) installations. The results were compared with the published literature values and an empirical multiparameter equation of state which covers the high-pressure region as well was established. The literature values available were subject to a consistency check with our data. An equation of state was established using parameters based on the new results to calculate the isothermal compressibility κT, isobaric thermal expansibility αp, thermal pressure coefficient γ, internal pressure pint, specific heat capacities at constant pressure cp and at constant volume cv, speed of sound u, and isentropic exponent κs for each IL at temperatures T = (273.15 to 413.15) K and pressures p up to 140 MPa. Keywords: density, high-pressure, high-temperature, ionic liquid, equation of state.
6th Int. Conf.: Thermophysical and Mechanical Properties of Advanced Materials (THERMAM)
8thRostocker Int. Conf.: Thermophysical Properties for Technical Thermodynamics
22-24 September 2019, Çeşme, İzmir, Turkey
9
ORAL ABSTRACTS
Synergy Effects of Graphene Nanoplatelets And Multiwalled Carbon Nanotubes on the Electrical Properties of Hdpe-Based Nanocomposites
Tuba EVGINa*, Zdenko SPITALSKYb, Alpaslan TURGUTa, Maria OMASTOVAb
a Dokuz Eylul University, Engineering Faculty, Mechanical Engineering Department, Tinaztepe Campus, 35397, Buca, Izmir,
Turkey b Polymer Institute, SAS, Dúbravská cesta 9, 845 41 Bratislava, Slovak Republic
*E-mail: [email protected]
The aim of this study was to investigate the synergistic effect of graphene nanoplatelets (GnPs) and multiwall carbon nanotubes (MWCNTs) on the electrical properties of the HDPE-based hybrid nanocomposites. In our previous works, we have shown how the addition of MWCNTs [1] and GnPs [2] and their sizes influenced the electrical conductivity of the pure HDPE. The HDPE-based nanocomposites with MWCNTs exhibit considerably higher electrical conductivity and lower percolation threshold than that of the HDPE/GnPs nanocomposites. The percolation threshold of the HDPE nanocomposites containing MWCNTs with higher aspect ratio (M12) was 2.23 wt.% [1], while this value was over 11.70 wt.% for all HDPE/GnPs nanocomposites [2]. Therefore, inspired by our previous works, we herein suggest using MWCNTs as a second filler for HDPE/GnPs nanocomposites, since MWCNTs may form a bridge between GnPs layers, which facilitates electron mobility. Due to much better performance of HDPE/M12 and HDPE/G2 nanocomposites, the amount of G2 (diameter (d)=44 µm, thickness (t)= 50-100 nm) was kept constant at 11.70 wt.% and M12 (d=10-20 nm, length (L)=10-30 µm) loading is in the range of 0.19-3.82 wt.% to investigate the synergistic effect of hybrid carbon-fillers. The samples were fabricated by the melt mixing methods, followed by the compression molding. Broadband dielectric spectroscopy (BDS) measurements were conducted by a Novocontrol Concept 40 instrument with an Alpha dielectric spectrometer supplied by Novocontrol Technologies GmbH (Germany). The conducting pathways of MWCNTs-GnPs-MWCNTs or GnPs-MWCNTs-GnPs in the HDPE/G2 (11.70 wt.%)/M12 increased with increasing of MWCNTs loading that causes an increment in the rate of electron hopping and/or tunneling. For example, the addition of 3.88 wt.% of MWCNTs M12 to the HDPE/G2 (11.70 wt.%) nanocomposite increases the electrical conductivity from 3.41×10⁻¹⁵ to 6.76×10⁻⁵ S/cm. This value is almost four orders of magnitude higher than that of the HDPE/G2 nanocomposite with the same total concentration (5.10×10⁻⁹ S/cm), however almost two orders of magnitude lower than that of the HDPE/M12 nanocomposite (5.08×10⁻³ S/cm). The percolation threshold for the HDPE/G2 (11.70 wt.%)/M12 nanocomposites is between 0.2 and 1 wt.% of M12 loadings, i.e it is between 11.90 and 12.70 wt.% of total hybrid filler materials. This value is at least 25 % lower than the percolation threshold of the HDPE/G2 nanocomposites. Results clearly showed that the addition of M12 into the HDPE/G2 (11.70 wt.%) nanocomposites leads to increase of the conductivity and decrease in the percolation threshold. Keywords: Polymer nanocomposites, graphene nanoplatelets (GnPs), multiwall carbon nanotubes (MWCNTs), electrical conductivity References [1] T. Evgin et al., “Effect of aspect ratio on thermal conductivity of high density polyethylene/multi-
walled carbon nanotubes nanocomposites,” Compos. Part A Appl. Sci. Manuf., vol. 82, pp. 208–213, 2016.
[2] T. Evgin et al., " Size effect of graphene nanoplatelets on the properties of high density polyethylene nanocomposites: Morphological, thermal, electrical and mechanical characterizations," The Beilstein Journal of Nanotechnology- Under Review
6th Int. Conf.: Thermophysical and Mechanical Properties of Advanced Materials (THERMAM)
8thRostocker Int. Conf.: Thermophysical Properties for Technical Thermodynamics
22-24 September 2019, Çeşme, İzmir, Turkey
10
Determination of the Optimum Operating Parameters of a Cascade Cooling System Using the R245fa (1,1,1,3,3- Pentafluoropropane) Refrigerant
Halil ATALAYa
a Department of Mechanical Engineering, Yozgat Bozok University, 66200, Yozgat, Turkey.
E-mail: [email protected]
Successive two-stage refrigeration systems are widely used, especially for low-temperature applications of vapor compression cooling cycles. One of the important steps to be taken for the more efficient operation of such systems is the selection of the refrigerant to be used in the system. Because achieving the highest COP value in refrigeration cycle depends particularly on the selection of refrigerant and the optimal determination of the operating parameters. R245fa (1,1,1,3,3-Pentafluoropropane) refrigerant is used as an ideal refrigerant for Organic Rankine Cycle especially at low temperatures. In this study, as an example, a two-stage refrigeration cycle model using R45fa refrigerant was developed and the optimal operating conditions of the system were determined. For this purpose, a simulation model has been developed by using Java language. In this model, stochastic (statistical) optimization methods have been utilized to prevent possible errors. In addition, a separate simulation model has been improved in the Java language for calculating the thermodynamic properties of all phases of the refrigerants. In the simulation study developed for the determination of thermodynamic properties, the properties for the liquid and superheated vapor zones were determined using the Helmholtz real gas state equation. The saturation properties of the refrigerants were also calculated using the cubic spline polynomial equations. It has been observed that the results obtained from this simulation study are significantly compatible with the actual cooling cycle and the model developed in this study will provide significant advantages, especially in the system design and analysis stage in industrial cooling applications.
Keywords: Refrigerants, thermodynamic properties, R245fa, Cascade cooling cycles.
6th Int. Conf.: Thermophysical and Mechanical Properties of Advanced Materials (THERMAM)
8thRostocker Int. Conf.: Thermophysical Properties for Technical Thermodynamics
22-24 September 2019, Çeşme, İzmir, Turkey
11
Effect Of Fullerenes C60 On Heat Capacity, Density, Thermal Conductivity And Viscosity Of Tetralin
Vitaly ZHELEZNYa, Olga KHLIYEVAa, Artem NIKULINb, Anastasiia NIKULINAc, Igor MOTOVOYa, Olena
MELNYKa, Vladimir BORISOVa Sandra I.G. Diasd, Ana MOITAd, António Luis MOREIRAd
a Department of Thermal Physics and Applied Ecology, Institute of Refrigeration, Cryotechnology and Eco-Energy,
Odessa National Academy of Food Technologies, 112, Kanatnaya St., 65039, Odessa, Ukraine. b CIC Energigune, Albert Einstein, 48, Minano, Alava, 01510, Spain.
c Independent Researcher. d IN+, Instituto Superior Técnico, Av. Rovisco Pais, 1, 1049-001 Lisboa, Portugal.
E-mail: [email protected]
One of the promising ways to improve the efficiency of solar power plants is the use of nanofluids instead of the traditional working fluids. To achieve the maximum efficiency of solar power plants, researchers pay considerable attention to both the thermophysical properties of working fluids and their ability to absorb solar energy. The use of nanotechnology allows purposefully to change thermophysical properties of high-temperature working fluids and to regulate the absorptive capacity of the rays of the sun. Moreover, the additives of nanoparticles to the working fluid may enhance the heat transfer processes in the heat exchange equipment. Thereafter, it results in decrease of their mass and dimensions, and consequently costs reduction for equipment production. Therefore, the influence of perspective types of nanoparticles, their size and concentration on the thermophysical properties of working fluids remains relevant. Tetralin (CAS 119-64-2) has been previously used as a coolant in nuclear power plants [1]. Thus, it can be considered as a promising high-temperature working fluid for solar energy due to its appropriate thermophysical properties and the ability to dissolve carbon nanoparticles. However, thermophysical properties of the solutions of tetralin with fullerenes C60 are still not studied. In present study the experimental results for the density, viscosity and heat capacity of tetralin/fullerene C60 solutions are reported in the temperature range from 280 K to 450 K and in the range of fullerenes concentrations up to 0.6 mass%. The density measurements of tetralin/C60 were carried out using a variable volume pycnometer with an uncertainty of 0.12%. The viscosity was measured by the capillary viscometer with a suspended level with an uncertainty of 0.5%. The isobaric heat capacity was measured on a variable-temperature adiabatic calorimeter with an uncertainty of 0.5%. Thermal conductivity was measured using an experimental setup that implements the transient hot-wire method. Tantalum wire with a diameter of 25 μm and a length of 71 mm was used as a sensing element. Thermal conductivity experiments were carried out in the temperature range from 290 to 340 K and in the range of fullerenes concentrations up to 0.7 mass% with an uncertainty of 3%. Based on the experimental results, it was shown, that the additives of fullerenes contribute to an slightly increase the density and decrease the heat capacity (up to 2.3 %) of tetralin. The effect of fullerenes C60 on thermal conductivity does not exceed 1.2%. The viscosity of tetralin with 0.5 mass % of C60 can be either lower than viscosity of pure tetralin at temperature below 350 K (up to 2 %), or higher the viscosity of tetralin when temperature more than 350 K (up to 1 %). Consequently, the report provides an analysis of the temperature and concentration dependences of the studied properties of tetralin/C60 solutions. Keywords: Tetralin/fullerenes C60, Density, Heat capacity, Thermal conductivity, Viscosity 1. Chikazawa, Y., Farmer, M., & Grandy, C. (2009). Technology gap analysis on sodium-cooled reactor fuel-handling system supporting advanced burner reactor development. Nuclear Technology, 165(3), 270-292.
6th Int. Conf.: Thermophysical and Mechanical Properties of Advanced Materials (THERMAM)
8thRostocker Int. Conf.: Thermophysical Properties for Technical Thermodynamics
22-24 September 2019, Çeşme, İzmir, Turkey
12
Temperature And Concentration Dependencies Of Density And Viscisity For The Fullerene C60 Solutions In O-Xylene
Katerina KHANCHYHC, Igor MOTOVOY, Vitaly ZHELEZNY, Olga KHLIYEVA, Evgeniy DMITRIEV, Konstantin TUMBURKAT
Department of Thermophysics and Applied Ecology, Institute of Refrigeration, Cryotechnology and Eco-Energy, Odessa National Academy of Food Technologies, 112, Kanatnaya St., 65039, Odessa, Ukraine.
E-mail: [email protected]
Nowadays application of nanotechnology is one of the most promising ways to improve the efficiency of energy equipment. The additives of nanoparticles increase the thermal conductivity, saturated vapor pressure, decrease the surface tension and may enhance the heat transfer processes with and without phase change. Moreover, it has been shown that nanoparticles like fullerenes contribute to the reduction of the friction in the mating parts and increase the energy efficiency of the vapor compression refrigeration machines [1]. However, despite these advantages, the prospects of fullerenes usage in power equipment remain insufficiently studied. The temperature and concentration dependences of density and viscosity of the solutions containing fullerenes at low concentration remain insufficiently studied. Furthermore, physical mechanisms behind those effects have not been fully studied. This study presents an experimental results for the density and viscosity of o-xylene/fullerenes C60 solutions. The experiments were carried out in the temperature range 280-350 K and concentrations up to 0.47 mass%. The density measurements of were carried out using a variable volume pycnometer with an uncertainty of ±0.0010 cm3 (0.13%). The viscosity was measured by the capillary viscometer with a suspended level with an uncertainty of 0.5%. The performed analysis indicate to a similarity between the concentration dependence of the density and viscosity of the investigated samples. At the concentrations up to 0.05 mass%, the density and viscosity of the solutions o-xylene/fullerenes C60 decreases as compared to pure o-xylene (on isotherms). At the concentrations of fullerenes higher than 0.05%, the density and viscosity of the solutions o-xylene/ fullerenes C60 increases. Based on the experimental results, we can conclude that the concentration dependence of the density and viscosity of the solutions o-xylene/fullerenes C60 is determined by two factors: fluctuational (up to 0.05 mass% of fullerenes) and concentrational (when concentration of C60 is higher than 0.05 mass%). 1. Ku B.C., Han Y.C., Lee J.E., Lee J.K., Park S.H. Tribological effects of fullerene (C60) nanoparticles added in mineral lubricants according to its viscosity // Int. J. Precis. Eng. Man. 2010. Vol. 11. P. 607-611.
6th Int. Conf.: Thermophysical and Mechanical Properties of Advanced Materials (THERMAM)
8thRostocker Int. Conf.: Thermophysical Properties for Technical Thermodynamics
22-24 September 2019, Çeşme, İzmir, Turkey
13
Thermal Diffusivity Measurements of Phase Change Materials in the Liquid Phase for Latent Thermal Energy Storage
Dr. Daniel LAGER, MSca
a Sustainable Thermal Energy Systems, Center for Energy, Austrian Institute of Technology, Giefinggasse 2, 1210 Vienna,
Austria E-mail: [email protected]
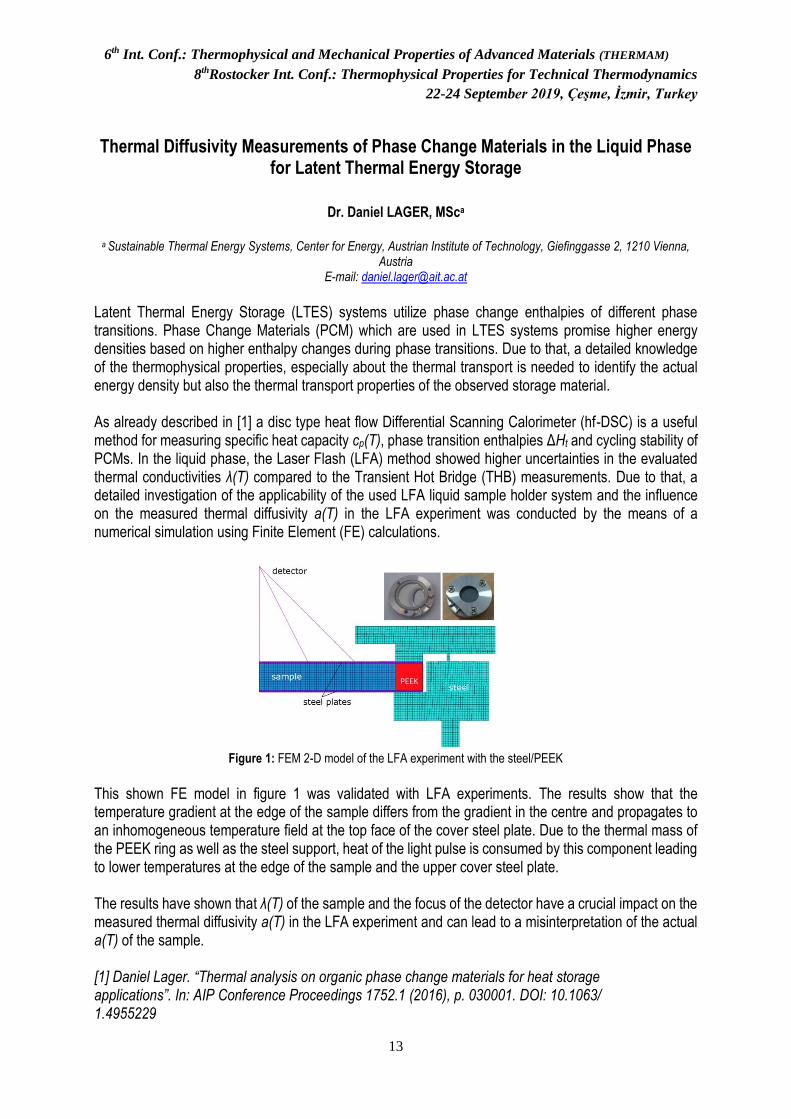
Latent Thermal Energy Storage (LTES) systems utilize phase change enthalpies of different phase transitions. Phase Change Materials (PCM) which are used in LTES systems promise higher energy densities based on higher enthalpy changes during phase transitions. Due to that, a detailed knowledge of the thermophysical properties, especially about the thermal transport is needed to identify the actual energy density but also the thermal transport properties of the observed storage material. As already described in [1] a disc type heat flow Differential Scanning Calorimeter (hf-DSC) is a useful method for measuring specific heat capacity cp(T), phase transition enthalpies ΔHt and cycling stability of PCMs. In the liquid phase, the Laser Flash (LFA) method showed higher uncertainties in the evaluated thermal conductivities λ(T) compared to the Transient Hot Bridge (THB) measurements. Due to that, a detailed investigation of the applicability of the used LFA liquid sample holder system and the influence on the measured thermal diffusivity a(T) in the LFA experiment was conducted by the means of a numerical simulation using Finite Element (FE) calculations.
Figure 1: FEM 2-D model of the LFA experiment with the steel/PEEK
This shown FE model in figure 1 was validated with LFA experiments. The results show that the temperature gradient at the edge of the sample differs from the gradient in the centre and propagates to an inhomogeneous temperature field at the top face of the cover steel plate. Due to the thermal mass of the PEEK ring as well as the steel support, heat of the light pulse is consumed by this component leading to lower temperatures at the edge of the sample and the upper cover steel plate. The results have shown that λ(T) of the sample and the focus of the detector have a crucial impact on the measured thermal diffusivity a(T) in the LFA experiment and can lead to a misinterpretation of the actual a(T) of the sample. [1] Daniel Lager. “Thermal analysis on organic phase change materials for heat storage applications”. In: AIP Conference Proceedings 1752.1 (2016), p. 030001. DOI: 10.1063/ 1.4955229

6th Int. Conf.: Thermophysical and Mechanical Properties of Advanced Materials (THERMAM)
8thRostocker Int. Conf.: Thermophysical Properties for Technical Thermodynamics
22-24 September 2019, Çeşme, İzmir, Turkey
14
Heating Characteristics of Cherry Juice in an Inductive Heat Exchanger
Orhan KAYAa , Filiz ICIERb
a Ege University, Institute of Natural and Applied Sciences, Food Engineering Section, 35100 Bornova, Izmir, Turkey b Ege University, Engineering Faculty, Food Engineering Department, 35100 Bornova, Izmir, Turkey
E-mail: [email protected]
Induction heating is based on suppliance of energy by electromagnetic induction. When alternating current flows through the induced coil, an electromagnetic field is formed around the coil. This electromagnetic field induces high currents in the ferromagnetic materials and the resistance of the material to the current generates heat in the ferromagnetic material. Induction heating technology provides rapid, clean, non-polluting and high energy efficient heating. The aim of this study is to determine the heating characteristics of the cherry juice in a custom designed inductive heat exchanger. The heating capability of cherry juice was investigated by applying 3 different constant pipe wall temperatures (80-90-100°C) at 3 different flow rates (200-250-300 ml/min). It was aimed to heat the cherry juice from 27±2°C to the target temperature of 75 °C. The pipe wall temperatures were kept constant by using a PI controller. It was determined that the time to reach the target temperature of the cherry juice decreased with increasing the constant pipe wall temperature. Also, it was concluded that the time to reach the target temperature of the cherry juice decreased with the reduction of the flow rate of cherry juice. The cherry juice was heated in the shortest time (123.3±4.94 s) at a flow rate of 200 ml/min with the constant pipe wall temperature of 100 °C. It was determined that the lowest energy consumption value was obtained by setting the pipe wall temperature to constant 80 °C. The energy consumption value increased as the constant pipe wall temperature increased. A comprehensive study on determination of different process conditions affecting quality and performance characteristics of fruit juices in an inductive heat exchanger is still in progress.
Keywords: cherry juice, induction, heat exchanger, energy, heating
6th Int. Conf.: Thermophysical and Mechanical Properties of Advanced Materials (THERMAM)
8thRostocker Int. Conf.: Thermophysical Properties for Technical Thermodynamics
22-24 September 2019, Çeşme, İzmir, Turkey
15
Characteristics of Free Surface Vortex Flows Under Effects of Rotation and Buoyant- Thermocapillary Convection
Malika IMOULAa, Rachid SACIb, Mustapha FEKHARC
a, c Dynamics of Motors and Vibroacoustics laboratory, University of Boumerdes, Avenue of Independence, 35 000, Algeria. b Physics Department , Faculty of science, University of Boumerdes, Avenue of Independence, 35 000, Algeria.
E-mail: [email protected], [email protected]
The characteristics of confined free surface swirling flows, driven by the combined effects of differential rotation and buoyant–thermocapillary convection are investigated numerically. Interest is mainly focused on the onset conditions of flow stagnation and associated reverse flow regions. As a basic isothermal configuration, we first consider the open top rotor-stator cylindrical configuration with a central thin rod, filled with an incompressible Newtonian fluid. Over a given range of Reynolds number Re, the flow pattern is shown to exhibit axisymmetric on-axis bubble and/or off-axis toroidal type vortices, in accord with the literature. Streamlines and velocity fields revealed that very small temperature gradients between the rod and the ambient medium are sufficient to alter significantly the flow topology. In particular, a warm rod is shown to enhance the onset of reverse flow circulations while a cool rod tends to suppress them. Besides, under very small temperature variations, thermocapillary convection induced by surface tension gradient is shown to efficiently control the free surface stagnation as well as the entire bulk meridian circulation. This influence, as expected, becomes more pronounced in the absence of gravity. However, with increasing rod temperature, buoyancy predominates; reducing drastically the angular momentum transfer from the disk towards the surface. Keywords: vortex flows, cylinder, central rod, buoyancy, surface tension.
6th Int. Conf.: Thermophysical and Mechanical Properties of Advanced Materials (THERMAM)
8thRostocker Int. Conf.: Thermophysical Properties for Technical Thermodynamics
22-24 September 2019, Çeşme, İzmir, Turkey
16
Study Of Thermophysical Properties of Carbonate Stones by Means of the Pulse Transient Technique and Analysis of the Effects of Thermal Heat Resistance and
Heat Capacity of Heat Source Accounted in Slab Model.
Vlastimil BOHÁČa, Rupali TIWARIa, Peter DIEŠKAb, Gregor Götzlc
a Institute of Physics, Slovak Academy of Sciences, Dúbravská cesta 9, 85101 Bratislava, Slovakia b Institute of Nuclear and Physical Engineering, Faculty of Electrical Engineering and Information Technology, STU in
Bratislava Ilkovičova 3, 812 19 Bratislava 1, Slovakia c Geological Survey of Austria, Neulinggasse 38, 1030 Vienna, Austria
E-mail: [email protected]
The purpose of this analytical study is to provide quantitative data in the presence of the thermal contact effects represented by the heat capacity of the heat source and the contact heat resistance solved by introducing the heat transfer coefficient in between the heat source and specimen body. Both effects influence the onset increase of the temperature response and subsequently cause thermal history in the next temperature response development. The batch of carbonate stones having different volume densities were measured by pulse transient method using slab model for parameters estimation procedure. The stones differ by structure, porosity, density, etc. The stone volume density was taken as driven parameter for the material inter-comparison because it depends on number of defects homogeneity and the state of structure and. Subsequently, the non-homogeneity of stones causes structure fluctuations and thus the change of thermal properties. In theoretical part the paper discuss the analysis of the model for temperature response function derived for the geometry of the infinitively large slabs having final thicknesses. The slab model accounts the heat capacity of the heat source as well as the contact heat resistance by introducing the heat transfer coefficient in between the heat source and the specimen body. Carbonate stones were obtained by field works from different part of Carpathian Mountains. The data will be useful for thermal calculations and optimization of the heat energy storage systems. Keywords: transient pulse method, slab model, thermal properties of stone materials Acknowledgements: This work was supported by the Scientific Grant Agency VEGA grant No. 2/0192/17 “Development of sensors and measurement methods for transient techniques for the measurement of thermophysical properties of materials and their application for seasonal storage of heat energy” and by grant GeoPLASMA-CE “Shallow Geothermal Energy Planning, Assessment and Mapping Strategies in Central Europe”.
6th Int. Conf.: Thermophysical and Mechanical Properties of Advanced Materials (THERMAM)
8thRostocker Int. Conf.: Thermophysical Properties for Technical Thermodynamics
22-24 September 2019, Çeşme, İzmir, Turkey
17
Impact of the Temperature Over 100°C on the Drying Kinetics, Thermophysical and Transport Properties of Dried Apple
Nasim KIAN-POURa, Sukru KARATASa*
a Department of Food Engineering , Istanbul Aydin University, Inönü, Küçükçekmece, 34295, Istanbul, Turkey.
E-mail: Şükrü KARATAŞ. [email protected]
The present work studied the feasibility of applying temperatures above 100°C to improve the engineering properties of apple dried with convective air dryer, as an interesting alternative to common temperatures (below 100°C). In order to investigate the influence of air temperature and samples' geometry on the drying kinetics, transport and thermo-physical properties of apple, different geometrically-shaped samples (square, circle, and triangle) with equal surface area and aspect ratio, were dried by the air with a velocity of 1.75 m/s and saturation humidity of Hs=25°C at 110, 115 and 120°C. To address the most appropriate drying equations, 6 commonly-used mathematical models were fit with the experimental results. The statistical and nonlinear regression analyses confirmed that the Midilli & Kucuk model was the best equation to predict the drying characteristic of all samples. Drying was accomplished in the falling rate period, which represented that diffusion was the main factor in the control of the drying process. According to the Fick’s second law of diffusion, the values of diffusion coefficients were in the range of 1.77 ×10⁻⁹ - 3.19 × 10⁻⁹ (m²/s). Besides, the relations derived from general molecular transport equations of Newton’s, Fourier’s and Fick’s law were used to calculate momentum, heat and mass transfer, respectively. The results revealed that drag forces, heat and mass transfer coefficients, thermal conductivities and specific heat varied from 2.796 - 3.331 (N), 32.06 - 38.14 (W/m² K), 0.02644 - 0.03156 (m/s), 0.557 - 0.580 (W/m.K), and 3722.13 - 3863.11 (J/kg.K), respectively. The results showed that triangle-shape samples could have the potential to improve the air drying of apples in terms of drying time and diffusion coefficient at an industrial extent. Also, the impact of temperatures above 100°C on the decrease of drying times and the increase of the moisture diffusivity of the apples was highlighted, which could bring the use of these temperatures closer to potential industrial use. Keywords: Heat transfer coefficient, Mass transfer coefficient, Mathematical modelling, Thermo-physical property, Drying kinetics.
6th Int. Conf.: Thermophysical and Mechanical Properties of Advanced Materials (THERMAM)
8thRostocker Int. Conf.: Thermophysical Properties for Technical Thermodynamics
22-24 September 2019, Çeşme, İzmir, Turkey
18
Usage Possibility of Grape Pomace in Compound Chocolate Instead of Sugar, Whey and Milk: Effect on Thermal and Rheological Properties
Kubra BURSAa, Mahmut KILICLIa, Omer Said TOKERa, Ibrahim PALABIYIKb, Nevzat KONARc, Betül Gizem ACANa, Mehmet GULCUd
a Food Engineering Department, Chemical and Metallurgical Engineering Faculty, Yildiz Technical University, İstanbul,
Turkey b Food Engineering Department, Faculty of Agriculture, Namık Kemal University, Tekirdag, Turkey
c Department of Food Engineering, Faculty of Architecture and Engineering, Siirt University, Siirt, Turkey d Ministry of Agriculture and Forestry, Food Control Laboratory Directorate, Balıkesir, Turkey
E-mail: [email protected]; [email protected]
Chocolate is a widely consumed fat-based product in the world and mainly composed of cocoa, sugar, cocoa butter, whey, milk powder and emulgators depending on the type of the products. Compound chocolate, cocolin, is produced using vegetable-based fat instead of cocoa butter. In the present study, grape pomace, waste of the grape juice production and rich in resveratrol content, was used in the compound chocolate formulation instead of sugar, whey and milk powder. For this aim, mixture design was performed to observe if it is possible to use grape pomace in the formulation. Prepared formulations included grape pomace, sugar and whey/milk powder between 1.5-15%, 25-40% and 6-21%, respectively. Particle size and rheological properties of the produced samples were determined. Particle size of the samples changed between 41.4 and 150.4 μm and it increased with increasing grape pomace level. Regarding rheological properties, all of the samples showed shear thinning behavior meaning that apparent viscosity decreased with increasing shear rate. Casson model well explained the relation between shear rate and shear stress values with R2 values ranged between 0.9895 and 0.9936. Yield stress and plastic viscosity values of the produced samples varied between 1.194-4.122 Pa and 1.061-1.922 Pa.s, respectively. According to the modelling results, as yield stress decreased with increasing pomace concentration, plastic viscosity increased. Thermal properties of chocolate, start and end of the melting tempearture, were determined using gap method composed of change in upper and lower part of plates as a result of melting of the samples resulted from temperature increase. Start and end points of the melting temperature of the samples change between 22.91-24.51ºC and 37.53-39.77ºC, which are not significantly affected by grape pomace usage in the formulation. The findings of the present study highlighted that grape pomace can be used in compound chocolate formulation instead of sugar and whey/milk powder to improve functional characteristics and to decrease cost of the compound chocolates. This work was funded by the Scientific and Technological Research Council of Turkey (TUBITAK), Project No: 217O054. Keywords: Compound chocolate, Melting, Rheology, Recycling of waste, Gap method
6th Int. Conf.: Thermophysical and Mechanical Properties of Advanced Materials (THERMAM)
8thRostocker Int. Conf.: Thermophysical Properties for Technical Thermodynamics
22-24 September 2019, Çeşme, İzmir, Turkey
19
Non-Linear Model Predictive Control of a Vapor Compression Refrigeration Cycle
Mert Sinan TURGUTa, Oguz Emrah TURGUTb, Mustafa Turhan ÇOBANc
a Department of Mechanical Engineering, Ege University, 35040 Bornova, Izmir, Turkey.
b Department of Mechanical Engineering, Bakircay University, 35665 Menemen, Izmir, Turkey. c Department of Mechanical Engineering, Ege University, 35040 Bornova, Izmir, Turkey.
E-mail: [email protected]
This paper is about the non-linear model predictive control (NMPC) of a basic vapor compression refrigeration cycle (VCC). The basic VCC consists of four components, namely the evaporator, condenser, compressor and expansion valve. The expansion valve utilized in this study is considered to be an electronic expansion valve (EEV) for the control purposes. Following techniques are utilized for the modeling of the VCC. Lumped parameter moving-boundary (MB) method is utilized for the modeling of the heat exchangers and static relationships are used for the modeling of the compressor and EEV. In the MB method, each phase that occurs in the heat exchanger is treated as a separate control volume and phase transition zones are modeled as time-dependent moving-boundaries. Thermodynamical and thermophysical properties of the fluid in the heat exchanger are calculated as lumped avarages for the each phase. The model validation study of the developed model is carried out with comparing the three selected outputs of the developed model with that of the model developed with ASPEN software with the same design properties. The ASPEN model outputs proved the validity of the developed model. Afterwards, an Articial Neural Network (ANN) is trained in off-line manner with the selected input-output combinations of the developed model. Prediction capability of the ANN is tested with comparing the outputs of the ANN with that of the developed model for the same inputs. The results showed that the ANN is fitted well and can accurately predict the outcomes of the model. Finally, the NMPC controller is implemented that utilizes the ANN as the main model of the VCC. The Whale Optimization Algorithm (WOA) is applied for the solution of the optimization problem that NMPC generates for the each time step. Performances of the four separate controllers are compared with each other, namely the cooling load, first law efficiency, entropy generation and second law efficiency controllers. Each controller are named after their unique performance objectives except the cooling load controller which considers only the common objective, that is cooling load trajectory tracking. By looking at the results, it has been seen that the entropy generation controller achieved the most desirable exergy destruction performance with 0.2% lower than that of the cooling load controller. The cooling load controller performed worst among the other controllers as expected. Moreover, the second law efficiency controller gave the highest overall second law efficiency throughout the simulation time. Keywords: Vapor Compression Refrigeration Cycle, Control Systems, Artificial Neural Networks, Whale Optimization Algorithm.
6th Int. Conf.: Thermophysical and Mechanical Properties of Advanced Materials (THERMAM)
8thRostocker Int. Conf.: Thermophysical Properties for Technical Thermodynamics
22-24 September 2019, Çeşme, İzmir, Turkey
20
DNA Nanobundles as Smart Drug Carriers
Aykut BILIRa, Necdet SAGLAMa
aDepartment of Nanotechnology and Nanomedicine, Hacettepe University, 06800, Ankara, Turkey
E-mail: [email protected]
Despite promising development of drugs over the past 50 years, effective delivery of the drugs to diseased
cells still remains a challenge. Nanoparticles have been used widely as drug carriers due to their high
delivery efficiencies and potential to break cellular drug resistance. However, their biocompatibility issues
and difficulty to engineer spatially addressable surfaces limits their widespread use. Alternatively, DNA is
inherently biocompatible and highly suitable for adding desired functionality to the tailored DNA shapes.
Since Nadrian C. Seeman suggested DNA as building block for bottom-up self assembly, numerous
nanostructures designed and developed based on Watson-Crick base pairing. By 2006 DNA origami
technique was invented and made possible to build 2D and 3D DNA nanostructures. Here to build drug
carrier system and overcome aforementioned limitations of nanoparticles we employed DNA origami, the
most versatile and common technique for nanostructure fabrication. Thermal annealing of 7-8 kb long
single-stranded DNA with hundreds of complementary distinct short ‘staple’ strands formed nanobundles.
Then gentamicin was chosen as model drug and loaded to this nanostructure via electrostatic binding and
characterized by EMSA (Electrophoretic mobility shift assay). A high level of drug loading efficiency was
achieved. Cytotoxicity of drug loaded nanostructures assessed by cell viability assay and showed
satisfactory results. The proposed approach presents efficient, biocompatible drug and carrier and shows
great potential of DNA nanostructures as cellular delivery vehicles as alternative to nanoparticle, polymer
and viruses.
Keywords: dna, nanotechnology, dna origami, drug delivery, nanomedicine

6th Int. Conf.: Thermophysical and Mechanical Properties of Advanced Materials (THERMAM)
8thRostocker Int. Conf.: Thermophysical Properties for Technical Thermodynamics
22-24 September 2019, Çeşme, İzmir, Turkey
21
Simulation and Design Optimization of Al Alloy Wheels Subjected to Biaxial Fatigue Loading
Ali KARAa, Meric ISIKa
aCMS Jant ve Makina A. Ş.
E-mail: [email protected] , [email protected]
As a responsible element to transfer road loads to the suspension system, passenger car wheels are subjected to time-varying load history affected by road conditions, and even by the tire used. Due to increase in use of aluminum alloy wheels in passenger cars, validation of performance of wheels for this type of loading became very important. In addition to constant amplitude fatigue requirements such as dynamic cornering or radial fatigue tests, flat track roll rig test or ZWARP (Biaxial Fatigue Test) test can be used to identify the durability of wheels under time varying load histories. Therefore, this study aimed to investigate the simulation and design optimization of Al alloy wheels under biaxial fatigue loading. LBF.WheelStrength simulation software was used coupled with ANSYS WB. Statistical design optimization using Design of Computational Experiments was conducted to obtain the optimum spoke cavity geometry for wheels by using Minitab 18.0 statistical software with objectives of stress and weight minimization. Keywords: Aluminum alloy wheel, Biaxial fatigue loading, Simulation, Optimization

6th Int. Conf.: Thermophysical and Mechanical Properties of Advanced Materials (THERMAM)
8thRostocker Int. Conf.: Thermophysical Properties for Technical Thermodynamics
22-24 September 2019, Çeşme, İzmir, Turkey
22
Numerical Investigation and Optimization of Dynamic Cornering Fatigue Behaviour and Natural Frequency of Aluminium Alloy Wheels
Ali KARAa, Meric ISIKa,Omer Burak CE
aCMS Jant ve Makina A. Ş.
E-mail: [email protected] , [email protected], [email protected]
The wheels are the parts which have critical importance, work under static and dynamic loads in vehicles. Therefore, in the design phase, based on the vehicle which the wheels are used for, before the production phase various mechanical analyses after, the production phase various tests carry on the wheels under the loads which are calculated related with standards. Some of these tests are dynamic cornering fatigue test, resonance test, biaxial fatigue test, radial fatigue test, 13° impact test, 90° impact test, compression of inner rim test and ZWARP test. All of the aforementioned tests can be performed in CMS mechanical laboratory. However, in order to perform these tests, the wheel must be manufactured. To provide cost advantage, finite element analyses are frequently used tools for the design validation step. Shortening the design validation phase is important for design process efficiency. Within the scope of the study, optimization studies were carried out which would benefit the shortening of the design process. The wheels work with many different parts while driving. During driving, the wheel is subjected to different periodic road-borne or vehicle-borne loads. Under these combined forces, the wheels might have fatigue cracks after the critical cycles. In addition, the wheels may resonate with other parts under operating conditions due to their natural frequency. In order to prevent the resonance of the parts on the vehicle and to determine the wheel stiffness, natural frequency analyses were performed. On the other hand, cornering fatigue conditions were analyzed with Ansys Workbench 19.0 package program in accordance with ISO 3006: 2015 dynamic cornering fatigue standard. In this study, 12 measurements on the wheel were used as input for the experimental design and the effects of the parameters on fatigue - frequency analysis were determined. As a result, optimization studies were carried out in order to minimize weight and maximize strength by considering the effects of parameters. Keywords: Aluminium alloy wheel, Optimization, Fatigue, Frequency
6th Int. Conf.: Thermophysical and Mechanical Properties of Advanced Materials (THERMAM)
8thRostocker Int. Conf.: Thermophysical Properties for Technical Thermodynamics
22-24 September 2019, Çeşme, İzmir, Turkey
23
The Effect of MGO Concentration on Physical Properties of MGO Thin Films
NADJAT CHAOUCH1,*, SAID LAKEL1,2 , SAID BENRAMACHE2
1Department of Technology, University Batna 2, 05000 , Batna , Algeria.
2 Material Sciences Department, Biskra University, 07000 Biskra, Algeria . 1Laboratory of Photonic Physics and Nanomaterials Multifunctional,
University of Biskra, 07000 Biskra, Algeria. E-mail: [email protected]
In this work, we have studied the role of solution molarity on the physical properties of MgO thin films. the MgO solution was prepared by dissolving the Magnesium chloride hexahydrate in the volume equal to H2O with variation of molarity in the rang of 0.05 to 0.2 mol.l-1. MgO thin films were deposited by pneumatic spray technique on the glass substrate at a 400 c° with 10 minutes.The obtain results of this work show that the MgO thin films having a cubic structure with (220) phase oriented the the minim crystallite size was found with 0.1 mol.l-1 .the overage transmittance is located in the rang of 75%-80%, in the visible region .the measurements optical band gap are 6.30, 6.50 ,7.60 and 6.70 ev of the prepared MgO films with 0.05, 0.10, 0.15 ,0.20 with respectively.The prepared MgO thin films can be used for photovoltaic application. Keywords: MgO; Thin films ; Optical gap.
6th Int. Conf.: Thermophysical and Mechanical Properties of Advanced Materials (THERMAM)
8thRostocker Int. Conf.: Thermophysical Properties for Technical Thermodynamics
22-24 September 2019, Çeşme, İzmir, Turkey
24
Development of Textile Reinforced Flexible Thermoplastic Laminates for Impact Resistance
Sinem OZTURKa, Utku VAROLa, Bekir BOYACIa , Tuba ALPYILDIZb
a Sun Tekstil San. ve Tic. A.Ş., Ar-Ge Merkezi, Yedi Eylül Mah. Celal Umur Cad. No:6/A, 35860, Torbalı, İzmir, TURKEY.
b Department of Textile Engineering, Dokuz Eylul University, Adatepe Mah. Doğuş Cad No:207,35390, Buca, İzmir, TURKEY. E-mail: [email protected]
Body armors are any defensive coverings worn to protect the body from impact attacks such as not only bullets but also stabs, blocks and particles with impact velocities. With the recent innovations in materials and manufacturing techniques, soft and rigid composites reinforced with textiles are offered to provide body armor with improved protection levels at a significant reduced weight: a potent combination for enhancing the effectiveness and mobility of military trrops, law enforcement officers and security personnel as body armors must be worn to be effective; weight and comfort are as important as the functionality.
In this study, it is aimed to investigate the effect of flat-bed lamination process parameters on the impact performances of the composites manufactured using thermoplastic matrix and textile reinforcement to be used as body armor. With this aim, TPU film is used as the thermoplastic matrix and different layers of woven fabrics made of aramid and glass fibres as the reinforcement. Considering the fibre orientation of the reinforcement (to be in 0 and 90), laminations are performed in two main directions and with three different methods. During the composite manufacturing, lamination process temperature, pressure and speed of the machine are the process parameters, thus effects of these process parameters on the adhesion and stab impact performances of the composites are investigated. The thermoplastics composites with standard accepted impact performances are laminated with warp knitted 3D fabrics (which are developed and manufactured within Ames Europe Textile especially for personal body protection) to improve comfort and impact performances. Thermoplastic composites manufactured with 5 layers of aramid woven fabrics (0/0/0/0/0) laminated with TPU films in between at 180C with 3m/mm process speed are found to have high impact performances to be used as personal body protector against 15J impacts of blocks/particles. It is seen that, with the increase of the lamination process temperature thermoplastic composites with impact performances could be performed in lesser process speed, which should be considered for the cost and performance optimization of the composites. With the manufacture of hybrid composites by laminating the 3D warp knitted fabric, it is found that the impact performances of thermoplastic composites have increased to be used as personal body protector against 40J impacts of blocks/particles. Keywords: textile, lamination, impact, thermoplastic film, thermoplastic laminates Acknowledgement
The authors are greatly indebted to the TUBITAK Research Foundation for providing financial support 1150547- Mekanik Etkilere Dayanımlı Esnek Formda Kişisel Koruyucu Hibrit Tekstil Yapılarının Geliştirilmesi.
6th Int. Conf.: Thermophysical and Mechanical Properties of Advanced Materials (THERMAM)
8thRostocker Int. Conf.: Thermophysical Properties for Technical Thermodynamics
22-24 September 2019, Çeşme, İzmir, Turkey
25
Theoretical Prediction of the Contact Angle Independent from the Volume Effect
Nur COBANOGLUa, Alper Mete GENCa, Sıla Ovgu KORKUT UYSALb, Ziya Haktan KARADENIZc, Matthias
H. BUSCHMANNd
a Graduate School of Natural and Applied Sciences, İzmir Kâtip Çelebi University, 35620, İzmir, Turkey.
b Department of Engineering Sciences, İzmir Kâtip Çelebi University, 35620, İzmir, Turkey c Department of Mechanical Engineering, İzmir Kâtip Çelebi University, 35620, İzmir, Turkey
d Institut für Luft- und Kältetechnik gGmbH Dresden, 01309, Dresden, Germany E-mail: [email protected]
Contact angle is defined as the degree of wetting of the fluid when the liquid and the solid interacts. When the contact angle is less than 90°, this means a high wettability and hydrophilicity of the surface whereas the greater contact angles mean lower wettability and hydrophobic nature of the surface. If the contact angle is greater than 150°, the surface is called as superhydrophobic. It depends on the surface characteristics such as surface roughness and type as well as liquid type. Some theoretical studies on predicting contact angle by droplet shape analysis were carried out. Vafaei and Podowski [1] developed a model on prediction of the contact angle by using force balance on the droplet. In this study, it is aimed to predict contact angle of droplet by rearrangement of the coefficients given in [1]. As a result of this rearrangement, the contact angle can be found by using geometrical parameters (location of the apex, radius of contact angle, radius of curvature) and thermophysical properties (surface tension and density) of the droplet sample. Moreover, different from the given correlation in [1], it is found that the volume of the droplet does not affect the contact angle considering the force balance on the droplet surface. Keywords: contact angle, wettability, surface tension, droplet volume [1] S. Vafaei and M. Z. Podowski, “Analysis of the relationship between liquid droplet size and contact angle,”
Adv. Colloid Interface Sci., vol. 113, no. 2, pp. 133–146, 2005.
6th Int. Conf.: Thermophysical and Mechanical Properties of Advanced Materials (THERMAM)
8thRostocker Int. Conf.: Thermophysical Properties for Technical Thermodynamics
22-24 September 2019, Çeşme, İzmir, Turkey
26
On the Validity of Mass Flow Rate Equation for Nanofluid Based Single Phase Natural Circulation Mini Loops
Nur COBANOGLUa, Mohmmad ALABOUDa, Ziya Haktan KARADENIZb
a Graduate School of Natural and Applied Sciences, İzmir Kâtip Çelebi University, 35620, İzmir, Turkey.
b Department of Mechanical Engineering, İzmir Kâtip Çelebi University, 35620, İzmir, Turkey. E-mail: [email protected]
Single phase natural circulation loops (SPNCLs) are the passive systems based on heat transfer from hot medium to cold medium by natural convection caused by temperature gradient. In order to increase performance of the system (stable flow and highly efficient heat transfer), studies on geometry and working fluids were carried out. Geometry (size, aspect ratio, heater-cooler orientation, pipe diameter, shape, inclination angle) is primary factor affecting performance and stability. Nanofluids, as a new heat transfer fluids, have been used to improve performance of SPNCLs. Temperatures (temperature difference in heater outlet and inlet, and maximum temperature), effectiveness and mass flow rate are widely used performance and characterization parameters in the available literature. Since measurement of the mass flow rate is more difficult compared to temperature, Vijayan et al. [1] developed a theoretical correlation for water based SPNCLs. In this study, validity of developed correlation by Vijayan et al. [1] for nanofluid based mini SPNCLs (SPNCmLs) is investigated for various geometrical parameters, numerically. Steady 3D model was developed for experimental setup (pipe diameter=4.75, aspect ratio=1.38) in the literature. Effects of different aspect ratios (0.4, 0.6, 0.8, 1.0, 1.2, 1.38, 1.6, 1.8 and 2.0) at constant pipe diameter (4.75 mm) and different pipe diameters (3, 4, 5, 6 mm) for constant aspect ratio (1.38) were analysed at constant heat flux (10, 30, 50 W) at heater section and constant temperature (20°) at cooler section. Water based Al2O3 nanofluids (1, 2, 3 vol. %) and water were used as working fluids. It is found that, mass flow rate in SPNCmL is in good agreement with correlation [1] for higher aspect ratio and pipe diameters. Moreover, higher concentrations and heater powers have higher difference from the correlation. Keywords: nanofluids, single phase natural circulation loops, natural convection, mass flow rate [1] P. K. Vijayan, “Experimental observations on the general trends of the steady state and stability behaviour
of single-phase natural circulation loops,” Nucl. Eng. Des., vol. 215, no. 1–2, pp. 139–152, 2002.
6th Int. Conf.: Thermophysical and Mechanical Properties of Advanced Materials (THERMAM)
8thRostocker Int. Conf.: Thermophysical Properties for Technical Thermodynamics
22-24 September 2019, Çeşme, İzmir, Turkey
27
Sound Insulation Performance of Chemically Foamed Low-Density Polyethylene Thermoplastics Materials
aMoussa El Khodor EL KHODOR, aMürsel ALIŞKIN, aHakkı OZER, bFurkan ERGIN, aMurat YAZICI
a Bursa Uludağ University, Engineering Faculty, Automotive Engineering Department
bPECHOM Endüstri ve Makine Tic.A.Ş. Alaaddin Bey Mah. 631. Sk. No:3A/1 Nilüfer/Bursa Turkey E-mail: [email protected] , [email protected] , [email protected] , [email protected] ,
Thermoplastic polymer-based foam materials are used frequently due to their superior sound and heat insulation, low density, chemical stability, vibration damping, recycling, and reprocessing properties. In this study, low-density polyethylene material (LDPE) in the thermoplastic materials group was foamed. Sodium bicarbonate (NaHCO3) was used as the foaming agent. Also, certain amounts of talc, glycerol monostearate (GMS) and zinc additive were added to the foam material to provide cell stability. Acoustic experiments were conducted to determine the sound insulation performance of foam materials which are frequently used in sound insulation. Moreover, the compression properties of the foam materials were determined by compression tests. FTIR, TGA, and DTA analyses were performed to determine the chemical and physical characterization of the foam material produced. SEM analyses were performed to determine the cell geometry, width, and thickness of the cell wall of the foam material. Keywords: Sound Insulation, LDPE Thermoplastic Foam ,Cell-size ,Cell-geometry
6th Int. Conf.: Thermophysical and Mechanical Properties of Advanced Materials (THERMAM)
8thRostocker Int. Conf.: Thermophysical Properties for Technical Thermodynamics
22-24 September 2019, Çeşme, İzmir, Turkey
28
Metal Insert Design for Clinching Process on Laminated Composite Structures
Emre ERBILa, Ramazan KARAKUZUa
a Izmir Dokuz Eylül University
E-mail: [email protected] , [email protected]
The lightweight composite materials bring out several opportunities besides some challenges. One of the key challenges is providing a strong and reliable joint for sensitive composite structures by preserv-ing their specifications without any damage. Traditional fasteners are mostly designed for sheet metals, such as rivets, bolts and clinched fixings are often incompatible with composites or they require addi-tional work. Despite the “embedding fasteners” can provide a secure and discrete fastening solution, they require proper production methods and special tools like moulding equipment for every case which results in higher production cost. Although, embedding the fasteners regardless of their shape can lead some design compatibility issues including process inefficiencies. Even the embedding pro-cess could weaken the composite product or increase the thickness and weight. Clinching composite layers is an alternative method for binding composite parts together. In this study, a parametric metal insert geometry model is described between two composite layers and optimized by using finite elements analysis in MARC/MENTAT software environment. Keywords: metal insert, fasteners, clinching, composites

6th Int. Conf.: Thermophysical and Mechanical Properties of Advanced Materials (THERMAM)
8thRostocker Int. Conf.: Thermophysical Properties for Technical Thermodynamics
22-24 September 2019, Çeşme, İzmir, Turkey
29
Ballistic and Impact Performance of Honeycomb Core Aluminum Sandwich Panels with Epoxy Based Syntactic Foam Infill
Yalcin BOZTOPRAKa, Cagatay OZADAb, Merve UNALb, Ibrahim Kursad TURKOGLUb,
Murat YAZICIb
a Marmara University, Technology Faculty, Metallurgical and Materials Eng. Department
b Bursa Uludağ University, Engineering Faculty, Automotive Engineering Department E-mail: [email protected] , [email protected] , [email protected] , [email protected] ,
An elastoplastic deformable epoxy resin was obtained by using post-curing operation from a developed high flexible epoxy resin. The elasticity modulus increased from 4.5 MPa to 200 MPa, and tensile yield strength also increased from 1.5 MPa to 10 MPa by post-curing operations. After post-curing, the flexible epoxy’s stress-strain curve also transformed from linear-elastic to elastic-plastic behavior. Due to the elastoplastic behavior of the post-cured epoxy resin, the material showed more impact energy absorption performance. This resin was used to obtain syntactic foams by using four different glass bubble contribution, which were 5,10,20 and 30% percentages. The obtained syntactic foams were filled inside the aluminum honeycomb core cells, and by bonding aluminum face sheets, the sandwich panels were also obtained. Obtained sandwich panels were subjected to impact loading and ballistic impact. The results were compared with the unfilled aluminum sandwich panels. The results concluded by using measured experimental data, the microstructure of the syntactic foams, fracture surface morphologies, and post-mortem observations. Keywords: Epoxy syntactic foam, Aluminum Honeycomb Sandwich, Impact loading, Ballistic performance
6th Int. Conf.: Thermophysical and Mechanical Properties of Advanced Materials (THERMAM)
8thRostocker Int. Conf.: Thermophysical Properties for Technical Thermodynamics
22-24 September 2019, Çeşme, İzmir, Turkey
30
Sound Insulation Performance of Honeycomb Core Aluminum Sandwich Panels with Flexible Epoxy Based Foam Infill
Yalcin BOZTOPRAKa, Cagatay OZADAb, Merve UNALb, Hakki OZER ,Furkan ERGINb,
Murat YAZICIb
a Marmara University, Technology Faculty, Metallurgical and Materials Eng. Department
b Bursa Uludağ University, Engineering Faculty, Automotive Engineering Department E-mail: [email protected] , [email protected] , [email protected] ,
[email protected] , [email protected] , [email protected]
Flexible epoxy resin has low strength high elongation properties without post-curing. The flexible epoxy resin tensile strength was obtained as 2 MPa. The maximum strain was also more than 65% percent. The behavior of the materials up to breaking point showed high linearity with very low Elastic Modulus, which is 4.5 MPa. This flexible epoxy material was foamed by using physical foaming technique using CO2 gas injection. The foamed structure was filled inside the aluminum honeycomb core cells. By bonding of aluminum face sheets, sandwich panels were obtained. The front face sheets of the sand-wich panels were perforated with a large number of circular holes. The sound insulation and sound transmission loss performance of the produced sandwich panels were obtained by using impedance tube setup. The results were compared with the unfilled aluminum sandwich panels and sound insulation materials which were used in this area. The mechanical and physical properties of the developed sandwich panels were also obtained by a series of experiments such as compression and three-point bending. The developed flexible epoxy foam was also investigated by the microstructural and cell morphology point of view. The results were concluded as a perspective of sound insulation performance and industrial application of the developed sandwich structures. Keywords: Flexible Epoxy Foam, Aluminum Honeycomb Sandwich, Sound insulation, Sound transmission loss
6th Int. Conf.: Thermophysical and Mechanical Properties of Advanced Materials (THERMAM)
8thRostocker Int. Conf.: Thermophysical Properties for Technical Thermodynamics
22-24 September 2019, Çeşme, İzmir, Turkey
31
Enhanced Thermal Conductivity and Photo-Thermal Conversion in Carbon Black Nanopowder Loaded Organic Phase Change Material
Amit Kumar MISHRAa, B. B. LAHIRI, John PHILIPa
aSmart Materials Section, Corrosion Science and Technology Division, Metallurgy and Materials Group, Indira Gandhi Centre
for Atomic Research, HBNI, Kalpakkam, Tamil Nadu, PIN 603102, India. E-mail: [email protected]
Latent heat thermal energy storage using organic phase change materials (PCMs) have been widely used for waste heat recovery from industrial processes, thermal management of electronic devices, solar thermal energy storage and thermoregulation of buildings. The high energy storage density and the capability of near-isothermal storage and retrieval of thermal energy make these PCMs attractive. However, inherently low thermal conductivity of such PCMs restricts their practical applicability. Thermal conductivity enhancements of PCMs have been achieved by dispersing high thermal conductivity nano-inclusions (like carbon nanotubes, graphene, metallic oxides, etc.) within the continuous media that makes these systems costly and hence, there is a need for developing cheaper nano-inclusion loaded PCMs. Imparting photo-thermal conversion capability to these nano-enhanced PCMs will make them technologically attractive and economically viable for rapid industrial adaptation. In the present study, we experimentally probe the enhancement in thermal conductivity and photo-thermal conversion for paraffin wax (PW) and lauric acid (LA) based PCMs loaded with carbon black nanopowder (CBNP) of size ~ 30 nm (determined from atomic force and scanning electron microscopy). Differential scanning calorimetry indicated that the phase transition temperatures and latent heat values were ~ 60.1, 45.4 0C and 125.9, 151.6 kJ/kg for pristine PW and LA, respectively. The phase transition temperatures remained unchanged upon loading with various concentrations of CBNP nano-inclusions. On the other hand, latent heat values decreased slightly with increasing loading, which was attributed to the lowering of PCM mass ratio. Thermal conductivity measurements were performed using a transient hot wire probe and for pristine PW and LA, the liquid state thermal conductivity values were ~ 0.155 and 0.141 W/mK, respectively. Upon loading with CBNP nano-inclusions, thermal conductivity enhancement in the liquid state was insignificant, whereas it was substantial in the solid state. For PW based PCMs, thermal conductivity enhancements in the solid state were ~ 80, 85, 98, 129 and 135 % for CBNP loading of 0.5, 1.0, 1.5, 2.0 and 2.5 wt. %, respectively. Similarly for the LA based PCMs, solid state thermal conductivity enhanced by ~ 133, 140, 143, 160, 164, 174 and 195 % for CBNP loading of 0.5, 1.0, 1.5, 2.0, 2.5, 3.0 and 3.5 wt. %, respectively. The highest thermal conductivity enhancements obtained in the present study (~ 135 and 195 % for PW and LA, respectively) were found to be significantly higher than the values reported in literature. For the nano-enhanced PCMs, during freezing, the nano-inclusions are driven towards the inter-crystallite spaces forming quasi-2D networks of percolating structures with high phonon mediated conductive heat transfer efficiency. Formation of such networks was visually observed using time-stamped optical phase contrast video microscopy. Superior volume filling capacity and high compressibilty of CBNP also aided in thermal conductivity enhancement. Infrared thermography based non-contact temperature mapping was performed to evaluate the photo-thermal conversion efficiency of CBNP loaded PCMs and it was observed that photo-thermal conversion enhanced by ~ 84 and 135 % for PW and LA based PCMs loaded with 2.5 and 3.5 wt. % of CBNP, respectively. Photo-thermal conversion was found to increase with CBNP loading, which was attributed to the intense multiple scattering of the incident radiation from larger sized CBNP aggregates within the PCM host matrices. High thermal conductivity and photo-thermal conversion efficiency of CBNP loaded PW and LA based PCMs will pave the way for development of portable and self-sustainable solar-thermal battery packs. Keywords: Phase change material, Latent heat thermal energy storage, Paraffin wax, Lauric acid, Carbon black nanopowder
6th Int. Conf.: Thermophysical and Mechanical Properties of Advanced Materials (THERMAM)
8thRostocker Int. Conf.: Thermophysical Properties for Technical Thermodynamics
22-24 September 2019, Çeşme, İzmir, Turkey
32
Continuously Fed Evaporating Cylindrical Water Blocks for Electronics Cooling Applications
Yigit AKKUSa , Barbaros CETINb , Zafer DURSUNKAYAc
a ASELSAN Inc.
b İhsan Dogramaci Bilkent University c Middle East Technical University
E-mail: [email protected] , [email protected] , [email protected]
Evaporation is commonly present in nature as well as in technological applications. High amount of energy (latent heat) is needed during liquid-vapor phase change to break the intermolecular forces between liquid molecules, which makes the evaporation process a promising tool in thermal management. Specifically, utilization of droplets, which function as local heat spreaders, has been proposed in the electronics cooling. However, drying out of the entire droplet in a short duration is a common problem and continuous feeding from a reservoir has been also proposed as a method to mitigate this challenge. As an alternative to the evaporating droplets, continuously fed evaporating half-cylinder water blocks can be also utilized for the cooling. Benefit of this approach would be the ease of the production of the feeding passages together with the relative ease of the numerical modeling. Concurrent effects of liquid feeding, thermocapillarity, internal heat transfer inside the droplet, heat and mass transfer at the liquid-vapor interface and gas motion above the interface are accounted during modeling, which is built on an iterative solution scheme using MATLAB LIVE-LINK INTERFACE for Finite Element Method based solver of COMSOL MULTIPHYSICS software. Keywords: Thermal management, Electronics cooling, Evaporation, Evaporating water blocks
6th Int. Conf.: Thermophysical and Mechanical Properties of Advanced Materials (THERMAM)
8thRostocker Int. Conf.: Thermophysical Properties for Technical Thermodynamics
22-24 September 2019, Çeşme, İzmir, Turkey
33
Preparation of Compositions Based on Modified Epoxide Oligomer with GO and Investigation of Their Physical-Mechanical Proporties
Ulviyya HASANOVAb , Fariz AMIROVa
, Narmina GULIYEVAa , Zarema
GAKHRAMANOVAa , Djavid NABIZADEa
, Baylar ZARBALIYEVa
aDepartment of Technology of Organic Substances and High Molecule Compounds, Azerbaijan State Oil and Industrial University, 16/21 Azadliq Ave, Baku, AZERBAIJAN
bDepartment of Organic Chemistry, Baku State University, Z. Khalilov Street, 23, AZ1148, Baku, AZERBAIJAN E-mail: [email protected]
Obtained composition prepared with epoxide oligomer has wide range of uses. Therefore, requirements
for operation properties of obtained composition are changing in wide range.It is possible to use different
modifier agents in order to get epoxide composition with high exploitation properties. As exapmles we can
show fillers, surface active compounds, antioxidants, plasticizer, and other high molecule and etc.
There are various adhesives and varnishes which are produced on the epoxide oligomer bases.
Adhesives are mainly used to glue metals, wooden materials (wood, wood powder), plastic uses,
ceramics, glasses etc.
As we know, adhesives on the basis of epoxide oligmer are obtained during cold and hot packing process
by adding packings to them. We obtained adhesive by using ED-20 marked epoxide oligomer and PEPA
packing in cold packing process. In order to improve quality of adhesive (preventing bending, decreasing
the number of bubbles, improving the packing and elastic properties of plastics, woods) epoxide oligomer
is modified with various contented fillers and caoutchouc solvents.
In order to improve properties of adhesive composition we modified it mechanically by mixing in various
ratios with GO. Then, anti-oxidant is added and it is mixed vigorously at 50-70 C in 1-2 minutes and after
adding packings it is mixed fast. The physical-mechanical properties of prepared composites samples
were studied.
After studying properties of adhesive composition modified with graphene oxide on the basis of epoxide,
we see that the number of air bubbles in obtained adhesive composition are less comparing with not
modified adhesive compositions. When graphene oxide is distributed equally, oligomer fills voids in itself
and take off the air bubbles and the number of bubbles are decreasing on the surface. However, it is seen
from the table that the physical-mechanical properties of adhesive composition modified with graphene
oxide with epoxide oligomers are less than the properties of not modified epoxide adhesive composition,
but bending during solidification is decreasing.
Keywords: physical-mechanical properties, preparation of compositions, modified epoxide oligomer with GO
6th Int. Conf.: Thermophysical and Mechanical Properties of Advanced Materials (THERMAM)
8thRostocker Int. Conf.: Thermophysical Properties for Technical Thermodynamics
22-24 September 2019, Çeşme, İzmir, Turkey
34
Thermodynamic Analysis of a New PV/T Hybrid Food Drying System
Damla BARISIK MARASLIa*, Neslihan COLAK GUNESb, Sebnem TAVMANa
a Department of Food Engineering, University of Ege, Bornova, 35100, Izmir, Turkey.
b Institute of Solar Energy, University of Ege, Bornova, 35100, Izmir, Turkey. E-mail: [email protected]
Drying is an energy intensive industrial process where heat and mass transfer takes place simultaneously and has been practised for a long time as a preservation method for agricultural food products. Type of product, energy consumption, dried product quality, food security and sustainability are critical parameters need to be taken into consideration during selecting of drying system. About 10-15% of the total world industrial energy is consumed for drying and the percentage consumption by food sector is 12%. Due to uncertain price rise and rapid depletion of fossil fuels, development of food drying systems integrated with renewable, sustainable energy sources became more and more important. As solar energy is abundant, eco-friendly, cheap and easily applicable, especially studies on solar energy based drying technologies and improvement of their energy efficiencies have been accelerated in recent years. Since solar energy is dependent on weather conditions, it is only possible to provide continuity of the drying process with additional heat sources. In order to prevent disruption of the drying process and improve to the drying efficiency, many researches show that heat pump is one of the most suitable thermal technologies. Solar energy can be converted into thermal and electrical energy by solar thermal collectors and photovoltaic (PV) modules, respectively. The performance of PV modules decreases when the ambient temperature rises above a certain level. For overcoming of this problem, a novel system calls a photovoltaic/thermal (PV/T) hybrid technology was developed. In this system, excess heat is transferred to the working medium by integration of absorber plate with PV modules. Although there are lots of studies on food drying, still a need for efficient, economical and sustainable novel food drying systems. Therefore, in this study, conceptual design of PV/T and unglazed solar collector integrated hybrid heat pump drying system was carried out. A thermodynamic analysis of a new PV/T hybrid food drying system was performed by applying mass, energy and exergy balances for the each system components. Keywords: PV/T, Hybrid, Solar Dryer.

6th Int. Conf.: Thermophysical and Mechanical Properties of Advanced Materials (THERMAM)
8thRostocker Int. Conf.: Thermophysical Properties for Technical Thermodynamics
22-24 September 2019, Çeşme, İzmir, Turkey
35
Industrial Manufacturing of Wood Plastic Composites from Municipal Bulky Plastic and Wood Wastes
Dildare BAŞALPa, Sait Cemil SOFUOĞLUb, Fikret İNALa,
Aysun SOFUOĞLUa, Funda TIHMINLIOĞLUa*
a Department of Chemical Engineering, İzmir Institute of Technology, 35430, Urla İzmir, Turkey. b Department of Environmental Engineering, İzmir Institute of Technology, 35430, Urla İzmir, Turkey.
E-mail:[email protected]
In order to minimize waste and decrease environmental effects of plastics, reserve natural resources and support circular economy for sustainable production and consumption, the possibility of using recycled plastics and woods from urban household bulky wastes for the industrial manufacturing wood plastic composites (WPCs) is investigated. The recycled WPC compounds, r-WPCs, were produced from urban household bulky wastes at different compositions (wood flour, anti-oxidants, UV stabilizers and coupling agents) to obtain optimum composition for pilot scale manufacturing. The mechanical tests of the WPCs were carried out in order to determine the performance of the r-WPC with virgin WPCs (v-WPC). The optimum compositions of wood and other additives in r-WPC were determined in laboratory scale before industrial applications. Effects of wood flour content, compatibilizer and other additives (UV, antioxidants) on tensile strength, impact, and water sorption properties of r-WPC were tested in order to determine the optimum WPC compositions. Industrial manufacturing of r-WPC products by using bulky wastes were done in injection molding machines by taking into account the optimum compositions. Crates and table legs from recycled plastic and wood wastes as potential products were produced in the industrial scale. Manufacturing of crates and table legs indicates the applicability of r-WPCs from recycle plastics in transport and furniture sectors, respectively. Many alternatives for r-WPC products for requisites and demands of consumers can be manufactured from municipal bulky waste. As a result of this study, the industrial manufacturing capability of r-WPC products from municipal bulky plastic and wood wastes was demonstrated and showed promising results by considering physical and mechanical properties. Keywords: wood plastic composites (WPC), recycling, mechanical properties, WPC manufacturing, bulky plastic waste

6th Int. Conf.: Thermophysical and Mechanical Properties of Advanced Materials (THERMAM)
8thRostocker Int. Conf.: Thermophysical Properties for Technical Thermodynamics
22-24 September 2019, Çeşme, İzmir, Turkey
36
Effect of Silica Particle Size and Filler Rate on the Fracture Properties of Epoxy Resin Composite
Zafer AZEMa , Ugur MALAYOGLUa , Bahadır UYULGANa
a Dokuz Eylul University
E-mail: [email protected] , [email protected] , [email protected]
Solvent-free bis-phenol A epoxy resin and pre-accelerated methyltetrahydrophytalic anhydride hardener were used as matrix material. Silica particles were added to matrix to produce silica-epoxy particulate composite. Silica particles with two mean diameters of 1 µm and 37 µm and filler rate of 20, 30, 40 and 60% were used to investigate the effect of particle size and filler rate on the fracture behavior of the epoxy resin composite, respectively. The fracture behavior of the composites was characterized by linear elastic fracture mechanics according to standard of ASTM-D5045 in which three-point bending test procedure was used to investigate plane-strain fracture toughness (Kıc) and strain energy release rate (Gıc) of the composite specimens. Tensile properties, Kıc and Gıc values increased with the particle size and filling rate, compared to unfilled neat epoxy polymer. Glass transient temperatures (Tg) of the samples were evaluated by using differential scanning calorimetry (DSC) to investigate the effect of particle size and filling rate on curing mechanism of the epoxy polymer composite. Measured Tg values show that particle size and quantity of the silica in the matrix have not a significant effect on the curing regime of the epoxy composite polymer. Fracture surfaces of the produced specimens were examined by SEM to be able to explain the fracture mechanisms of silica filled epoxy composite. Keywords: silica, epoxy composites, fracture toughness
6th Int. Conf.: Thermophysical and Mechanical Properties of Advanced Materials (THERMAM)
8thRostocker Int. Conf.: Thermophysical Properties for Technical Thermodynamics
22-24 September 2019, Çeşme, İzmir, Turkey
37
Determination of Thermal Conductivity of Carbon Filled Polymeric Composite Plates for Compact Plate Heat Exchangers
Aysun GUVENa, Özay AKDEMIRb, M. Turhan ÇOBANb, Metehan ATAGURc, Yoldaş SEKId,e, Kutlay SEVERc, Lütfiye ALTAYb,e, Mehmet SARIKANATb,e
aAnkara Yıldırım Beyazıt University, Mechanical Engineering Department, Keçiören, Ankara, bEge University, Mechanical Engineering Department, Bornova, Izmir, Turkey.
cİzmir Katip Celebi University, Faculty of Engineering and Architecture, Çiğli, Izmir, Turkey dDokuz Eylul University, Faculty of Science, Buca, Izmir, Turkey
eİzmir Eğitim Sağlık Sanayi Yatırım A.Ş., Turgutlu, Manisa, Turkey E-mail: [email protected], [email protected]
Fabrications of thermally conductive polymeric composite materials to be used in heat transfer devices have gained a great importance over the last decades. Recently, the use of thermally conductive polymeric composites in thermal management industry is growing up. Some of these polymers can replace metals and ceramics in heat exhangers due to cost and energy savings. Because conductive polymers have the advantages of low cost, low density and good corrosion resistance and easy manufacturability. A heat exchanger is a device used to transfer heat between two or more fluids. The fluids can be single or two phase and, depending on the exchanger type, may be separated or in direct contact. In order to increase the heat transfer, heat exchangers with high thermal conductivity and low coefficient of thermal expansion are commonly preferred. For improving the thermal conductivity of a polymeric material, polymer matrices are usually filled with the thermally conductive fillers like metal powders, ceramic powders and carbon-based materials. In this study, graphene and synthetic graphite were used as carbon fillers. Graphene and synthetic graphite filled polypropylene composites were prepared with gelimat mixer and hot press molding techniques. Experimental setup of compact plate heat exchanger to determine the thermal conductivity of composite plates was designed and established. It was observed that the thermal conductivity of polypropylene was increased by the addition of graphene and synthetic graphite. To investigate the effect of fillers on the thermal properties of composite plates, several caharacterization techniques were performed. According to the results, the highest through-plane thermal conductivity was obtained to be 3.4 W/mK using experimental setup of compact plate heat exchanger and 2.6 W/mK using Flash Diffusivity Analyzers. Acknowledgement This study was supported by Ministry of Science, Industry and Technology (Turkey), Project Number: 0728.STZ.2014, and Research Foundation of Ege University, Project numbers: 14-MÜH-072 and 16-MÜH-058.
6th Int. Conf.: Thermophysical and Mechanical Properties of Advanced Materials (THERMAM)
8thRostocker Int. Conf.: Thermophysical Properties for Technical Thermodynamics
22-24 September 2019, Çeşme, İzmir, Turkey
38
Magnetic Nanofluid Flow in a Microchannel by an External Magnetic Field
Serkan DOGANAYa, Levent CETINb, Mehmet Akif EZANc, Alpaslan TURGUTc
aDokuz Eylül University, The Graduate School of Natural and Applied Sciences, İzmir, Turkey,
bİzmir Kâtip Çelebi University, Department of Mechatronics Engineering, İzmir, Turkey, cDokuz Eylül University, Department of Mechanical Engineering, İzmir, Turkey,
E-mail: [email protected]
Magnetic nanofluids are colloidal mixtures which consist of nano sized magnetic particles suspended in a carrier liquid. These nanoparticles typically can be maghemite (γ-Fe2O3), magnetite (Fe3O4) and cobalt ferrite (CoFe2O4) as magnetic materials. They have many potential industrial applications on electrical, mechanical and optical fields. The ability of being manipulated by an external magnetic field made magnetic nanofluids attractive especially when the fluid transport necessary in tiny quantities. Therefore, they have also the potential to be utilized in microfluidic systems such as micro-sized heat sinks, micro-pumping and micro-mixing [1]. In this numerical study, Fe3O4-water magnetic nanofluid in a square cross sectional microchannel with a circular path was considered as the working medium. In order to manipulate the magnetic nanofluid, NdFeB permanent magnets were employed. Hence, the external magnetic field gradient generated by the permanent magnets caused a magnetic force on the magnetic nanofluid inside the microchannel. Then, the magnetic force was defined as a body force in the simulations. The results indicated that it is possible to achieve a magnetic nanofluid flow in a microchannel by an external magnetic field. Moreover, we observed that the magnetic nanofluid velocity inside the microchannel depends on the magnetization of the magnetic nanofluid sample. Keywords: magnetic nanofluid, magnetic field, magnetization, microfluidics, [1] Iverson B.D., Garimella S.V., Microfluidics and Nanofluidics, 5, pp. 145-174, 2008.

6th Int. Conf.: Thermophysical and Mechanical Properties of Advanced Materials (THERMAM)
8thRostocker Int. Conf.: Thermophysical Properties for Technical Thermodynamics
22-24 September 2019, Çeşme, İzmir, Turkey
39
Investigating the Preform Binder Effects on Thermo-Mechanical Properties of Composite Panels for Wind Blade Applications
Sema YILDIZa, Berkay AYDOGANa, Nur KARASAHINa, İlker TOPUZa
a TPI Kompozit Kanat A.Ş. E-mail: [email protected] , [email protected] , [email protected] ,
The effects of epoxy-based binder impregnated fabrics on both mechanical and thermomechanical properties of E-glass/epoxy-amine system for preform wind turbine blade part manufacturing applications were investigated. The resultant properties were compared with binder-free fabrics containing panels. Two types of fabrics which have unidirectional (UD) 0o and biaxial (+45o/-45o) orientations were used during the trials. The integrity of the binder impregnated fabrics with each other was ensured by the application of heat and vacuum pressure. Composite panels were produced by using epoxy resin and vacuum-bag infusion process to investigate their mechanical properties. Results of the table-top trials reveal that there is a general increasing trend for ILSS and tensile properties of panels which were produced by binder impregnated fabrics when compared to binder-free panels. However, such a trend could not be observed among the panels produced with binder impregnated fabrics with increasing binder concentration. Complex modulus values of the panels were also tested with DMA and have seen that they decrease with the use of bindered fabrics whereas they increase with increasing binder concentration only for Biaxial fabrics. On the other hand, there were many noisy fluctuations for UD panels due to excessive stiffness of panels. Moreover, it was detected the Tg values of panels with binders increases which indicates that binders partially dissolve within epoxy resin matrix during infusion. Keywords: Preform, binder, wind blade, mechanical properties
6th Int. Conf.: Thermophysical and Mechanical Properties of Advanced Materials (THERMAM)
8thRostocker Int. Conf.: Thermophysical Properties for Technical Thermodynamics
22-24 September 2019, Çeşme, İzmir, Turkey
40
Magnetization Behavior of Fe3O4 – Water And Fe2O3 – Water Magnetic Nanofluids
Rahime ALSANGURa, Serkan DOGANAYa,b, Alpaslan TURGUTc, Levent CETINb
a Dokuz Eylül University, The Graduate School of Natural and Applied Sciences, İzmir, Turkey.
bİzmir Kâtip Çelebi University, Department of Mechatronics Engineering, İzmir, Turkey. cDokuz Eylül University, Department of Mechanical Engineering, İzmir, Turkey.
E-mail: [email protected]
Nanofluids are colloids that contain nanosized particles dispersed into a base fluid to improve the thermophysical properties of the base fluid. If the nanosized particles have magnetic properties, the fluid can be called as magnetic nanofluids. Thermophysical properties of magnetic nanofluids can be altered and tuned by applying external magnetic field. This situation provides many potential application areas for these fluids, such as biomedical applications and heat transfer [1]. Magnetic properties and magnetization behaviour can give an insight to the nanostructure of the nanofluid, such as particle interactions and agglomerate formation which can strongly influence the thermophysical properties of the fluid [2]. To understand the effect of the magnetization on the magnetic nanofluids, magnetization measurements were carried out for magnetite (Fe3O4) - water and maghemite (γ-Fe2O3) - water magnetic nanofluids by using a vibrating sample magnetometer (VSM). Various samples with different volume concentrations for Fe3O4 - water (1, 2, 3, 4 and 4.8%) and γ-Fe2O3 - water (1.1 and 2.2%) nanofluids were used in measurements. The results show that γ-Fe2O3 - water magnetic nanofluid have higher magnetization values than Fe3O4 - water magnetic nanofluid. The measurements also point out that as the volume concentration increases, magnetization of the both magnetic nanofluids increases as well. Keywords: Magnetic nanofluids, magnetic properties, magnetization, magnetite, maghemite. References [1] Kumar, A., & Subudhi, S. (2018). Preparation, characteristics, convection and applications of magnetic nanofluids: A review. Heat and Mass Transfer, 54(2), 241-265. [2] Vékás, L., Marinică, O., Susan-Resiga, D., Stoian, F. D., & Bica, D. (2004, October). Magnetic and flow properties of high magnetization nanofluids. In Proceedings of the 6th International Conference on Hydraulic Machinery and Hydrodynamics, Timisoara, Romania, Oct (pp. 21-22).
6th Int. Conf.: Thermophysical and Mechanical Properties of Advanced Materials (THERMAM)
8thRostocker Int. Conf.: Thermophysical Properties for Technical Thermodynamics
22-24 September 2019, Çeşme, İzmir, Turkey
41
Influence of Film Thickness on Electromechanical Properties of Cellulose-Graphene Ionic Polymer Composite Films
Ozge AKBULBULa , Mert SENERa, B.Oguz GURSESa , Mehmet SARIKANATa , Aysun BALTACIa ,Yoldas
SEKIb
a Department of Mechanical Engineering, Ege University, Erzene, 172, 35040, İzmir, Turkey. b Department of Chemical Engineering, Dokuz Eylül University, Kuruçeşme,35390, İzmir, Turkey.
Email:[email protected]
Ionic polymer metal composites (IPMC) are smart materials in which the generated motion is controlled by electric field applied between the two electrodes of IPMC. Free ions that are diffused in the body of IPMC move due to the applied external electric field, and accumulate on the surface of one of the elec- trodes. This inhomogenous distribution of ions in the film causes a bending motion in the actuator. IPMCs are generally made of ionic polymers like Nafion, cellulose, chitosan etc. They are classified as electroactive materials like piezoelectrics. They are actuated by low voltages like 3-10V, and they show better performance in ionic environments like human body due to their ionic characteristics. In this study; cellulose is used as the matrix material of ionic polymer composite actuator and graphane is added to increase tip displacement by increasing the electrical conductivity. Cellulose is dissolved in 1-ethyl-3-methylimidozalium diethylphosphonate ([EMIM] DEP) and N, N-dimethyl acetamide (DMAc) then 0.2% wt Graphene is added to the mixture. Films of 1,2,3 mm thickness are obtained by drying. And then, golden leaves of 10um are placed on the both sides of ionic polymer as the electrodes. The performance of manufactured IPMC layers is evaluated by experimentally. The maximum tip displace- ments of actuators are measured by laser displacement sensor and maximum force is measured by a load cell. Keywords: cellulose, graphene, electroactive film, ionic polymer.

6th Int. Conf.: Thermophysical and Mechanical Properties of Advanced Materials (THERMAM)
8thRostocker Int. Conf.: Thermophysical Properties for Technical Thermodynamics
22-24 September 2019, Çeşme, İzmir, Turkey
42
The Effect of Woven Glass On HDPE Composite Materials
Samet SANBURa, Sami SAYERb, Akar DOGANa, Cicek OZESc,
aThe Graduate School of Natural and Applied Sciences, Dokuz Eylül University, 35390, Izmir, TURKEY
bDepartment of PolymerTechnology, Ege Vocational School, Ege University, 35100, Izmir, TURKEY c Department of Mechanical Engineering, Dokuz Eylül University, 35390, Izmir, TURKEY
E-mail: [email protected]
Composite materials have been widely used in a wide range of engineering applications as automotive, aerospace, civil engineering structures, due to their higher strength/weight ratios. In this study, two types of thermoplastic composites were produced by placing single and double layers of woven E- glass fabric between polyethylene films. The composites were prepared using the compression molder by curing the materials at a temperature of 190 oC under a constant pressure of 8,163 bar for 30 min. The mechanical properties were evaluated by means of tensile test and drop weight impact test. The drop weight impact tests were performed at the different energy levels beginning from 25 joule. Impact test results showed that with increasing energy level, contact force increased, while the contact time de-creased. The maximum tensile load for the composite consisting single layer of woven E- glass fabric between polyethylene films was found 2073 N and for the composite consisting double layer of woven E- glass fabric between polyethylene films was found 3850 N. The average tensile strength was found 46 MPa for the composite consisting single layer of woven E- glass fabric between polyethylene films and 70 MPa for the composite consisting double layer of woven E- glass fabric between polyethylene films. It has been found that woven glass fabric reinforcement significantly increases the tensile strength of the polyethylene film.
Keywords: polyethylene film, tensile test, impact test
6th Int. Conf.: Thermophysical and Mechanical Properties of Advanced Materials (THERMAM)
8thRostocker Int. Conf.: Thermophysical Properties for Technical Thermodynamics
22-24 September 2019, Çeşme, İzmir, Turkey
43
Investigation of Thermal, Mechanical and Flame Retardance Properties of Flame Retarded Polyamide Composites for Railway Applications
Tugce Uysalmana,*, Melis Ozkayaa, Gozde Sevig Tantuga, Akin Isbilira, Kerim
Eraslanb,Yoldas Sekic, Lutfiye Altayd, Mehmet Sarikanatd
aİzmir Eğitim Sağlık Sanayi Yatırım A.Ş., Manisa, Turkey bPurdue University, Mechanical Engineering Department, USA
cDokuz Eylul University, Faculty of Science, Izmir, Turkey dEge University Mechanical Engineering Department, İzmir, Turkey
E-mail: [email protected] ,[email protected] ,[email protected] ,[email protected] ,[email protected] ,[email protected] ,[email protected]
Polyamide 6 (PA6) is one of the thermoplastics used in many fields such as automotive, railway, textile, construction and electrical-electronics sectors. It is one of the thermoplastic materials with a fast flammable and low limiting oxygen index (LOI). By using flame retardant additives it is possible to improve the easy flammability of pure PA6. The aim of this study is to develop Polyamide (PA6) based flame retarded compounds, which have halogen free flame retardant properties at different hazard levels HL1, HL2 and HL3 according to EN 45545-2 standard, by using twin-screw extruder. With the addition of different amounts of zinc borate, it has been studied to improve the flammability properties of PA6 and the composites produced have been characterized. Density and melt flow index (MFI) test were performed. Tensile, flexural and Izod Impact properties were determined in order to measure the effect of flame retardant to the mechanical properties. UL94 test was used to see the V-0, V-1 and V-2 flammability ratings. Glow wire and LOI tests were performed to see the flammability performance of the composites. Heat Deflection Temperature (HDT) and Vicat Softening temperature, thermogravimetric analysis (TGA), thermo-mechanic analysis (TMA) and differential scanning calorimetry (DSC) analysis were performed for the thermal and thermo-mechanical properties. As a result of the study, the LOI value of PA6 was increased by approximately 43%. Keywords: Flame Retardants, Zinc Borate, Polyamide 6 (PA6), Railway Application, Composite Acknowledgement: We would like to thank to project conducted in R&D center of IMS polymers with a project number of MG014.

6th Int. Conf.: Thermophysical and Mechanical Properties of Advanced Materials (THERMAM)
8thRostocker Int. Conf.: Thermophysical Properties for Technical Thermodynamics
22-24 September 2019, Çeşme, İzmir, Turkey
44
Development of Energy Efficiency High Polymeric Composite Material for Building Applications
Melis Ozkayaa , Gozde Sevig Tantuga, Tugçe Uysalmana , Akin Isbilira, Hava Cekina , Lutfiye
Altayb, Mehmet Sarikanatb, Yoldas Sekic
aİzmir Eğitim Sağlık Sanayi Yatırım A.Ş., Turkey bDepartment of Mechanical Engineering, Ege University, Turkey,
cDepartment of Chemistry, Dokuz Eylul University, Turkey, E-mail(s): [email protected], [email protected], [email protected],
[email protected], [email protected], [email protected] [email protected], [email protected]
The main concern in the thermal energy storage systems is the storage and usage of thermal energy at the time when it is available and required, respectively. Polymeric energy storage materials are materials that are used to store thermal energy in many building applications. In this study, effect of phase change materials on thermal, mechanical, and physical properties of thermoplastic composites was investigated. Polypropylene (PP) as a polymer matrix of paraffin wax RT5HC as phase change material (PCM) were used to manufacture PCM filled PP composites. Composite granules were obtained by adding RT5HC at various weight fractions (20, 30, 40%) into PP with twin screw extruder. Test specimens were produced by injection molding of these composite granules. The effect of PCM on thermal, mechanical and physical properties of composites were studied by several characterization techniques such as Thermogravimetric Analysis (TGA), Differential Scanning Calorimetry (DSC), Thermomechanical Analysis (TMA), Melt Flow Index (MFI), HDT Vicat, Tensile and Flexural Tests, Notched and Unnotched Impact Strength Tests, and Density Analysis. It has been demonstrated that PCM improved thermal properties and energy capacity of PP composites. PP composites with PCM has a great potential to be used in room temperature applications with high thermal efficiency. Keywords: polypropylene composites, phase change materials, mechanical properties, thermal properties Acknowledgement: We would like to thank to project conducted in R&D center of IMS polymers with a project number of MG012.

6th Int. Conf.: Thermophysical and Mechanical Properties of Advanced Materials (THERMAM)
8thRostocker Int. Conf.: Thermophysical Properties for Technical Thermodynamics
22-24 September 2019, Çeşme, İzmir, Turkey
45
Investigation of Thermal and Mechanical Properties of Synthetic Graphite Filled PBT Composites
Gozde Sevig Tantuga, Tugçe Uysalmana , Melis Ozkayaa ,Akın Isbilira, Ferhat Onera , Lutfiye
Altayb, Mehmet Sarıkanatb, Yoldas Sekic
aİzmir Eğitim Sağlık Sanayi Yatırım A.Ş., Turkey bDepartment of Mechanical Engineering, Ege University, Turkey,
cDepartment of Chemistry, Dokuz Eylul University, Turkey, E-mail(s): [email protected], [email protected], [email protected],
[email protected], [email protected], [email protected] [email protected], [email protected]
Thermal management of products has gained a great importance due to rapid technological advancements in electronics, power generation, thermal coatings, aviation and many other industries. Heat release from the electronic devices is performed by thermal conduction. Among different methods of heat dissipation from heat source, heat sinks with high thermal conductivity and low coefficient of thermal expansion are commonly used. Recently, the use of thermally conductive polymeric composites in thermal management industry is growing up. Some of these polymers can replace metals and ceramics in heat transfer devices and systems due to cost and energy savings.
In this study, for improving the thermal conductivity of a polymeric material, PBT was filled with synthetic graphite. Synthetic graphite and PBT with various weight fractions were mixed into polymer by using twin-screw extruder and test specimens were fabricated by injection molding. In-plane and through-plane thermal conductivity values were obtained by Xenon Flash Diffus ivity according to ASTM E1461. Change in mechanical properties of carbon based composites was determined by tensile and impact tests. It was observed that specific heat values increased with respect to increasing weight fractions of carbon fillers. Increasing graphite ratio in PBT led to decrease in mechanical properties. Synthetic graphite addition into PPS at 40wt% increased in-plane and through-plane thermal conductivity of PBT by 65 times and 12 times, respectively.
Keywords: PBT, graphite, thermal properties, mechanical properties, composites Acknowledgement: We would like to thank to project conducted in R&D center of IMS polymers with a project number of MG007.

6th Int. Conf.: Thermophysical and Mechanical Properties of Advanced Materials (THERMAM)
8thRostocker Int. Conf.: Thermophysical Properties for Technical Thermodynamics
22-24 September 2019, Çeşme, İzmir, Turkey
46
Effect of Iron Powder on Mechanical and Thermal Properties of Polyester Based Composites
Sena GULENa, Lütfiye ALTAY, Mehmet SARIKANATa, Zafer YENIERa
aDepartment of Mechanical Engineering, Ege University, Turkey, E-mail(s): [email protected], [email protected] , [email protected], [email protected]
Developments and technological advances in many sectors such as electronic devices, power generation, thermal coatings, aviation, etc. make thermal management of substances even more important. The heat generated during the operation of electronic devices is generally dissipated by thermal conduction. Polymers with high thermal conductivity are increasingly being used in the thermal management industry. In recent years many study shows that polymeric composites containing metal powders such as copper, aluminium, steel, replace the conventional materials due to their light weight, high thermophysical and mechanical properties. The main motivation in this study is the experimental investigation of the concentration effects of iron powder used as filler materials in Polyester resin on thermal conductivity and mechanical properties. Experimentally, iron powder in various weight fractions (5, 10, 15, 20, 25, 30) were added into Polyester resin. Thermal, morphologic and mechanical analysis have examined. According to the desired thermal conductivity values, 30wt% of iron powder concentration has the highest thermal and electrical conductivity values. Therefore, the mechanical properties of polymer composites are considerably important for industrial applications. Different iron powder ratios in Polyester resin have not play an effective role in mechanical properties of this polymeric composite. Keywords: Thermal conductivity, polymer composite materials, Iron powder.
6th Int. Conf.: Thermophysical and Mechanical Properties of Advanced Materials (THERMAM)
8thRostocker Int. Conf.: Thermophysical Properties for Technical Thermodynamics
22-24 September 2019, Çeşme, İzmir, Turkey
47
Determination of Thermal and Rheological Properties of Collagen Protein
Ozge ATAa, Ebru ORMANLIa, Seher KUMCUOGLUb, Sebnem TAVMANb
a Graduate Faculty of Natural and Applied Science, Ege University, 35040, İzmir, TURKEY
b Department of Food Engineering, Ege University,35040 ,İzmir, TURKEY E-mail: [email protected]
Collagen is a fibrous protein that contains about 30% of the total protein in mammals. Collagen is isolated from various animal sources such as bovine, porcine and fish. There is a high demand for collagen in food industry due to it displays multiple functional roles in food processing and formulations. Functional properties that are associated with emulsion formation and stabilization, gelling (gel strength, gelling time, viscosity, thickening, water binding) and protective colloid function. In this study; thermal and rheological properties of collagen protein were investigated. In this study, lamb feet were used as a source of collagen. Lamb feet, purchased from a butcher, were cut into small pieces and homogenised with 0.05 M Tris-HCl (pH 7.5). Then, some pre-treaments such as defatting with ethanol, decalcification with EDTA-2Na and removing non-collagenous proteins with NaOH were carried out, respectively.The pre-treated samples mixed in %5 lactic acid containing 0.1 (w/v) pepsin at 4°C for 6 hours and then ultrasound-assisted extraction (35 kHz, 140/560W) was performed for 60 minutes at 20°C. Afterward, the suspensions were salted out by adding 2.5 M NaCl and subsequently dialyzed in 0.1 M lactic acid for 24 h and in distilled water for 48 h. The dialyzed supernatant was lyophilized by vacuum freeze drying. Fourier transform infrared (FTIR) analysis was carried out for chemical characterization of collagen. Thermal properties of collagen were determined by Differential scanning calorimetry (DSC). Flow behavior of collagen solutions was determined by flow test at different temperatures (5, 20, 35, 50 °C). Collagen exhibited the absorption characteristic peaks in the spectra (amide A and B as well as amide I, II, III). The DSC pattern of collagen showed a single endothermic peak, the maximum transition temperature (Tmax) and enthalpy (ΔH) are determined as 41.86±0.13 °C and 0.082±0.035 J/g, respectively. When the flow behavior characteristics of the collagen solutions at different temperatures were examined, it was determined that at the same shear rate value the shear stress value decreases when the temperature increases. And it was determined that the model that best represents the flow behavior for all samples is the Power Law model.
Keywords: collagen, protein, thermal properties, rheological properties
6th Int. Conf.: Thermophysical and Mechanical Properties of Advanced Materials (THERMAM)
8thRostocker Int. Conf.: Thermophysical Properties for Technical Thermodynamics
22-24 September 2019, Çeşme, İzmir, Turkey
48
Thermal and Mechanical Behaviour of Graphene Loaded Graphite/PPS Composites
Lutfiye Altaya, Gozde Sevig Tantugb, Hava Cekinb, Yoldas Sekic, Mehmet Sarikanata
aDepartment of Mechanical Engineering, Ege University, Turkey, b İzmir Eğitim Sağlık Sanayi Yatırım A.Ş., Turkey
cDepartment of Chemistry, Dokuz Eylul University, Turkey, E-mail(s): [email protected], [email protected], [email protected],
[email protected], [email protected]
Polymeric materials have generally limited usage in high-temperature applications due to their low thermal conductivity, approximately between 0.11 and 0.44W/mK. It has been known that good thermal conductivity is one of many important properties that are essential for various industrial applications. Polymers can be filled with various conductive fillers to be used in place of metals and ceramics in heat transfer devices and systems. Thermally conductive polymeric composite materials, due to their excellent thermal and mechanical properties, have gained particular importance in thermal management applications, especially as they provide cost and energy savings. Graphene, a single layer of graphite, offers extraordinary properties due to its unique 2D structure. High thermal conductivity, superior mechanical properties, and excellent electronic transport properties make graphene potential carbon filler that could dramatically improve the structural and functional properties of polymer-based composites at low loadings. In this study, synthetic graphite and graphene nanoplatelets were used as conductive carbon fillers to produce polyphenylene sulfide (PPS) based composite materals. Carbon fillers with various weight fractions were mixed into PPS by using twin-screw extruder and test specimens were fabricated by injection molding machine. Synergistic effect of graphene on thermal properties of graphite/PPS composites were investigated by TGA and DSC analyses. Xenon Flash Diffusivity was used to measure both in-plane and through-plane thermal conductivity values of composites. Change in tensile and flexural properties of hybrid carbon filled PPS composites were investigated by mechanical characterization. It was observed that graphite and graphene filled composites showed increase in thermal stability. Also, improved in-plane and through-plane thermal conductivity values were obtained when graphene was used at 5wt% in the composites. This study showed that when graphite and graphene were used as hybrid carbon fillers, measured thermal conductivities were significantly higher because of the better thermal network formation in PPS based composites, It has been demonstrated that the addition of graphite and/or graphene does not cause a remarkable change in mechanical properties.
Keyword(s): PPS, graphite, graphene, thermal properties, mechanical properties, composites Acknowledgement: We would like to thank to project funded by Scientific and Technological Research Council of Turkey (No: 117M088 TUBITAK)

6th Int. Conf.: Thermophysical and Mechanical Properties of Advanced Materials (THERMAM)
8thRostocker Int. Conf.: Thermophysical Properties for Technical Thermodynamics
22-24 September 2019, Çeşme, İzmir, Turkey
49
Measurement of Viscosity and Specific Heat of Nanofluids of Practical Interest
Maycon C. F. Magalhãesa*, Helcio R. B. Orlande
a
1Federal University of Rio de Janeiro *Corresponding author: [email protected]
This work presents the results obtained at Heat Transfer and Transmission Laboratory – LTTC PEM/COPPE/UFRJ - for the physical properties measurements of selected water-based nanofluids. The physical properties of interest here are specific heat and viscosity. The specific heat was measured with a Differential Scanning Calorimeter while the viscosity was measured with a rotational rheometer. These equipment allow the temperature variation of the tests through their temperature controllers. Commercial nanofluids with nanoparticles of SiO2 were analysed with different volume concentrations. Particular focus is given for those with SiO2 nanoparticles, due to present high stability, without any apparent deposition of nanoparticles. With the physical properties measured in this work, a new correlation is proposed to the viscosity of SiO2 nanofluid as a function volume concentration of nanoparticle and temperature.
Keywords: Nanofluids, Viscosity, Specific Heat, SiO2 nanoparticle.
6th Int. Conf.: Thermophysical and Mechanical Properties of Advanced Materials (THERMAM)
8thRostocker Int. Conf.: Thermophysical Properties for Technical Thermodynamics
22-24 September 2019, Çeşme, İzmir, Turkey
50
Rubber Based Functionally Graded Syntactic Foams Under Multiple Quasi Static Compression Loading
Hasan KASIMa
a PEGA Automotive Air-Spring Systems Co. Inc, R&D Department Dosab/Bursa -TURKEY Email: [email protected]
Syntactic foams are lightweight composite materials producing a kind of hollow spheres into the binder materials. The mechanical behavior of these foams depends on the binder and hollow particle material types. The thermoset polymer-based binder materials and glass bubbles are the most used materials to develop syntactic foams. These syntactic foams generally deform under load as brittle foams. Under repeated loading conditions, these type of foams does not continue their functions, even the reducing ratio. In this study, rubber-based syntactic foams with functionally graded configurations were developed by using hollow-glass microspheres. The compression behavior of the developed syntactic foam was investigated under repeated quasi-static compression loading conditions, and load-displacement behavior was observed according to numbers of loading. The foam structure also designed as functionally graded to obtain maximum energy absorption behavior under compression loading by changing regional density oft he foam during the manufacturing process. The behavior of the graded foam also measured under multiple quasi-static compression loading conditions. The microstructural modifications after each loading were observed using Micro-CT scanning techniques and SEM images. The syntactic foams were observed after repeated loading conditions by breaking oft he glasses micro-spheres inside the rubber binder to convert to closed cell rubber foam by including glass particles inside each cell. Keywords: Rubber syntactic foam, Multiple quasi-static compression loading, Micro CT 3D scan, SEM
6th Int. Conf.: Thermophysical and Mechanical Properties of Advanced Materials (THERMAM)
8thRostocker Int. Conf.: Thermophysical Properties for Technical Thermodynamics
22-24 September 2019, Çeşme, İzmir, Turkey
51
POSTER ABSTRACTS
Energetic-Exergetic Evaluations of Ohmic Thawing Process Applied at Different Voltage Gradients
Omer Faruk COKGEZMEa, Mutlu CEVIKb, Deniz DONERc, Filiz ICIERa
a Ege University, Engineering Faculty, Food Engineering Department, 35100 Bornova, Izmir, Turkey b Munzur University, Food Engineering Department, Faculty of Engineering, 62100 Tunceli, Turkey
cEge University, Institute of Natural and Applied Sciences, Food Engineering Section, 35100 Bornova, Izmir, Turkey E-mail: [email protected]
The frozen meat products should be thawed before its consumption or usage in further processing. The main purpose of the thawing process is to carry out the thawing process in the least possible thawing time and with the lower energy requirement. To shorten the thawing time and to increase the energy efficiencies, studies have been focused on alternative thawing methods. Ohmic thawing is a novel alternative thawing method for foods. It is based on the passing of electric current from the food and using it as a resistance in the circuit. In this study, the frozen minced beef samples in a cylindrical shape (13 cm height × 3.91 cm diameter) having fat content of 10% were thawed with ohmic thawing (OT). OT was applied at 4°C±0.5°C ambient temperature by using voltage gradients of 10, 13, and 16 V/cm by using titanium foil electrodes and novel custom-made ohmic thawing cell. It was aimed to investigate the effect of voltage gradient on energetic and exergetic performances of ohmic thawing applied to minced meat until its centre temperature reached -1°C from -18 °C. The energy efficiencies for ohmic thawing of cylindrical frozen minced meat were in the range of 17.66% and 38.69% while the exergy efficiencies were between 12.03% and 34.73%. As the voltage gradient increased the energy-exergy efficiencies increased. The lowest improvement potential was found for 16 V/cm since the energy loss value was minimum at this voltage gradient. It is thought that the results of the present study will provide valuable data for designing pilot and industrial scale ohmic thawing systems. Keywords: Ohmic, meat, thawing, energy, exergy Acknowledgements: This study was part of the project financially supported by TUBİTAK-TOVAG (Project no. 115O207).
6th Int. Conf.: Thermophysical and Mechanical Properties of Advanced Materials (THERMAM)
8thRostocker Int. Conf.: Thermophysical Properties for Technical Thermodynamics
22-24 September 2019, Çeşme, İzmir, Turkey
52
Use of Surface Enhanced Raman Spectroscopy as a Tool for Detection of 6-Mono Acetyl Morphine (6-MAM)
Ramazan AKCANa, Mahmut Serif YILDIRIMb, Hasan ILHANc, Gokhan DEMIRELd,
Ugur TAMERe, Necdet SAGLAMf
a Associated Professor, Department of Forensic Medicine, Medical Faculty, Hacettepe University, Ankara, Turkey
b Forensic Medicine Specialist, Department of Forensic Medicine, Medical Faculty, Hacettepe University, Ankara, Turkey c PhD Student, Department of Nanotechnology and Nanomedicine, Hacettepe University, Ankara, Turkey
d Department of Chemistry, Faculty of Pharmacy, Gazi University, Ankara, Turkey e Department of Analytical Chemistry, Faculty of Pharmacy, Gazi University, Ankara, Turkey f Department of Nanotechnology and Nanomedicine, Hacettepe University, Ankara, Turkey
E-mail: [email protected]
6-Mono acetyl morphine (6-MAM) is a metabolite of Heroin, a common drug of abuse. This metabolite can be detected by certain analytical methods. However, there is a strong need for cheaper and faster methods to detect 6-MAM. Surface Enhanced Raman Spectroscopy (SERS) raises as an alternative tool for detection of drugs of abuse. This study aims to reveal SERS spectra of 6-MAM and establish an alternative method for 6-MAM detection. 6-MAM, in acetonitrile solution, in concentration of 1 mg/mL was used as sample solution. 2 µL of 6-MAM solution and 2 µL of colloidal Ag nanoparticles were mixed and vortexted. Lastly 2 µL of final solution was dropped on to Raman active Au surface. After an incubation period of five minutes Raman spectra gathered by a Raman Spectroscope with 785 nm laser source. The same process was repeated for 100 ppb, 500 ppb, 1 ppm, 5 ppm, 10 ppm, 50 ppm, 100 ppm concentrations of 6-MAM. Gathered spectra were compared. Major peaks of morphine were determined as 627 s-1 was the main major/specific peak. Other peaks were 544, 627, 868, 943, 1014, 1394 s-1. Gathered spectra of were compared for different concentrations of 6-MAM. A non-linear calibration curve was prepared using the intensity of 627 s-1. A clear SERS spectrum of 6-MAM was obtained. Developed method showed the ability of SERS in terms of 6-MAM detection in different concentrations. Keywords: Forensic Toxicology, Surface Enhanced Raman Spectroscopy, 6-Mono acetyl morphine
6th Int. Conf.: Thermophysical and Mechanical Properties of Advanced Materials (THERMAM)
8thRostocker Int. Conf.: Thermophysical Properties for Technical Thermodynamics
22-24 September 2019, Çeşme, İzmir, Turkey
53
Effect of Grape Pomace Usage in Chocolate Spread Formulatıon on Textural and Rheologıcal Propertıes
Betul Gizem ACANa, Mehmet GULCUb, Omer Said TOKERa, Ibrahim PALABIYIKc, Nevzat KONARd, Kubra BURSAa, Mahmut KILICLIa
a Food Engineering Department, Chemical and Metallurgical Engineering Faculty, Yildiz Technical University, İstanbul,
Turkey b Ministry of Agriculture and Forestry, Food Control Laboratory Directorate, Balıkesir, Turkey
c Food Engineering Department, Faculty of Agriculture, Namık Kemal University, Tekirdag, Turkey d Department of Food Engineering, Faculty of Architecture and Engineering, Siirt University, Siirt, Turkey
Aproximately 33-50% of all produced foods is wasted. Therefore, recycling of food wastes is one of the most hot topic in the food industry. Fruit and vegetable-based wastes are composed of important part of the wastes. In the present study, grape pomace, arised after grape juice production was used in the chocolate spread, widely consumed by people of all ages throughout the world, instead of sugar, whey and milk powder up to some level. The formulations of the chocolate spreads were determined using mixture design. Sugar, whey/milk powder and pomace concentrations changed between 35-50%, 0.066-8.000% and 0.23-15%, respectively. Steady rheological properties of the chocolate spread were determined at 40 ºC and Ostwald de Waele model well described the flow behavior of the samples with R2 values close to unity. Consistency coefficient (K) and flow behavior index values changed between 8.29-24.26 Pa.sn and 0.523-0.708, respectively. In addition, firmeness and work of shear parameters as a textural characteristics were measured and they were found to between 1.92-4.17 N and 0.755-1.421 N.mm. Mixture design was performed to mathematically explain the relation between rheological and textural parameters with respect to sugar, whey/milk powder and grape pomace concentrations. All of the established models successfully described the relation with R2 values higher than 0.8. Textural and rheological parameters as well as sensory characteristics of the samples indicated that grape pomace can be used as a healthy and low-cost ingredient in chocolate spread formulation instead of sugar, whey and milk powder up to some level. This work was funded by the Scientific and Technological Research Council of Turkey (TUBITAK), Project No: 217O054. Keywords: Grape pomace, Waste, Chocolate Spread, Mixture Design, Rheology
6th Int. Conf.: Thermophysical and Mechanical Properties of Advanced Materials (THERMAM)
8thRostocker Int. Conf.: Thermophysical Properties for Technical Thermodynamics
22-24 September 2019, Çeşme, İzmir, Turkey
54
Rational Technology for Producing Cement From Opoka-Like Rocks of Uzbekistan
Dilshod MUKHITDINOVa, Farrukh ATABAEVa, Mastura ISKANDAROVAa
aResearch and test center "Strom" of Institute of the General and Inorganic Chemistry of Academy of Sciences of the
Republic of Uzbekistan, Tashkent, UZBEKISTAN e-mail: [email protected]; [email protected]
The article presents information on the results of scientific studies on the physico-chemical properties of opoka-like rocks of the Republic of Uzbekistan and their influence on physical-mechanical properties of portlandcement. It is known that the opoka consists mainly of clay minerals. Typical or normal supports are those opokas, which contain 54-80 % of opal silica, 10-40 % of clay minerals and up to 10 % of sandy particles. Due to the fact that the opoka in its composition contain active silica, capable of chemically interacting with lime under normal conditions, they are called pozzolans, that is, the products of chemical interaction with clinker minerals are slightly soluble in water calcium hydrosilicates, formed due to the intensive binding of CA(OH)2, released during the hydrolysis of clinker minerals and hydration of cement. The faster the CA(OH)2 binds to water-insoluble hydrate compounds, the faster the cement stone is compacted and strengthened. In the research and testing center "Strom" of the Institute of General and inorganic chemistry of the Academy of Sciences of the Republic of Uzbekistan investigated the influence of rock, represented by geologists as opoka, on the suitability for use as an additive for cement grade PC 400 D20. The presented rock samples showed that the chemical composition of the rock consists mainly of silica SiO2, the content of which is 80,6%, A12O3-9,57%; Fe2O3-1,59; CaО-0,27; MgO-0,80%; SO3-0,76; losses during calcination-1.59%, i.e. its composition according to the content of oxides is within the reference data characteristic of the opoka. To obtain the incremental cement, the mixture comprising clinker, 10-20% of the opoka and 5% of gypsum were subjected to joint grinding. Noted that the introduction of the mixture "clinker+gypsum" 10-20% of the flask, the crushing process compared to the cement with no cement remains practically unchanged: the grinding fineness, is determined by the residue on the sieve № 008 of cement with the additive of the flask, was 10-12%. Cement after 28 days of hardening in water have compressive strength within 406-442 kgf/cm2, which characterizes them as general construction cements grade 400 according to GOST (State standard) 10178-85. At the same time, the activity of additional cements with 10-20% opoka is 430-442 kgf/cm2, which is higher than that of non-additive cement having a strength of 402 kgf/cm2. It should be noted that the clinker for the production of cements with opoka must be of high quality and contain at least 55% of three calcium silicate C3S. Keywords: opoka, clay minerals, portlandcement, cement additive, clinker
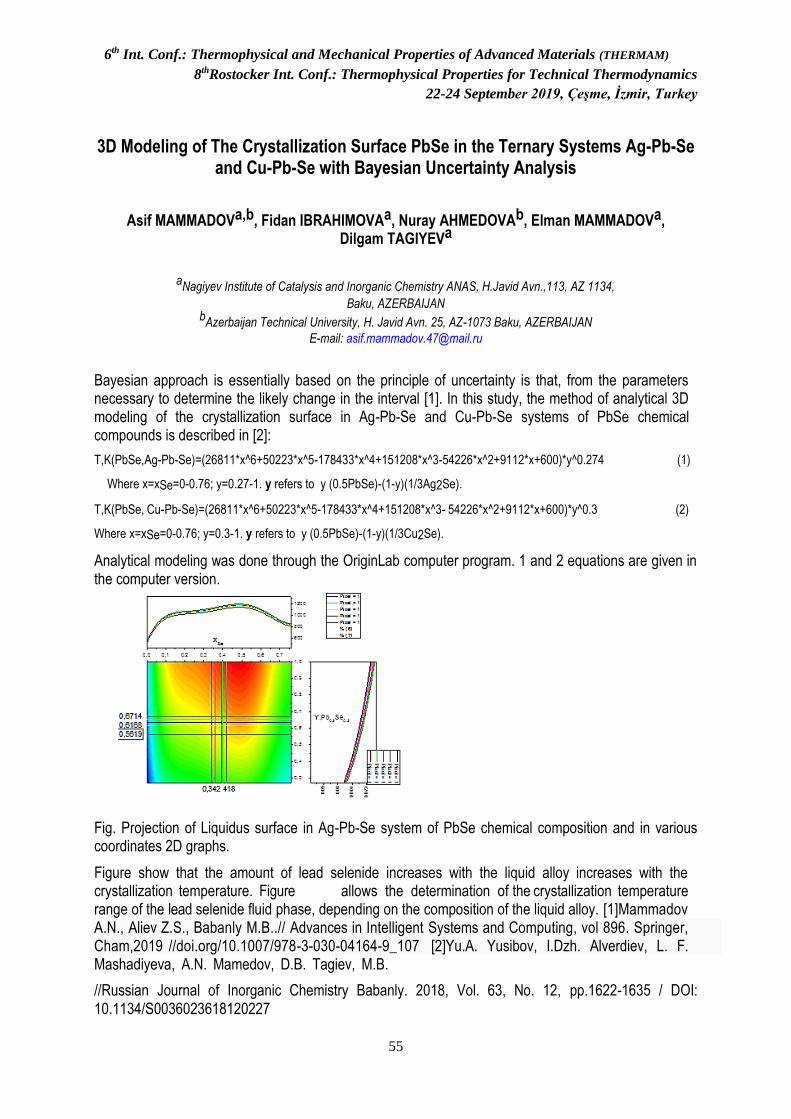
6th Int. Conf.: Thermophysical and Mechanical Properties of Advanced Materials (THERMAM)
8thRostocker Int. Conf.: Thermophysical Properties for Technical Thermodynamics
22-24 September 2019, Çeşme, İzmir, Turkey
55
3D Modeling of The Crystallization Surface PbSe in the Ternary Systems Ag-Pb-Se and Cu-Pb-Se with Bayesian Uncertainty Analysis
Asif MAMMADOVa,b, Fidan IBRAHIMOVAa, Nuray AHMEDOVAb, Elman MAMMADOVa, Dilgam TAGIYEVa
aNagiyev Institute of Catalysis and Inorganic Chemistry ANAS, H.Javid Avn.,113, AZ 1134,
Baku, AZERBAIJAN bAzerbaijan Technical University, H. Javid Avn. 25, AZ-1073 Baku, AZERBAIJAN
E-mail: [email protected]
Bayesian approach is essentially based on the principle of uncertainty is that, from the parameters necessary to determine the likely change in the interval [1]. In this study, the method of analytical 3D modeling of the crystallization surface in Ag-Pb-Se and Cu-Pb-Se systems of PbSe chemical compounds is described in [2]:
T,K(PbSe,Ag-Pb-Se)=(26811*x^6+50223*x^5-178433*x^4+151208*x^3-54226*x^2+9112*x+600)*y^0.274 (1)
Where x=xSe=0-0.76; y=0.27-1. y refers to y (0.5PbSe)-(1-y)(1/3Ag2Se).
T,K(PbSe, Cu-Pb-Se)=(26811*x^6+50223*x^5-178433*x^4+151208*x^3- 54226*x^2+9112*x+600)*y^0.3 (2)
Where x=xSe=0-0.76; y=0.3-1. y refers to y (0.5PbSe)-(1-y)(1/3Cu2Se).
Analytical modeling was done through the OriginLab computer program. 1 and 2 equations are given in the computer version.
Fig. Projection of Liquidus surface in Ag-Pb-Se system of PbSe chemical composition and in various coordinates 2D graphs.
Figure show that the amount of lead selenide increases with the liquid alloy increases with the crystallization temperature. Figure allows the determination of the crystallization temperature range of the lead selenide fluid phase, depending on the composition of the liquid alloy. [1]Mammadov A.N., Aliev Z.S., Babanly M.B..// Advances in Intelligent Systems and Computing, vol 896. Springer, Cham,2019 //doi.org/10.1007/978-3-030-04164-9_107 [2]Yu.A. Yusibov, I.Dzh. Alverdiev, L. F. Mashadiyeva, A.N. Mamedov, D.B. Tagiev, M.B.
//Russian Journal of Inorganic Chemistry Babanly. 2018, Vol. 63, No. 12, pp.1622-1635 / DOI: 10.1134/S0036023618120227
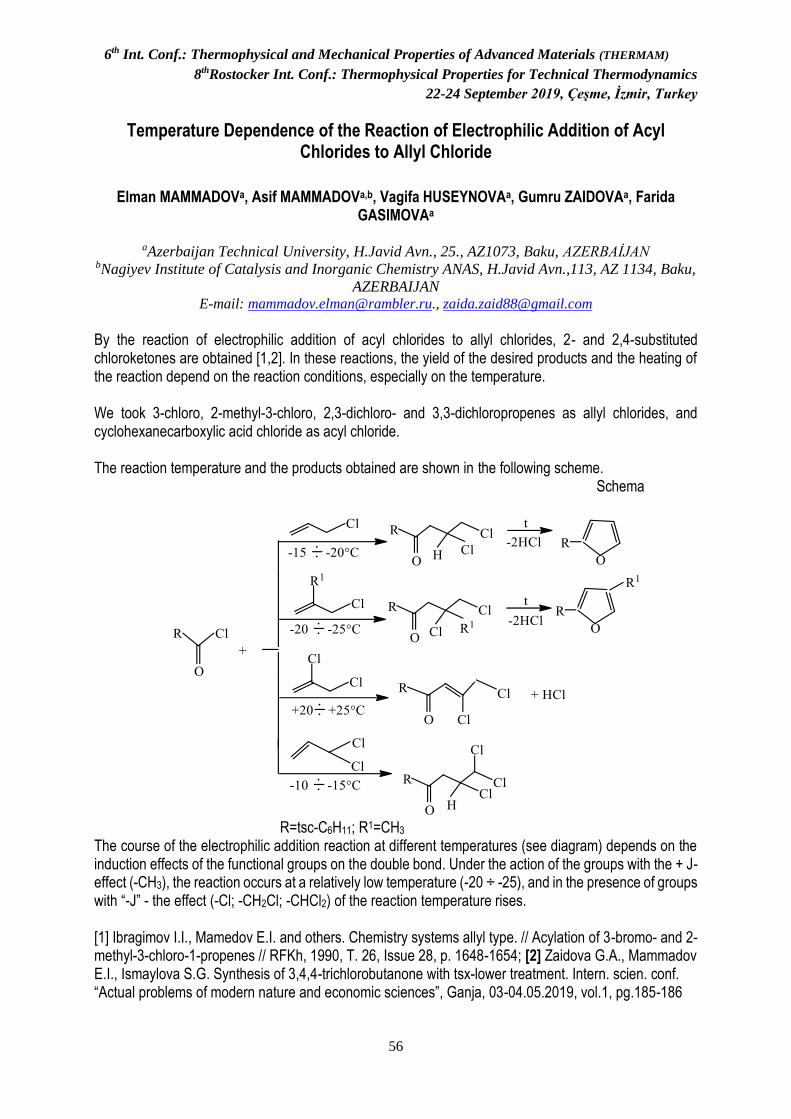
6th Int. Conf.: Thermophysical and Mechanical Properties of Advanced Materials (THERMAM)
8thRostocker Int. Conf.: Thermophysical Properties for Technical Thermodynamics
22-24 September 2019, Çeşme, İzmir, Turkey
56
Temperature Dependence of the Reaction of Electrophilic Addition of Acyl Chlorides to Allyl Chloride
Elman MAMMADOVa, Asif MAMMADOVa,b, Vagifa HUSEYNOVAa, Gumru ZAIDOVAa, Farida
GASIMOVAa
aAzerbaijan Technical University, H.Javid Avn., 25., AZ1073, Baku, AZERBAİJAN bNagiyev Institute of Catalysis and Inorganic Chemistry ANAS, H.Javid Avn.,113, AZ 1134, Baku,
AZERBAIJAN E-mail: [email protected]., [email protected]
By the reaction of electrophilic addition of acyl chlorides to allyl chlorides, 2- and 2,4-substituted chloroketones are obtained [1,2]. In these reactions, the yield of the desired products and the heating of the reaction depend on the reaction conditions, especially on the temperature. We took 3-chloro, 2-methyl-3-chloro, 2,3-dichloro- and 3,3-dichloropropenes as allyl chlorides, and cyclohexanecarboxylic acid chloride as acyl chloride. The reaction temperature and the products obtained are shown in the following scheme. Schema
R=tsc-C6H11; R1=CH3
The course of the electrophilic addition reaction at different temperatures (see diagram) depends on the induction effects of the functional groups on the double bond. Under the action of the groups with the + J-effect (-CH3), the reaction occurs at a relatively low temperature (-20 ÷ -25), and in the presence of groups with “-J” - the effect (-Cl; -CH2Cl; -CHCl2) of the reaction temperature rises.
[1] Ibragimov I.I., Mamedov E.I. and others. Chemistry systems allyl type. // Acylation of 3-bromo- and 2-methyl-3-chloro-1-propenes // RFKh, 1990, T. 26, Issue 28, p. 1648-1654; [2] Zaidova G.A., Mammadov E.I., Ismaylova S.G. Synthesis of 3,4,4-trichlorobutanone with tsx-lower treatment. Intern. scien. conf. “Actual problems of modern nature and economic sciences”, Ganja, 03-04.05.2019, vol.1, pg.185-186

6th Int. Conf.: Thermophysical and Mechanical Properties of Advanced Materials (THERMAM)
8thRostocker Int. Conf.: Thermophysical Properties for Technical Thermodynamics
22-24 September 2019, Çeşme, İzmir, Turkey
57
Quantum Chemical Studies of Some Diamine Derivatives: Theoretical Investigation
Semran SAGLAMa, Umran Ceren BASKOSEb , Akif OZBAYa, T. Raci SERTBAKANc
a Department of Physics, Gazi University, 06500, Ankara, Turkey.
b Photonics Application and Research Center, Gazi University, 06500, Ankara, Turkey. cDepartment of Physics, Kırşehir Ahi Evran University, 40100, Kırşehir, Turkey
E-mail: [email protected]
In this study, ,-diamines (NH2(CH)nNH2, n=10,12) have been investigated by using density functional theory. The quantum chemical calculations were performed by means of the Gaussian 09W [1] and Gauss View 5.0 [2] software package, using hybrid density functional theory (DFT) at the B3LYP level and with 6-311G++(d, p) basis set. All the computations have been carried out in gas phase. The harmonic vibrational frequencies have been calculated at the same level of theory. The vibrational frequencies were calculated and scaled, and subsequently values have been compared with the experimental Infrared spectra. The vibrational modes were assigned on the basis of the potential energy distribution (PED) analysis for using scaled quantum mechanics (SQM) program [3]. The highest occupied molecular orbital energy (EHOMO), lowest unoccupied molecular orbital energy (ELUMO) and the energy gap between EHOMO
and ELUMO (EHOMO-LUMO) have been calculated at the same level of theory. Additionally, the molecular electrostatic potential, electron density and electron density contour plots were presented.
ELUMO = -0,58 eV
EHOMO = -9.42 eV
Figure1. Optimized structures, atom numbering and HOMO LUMO plot of 1,10-Diaminodecane Keywords: 1,10-Diaminodecane and 1,12-Diaminododecane, Density Functional Theory (DFT), Molecular Spectroscopy REFERENCES [1] Gaussian 09, Revision E.01, M.J. Frisch, Gaussian, Inc., Pittsburgh, PA, 2009.. [2] A. Frisch, A.B. Nielson, A.J. Holder, Gaussview User Manual, Gaussian Inc., Pittsburgh, PA, 2000. [3] G. Rauhut, P. Pulay, J. Phys. Chem. 99 (1995) 3093
6th Int. Conf.: Thermophysical and Mechanical Properties of Advanced Materials (THERMAM)
8thRostocker Int. Conf.: Thermophysical Properties for Technical Thermodynamics
22-24 September 2019, Çeşme, İzmir, Turkey
58
Sers Based LFIA for Detection of Pathogen Bacteria in Nanotechnology
Hasan ILHANa, Ugur TAMERb , Necdet SAGLAMa
a Department of Nanotechnology Nanomedicine, Graduate School of Science and Engineering Hacettepe University,
Beytepe Campus, 06800, Ankara, Turkey. b Department of Analytical Chemistry Faculty of Pharmacy, Gazi University, Teknikokullar, Ankara, Turkey.
E-mail: [email protected]
In recent years, rapid and accurate detection of pathogenic bacteria (Salmonella, Staphylococcus, Escherichia et al.) has been a current research area in terms of public health and food safety. One of the effective methods for this purpose is Surface-enhanced Raman scattering (SERS), its sensitivity, signal amplification capability, portability, and paper-based horizontal flow immunoassay (LFIA) system; Due to their high analysis rate and low cost, they stand out as a powerful and effective technique for the detection of pathogenic microorganisms. In this study, SERS and the paper-based LFIA system were combined using raman label of DTNB 5,5 D-Dithiobis (2-Nitrobenzoic acid). Accurate and rapid detection of target and other pathogenic bacteria was performed after pre-enrichment with Fe3O4/Au-PEI nanoparticles. For this purpose, the SERS-based LFIA system developed by us is intended to be applied to E. coli as an indicator microorganism due to highly selective method, and also 20 nm gold nanoparticle (AuNP), casein, 15 nm size Fe3O4/Au-PEI nanoparticles and rennet enzyme were used and optimized conditions were investigated. In the first stage of our study, Fe3O4/Au-PEI nanoparticles coated selected bacterial antibody were interacted with E. coli concentrations of 101-107 cfu/mL with the help of enzyme based magnetic extraction system. In the last stage of our study, the effectiveness of E. coli was investigated in synthetic urine, reference blood and commercial milk known as biological samples. Here, this study showed that the synthetic urine, reference blood and milk, valuable nutrients especially indicator E. coli tested as biological samples confirmed the idea that we will detect other pathogen bacteria. Keywords: SERS, AuNP, Nanotechnology Nanomedicine, LFIA, Fe3O4/Au-PEI.
6th Int. Conf.: Thermophysical and Mechanical Properties of Advanced Materials (THERMAM)
8thRostocker Int. Conf.: Thermophysical Properties for Technical Thermodynamics
22-24 September 2019, Çeşme, İzmir, Turkey
59
The Effect of Annealing Temperature on the Structural and Optical Properties of CuO Nanoparticles
Almi KENZAa, Lakel SAIDa, Youcef HADJERa
a Department of matter sciences, University of Biskra, Post Box 145 RP, 07000, City Biskra, Algérie.
E-mail: [email protected]
In recent years, nanoscale metal oxides have attracted a great deal of research interest because of both fundamental and technological point of view. Among all the metal oxides, cupric oxide (CuO) has attracted considerable attention because of its particular properties. We report in this study, the effect of temperature annealing on the structural and optical properties of CuO nanoparticles. This latter was synthesized using the sol-gel method. The structural and optical properties of these nanoparticles were studied using X-ray diffraction (XRD) and UV-Visible spectrophotometer. XRD analysis indicated that the crystallite size increase as and when the annealing temperature increase, its average value varied between 20,31 and 48,07 nm. The transmittance value of the obtained nanoparticles varied between 38% and 60% in the range of visible light. Optical absorption analysis indicated that the band gap decreased proportionally to the increase of the temperature, it varied between 3,45 and 3,21 eV.
Keywords: Metal oxides, nanoparticles, nanoparticles elaboration methods
6th Int. Conf.: Thermophysical and Mechanical Properties of Advanced Materials (THERMAM)
8thRostocker Int. Conf.: Thermophysical Properties for Technical Thermodynamics
22-24 September 2019, Çeşme, İzmir, Turkey
60
Thermal Proporties of New Composite Materials Based on Date Palm Waste
Kenza ALMIa, Said LAKELa, Adel BENCHABANEb, Abdelwahade KRIKERc
a Department of matter sciences, University of Biskra, Post Box 145 RP, 07000, City Biskra, Algeria.
b Department of mechanics, University of Biskra, Post Box 145 RP, 07000, City Biskra, Algeria. b Department of civil engineering, University of Ouargla, Post Box 511 RP, 30000, City Ouargla, Algeria.
E-mail: [email protected]
The exploitation of the useless biomass generated every year by a huge number of date palm trees could have a positive economic and environmental impact. In this respect, the objective of the present work is to study the possibility to produce low thermal conductivity composite materials using date palm particles and low-cost binder. Date palm particles were used as a reinforcing material of an organic matrix, wherein two types of polymers were tested. Thermal properties of the obtained composites were characterized using the thermal analyzer Hot Disk-Thermoconcept. The effect of elaboration process variables such as press temperature, particle size, press cycle time, and incorporation rate on the thermal conductivity, diffusivity, and thermal density of the materials was studied. The results were presented graphically and discussed in terms of elaboration process parameters in order to determine the optimum conditions of the composite material elaboration. Keywords: Date palm wood, biocomposite materials, thermal properties
6th Int. Conf.: Thermophysical and Mechanical Properties of Advanced Materials (THERMAM)
8thRostocker Int. Conf.: Thermophysical Properties for Technical Thermodynamics
22-24 September 2019, Çeşme, İzmir, Turkey
61
Study of Antimicrobial Properties Substances Synthesized Based on Dimethyl 4-Hydroxy-4-Methyl-2- (4-Methylphenyl) -6-Oxocyclohexane-1,3-Dicarboxylate
Fariz Amirov, Javid Safarov, Narmina Guliyeva , Zarema Gakhramanova ,
Elsun Azizov, Gamar Suleymanova, Shabnam Hajizade
Department of Technology of Organic Substances and High Molecule Compounds, Azerbaijan State Oil and Industrial
University, 16/21 Azadliq Ave, Baku, AZERBAIJAN
b Lehrstuhl für Technische Thermodynamik, Universität Rostock, GERMANY
Modern synthetic antimicrobial agents occupy a leading place in the treatment of bacterial infections. The
difficulties of treating and preventing infectious diseases caused by the diversity of biological forms of
pathogens, the constant emergence of multi-resistant forms, the emergence of new types of dangerous
pathogens, determine the urgency of the problem of creating new antimicrobial agents. The need for new
drugs due to various reasons: the expansion of the antimicrobial spectrum, increased activity, activity
against resistant pathogens, improved pharmacokinetic properties, reduced toxicity. Organic compounds
inhibit or completely stop the growth of microorganisms.
The antimicrobial activity of some synthesized compounds of synthesized new chemical compounds
based on diethyl 4-hydroxy-4-methyl-2- (4-methylphenyl) -6-oxocyclohexane-1,3-dicarboxylate was
screened and the antimicrobial activity of derivatives of polycarbonyl compounds was established with
respect to microorganism test cultures, performed by a disc diffusion method and a serial dilution method
Sample.1 (1-(-6-hydroxy-3,6-dimethyl-4-phenyl-2-(thiazol-2-yl)-4,5,6,7-tetrahydro-2H-indazol-5-yl)
ethan-1-one), Sample 2 (1- (6-hydroxy-3,6-dimethyl-2,4-diphenyl-4,5,6,7-tetrahydro-2H-indazol-5-yl)
ethan-1-one), Sample 3 5-Acetyl-6-hydroxy-3,6-dimethyl-4-phenyl-4,5,6,7-tetrahydro-2H-indazole-2-
carbothioamide, Sample 4 (diethyl-9-hydroxy-9-methyl-7-phenyl-1,4-diazaspiro [4.5] decane-
6,8dikarboksilat)
Our studies show the relationship between the bactericidal action of the synthesized substances and their
structure and composition.
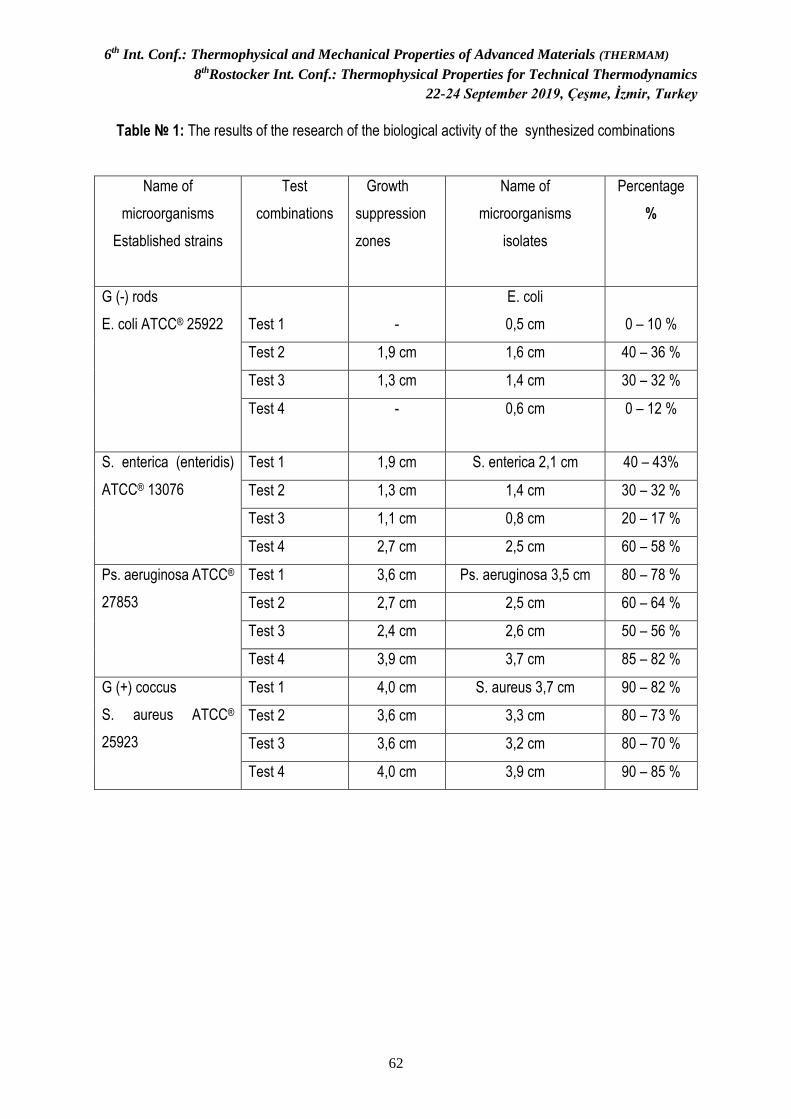
6th Int. Conf.: Thermophysical and Mechanical Properties of Advanced Materials (THERMAM)
8thRostocker Int. Conf.: Thermophysical Properties for Technical Thermodynamics
22-24 September 2019, Çeşme, İzmir, Turkey
62
Table № 1: The results of the research of the biological activity of the synthesized combinations
Name of
microorganisms
Established strains
Test
combinations
Growth
suppression
zones
Name of
microorganisms
isolates
Percentage
%
G (-) rods
E. coli ATCC® 25922
Test 1
-
E. coli
0,5 cm
0 – 10 %
Test 2 1,9 cm 1,6 cm 40 – 36 %
Test 3 1,3 cm 1,4 cm 30 – 32 %
Test 4 - 0,6 cm 0 – 12 %
S. enterica (enteridis)
ATCC® 13076
Test 1 1,9 сm S. enterica 2,1 cm 40 – 43%
Test 2 1,3 сm 1,4 cm 30 – 32 %
Test 3 1,1 сm 0,8 cm 20 – 17 %
Test 4 2,7 сm 2,5 cm 60 – 58 %
Ps. aeruginosa ATCC®
27853
Test 1 3,6 сm Ps. aeruginosa 3,5 cm 80 – 78 %
Test 2 2,7 сm 2,5 cm 60 – 64 %
Test 3 2,4 cm 2,6 cm 50 – 56 %
Test 4 3,9 сm 3,7 cm 85 – 82 %
G (+) coccus
S. aureus ATCC®
25923
Test 1 4,0 cm S. aureus 3,7 cm 90 – 82 %
Test 2 3,6 cm 3,3 cm 80 – 73 %
Test 3 3,6 cm 3,2 cm 80 – 70 %
Test 4 4,0 cm 3,9 cm 90 – 85 %
6th Int. Conf.: Thermophysical and Mechanical Properties of Advanced Materials (THERMAM)
8thRostocker Int. Conf.: Thermophysical Properties for Technical Thermodynamics
22-24 September 2019, Çeşme, İzmir, Turkey
63
Mechano-Chemical Modification of Wastes of Polystyrene with Polyvinyl Chloride
Gulnara ALIYEVA, Javid SAFAROV, Firangiz RAHIMOVA , Vugar KHALILOV
Department of Technology of Organic Substances and High Molecule Compounds, Azerbaijan State Oil and Industrial
University, 16/21 Azadliq Ave, Baku, AZERBAIJAN
b Lehrstuhl für Technische Thermodynamik, Universität Rostock, GERMANY
The purpose of this work is the synthesis of sulfocatonites based on household waste of polystyrene, modified polyvinyl chloride. It is known that due to its operational characteristics and ease of obtaining polymeric materials and products derived from them, are used in almost all areas of industry. In this regard, the amount of polymer waste increases greatly and the amount of this waste increases ~ 5% annually. Polystyrene is one of the most widely used polymers in the industry and about 8% of all household and industrial waste falls to its share. One of the ways to recycle polymeric wastes is to reuse them. In this regard, the synthesis of ion-exchange materials using polystyrene waste is an important task. As an object of research, the internal lining of the «ORSK» refrigerator produced in 1979 (OPS) and polyvinyl chloride (PVC) obtained by the suspension method were used. Mechano-chemical modification of the polymer mixture OPS: PVC was carried out on a laboratory capillary viscometer (IIRT-1) with a constant shear rate at a temperature of 140-150 °C for 5 minutes. Under these conditions, all modified mixtures had a stable flow. To obtain a homogeneous composition, the polymer mixture was subjected to triple treatment. Were obtained polymer compositions OPS: PVC in the following ratios, wt.%: 99: 1; 98: 2; 97: 3; 96: 4; 95: 5. Mechano-chemical modification was carried out to obtain graft and block copolymers in order to increase the impact strength of polystyrene waste by introducing a polymer containing a functional group. It was expected that with an increase in the impact strength of polystyrene, as well as as a result of weak structuring due to the functional group, the mechanical strength of sulfonic cation exchangers based on the OPS: PVC polymer blend will increase and the exchange characteristics of ion exchangers will change. The effect of PVC content on the complex of rheological properties of polystyrene wastes was studied. The rheological properties of the systems were investigated by capillary viscometry 140-150 ° C
in a wide range of stresses ( ) and shear rates (•
). The temperature was chosen based on practical
considerations of processing mixtures of plastics under production conditions, the shear stress range was 3.56 ÷ 7.87 · 105Pa. The homogeneity of the obtained systems is proved by the non-Newtonian nature of the flow of the systems. The straight-line character of the dependence of the shear rate on the shear stress value and the monotonic changes in the effective viscosity of the modified mixtures on the amount of the modifier introduced indicate a more uniform structure of these systems for all samples. In this regard, the efficiency of the process of sulfonation improves, since the nature of the supramolecular structure of polystyrene changes. Subsequently, sulfonic cation exchangers were obtained on the basis of modified OPS: PVC polymer compositions by sulfonation with concentrated sulfuric acid.
6th Int. Conf.: Thermophysical and Mechanical Properties of Advanced Materials (THERMAM)
8thRostocker Int. Conf.: Thermophysical Properties for Technical Thermodynamics
22-24 September 2019, Çeşme, İzmir, Turkey
64
Fabrication and Characterization of Natural Fiber Reinforced Thermoplastic Composites
Samet SANBURa ,Cicek OZESb, Ugur Omer KOCAMISc, Sami SAYERd, Halis KANDASa,
Okan OZDEMİRb
aThe Graduate School of Natural and Applied Sciences, Dokuz Eylül University, 35390, Izmir, TURKEY
bDepartment of Mechanical Engineering, Dokuz Eylül University, 35390, Izmir, TURKEY cGraduate Faculty of Natural and Applied Science, Ege University, 35100, İzmir, TURKEY
d Department of PolymerTechnology, Ege Vocational School, Ege University, 35100, Izmir, TURKEY E-mail: [email protected]
This study relates to the production of a composite reinforced with flax/jute woven fabrics and determination of its mechanical properties. The polypropylene nonwoven fabric used as a matrix material was placed between the layers jute and flax woven fabrics in thin form and formed into an interface which joins the jute and flax fabric layers by melting under high pressure and temperature. For increasing the amount of adhesion between reinforcement and matrix, alkali treatment was applied to jute and flax fabrics. The jute and flax woven fabrics have been retained in rate of 2% NaOH solution for 2 hour, then have been dried at room temperature. The composite was prepared using the compression molder by curing the materials at a temperature of 180 oC under a constant pressure of 8,163 bar for 30 min. The mechanical properties were evaluated by means of tensile, flexural and dropweight impact test. The ultimate tensile strength the young modulus of the hybrid composite was determined as 25.95 MPa and 2.76 GPa respectively. And the flexural strength of the hybrid composite was determined as 19.75 MPa. The perforation threshold of the composite was observed at 14,89 joule. Polypropylene used in the study was produced by spunbond method. In subsequent studies, the meltblown production method and the sequence of the jute and flax fabric may be worth investigating. Keywords: polypropylene nonwoven fabric, mechanical properties, impact test
6th Int. Conf.: Thermophysical and Mechanical Properties of Advanced Materials (THERMAM)
8thRostocker Int. Conf.: Thermophysical Properties for Technical Thermodynamics
22-24 September 2019, Çeşme, İzmir, Turkey
65
Recent Technologies on Refrigeration Systems: a Novel Design to Enhance the Performance of the Vapor Compression System
Halil Dogacan KOCAa, Nur COBANOGLUb, Alper Mete GENCa, Ziya Haktan KARADENIZb, Orhan
EKRENc
a Department of R&D, Klimasan Klima San. ve Tic. A.Ş, Yunusemre, Manisa, Turkey b Department of Mechanical Engineering, Izmir Katip Celebi University, Cigli, İzmir, Turkey
c Solar Energy Institute, Ege University, Bornova, Izmir, Turkey E-mail: [email protected] , [email protected] , [email protected] , [email protected] ,
The highest energy consumption in residential buildings is due to the home-type refrigerators and freezers. Therefore, to improve the coefficient of performance and reduce the energy consumption are the most important goals for researchers and suppliers. Over the past few decades, there has been a significant number of innovative systems that have become a part of the refrigeration system in mass production. In this research, a literature review of these systems (variable capacity compressors, microchannel heat exchangers, phase change materials etc.) which reduce the energy consumption of the vapor compression system is presented. In addition to existing studies, this paper also presents a numerical investigation carried out to study the effect of a natural circulation loop on vapor compression system. Using a natural circulation loop on a cooling system of household refrigerator/freezer is a novel method which has a potential for enhancing coefficient of performance. By using temperature-entropy and pressure-enthalpy diagrams, effects of natural circulation loop on system is examined. Keywords: coefficient of performance, natural circulation loops ,refrigerator

6th Int. Conf.: Thermophysical and Mechanical Properties of Advanced Materials (THERMAM)
8thRostocker Int. Conf.: Thermophysical Properties for Technical Thermodynamics
22-24 September 2019, Çeşme, İzmir, Turkey
66
The Study of Aluminium and Chrome Based New Bimetallic Catalytic Complex
Hikmet İBRAHİMOV, Shahla ALIZADEH, Lala ZAMANOVA
Department of Petroleum Chemistry, Institute of Petrochemical Processes, Khojaly avn., 30, AZ 1025, Baku, AZERBAIJAN E-mail:[email protected]
The development of processes of industrial importance such as oligomerization, polymerization and alkylation is of special importance for progress of petrochemical industry in our republic. It is known that AlCl3 and aluminium organic compounds, including Ziegler-Natta catalysts prepared on the basis of transition metal chlorides are used for oligomerization processes. This type of catalysts is very sensitive to the effect of the external environment, as well availability of low-molecular fractions in proper amount in composition of the obtained products has a negative impact on the physical and chemical properties of oligomers and materials obtained on the bases of it. New catalytic complex (NCC) has been synthesized by using metallic aluminium and 1,2-dichloroethane on purpose of preventing these deficiencies and increasing the economical effectiveness of the process and shown that NCC has higher stable activity in comparison with the other aluminium-containing catalysts in the processes of oligomerization, alkylation of liquid products of pyrolysis.
The synthesis of bimetallic catalytic complex has been realized in “in situ” mode by including metal compound into the system during the running of the reaction, at the moment of formation of initial radicals by using metallic aluminium, 1,2-dichloroethane chrome salt, and the physical and chemical parameters of obtained catalytic complex have been studied. The impact of temperature, reaction duration, the nature of the solvent, amount of the compounds, as well Al:Me molar ratio on the synthesis process have been investigated and optimal condition has been defined. Oligomerization processes of hexene-1 in presence of the synthesized bimetallic catalytic complex have been conducted and the results have comparatively analyzed. It has been established that bimetallic catalysts, especially NCC/CrCl3 in molar ratio of Al:Me=8:1 allow to decrease the density of catalyst from 1,0%mass to 0,5%mass, to increase the mass of the molecule, to improve the physical and mechanical properties of the obtained products in oligomerization processes by showing higher activity.
The nature, the structure, different physical parameters and the impact mechanism of synthesized catalytic complexes have been investigated by modern physical analysis methods. The size of catalytic particles in liquid phase has been investigated by dynamic light scattering (DLS) spectroscopy method and established that at 25ºC temperature NCC and its modification with Cr(III) chloride, constitute from nanodispersed clusters of sizes changing, respectively at interval of 11,9-44,2 nm and 37,4-142,0 nm. The formation of nanostructured carbon particles and Me-C interactions in catalytic complexes has been confirmed by spectroscopy analysis methods as EMR, TG/DTA, RFM, RFA, İR-, UV-.
Thus, conducted investigations show that it is possible to form new generation Ziegler-Natta type catalytic complexes constituting from nanostructured clusters with high stable activity by using metallic aluminium, dichloroethane and transition metal chloride. This type of the catalytic complexes create wide perspectives for realization of synthesis of high-molecular compounds of variuos definition in industry on the basis of oligomerization and polymerization reactions of individual olefins.

6th Int. Conf.: Thermophysical and Mechanical Properties of Advanced Materials (THERMAM)
8thRostocker Int. Conf.: Thermophysical Properties for Technical Thermodynamics
22-24 September 2019, Çeşme, İzmir, Turkey
67
FULL TEXTS
6th Int. Conf.: Thermophysical and Mechanical Properties of Advanced Materials (THERMAM)
8thRostocker Int. Conf.: Thermophysical Properties for Technical Thermodynamics
22-24 September 2019, Çeşme, İzmir, Turkey
68
Comparison of Energy and Exergy Performances of Parabolic Solar Trough Collector of Molten Salt and 100 Bar Air
F.M. Arslana, H. Günerhanb
aEge University, Graduate Shcool of Natural Applied Science, 35100 Bornova- İzmir- Turkey bEge University, Faculty of Engineering, Mechanical Engineering Department, 35100 Bornova- İzmir- Turkey
*Corresponding author: [email protected]
Keywords: Energy and exergy performance, Parabolic trough collector, Heat transfer fluids
Abstract: In this study, energy and exergy efficiency and pressure drops of air at 100 bar and molten salt
which is mixture of 60 wt% sodium nitrate (NaNO3) and 40 wt% potassium nitrate (KNO3) were compared.
The volumetric flow rates of air and molten salt were determined to be 1180 L/min and 145 L/min,
respectively. All calculations were performed using the properties of the LS-2 parabolic trough collector.
As a result, the thermal efficiency of the molten salt is higher than the air at 100 bar, and the maximum
difference of thermal efficiency was calculated as 3.83% at 550 °C. Furthermore, after 319 °C, the exergy
efficiency of the molten salt was higher than the air and the maximum exergy efficiency difference was
calculated to be 2.53%.
Introduction/Background: Among solar technologies, parabolic solar technology is one of the low-cost
technology [1]. Parabolic solar collectors reflect the sun's rays from a parabolic shaped twisted reflector
to the receiving pipe. Parabolic solar collectors transfer the sun's rays from the large area reflector to the
small area (the receiving pipe) and then transfer this energy to the fluid circulating within the receiving
pipe [2]. The PTC receiver tube is usually made of stainless steel. it is coated with a black selective coating
and isolated with a glass cover. To reduce the convective heat loss, the annular space between the
receiving tube and the glass is vacuumed. The outer glass surface can be coated with anti-reflective
coating to reduce heat losses by infrared radiation [3] The most common commercially used PTC
reflective material is a low iron thick glass mirror with silver coating on the back. However, in addition to
polished metal sheets, silver or aluminum thin coated films can also be used on a hard parabolic shaped
layer. The reflectance of the clean, silver-backed glass mirror is approximately 0.93. The silver coated
mirrors are very resistant to breakage and the breakage rate in PTC applications is less than 0.1% per
year [2]. Fig. 1 shows the reflectors and receivers of the parabolic solar collector.

6th Int. Conf.: Thermophysical and Mechanical Properties of Advanced Materials (THERMAM)
8thRostocker Int. Conf.: Thermophysical Properties for Technical Thermodynamics
22-24 September 2019, Çeşme, İzmir, Turkey
69
Figure 1. Reflector and receivers of the parabolic trough collector [4]
As PTC heat transfer fluids, water (up to 100 ° C), pressurized water, thermal oils (up to 400 ° C), nitrate
salts (up to 600 ° C), liquid metals such as sodium and lead-bismuth (up to 900 ° C) and gases such as
air, carbon dioxide and helium (above 1000 ° C) can be used [5]. PTC applications using molten salt
technology have attracted attention in recent years due to their high performance and low cost [6]. The
molten salts have some advantages over the thermal oil (e.g.low environmental effect). However, molten
salts exhibit a higher melting point with the risk of salt freezing and/or filling/drainage of the solar field
tubes compared to thermal oils [7]. The use of pressurized gases as working fluids is clean and safe
without temperature limitation. It also provides perfect integration with a storage system based on molten
salts [8].
Thermal model
Energy model of PTC can be explained by the energy balance in receivers. Energy model includes solar
radiation, optical losses in parabolic reflector and receivers, heat losses in receivers, and heat gains of
working fluid [10].
abs loss usefulQ Q Q= + (1)
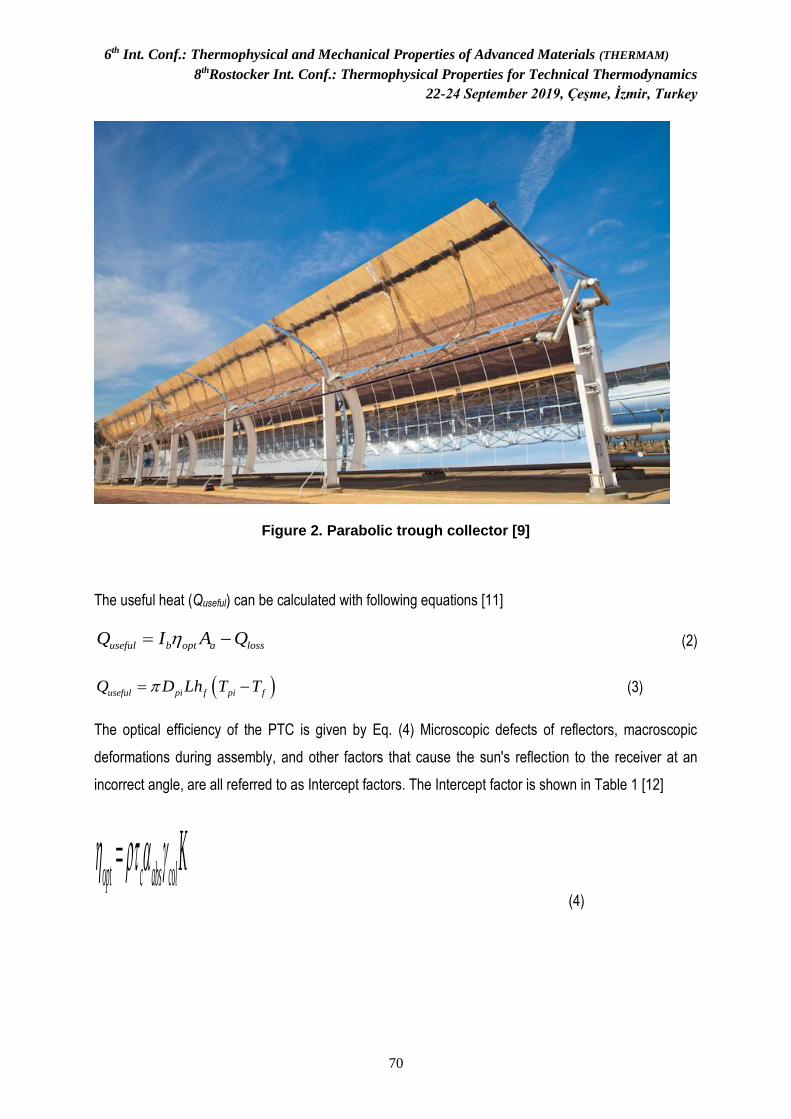
6th Int. Conf.: Thermophysical and Mechanical Properties of Advanced Materials (THERMAM)
8thRostocker Int. Conf.: Thermophysical Properties for Technical Thermodynamics
22-24 September 2019, Çeşme, İzmir, Turkey
70
Figure 2. Parabolic trough collector [9]
The useful heat (Quseful) can be calculated with following equations [11]
useful b opt a lossQ I A Q= − (2)
( )useful pi f pi fQ D Lh T T= − (3)
The optical efficiency of the PTC is given by Eq. (4) Microscopic defects of reflectors, macroscopic
deformations during assembly, and other factors that cause the sun's reflection to the receiver at an
incorrect angle, are all referred to as Intercept factors. The Intercept factor is shown in Table 1 [12]
opt c abs col K = (4)
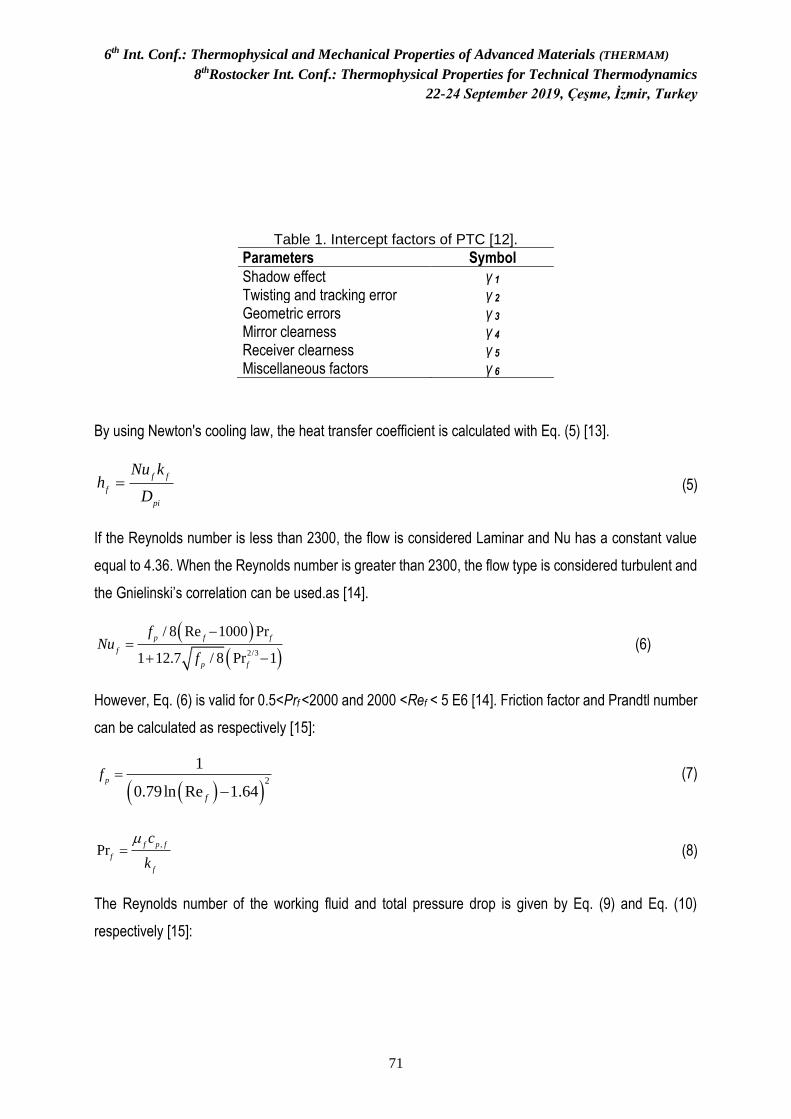
6th Int. Conf.: Thermophysical and Mechanical Properties of Advanced Materials (THERMAM)
8thRostocker Int. Conf.: Thermophysical Properties for Technical Thermodynamics
22-24 September 2019, Çeşme, İzmir, Turkey
71
Table 1. Intercept factors of PTC [12].
Parameters Symbol
Shadow effect γ 1
Twisting and tracking error γ 2 Geometric errors γ 3 Mirror clearness γ 4 Receiver clearness γ 5 Miscellaneous factors γ 6
By using Newton's cooling law, the heat transfer coefficient is calculated with Eq. (5) [13].
f f
f
pi
Nu kh
D= (5)
If the Reynolds number is less than 2300, the flow is considered Laminar and Nu has a constant value
equal to 4.36. When the Reynolds number is greater than 2300, the flow type is considered turbulent and
the Gnielinski’s correlation can be used.as [14].
( )
( )2/3
/ 8 Re 1000 Pr
1 12.7 / 8 Pr 1
p f f
f
p f
fNu
f
−=
+ − (6)
However, Eq. (6) is valid for 0.5<Prf <2000 and 2000 <Ref < 5 E6 [14]. Friction factor and Prandtl number
can be calculated as respectively [15]:
( )( )2
1
0.79ln Re 1.64p
f
f =
− (7)
,Pr
f p f
f
f
c
k
= (8)
The Reynolds number of the working fluid and total pressure drop is given by Eq. (9) and Eq. (10)
respectively [15]:
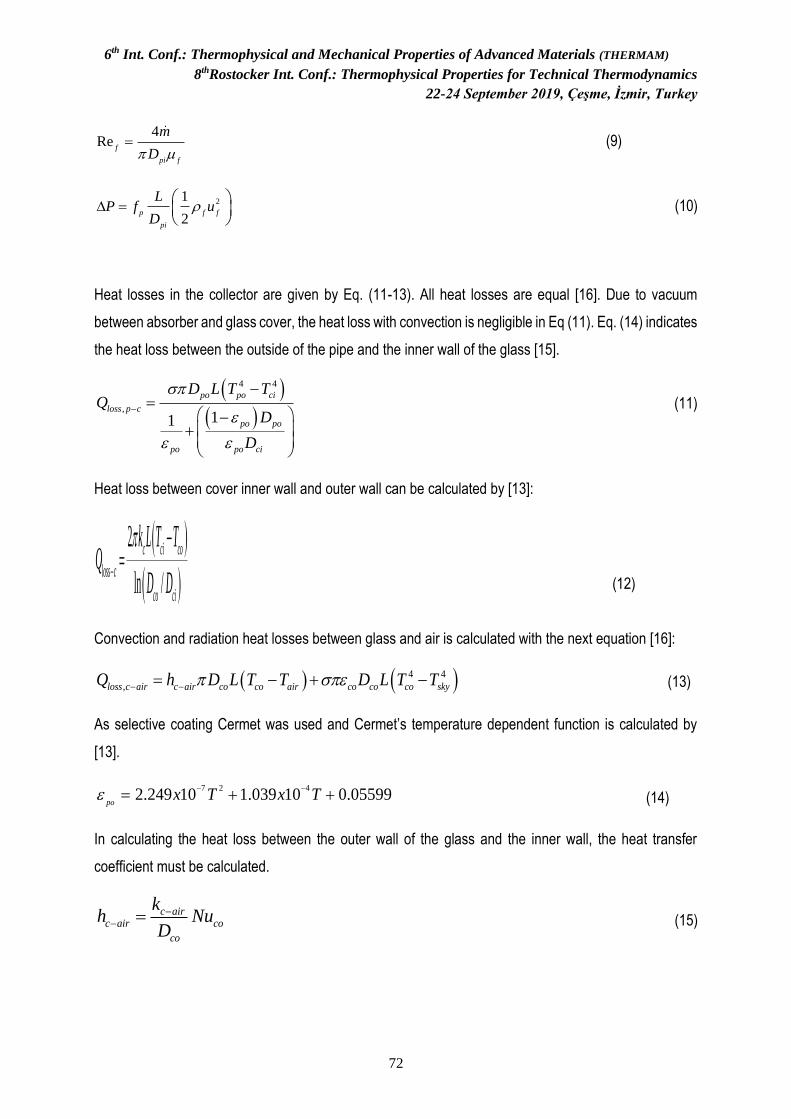
6th Int. Conf.: Thermophysical and Mechanical Properties of Advanced Materials (THERMAM)
8thRostocker Int. Conf.: Thermophysical Properties for Technical Thermodynamics
22-24 September 2019, Çeşme, İzmir, Turkey
72
4Re
f
pi f
m
D = (9)
21
2p f f
pi
LP f u
D =
(10)
Heat losses in the collector are given by Eq. (11-13). All heat losses are equal [16]. Due to vacuum
between absorber and glass cover, the heat loss with convection is negligible in Eq (11). Eq. (14) indicates
the heat loss between the outside of the pipe and the inner wall of the glass [15].
( )( )
4 4
,11
po po ci
loss p c
po po
po po ci
D L T TQ
D
D
−
−=
− +
(11)
Heat loss between cover inner wall and outer wall can be calculated by [13]:
( )
( )
2
ln /
c ci co
loss c
co ci
k L T TQ
D D
−
−=
(12)
Convection and radiation heat losses between glass and air is calculated with the next equation [16]:
( ) ( )4 4
,loss c air c air co co air co co co skyQ h D L T T D L T T − −= − + − (13)
As selective coating Cermet was used and Cermet’s temperature dependent function is calculated by
[13].
7 2 42.249 10 1.039 10 0.05599
pox T x T
− −= + + (14)
In calculating the heat loss between the outer wall of the glass and the inner wall, the heat transfer
coefficient must be calculated.
c airc air co
co
kh Nu
D
−− = (15)
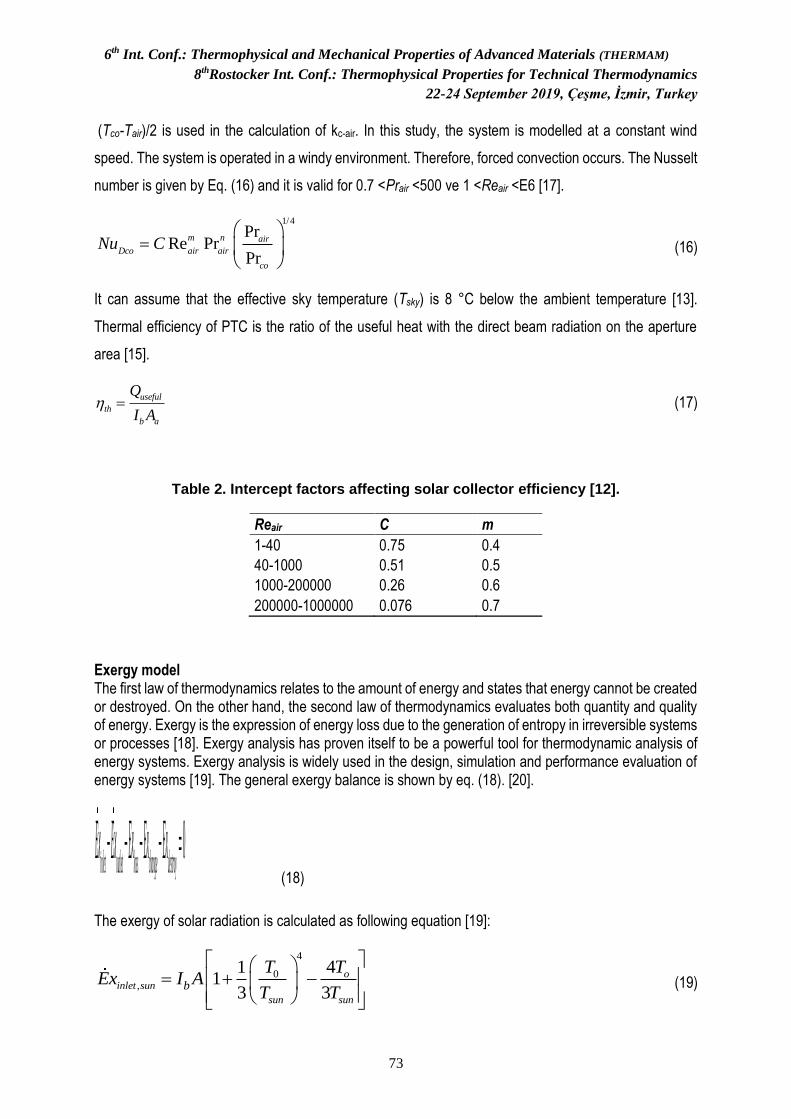
6th Int. Conf.: Thermophysical and Mechanical Properties of Advanced Materials (THERMAM)
8thRostocker Int. Conf.: Thermophysical Properties for Technical Thermodynamics
22-24 September 2019, Çeşme, İzmir, Turkey
73
(Tco-Tair)/2 is used in the calculation of kc-air. In this study, the system is modelled at a constant wind
speed. The system is operated in a windy environment. Therefore, forced convection occurs. The Nusselt
number is given by Eq. (16) and it is valid for 0.7 <Prair <500 ve 1 <Reair <E6 [17].
1/4
PrRe Pr
Pr
m n air
Dco air air
co
Nu C=
(16)
It can assume that the effective sky temperature (Tsky) is 8 °C below the ambient temperature [13].
Thermal efficiency of PTC is the ratio of the useful heat with the direct beam radiation on the aperture
area [15].
useful
th
b a
Q
I A = (17)
Table 2. Intercept factors affecting solar collector efficiency [12].
Reair C m
1-40 0.75 0.4
40-1000 0.51 0.5
1000-200000 0.26 0.6
200000-1000000 0.076 0.7
Exergy model The first law of thermodynamics relates to the amount of energy and states that energy cannot be created or destroyed. On the other hand, the second law of thermodynamics evaluates both quantity and quality of energy. Exergy is the expression of energy loss due to the generation of entropy in irreversible systems or processes [18]. Exergy analysis has proven itself to be a powerful tool for thermodynamic analysis of energy systems. Exergy analysis is widely used in the design, simulation and performance evaluation of energy systems [19]. The general exergy balance is shown by eq. (18). [20].
0inlet outlet loss change destroyEx Ex Ex Ex Ex− − − − = (18)
The exergy of solar radiation is calculated as following equation [19]:
4
0,
411
3 3
oinlet sun
sun sun
b
T TEx I A
T T
= + −
(19)

6th Int. Conf.: Thermophysical and Mechanical Properties of Advanced Materials (THERMAM)
8thRostocker Int. Conf.: Thermophysical Properties for Technical Thermodynamics
22-24 September 2019, Çeşme, İzmir, Turkey
74
Useful exergy is given by Eq. (20). Tsun can be taken as 5770K [15].
00
mmc T ln out
useful useful
in f f
p
T TEx Q
T T
P
= −
− (20)
Optic and heat exergy loss are calculated as [21]:
( )4
0loss,opt
411 1
3 3
oopt
sun sun
b
T TEx I A
T T
= − + −
(21)
loss,th 0
1 1loss
air ro
Ex Q TT T
= −
(22)
Total exergy loss is the sum of optical and heat exergy losses [21]
, ,loss loss opt loss thEx Ex Ex= +
The ratio of the useful exergy to the exergy of solar radiation gives the exergy efficiency [20].
,
useful
ex
inlet sun
Ex
Ex = (23)
Model description
Fluids properties
The volumetric flow rates of the working fluids were chosen in order to make an appropriate comparison
of the working fluids in the study. The selections were made considering the change of thermal and exergy
efficiency of HTFs. The volumetric flow rate of air was selected as 1180 l / min and the molten oil was 145
l / min. The maximum pressure the system can achieve without mechanical risk is 100 bar. Therefore, the
air pressure was selected as 100 bar [22]. With references [23] and [24] thermophysical properties of air
at 100 bar is obtained. The maximum operating temperature of the molten salt is 873 K and the freezing
point is 493 K. Thermophysical properties of molten salt can be calculated with following equations [7,25].
42.1060 6.6795 10f fx T
−= − (24)
5
,1.5404 3.092 10
p f fc x T−
= − (25)
40.3804 3.452 10f fk x T
−= + (26)
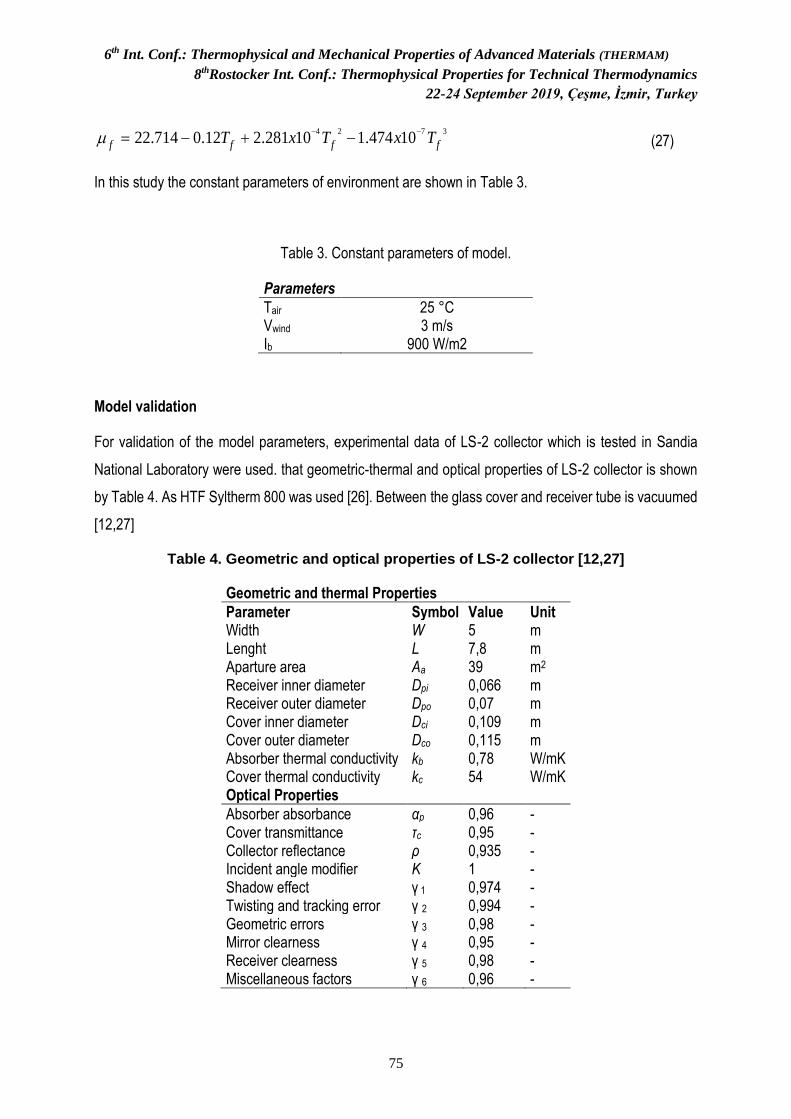
6th Int. Conf.: Thermophysical and Mechanical Properties of Advanced Materials (THERMAM)
8thRostocker Int. Conf.: Thermophysical Properties for Technical Thermodynamics
22-24 September 2019, Çeşme, İzmir, Turkey
75
4 2 7 322.714 0.12 2.281 10 1.474 10f f f fT x T x T
− −= − + − (27)
In this study the constant parameters of environment are shown in Table 3.
Table 3. Constant parameters of model.
Parameters
Tair 25 °C Vwind 3 m/s Ib 900 W/m2
Model validation
For validation of the model parameters, experimental data of LS-2 collector which is tested in Sandia
National Laboratory were used. that geometric-thermal and optical properties of LS-2 collector is shown
by Table 4. As HTF Syltherm 800 was used [26]. Between the glass cover and receiver tube is vacuumed
[12,27]
Table 4. Geometric and optical properties of LS-2 collector [12,27]
Geometric and thermal Properties
Parameter Symbol Value Unit Width W 5 m Lenght L 7,8 m Aparture area Aa 39 m2 Receiver inner diameter Dpi 0,066 m Receiver outer diameter Dpo 0,07 m Cover inner diameter Dci 0,109 m Cover outer diameter Dco 0,115 m Absorber thermal conductivity kb 0,78 W/mK Cover thermal conductivity kc 54 W/mK Optical Properties
Absorber absorbance αp 0,96 - Cover transmittance τc 0,95 - Collector reflectance ρ 0,935 - Incident angle modifier K 1 - Shadow effect γ 1 0,974 - Twisting and tracking error γ 2 0,994 - Geometric errors γ 3 0,98 - Mirror clearness γ 4 0,95 - Receiver clearness γ 5 0,98 - Miscellaneous factors γ 6 0,96 -
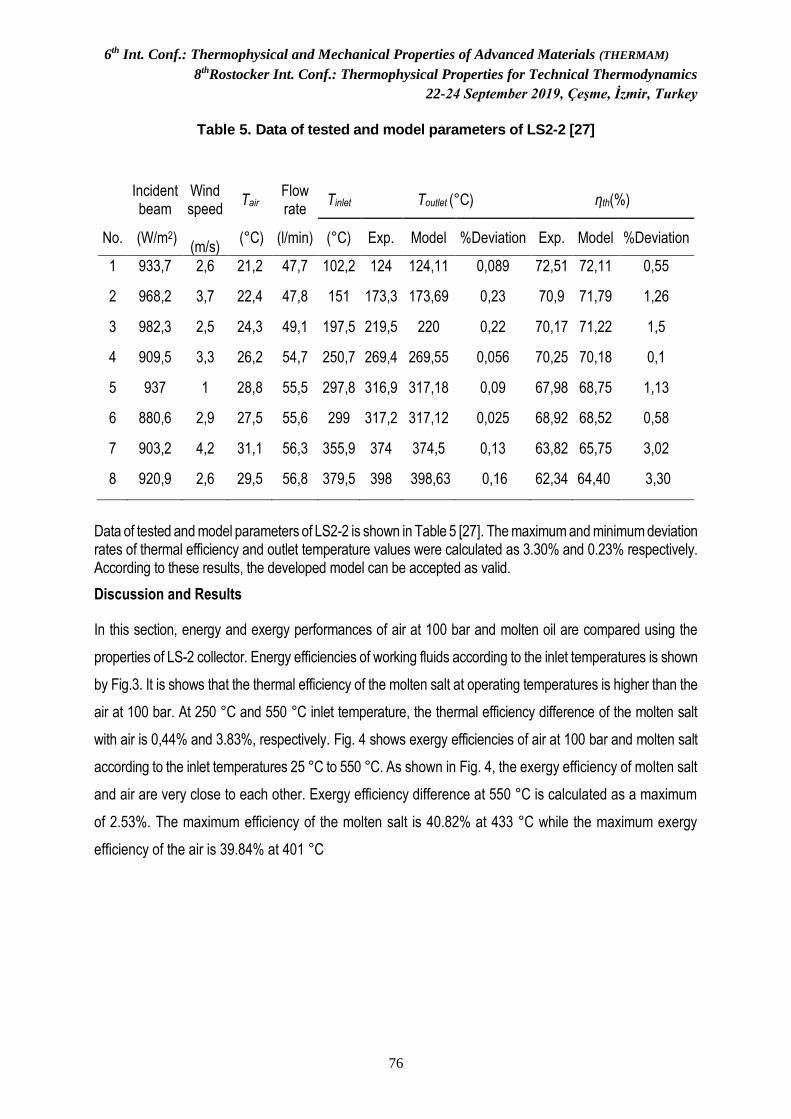
6th Int. Conf.: Thermophysical and Mechanical Properties of Advanced Materials (THERMAM)
8thRostocker Int. Conf.: Thermophysical Properties for Technical Thermodynamics
22-24 September 2019, Çeşme, İzmir, Turkey
76
Table 5. Data of tested and model parameters of LS2-2 [27]
Incident beam
Wind speed
Tair Flow rate
Tinlet Toutlet (°C) ηth(%)
No. (W/m2)
(m/s) (°C) (l/min) (°C) Exp. Model %Deviation Exp. Model %Deviation
1 933,7 2,6 21,2 47,7 102,2 124 124,11 0,089 72,51 72,11 0,55
2 968,2 3,7 22,4 47,8 151 173,3 173,69 0,23 70,9 71,79 1,26
3 982,3 2,5 24,3 49,1 197,5 219,5 220 0,22 70,17 71,22 1,5
4 909,5 3,3 26,2 54,7 250,7 269,4 269,55 0,056 70,25 70,18 0,1
5 937 1 28,8 55,5 297,8 316,9 317,18 0,09 67,98 68,75 1,13
6 880,6 2,9 27,5 55,6 299 317,2 317,12 0,025 68,92 68,52 0,58
7 903,2 4,2 31,1 56,3 355,9 374 374,5 0,13 63,82 65,75 3,02
8 920,9 2,6 29,5 56,8 379,5 398 398,63 0,16 62,34 64,40 3,30
Data of tested and model parameters of LS2-2 is shown in Table 5 [27]. The maximum and minimum deviation rates of thermal efficiency and outlet temperature values were calculated as 3.30% and 0.23% respectively. According to these results, the developed model can be accepted as valid.
Discussion and Results
In this section, energy and exergy performances of air at 100 bar and molten oil are compared using the
properties of LS-2 collector. Energy efficiencies of working fluids according to the inlet temperatures is shown
by Fig.3. It is shows that the thermal efficiency of the molten salt at operating temperatures is higher than the
air at 100 bar. At 250 °C and 550 °C inlet temperature, the thermal efficiency difference of the molten salt
with air is 0,44% and 3.83%, respectively. Fig. 4 shows exergy efficiencies of air at 100 bar and molten salt
according to the inlet temperatures 25 °C to 550 °C. As shown in Fig. 4, the exergy efficiency of molten salt
and air are very close to each other. Exergy efficiency difference at 550 °C is calculated as a maximum
of 2.53%. The maximum efficiency of the molten salt is 40.82% at 433 °C while the maximum exergy
efficiency of the air is 39.84% at 401 °C
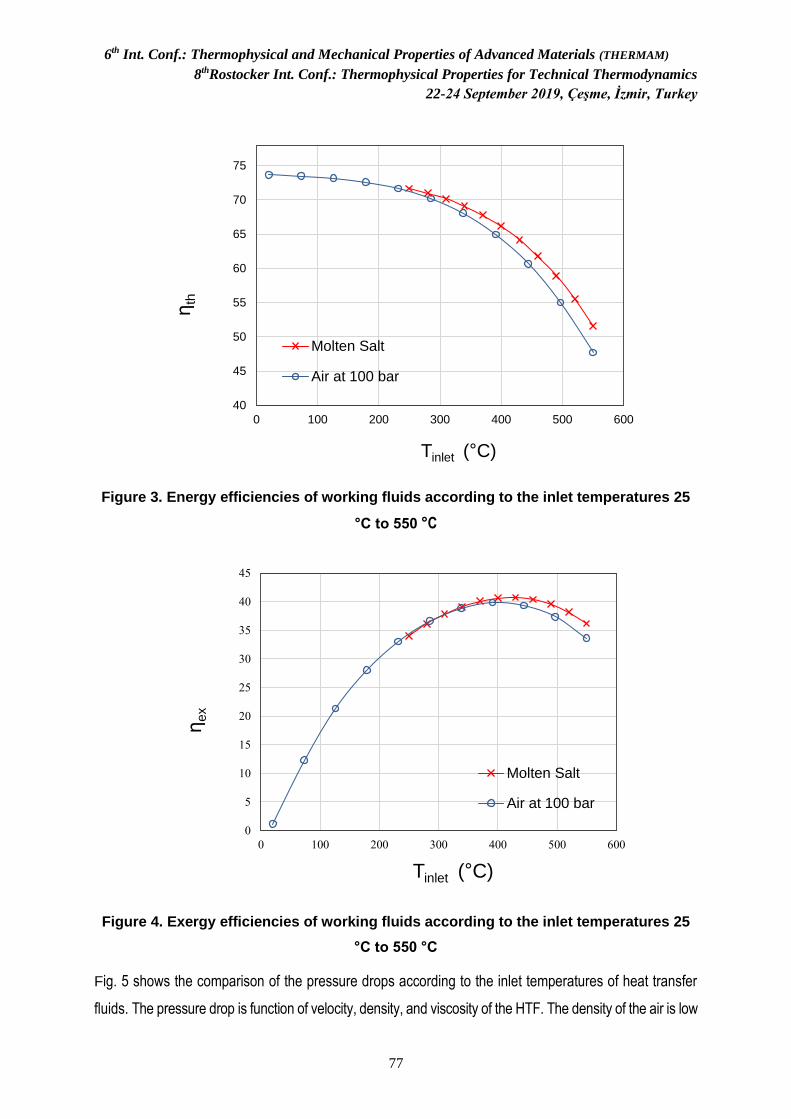
6th Int. Conf.: Thermophysical and Mechanical Properties of Advanced Materials (THERMAM)
8thRostocker Int. Conf.: Thermophysical Properties for Technical Thermodynamics
22-24 September 2019, Çeşme, İzmir, Turkey
77
Figure 3. Energy efficiencies of working fluids according to the inlet temperatures 25
°C to 550 °C
Figure 4. Exergy efficiencies of working fluids according to the inlet temperatures 25
°C to 550 °C
Fig. 5 shows the comparison of the pressure drops according to the inlet temperatures of heat transfer
fluids. The pressure drop is function of velocity, density, and viscosity of the HTF. The density of the air is low
40
45
50
55
60
65
70
75
0 100 200 300 400 500 600
ηth
Tinlet (°C)
Molten Salt
Air at 100 bar
0
5
10
15
20
25
30
35
40
45
0 100 200 300 400 500 600
ηex
Tinlet (°C)
Molten Salt
Air at 100 bar
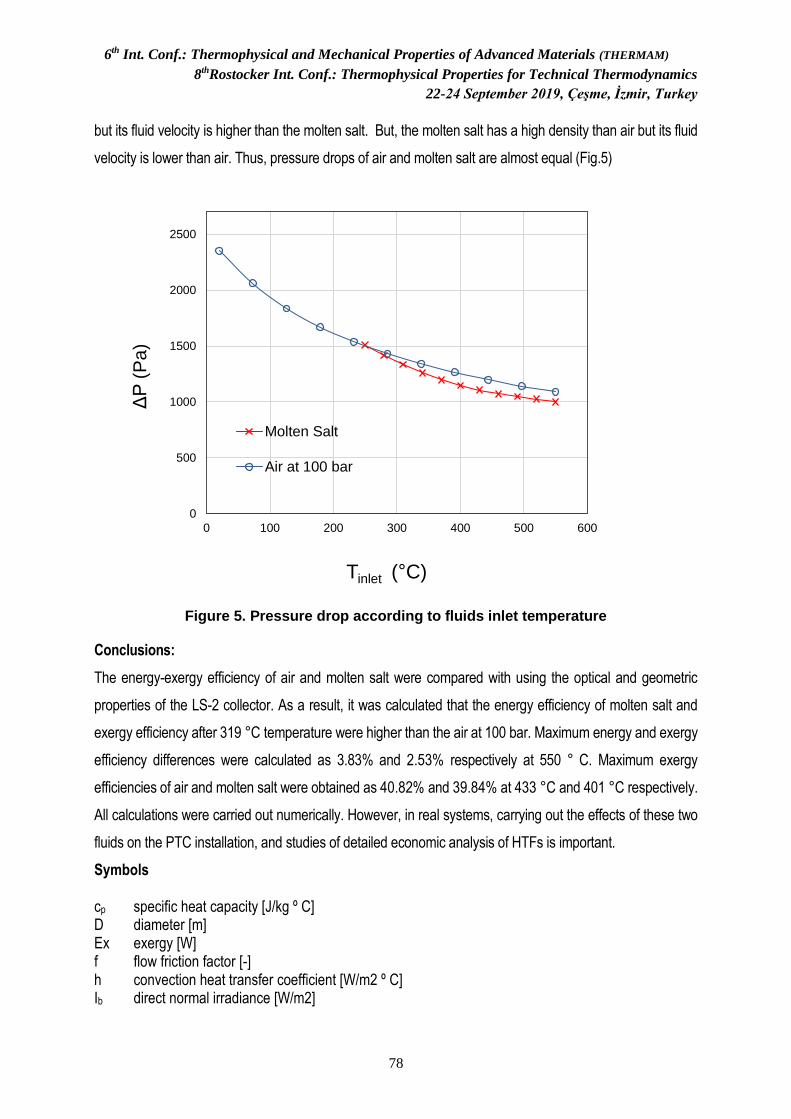
6th Int. Conf.: Thermophysical and Mechanical Properties of Advanced Materials (THERMAM)
8thRostocker Int. Conf.: Thermophysical Properties for Technical Thermodynamics
22-24 September 2019, Çeşme, İzmir, Turkey
78
but its fluid velocity is higher than the molten salt. But, the molten salt has a high density than air but its fluid
velocity is lower than air. Thus, pressure drops of air and molten salt are almost equal (Fig.5)
Figure 5. Pressure drop according to fluids inlet temperature
Conclusions:
The energy-exergy efficiency of air and molten salt were compared with using the optical and geometric
properties of the LS-2 collector. As a result, it was calculated that the energy efficiency of molten salt and
exergy efficiency after 319 °C temperature were higher than the air at 100 bar. Maximum energy and exergy
efficiency differences were calculated as 3.83% and 2.53% respectively at 550 ° C. Maximum exergy
efficiencies of air and molten salt were obtained as 40.82% and 39.84% at 433 °C and 401 °C respectively.
All calculations were carried out numerically. However, in real systems, carrying out the effects of these two
fluids on the PTC installation, and studies of detailed economic analysis of HTFs is important.
Symbols cp specific heat capacity [J/kg º C] D diameter [m] Ex exergy [W] f flow friction factor [-] h convection heat transfer coefficient [W/m2 º C] Ib direct normal irradiance [W/m2]
0
500
1000
1500
2000
2500
0 100 200 300 400 500 600
ΔP
(Pa
)
Tinlet (°C)
Molten Salt
Air at 100 bar
6th Int. Conf.: Thermophysical and Mechanical Properties of Advanced Materials (THERMAM)
8thRostocker Int. Conf.: Thermophysical Properties for Technical Thermodynamics
22-24 September 2019, Çeşme, İzmir, Turkey
79
k thermal conductivity [W/m ºC] K incident angle modifier [-] L lenght [m] m mass flow rate [kg/s] Nu Nusselt number [-] Pr Prandtl number [-] Re Reynolds number [=u D/ ] T Temperature [K] u velocity [m/s] UL overall heat transfer coefficient (W/m2 ºC] Q heat flux [W] V volumetric flow rate (L/min) W Width [m] Subscripts a aparture abs absorbtance c cover ci inside of cover co outside of cover col collector ex exergy f working fluid opt optical p pipe pi inside of pipe po outside of pipe th thermal
Greek symbols α absorbance [-] ΔP pressure drop [Pa] ε emissivity [-] η efficiency [-] γ intercept factor [-] θ incident angle [º] μ dynamic viscosity [Pa s] ρ density [kg/m3] σ Stefan Boltzmann constant [5.67x10⁸ W/m2 K4] τ transmittance [-]
References:
1. Subramani, J., Nagarajan, P.K., Mahian, O., Sathyamurthy, R., “Efficiency and heat transfer
improvements in a parabolic trough solar collector using TiO 2 nanofluids under turbulent flow
regime”, Renewable Energy, 2018, 119: 19-31.
6th Int. Conf.: Thermophysical and Mechanical Properties of Advanced Materials (THERMAM)
8thRostocker Int. Conf.: Thermophysical Properties for Technical Thermodynamics
22-24 September 2019, Çeşme, İzmir, Turkey
80
2. Lovegrove, K., Stein, W., “Concentrating solar power technology: principles, developments and
applications”. Elsevier, 2012.
3. Yılmaz, I. H., & Mwesigye, A., 2018, Modeling, simulation and performance analysis of parabolic
trough solar collectors: A comprehensive review. Applied energy, 225, 135-174.
4. Arslan F.M., 2018, Energy and exergy analysis of parabolic trough collectors, master thesis, Ege
University, İzmir, Tüurkey.
5. Bellos, E., Tzivanidis, C., & Antonopoulos, K. A., 2016, A detailed working fluid investigation for
solar parabolic trough collectors. Applied Thermal Engineering, 114, 374-386.
6. Chang C., Sciacovelli A., Wu Z., Xin Li, Y. Li, M. Zhao, J Deng, Z. Wang, Y. Ding, Enhanced heat
transfer in a parabolic trough solar receiver by inserting rods and using molten salt as heat
transfer fluid, Applied Energy, 220, 337–350 (2018)
7. A. Bonk, S. Sau, N. Uranga, M. Hernaiz, Thomas Bauer, Advanced heat transfer fluids for direct
molten salt line-focusing CSP plants, Progress in Energy and Combustion Science, 67, 69-87,
(2018)
8. Biencinto M., González L., Zarza E., Díez L. E., Muñoz J. and Val J. M., Modeling And Simulation
of A Loop of Parabolic Troughs Using Nitrogen As Workıng Fluid, Solarpaces (2012)
9. https://news.3m.com/blog/english/3m-helps-build-worlds-largest-solar-collectorPGK
10. Hachicha, A. A., Rodríguez, I., Capdevila, R., & Oliva, A., 2013, Heat transfer analysis and
numerical simulation of a parabolic trough solar collector. Applied energy, 111, 581-592
11. Mwesigye, A., Yılmaz, İ. H., & Meyer, J. P., 2018, Numerical analysis of the thermal and
thermodynamic performance of a parabolic trough solar collector using SWCNTs-Therminol®
VP-1 nanofluid. Renewable Energy, 119, 844-862.
12. Behar, O., Khellaf, A., Mohammedİ, K., “A novel parabolic trough solar collector model–Validation
with experimental data and comparison to Engineering Equation Solver (EES)”, Energy
Conversion and Management, 2015, 106: 268-281.
13. Forristal, R., “Heat transfer analysis and modeling of a parabolic trough solar receiver
implemented in engineering equation solver”, National Renewable Energy Lab., Golden,
CO.(US), 2003.
14. Coccia, G., Di Nicola, G., & Hidalgo, A., 2016, Parabolic trough collector prototypes for low-
temperature process heat. Springer.
15. Bellos, E., & Tzivanidis, C., 2017, A detailed exergetic analysis of parabolic trough collectors.
Energy Conversion and Management, 149, 275-292.
6th Int. Conf.: Thermophysical and Mechanical Properties of Advanced Materials (THERMAM)
8thRostocker Int. Conf.: Thermophysical Properties for Technical Thermodynamics
22-24 September 2019, Çeşme, İzmir, Turkey
81
16. Duffie, J. A., & Beckman, W. A., 2013, Solar engineering of thermal processes. John Wiley &
Sons.
17. Kalogirou, S. A., 2012, A detailed thermal model of a parabolic trough collector receiver. Energy,
48(1), 298-306.
18. Hepbasli, A., 2008, A key review on exergetic analysis and assessment of renewable energy
resources for a sustainable future. Renewable and sustainable energy reviews, 12(3), 593-661.
19. Gunerhan, H., & Hepbasli, A., 2007, Exergetic modeling and performance evaluation of solar
water heating systems for building applications. Energy and Buildings, 39(5), 509-516.
20. Madadi, V., Tavakoli, T., & Rahimi, A., 2014, First and second thermodynamic law analyses
applied to a solar dish collector. Journal of Non-Equilibrium Thermodynamics, 39(4), 183-197.
21. Loni, R., Asli-ardeh, E. A., Ghobadian, B., Kasaeian, A. B., & Gorjian, S., 2017, Thermodynamic
analysis of a solar dish receiver using different nanofluids. Energy, 133, 749-760. J.
22. M. Anton, M. Biencinto, E. Zarza, L.E. Díez, Theoretical basis and experimental facility for
parabolic trough collectors at high temperature using gas as heat transfer fluid, Applied Energy,
135, 373–381 (2014)
23. K. Kadoya, N. Matsunaga, A. Nagashima, Viscosity and Thermal Conductivity of Dry Air in the
Gaseous Phase, Journal of Physical and Chemical Reference Data, 14, 947 (1985)
24. E. W. Lemmon, R. T Jacobsen, Steven G. Penoncello, D. G. Friend, Thermodynamic Properties
of Air and Mixtures of Nitrogen, Argon, and Oxygen From 60 to 2000 K at Pressures to 2000 Mpa,
J. Phys. Chem. Ref. Data, 29, (2000)
25. T. Bauer, N. Pfleger, N. Breidenbach, M. Eck, D. Laing, S. Kaesche, Material aspects of Solar
Salt for sensible heat storage, Applied Energy, 111, 1114–1119 (2013)
26. https://www.loikitsdistribution.com/files/syltherm-800-product-brochure.pdf
27. Dudley, V. E., Kolb, G. J., Mahoney, A. R., Mancini, T. R., Matthews, C. W., Sloan, M., & Kearney,
D., 1994, Test results: SEGS LS-2 solar collector. Nasa Sti/recon Technical Report N, 96.
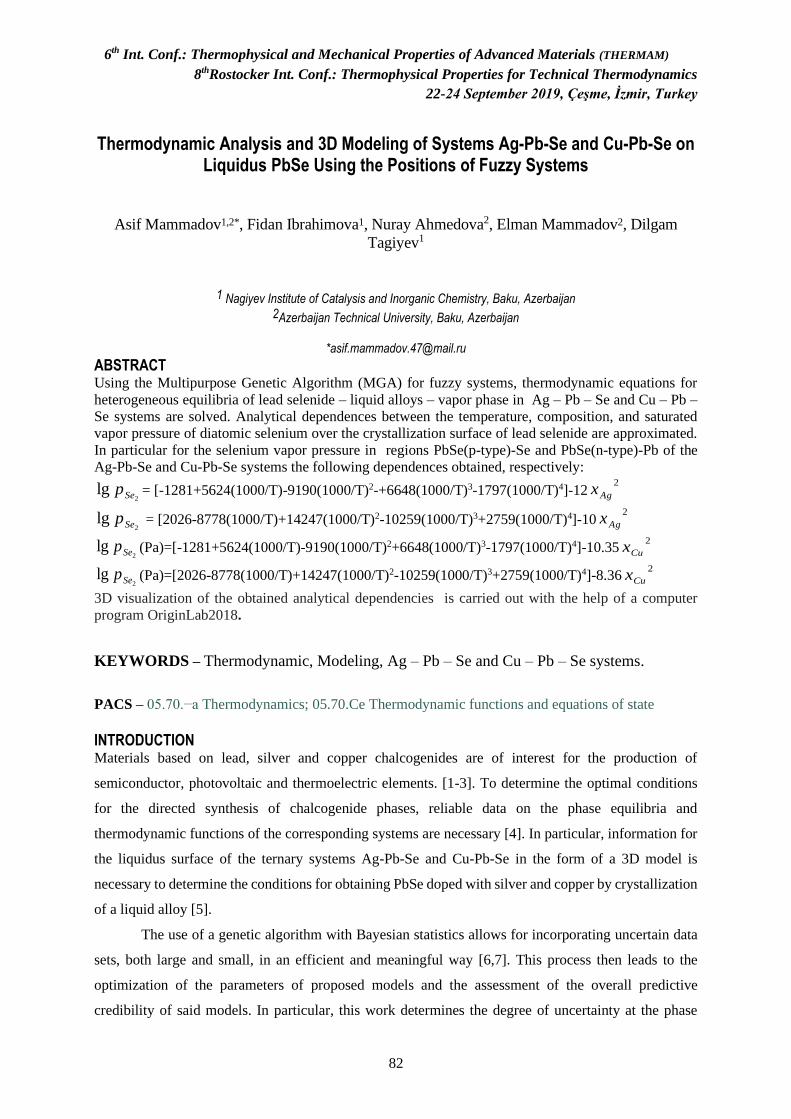
6th Int. Conf.: Thermophysical and Mechanical Properties of Advanced Materials (THERMAM)
8thRostocker Int. Conf.: Thermophysical Properties for Technical Thermodynamics
22-24 September 2019, Çeşme, İzmir, Turkey
82
Thermodynamic Analysis and 3D Modeling of Systems Ag-Pb-Se and Cu-Pb-Se on Liquidus PbSe Using the Positions of Fuzzy Systems
Asif Mammadov1,2*, Fidan Ibrahimova1, Nuray Ahmedova2, Elman Mammadov2, Dilgam
Tagiyev1
1 Nagiyev Institute of Catalysis and Inorganic Chemistry, Baku, Azerbaijan 2Azerbaijan Technical University, Baku, Azerbaijan
ABSTRACT Using the Multipurpose Genetic Algorithm (MGA) for fuzzy systems, thermodynamic equations for
heterogeneous equilibria of lead selenide – liquid alloys – vapor phase in Ag – Pb – Se and Cu – Pb –
Se systems are solved. Analytical dependences between the temperature, composition, and saturated
vapor pressure of diatomic selenium over the crystallization surface of lead selenide are approximated.
In particular for the selenium vapor pressure in regions PbSe(p-type)-Se and PbSe(n-type)-Pb of the
Ag-Pb-Se and Cu-Pb-Se systems the following dependences obtained, respectively:
2lg Sep = [-1281+5624(1000/T)-9190(1000/T)2-+6648(1000/T)3-1797(1000/T)4]-12
2
Agx
2lg Sep = [2026-8778(1000/T)+14247(1000/T)2-10259(1000/T)3+2759(1000/T)4]-10
2
Agx
2lg Sep (Pa)=[-1281+5624(1000/T)-9190(1000/T)2+6648(1000/T)3-1797(1000/T)4]-10.35
2
Cux
2lg Sep (Pa)=[2026-8778(1000/T)+14247(1000/T)2-10259(1000/T)3+2759(1000/T)4]-8.36
2
Cux
3D visualization of the obtained analytical dependencies is carried out with the help of a computer
program OriginLab2018.
KEYWORDS – Thermodynamic, Modeling, Ag – Pb – Se and Cu – Pb – Se systems.
PACS – 05.70.−a Thermodynamics; 05.70.Ce Thermodynamic functions and equations of state
INTRODUCTION Materials based on lead, silver and copper chalcogenides are of interest for the production of
semiconductor, photovoltaic and thermoelectric elements. [1-3]. To determine the optimal conditions
for the directed synthesis of chalcogenide phases, reliable data on the phase equilibria and
thermodynamic functions of the corresponding systems are necessary [4]. In particular, information for
the liquidus surface of the ternary systems Ag-Pb-Se and Cu-Pb-Se in the form of a 3D model is
necessary to determine the conditions for obtaining PbSe doped with silver and copper by crystallization
of a liquid alloy [5].
The use of a genetic algorithm with Bayesian statistics allows for incorporating uncertain data
sets, both large and small, in an efficient and meaningful way [6,7]. This process then leads to the
optimization of the parameters of proposed models and the assessment of the overall predictive
credibility of said models. In particular, this work determines the degree of uncertainty at the phase
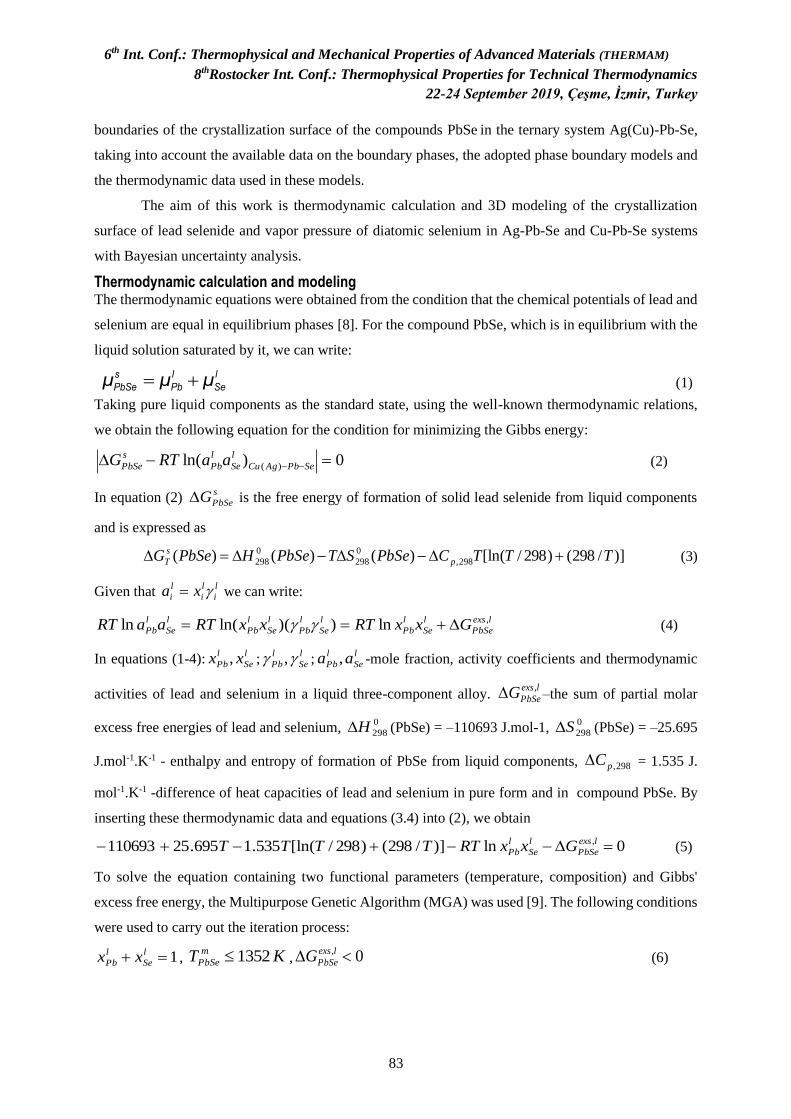
6th Int. Conf.: Thermophysical and Mechanical Properties of Advanced Materials (THERMAM)
8thRostocker Int. Conf.: Thermophysical Properties for Technical Thermodynamics
22-24 September 2019, Çeşme, İzmir, Turkey
83
boundaries of the crystallization surface of the compounds PbSe in the ternary system Ag(Cu)-Pb-Se,
taking into account the available data on the boundary phases, the adopted phase boundary models and
the thermodynamic data used in these models.
The aim of this work is thermodynamic calculation and 3D modeling of the crystallization
surface of lead selenide and vapor pressure of diatomic selenium in Ag-Pb-Se and Cu-Pb-Se systems
with Bayesian uncertainty analysis.
Thermodynamic calculation and modeling The thermodynamic equations were obtained from the condition that the chemical potentials of lead and
selenium are equal in equilibrium phases [8]. For the compound PbSe, which is in equilibrium with the
liquid solution saturated by it, we can write:
= +s l l
PbSe Pb Seμ μ μ (1)
Taking pure liquid components as the standard state, using the well-known thermodynamic relations,
we obtain the following equation for the condition for minimizing the Gibbs energy:
0)ln( )( =− −− SePbAgCu
l
Se
l
Pb
s
PbSe aaRTG (2)
In equation (2) s
PbSeG is the free energy of formation of solid lead selenide from liquid components
and is expressed as
)]/298()298/[ln()()()( 298,
0
298
0
298 TTTCPbSeSTPbSeHPbSeG p
s
T +−−= (3)
Given that l
i
l
i
l
i xa = we can write:
lexs
PbSe
l
Se
l
Pb
l
Se
l
Pb
l
Se
l
Pb
l
Se
l
Pb GxxRTxxRTaaRT ,ln))(ln(ln +== (4)
In equations (1-4):l
Se
l
Pb xx , ;l
Se
l
Pb , ;l
Se
l
Pb aa , -mole fraction, activity coefficients and thermodynamic
activities of lead and selenium in a liquid three-component alloy. lexs
PbSeG , –the sum of partial molar
excess free energies of lead and selenium, 0
298H (PbSe) = –110693 J.mol-1, 0
298S (PbSe) = –25.695
J.mol-1.K-1 - enthalpy and entropy of formation of PbSe from liquid components, 298,pC = 1.535 J.
mol-1.K-1 -difference of heat capacities of lead and selenium in pure form and in compound PbSe. By
inserting these thermodynamic data and equations (3.4) into (2), we obtain
0ln)]/298()298/[ln(535.1695.25110693 , =−−+−+− lexs
PbSe
l
Se
l
Pb GxxRTTTTT
(5)
To solve the equation containing two functional parameters (temperature, composition) and Gibbs'
excess free energy, the Multipurpose Genetic Algorithm (MGA) was used [9]. The following conditions
were used to carry out the iteration process:
1=+ l
Se
l
Pb xx , KT m
PbSe 1352 , 0, lexs
PbSeG (6)
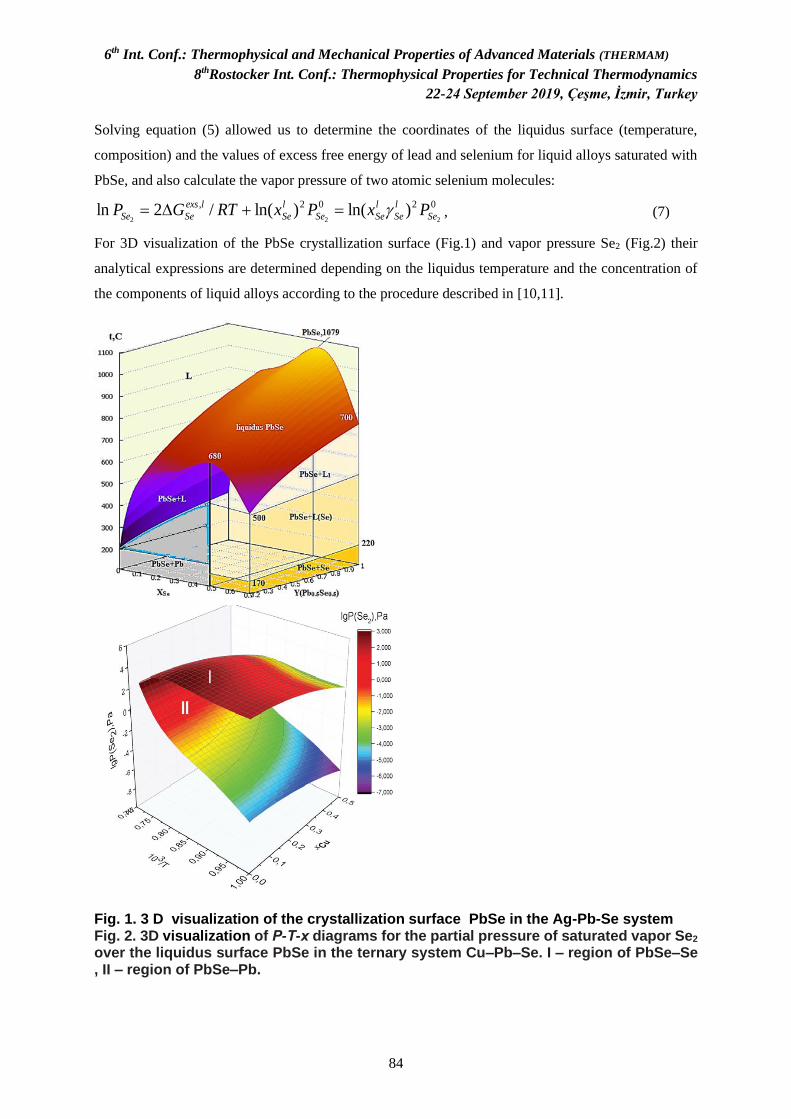
6th Int. Conf.: Thermophysical and Mechanical Properties of Advanced Materials (THERMAM)
8thRostocker Int. Conf.: Thermophysical Properties for Technical Thermodynamics
22-24 September 2019, Çeşme, İzmir, Turkey
84
Solving equation (5) allowed us to determine the coordinates of the liquidus surface (temperature,
composition) and the values of excess free energy of lead and selenium for liquid alloys saturated with
PbSe, and also calculate the vapor pressure of two atomic selenium molecules:
0202,
222)ln()ln(/2ln Se
l
Se
l
SeSe
l
Se
lexs
SeSe PxPxRTGP =+= , (7)
For 3D visualization of the PbSe crystallization surface (Fig.1) and vapor pressure Se2 (Fig.2) their
analytical expressions are determined depending on the liquidus temperature and the concentration of
the components of liquid alloys according to the procedure described in [10,11].
Fig. 1. 3 D visualization of the crystallization surface PbSe in the Ag-Pb-Se system Fig. 2. 3D visualization of Р-Т-х diagrams for the partial pressure of saturated vapor Se2 over the liquidus surface PbSe in the ternary system Cu–Pb–Se. I – region of PbSe–Se , II – region of PbSe–Pb.

6th Int. Conf.: Thermophysical and Mechanical Properties of Advanced Materials (THERMAM)
8thRostocker Int. Conf.: Thermophysical Properties for Technical Thermodynamics
22-24 September 2019, Çeşme, İzmir, Turkey
85
The contour of the frontal part of the graph in fig. 2 represents the lgP – 1/T dependence in the
PbSe liquidus line of the Pb – Se binary system and is in agreement with the experimental data [12],
which indicates the reliability of the used calculation method.
CONCLUSION Using the mathematical apparatus of thermodynamics of heterogeneous equilibria from the
position of fuzzy systems the T-x-y and P(Se2) -T-x diagrams of Cu – Pb – Se and Ag-Pb-Se systems
on the crystallization surface of lead selenide were determined and modeled. The data obtained can be
used to determine the conditions for the synthesis of lead selenide with a certain type of conductivity,
since region I refers to the p-type PbSe semiconductor, mainly with hole conduction, and region II refers
to the n-type PbSe semiconductor with mainly electronic conductivity.
REFERENCES [1] Applications of Chalcogenides: S, Se, and Te. Ed. by Gurinder Kaur Ahluwalia. Springer,
2017, 461 p.
[2] Jin Y., Han M.-K., Kim S.-J. Na-Doping Effects on Thermoelectric Properties of Cu2−xSe
Nanoplates. Appl. Sci.( 2018) vol.8, pp. 12; DOI:10.3390/app8010012.
[3] Wang H., Pei Y., Lalonde A.D., Snyder G.J. Heavily doped p-type PbSe with high
thermoelectric performance: An alternative for PbTe. Advanced Materials, (2011), vol.
23(11), pp. 1366-1370. DOI: 10.1002/adma.201004200.
[4] Babanly M.B., Chulkov E.V., Aliev Z.S., Shevelkov A., Amiraslanov I.R. Phase diagrams
in materials science of topological insulators based on metal chalcogenides. Russian J.
Inorg. Chem. (2017) V. 62. No.13. P. 1703–1730. DOI: 10.1134/S0036023617130034.
[5] Mamedov A.N., Akhmedova N.Ya., Asadov C.M., Babanly N.B., Mamedov E.M.
Thermodynamic analysis and defection formation in Cu-Pb-Se alloys. Chemical Problems
(2019) no.1 (17), p.16-25/ Doi.org/10.32737/2221-8688-2019-1-16-25
[6] Thien C. Duong , Robert E.Hackenberg , Alex Landa et all. Revisiting thermodynamics
and kinetic diffusivities of uranium– niobium with Bayesian uncertainty analysis.
CALPHAD. (2016), 55, 219–230. https://doi.org/10.1016/j.calphad.2016.09.006
[7] Mammadov A.N., Aliev Z.S., Babanly M.B. Study of the Uncertainty Heterogeneous
Phase Equilibria Areas in the Binary YbTe-SnTe System. In: Aliev R., et al. (eds) 13th
Intern. Conf. on Theory and Appl. of Fuzzy Systems. ICAFS 2018. Advances in Intelligent
Systems and Computing, vol 896. Springer, Cham.(2019). https://doi.org/10.1007/978-3-
030-04164-9_107
[8] Stolen, S., Grande, T.: Chemical thermodynamics of materials: macroscopic and
microscopic aspects. John Wiley & Sons, England (2004)
6th Int. Conf.: Thermophysical and Mechanical Properties of Advanced Materials (THERMAM)
8thRostocker Int. Conf.: Thermophysical Properties for Technical Thermodynamics
22-24 September 2019, Çeşme, İzmir, Turkey
86
[9] Preuss, M., Wessing, S., Rudolph, G., Sadowski. G.: Solving phase equilibrium problems
by means of avoidance-based multiobjectivization. in springer handbook of computational
intelligence. Part E.58, Evol. Comput., pp.1159-1169 (2015).
[10] Akhmedova N.Ya., Babanly N.B., Mamedov A.N., Yusibov Yu.Y. Multi-3d modeling of
the liquidus and immiscibility surfaces in the Cu–Pb–Te system. Azerbaijan Chemical
Journal № 1, (2019), p.59-65. https://doi.org/10.32737/0005-2531-2019-1-59-64.
[11] Yusibov Yu.Y., Alverdiev I.Dzh., Mashadiyeva L.F., Mamedov A.N., Tagiev D.B.,
Babanly M.B.. Study and 3D Modeling of the Phase Diagram of the Ag–Sn–Se System.
Russian J. Inorgan. Chemistry. 2018, Vol. 63, No. 12, pp.1622-1635 / DOI:
10.1134/S0036023618120227
[12] Sealy B. J., Crocker A. J. The P-T-x phase diagram of PbTe and PbSe . J. Materials
Science, (1973), № 8, pp. 1737–1747.

6th Int. Conf.: Thermophysical and Mechanical Properties of Advanced Materials (THERMAM)
8thRostocker Int. Conf.: Thermophysical Properties for Technical Thermodynamics
22-24 September 2019, Çeşme, İzmir, Turkey
87
Numerical Investigation and Optimization of Dynamic Cornering Fatigue Behaviour and Natural Frequency of Aluminium Alloy Wheels
M. Işıka*, A. Karaa and O. B. Çea
aR&D Center, CMS Jant ve Makina Sanayi A. S., Izmir, Turkey
*Corresponding author: [email protected]
Keywords: Aluminium alloy wheel, Optimization, Fatigue, Frequency
Abstract: The wheels are the parts which have critical importance on safety they work under static
and dynamic loads in vehicles. Therefore various mechanical analysis are made prior to production
as well as after production validation tests. Some of these tests are; dynamic cornering fatigue test,
resonance test, biaxial fatigue test, radial fatigue test, 13° impact test, 90° impact test, compression
of inner rim test and ZWARP test. All of the aforementioned tests can be performed in CMS
mechanical laboratory. However, in order to perform these tests, the wheel must be manufactured.
To assure cost advantage, finite element analyses are frequently used tools for the design validation
step. Shortening the design validation phase is important for design process efficiency. Within the
scope of the study, optimization studies were carried out which would benefit the shortening of the
design process. The wheels work in combination with many different parts while driving and is
subjected to different periodic road-borne or vehicle-borne loads. Under these combined forces,
wheels might have fatigue cracks after the critical number of cycles. In addition, wheels may
resonate with other parts under operating conditions due to their natural frequency. In order to
prevent the resonance of the parts on the vehicle and to determine the wheel stiffness, natural
frequency analyses are performed. On the other hand, cornering fatigue conditions are analyzed
with Ansys Workbench 19.0 package program in accordance with ISO 3006: 2015 dynamic
cornering fatigue standard. In this study, 12 measurements on the wheel were used as input for the
experimental design and the effects of the parameters on fatigue - frequency analysis were
determined. As a result, optimization studies were carried out in order to minimize weight and
maximize strength by considering the effects of parameters.
Introduction Automobiles are vehicles consisting of many different parts. The key industry and subindustry
manufacturers of automobiles try to produce these parts with the lowest cost, highest efficiency and
the most appropriate safety coefficients where these parameters are suitable. Aluminium alloy
wheels used in passenger cars have functions besides the visuality they add to the vehicles. Wheels
are safety parts with legal obligations and directly related to life and property safety. Other functions
of the wheels are to provide connection between tyre and hubs, outstand the road-borne impact
effects. The changes in the weight, size and design of the wheel significantly affect the performance,
comfort and fuel economy of automobiles [1].
The wheels come into contact with the tires and are safety components located on the vehicle
between the tire and the axle system, operating under different driving and environmental
conditions during their lifetime. Since they are safety components, wheels are expected to meet a
wide range of strength requirements set by international standards, from design to production [2].
Wheels are the parts whose basic dimensions are designed according to the standards. In this way,
it is aimed to minimize the problems related to installation and vehicle compatibility. European
Tyre and Rim Technical Organization and Japan Automobile Tyre Manufacturers Association is
the largest source which include standard wheel dimensions. Some of these dimensions are wheel
diameter, rim width, pitch center diameter, bead seat dimension. Wheels used in passenger cars
have a rim width of 4” to 10” and a wheel diameter of 10” to 22” [3].
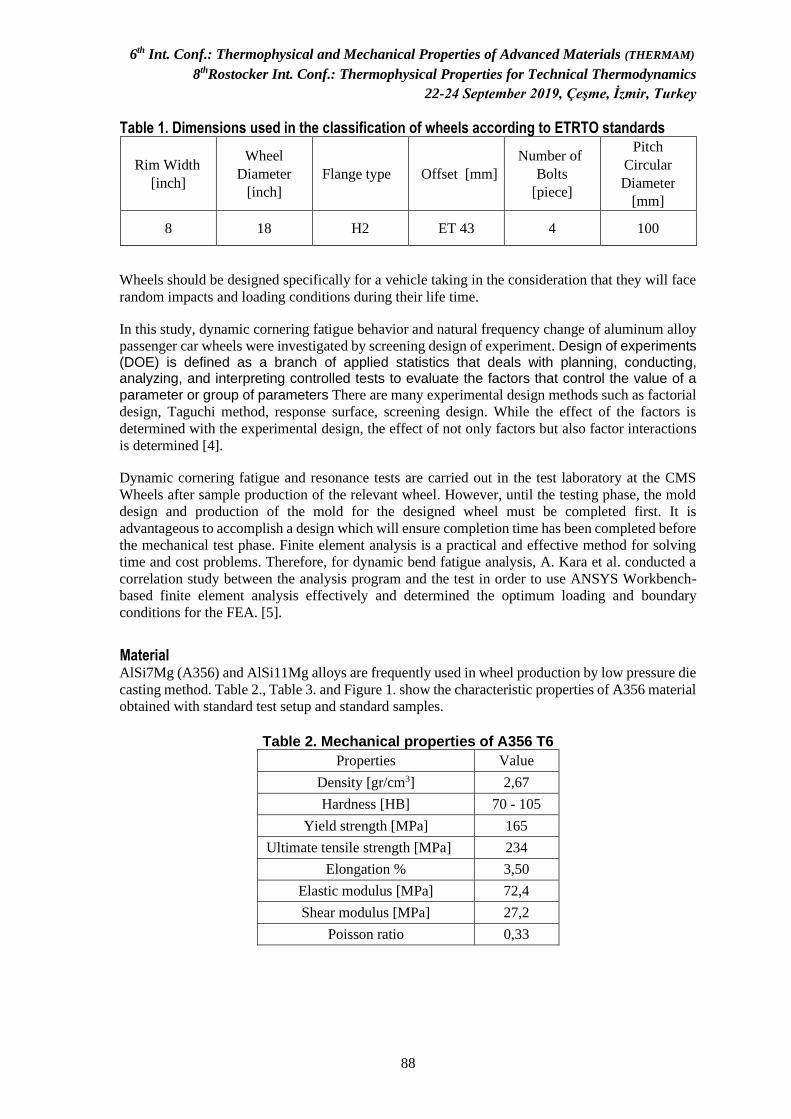
6th Int. Conf.: Thermophysical and Mechanical Properties of Advanced Materials (THERMAM)
8thRostocker Int. Conf.: Thermophysical Properties for Technical Thermodynamics
22-24 September 2019, Çeşme, İzmir, Turkey
88
Table 1. Dimensions used in the classification of wheels according to ETRTO standards
Rim Width
[inch]
Wheel
Diameter
[inch]
Flange type Offset [mm]
Number of
Bolts
[piece]
Pitch
Circular
Diameter
[mm]
8 18 H2 ET 43 4 100
Wheels should be designed specifically for a vehicle taking in the consideration that they will face
random impacts and loading conditions during their life time.
In this study, dynamic cornering fatigue behavior and natural frequency change of aluminum alloy
passenger car wheels were investigated by screening design of experiment. Design of experiments (DOE) is defined as a branch of applied statistics that deals with planning, conducting, analyzing, and interpreting controlled tests to evaluate the factors that control the value of a
parameter or group of parameters There are many experimental design methods such as factorial
design, Taguchi method, response surface, screening design. While the effect of the factors is
determined with the experimental design, the effect of not only factors but also factor interactions
is determined [4].
Dynamic cornering fatigue and resonance tests are carried out in the test laboratory at the CMS
Wheels after sample production of the relevant wheel. However, until the testing phase, the mold
design and production of the mold for the designed wheel must be completed first. It is
advantageous to accomplish a design which will ensure completion time has been completed before
the mechanical test phase. Finite element analysis is a practical and effective method for solving
time and cost problems. Therefore, for dynamic bend fatigue analysis, A. Kara et al. conducted a
correlation study between the analysis program and the test in order to use ANSYS Workbench-
based finite element analysis effectively and determined the optimum loading and boundary
conditions for the FEA. [5].
Material AlSi7Mg (A356) and AlSi11Mg alloys are frequently used in wheel production by low pressure die
casting method. Table 2., Table 3. and Figure 1. show the characteristic properties of A356 material
obtained with standard test setup and standard samples.
Table 2. Mechanical properties of A356 T6
Properties Value
Density [gr/cm3] 2,67
Hardness [HB] 70 - 105
Yield strength [MPa] 165
Ultimate tensile strength [MPa] 234
Elongation % 3,50
Elastic modulus [MPa] 72,4
Shear modulus [MPa] 27,2
Poisson ratio 0,33
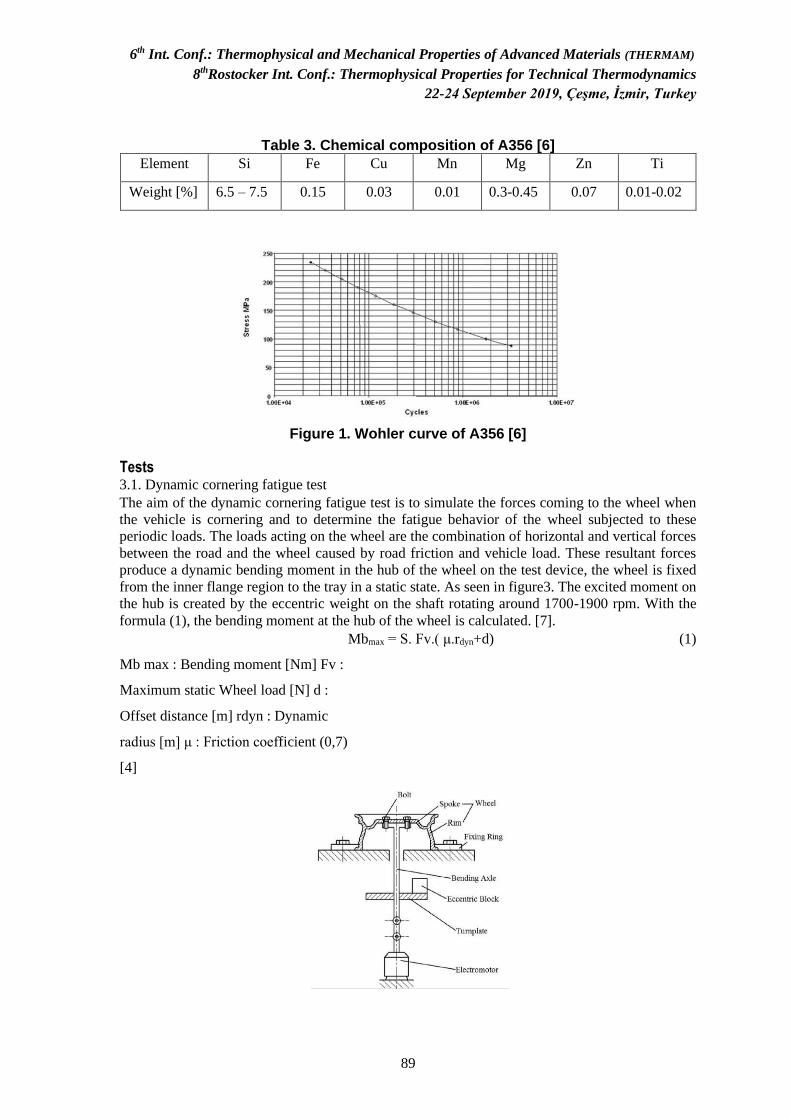
6th Int. Conf.: Thermophysical and Mechanical Properties of Advanced Materials (THERMAM)
8thRostocker Int. Conf.: Thermophysical Properties for Technical Thermodynamics
22-24 September 2019, Çeşme, İzmir, Turkey
89
Table 3. Chemical composition of A356 [6]
Element Si Fe Cu Mn Mg Zn Ti
Weight [%] 6.5 – 7.5 0.15 0.03 0.01 0.3-0.45 0.07 0.01-0.02
Figure 1. Wohler curve of A356 [6]
Tests 3.1. Dynamic cornering fatigue test
The aim of the dynamic cornering fatigue test is to simulate the forces coming to the wheel when
the vehicle is cornering and to determine the fatigue behavior of the wheel subjected to these
periodic loads. The loads acting on the wheel are the combination of horizontal and vertical forces
between the road and the wheel caused by road friction and vehicle load. These resultant forces
produce a dynamic bending moment in the hub of the wheel on the test device, the wheel is fixed
from the inner flange region to the tray in a static state. As seen in figure3. The excited moment on
the hub is created by the eccentric weight on the shaft rotating around 1700-1900 rpm. With the
formula (1), the bending moment at the hub of the wheel is calculated. [7].
Mbmax = S. Fv.( μ.rdyn+d) (1)
Mb max : Bending moment [Nm] Fv :
Maximum static Wheel load [N] d :
Offset distance [m] rdyn : Dynamic
radius [m] μ : Friction coefficient (0,7)
[4]
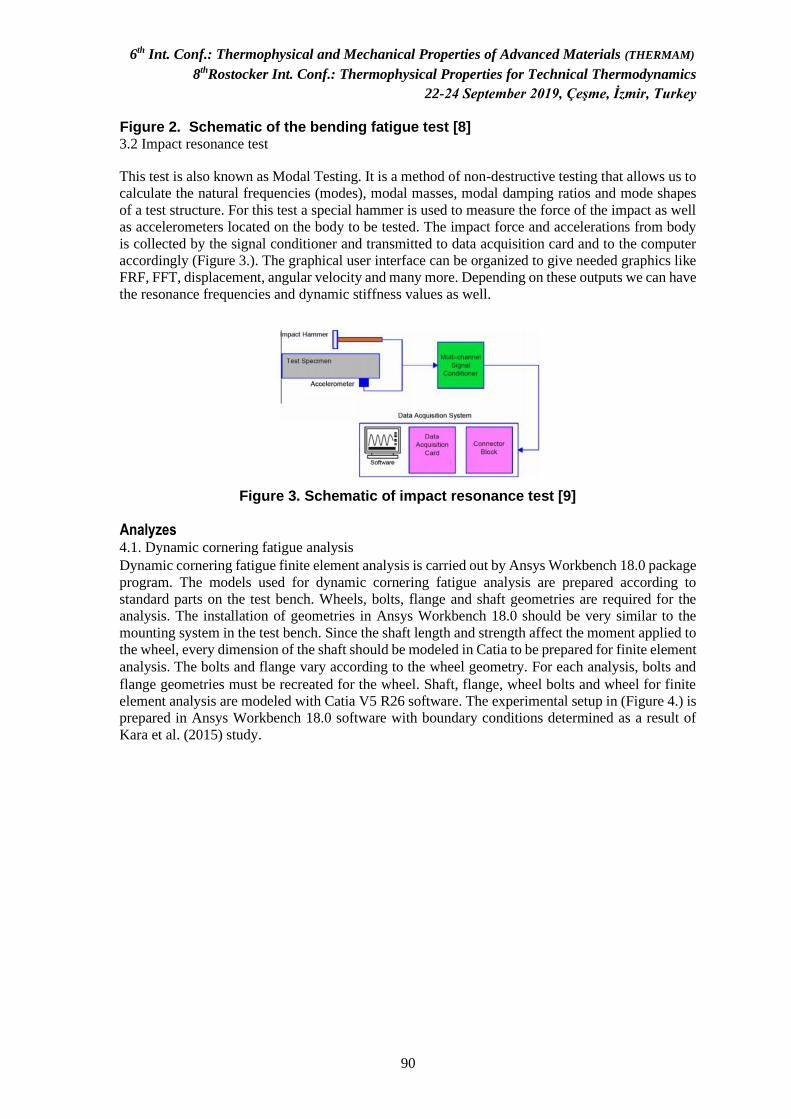
6th Int. Conf.: Thermophysical and Mechanical Properties of Advanced Materials (THERMAM)
8thRostocker Int. Conf.: Thermophysical Properties for Technical Thermodynamics
22-24 September 2019, Çeşme, İzmir, Turkey
90
Figure 2. Schematic of the bending fatigue test [8] 3.2 Impact resonance test
This test is also known as Modal Testing. It is a method of non-destructive testing that allows us to
calculate the natural frequencies (modes), modal masses, modal damping ratios and mode shapes
of a test structure. For this test a special hammer is used to measure the force of the impact as well
as accelerometers located on the body to be tested. The impact force and accelerations from body
is collected by the signal conditioner and transmitted to data acquisition card and to the computer
accordingly (Figure 3.). The graphical user interface can be organized to give needed graphics like
FRF, FFT, displacement, angular velocity and many more. Depending on these outputs we can have
the resonance frequencies and dynamic stiffness values as well.
Figure 3. Schematic of impact resonance test [9]
Analyzes 4.1. Dynamic cornering fatigue analysis
Dynamic cornering fatigue finite element analysis is carried out by Ansys Workbench 18.0 package
program. The models used for dynamic cornering fatigue analysis are prepared according to
standard parts on the test bench. Wheels, bolts, flange and shaft geometries are required for the
analysis. The installation of geometries in Ansys Workbench 18.0 should be very similar to the
mounting system in the test bench. Since the shaft length and strength affect the moment applied to
the wheel, every dimension of the shaft should be modeled in Catia to be prepared for finite element
analysis. The bolts and flange vary according to the wheel geometry. For each analysis, bolts and
flange geometries must be recreated for the wheel. Shaft, flange, wheel bolts and wheel for finite
element analysis are modeled with Catia V5 R26 software. The experimental setup in (Figure 4.) is
prepared in Ansys Workbench 18.0 software with boundary conditions determined as a result of
Kara et al. (2015) study.
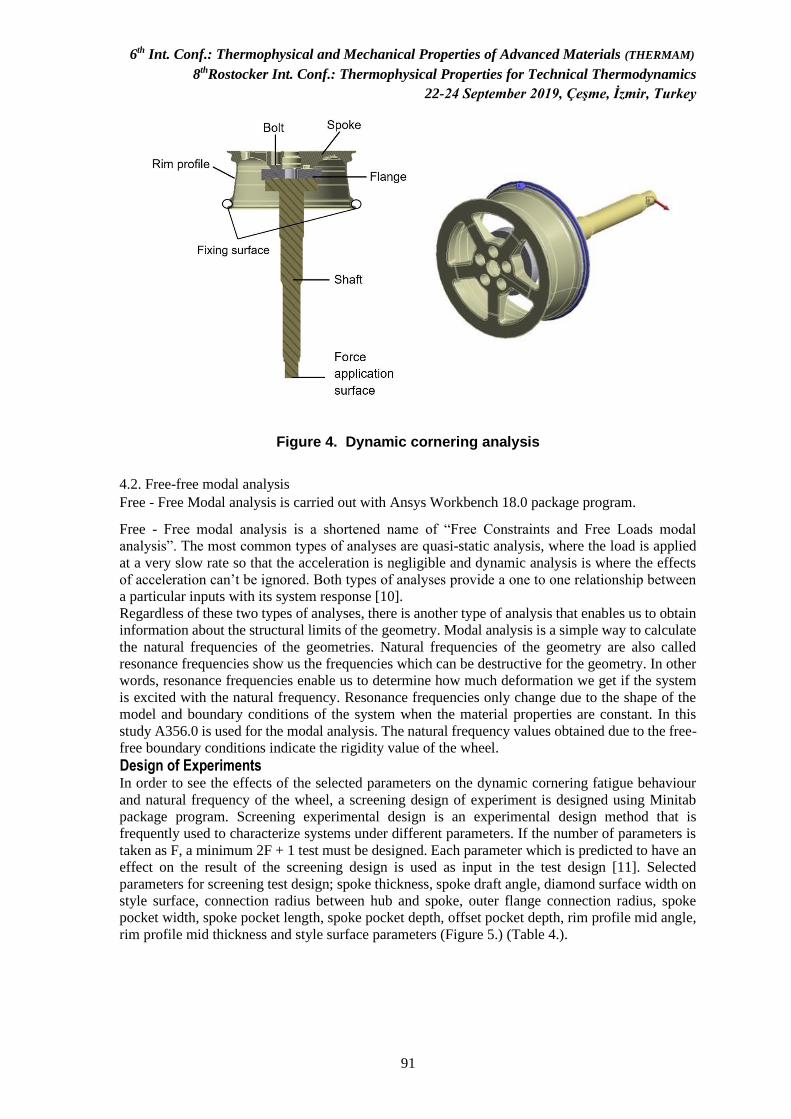
6th Int. Conf.: Thermophysical and Mechanical Properties of Advanced Materials (THERMAM)
8thRostocker Int. Conf.: Thermophysical Properties for Technical Thermodynamics
22-24 September 2019, Çeşme, İzmir, Turkey
91
Figure 4. Dynamic cornering analysis
4.2. Free-free modal analysis
Free - Free Modal analysis is carried out with Ansys Workbench 18.0 package program.
Free - Free modal analysis is a shortened name of “Free Constraints and Free Loads modal
analysis”. The most common types of analyses are quasi-static analysis, where the load is applied
at a very slow rate so that the acceleration is negligible and dynamic analysis is where the effects
of acceleration can’t be ignored. Both types of analyses provide a one to one relationship between
a particular inputs with its system response [10].
Regardless of these two types of analyses, there is another type of analysis that enables us to obtain
information about the structural limits of the geometry. Modal analysis is a simple way to calculate
the natural frequencies of the geometries. Natural frequencies of the geometry are also called
resonance frequencies show us the frequencies which can be destructive for the geometry. In other
words, resonance frequencies enable us to determine how much deformation we get if the system
is excited with the natural frequency. Resonance frequencies only change due to the shape of the
model and boundary conditions of the system when the material properties are constant. In this
study A356.0 is used for the modal analysis. The natural frequency values obtained due to the free-
free boundary conditions indicate the rigidity value of the wheel.
Design of Experiments In order to see the effects of the selected parameters on the dynamic cornering fatigue behaviour
and natural frequency of the wheel, a screening design of experiment is designed using Minitab
package program. Screening experimental design is an experimental design method that is
frequently used to characterize systems under different parameters. If the number of parameters is
taken as F, a minimum 2F + 1 test must be designed. Each parameter which is predicted to have an
effect on the result of the screening design is used as input in the test design [11]. Selected
parameters for screening test design; spoke thickness, spoke draft angle, diamond surface width on
style surface, connection radius between hub and spoke, outer flange connection radius, spoke
pocket width, spoke pocket length, spoke pocket depth, offset pocket depth, rim profile mid angle,
rim profile mid thickness and style surface parameters (Figure 5.) (Table 4.).
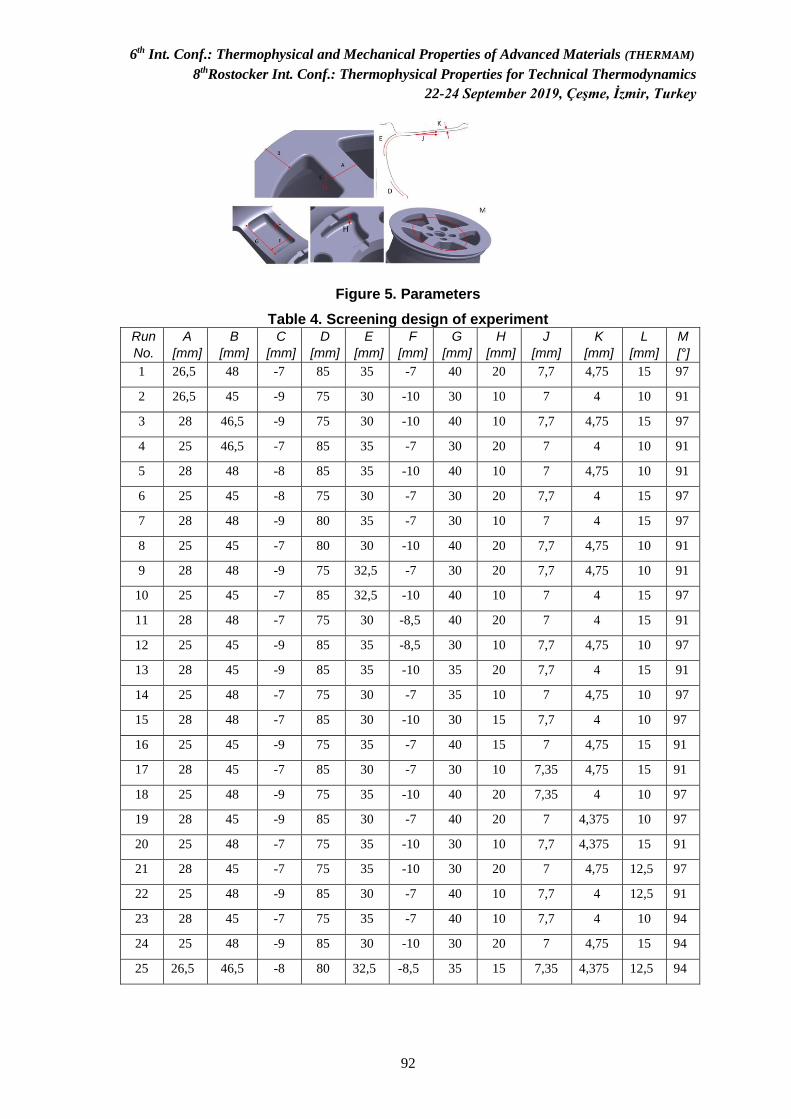
6th Int. Conf.: Thermophysical and Mechanical Properties of Advanced Materials (THERMAM)
8thRostocker Int. Conf.: Thermophysical Properties for Technical Thermodynamics
22-24 September 2019, Çeşme, İzmir, Turkey
92
Figure 5. Parameters
Table 4. Screening design of experiment Run
No. A
[mm] B
[mm] C
[mm] D
[mm] E
[mm] F
[mm] G
[mm] H
[mm] J
[mm] K
[mm] L
[mm] M
[°]
1 26,5 48 -7 85 35 -7 40 20 7,7 4,75 15 97
2 26,5 45 -9 75 30 -10 30 10 7 4 10 91
3 28 46,5 -9 75 30 -10 40 10 7,7 4,75 15 97
4 25 46,5 -7 85 35 -7 30 20 7 4 10 91
5 28 48 -8 85 35 -10 40 10 7 4,75 10 91
6 25 45 -8 75 30 -7 30 20 7,7 4 15 97
7 28 48 -9 80 35 -7 30 10 7 4 15 97
8 25 45 -7 80 30 -10 40 20 7,7 4,75 10 91
9 28 48 -9 75 32,5 -7 30 20 7,7 4,75 10 91
10 25 45 -7 85 32,5 -10 40 10 7 4 15 97
11 28 48 -7 75 30 -8,5 40 20 7 4 15 91
12 25 45 -9 85 35 -8,5 30 10 7,7 4,75 10 97
13 28 45 -9 85 35 -10 35 20 7,7 4 15 91
14 25 48 -7 75 30 -7 35 10 7 4,75 10 97
15 28 48 -7 85 30 -10 30 15 7,7 4 10 97
16 25 45 -9 75 35 -7 40 15 7 4,75 15 91
17 28 45 -7 85 30 -7 30 10 7,35 4,75 15 91
18 25 48 -9 75 35 -10 40 20 7,35 4 10 97
19 28 45 -9 85 30 -7 40 20 7 4,375 10 97
20 25 48 -7 75 35 -10 30 10 7,7 4,375 15 91
21 28 45 -7 75 35 -10 30 20 7 4,75 12,5 97
22 25 48 -9 85 30 -7 40 10 7,7 4 12,5 91
23 28 45 -7 75 35 -7 40 10 7,7 4 10 94
24 25 48 -9 85 30 -10 30 20 7 4,75 15 94
25 26,5 46,5 -8 80 32,5 -8,5 35 15 7,35 4,375 12,5 94
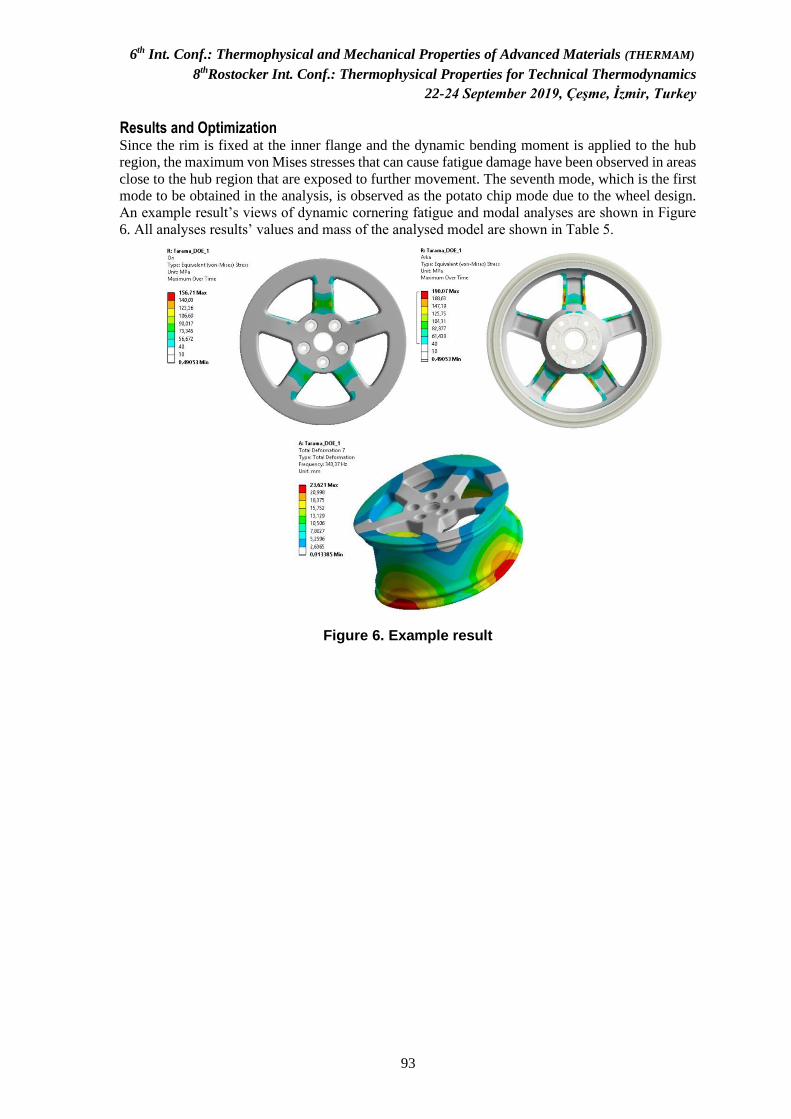
6th Int. Conf.: Thermophysical and Mechanical Properties of Advanced Materials (THERMAM)
8thRostocker Int. Conf.: Thermophysical Properties for Technical Thermodynamics
22-24 September 2019, Çeşme, İzmir, Turkey
93
Results and Optimization Since the rim is fixed at the inner flange and the dynamic bending moment is applied to the hub
region, the maximum von Mises stresses that can cause fatigue damage have been observed in areas
close to the hub region that are exposed to further movement. The seventh mode, which is the first
mode to be obtained in the analysis, is observed as the potato chip mode due to the wheel design.
An example result’s views of dynamic cornering fatigue and modal analyses are shown in Figure
6. All analyses results’ values and mass of the analysed model are shown in Table 5.
Figure 6. Example result
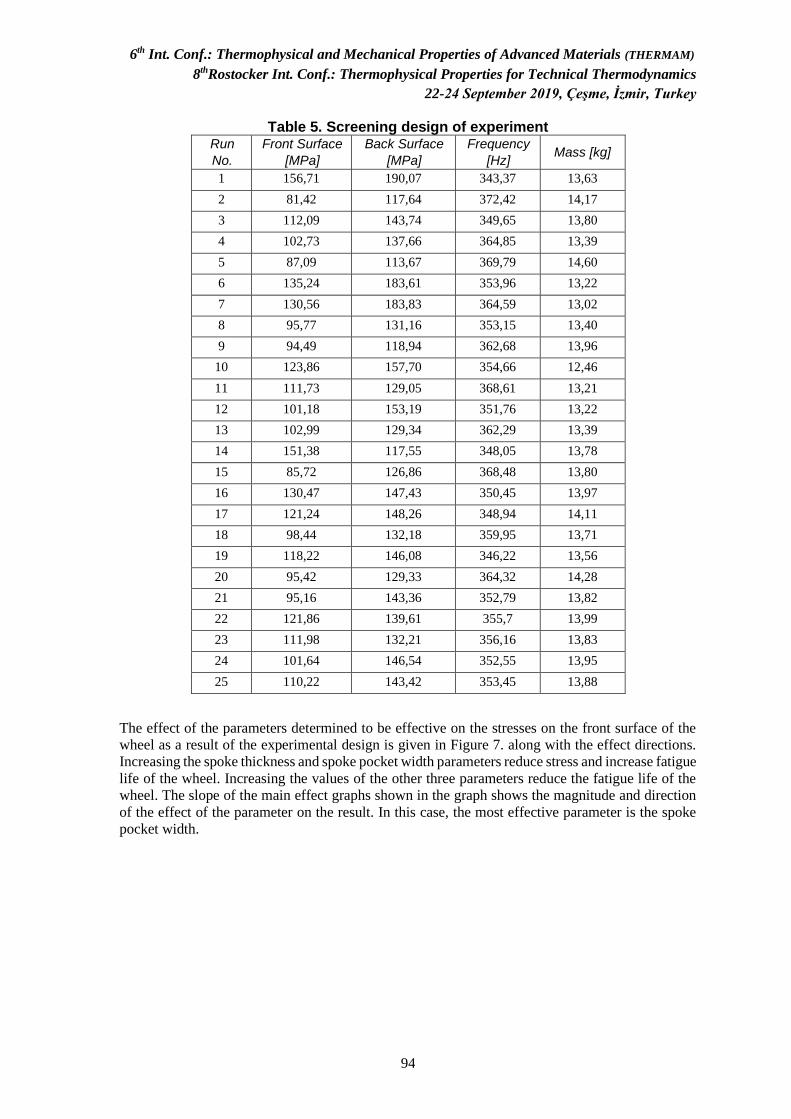
6th Int. Conf.: Thermophysical and Mechanical Properties of Advanced Materials (THERMAM)
8thRostocker Int. Conf.: Thermophysical Properties for Technical Thermodynamics
22-24 September 2019, Çeşme, İzmir, Turkey
94
Table 5. Screening design of experiment Run
No. Front Surface
[MPa] Back Surface
[MPa] Frequency
[Hz] Mass [kg]
1 156,71 190,07 343,37 13,63
2 81,42 117,64 372,42 14,17
3 112,09 143,74 349,65 13,80
4 102,73 137,66 364,85 13,39
5 87,09 113,67 369,79 14,60
6 135,24 183,61 353,96 13,22
7 130,56 183,83 364,59 13,02
8 95,77 131,16 353,15 13,40
9 94,49 118,94 362,68 13,96
10 123,86 157,70 354,66 12,46
11 111,73 129,05 368,61 13,21
12 101,18 153,19 351,76 13,22
13 102,99 129,34 362,29 13,39
14 151,38 117,55 348,05 13,78
15 85,72 126,86 368,48 13,80
16 130,47 147,43 350,45 13,97
17 121,24 148,26 348,94 14,11
18 98,44 132,18 359,95 13,71
19 118,22 146,08 346,22 13,56
20 95,42 129,33 364,32 14,28
21 95,16 143,36 352,79 13,82
22 121,86 139,61 355,7 13,99
23 111,98 132,21 356,16 13,83
24 101,64 146,54 352,55 13,95
25 110,22 143,42 353,45 13,88
The effect of the parameters determined to be effective on the stresses on the front surface of the
wheel as a result of the experimental design is given in Figure 7. along with the effect directions.
Increasing the spoke thickness and spoke pocket width parameters reduce stress and increase fatigue
life of the wheel. Increasing the values of the other three parameters reduce the fatigue life of the
wheel. The slope of the main effect graphs shown in the graph shows the magnitude and direction
of the effect of the parameter on the result. In this case, the most effective parameter is the spoke
pocket width.
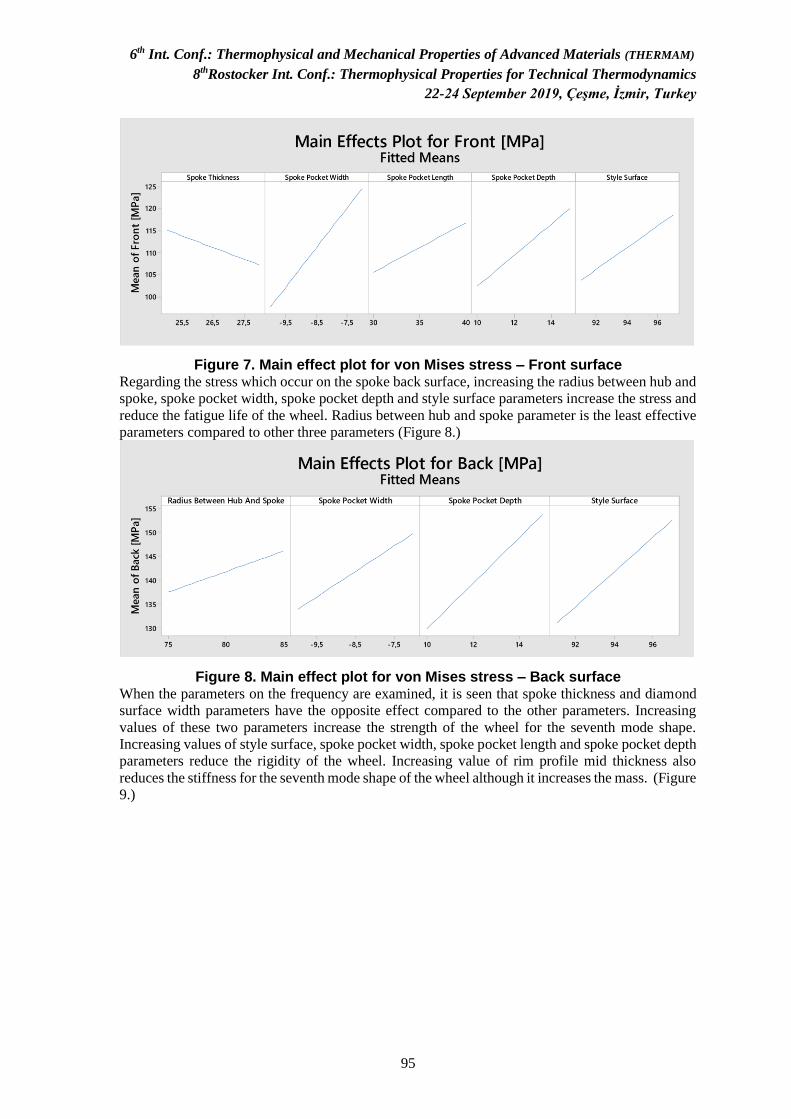
6th Int. Conf.: Thermophysical and Mechanical Properties of Advanced Materials (THERMAM)
8thRostocker Int. Conf.: Thermophysical Properties for Technical Thermodynamics
22-24 September 2019, Çeşme, İzmir, Turkey
95
Figure 7. Main effect plot for von Mises stress – Front surface Regarding the stress which occur on the spoke back surface, increasing the radius between hub and
spoke, spoke pocket width, spoke pocket depth and style surface parameters increase the stress and
reduce the fatigue life of the wheel. Radius between hub and spoke parameter is the least effective
parameters compared to other three parameters (Figure 8.)
Figure 8. Main effect plot for von Mises stress – Back surface When the parameters on the frequency are examined, it is seen that spoke thickness and diamond
surface width parameters have the opposite effect compared to the other parameters. Increasing
values of these two parameters increase the strength of the wheel for the seventh mode shape.
Increasing values of style surface, spoke pocket width, spoke pocket length and spoke pocket depth
parameters reduce the rigidity of the wheel. Increasing value of rim profile mid thickness also
reduces the stiffness for the seventh mode shape of the wheel although it increases the mass. (Figure
9.)
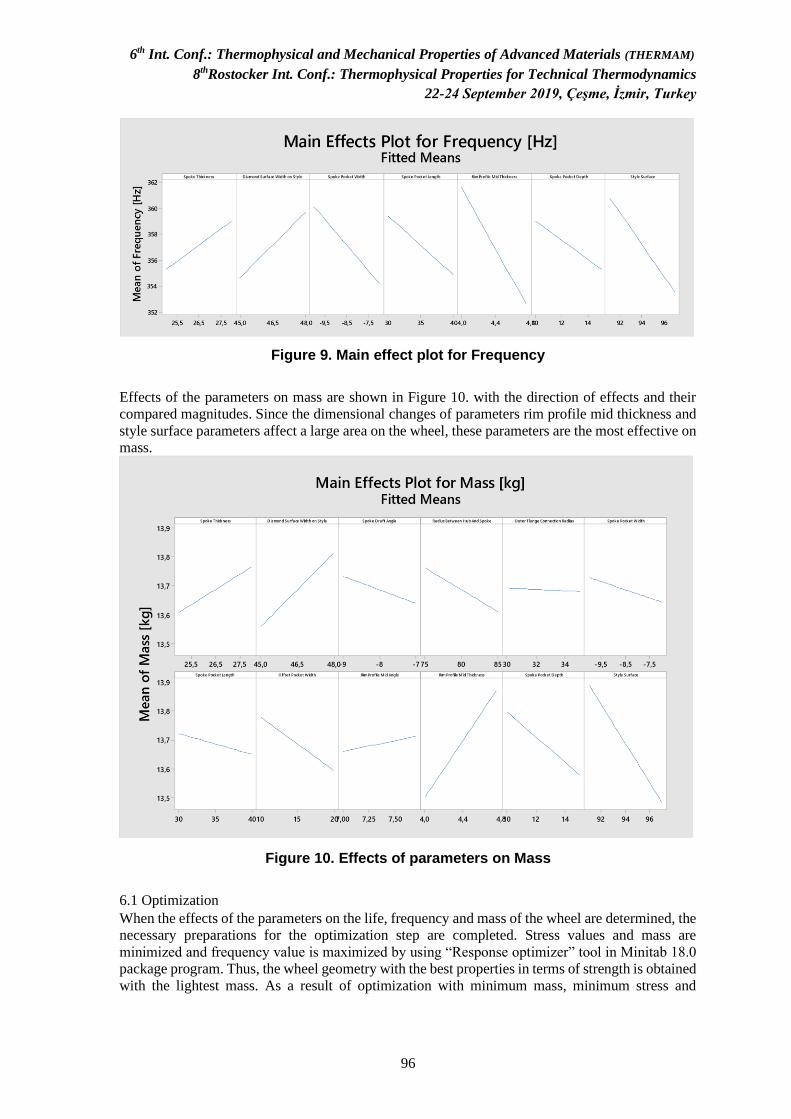
6th Int. Conf.: Thermophysical and Mechanical Properties of Advanced Materials (THERMAM)
8thRostocker Int. Conf.: Thermophysical Properties for Technical Thermodynamics
22-24 September 2019, Çeşme, İzmir, Turkey
96
Figure 9. Main effect plot for Frequency
Effects of the parameters on mass are shown in Figure 10. with the direction of effects and their
compared magnitudes. Since the dimensional changes of parameters rim profile mid thickness and
style surface parameters affect a large area on the wheel, these parameters are the most effective on
mass.
Figure 10. Effects of parameters on Mass
6.1 Optimization
When the effects of the parameters on the life, frequency and mass of the wheel are determined, the
necessary preparations for the optimization step are completed. Stress values and mass are
minimized and frequency value is maximized by using “Response optimizer” tool in Minitab 18.0
package program. Thus, the wheel geometry with the best properties in terms of strength is obtained
with the lightest mass. As a result of optimization with minimum mass, minimum stress and
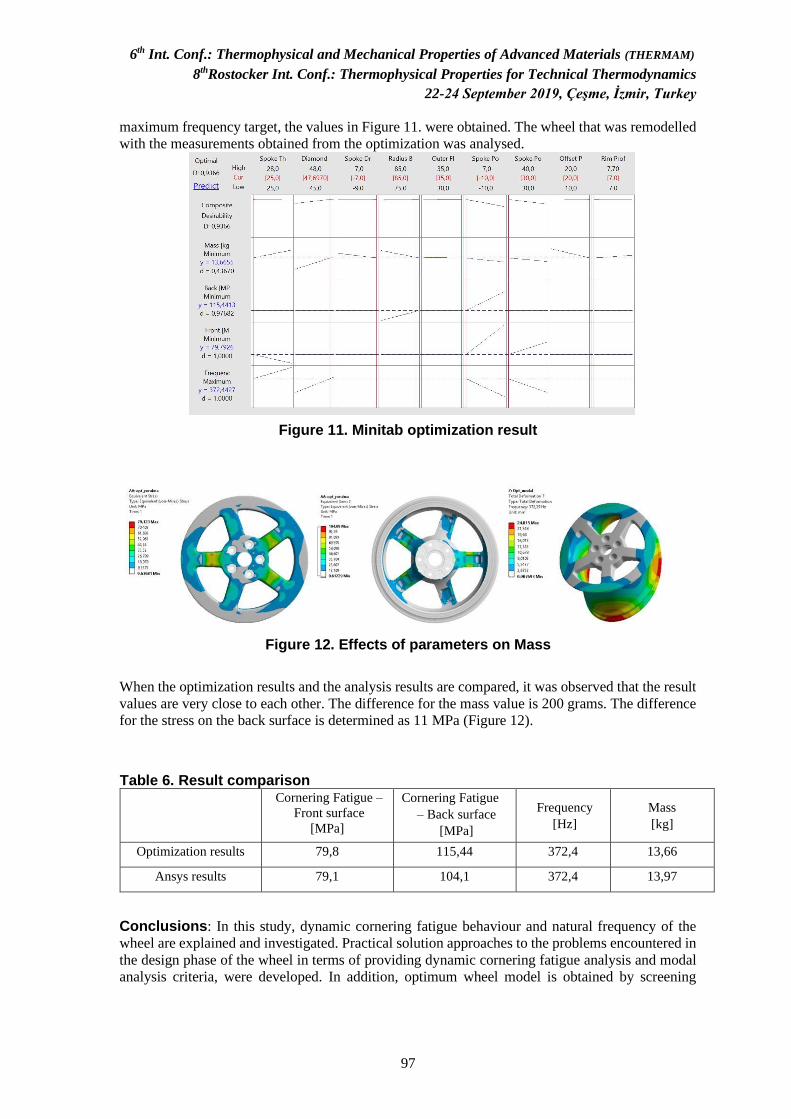
6th Int. Conf.: Thermophysical and Mechanical Properties of Advanced Materials (THERMAM)
8thRostocker Int. Conf.: Thermophysical Properties for Technical Thermodynamics
22-24 September 2019, Çeşme, İzmir, Turkey
97
maximum frequency target, the values in Figure 11. were obtained. The wheel that was remodelled
with the measurements obtained from the optimization was analysed.
Figure 11. Minitab optimization result
Figure 12. Effects of parameters on Mass
When the optimization results and the analysis results are compared, it was observed that the result
values are very close to each other. The difference for the mass value is 200 grams. The difference
for the stress on the back surface is determined as 11 MPa (Figure 12).
Table 6. Result comparison
Cornering Fatigue –
Front surface [MPa]
Cornering Fatigue – Back surface
[MPa]
Frequency
[Hz] Mass [kg]
Optimization results 79,8 115,44 372,4 13,66
Ansys results 79,1 104,1 372,4 13,97
Conclusions: In this study, dynamic cornering fatigue behaviour and natural frequency of the
wheel are explained and investigated. Practical solution approaches to the problems encountered in
the design phase of the wheel in terms of providing dynamic cornering fatigue analysis and modal
analysis criteria, were developed. In addition, optimum wheel model is obtained by screening
6th Int. Conf.: Thermophysical and Mechanical Properties of Advanced Materials (THERMAM)
8thRostocker Int. Conf.: Thermophysical Properties for Technical Thermodynamics
22-24 September 2019, Çeşme, İzmir, Turkey
98
design of experiment with the minimum stress, minimum mass and maximum natural frequency
goals.
References:
1. Tarkun, D. AlSi7Mg T6, AlSi7Mg ve AlSi11Mg, Alaşımlarının Binek Araç Jant
Malzemesi Olarak Kullanılabilirliklerinin Araştırılması, Istanbul Technical University,
Department of Mechanical Engineering, Materials and Manufacturing Program, Master's
Degree, 2015.
2. Akdoğan Y. M., Esener, E. Ercan, S., Fırat, M. Disk Tipi Bir Jantın Köşe Yorulma Davranışının
Sonlu Elemanlar Analizi İle İncelenmesi, 7th International Automotive Technologies
Congress 26 - 27 May 2014, Bursa.
3. Ercan. S. Ticari Araçlarda Kullanılan Jantlarda Dinamik İşletim Yükü Altında Oluşan
Yorulma Ömrünün Bilgisayar Destekli Belirlenmesi, Dokuz Eylul University,
Department of Construction and Manufacturing, Master’s Degree. 2015.
4. Erdem, V., Belevi, M., Koçhan, C. Taguchi metodu ile plastik enjeksiyon parçalarda
çarpılmanın en aza indirilmesi, Dokuz Eylul University, Department of Mechanical
Engineering, Journal of Science and Engineering, 29 May 2010.
5. Kara, A., Çubuklusu, E. Aybarç, U., Topçuoğlu, Ö. Y., Çe, Ö. B., Kalender, C.,
Alüminyum Alaşımlı Jantlarda Dinamik Yorulma Benzetimleri, 1st International Congress On Engineering, Architecture And Design, 13 - 14 November 2015, Kocaeli, pp 15-23.
6. Raju, P., R., Satyanarayana, B., Ramji, K., Babu, K., S. Evaluation of fatigue life of
aluminium alloy wheels under bending loads. Fatigue & fracture of engineering materials
& structures 32(6), pp 119-126, 2009.
7. Kocabıçak, Ü., Fırat,M. Jantların Virajda Yorulma Testlerinin Sayısal Analizi, Makine
Tasarım ve İmalat Dergisi, 450, pp. 25-37, 2000.
8. Chai, W., Liu, X., Shan, Y., Wan, X., & Jiang, E. Research on simulation of the bending
fatigue test of automotive wheel made of long glass fiber reinforced thermoplastic
considering anisotropic property. Advances in Engineering Software, 116, 1-8, 2018.
9. Afroughsabet, V., Biolzi, L., & Ozbakkaloglu, T. High-performance fiber-reinforced
concrete: a review. Journal of Materials Science, 51(14), 6517-6551, 2016.
10. Abd, E., A., Gohary, M. A., & El-Gamal, H. A. Modal analysis on tire with respect to
different parameters. Alexandria Engineering Journal, 56(4), 345-357, 2017.
11. Mohamed, O., A., Masood, H., S., Bhowmik, L., J. Experimental investigation of creep
deformation of part processed by fused deposition modeling using definitive screening
design, Additive Manufacturing (18) 164–170, 2017.
6th Int. Conf.: Thermophysical and Mechanical Properties of Advanced Materials (THERMAM)
8thRostocker Int. Conf.: Thermophysical Properties for Technical Thermodynamics
22-24 September 2019, Çeşme, İzmir, Turkey
99
Simulation and Design Optimization of Al Alloy Wheels Subjected to Biaxial Fatigue Loading
A. Kara1, M. Işık1
1CMS Jant ve Makina Sanayi A. Ş.
*Corresponding author: [email protected]
Keywords: Aluminum alloy wheel, biaxial fatigue loading, simulation, optimization
Abstract: As a responsible element to transfer road loads to the suspension system, passenger car
wheels are subjected to time-varying load history affected by road conditions, and even by the tire
used. Due to increase in use of aluminum alloy wheels in passenger cars, validation of performance
of wheels for this type of loading became very important. In addition to constant amplitude fatigue
requirements such as dynamic cornering or radial fatigue tests, flat track roll rig test or ZWARP
(Biaxial Fatigue Test) test can be used to identify the durability of wheels under time varying load
histories. Therefore, this study aimed to investigate the simulation and design optimization of Al
alloy wheels under biaxial fatigue loading. LBF.WheelStrength simulation software was used
coupled with ANSYS WB. Statistical design optimization using Design of Computational
Experiments was conducted to obtain the optimum spoke cavity geometry for wheels by using
Minitab 18.0 statistical software with objectives of stress and weight minimization.
Introduction Aluminum alloy wheels are the most widely used car wheel type since decades. The most
commonly used manufacturing method for aluminum alloy wheels is die casting by using Low
Pressure Die Casting Method. Generally A356 (AlSi7Mg) alloy was used and T6 heat treatment
was applied due to its ability to be artificially aged. In the validation of performance of passenger
car wheels various service or extreme conditions were taken into account and proofing tests were
standardized since decades. Generally impact performance of wheels were tested by 90° or 13°
impact tests, modal analysis is used to measure their dynamic behavior, various static or dynamic
methods were used to measure rigidity of wheels, and fatigue tests such as dynamic cornering
fatigue, radial fatigue, flat track roll rig, and ZWARP tests were conducted on wheels. In the
literature there are numerous studies on related proofing tests and some summarized below.
13° impact test on aluminum alloy wheels was investigated by comparing their experimental results
and numerical results and used their finite element total plastic work as an indicator to predict wheel
fracture [1]. In another study, researchers investigated the radial fatigue behavior of an alloy wheel
[2]. Their approach is based on the calibration of an S-N curve comparing the experimental and
numerical results obtained through the course of their study and reported a suitable safety factor by
conducting parametric studies. Dynamic cornering fatigue behavior of a passenger car wheel was
investigated and damage accumulation was taken into account by using Palmgren-Miner rule and
developed an analysis program called “Metal Fatigue Prediction and Analysis – MFPA” [3].
Dynamic cornering fatigue behavior of wheels was also investigated and its response was optimized
with a co-objective of mass minimization [4]. In their study, main objectives were to decrease mass
and stress applied as a result of cornering fatigue loading.
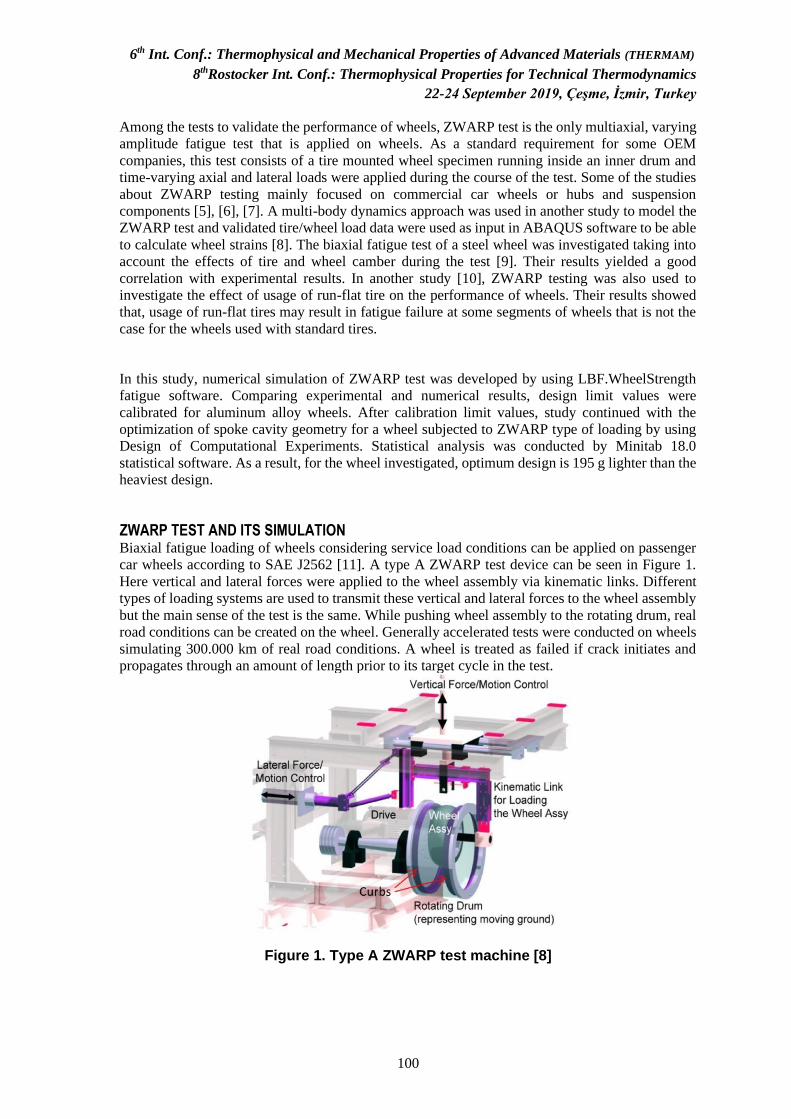
6th Int. Conf.: Thermophysical and Mechanical Properties of Advanced Materials (THERMAM)
8thRostocker Int. Conf.: Thermophysical Properties for Technical Thermodynamics
22-24 September 2019, Çeşme, İzmir, Turkey
100
Among the tests to validate the performance of wheels, ZWARP test is the only multiaxial, varying
amplitude fatigue test that is applied on wheels. As a standard requirement for some OEM
companies, this test consists of a tire mounted wheel specimen running inside an inner drum and
time-varying axial and lateral loads were applied during the course of the test. Some of the studies
about ZWARP testing mainly focused on commercial car wheels or hubs and suspension
components [5], [6], [7]. A multi-body dynamics approach was used in another study to model the
ZWARP test and validated tire/wheel load data were used as input in ABAQUS software to be able
to calculate wheel strains [8]. The biaxial fatigue test of a steel wheel was investigated taking into
account the effects of tire and wheel camber during the test [9]. Their results yielded a good
correlation with experimental results. In another study [10], ZWARP testing was also used to
investigate the effect of usage of run-flat tire on the performance of wheels. Their results showed
that, usage of run-flat tires may result in fatigue failure at some segments of wheels that is not the
case for the wheels used with standard tires.
In this study, numerical simulation of ZWARP test was developed by using LBF.WheelStrength
fatigue software. Comparing experimental and numerical results, design limit values were
calibrated for aluminum alloy wheels. After calibration limit values, study continued with the
optimization of spoke cavity geometry for a wheel subjected to ZWARP type of loading by using
Design of Computational Experiments. Statistical analysis was conducted by Minitab 18.0
statistical software. As a result, for the wheel investigated, optimum design is 195 g lighter than the
heaviest design.
ZWARP TEST AND ITS SIMULATION Biaxial fatigue loading of wheels considering service load conditions can be applied on passenger
car wheels according to SAE J2562 [11]. A type A ZWARP test device can be seen in Figure 1.
Here vertical and lateral forces were applied to the wheel assembly via kinematic links. Different
types of loading systems are used to transmit these vertical and lateral forces to the wheel assembly
but the main sense of the test is the same. While pushing wheel assembly to the rotating drum, real
road conditions can be created on the wheel. Generally accelerated tests were conducted on wheels
simulating 300.000 km of real road conditions. A wheel is treated as failed if crack initiates and
propagates through an amount of length prior to its target cycle in the test.
Figure 1. Type A ZWARP test machine [8]
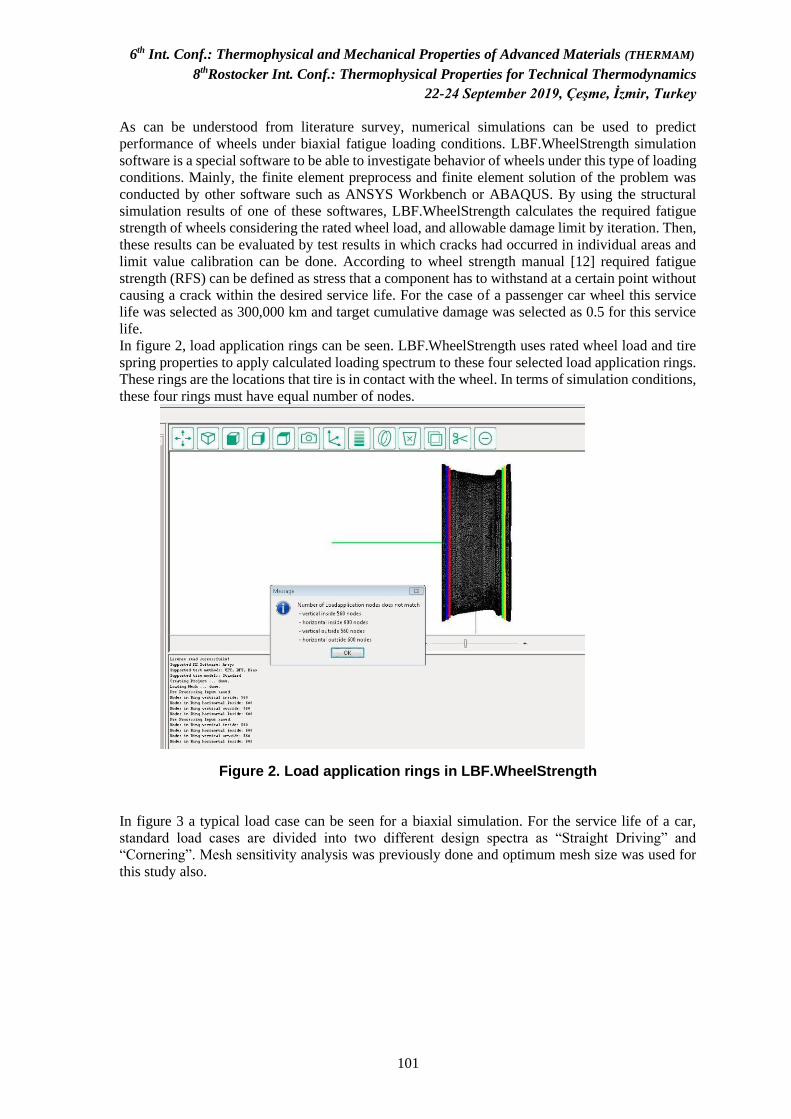
6th Int. Conf.: Thermophysical and Mechanical Properties of Advanced Materials (THERMAM)
8thRostocker Int. Conf.: Thermophysical Properties for Technical Thermodynamics
22-24 September 2019, Çeşme, İzmir, Turkey
101
As can be understood from literature survey, numerical simulations can be used to predict
performance of wheels under biaxial fatigue loading conditions. LBF.WheelStrength simulation
software is a special software to be able to investigate behavior of wheels under this type of loading
conditions. Mainly, the finite element preprocess and finite element solution of the problem was
conducted by other software such as ANSYS Workbench or ABAQUS. By using the structural
simulation results of one of these softwares, LBF.WheelStrength calculates the required fatigue
strength of wheels considering the rated wheel load, and allowable damage limit by iteration. Then,
these results can be evaluated by test results in which cracks had occurred in individual areas and
limit value calibration can be done. According to wheel strength manual [12] required fatigue
strength (RFS) can be defined as stress that a component has to withstand at a certain point without
causing a crack within the desired service life. For the case of a passenger car wheel this service
life was selected as 300,000 km and target cumulative damage was selected as 0.5 for this service
life.
In figure 2, load application rings can be seen. LBF.WheelStrength uses rated wheel load and tire
spring properties to apply calculated loading spectrum to these four selected load application rings.
These rings are the locations that tire is in contact with the wheel. In terms of simulation conditions,
these four rings must have equal number of nodes.
Figure 2. Load application rings in LBF.WheelStrength
In figure 3 a typical load case can be seen for a biaxial simulation. For the service life of a car,
standard load cases are divided into two different design spectra as “Straight Driving” and
“Cornering”. Mesh sensitivity analysis was previously done and optimum mesh size was used for
this study also.
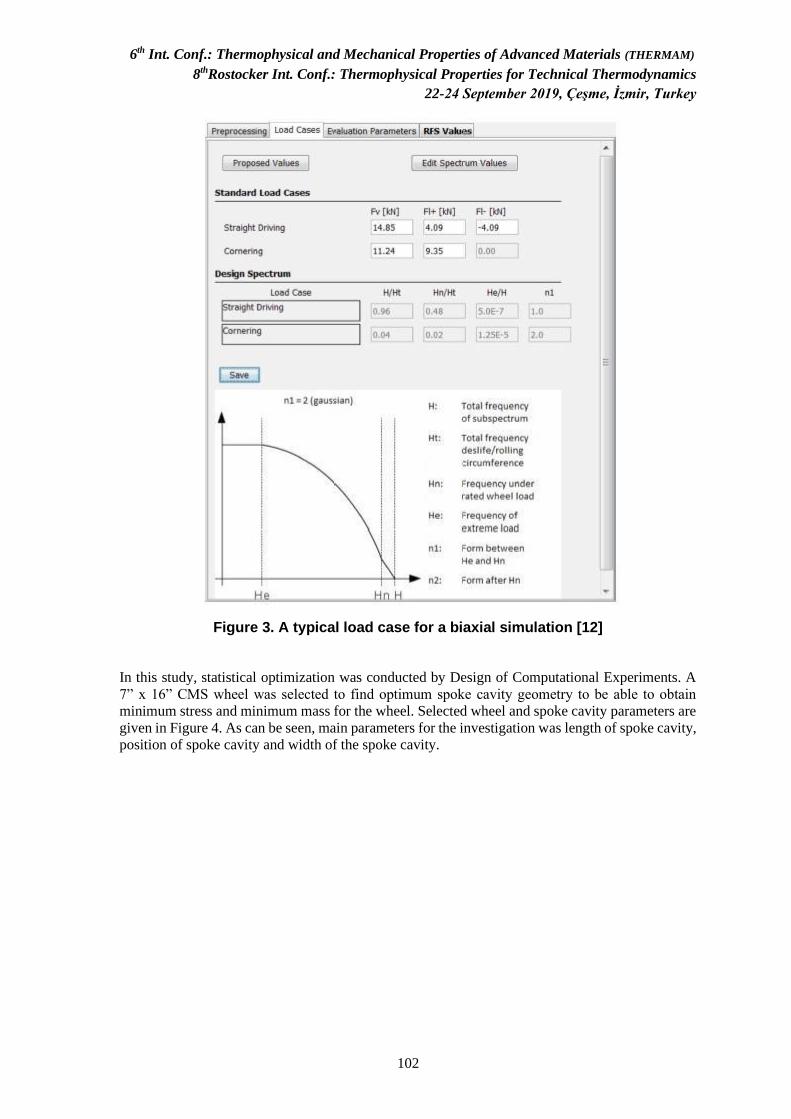
6th Int. Conf.: Thermophysical and Mechanical Properties of Advanced Materials (THERMAM)
8thRostocker Int. Conf.: Thermophysical Properties for Technical Thermodynamics
22-24 September 2019, Çeşme, İzmir, Turkey
102
Figure 3. A typical load case for a biaxial simulation [12]
In this study, statistical optimization was conducted by Design of Computational Experiments. A
7” x 16” CMS wheel was selected to find optimum spoke cavity geometry to be able to obtain
minimum stress and minimum mass for the wheel. Selected wheel and spoke cavity parameters are
given in Figure 4. As can be seen, main parameters for the investigation was length of spoke cavity,
position of spoke cavity and width of the spoke cavity.
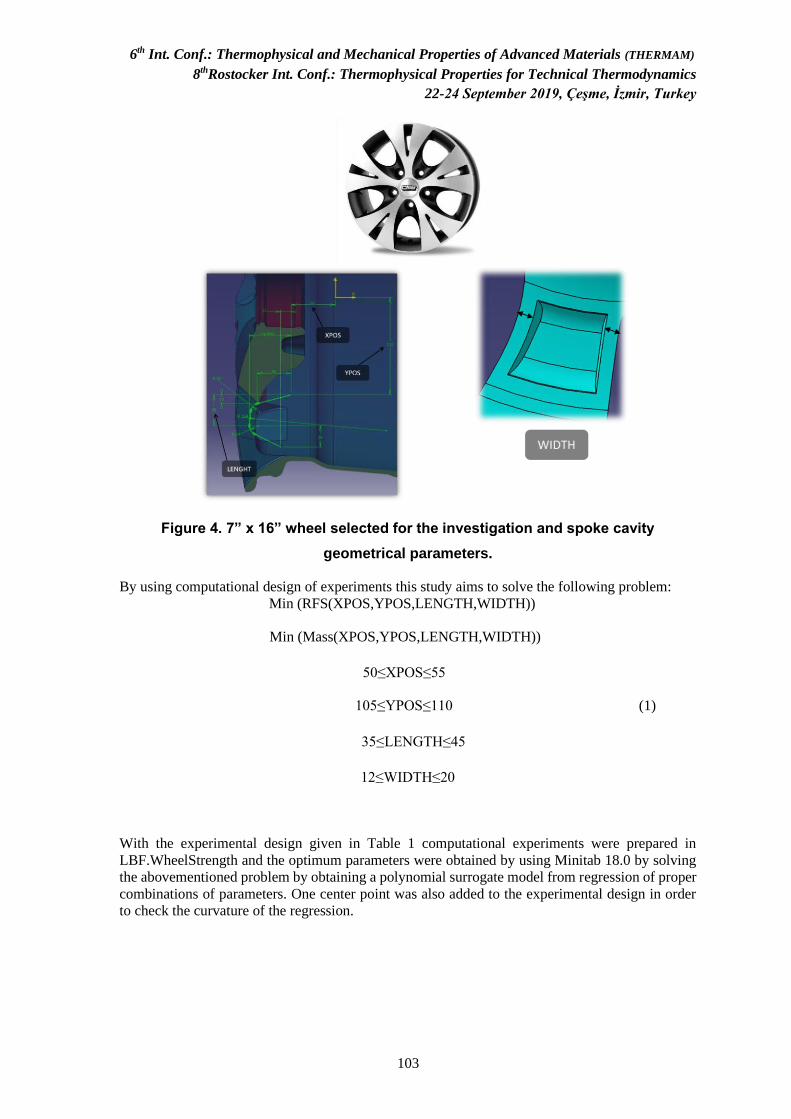
6th Int. Conf.: Thermophysical and Mechanical Properties of Advanced Materials (THERMAM)
8thRostocker Int. Conf.: Thermophysical Properties for Technical Thermodynamics
22-24 September 2019, Çeşme, İzmir, Turkey
103
Figure 4. 7” x 16” wheel selected for the investigation and spoke cavity
geometrical parameters.
By using computational design of experiments this study aims to solve the following problem:
Min (RFS(XPOS,YPOS,LENGTH,WIDTH))
Min (Mass(XPOS,YPOS,LENGTH,WIDTH))
50≤XPOS≤55
105≤YPOS≤110 (1)
35≤LENGTH≤45
12≤WIDTH≤20
With the experimental design given in Table 1 computational experiments were prepared in
LBF.WheelStrength and the optimum parameters were obtained by using Minitab 18.0 by solving
the abovementioned problem by obtaining a polynomial surrogate model from regression of proper
combinations of parameters. One center point was also added to the experimental design in order
to check the curvature of the regression.
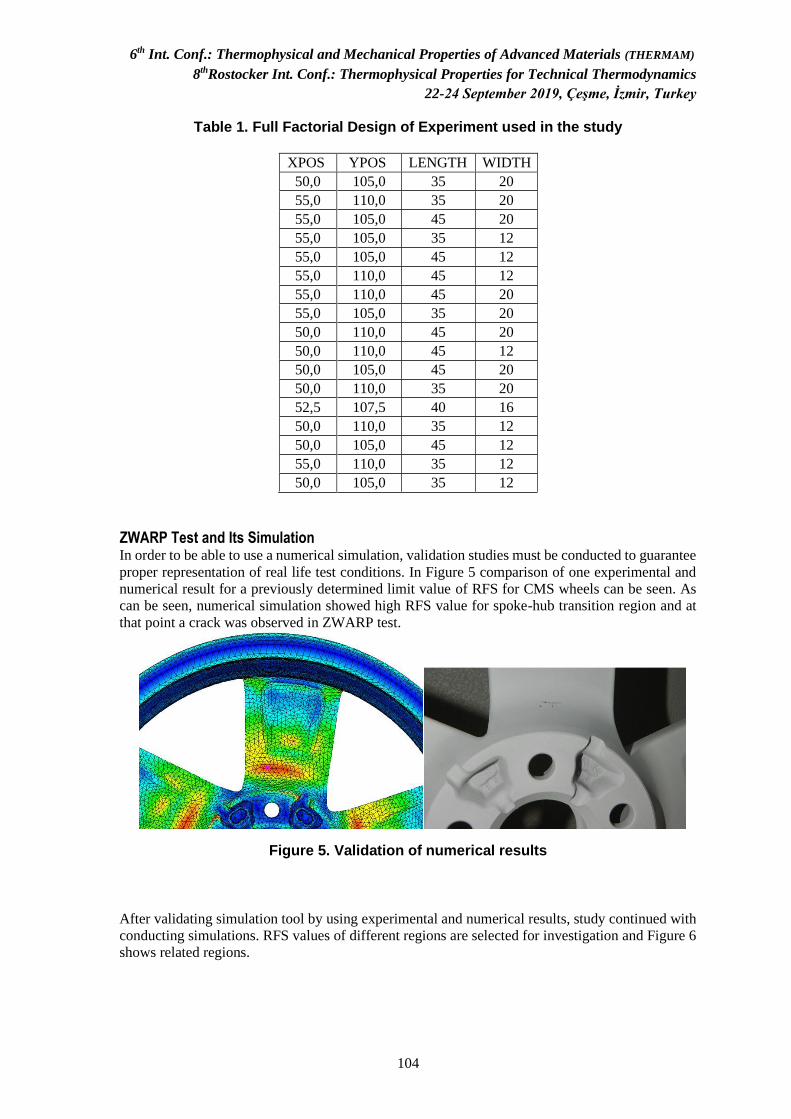
6th Int. Conf.: Thermophysical and Mechanical Properties of Advanced Materials (THERMAM)
8thRostocker Int. Conf.: Thermophysical Properties for Technical Thermodynamics
22-24 September 2019, Çeşme, İzmir, Turkey
104
Table 1. Full Factorial Design of Experiment used in the study
XPOS YPOS LENGTH WIDTH
50,0 105,0 35 20
55,0 110,0 35 20
55,0 105,0 45 20
55,0 105,0 35 12
55,0 105,0 45 12
55,0 110,0 45 12
55,0 110,0 45 20
55,0 105,0 35 20
50,0 110,0 45 20
50,0 110,0 45 12
50,0 105,0 45 20
50,0 110,0 35 20
52,5 107,5 40 16
50,0 110,0 35 12
50,0 105,0 45 12
55,0 110,0 35 12
50,0 105,0 35 12
ZWARP Test and Its Simulation In order to be able to use a numerical simulation, validation studies must be conducted to guarantee
proper representation of real life test conditions. In Figure 5 comparison of one experimental and
numerical result for a previously determined limit value of RFS for CMS wheels can be seen. As
can be seen, numerical simulation showed high RFS value for spoke-hub transition region and at
that point a crack was observed in ZWARP test.
Figure 5. Validation of numerical results
After validating simulation tool by using experimental and numerical results, study continued with
conducting simulations. RFS values of different regions are selected for investigation and Figure 6
shows related regions.

6th Int. Conf.: Thermophysical and Mechanical Properties of Advanced Materials (THERMAM)
8thRostocker Int. Conf.: Thermophysical Properties for Technical Thermodynamics
22-24 September 2019, Çeşme, İzmir, Turkey
105
Figure 6. Solution investigation regions for RFS values.
These four investigation regions were selected based on the know-how that these points can be
critical for wheels subjected to this type of loading. Therefore optimization problem becomes a
problem with 4 objectives to minimize. For the sake of convenience, all stress values calculated
were normalized with their own maximum value. Results can be seen in Table 2 below.
Table 2. Results of computational experiments.
XPOS YPOS LENGTH WIDTH Mass
(kg)
Spoke
Cavity Window Style
50,0 105,0 35 20 11.164 0.653 0.747 0.963
55,0 110,0 35 20 11.066 0.695 0.769 0.944
55,0 105,0 45 20 10.988 0.737 0.813 0.981
55,0 105,0 35 12 10.973 1.000 1.000 1.000
55,0 105,0 45 12 10.868 1.000 0.989 1.000
55,0 110,0 45 12 10.863 0.947 0.934 0.944
55,0 110,0 45 20 10.977 0.705 0.780 0.944
55,0 105,0 35 20 11.068 0.737 0.824 0.963
50,0 110,0 45 20 11.120 0.600 0.692 0.944
50,0 110,0 45 12 11.059 0.726 0.747 0.944
50,0 105,0 45 20 11.119 0.653 0.758 0.981
50,0 110,0 35 20 11.170 0.600 0.692 0.926
52,5 107,5 40 16 11.048 0.768 0.835 0.944
50,0 110,0 35 12 11.124 0.726 0.747 0.907
50,0 105,0 45 12 11.054 0.811 0.846 0.963
55,0 110,0 35 12 10.977 0.926 0.912 0.907
50,0 105,0 35 12 11.112 0.789 0.857 0.963
Results given in Table 2 was then used to investigate the effects of input parameters on objectives.
In Figure 7 pareto charts for mass and normalized stresses are given.

6th Int. Conf.: Thermophysical and Mechanical Properties of Advanced Materials (THERMAM)
8thRostocker Int. Conf.: Thermophysical Properties for Technical Thermodynamics
22-24 September 2019, Çeşme, İzmir, Turkey
106
Figure 7. Pareto charts of standardized effects of
Figure 7 shows that effects of different parameters on objective functions differs with respect to
stress calculation regions. These data were then used to build polynomial regression equations. In
this step, backward elimination was used without hierarchy requirement. By using these regression
equations, optimum parameters were then determined. Results can be seen in response optimization
plot given in Figure 8. In Figure 8 optimum values for different objectives can be seen. By using
optimum combination of input parameters, a 192 g lighter wheel with up to 30% lower stress at
spoke cavity region can be achieved. In the style region combinations of selected parameters yielded
close result then only 6% lower stress was achieved.
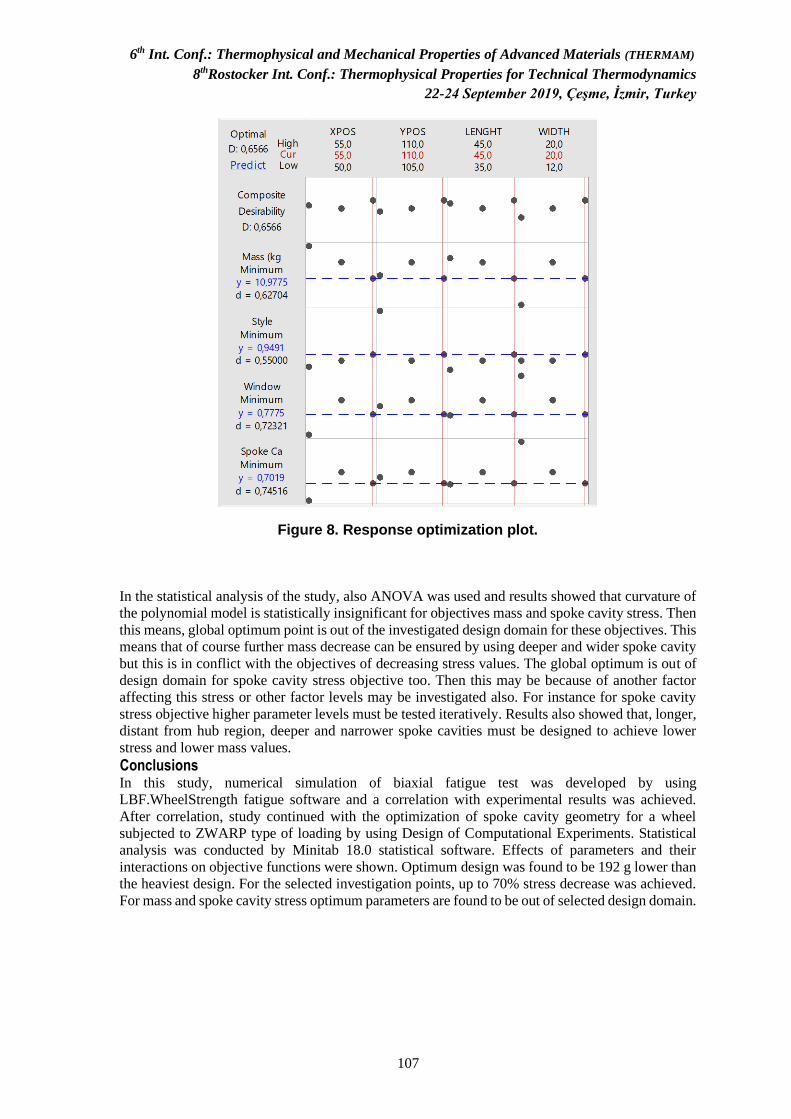
6th Int. Conf.: Thermophysical and Mechanical Properties of Advanced Materials (THERMAM)
8thRostocker Int. Conf.: Thermophysical Properties for Technical Thermodynamics
22-24 September 2019, Çeşme, İzmir, Turkey
107
Figure 8. Response optimization plot.
In the statistical analysis of the study, also ANOVA was used and results showed that curvature of
the polynomial model is statistically insignificant for objectives mass and spoke cavity stress. Then
this means, global optimum point is out of the investigated design domain for these objectives. This
means that of course further mass decrease can be ensured by using deeper and wider spoke cavity
but this is in conflict with the objectives of decreasing stress values. The global optimum is out of
design domain for spoke cavity stress objective too. Then this may be because of another factor
affecting this stress or other factor levels may be investigated also. For instance for spoke cavity
stress objective higher parameter levels must be tested iteratively. Results also showed that, longer,
distant from hub region, deeper and narrower spoke cavities must be designed to achieve lower
stress and lower mass values.
Conclusions In this study, numerical simulation of biaxial fatigue test was developed by using
LBF.WheelStrength fatigue software and a correlation with experimental results was achieved.
After correlation, study continued with the optimization of spoke cavity geometry for a wheel
subjected to ZWARP type of loading by using Design of Computational Experiments. Statistical
analysis was conducted by Minitab 18.0 statistical software. Effects of parameters and their
interactions on objective functions were shown. Optimum design was found to be 192 g lower than
the heaviest design. For the selected investigation points, up to 70% stress decrease was achieved.
For mass and spoke cavity stress optimum parameters are found to be out of selected design domain.
6th Int. Conf.: Thermophysical and Mechanical Properties of Advanced Materials (THERMAM)
8thRostocker Int. Conf.: Thermophysical Properties for Technical Thermodynamics
22-24 September 2019, Çeşme, İzmir, Turkey
108
References:
1. Chang, C. L., Yang, S. H. Simulation of wheel impact test using finite element method,
Engineering Failure Analysis, 16, 5, pp.1711-1719, 2009.
2. Raju, P. R., Satyanarayana, B., Ramji, K., Babu, K. S. Evaluation of fatigue life of aluminum
alloy wheels under radial loads, Engineering failure analysis, 14, 5, pp.791800, 2007.
3. Kocabicak, U., Firat, M. Numerical analysis of wheel cornering fatigue tests, Engineering
Failure Analysis, 8, 4, pp.339-354, 2001.
4. Kara, A., Çubuklusu, H. E., Topçuoğlu, Ö. Y., Çe, Ö. B., Aybarç, U., Kalender, C. Design
and weight optimization of aluminum alloy wheels, Pamukkale University Journal of
Engineering Sciences, 23, 8, pp.957-962, 2017.
5. Ceyhan, A., Duruş, M., Akarsu, C., Aydın, R., Aray, A., Hatık, G., Özkardeşler, B. C. Wheel
hub fatigue performance under non-constant rotational loading and comparison to
Eurocycle test, Procedia Engineering, 101, pp.77-84, 2015.
6. Herbert, A., Fischer, G., Ehl, O. Load program development and testing of super single
wheels in the biaxial wheel test rig and numerical pre-design (No. 2004-012691). SAE
Technical Paper, 2004.
7. Ehl, O., Simms, P., Störzel, K., Bruder, T. Reliable pre-design of commercial vehicle
rotating suspension components (No. 2003-01-3426). SAE Technical Paper, 2003.
8. Santiciolli, F. M., Möller, R., Krause, I., & Dedini, F. G. Simulation of the scenario of the
biaxial wheel fatigue test. Advances in Engineering Software, 114, 337-347, 2017.
9. Wan, X., Shan, Y., Liu, X., Wang, H., Wang, J. Simulation of biaxial wheel test and fatigue
life estimation considering the influence of tire and wheel camber, Advances in
Engineering Software, 92, pp.57-64, 2016.
10. Heim, R., Krause, I., Weingaertner, S. Runflat-Technology and its Impact on Design and
Durability of Wheels (No. 2007-01-1532). SAE Technical Paper, 2007.
11. Society of Automotive Engineers, Biaxial Wheel Fatigue Test: SAE J2562, Rev.
APRIL2016. Society of Automotive Engineers, 2016.
12. Fraunhofer LBF, LBF.WheelStrength User Manual, 2016.

6th Int. Conf.: Thermophysical and Mechanical Properties of Advanced Materials (THERMAM)
8thRostocker Int. Conf.: Thermophysical Properties for Technical Thermodynamics
22-24 September 2019, Çeşme, İzmir, Turkey
109
Investigating the Preform Binder Effects on Thermo-Mechanical Properties of Composite Panels for Wind Blade Applications
Sema YILDIZ (a) , Berkay AYDOGAN(a), Nur KARASAHIN (a), Ilker TOPUZ (a)
(a) TPI Kompozit Kanat A.Ş., 1 Sok. No:70 Sasalı Çiğli/İzmir, TURKEY
Key words: Preform, binder, wind blade, mechanical properties
Abstract: The effects of epoxy-based binder impregnated fabrics on both mechanical and
thermo-mechanical properties of E-glass/epoxy-amine system for preform wind turbine blade
part manufacturing applications were investigated. The resultant properties were compared
with binder-free fabrics containing panels. Two types of fabrics which have unidirectional (UD)
0o and biaxial +45o/-45o orientations were used during the trials. The consolidation of the binder
impregnated fabrics with each other was ensured by the application of heat and vacuum
pressure. Composite panels were produced by using epoxy resin and vacuum-bag infusion
process to investigate their mechanical properties.
Results of the table-top trials reveal that there is a general increasing trend for ILSS and tensile
properties of panels which were produced by binder impregnated fabrics when compared to
binder-free panels. However, such a trend could not be observed among the panels produced
with binder impregnated fabrics with increasing binder concentration. Complex modulus values
of the panels were also tested with DMA and have seen that they decrease with the use of
binder added fabrics whereas they increases with increasing binder concentration only for
biaxial fabrics. On the other hand, there were many noisy fluctuations for UD panels due to
excessive stiffness of panels. Moreover, it was detected the Tg values of panels with binder
increases which indicates that binders partially dissolve within epoxy resin matrix during
infusion.
Introduction: Wind energy has a gradually increasing demand due to environmental concerns
and economical development [1]. It is a sustainable source of renewable energy with large
reserves and wide distribution [2]. Wind turbine blades are huge composite parts which are
used for transformation of electrical energy from wind energy [3]. They are currently
manufactured by combination of resin and fabrics textured from fibers. Blades are generally
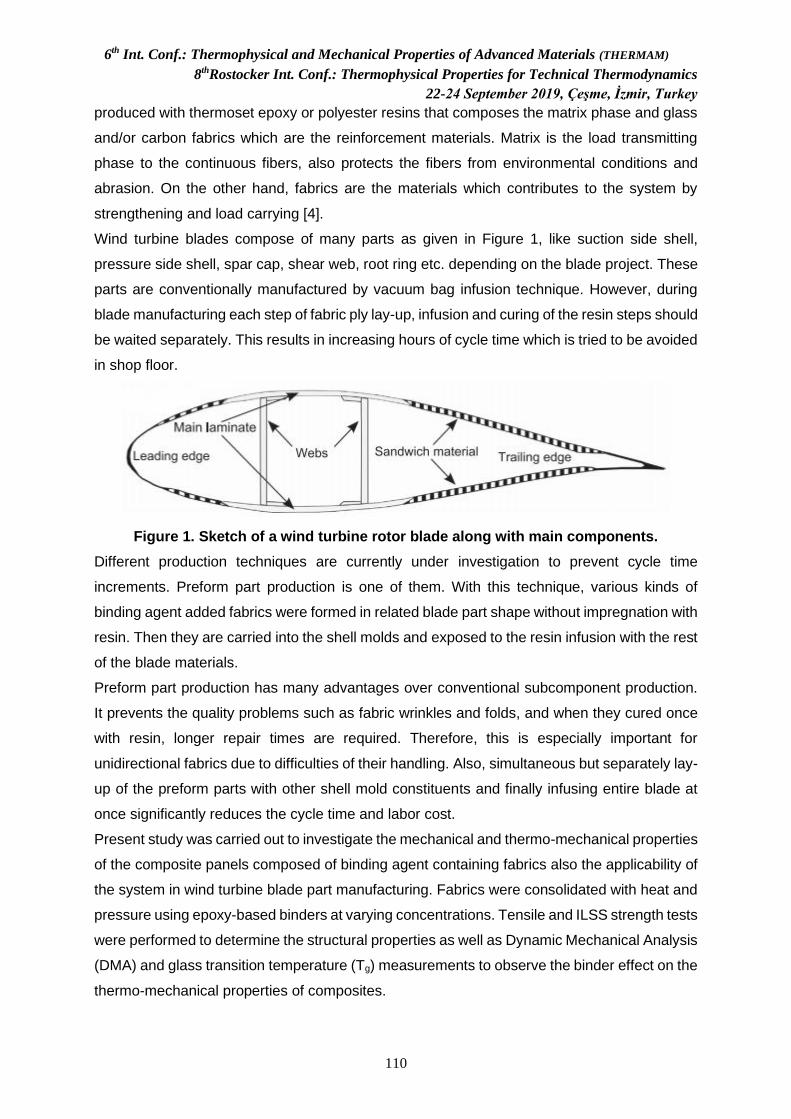
6th Int. Conf.: Thermophysical and Mechanical Properties of Advanced Materials (THERMAM)
8thRostocker Int. Conf.: Thermophysical Properties for Technical Thermodynamics
22-24 September 2019, Çeşme, İzmir, Turkey
110
produced with thermoset epoxy or polyester resins that composes the matrix phase and glass
and/or carbon fabrics which are the reinforcement materials. Matrix is the load transmitting
phase to the continuous fibers, also protects the fibers from environmental conditions and
abrasion. On the other hand, fabrics are the materials which contributes to the system by
strengthening and load carrying [4].
Wind turbine blades compose of many parts as given in Figure 1, like suction side shell,
pressure side shell, spar cap, shear web, root ring etc. depending on the blade project. These
parts are conventionally manufactured by vacuum bag infusion technique. However, during
blade manufacturing each step of fabric ply lay-up, infusion and curing of the resin steps should
be waited separately. This results in increasing hours of cycle time which is tried to be avoided
in shop floor.
Figure 1. Sketch of a wind turbine rotor blade along with main components.
Different production techniques are currently under investigation to prevent cycle time
increments. Preform part production is one of them. With this technique, various kinds of
binding agent added fabrics were formed in related blade part shape without impregnation with
resin. Then they are carried into the shell molds and exposed to the resin infusion with the rest
of the blade materials.
Preform part production has many advantages over conventional subcomponent production.
It prevents the quality problems such as fabric wrinkles and folds, and when they cured once
with resin, longer repair times are required. Therefore, this is especially important for
unidirectional fabrics due to difficulties of their handling. Also, simultaneous but separately lay-
up of the preform parts with other shell mold constituents and finally infusing entire blade at
once significantly reduces the cycle time and labor cost.
Present study was carried out to investigate the mechanical and thermo-mechanical properties
of the composite panels composed of binding agent containing fabrics also the applicability of
the system in wind turbine blade part manufacturing. Fabrics were consolidated with heat and
pressure using epoxy-based binders at varying concentrations. Tensile and ILSS strength tests
were performed to determine the structural properties as well as Dynamic Mechanical Analysis
(DMA) and glass transition temperature (Tg) measurements to observe the binder effect on the
thermo-mechanical properties of composites.
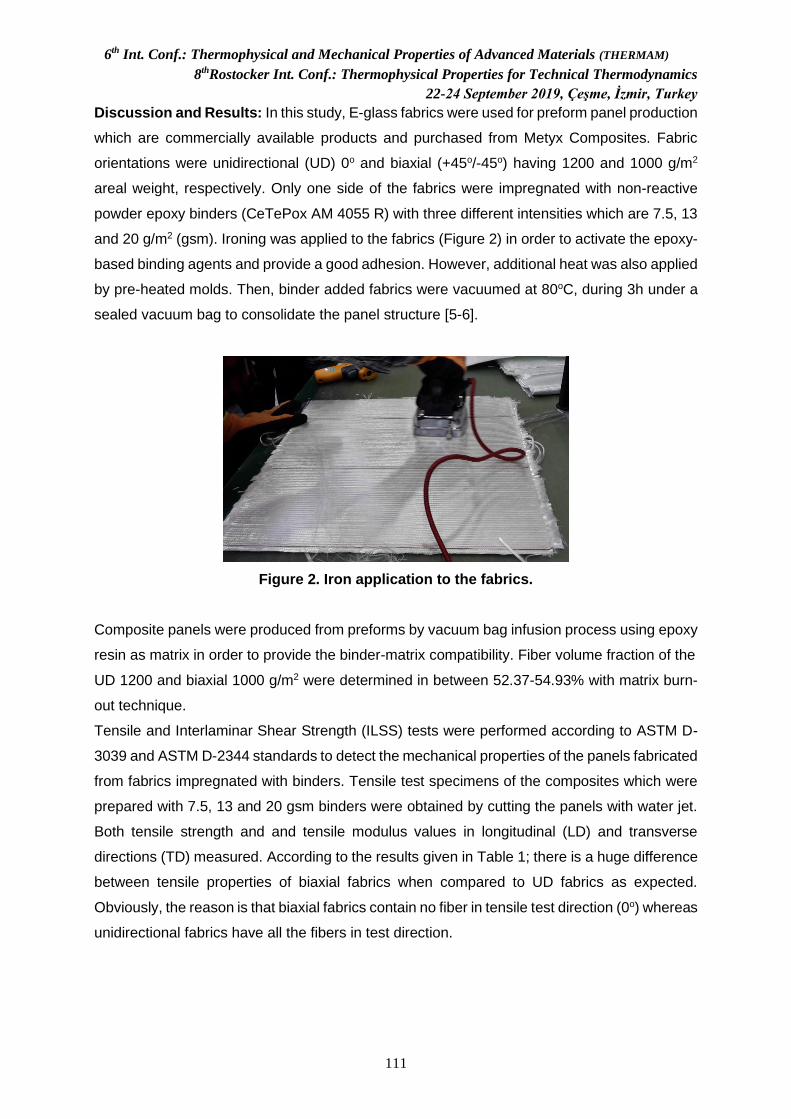
6th Int. Conf.: Thermophysical and Mechanical Properties of Advanced Materials (THERMAM)
8thRostocker Int. Conf.: Thermophysical Properties for Technical Thermodynamics
22-24 September 2019, Çeşme, İzmir, Turkey
111
Discussion and Results: In this study, E-glass fabrics were used for preform panel production
which are commercially available products and purchased from Metyx Composites. Fabric
orientations were unidirectional (UD) 0o and biaxial (+45o/-45o) having 1200 and 1000 g/m2
areal weight, respectively. Only one side of the fabrics were impregnated with non-reactive
powder epoxy binders (CeTePox AM 4055 R) with three different intensities which are 7.5, 13
and 20 g/m2 (gsm). Ironing was applied to the fabrics (Figure 2) in order to activate the epoxy-
based binding agents and provide a good adhesion. However, additional heat was also applied
by pre-heated molds. Then, binder added fabrics were vacuumed at 80oC, during 3h under a
sealed vacuum bag to consolidate the panel structure [5-6].
Figure 2. Iron application to the fabrics.
Composite panels were produced from preforms by vacuum bag infusion process using epoxy
resin as matrix in order to provide the binder-matrix compatibility. Fiber volume fraction of the
UD 1200 and biaxial 1000 g/m2 were determined in between 52.37-54.93% with matrix burn-
out technique.
Tensile and Interlaminar Shear Strength (ILSS) tests were performed according to ASTM D-
3039 and ASTM D-2344 standards to detect the mechanical properties of the panels fabricated
from fabrics impregnated with binders. Tensile test specimens of the composites which were
prepared with 7.5, 13 and 20 gsm binders were obtained by cutting the panels with water jet.
Both tensile strength and and tensile modulus values in longitudinal (LD) and transverse
directions (TD) measured. According to the results given in Table 1; there is a huge difference
between tensile properties of biaxial fabrics when compared to UD fabrics as expected.
Obviously, the reason is that biaxial fabrics contain no fiber in tensile test direction (0o) whereas
unidirectional fabrics have all the fibers in test direction.
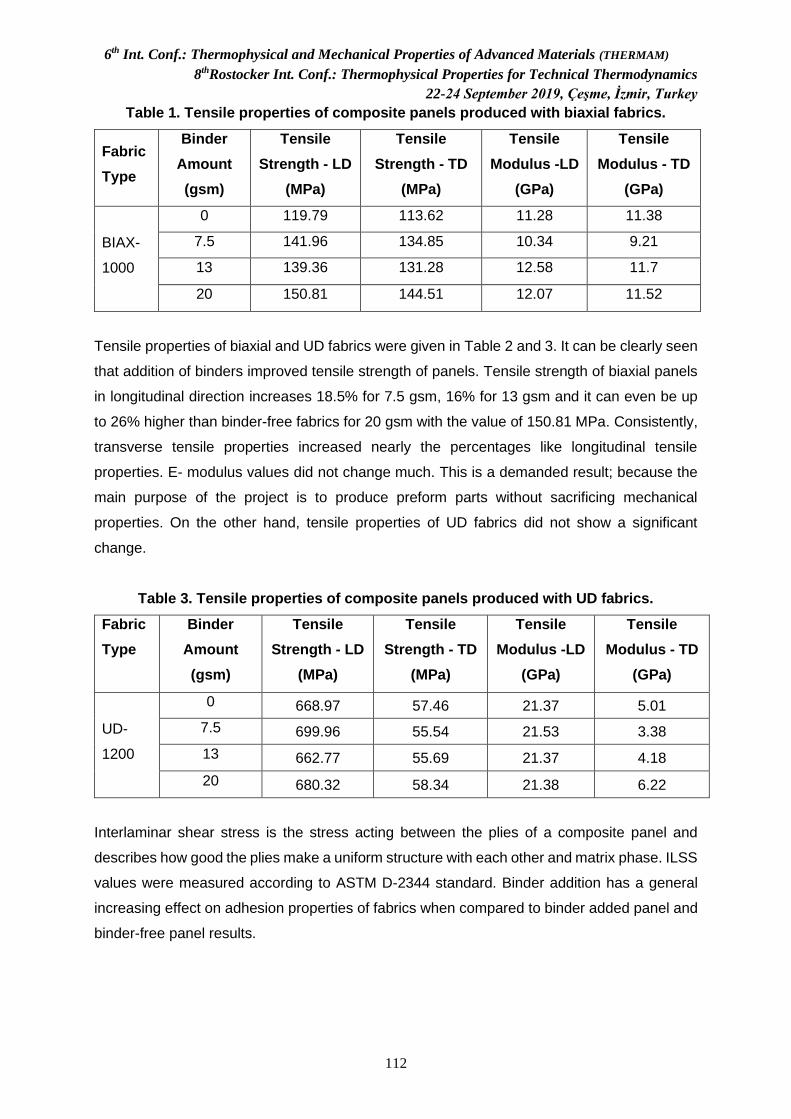
6th Int. Conf.: Thermophysical and Mechanical Properties of Advanced Materials (THERMAM)
8thRostocker Int. Conf.: Thermophysical Properties for Technical Thermodynamics
22-24 September 2019, Çeşme, İzmir, Turkey
112
Table 1. Tensile properties of composite panels produced with biaxial fabrics.
Fabric
Type
Binder
Amount
(gsm)
Tensile
Strength - LD
(MPa)
Tensile
Strength - TD
(MPa)
Tensile
Modulus -LD
(GPa)
Tensile
Modulus - TD
(GPa)
BIAX-
1000
0 119.79 113.62 11.28 11.38
7.5 141.96 134.85 10.34 9.21
13 139.36 131.28 12.58 11.7
20 150.81 144.51 12.07 11.52
Tensile properties of biaxial and UD fabrics were given in Table 2 and 3. It can be clearly seen
that addition of binders improved tensile strength of panels. Tensile strength of biaxial panels
in longitudinal direction increases 18.5% for 7.5 gsm, 16% for 13 gsm and it can even be up
to 26% higher than binder-free fabrics for 20 gsm with the value of 150.81 MPa. Consistently,
transverse tensile properties increased nearly the percentages like longitudinal tensile
properties. E- modulus values did not change much. This is a demanded result; because the
main purpose of the project is to produce preform parts without sacrificing mechanical
properties. On the other hand, tensile properties of UD fabrics did not show a significant
change.
Table 3. Tensile properties of composite panels produced with UD fabrics.
Fabric
Type
Binder
Amount
(gsm)
Tensile
Strength - LD
(MPa)
Tensile
Strength - TD
(MPa)
Tensile
Modulus -LD
(GPa)
Tensile
Modulus - TD
(GPa)
UD-
1200
0 668.97 57.46 21.37 5.01
7.5 699.96 55.54 21.53 3.38
13 662.77 55.69 21.37 4.18
20 680.32 58.34 21.38 6.22
Interlaminar shear stress is the stress acting between the plies of a composite panel and
describes how good the plies make a uniform structure with each other and matrix phase. ILSS
values were measured according to ASTM D-2344 standard. Binder addition has a general
increasing effect on adhesion properties of fabrics when compared to binder added panel and
binder-free panel results.
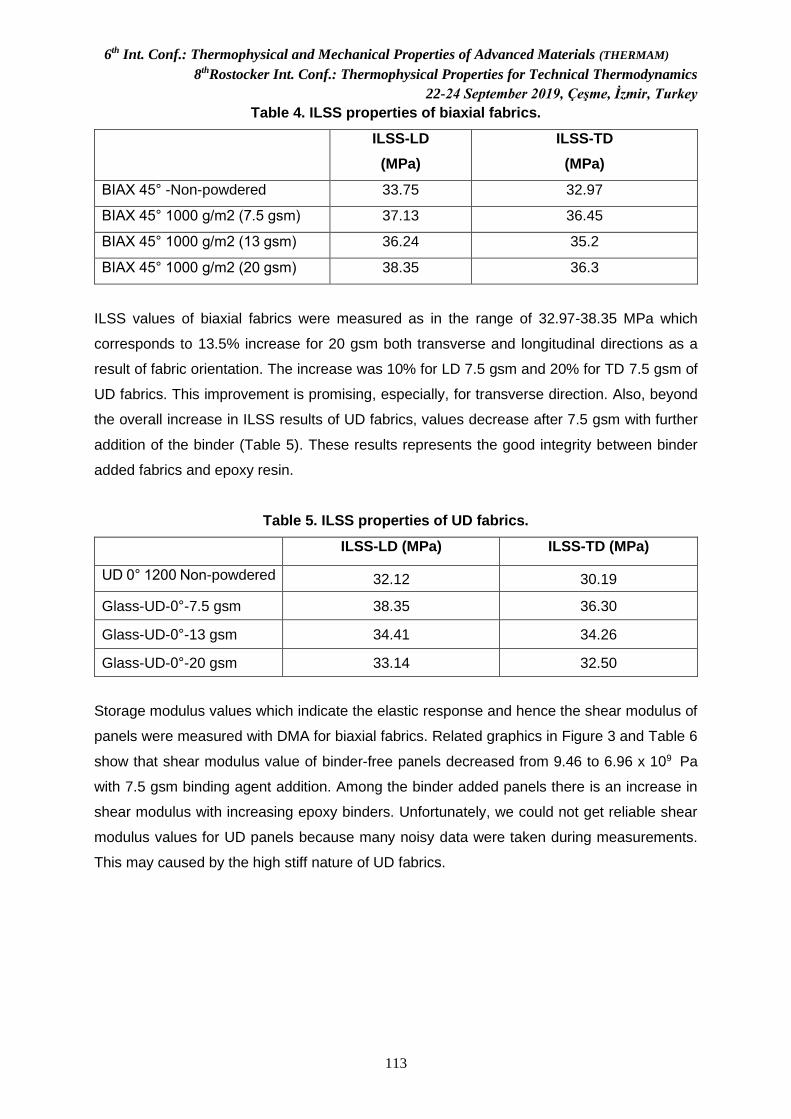
6th Int. Conf.: Thermophysical and Mechanical Properties of Advanced Materials (THERMAM)
8thRostocker Int. Conf.: Thermophysical Properties for Technical Thermodynamics
22-24 September 2019, Çeşme, İzmir, Turkey
113
Table 4. ILSS properties of biaxial fabrics.
ILSS-LD
(MPa)
ILSS-TD
(MPa)
BIAX 45° -Non-powdered 33.75 32.97
BIAX 45° 1000 g/m2 (7.5 gsm) 37.13 36.45
BIAX 45° 1000 g/m2 (13 gsm) 36.24 35.2
BIAX 45° 1000 g/m2 (20 gsm) 38.35 36.3
ILSS values of biaxial fabrics were measured as in the range of 32.97-38.35 MPa which
corresponds to 13.5% increase for 20 gsm both transverse and longitudinal directions as a
result of fabric orientation. The increase was 10% for LD 7.5 gsm and 20% for TD 7.5 gsm of
UD fabrics. This improvement is promising, especially, for transverse direction. Also, beyond
the overall increase in ILSS results of UD fabrics, values decrease after 7.5 gsm with further
addition of the binder (Table 5). These results represents the good integrity between binder
added fabrics and epoxy resin.
Table 5. ILSS properties of UD fabrics.
ILSS-LD (MPa) ILSS-TD (MPa)
UD 0° 1200 Non-powdered 32.12 30.19
Glass-UD-0°-7.5 gsm 38.35 36.30
Glass-UD-0°-13 gsm 34.41 34.26
Glass-UD-0°-20 gsm 33.14 32.50
Storage modulus values which indicate the elastic response and hence the shear modulus of
panels were measured with DMA for biaxial fabrics. Related graphics in Figure 3 and Table 6
show that shear modulus value of binder-free panels decreased from 9.46 to 6.96 x 10⁹ Pa
with 7.5 gsm binding agent addition. Among the binder added panels there is an increase in
shear modulus with increasing epoxy binders. Unfortunately, we could not get reliable shear
modulus values for UD panels because many noisy data were taken during measurements.
This may caused by the high stiff nature of UD fabrics.

6th Int. Conf.: Thermophysical and Mechanical Properties of Advanced Materials (THERMAM)
8thRostocker Int. Conf.: Thermophysical Properties for Technical Thermodynamics
22-24 September 2019, Çeşme, İzmir, Turkey
114
Figure 3. Shear Modulus data of biaxial 1000-No powder) b) Biax 1000-7.5 gsm c) Biax
1000-13 gsm d) Biax 1000-20 gsm.
According to the results given in Table 6, Tg of all binding agent cotaining panels were
developed. This result can be attributed to the partial dissolution of the epoxy based binders
in epoxy resin which represents the compatibility with each other [7]. Tg value had increased
up to 26.5% for UD-20 gsm panel compared to neat panel.
Table 6. Tg and Shear Modulus values of composite panels.
Fabric Type Binder Content (gsm) Onset Tg (oC) Shear Modulus (GPa)
Biax 1000
0 67.47 9.46
7.5 72.14 6.96
13 80.05 8.38
20 75.02 9.33
UD 1200
0 71.20
7.5 87.87
13 85.96
20 90.12
a)
d) c)
b)
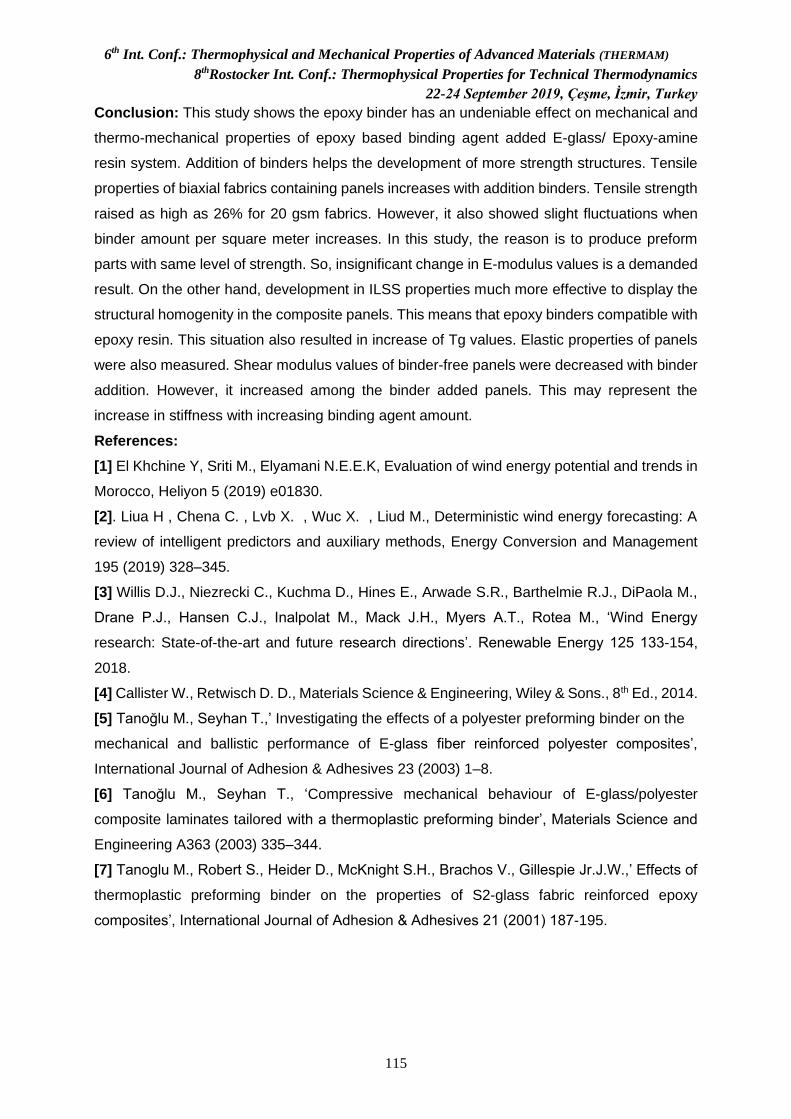
6th Int. Conf.: Thermophysical and Mechanical Properties of Advanced Materials (THERMAM)
8thRostocker Int. Conf.: Thermophysical Properties for Technical Thermodynamics
22-24 September 2019, Çeşme, İzmir, Turkey
115
Conclusion: This study shows the epoxy binder has an undeniable effect on mechanical and
thermo-mechanical properties of epoxy based binding agent added E-glass/ Epoxy-amine
resin system. Addition of binders helps the development of more strength structures. Tensile
properties of biaxial fabrics containing panels increases with addition binders. Tensile strength
raised as high as 26% for 20 gsm fabrics. However, it also showed slight fluctuations when
binder amount per square meter increases. In this study, the reason is to produce preform
parts with same level of strength. So, insignificant change in E-modulus values is a demanded
result. On the other hand, development in ILSS properties much more effective to display the
structural homogenity in the composite panels. This means that epoxy binders compatible with
epoxy resin. This situation also resulted in increase of Tg values. Elastic properties of panels
were also measured. Shear modulus values of binder-free panels were decreased with binder
addition. However, it increased among the binder added panels. This may represent the
increase in stiffness with increasing binding agent amount.
References:
[1] El Khchine Y, Sriti M., Elyamani N.E.E.K, Evaluation of wind energy potential and trends in
Morocco, Heliyon 5 (2019) e01830.
[2]. Liua H , Chena C. , Lvb X. , Wuc X. , Liud M., Deterministic wind energy forecasting: A
review of intelligent predictors and auxiliary methods, Energy Conversion and Management
195 (2019) 328–345.
[3] Willis D.J., Niezrecki C., Kuchma D., Hines E., Arwade S.R., Barthelmie R.J., DiPaola M.,
Drane P.J., Hansen C.J., Inalpolat M., Mack J.H., Myers A.T., Rotea M., ‘Wind Energy
research: State-of-the-art and future research directions’. Renewable Energy 125 133-154,
2018.
[4] Callister W., Retwisch D. D., Materials Science & Engineering, Wiley & Sons., 8th Ed., 2014.
[5] Tanoğlu M., Seyhan T.,’ Investigating the effects of a polyester preforming binder on the
mechanical and ballistic performance of E-glass fiber reinforced polyester composites’,
International Journal of Adhesion & Adhesives 23 (2003) 1–8.
[6] Tanoğlu M., Seyhan T., ‘Compressive mechanical behaviour of E-glass/polyester
composite laminates tailored with a thermoplastic preforming binder’, Materials Science and
Engineering A363 (2003) 335–344. [7] Tanoglu M., Robert S., Heider D., McKnight S.H., Brachos V., Gillespie Jr.J.W.,’ Effects of
thermoplastic preforming binder on the properties of S2-glass fabric reinforced epoxy
composites’, International Journal of Adhesion & Adhesives 21 (2001) 187-195.

6th Int. Conf.: Thermophysical and Mechanical Properties of Advanced Materials (THERMAM)
8thRostocker Int. Conf.: Thermophysical Properties for Technical Thermodynamics
22-24 September 2019, Çeşme, İzmir, Turkey
116
The Effect of Woven Glass on HDPE Composite Materials
S. Sanbur1*, S. Sayer2, A. Dogan1 and C. Ozes3
1Graduate School of Natural and Applied Sciences, Dokuz Eylül University, 35390, Izmir, TURKEY
2Department of Polymer Technology, Ege Vocational School, Ege University, 35100, Izmir, TURKEY
3Department of Mechanical Engineering, Dokuz Eylül University, 35390, Izmir, TURKEY
*Corresponding author: [email protected] Keywords: Polyethylene film, Tensile test, Impact test
Abstract: In this study, two types of thermoplastic composites were produced by placing single
and double layers of woven E- glass fabric between high density polyethylene films. The
composites were prepared using the compression molding method. The mechanical properties
were evaluated by means of tensile test and drop weight impact test. Impact test results
showed that with increasing energy level, contact force increased, while the contact time
decreased. It has been found that woven glass fabric reinforcement significantly increases the
tensile strength of the high density polyethylene film.
Introduction/Background: Composites materials have been widely used in aircraft, marine
and automotive parts because of their excellent and a unique combination of physical and
mechanical properties [1-4]. Structural composite parts in the automotive industry often have
a thermoset matrix due to lower raw material costs, but the requirements for recyclability have
increased interest in polymers with thermoplastic structure. Thermoplastic matrix is generally
preferred over thermoset for improving impact resistance [5]. In a thermoplastic polymer,
molecules are not chemically joined together. They are linked each other with weak secondary
bonds or intermolecular forces, like van der Waals bonds and hydrogen bonds. This weak
molecular bond broke if the polymer is heated. Conversely, broken bonds are restored when
the liquid thermoplastic polymer is cooled. So, a thermoplastic polymer can be heat softened,
melted, and reshaped [6]. The researcher has presented many articles concerning the
thermoplastic composites. [1,3,5,7-10]. This study relates to the fabrication and testing of
woven E-glass fabric high density polyethylene composite material. The mechanical properties
were evaluated by means of tensile test and impact test.
Discussion and Results: Two types of thermoplastic composites, the schematic
representation shown in the Figure 1, were prepared by placing single and double layers of
woven E- glass fabric (areal weight of 100 g/m2 ) between high density polyethylene films. The
polyethylene film with a tensile strength of 28 MPa and a thickness of 1 mm. The composites
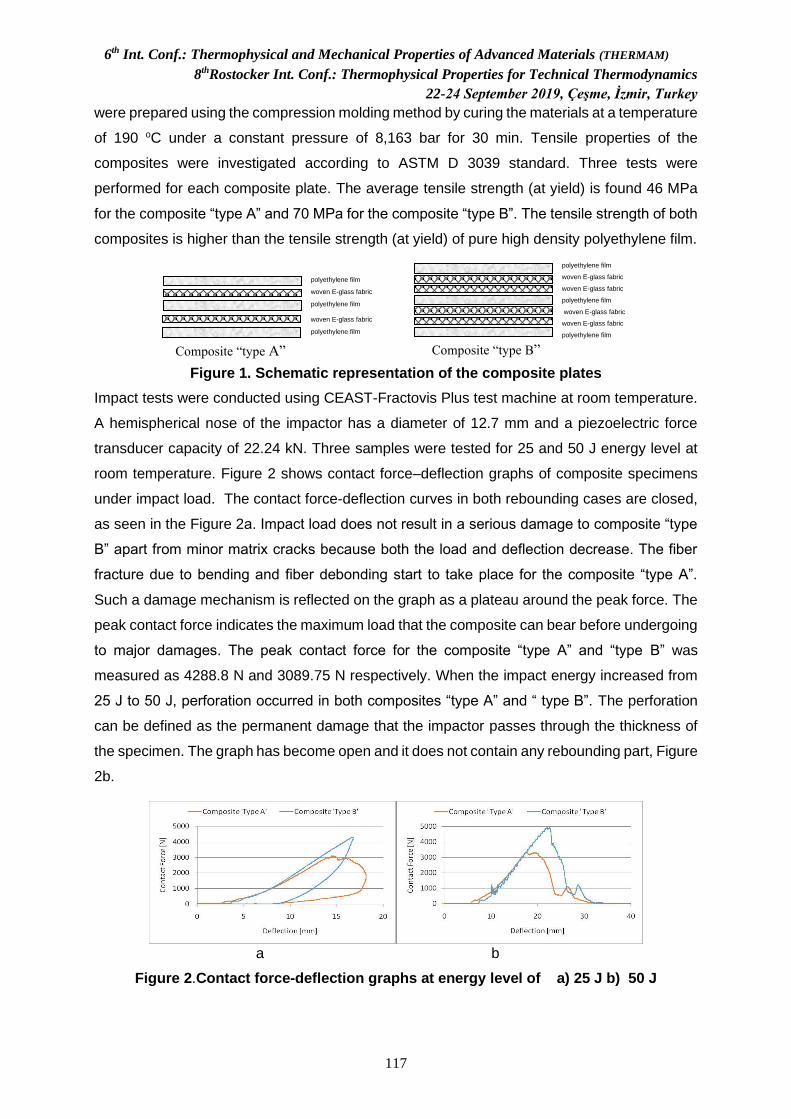
6th Int. Conf.: Thermophysical and Mechanical Properties of Advanced Materials (THERMAM)
8thRostocker Int. Conf.: Thermophysical Properties for Technical Thermodynamics
22-24 September 2019, Çeşme, İzmir, Turkey
117
were prepared using the compression molding method by curing the materials at a temperature
of 190 oC under a constant pressure of 8,163 bar for 30 min. Tensile properties of the
composites were investigated according to ASTM D 3039 standard. Three tests were
performed for each composite plate. The average tensile strength (at yield) is found 46 MPa
for the composite “type A” and 70 MPa for the composite “type B”. The tensile strength of both
composites is higher than the tensile strength (at yield) of pure high density polyethylene film.
Figure 1. Schematic representation of the composite plates
Impact tests were conducted using CEAST-Fractovis Plus test machine at room temperature.
A hemispherical nose of the impactor has a diameter of 12.7 mm and a piezoelectric force
transducer capacity of 22.24 kN. Three samples were tested for 25 and 50 J energy level at
room temperature. Figure 2 shows contact force–deflection graphs of composite specimens
under impact load. The contact force-deflection curves in both rebounding cases are closed,
as seen in the Figure 2a. Impact load does not result in a serious damage to composite “type
B” apart from minor matrix cracks because both the load and deflection decrease. The fiber
fracture due to bending and fiber debonding start to take place for the composite “type A”.
Such a damage mechanism is reflected on the graph as a plateau around the peak force. The
peak contact force indicates the maximum load that the composite can bear before undergoing
to major damages. The peak contact force for the composite “type A” and “type B” was
measured as 4288.8 N and 3089.75 N respectively. When the impact energy increased from
25 J to 50 J, perforation occurred in both composites “type A” and “ type B”. The perforation
can be defined as the permanent damage that the impactor passes through the thickness of
the specimen. The graph has become open and it does not contain any rebounding part, Figure
2b.
a b
Figure 2.Contact force-deflection graphs at energy level of a) 25 J b) 50 J
polyethylene film
woven E-glass fabric
woven E-glass fabric
polyethylene film
woven E-glass fabric
woven E-glass fabric
polyethylene film
Composite “type A” Composite “type B”
polyethylene film
woven E-glass fabric
polyethylene film woven E-glass fabric
polyethylene film
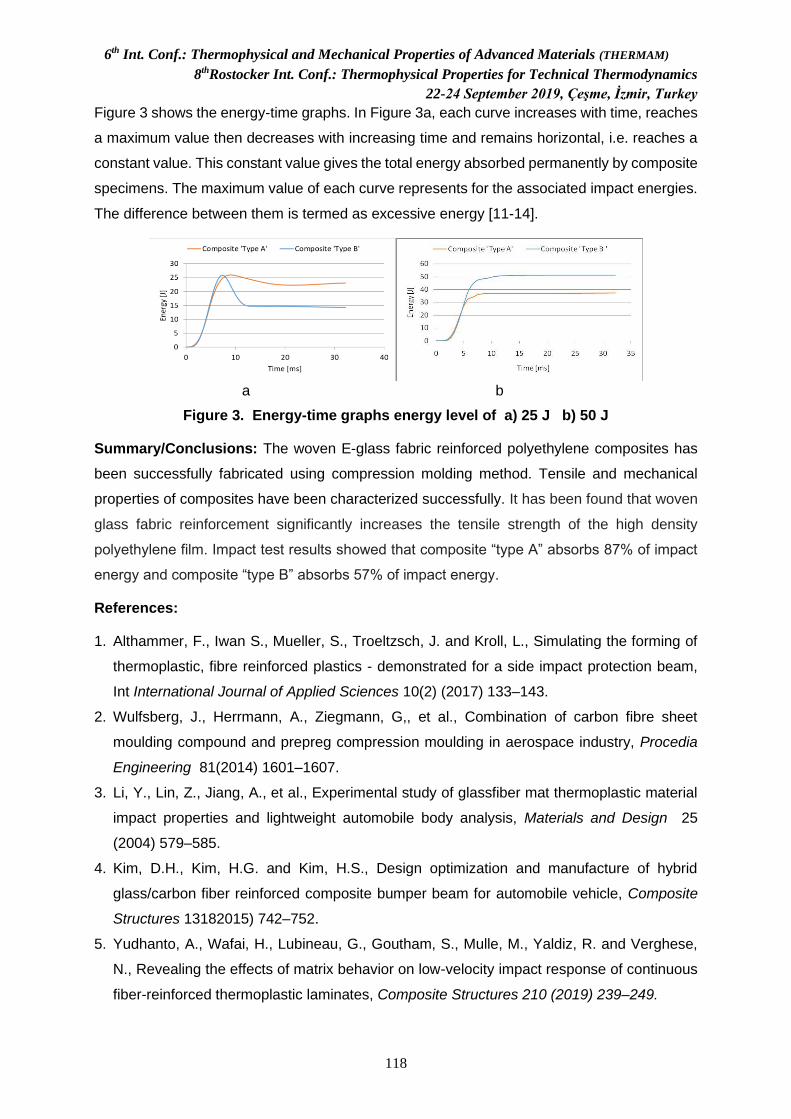
6th Int. Conf.: Thermophysical and Mechanical Properties of Advanced Materials (THERMAM)
8thRostocker Int. Conf.: Thermophysical Properties for Technical Thermodynamics
22-24 September 2019, Çeşme, İzmir, Turkey
118
Figure 3 shows the energy-time graphs. In Figure 3a, each curve increases with time, reaches
a maximum value then decreases with increasing time and remains horizontal, i.e. reaches a
constant value. This constant value gives the total energy absorbed permanently by composite
specimens. The maximum value of each curve represents for the associated impact energies.
The difference between them is termed as excessive energy [11-14].
a b
Figure 3. Energy-time graphs energy level of a) 25 J b) 50 J
Summary/Conclusions: The woven E-glass fabric reinforced polyethylene composites has
been successfully fabricated using compression molding method. Tensile and mechanical
properties of composites have been characterized successfully. It has been found that woven
glass fabric reinforcement significantly increases the tensile strength of the high density
polyethylene film. Impact test results showed that composite “type A” absorbs 87% of impact
energy and composite “type B” absorbs 57% of impact energy.
References:
1. Althammer, F., Iwan S., Mueller, S., Troeltzsch, J. and Kroll, L., Simulating the forming of
thermoplastic, fibre reinforced plastics - demonstrated for a side impact protection beam,
Int International Journal of Applied Sciences 10(2) (2017) 133–143.
2. Wulfsberg, J., Herrmann, A., Ziegmann, G,, et al., Combination of carbon fibre sheet
moulding compound and prepreg compression moulding in aerospace industry, Procedia
Engineering 81(2014) 1601–1607.
3. Li, Y., Lin, Z., Jiang, A., et al., Experimental study of glassfiber mat thermoplastic material
impact properties and lightweight automobile body analysis, Materials and Design 25
(2004) 579–585.
4. Kim, D.H., Kim, H.G. and Kim, H.S., Design optimization and manufacture of hybrid
glass/carbon fiber reinforced composite bumper beam for automobile vehicle, Composite
Structures 13182015) 742–752.
5. Yudhanto, A., Wafai, H., Lubineau, G., Goutham, S., Mulle, M., Yaldiz, R. and Verghese,
N., Revealing the effects of matrix behavior on low-velocity impact response of continuous
fiber-reinforced thermoplastic laminates, Composite Structures 210 (2019) 239–249.
6th Int. Conf.: Thermophysical and Mechanical Properties of Advanced Materials (THERMAM)
8thRostocker Int. Conf.: Thermophysical Properties for Technical Thermodynamics
22-24 September 2019, Çeşme, İzmir, Turkey
119
6. Atilla, D., Determination of mechanical properties of composite materials reinforced by
mineral, Master's Thesis, Izmir, 2019.
7. Arikan, V. and Sayman, O., Comparative study on repeated impact response of E-glass
fiber reinforced polypropylene & epoxy matrix composites, Composites Part B: Engineering
83 (2015) 1–6.
8. Vieille, B., Casado, V.M. and Bouvet, C., About the impact behavior of woven-ply carbon
fiber-reinforced thermoplastic- and thermosetting-composites: a comparative study,
Composite Structures 101(2013) 9–21.
9. Doğan, A. and Arman, Y., Effects of temperature and impactor nose diameter on the impact
behavior of PA6 and PP thermoplastic composites, Journal of Elastomers & Plastics, 51(1)
(2019) 64–74.
10. Boria, S., Scattina, A. and Belingardi, G., Impact behavior of a fully thermoplastic
composite, Composite Structures 167 (2017) 63–75.
11. Aktaş, M.,Balcıoğlu, H.E., Aktaş, A., Turker, E. and Deniz, M.E., Impact and post impact
behavior of layer fabric composites, Composite Structures 94 (2012) 2809–2818.
12. Aktas, M., Atas, C., Icten, B.M. and Karakuzu, R., An experimental investigation of the
impact response of composite laminates, Composite Structures 87 (2009) 307–313.
13. Liu, D., Characterization of impact properties and damage process of glass/epoxy
composite laminates, Journal of Composite Materials 38 (2004) 1425–1442.
14. Atas, C. and Sayman, O., An overall view on impact response of woven fabric composite
plates, Composite Structures 82 (2008) 336–345.
6th Int. Conf.: Thermophysical and Mechanical Properties of Advanced Materials (THERMAM)
8thRostocker Int. Conf.: Thermophysical Properties for Technical Thermodynamics
22-24 September 2019, Çeşme, İzmir, Turkey
120
Magnetization Behavior of Fe3O4 – Water and Fe2O3 – Water Magnetic Nanofluids
R. ALSANGURa*, S. DOGANAYa,b, A. TURGUTc and L. CETINb
aDokuz Eylül University, The Graduate School of Natural and Applied Sciences, İzmir, Turkey.
bİzmir Kâtip Çelebi University, Department of Mechatronics Engineering, İzmir, Turkey.
cDokuz Eylül University, Department of Mechanical Engineering, İzmir, Turkey. *Corresponding author: [email protected]
Keywords: Magnetic nanofluids, Magnetic properties, Magnetization, Magnetite, Maghemite. Abstract: Magnetic nanofluids are colloids that contain magnetic nanoparticles that are
dispersed in a base fluid. External magnetic field can cause changes in some of the properties
of these fluids and magnetic behaviour and magnetization may help to understand better the
nanostructure of the fluid. To understand the effect of the magnetization on the magnetic
nanofluids, magnetization measurements were carried out for magnetite (Fe3O4) - water and
maghemite (γ-Fe2O3) - water magnetic nanofluids by using a vibrating sample magnetometer
(VSM). Various samples with different volume concentrations for Fe3O4 - water (1, 2, 3, 4 and
4.8%) and γ-Fe2O3 - water (1.1 and 2.2%) nanofluids were used in measurements. The results
show that γ-Fe2O3 - water magnetic nanofluid have higher magnetization values than Fe3O4 -
water magnetic nanofluid. The measurements also point out that as the volume concentration
increases, magnetization of the both magnetic nanofluids increases as well.
Introduction/Background:
Nanofluids are colloids that contain nanosized particles dispersed into a base fluid to improve
the thermophysical properties of the base fluid. If the nanosized particles have magnetic
properties, the fluid can be called as magnetic nanofluids. Thermophysical properties of
magnetic nanofluids can be altered and tuned by applying external magnetic field. This
situation provides many potential application areas for these fluids, such as biomedical
applications, solar systems [1] and heat transfer [2]. Magnetic properties and magnetization
behaviour can give an insight to the nanostructure of the nanofluid, such as particle interactions
and agglomerate formation which can strongly influence the thermophysical properties of the
fluid [3].
This study aims to investigate the magnetization behaviour of magnetite (Fe3O4) - water and
maghemite (γ-Fe2O3) - water magnetic nanofluids. The magnetic nanofluid samples with
different volume concentrations were measured by using a Vibrating Sonic Magnetometer
(VSM). The results pointed out that (γ-Fe2O3) - water magnetic nanofluid has higher
magnetization value than Fe3O4 – water and both fluids’ magnetization values increases with
increasing volume concentration.
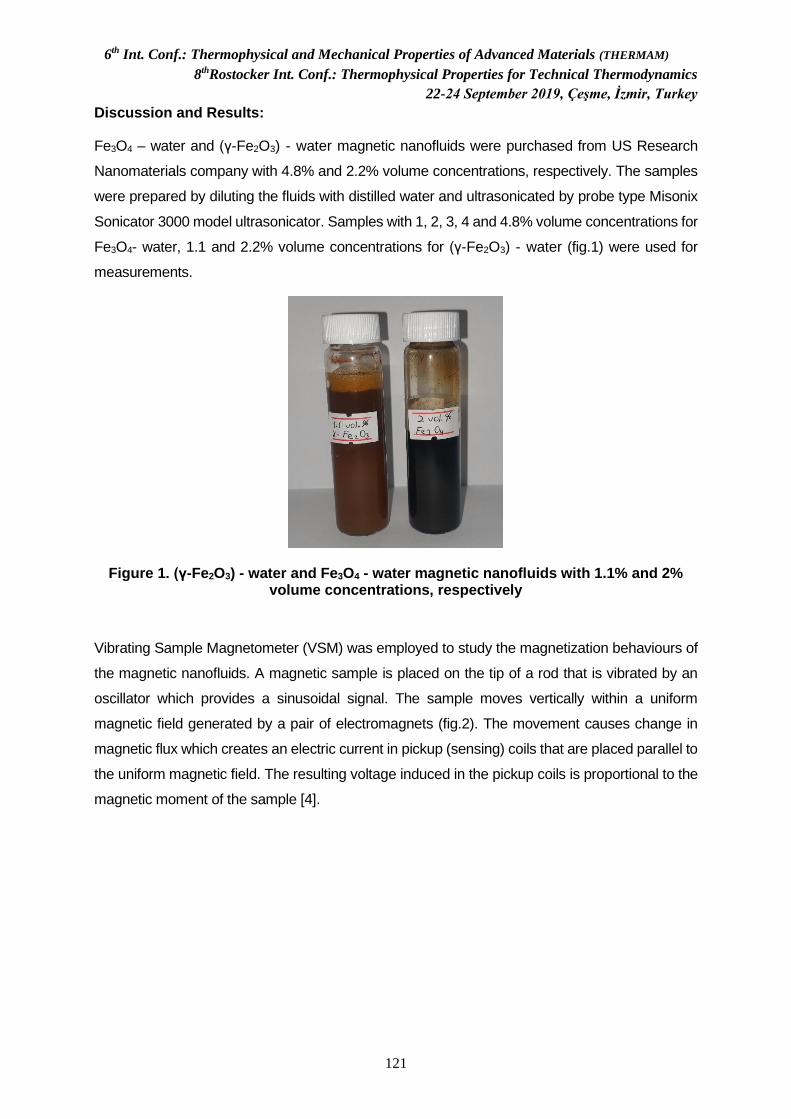
6th Int. Conf.: Thermophysical and Mechanical Properties of Advanced Materials (THERMAM)
8thRostocker Int. Conf.: Thermophysical Properties for Technical Thermodynamics
22-24 September 2019, Çeşme, İzmir, Turkey
121
Discussion and Results:
Fe3O4 – water and (γ-Fe2O3) - water magnetic nanofluids were purchased from US Research
Nanomaterials company with 4.8% and 2.2% volume concentrations, respectively. The samples
were prepared by diluting the fluids with distilled water and ultrasonicated by probe type Misonix
Sonicator 3000 model ultrasonicator. Samples with 1, 2, 3, 4 and 4.8% volume concentrations for
Fe3O4- water, 1.1 and 2.2% volume concentrations for (γ-Fe2O3) - water (fig.1) were used for
measurements.
Figure 1. (γ-Fe2O3) - water and Fe3O4 - water magnetic nanofluids with 1.1% and 2% volume concentrations, respectively
Vibrating Sample Magnetometer (VSM) was employed to study the magnetization behaviours of
the magnetic nanofluids. A magnetic sample is placed on the tip of a rod that is vibrated by an
oscillator which provides a sinusoidal signal. The sample moves vertically within a uniform
magnetic field generated by a pair of electromagnets (fig.2). The movement causes change in
magnetic flux which creates an electric current in pickup (sensing) coils that are placed parallel to
the uniform magnetic field. The resulting voltage induced in the pickup coils is proportional to the
magnetic moment of the sample [4].
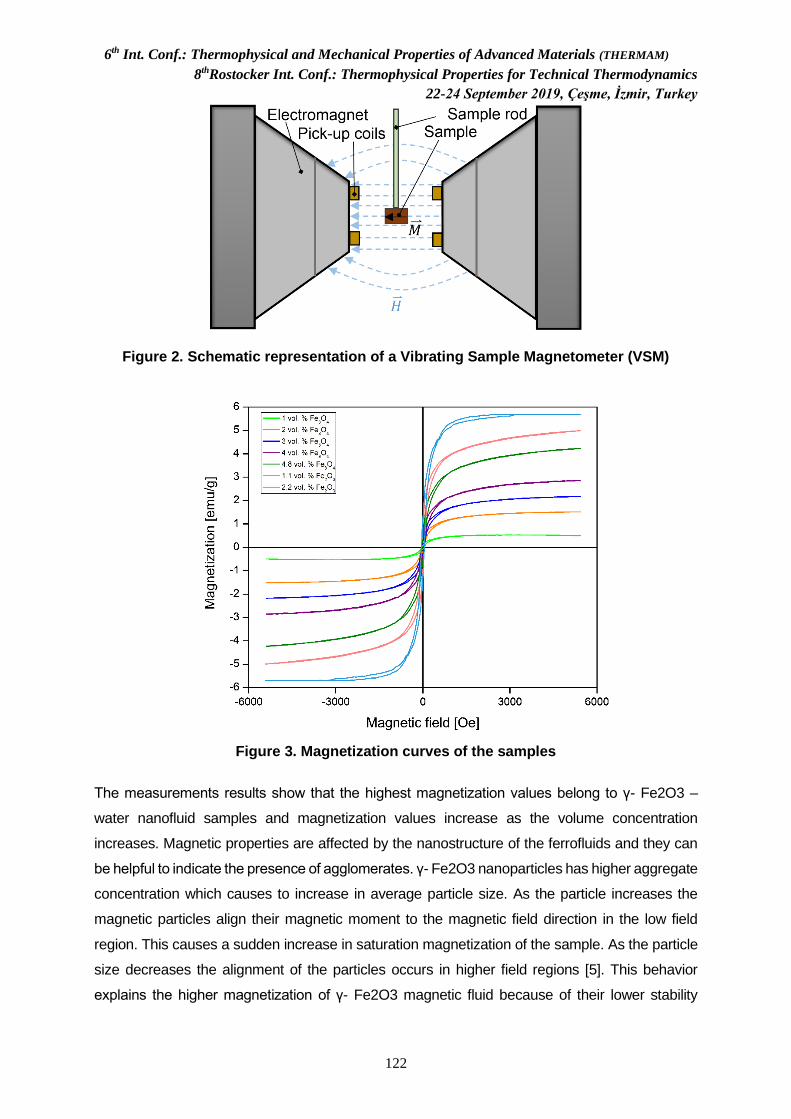
6th Int. Conf.: Thermophysical and Mechanical Properties of Advanced Materials (THERMAM)
8thRostocker Int. Conf.: Thermophysical Properties for Technical Thermodynamics
22-24 September 2019, Çeşme, İzmir, Turkey
122
Figure 2. Schematic representation of a Vibrating Sample Magnetometer (VSM)
Figure 3. Magnetization curves of the samples
The measurements results show that the highest magnetization values belong to γ- Fe2O3 –
water nanofluid samples and magnetization values increase as the volume concentration
increases. Magnetic properties are affected by the nanostructure of the ferrofluids and they can
be helpful to indicate the presence of agglomerates. γ- Fe2O3 nanoparticles has higher aggregate
concentration which causes to increase in average particle size. As the particle increases the
magnetic particles align their magnetic moment to the magnetic field direction in the low field
region. This causes a sudden increase in saturation magnetization of the sample. As the particle
size decreases the alignment of the particles occurs in higher field regions [5]. This behavior
explains the higher magnetization of γ- Fe2O3 magnetic fluid because of their lower stability

6th Int. Conf.: Thermophysical and Mechanical Properties of Advanced Materials (THERMAM)
8thRostocker Int. Conf.: Thermophysical Properties for Technical Thermodynamics
22-24 September 2019, Çeşme, İzmir, Turkey
123
compared to Fe3O4 magnetic fluids. Fig 3 shows the magnetization curves of the samples.
Magnetization values increases as the volume concentration increases because of the increased
particle content in the sample.
Summary/Conclusions: The magnetization measurements for γ- Fe2O3 – water and Fe3O4 –
water magnetic fluids were carried out for various volume concentrations. The measurements
pointed out that the magnetic behaviour of the magnetic nanofluids depends on the size of the
particles, aggregations, and volume concentration of the fluids. Aggregations align their magnetic
moments to the magnetic field direction at low magnetic field region causing a sudden increase
in saturation magnetization.
References:
1. Ghadiri, M., Sardarabadi, M., Pasandideh-fard, M., and Moghadam, A. J. (2015).
Experimental investigation of a PVT system performance using nano
ferrofluids. Energy Conversion and Management, 103, 468-476.
2. Kumar, A. and Subudhi, S. (2018). Preparation, characteristics, convection and
applications of magnetic nanofluids: A review. Heat and Mass Transfer, 54(2), 241-265.
3. Vékás, L., Marinică, O., Susan-Resiga, D., Stoian, F. D., and Bica, D. (2004, October).
Magnetic and flow properties of high magnetization nanofluids. In Proceedings of the 6th
International Conference on Hydraulic Machinery and Hydrodynamics, Timisoara,
Romania, Oct (pp. 21-22).
4. Foner, S. (1959). Versatile and sensitive vibrating‐sample magnetometer. Review of
Scientific Instruments, 30(7), 548-557.
5. Raşa, M., Bica, D., Philipse, A., & Vekas, L. (2002). Dilution series approach for
investigation of microstructural properties and particle interactions in high-quality magnetic
fluids. The European Physical Journal E, 7(3), 209-220.
6th Int. Conf.: Thermophysical and Mechanical Properties of Advanced Materials (THERMAM)
8thRostocker Int. Conf.: Thermophysical Properties for Technical Thermodynamics
22-24 September 2019, Çeşme, İzmir, Turkey
124
Thermodynamic and Thermophysical Properties of Humid air by Using Cubic Peng-Robinson EOS
Mustafa Turhan COBAN School of Engineering, Department of Mechanical Engineering; Ege University, Bornova, Izmir, Turkey
[email protected] www.turhancoban.com
Keywords: Thermodynamic properties of humid air, Peng-Robison EOS, cubic EOS, thermodynamic properties of dry air, thermophysial properties of humid air
1. Abstract: In humid air thermodynamic property calculations, it is usually ideal gas EOS is used. The basic reason for this is simplicity of using ideal gas EOS. For most air condition applications it might be sufficient, but when applications with higher pressure zones are considered error level will increased. An equation of state with better accuracy of thermodynamic properties will be required for extreme cases. In this study Peng-Robinson equation of state will be used to establish computer programs in java language to calculate properties of humid air. Cubic equation of states are basically defining the gas phase, with a better accuracy compare to ideal gas EOS and can be defined accurate enough results for high pressure applications as well. It is also possible to solve inverse equation v(T,P) by using cubic form oft he equation. Avoiding of more complex iterative root finding process, makes cubic equations a desirable EOS selection. For pure gases Peng-Robinson EOS defined as a function of critical properties and accentric factor. In order to mix gases Harstad, Miller, and Bellan EOSs for gas mixtures, particularly of PR-EOS. In this study the mixing rule proposed by Miller et al. is used to extend the PR equation of state to mixtures. Definition of dry air mixture is taken from standard air formula which is given as a mixture of gases such as Nitrogen, Oxygen, Argon, carbondioxide, Neon, Helium, Methane, Kripton, Hydrogen and Xenon . Mixing of air and water is carried out by using PR EOS mixing, but water properties such as saturation vapor pressure, saturation liquid and vapor densities are taken by utilizing IAPWS-97 water and steam industrial EOS. Basic thermodynamic and heat-mass transfer equations are used to define properties such as dew point temperature, adyabatic saturation temperature and wet bulb temperature. In order to calculate thermophysical properties such as viscosity, thermal conductivity etc. combination of cubic surface splines and Wilke, Reichenberg… methods are used. Results of developed equations are compared with Ideal gas and IAPWS-95 EOS & IAPWS G8-10 Humid air EOS. A Graphical user interphase is also developed. All the program codes are listed as free access in www.turhancoban.com adress. As subprograms properties of properties of dry air can also be calculated by using this set of PR EOS programs. All the codes are developed in java programming language.
2 Formulation of Equation of State
We will consider Peng-Robinson cubic equation of states for dry exhaust gas mixture in this paper. Details of the Peng-Robinsob Equation of State is given below.
Cubic Equation of State has a general form of equation
𝑃 =𝑅𝑇
𝑣−𝑏−
𝑎
𝑣2+𝑢𝑏𝑣+𝑤𝑏2 2.1
Peng-Robinson EOS coefficients: u=2,w=-1 so that equation took the form:
𝑃 =𝑅𝑇
𝑣−𝑏−
𝑎
𝑣2+2𝑏𝑣−𝑏2 2.2 where
𝑏 =0.0780𝑅𝑇𝑐𝑟𝑖𝑡
𝑃𝑐𝑟𝑖𝑡 2.3 and
𝑎 =0.45724𝑅2𝑇𝑐𝑟𝑖𝑡
2
𝑃𝑐𝑟𝑖𝑡[1 + 𝑓𝜔(1 − 𝑇𝑟
0.5)]2 2.4
𝑓𝜔 = 0.37464 + 1.54226𝜔 − 0.269992𝜔2 2.5 𝜔 in Peng-Robinson and Soawe equation of states coefficient is called accentric factor. This factor is calculated as
6th Int. Conf.: Thermophysical and Mechanical Properties of Advanced Materials (THERMAM)
8thRostocker Int. Conf.: Thermophysical Properties for Technical Thermodynamics
22-24 September 2019, Çeşme, İzmir, Turkey
125
𝜔 = −𝑙𝑜𝑔10𝑃𝑠𝑎𝑡𝑢𝑟𝑎𝑡𝑒𝑑 𝑣𝑎𝑝𝑜𝑟(𝑎𝑡 𝑇𝑟 = 0.7) − 1 2.6
To obtain values of 𝜔, the reduced vapor pressure (𝑃𝑟 = 𝑃 𝑃𝑐𝑟𝑖𝑡⁄ ) at 𝑇𝑟 = 𝑇 𝑇𝑐𝑟𝑖𝑡 = 0.7⁄ is required. The equation can also be written in the following form:
𝑍3 − (1 + 𝐵∗ − 𝑢𝐵∗)𝑍2 + (𝐴∗ +𝑤𝐵∗2 − 𝑢𝐵∗ − 𝑢𝐵∗2)𝑍 − 𝐴∗𝐵∗ − 𝐵∗2 −𝑤𝐵∗2 − 𝑤𝐵∗3 = 0 2.7
where 𝐴∗ =𝑎𝑃
𝑅2𝑇2 2.8 and 𝐵∗ =
𝑏𝑃
𝑅𝑇 2.9 𝑍 =
𝑃𝑣
𝑅𝑇 2.10
We are trying to establish equation of state which is a gas mixture. More recently, Harstad, Miller, and Bellan [1] have presented computationally efficient forms of EOSs for gas mixtures, particularly of PR-EOS. They have also shown that it is possible to extend the equations’ validity beyond the range of data using departure functions. In this study the mixing rule proposed by Miller et al. is used to extend the PR equation of state to mixtures. In particular, the parameters a and b can be obtained by 𝑎 = ∑ ∑ 𝑦𝑖𝑦𝑗𝑎𝑖𝑗𝑗𝑖 2.11 and 𝑏 = ∑ 𝑦𝑖𝑏𝑖𝑖 2.12 where y is the mole fraction in the vapor phase
Where 𝑏𝑖𝑗 =0.0780𝑅𝑇𝑐𝑟𝑖𝑡 𝑖𝑗
𝑃𝑐𝑟𝑖𝑡 𝑖𝑗 2.13 𝑎𝑖𝑗 =
0.45724𝑅2𝑇𝑐𝑟𝑖𝑡 𝑖𝑗2
𝑃𝑐𝑟𝑖𝑡 𝑖𝑗[1 + 𝑓𝜔𝑖𝑗(1 − 𝑇𝑟 𝑖𝑗
0.5)]2 2.14
𝑓𝜔𝑖𝑗 = 0.37464 + 1.54226𝜔𝑖𝑗 − 0.269992𝜔𝑖𝑗2 2.15
𝑇𝑟 𝑖𝑗 = 𝑇 𝑇𝑐𝑟𝑖𝑡 𝑖𝑗⁄ 2.16
The diagonal elements of the “critical” matrices are equal to their corresponding pure substance counterparts, i.e., 𝑇𝑐𝑟𝑖𝑡 𝑖𝑖
= 𝑇𝑐𝑟𝑖𝑡 𝑖 , 𝑃𝑐𝑟𝑖𝑡 𝑖𝑖 = 𝑃𝑐𝑟𝑖𝑡 𝑖, and 𝜔𝑖𝑖 = 𝜔𝑖 . The off-diagonal
elements are evaluated through additional rules:
𝑃𝑐𝑟𝑖𝑡 𝑖𝑗 =𝑍𝑐𝑟𝑖𝑡 𝑖𝑗𝑅𝑇𝑐𝑟𝑖𝑡 𝑖𝑗
𝑉𝑐𝑟𝑖𝑡 𝑖𝑗 2.17
𝑉𝑐𝑟𝑖𝑡 𝑖𝑗 =
1
8[(𝑉𝑐𝑟𝑖𝑡 𝑖𝑖
)1/3 + (𝑉𝑐𝑟𝑖𝑡 𝑗𝑗 )
1/3] 2.18
𝑍𝑐𝑟𝑖𝑡 𝑖𝑗 =
1
2[𝑍𝑐𝑟𝑖𝑡 𝑖𝑖 + 𝑍𝑐𝑟𝑖𝑡 𝑗𝑗
] 2.19
𝜔 𝑖𝑗 =
1
2[𝜔 𝑖𝑖
+𝜔 𝑗𝑗 ] 2.20
𝑇𝑐𝑟𝑖𝑡 𝑖𝑗 = √𝑇𝑐𝑟𝑖𝑡 𝑖𝑖
𝑇𝑐𝑟𝑖𝑡 𝑗𝑗 (1 − 𝑘𝑖𝑗) 2.21
Where interaction coefficient 𝑘𝑖𝑗 can be calculated as:
𝑘𝑖𝑗 = 1 −(𝑉𝑐𝑟𝑖𝑡 𝑖𝑖
𝑉𝑐𝑟𝑖𝑡 𝑗𝑗 )
1/2
𝑉𝑐𝑟𝑖𝑡 𝑖𝑗 2.22
Partial derivatives with respect to a 𝜕𝑎
𝜕𝑇= −
1
𝑇∑ ∑ (𝑦𝑖𝑦𝑗𝑎𝑖𝑗
𝑓𝜔𝑖𝑗√𝑇𝑟 𝑖𝑗
1+𝑓𝜔𝑖𝑗(1−√𝑇𝑟 𝑖𝑗))𝑗𝑖 2.23
𝜕2𝑎
𝜕𝑇2=
0.457236𝑅2
2𝑇∑ ∑ (𝑦𝑖𝑦𝑗𝑎𝑖𝑗(1 − 𝑓𝜔𝑖𝑗)
𝑇𝑐𝑟𝑖𝑡 𝑖𝑗
𝑃𝑐𝑟𝑖𝑡 𝑖𝑗√𝑇𝑟 𝑖𝑗)𝑗𝑖 2.24
In order to solve v(T,P) root solving is required, but due to structure of cubic equations root solving can easily be established by using Tartaglia & Cardino formula(1530). The basic formulas used to calculate cubic roots analytically are as follows:
𝑦 = 𝑎0 + 𝑎1𝑥 + 𝑎2𝑥2 + 𝑎3𝑥
3 2.25 𝑎 = 𝑎2/𝑎3 𝑏 = 𝑎1/𝑎3 𝑐 = 𝑎0/𝑎3 2.26
𝑦 = 𝑐 + 𝑏𝑥 + 𝑎𝑥2 + 𝑥3 2.27
𝑄 =𝑎2−3𝑏
9 𝑧 = 2𝑎3 − 9𝑎𝑏 + 27𝑐 2.28 𝑅 = 𝑧/54 2.29
𝑖𝑓(𝑅2 < 𝑄3)
{
𝜃 = 𝑐𝑜𝑠−1 (
𝑅
√𝑄3)
𝑥0 = −2√𝑄𝑐𝑜𝑠[𝜃 3⁄ ] − 𝑎/3
𝑥1 = 2√𝑄𝑐𝑜𝑠[(𝜃 − 2𝜋) 3⁄ ] − 𝑎/3
𝑥2 = 2√𝑄𝑐𝑜𝑠[(𝜃 − 2𝜋) 3⁄ ] − 𝑎/3}
𝑒𝑙𝑠𝑒
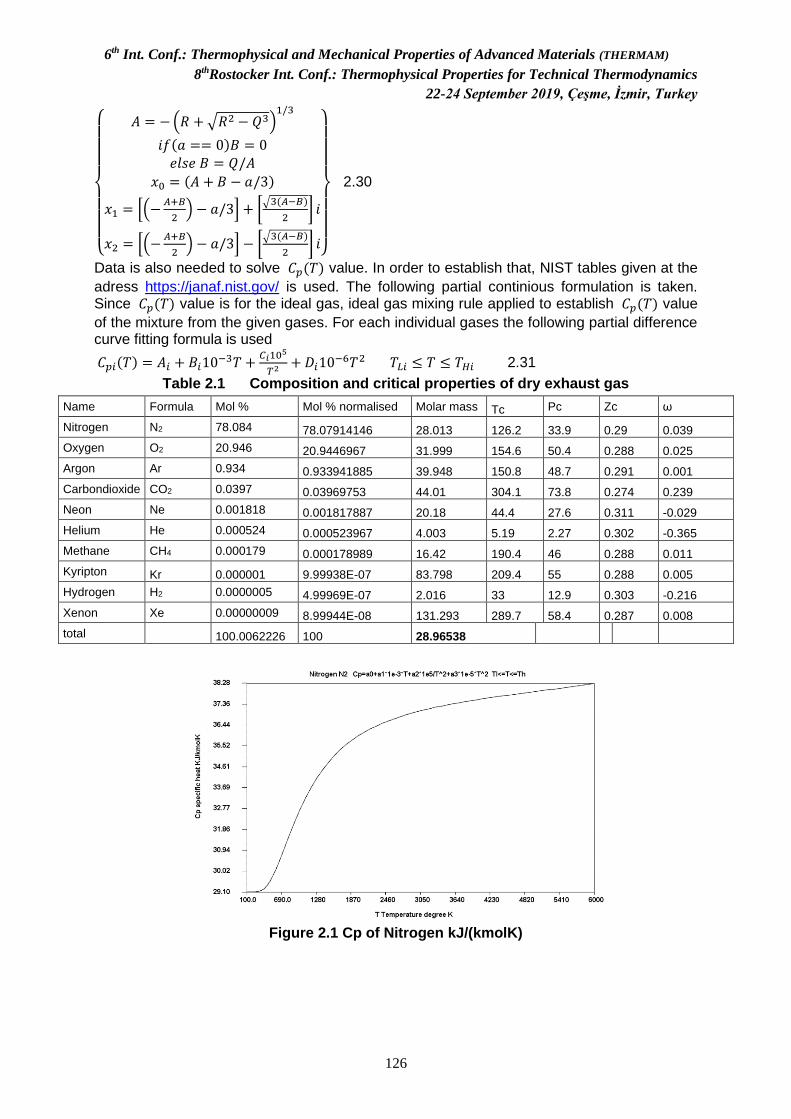
6th Int. Conf.: Thermophysical and Mechanical Properties of Advanced Materials (THERMAM)
8thRostocker Int. Conf.: Thermophysical Properties for Technical Thermodynamics
22-24 September 2019, Çeşme, İzmir, Turkey
126
{
𝐴 = −(𝑅 +√𝑅2 − 𝑄3)
1/3
𝑖𝑓(𝑎 == 0)𝐵 = 0𝑒𝑙𝑠𝑒 𝐵 = 𝑄/𝐴
𝑥0 = (𝐴 + 𝐵 − 𝑎/3)
𝑥1 = [(−𝐴+𝐵
2) − 𝑎/3] + [
√3(𝐴−𝐵)
2] 𝑖
𝑥2 = [(−𝐴+𝐵
2) − 𝑎/3] − [
√3(𝐴−𝐵)
2] 𝑖}
2.30
Data is also needed to solve 𝐶𝑝(𝑇) value. In order to establish that, NIST tables given at the
adress https://janaf.nist.gov/ is used. The following partial continious formulation is taken. Since 𝐶𝑝(𝑇) value is for the ideal gas, ideal gas mixing rule applied to establish 𝐶𝑝(𝑇) value
of the mixture from the given gases. For each individual gases the following partial difference curve fitting formula is used
𝐶𝑝𝑖(𝑇) = 𝐴𝑖 + 𝐵𝑖10−3𝑇 +
𝐶𝑖105
𝑇2+𝐷𝑖10
−6𝑇2 𝑇𝐿𝑖 ≤ 𝑇 ≤ 𝑇𝐻𝑖 2.31
Table 2.1 Composition and critical properties of dry exhaust gas
Figure 2.1 Cp of Nitrogen kJ/(kmolK)
Name Formula Mol % Mol % normalised Molar mass Tc Pc Zc ω
Nitrogen N2 78.084 78.07914146 28.013 126.2 33.9 0.29 0.039
Oxygen O2 20.946 20.9446967 31.999 154.6 50.4 0.288 0.025
Argon Ar 0.934 0.933941885 39.948 150.8 48.7 0.291 0.001
Carbondioxide CO2 0.0397 0.03969753 44.01 304.1 73.8 0.274 0.239
Neon Ne 0.001818 0.001817887 20.18 44.4 27.6 0.311 -0.029
Helium He 0.000524 0.000523967 4.003 5.19 2.27 0.302 -0.365
Methane CH4 0.000179 0.000178989 16.42 190.4 46 0.288 0.011
Kyripton Kr 0.000001 9.99938E-07 83.798 209.4 55 0.288 0.005
Hydrogen H2 0.0000005 4.99969E-07 2.016 33 12.9 0.303 -0.216
Xenon Xe 0.00000009 8.99944E-08 131.293 289.7 58.4 0.287 0.008
total 100.0062226 100 28.96538
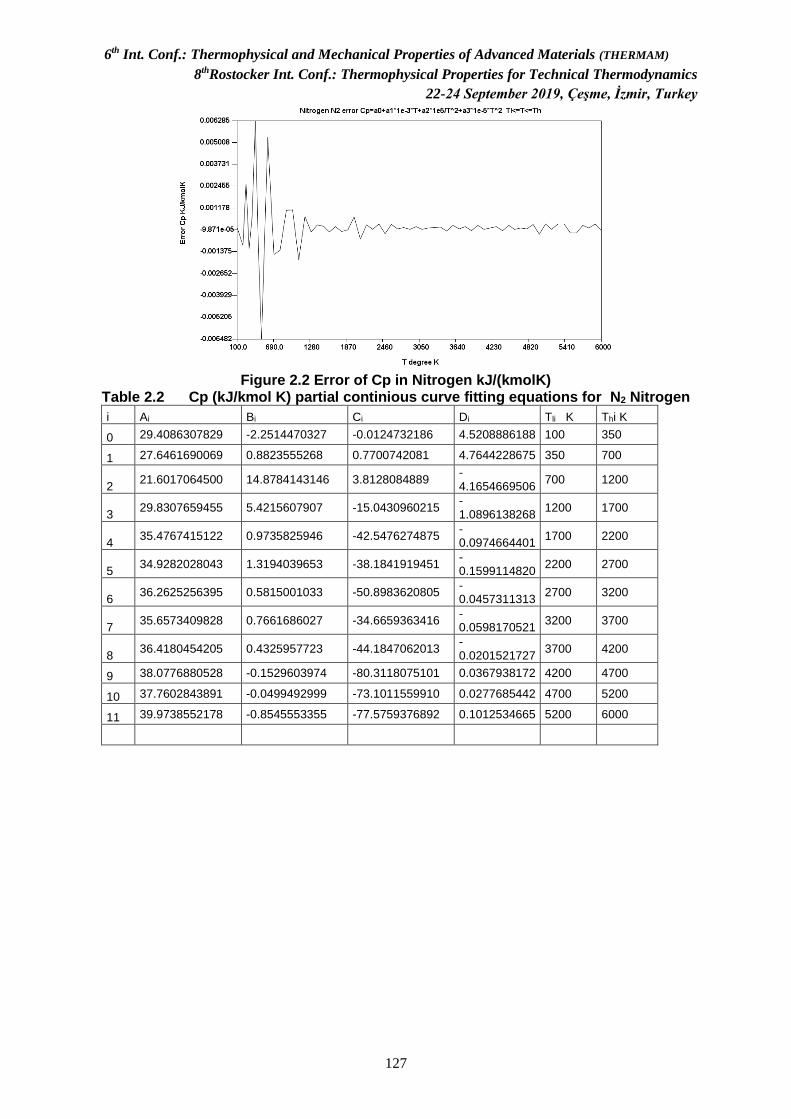
6th Int. Conf.: Thermophysical and Mechanical Properties of Advanced Materials (THERMAM)
8thRostocker Int. Conf.: Thermophysical Properties for Technical Thermodynamics
22-24 September 2019, Çeşme, İzmir, Turkey
127
Figure 2.2 Error of Cp in Nitrogen kJ/(kmolK)
Table 2.2 Cp (kJ/kmol K) partial continious curve fitting equations for N2 Nitrogen
i Ai Bi Ci Di Tli K Thi K
0 29.4086307829 -2.2514470327 -0.0124732186 4.5208886188 100 350
1 27.6461690069 0.8823555268 0.7700742081 4.7644228675 350 700
2 21.6017064500 14.8784143146 3.8128084889
-4.1654669506
700 1200
3 29.8307659455 5.4215607907 -15.0430960215
-1.0896138268
1200 1700
4 35.4767415122 0.9735825946 -42.5476274875
-0.0974664401
1700 2200
5 34.9282028043 1.3194039653 -38.1841919451
-0.1599114820
2200 2700
6 36.2625256395 0.5815001033 -50.8983620805
-0.0457311313
2700 3200
7 35.6573409828 0.7661686027 -34.6659363416
-0.0598170521
3200 3700
8 36.4180454205 0.4325957723 -44.1847062013
-0.0201521727
3700 4200
9 38.0776880528 -0.1529603974 -80.3118075101 0.0367938172 4200 4700
10 37.7602843891 -0.0499492999 -73.1011559910 0.0277685442 4700 5200
11 39.9738552178 -0.8545553355 -77.5759376892 0.1012534665 5200 6000
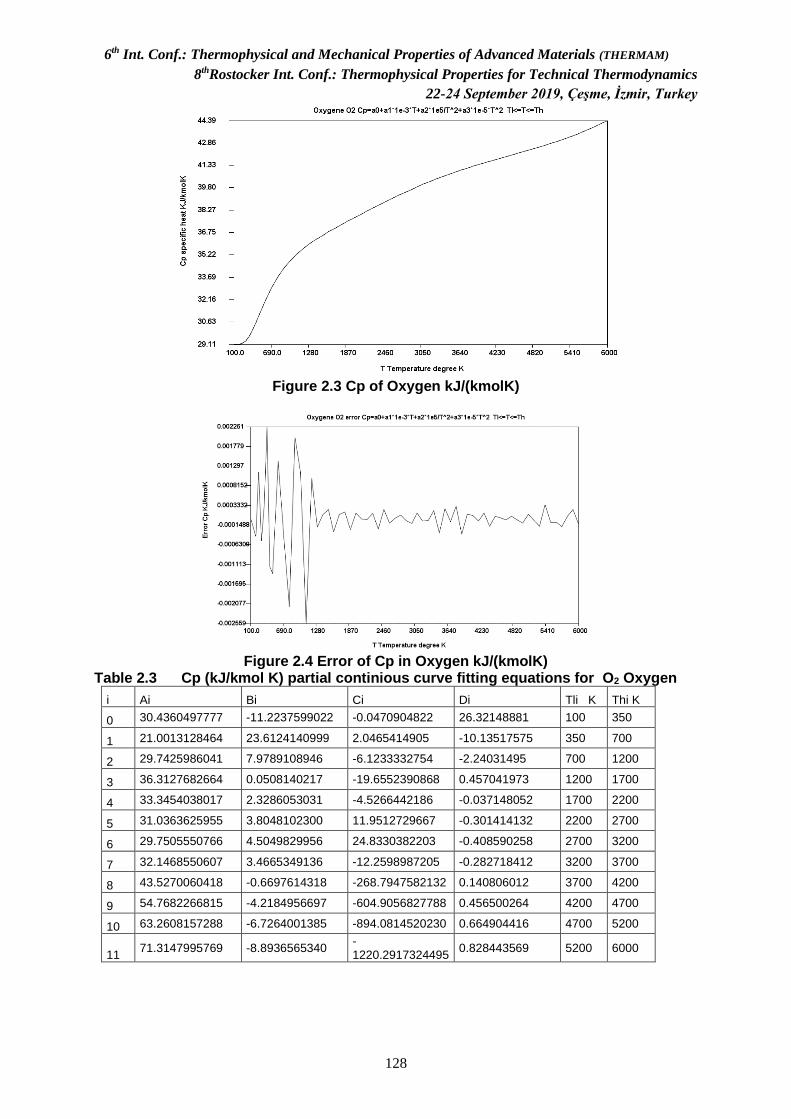
6th Int. Conf.: Thermophysical and Mechanical Properties of Advanced Materials (THERMAM)
8thRostocker Int. Conf.: Thermophysical Properties for Technical Thermodynamics
22-24 September 2019, Çeşme, İzmir, Turkey
128
Figure 2.3 Cp of Oxygen kJ/(kmolK)
Figure 2.4 Error of Cp in Oxygen kJ/(kmolK)
Table 2.3 Cp (kJ/kmol K) partial continious curve fitting equations for O2 Oxygen
i Ai Bi Ci Di Tli K Thi K
0 30.4360497777 -11.2237599022 -0.0470904822 26.32148881 100 350
1 21.0013128464 23.6124140999 2.0465414905 -10.13517575 350 700
2 29.7425986041 7.9789108946 -6.1233332754 -2.24031495 700 1200
3 36.3127682664 0.0508140217 -19.6552390868 0.457041973 1200 1700
4 33.3454038017 2.3286053031 -4.5266442186 -0.037148052 1700 2200
5 31.0363625955 3.8048102300 11.9512729667 -0.301414132 2200 2700
6 29.7505550766 4.5049829956 24.8330382203 -0.408590258 2700 3200
7 32.1468550607 3.4665349136 -12.2598987205 -0.282718412 3200 3700
8 43.5270060418 -0.6697614318 -268.7947582132 0.140806012 3700 4200
9 54.7682266815 -4.2184956697 -604.9056827788 0.456500264 4200 4700
10 63.2608157288 -6.7264001385 -894.0814520230 0.664904416 4700 5200
11 71.3147995769 -8.8936565340
-1220.2917324495
0.828443569 5200 6000

6th Int. Conf.: Thermophysical and Mechanical Properties of Advanced Materials (THERMAM)
8thRostocker Int. Conf.: Thermophysical Properties for Technical Thermodynamics
22-24 September 2019, Çeşme, İzmir, Turkey
129
Table 2.4 Cp (kJ/kmol K) partial continious curve fitting equations for Ar Argonne
i Ai Bi Ci Di Tli K Thi K
0 20.786 0.00E+00 0.00E+00 0.00E+00 100 6000
Figure 2.5 Cp of Methane kJ/(kmolK)
Figure 2.6 Error of Cp in Methane kJ/(kmolK)
Table 2.5 Cp (kJ/kmol K) partial continious curve fitting equations for CH4 Methane
i Ai Bi Ci Di Tli K Thi K
0 38.9123736504 -55.3874872142 -0.1624378115 150.9053147152 100 350
1 0.2017001921 103.1499706325 6.8244054323 -32.6647019325 350 700
2 11.5469381874 82.1956932915 -3.4532853748 -21.6049885321 700 1200
3 50.5726286784 38.2867248339 -96.5322057325 -7.6255082941 1200 1700
4 79.6812573368 14.8141853159 -230.3204126171 -2.2882055069 1700 2200
5 94.2035225106 5.8402863889 -343.8735028312 -0.7248723495 2200 2700
6 104.3572688164 0.9375681237 -473.8206804593 -0.0573582565 2700 3200
7 103.6301717202 1.3552795586 -469.7217838104 -0.1207924453 3200 3700
8 105.4581132228 0.6836699074 -509.3619167972 -0.0516420434 3700 4200
9 111.0178882010 -1.0114481078 -685.2166188470 0.0932934104 4200 4700
10 111.6872244691 -1.0507238460 -747.2766372898 0.0840648677 4700 5200
11 104.2567574929 0.8702029904 -413.4705005282 -0.0562039032 5200 6000
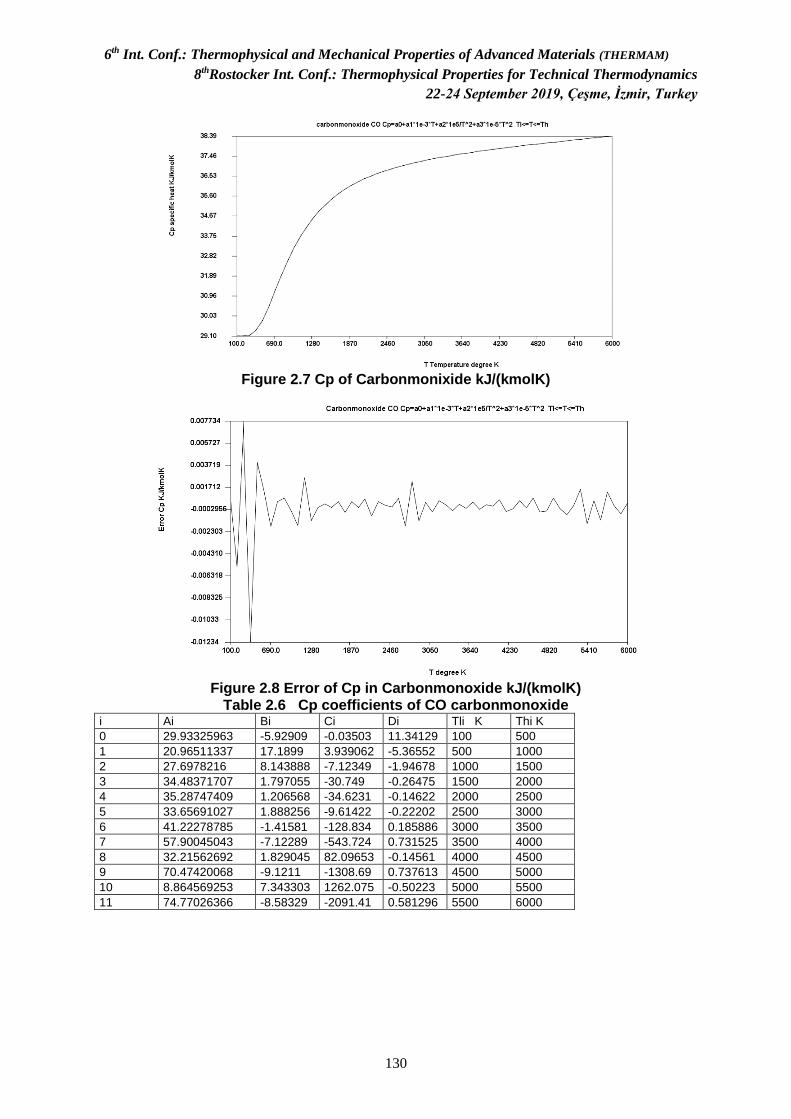
6th Int. Conf.: Thermophysical and Mechanical Properties of Advanced Materials (THERMAM)
8thRostocker Int. Conf.: Thermophysical Properties for Technical Thermodynamics
22-24 September 2019, Çeşme, İzmir, Turkey
130
Figure 2.7 Cp of Carbonmonixide kJ/(kmolK)
Figure 2.8 Error of Cp in Carbonmonoxide kJ/(kmolK)
Table 2.6 Cp coefficients of CO carbonmonoxide i Ai Bi Ci Di Tli K Thi K
0 29.93325963 -5.92909 -0.03503 11.34129 100 500
1 20.96511337 17.1899 3.939062 -5.36552 500 1000
2 27.6978216 8.143888 -7.12349 -1.94678 1000 1500
3 34.48371707 1.797055 -30.749 -0.26475 1500 2000
4 35.28747409 1.206568 -34.6231 -0.14622 2000 2500
5 33.65691027 1.888256 -9.61422 -0.22202 2500 3000
6 41.22278785 -1.41581 -128.834 0.185886 3000 3500
7 57.90045043 -7.12289 -543.724 0.731525 3500 4000
8 32.21562692 1.829045 82.09653 -0.14561 4000 4500
9 70.47420068 -9.1211 -1308.69 0.737613 4500 5000
10 8.864569253 7.343303 1262.075 -0.50223 5000 5500
11 74.77026366 -8.58329 -2091.41 0.581296 5500 6000

6th Int. Conf.: Thermophysical and Mechanical Properties of Advanced Materials (THERMAM)
8thRostocker Int. Conf.: Thermophysical Properties for Technical Thermodynamics
22-24 September 2019, Çeşme, İzmir, Turkey
131
Figure 2.9 Cp of Carbondioxide kJ/(kmolK)
Figure 2.10 Error of Cp in Carbondioxide kJ/(kmolK)
Table 2.7 Cp coefficients of CO2 carbondioxide i Ai Bi Ci Di Tli K Thi K
0 17.3008737 80.30037 0.439594 -52.0538 100 500
1 32.82713013 33.27479 -5.03948 -11.2926 500 1000
2 47.39290533 12.63049 -27.1382 -3.00224 1000 1500
3 58.83520998 1.982446 -67.5235 -0.19015 1500 2000
4 60.89376216 0.909562 -86.5155 -0.04998 2000 2500
5 70.41645838 -3.8184 -201.416 0.611812 2500 3000
6 56.10341643 2.640738 16.60137 -0.22012 3000 3500
7 54.2839019 3.114683 80.13276 -0.24933 3500 4000
8 61.79621452 0.571644 -116.852 -0.00616 4000 4500
9 139.3004807 -21.3796 -2977.62 1.742156 4500 5000
10 -39.70675714 25.80975 4655.538 -1.75674 5000 5500
11 54.71006516 1.988445 271.9708 -0.06775 5500 6000
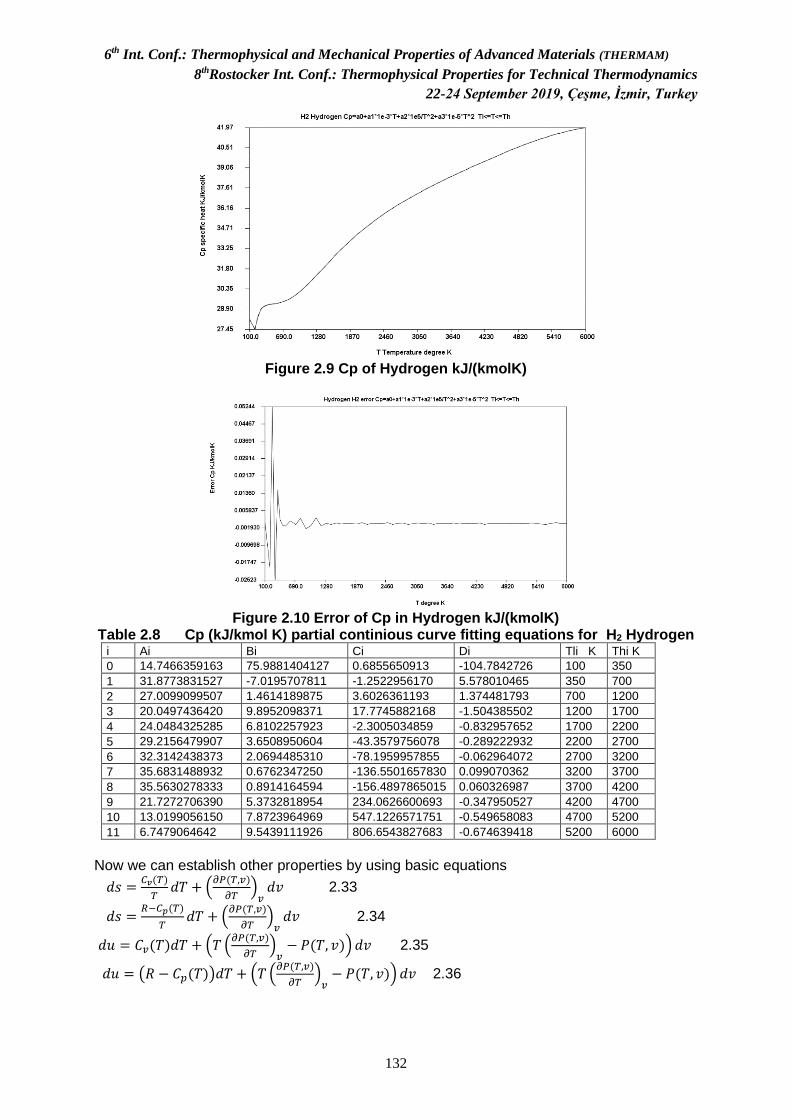
6th Int. Conf.: Thermophysical and Mechanical Properties of Advanced Materials (THERMAM)
8thRostocker Int. Conf.: Thermophysical Properties for Technical Thermodynamics
22-24 September 2019, Çeşme, İzmir, Turkey
132
Figure 2.9 Cp of Hydrogen kJ/(kmolK)
Figure 2.10 Error of Cp in Hydrogen kJ/(kmolK)
Table 2.8 Cp (kJ/kmol K) partial continious curve fitting equations for H2 Hydrogen i Ai Bi Ci Di Tli K Thi K
0 14.7466359163 75.9881404127 0.6855650913 -104.7842726 100 350
1 31.8773831527 -7.0195707811 -1.2522956170 5.578010465 350 700
2 27.0099099507 1.4614189875 3.6026361193 1.374481793 700 1200
3 20.0497436420 9.8952098371 17.7745882168 -1.504385502 1200 1700
4 24.0484325285 6.8102257923 -2.3005034859 -0.832957652 1700 2200
5 29.2156479907 3.6508950604 -43.3579756078 -0.289222932 2200 2700
6 32.3142438373 2.0694485310 -78.1959957855 -0.062964072 2700 3200
7 35.6831488932 0.6762347250 -136.5501657830 0.099070362 3200 3700
8 35.5630278333 0.8914164594 -156.4897865015 0.060326987 3700 4200
9 21.7272706390 5.3732818954 234.0626600693 -0.347950527 4200 4700
10 13.0199056150 7.8723964969 547.1226571751 -0.549658083 4700 5200
11 6.7479064642 9.5439111926 806.6543827683 -0.674639418 5200 6000
Now we can establish other properties by using basic equations
𝑑𝑠 =𝐶𝑣(𝑇)
𝑇𝑑𝑇 + (
𝜕𝑃(𝑇,𝑣)
𝜕𝑇)𝑣𝑑𝑣 2.33
𝑑𝑠 =𝑅−𝐶𝑝(𝑇)
𝑇𝑑𝑇 + (
𝜕𝑃(𝑇,𝑣)
𝜕𝑇)𝑣𝑑𝑣 2.34
𝑑𝑢 = 𝐶𝑣(𝑇)𝑑𝑇 + (𝑇 (𝜕𝑃(𝑇,𝑣)
𝜕𝑇)𝑣− 𝑃(𝑇, 𝑣)) 𝑑𝑣 2.35
𝑑𝑢 = (𝑅 − 𝐶𝑝(𝑇))𝑑𝑇 + (𝑇 (𝜕𝑃(𝑇,𝑣)
𝜕𝑇)𝑣− 𝑃(𝑇, 𝑣)) 𝑑𝑣 2.36
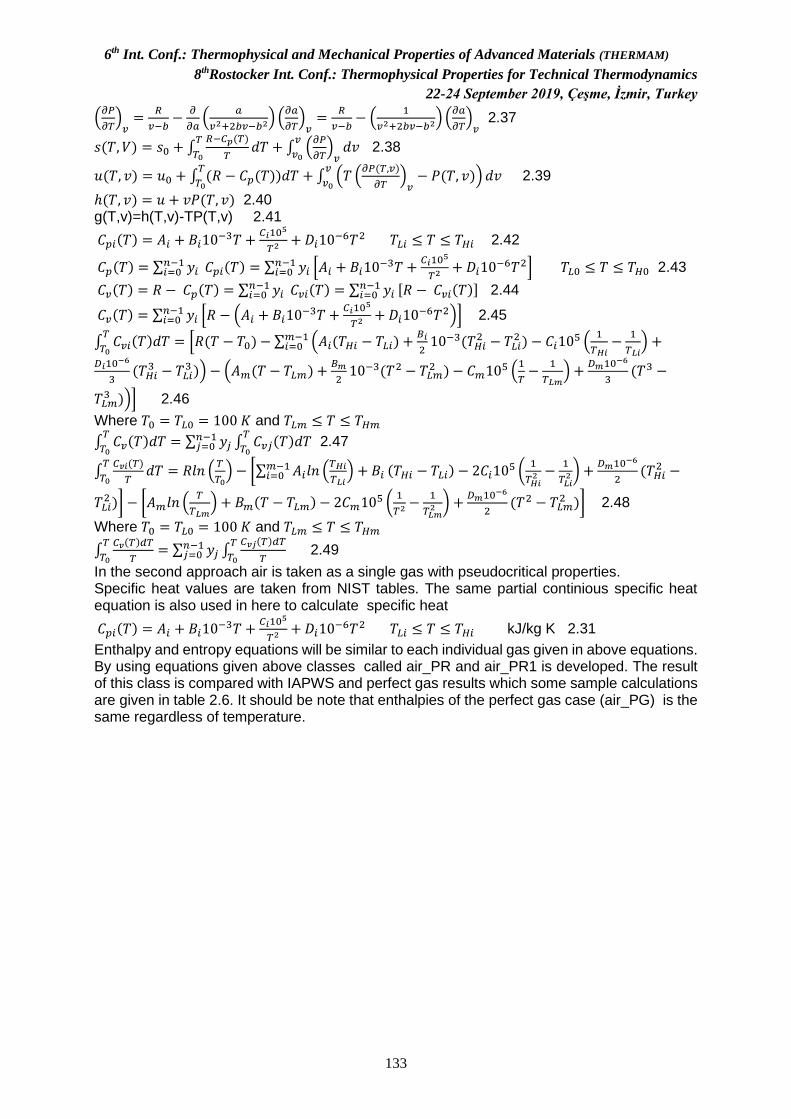
6th Int. Conf.: Thermophysical and Mechanical Properties of Advanced Materials (THERMAM)
8thRostocker Int. Conf.: Thermophysical Properties for Technical Thermodynamics
22-24 September 2019, Çeşme, İzmir, Turkey
133
(𝜕𝑃
𝜕𝑇)𝑣=
𝑅
𝑣−𝑏−
𝜕
𝜕𝑎(
𝑎
𝑣2+2𝑏𝑣−𝑏2) (
𝜕𝑎
𝜕𝑇)𝑣=
𝑅
𝑣−𝑏− (
1
𝑣2+2𝑏𝑣−𝑏2) (
𝜕𝑎
𝜕𝑇)𝑣 2.37
𝑠(𝑇, 𝑉) = 𝑠0 + ∫𝑅−𝐶𝑝(𝑇)
𝑇𝑑𝑇
𝑇
𝑇0+ ∫ (
𝜕𝑃
𝜕𝑇)𝑣𝑑𝑣
𝑣
𝑣0 2.38
𝑢(𝑇, 𝑣) = 𝑢0 + ∫ (𝑅 − 𝐶𝑝(𝑇))𝑑𝑇𝑇
𝑇0+ ∫ (𝑇 (
𝜕𝑃(𝑇,𝑣)
𝜕𝑇)𝑣− 𝑃(𝑇, 𝑣))
𝑣
𝑣0𝑑𝑣 2.39
ℎ(𝑇, 𝑣) = 𝑢 + 𝑣𝑃(𝑇, 𝑣) 2.40 g(T,v)=h(T,v)-TP(T,v) 2.41
𝐶𝑝𝑖(𝑇) = 𝐴𝑖 + 𝐵𝑖10−3𝑇 +
𝐶𝑖105
𝑇2+𝐷𝑖10
−6𝑇2 𝑇𝐿𝑖 ≤ 𝑇 ≤ 𝑇𝐻𝑖 2.42
𝐶𝑝(𝑇) = ∑ 𝑦𝑖𝑛−1𝑖=0 𝐶𝑝𝑖(𝑇) = ∑ 𝑦𝑖
𝑛−1𝑖=0 [𝐴𝑖 + 𝐵𝑖10
−3𝑇 +𝐶𝑖10
5
𝑇2+ 𝐷𝑖10
−6𝑇2] 𝑇𝐿0 ≤ 𝑇 ≤ 𝑇𝐻0 2.43
𝐶𝑣(𝑇) = 𝑅 − 𝐶𝑝(𝑇) = ∑ 𝑦𝑖𝑛−1𝑖=0 𝐶𝑣𝑖(𝑇) = ∑ 𝑦𝑖
𝑛−1𝑖=0 [𝑅 − 𝐶𝑣𝑖(𝑇)] 2.44
𝐶𝑣(𝑇) = ∑ 𝑦𝑖𝑛−1𝑖=0 [𝑅 − (𝐴𝑖 + 𝐵𝑖10
−3𝑇 +𝐶𝑖10
5
𝑇2+ 𝐷𝑖10
−6𝑇2)] 2.45
∫ 𝐶𝑣𝑖(𝑇)𝑑𝑇 = [𝑅(𝑇 − 𝑇0) − ∑ (𝐴𝑖(𝑇𝐻𝑖 − 𝑇𝐿𝑖) +𝐵𝑖
210−3(𝑇𝐻𝑖
2 − 𝑇𝐿𝑖2 ) − 𝐶𝑖10
5 (1
𝑇𝐻𝑖−
1
𝑇𝐿𝑖) +𝑚−1
𝑖=0𝑇
𝑇0𝐷𝑖10
−6
3(𝑇𝐻𝑖
3 − 𝑇𝐿𝑖3 )) − (𝐴𝑚(𝑇 − 𝑇𝐿𝑚) +
𝐵𝑚
210−3(𝑇2 − 𝑇𝐿𝑚
2 ) − 𝐶𝑚105 (
1
𝑇−
1
𝑇𝐿𝑚) +
𝐷𝑚10−6
3(𝑇3 −
𝑇𝐿𝑚3 ))] 2.46
Where 𝑇0 = 𝑇𝐿0 = 100 𝐾 and 𝑇𝐿𝑚 ≤ 𝑇 ≤ 𝑇𝐻𝑚
∫ 𝐶𝑣(𝑇)𝑑𝑇 = ∑ 𝑦𝑗𝑛−1𝑗=0 ∫ 𝐶𝑣𝑗(𝑇)𝑑𝑇
𝑇
𝑇0
𝑇
𝑇0 2.47
∫𝐶𝑣𝑖(𝑇)
𝑇𝑑𝑇 = 𝑅𝑙𝑛 (
𝑇
𝑇0) − [∑ 𝐴𝑖𝑙𝑛 (
𝑇𝐻𝑖
𝑇𝐿𝑖) + 𝐵𝑖
𝑚−1𝑖=0 (𝑇𝐻𝑖 − 𝑇𝐿𝑖) − 2𝐶𝑖10
5 (1
𝑇𝐻𝑖2 −
1
𝑇𝐿𝑖2) +
𝐷𝑚10−6
2(𝑇𝐻𝑖
2 −𝑇
𝑇0
𝑇𝐿𝑖2 )] − [𝐴𝑚𝑙𝑛 (
𝑇
𝑇𝐿𝑚) + 𝐵𝑚(𝑇 − 𝑇𝐿𝑚) − 2𝐶𝑚10
5 (1
𝑇2−
1
𝑇𝐿𝑚2 ) +
𝐷𝑚10−6
2(𝑇2 − 𝑇𝐿𝑚
2 )] 2.48
Where 𝑇0 = 𝑇𝐿0 = 100 𝐾 and 𝑇𝐿𝑚 ≤ 𝑇 ≤ 𝑇𝐻𝑚
∫𝐶𝑣(𝑇)𝑑𝑇
𝑇= ∑ 𝑦𝑗
𝑛−1𝑗=0 ∫
𝐶𝑣𝑗(𝑇)𝑑𝑇
𝑇
𝑇
𝑇0
𝑇
𝑇0 2.49
In the second approach air is taken as a single gas with pseudocritical properties. Specific heat values are taken from NIST tables. The same partial continious specific heat equation is also used in here to calculate specific heat
𝐶𝑝𝑖(𝑇) = 𝐴𝑖 + 𝐵𝑖10−3𝑇 +
𝐶𝑖105
𝑇2+𝐷𝑖10
−6𝑇2 𝑇𝐿𝑖 ≤ 𝑇 ≤ 𝑇𝐻𝑖 kJ/kg K 2.31
Enthalpy and entropy equations will be similar to each individual gas given in above equations. By using equations given above classes called air_PR and air_PR1 is developed. The result of this class is compared with IAPWS and perfect gas results which some sample calculations are given in table 2.6. It should be note that enthalpies of the perfect gas case (air_PG) is the same regardless of temperature.
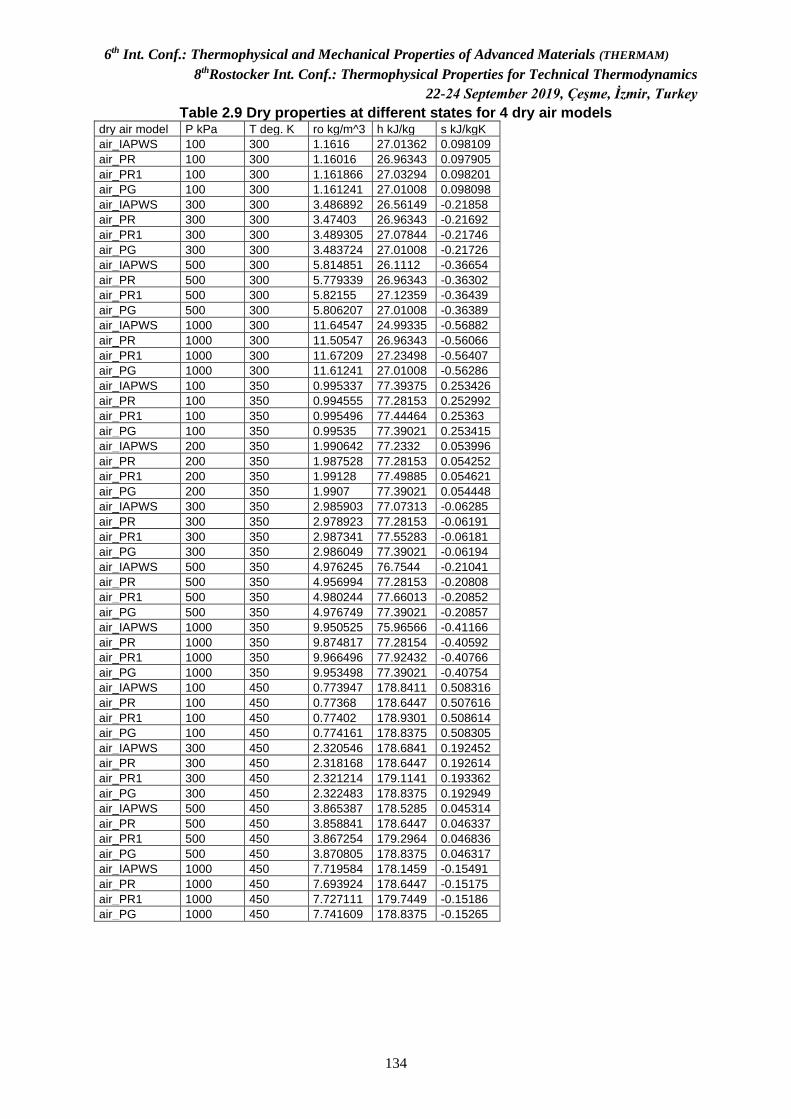
6th Int. Conf.: Thermophysical and Mechanical Properties of Advanced Materials (THERMAM)
8thRostocker Int. Conf.: Thermophysical Properties for Technical Thermodynamics
22-24 September 2019, Çeşme, İzmir, Turkey
134
Table 2.9 Dry properties at different states for 4 dry air models dry air model P kPa T deg. K ro kg/m^3 h kJ/kg s kJ/kgK
air_IAPWS 100 300 1.1616 27.01362 0.098109
air_PR 100 300 1.16016 26.96343 0.097905
air_PR1 100 300 1.161866 27.03294 0.098201
air_PG 100 300 1.161241 27.01008 0.098098
air_IAPWS 300 300 3.486892 26.56149 -0.21858
air_PR 300 300 3.47403 26.96343 -0.21692
air_PR1 300 300 3.489305 27.07844 -0.21746
air_PG 300 300 3.483724 27.01008 -0.21726
air_IAPWS 500 300 5.814851 26.1112 -0.36654
air_PR 500 300 5.779339 26.96343 -0.36302
air_PR1 500 300 5.82155 27.12359 -0.36439
air_PG 500 300 5.806207 27.01008 -0.36389
air_IAPWS 1000 300 11.64547 24.99335 -0.56882
air_PR 1000 300 11.50547 26.96343 -0.56066
air_PR1 1000 300 11.67209 27.23498 -0.56407
air_PG 1000 300 11.61241 27.01008 -0.56286
air_IAPWS 100 350 0.995337 77.39375 0.253426
air_PR 100 350 0.994555 77.28153 0.252992
air_PR1 100 350 0.995496 77.44464 0.25363
air_PG 100 350 0.99535 77.39021 0.253415
air_IAPWS 200 350 1.990642 77.2332 0.053996
air_PR 200 350 1.987528 77.28153 0.054252
air_PR1 200 350 1.99128 77.49885 0.054621
air_PG 200 350 1.9907 77.39021 0.054448
air_IAPWS 300 350 2.985903 77.07313 -0.06285
air_PR 300 350 2.978923 77.28153 -0.06191
air_PR1 300 350 2.987341 77.55283 -0.06181
air_PG 300 350 2.986049 77.39021 -0.06194
air_IAPWS 500 350 4.976245 76.7544 -0.21041
air_PR 500 350 4.956994 77.28153 -0.20808
air_PR1 500 350 4.980244 77.66013 -0.20852
air_PG 500 350 4.976749 77.39021 -0.20857
air_IAPWS 1000 350 9.950525 75.96566 -0.41166
air_PR 1000 350 9.874817 77.28154 -0.40592
air_PR1 1000 350 9.966496 77.92432 -0.40766
air_PG 1000 350 9.953498 77.39021 -0.40754
air_IAPWS 100 450 0.773947 178.8411 0.508316
air_PR 100 450 0.77368 178.6447 0.507616
air_PR1 100 450 0.77402 178.9301 0.508614
air_PG 100 450 0.774161 178.8375 0.508305
air_IAPWS 300 450 2.320546 178.6841 0.192452
air_PR 300 450 2.318168 178.6447 0.192614
air_PR1 300 450 2.321214 179.1141 0.193362
air_PG 300 450 2.322483 178.8375 0.192949
air_IAPWS 500 450 3.865387 178.5285 0.045314
air_PR 500 450 3.858841 178.6447 0.046337
air_PR1 500 450 3.867254 179.2964 0.046836
air_PG 500 450 3.870805 178.8375 0.046317
air_IAPWS 1000 450 7.719584 178.1459 -0.15491
air_PR 1000 450 7.693924 178.6447 -0.15175
air_PR1 1000 450 7.727111 179.7449 -0.15186
air_PG 1000 450 7.741609 178.8375 -0.15265

6th Int. Conf.: Thermophysical and Mechanical Properties of Advanced Materials (THERMAM)
8thRostocker Int. Conf.: Thermophysical Properties for Technical Thermodynamics
22-24 September 2019, Çeşme, İzmir, Turkey
135
Figure 2.9 Cp of Air as a single gas kJ/(kgK)
Figure 2.10 Error of Cp of air as a single gas kJ/(kmolK)
For the steam calculations class steamIAPWS_IF97 is used. Details of these equation of state is as follows: International Association for the Properties of Water and Steam(IAPWS) is developed a new set of equation of states for industrail use. This new set of equations are developed in 1997. Steam properties are given by 5 sets of equation of states, as shown in the Figure 2.11
Figure 2.11 Zone definitions for different sub EOS for IAPWS-IF97
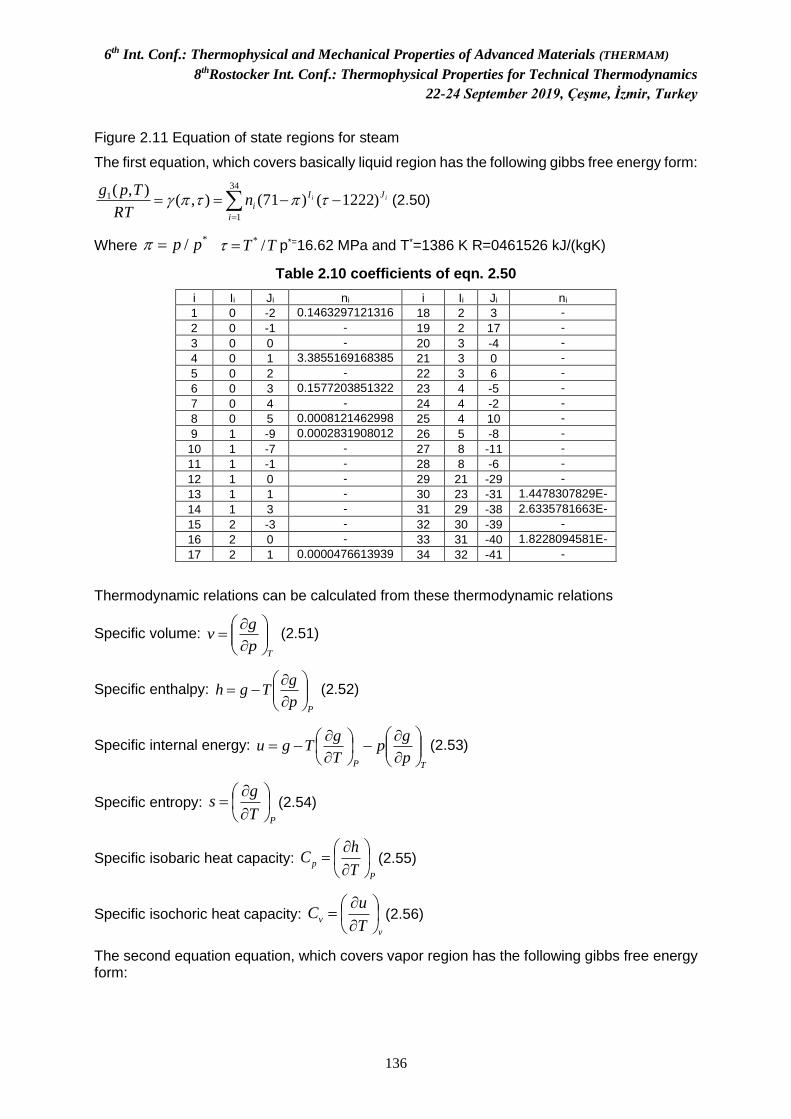
6th Int. Conf.: Thermophysical and Mechanical Properties of Advanced Materials (THERMAM)
8thRostocker Int. Conf.: Thermophysical Properties for Technical Thermodynamics
22-24 September 2019, Çeşme, İzmir, Turkey
136
Figure 2.11 Equation of state regions for steam
The first equation, which covers basically liquid region has the following gibbs free energy form:
=
−−==34
1
1 )1222()71(),(),(
i
JI
iiin
RT
Tpg (2.50)
Where */ pp= TT /*= p*=16.62 MPa and T*=1386 K R=0461526 kJ/(kgK)
Table 2.10 coefficients of eqn. 2.50
i Ii Ji ni i Ii Ji ni
1 0 -2 0.14632971213167
18 2 3 -4.4141845331E-
06 2 0 -1 -
0.84548187169114
19 2 17 -7.2694996298E-
16 3 0 0 -
3.75636036720400
20 3 -4 -3.1679644845E-
05 4 0 1 3.3855169168385
0 21 3 0 -
2.8270797985E-06
5 0 2 -0.9579196338787
2
22 3 6 -8.5205128120E-
10 6 0 3 0.1577203851322
8 23 4 -5 -
2.2425281908E-06
7 0 4 -0.0166164171995
0
24 4 -2 -6.5171222896E-
07 8 0 5 0.0008121462998
4 25 4 10 -
1.4341729938E-13
9 1 -9 0.00028319080124
26 5 -8 -4.0516996860E-
07 10 1 -7 -
0.00060706301566
27 8 -11 -1.2734301742E-
09 11 1 -1 -
0.01899006821842
28 8 -6 -1.7424871231E-
10 12 1 0 -
0.03252974877051
29 21 -29 -6.8762131296E-
19 13 1 1 -
0.02184171717541
30 23 -31 1.4478307829E-20 14 1 3 -
0.00005283835797
31 29 -38 2.6335781663E-23 15 2 -3 -
0.00047184321073
32 30 -39 -1.1947622640E-
23 16 2 0 -
0.00030001780793
33 31 -40 1.8228094581E-24 17 2 1 0.0000476613939
1 34 32 -41 -
9.3537087292E-26
Thermodynamic relations can be calculated from these thermodynamic relations
Specific volume:
Tp
gv
= (2.51)
Specific enthalpy:
Pp
gTgh
−= (2.52)
Specific internal energy:
TP p
gp
T
gTgu
−
−= (2.53)
Specific entropy: PT
gs
= (2.54)
Specific isobaric heat capacity: P
pT
hC
= (2.55)
Specific isochoric heat capacity: v
vT
uC
= (2.56)
The second equation equation, which covers vapor region has the following gibbs free energy form:
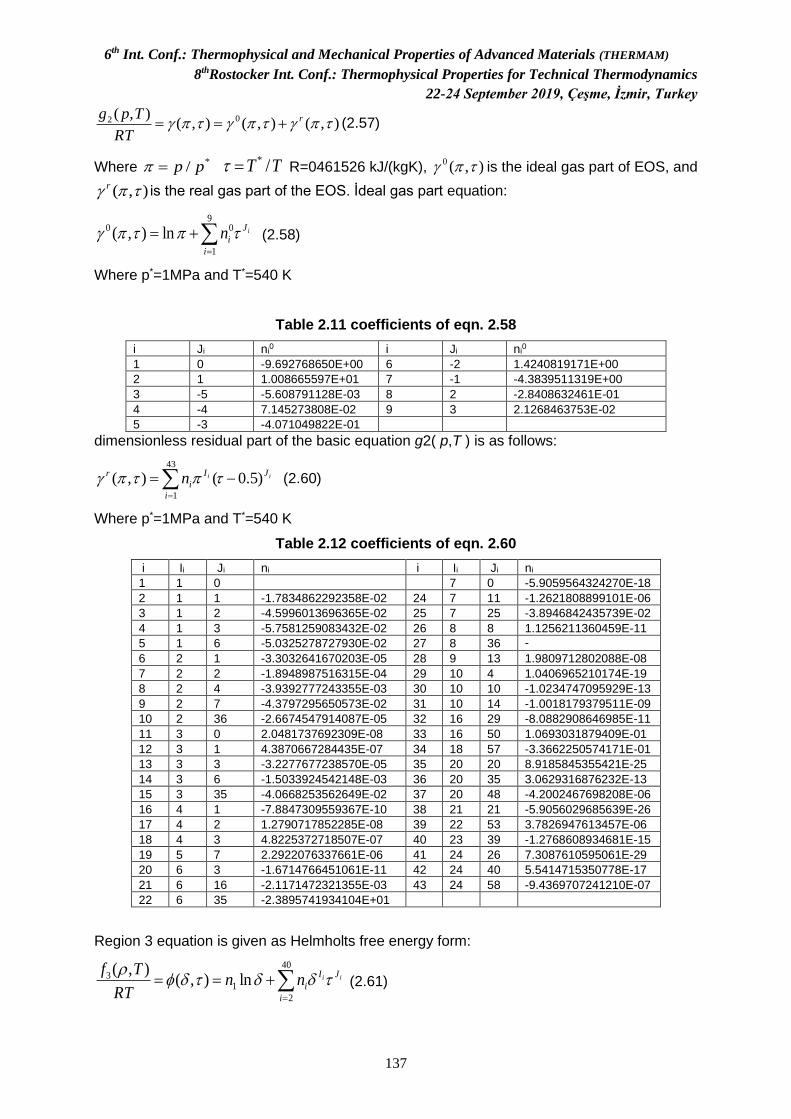
6th Int. Conf.: Thermophysical and Mechanical Properties of Advanced Materials (THERMAM)
8thRostocker Int. Conf.: Thermophysical Properties for Technical Thermodynamics
22-24 September 2019, Çeşme, İzmir, Turkey
137
),(),(),(),( 02 r
RT
Tpg+== (2.57)
Where */ pp= TT /*= R=0461526 kJ/(kgK), ),(0 is the ideal gas part of EOS, and
),( ris the real gas part of the EOS. İdeal gas part equation:
iJ
i
in =
+=9
1
00 ln),( (2.58)
Where p*=1MPa and T*=540 K
Table 2.11 coefficients of eqn. 2.58
i Ji ni0 i Ji ni
0
1 0 -9.692768650E+00 6 -2 1.4240819171E+00
2 1 1.008665597E+01 7 -1 -4.3839511319E+00
3 -5 -5.608791128E-03 8 2 -2.8408632461E-01
4 -4 7.145273808E-02 9 3 2.1268463753E-02
5 -3 -4.071049822E-01
dimensionless residual part of the basic equation g2( p,T ) is as follows:
ii J
i
I
i
r n )5.0(),(43
1
−= =
(2.60)
Where p*=1MPa and T*=540 K
Table 2.12 coefficients of eqn. 2.60
i Ii Ji ni i Ii Ji ni
1 1 0 7 0 -5.9059564324270E-18
2 1 1 -1.7834862292358E-02 24 7 11 -1.2621808899101E-06
3 1 2 -4.5996013696365E-02 25 7 25 -3.8946842435739E-02
4 1 3 -5.7581259083432E-02 26 8 8 1.1256211360459E-11
5 1 6 -5.0325278727930E-02 27 8 36 -8.2311340897998E+00 6 2 1 -3.3032641670203E-05 28 9 13 1.9809712802088E-08
7 2 2 -1.8948987516315E-04 29 10 4 1.0406965210174E-19
8 2 4 -3.9392777243355E-03 30 10 10 -1.0234747095929E-13
9 2 7 -4.3797295650573E-02 31 10 14 -1.0018179379511E-09
10 2 36 -2.6674547914087E-05 32 16 29 -8.0882908646985E-11
11 3 0 2.0481737692309E-08 33 16 50 1.0693031879409E-01
12 3 1 4.3870667284435E-07 34 18 57 -3.3662250574171E-01
13 3 3 -3.2277677238570E-05 35 20 20 8.9185845355421E-25
14 3 6 -1.5033924542148E-03 36 20 35 3.0629316876232E-13
15 3 35 -4.0668253562649E-02 37 20 48 -4.2002467698208E-06
16 4 1 -7.8847309559367E-10 38 21 21 -5.9056029685639E-26
17 4 2 1.2790717852285E-08 39 22 53 3.7826947613457E-06
18 4 3 4.8225372718507E-07 40 23 39 -1.2768608934681E-15
19 5 7 2.2922076337661E-06 41 24 26 7.3087610595061E-29
20 6 3 -1.6714766451061E-11 42 24 40 5.5414715350778E-17
21 6 16 -2.1171472321355E-03 43 24 58 -9.4369707241210E-07
22 6 35 -2.3895741934104E+01
Region 3 equation is given as Helmholts free energy form:
=
+==40
2
13 ln),(
),(
i
JI
iiinn
RT
Tf
(2.61)
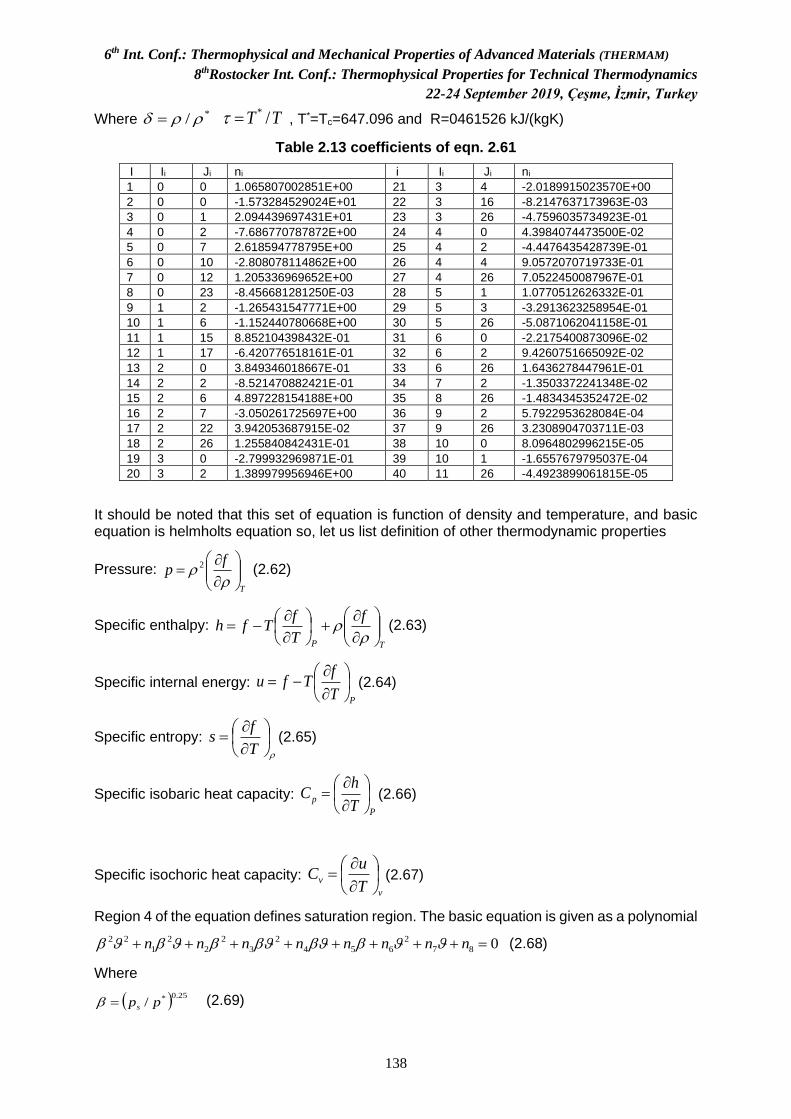
6th Int. Conf.: Thermophysical and Mechanical Properties of Advanced Materials (THERMAM)
8thRostocker Int. Conf.: Thermophysical Properties for Technical Thermodynamics
22-24 September 2019, Çeşme, İzmir, Turkey
138
Where */ = TT /*= , T*=Tc=647.096 and R=0461526 kJ/(kgK)
Table 2.13 coefficients of eqn. 2.61
I Ii Ji ni i Ii Ji ni
1 0 0 1.065807002851E+00 21 3 4 -2.0189915023570E+00
2 0 0 -1.573284529024E+01 22 3 16 -8.2147637173963E-03
3 0 1 2.094439697431E+01 23 3 26 -4.7596035734923E-01
4 0 2 -7.686770787872E+00 24 4 0 4.3984074473500E-02
5 0 7 2.618594778795E+00 25 4 2 -4.4476435428739E-01
6 0 10 -2.808078114862E+00 26 4 4 9.0572070719733E-01
7 0 12 1.205336969652E+00 27 4 26 7.0522450087967E-01
8 0 23 -8.456681281250E-03 28 5 1 1.0770512626332E-01
9 1 2 -1.265431547771E+00 29 5 3 -3.2913623258954E-01
10 1 6 -1.152440780668E+00 30 5 26 -5.0871062041158E-01
11 1 15 8.852104398432E-01 31 6 0 -2.2175400873096E-02
12 1 17 -6.420776518161E-01 32 6 2 9.4260751665092E-02
13 2 0 3.849346018667E-01 33 6 26 1.6436278447961E-01
14 2 2 -8.521470882421E-01 34 7 2 -1.3503372241348E-02
15 2 6 4.897228154188E+00 35 8 26 -1.4834345352472E-02
16 2 7 -3.050261725697E+00 36 9 2 5.7922953628084E-04
17 2 22 3.942053687915E-02 37 9 26 3.2308904703711E-03
18 2 26 1.255840842431E-01 38 10 0 8.0964802996215E-05
19 3 0 -2.799932969871E-01 39 10 1 -1.6557679795037E-04
20 3 2 1.389979956946E+00 40 11 26 -4.4923899061815E-05
It should be noted that this set of equation is function of density and temperature, and basic equation is helmholts equation so, let us list definition of other thermodynamic properties
Pressure:
T
fp
=
2 (2.62)
Specific enthalpy:
TP
f
T
fTfh
+
−=
(2.63)
Specific internal energy: PT
fTfu
−= (2.64)
Specific entropy:
=
T
fs (2.65)
Specific isobaric heat capacity: P
pT
hC
= (2.66)
Specific isochoric heat capacity: v
vT
uC
= (2.67)
Region 4 of the equation defines saturation region. The basic equation is given as a polynomial
087
2
654
2
3
2
2
2
1
22 =++++++++ nnnnnnnn (2.68)
Where
( ) 25.0*/ pps= (2.69)
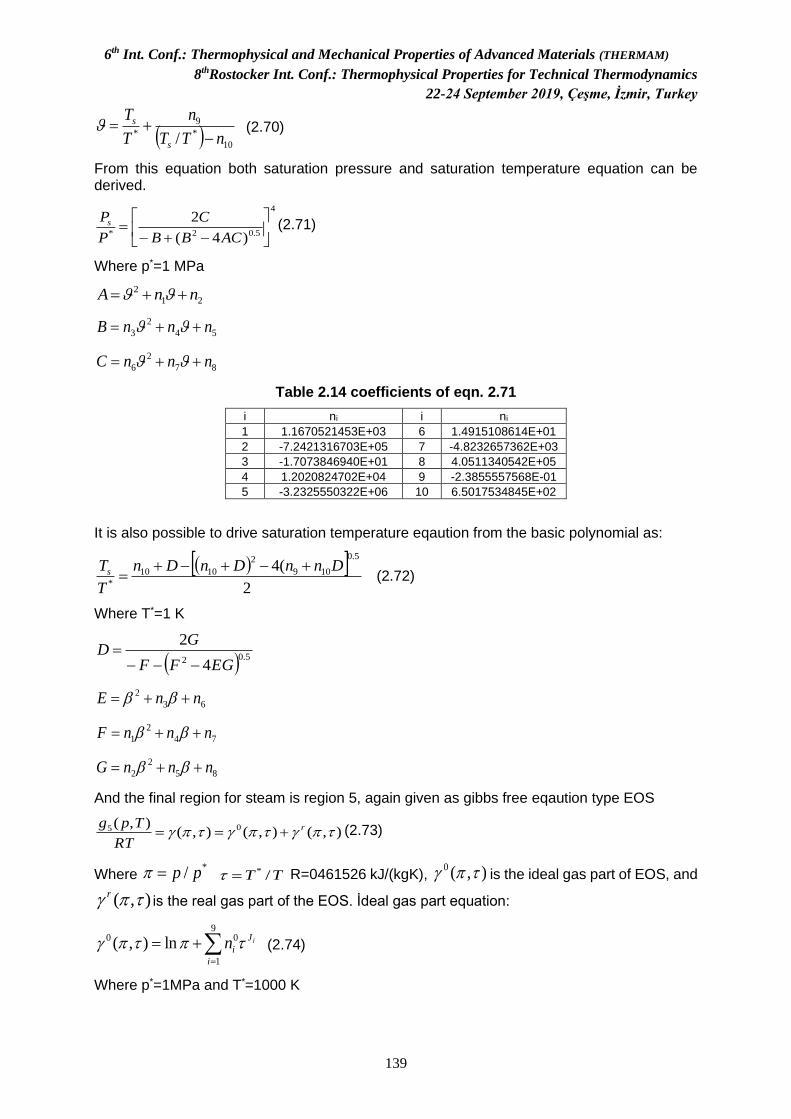
6th Int. Conf.: Thermophysical and Mechanical Properties of Advanced Materials (THERMAM)
8thRostocker Int. Conf.: Thermophysical Properties for Technical Thermodynamics
22-24 September 2019, Çeşme, İzmir, Turkey
139
( ) 10
*
9
* / nTT
n
T
T
s
s
−+= (2.70)
From this equation both saturation pressure and saturation temperature equation can be derived.
4
5.02* )4(
2
−+−=
ACBB
C
P
Ps (2.71)
Where p*=1 MPa
21
2 nnA ++=
54
2
3 nnnB ++=
87
2
6 nnnC ++=
Table 2.14 coefficients of eqn. 2.71
i ni i ni
1 1.1670521453E+03 6 1.4915108614E+01
2 -7.2421316703E+05 7 -4.8232657362E+03
3 -1.7073846940E+01 8 4.0511340542E+05
4 1.2020824702E+04 9 -2.3855557568E-01
5 -3.2325550322E+06 10 6.5017534845E+02
It is also possible to drive saturation temperature eqaution from the basic polynomial as:
( ) 2
(45.0
109
2
1010
*
DnnDnDn
T
Ts +−+−+= (2.72)
Where T*=1 K
( ) 5.02 4
2
EGFF
GD
−−−=
63
2 nnE ++=
74
2
1 nnnF ++=
85
2
2 nnnG ++=
And the final region for steam is region 5, again given as gibbs free eqaution type EOS
),(),(),(),( 05 r
RT
Tpg+== (2.73)
Where */ pp= TT /*= R=0461526 kJ/(kgK), ),(0 is the ideal gas part of EOS, and
),( ris the real gas part of the EOS. İdeal gas part equation:
iJ
i
in =
+=9
1
00 ln),( (2.74)
Where p*=1MPa and T*=1000 K
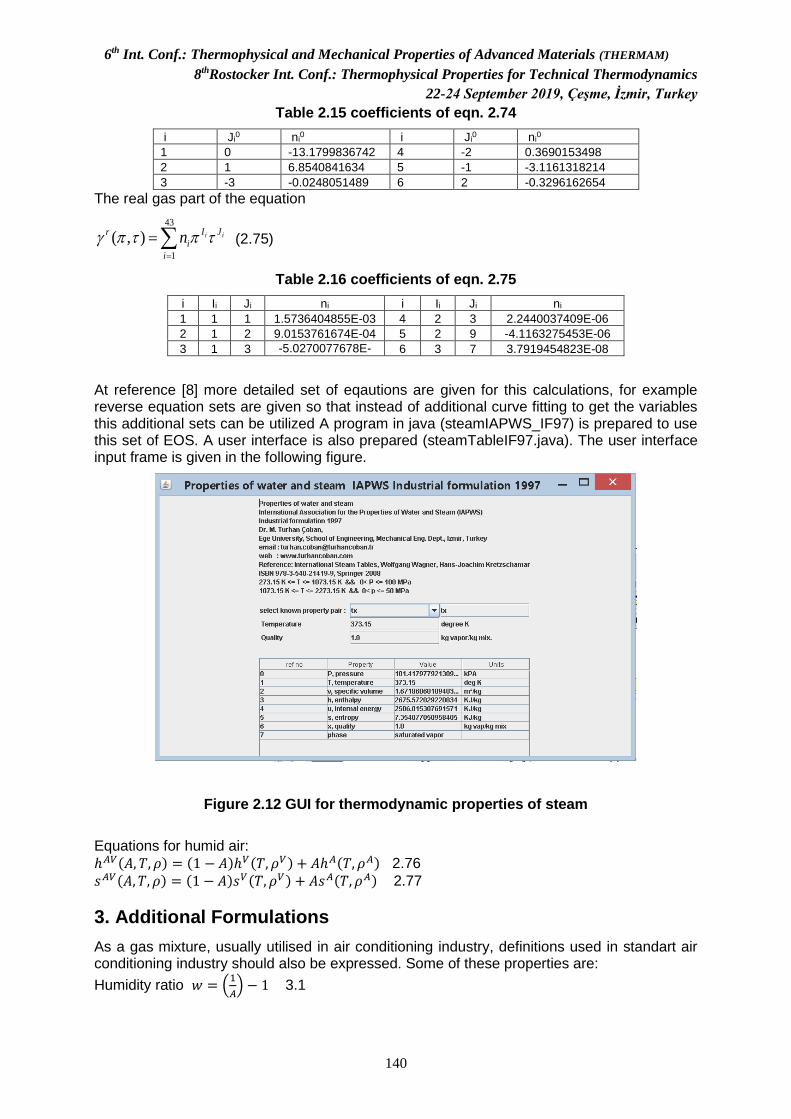
6th Int. Conf.: Thermophysical and Mechanical Properties of Advanced Materials (THERMAM)
8thRostocker Int. Conf.: Thermophysical Properties for Technical Thermodynamics
22-24 September 2019, Çeşme, İzmir, Turkey
140
Table 2.15 coefficients of eqn. 2.74
i Ji0 ni
0 i Ji0 ni
0
1 0 -13.1799836742 4 -2 0.3690153498
2 1 6.8540841634 5 -1 -3.1161318214
3 -3 -0.0248051489 6 2 -0.3296162654
The real gas part of the equation
ii J
i
I
i
r n =
=43
1
),( (2.75)
Table 2.16 coefficients of eqn. 2.75
i Ii Ji ni i Ii Ji ni
1 1 1 1.5736404855E-03 4 2 3 2.2440037409E-06
2 1 2 9.0153761674E-04 5 2 9 -4.1163275453E-06
3 1 3 -5.0270077678E-03
6 3 7 3.7919454823E-08
At reference [8] more detailed set of eqautions are given for this calculations, for example reverse equation sets are given so that instead of additional curve fitting to get the variables this additional sets can be utilized A program in java (steamIAPWS_IF97) is prepared to use this set of EOS. A user interface is also prepared (steamTableIF97.java). The user interface input frame is given in the following figure.
Figure 2.12 GUI for thermodynamic properties of steam
Equations for humid air:
ℎ𝐴𝑉(𝐴, 𝑇, 𝜌) = (1 − 𝐴)ℎ𝑉(𝑇, 𝜌𝑉) + 𝐴ℎ𝐴(𝑇, 𝜌𝐴) 2.76
𝑠𝐴𝑉(𝐴, 𝑇, 𝜌) = (1 − 𝐴)𝑠𝑉(𝑇, 𝜌𝑉) + 𝐴𝑠𝐴(𝑇, 𝜌𝐴) 2.77
3. Additional Formulations
As a gas mixture, usually utilised in air conditioning industry, definitions used in standart air conditioning industry should also be expressed. Some of these properties are:
Humidity ratio 𝑤 = (1
𝐴) − 1 3.1
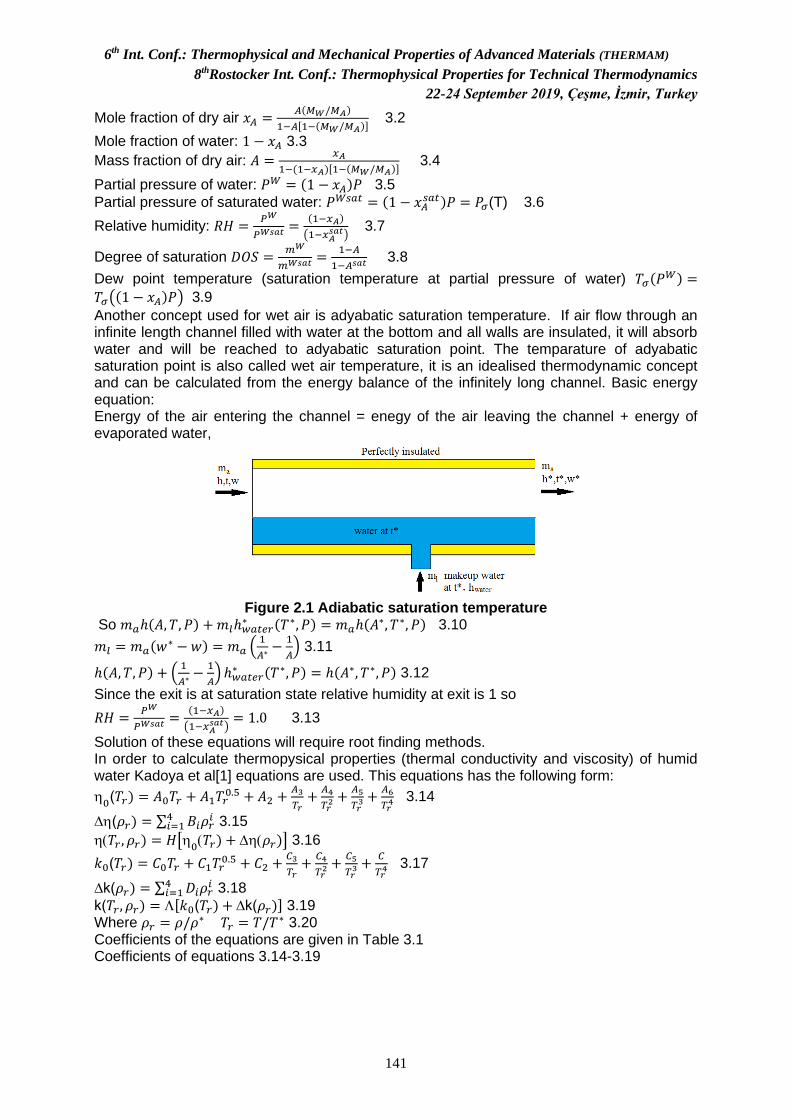
6th Int. Conf.: Thermophysical and Mechanical Properties of Advanced Materials (THERMAM)
8thRostocker Int. Conf.: Thermophysical Properties for Technical Thermodynamics
22-24 September 2019, Çeşme, İzmir, Turkey
141
Mole fraction of dry air 𝑥𝐴 =𝐴(𝑀𝑊/𝑀𝐴)
1−𝐴[1−(𝑀𝑊/𝑀𝐴)] 3.2
Mole fraction of water: 1 − 𝑥𝐴 3.3
Mass fraction of dry air: 𝐴 =𝑥𝐴
1−(1−𝑥𝐴)[1−(𝑀𝑊/𝑀𝐴)] 3.4
Partial pressure of water: 𝑃𝑊 = (1 − 𝑥𝐴)𝑃 3.5
Partial pressure of saturated water: 𝑃𝑊𝑠𝑎𝑡 = (1 − 𝑥𝐴𝑠𝑎𝑡)𝑃 = 𝑃𝜎(T) 3.6
Relative humidity: 𝑅𝐻 =𝑃𝑊
𝑃𝑊𝑠𝑎𝑡 =(1−𝑥𝐴)
(1−𝑥𝐴𝑠𝑎𝑡)
3.7
Degree of saturation 𝐷𝑂𝑆 =𝑚𝑊
𝑚𝑊𝑠𝑎𝑡 =1−𝐴
1−𝐴𝑠𝑎𝑡 3.8
Dew point temperature (saturation temperature at partial pressure of water) 𝑇𝜎(𝑃𝑊) =
𝑇𝜎((1 − 𝑥𝐴)𝑃) 3.9
Another concept used for wet air is adyabatic saturation temperature. If air flow through an infinite length channel filled with water at the bottom and all walls are insulated, it will absorb water and will be reached to adyabatic saturation point. The temparature of adyabatic saturation point is also called wet air temperature, it is an idealised thermodynamic concept and can be calculated from the energy balance of the infinitely long channel. Basic energy equation: Energy of the air entering the channel = enegy of the air leaving the channel + energy of evaporated water,
Figure 2.1 Adiabatic saturation temperature
So 𝑚𝑎ℎ(𝐴, 𝑇, 𝑃) +𝑚𝑙ℎ𝑤𝑎𝑡𝑒𝑟∗ (𝑇∗, 𝑃) = 𝑚𝑎ℎ(𝐴
∗, 𝑇∗, 𝑃) 3.10
𝑚𝑙 = 𝑚𝑎(𝑤∗ −𝑤) = 𝑚𝑎 (
1
𝐴∗−
1
𝐴) 3.11
ℎ(𝐴, 𝑇, 𝑃) + (1
𝐴∗−
1
𝐴) ℎ𝑤𝑎𝑡𝑒𝑟
∗ (𝑇∗, 𝑃) = ℎ(𝐴∗, 𝑇∗, 𝑃) 3.12
Since the exit is at saturation state relative humidity at exit is 1 so
𝑅𝐻 =𝑃𝑊
𝑃𝑊𝑠𝑎𝑡 =(1−𝑥𝐴)
(1−𝑥𝐴𝑠𝑎𝑡)
= 1.0 3.13
Solution of these equations will require root finding methods. In order to calculate thermopysical properties (thermal conductivity and viscosity) of humid water Kadoya et al[1] equations are used. This equations has the following form:
0(𝑇𝑟) = 𝐴0𝑇𝑟 + 𝐴1𝑇𝑟
0.5 + 𝐴2 +𝐴3
𝑇𝑟+𝐴4
𝑇𝑟2 +
𝐴5
𝑇𝑟3 +
𝐴6
𝑇𝑟4 3.14
∆(𝜌𝑟) = ∑ 𝐵𝑖𝜌𝑟𝑖4
𝑖=1 3.15
(𝑇𝑟, 𝜌𝑟) = 𝐻[0(𝑇𝑟) + (𝜌𝑟)] 3.16
𝑘0(𝑇𝑟) = 𝐶0𝑇𝑟 + 𝐶1𝑇𝑟0.5 + 𝐶2 +
𝐶3
𝑇𝑟+
𝐶4
𝑇𝑟2 +
𝐶5
𝑇𝑟3 +
𝐶
𝑇𝑟4 3.17
∆k(𝜌𝑟) = ∑ 𝐷𝑖𝜌𝑟𝑖4
𝑖=1 3.18
k(𝑇𝑟, 𝜌𝑟) = [𝑘0(𝑇𝑟) + ∆k(𝜌𝑟)] 3.19 Where 𝜌𝑟 = 𝜌/𝜌
∗ 𝑇𝑟 = 𝑇/𝑇∗ 3.20
Coefficients of the equations are given in Table 3.1 Coefficients of equations 3.14-3.19
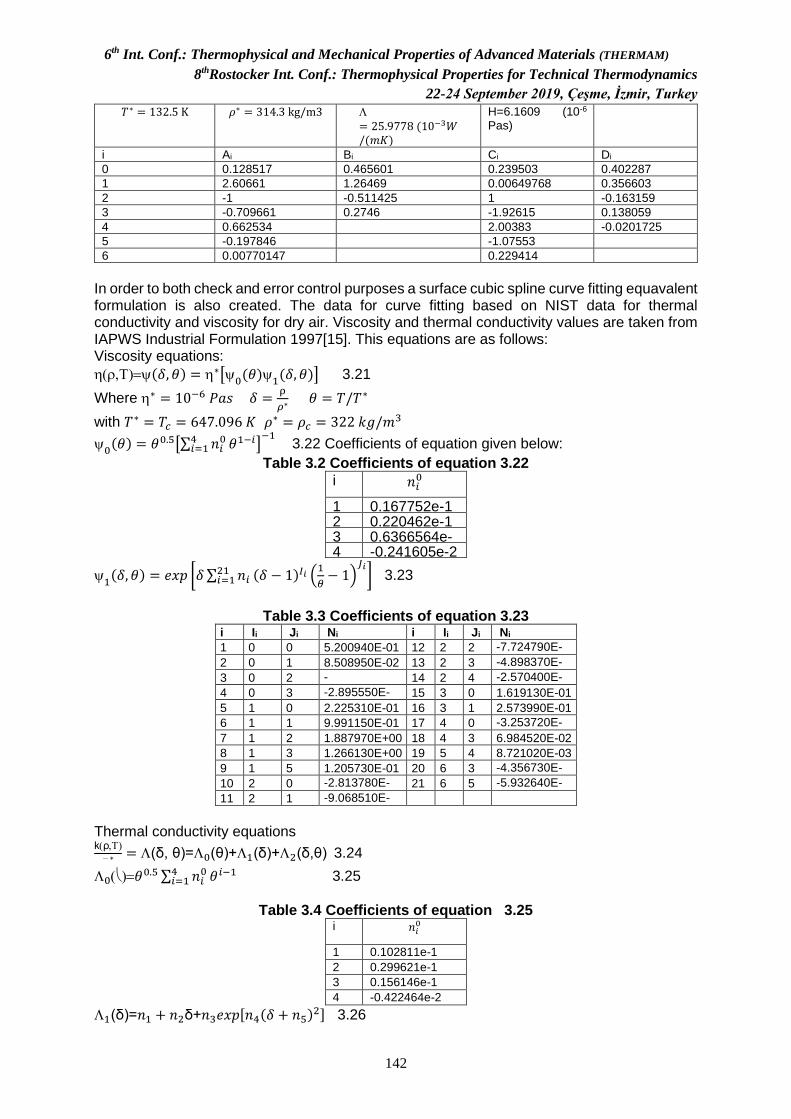
6th Int. Conf.: Thermophysical and Mechanical Properties of Advanced Materials (THERMAM)
8thRostocker Int. Conf.: Thermophysical Properties for Technical Thermodynamics
22-24 September 2019, Çeşme, İzmir, Turkey
142
𝑇∗ = 132.5 K 𝜌∗ = 314.3 kg/m3
= 25.9778 (10−3𝑊/(𝑚𝐾)
H=6.1609 (10-6 Pas)
i Ai Bi Ci Di
0 0.128517 0.465601 0.239503 0.402287
1 2.60661 1.26469 0.00649768 0.356603
2 -1 -0.511425 1 -0.163159
3 -0.709661 0.2746 -1.92615 0.138059
4 0.662534 2.00383 -0.0201725
5 -0.197846 -1.07553
6 0.00770147 0.229414
In order to both check and error control purposes a surface cubic spline curve fitting equavalent formulation is also created. The data for curve fitting based on NIST data for thermal conductivity and viscosity for dry air. Viscosity and thermal conductivity values are taken from IAPWS Industrial Formulation 1997[15]. This equations are as follows: Viscosity equations:
()=(𝛿, 𝜃) = ∗[0(𝜃)1(𝛿, 𝜃)] 3.21
Where ∗ = 10−6 𝑃𝑎𝑠 𝛿 =ρ
𝜌∗ 𝜃 = 𝑇/𝑇∗
with 𝑇∗ = 𝑇𝑐 = 647.096 𝐾 𝜌∗ = 𝜌𝑐 = 322 𝑘𝑔/𝑚3
0(𝜃) = 𝜃0.5[∑ 𝑛𝑖
04𝑖=1 𝜃1−𝑖]
−1 3.22 Coefficients of equation given below:
Table 3.2 Coefficients of equation 3.22
i 𝑛𝑖0
1 0.167752e-1 2 0.220462e-1 3 0.6366564e-
2 4 -0.241605e-2
1(𝛿, 𝜃) = 𝑒𝑥𝑝 [𝛿 ∑ 𝑛𝑖
21𝑖=1 (𝛿 − 1)𝐼𝑖 (
1
𝜃− 1)
𝐽𝑖] 3.23
Table 3.3 Coefficients of equation 3.23
i Ii Ji Ni i Ii Ji Ni
1 0 0 5.200940E-01 12 2 2 -7.724790E-01 2 0 1 8.508950E-02 13 2 3 -4.898370E-01 3 0 2 -
1.083740E+00 14 2 4 -2.570400E-
01 4 0 3 -2.895550E-01
15 3 0 1.619130E-01
5 1 0 2.225310E-01 16 3 1 2.573990E-01
6 1 1 9.991150E-01 17 4 0 -3.253720E-02 7 1 2 1.887970E+00 18 4 3 6.984520E-02
8 1 3 1.266130E+00 19 5 4 8.721020E-03
9 1 5 1.205730E-01 20 6 3 -4.356730E-03 10 2 0 -2.813780E-
01 21 6 5 -5.932640E-
04 11 2 1 -9.068510E-01
Thermal conductivity equations k(ρ)
∗ = (δ, θ)=0(θ)+1(δ)+2(δ,θ) 3.24
0()=𝜃0.5∑ 𝑛𝑖04
𝑖=1 𝜃𝑖−1 3.25
Table 3.4 Coefficients of equation 3.25
i 𝑛𝑖0
1 0.102811e-1
2 0.299621e-1
3 0.156146e-1
4 -0.422464e-2
1(δ)=𝑛1 + 𝑛2δ+𝑛3𝑒𝑥𝑝[𝑛4(𝛿 + 𝑛5)2] 3.26

6th Int. Conf.: Thermophysical and Mechanical Properties of Advanced Materials (THERMAM)
8thRostocker Int. Conf.: Thermophysical Properties for Technical Thermodynamics
22-24 September 2019, Çeşme, İzmir, Turkey
143
Table 3.5 Coefficients of equation 3.26
i ni
1 0.39707
2 0.400302
3 -0.171587e4
4 -0.239219e1
2(δ,θ)=(𝑛1𝜃−10 + 𝑛2)𝛿
1.8𝑒𝑥𝑝[𝑛2(1 − 𝛿2.8)] + 𝑛4𝐴𝛿
𝐵𝑒𝑥𝑝 [(𝐵
1+𝐵) (1 − 𝛿1+𝐵)] + 𝑛5𝑒𝑥𝑝[𝑛6𝜃
1.5 +
𝑛7𝛿−5] 3.27
𝐴(𝜃) = 2 + 𝑛8(∆𝜃)−0.6 3.27a
𝐵(𝜃) = {(∆𝜃)−1 𝑓𝑜𝑟 𝜃 ≥ 1
𝑛9(∆𝜃)−0.6 𝑓𝑜𝑟 𝜃 < 1
3.27b with ∆𝜃 = |𝜃 − 1| + 𝑛10
Table 3.6 Coefficients of equation 3.27 i ni i ni
1 7.013090E-02 6 -4.117170E+00
2 1.185200E-02 7 -6.179370E+00
3 6.428570E-01 8 8.229940E-02
4 1.699370E-03 9 1.009320E+01
5 -1.020000E+00 10 3.089760E-03
For mixing of dry air and water Wilke equation[6] will be used. This equation has the following form:
𝑚𝑖𝑥
=𝑥𝐴𝐴
𝑥𝐴+𝐴𝐴𝑉+
(1−𝑥𝐴)𝑉(1−𝑥𝐴)+𝑉𝑉𝐴
3.28 where
𝐴𝑉=
[1+(𝐴/𝑉)1/2
(𝑀𝑉/𝑀𝐴)1/4]
{8[1+(𝑀𝐴/𝑀𝑉)]}1/2 3.28a
𝑉𝐴=
𝐴𝑉𝑉/
𝐴(𝑀𝐴/𝑀𝑉) 3.28b
For thermal conductivity, similar equations will be used.
k𝑚𝑖𝑥 =𝑥𝐴k𝐴
𝑥𝐴+k𝐴 𝐴𝑉+
(1−𝑥𝐴)k𝑉
(1−𝑥𝐴)+k𝑉 𝑉𝐴 3.29 where
𝐴𝑉=
[1+(k𝐴/k𝑉)1/2(𝑀𝑉/𝑀𝐴)
1/4]
{8[1+(𝑀𝐴/𝑀𝑉)]}1/2 3.29a
𝑉𝐴=
𝐴𝑉𝑘𝑉/k𝐴(𝑀𝐴/𝑀𝑉) 3.29b
4. Computer development and error check
Several programs (classes) in java language to carry out this analysis. The list of program(class) names are given in Table 4.1
Table 4.1 Program lists
Class/interface name Source
Interface if_x Base interface general definition for function f(x)
Interface if_x Base interface general definition for function f0(x0,x1,x2..) f1(x0,x1,x2,..) …
steam Water-steam EOS Keenan, Keys,Hill, Moore 1969
steamIAPWS_IF97 Water-steam EOS International Steam Tables, Wolfgang Wagner, Hans-Joachim Kretzschamar ISBN 978-3-540-21419-9
steam_IAPWS95 The IAPWS Formulation 1995 for the Thermodynamic Properties of Ordinary Water Substance for General and Scientific Use W. Wagner and A. PruB J. Phys. Chem. Ref. Data, Vol. 31, No. 2, 2002
air_IAPWS Dry air EOS. Guideline on an Equation of State for Humid Air in Contact with Seawater and Ice, Consistent with the IAPWS Formulation 2008 for the Thermodynamic Properties of Seawater
air_PR Dry air EOS. using Peng Robinson EOS for mixtures The properties of Gases & Liquids Robert C. Reid et al., Janaf Tables (NIST data https://janaf.nist.gov/)
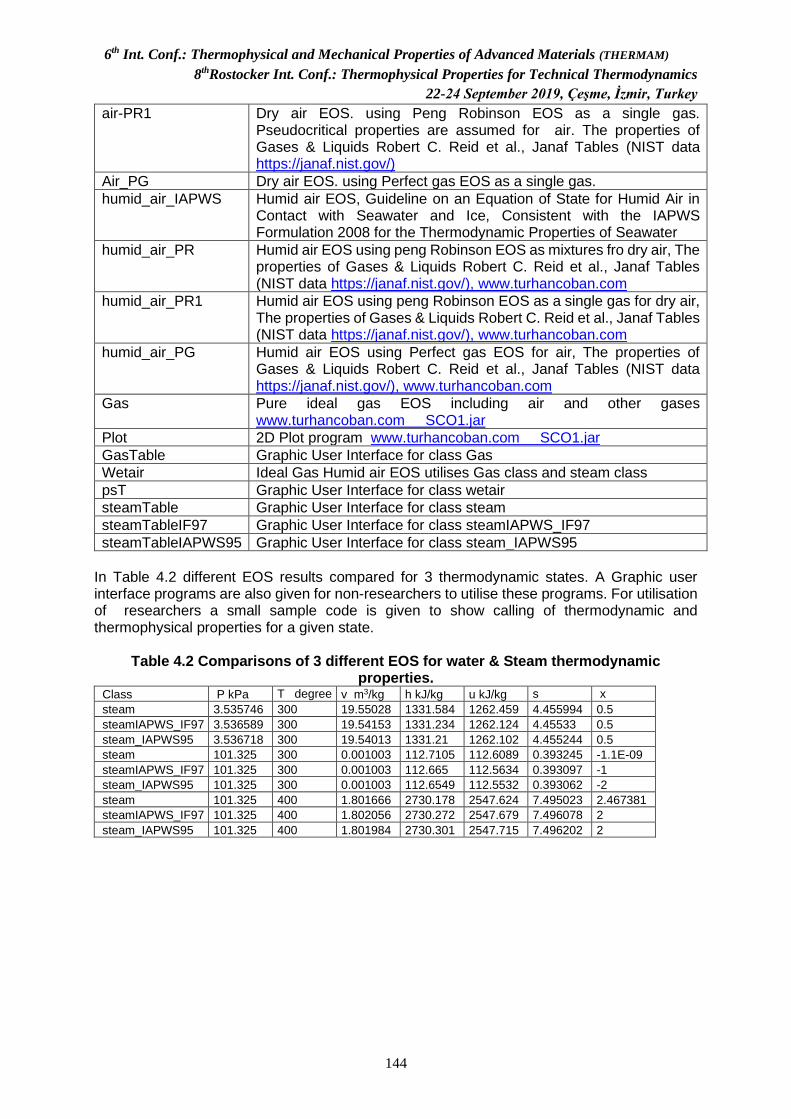
6th Int. Conf.: Thermophysical and Mechanical Properties of Advanced Materials (THERMAM)
8thRostocker Int. Conf.: Thermophysical Properties for Technical Thermodynamics
22-24 September 2019, Çeşme, İzmir, Turkey
144
air-PR1 Dry air EOS. using Peng Robinson EOS as a single gas. Pseudocritical properties are assumed for air. The properties of Gases & Liquids Robert C. Reid et al., Janaf Tables (NIST data https://janaf.nist.gov/)
Air_PG Dry air EOS. using Perfect gas EOS as a single gas.
humid_air_IAPWS Humid air EOS, Guideline on an Equation of State for Humid Air in Contact with Seawater and Ice, Consistent with the IAPWS Formulation 2008 for the Thermodynamic Properties of Seawater
humid_air_PR Humid air EOS using peng Robinson EOS as mixtures fro dry air, The properties of Gases & Liquids Robert C. Reid et al., Janaf Tables (NIST data https://janaf.nist.gov/), www.turhancoban.com
humid_air_PR1 Humid air EOS using peng Robinson EOS as a single gas for dry air, The properties of Gases & Liquids Robert C. Reid et al., Janaf Tables (NIST data https://janaf.nist.gov/), www.turhancoban.com
humid_air_PG Humid air EOS using Perfect gas EOS for air, The properties of Gases & Liquids Robert C. Reid et al., Janaf Tables (NIST data https://janaf.nist.gov/), www.turhancoban.com
Gas Pure ideal gas EOS including air and other gases www.turhancoban.com SCO1.jar
Plot 2D Plot program www.turhancoban.com SCO1.jar
GasTable Graphic User Interface for class Gas
Wetair Ideal Gas Humid air EOS utilises Gas class and steam class
psT Graphic User Interface for class wetair
steamTable Graphic User Interface for class steam
steamTableIF97 Graphic User Interface for class steamIAPWS_IF97
steamTableIAPWS95 Graphic User Interface for class steam_IAPWS95
In Table 4.2 different EOS results compared for 3 thermodynamic states. A Graphic user interface programs are also given for non-researchers to utilise these programs. For utilisation of researchers a small sample code is given to show calling of thermodynamic and thermophysical properties for a given state.
Table 4.2 Comparisons of 3 different EOS for water & Steam thermodynamic properties.
Class P kPa T degree K
v m3/kg h kJ/kg u kJ/kg s kJ/(kgK)
x kg vap/kg steam 3.535746 300 19.55028 1331.584 1262.459 4.455994 0.5
steamIAPWS_IF97 3.536589 300 19.54153 1331.234 1262.124 4.45533 0.5
steam_IAPWS95 3.536718 300 19.54013 1331.21 1262.102 4.455244 0.5
steam 101.325 300 0.001003 112.7105 112.6089 0.393245 -1.1E-09
steamIAPWS_IF97 101.325 300 0.001003 112.665 112.5634 0.393097 -1
steam_IAPWS95 101.325 300 0.001003 112.6549 112.5532 0.393062 -2
steam 101.325 400 1.801666 2730.178 2547.624 7.495023 2.467381
steamIAPWS_IF97 101.325 400 1.802056 2730.272 2547.679 7.496078 2
steam_IAPWS95 101.325 400 1.801984 2730.301 2547.715 7.496202 2
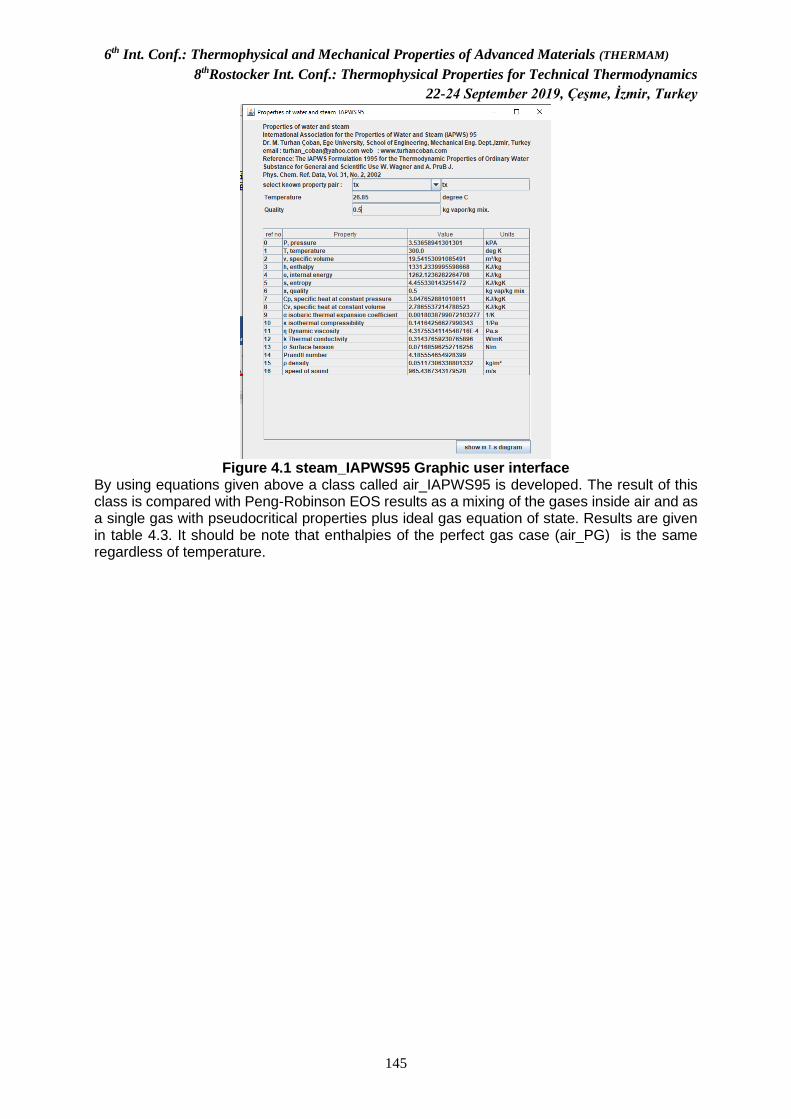
6th Int. Conf.: Thermophysical and Mechanical Properties of Advanced Materials (THERMAM)
8thRostocker Int. Conf.: Thermophysical Properties for Technical Thermodynamics
22-24 September 2019, Çeşme, İzmir, Turkey
145
Figure 4.1 steam_IAPWS95 Graphic user interface
By using equations given above a class called air_IAPWS95 is developed. The result of this class is compared with Peng-Robinson EOS results as a mixing of the gases inside air and as a single gas with pseudocritical properties plus ideal gas equation of state. Results are given in table 4.3. It should be note that enthalpies of the perfect gas case (air_PG) is the same regardless of temperature.
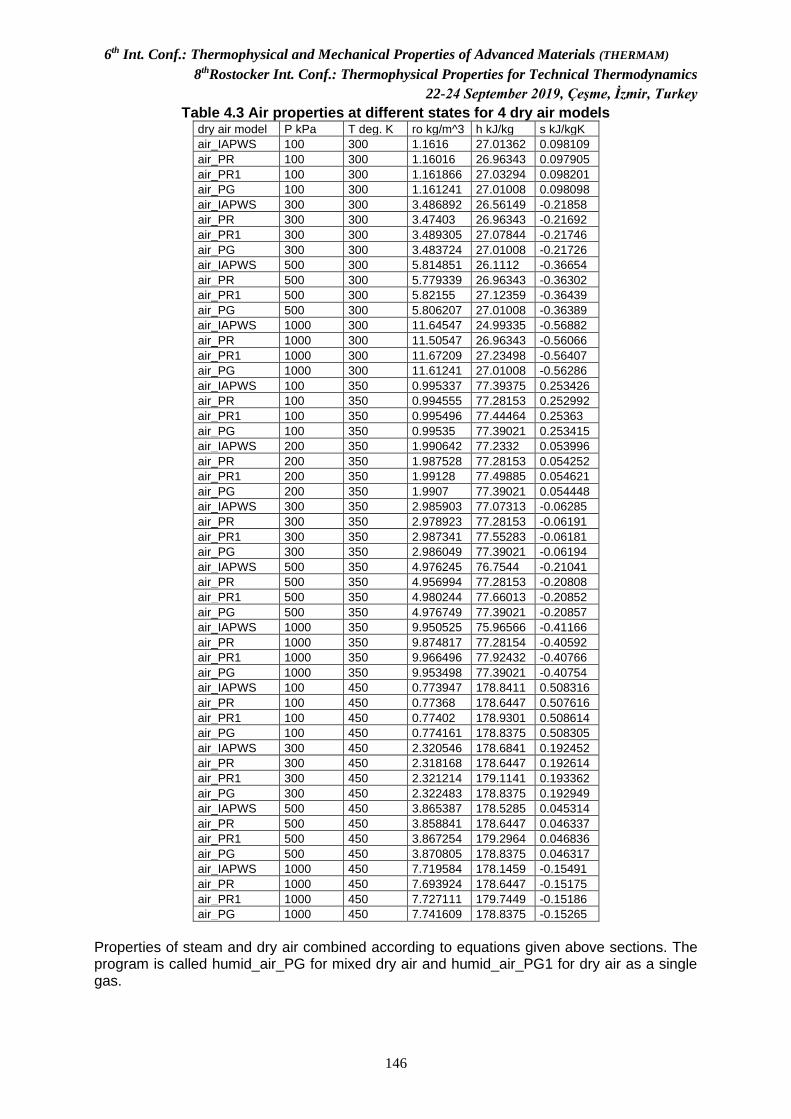
6th Int. Conf.: Thermophysical and Mechanical Properties of Advanced Materials (THERMAM)
8thRostocker Int. Conf.: Thermophysical Properties for Technical Thermodynamics
22-24 September 2019, Çeşme, İzmir, Turkey
146
Table 4.3 Air properties at different states for 4 dry air models dry air model P kPa T deg. K ro kg/m^3 h kJ/kg s kJ/kgK
air_IAPWS 100 300 1.1616 27.01362 0.098109
air_PR 100 300 1.16016 26.96343 0.097905
air_PR1 100 300 1.161866 27.03294 0.098201
air_PG 100 300 1.161241 27.01008 0.098098
air_IAPWS 300 300 3.486892 26.56149 -0.21858
air_PR 300 300 3.47403 26.96343 -0.21692
air_PR1 300 300 3.489305 27.07844 -0.21746
air_PG 300 300 3.483724 27.01008 -0.21726
air_IAPWS 500 300 5.814851 26.1112 -0.36654
air_PR 500 300 5.779339 26.96343 -0.36302
air_PR1 500 300 5.82155 27.12359 -0.36439
air_PG 500 300 5.806207 27.01008 -0.36389
air_IAPWS 1000 300 11.64547 24.99335 -0.56882
air_PR 1000 300 11.50547 26.96343 -0.56066
air_PR1 1000 300 11.67209 27.23498 -0.56407
air_PG 1000 300 11.61241 27.01008 -0.56286
air_IAPWS 100 350 0.995337 77.39375 0.253426
air_PR 100 350 0.994555 77.28153 0.252992
air_PR1 100 350 0.995496 77.44464 0.25363
air_PG 100 350 0.99535 77.39021 0.253415
air_IAPWS 200 350 1.990642 77.2332 0.053996
air_PR 200 350 1.987528 77.28153 0.054252
air_PR1 200 350 1.99128 77.49885 0.054621
air_PG 200 350 1.9907 77.39021 0.054448
air_IAPWS 300 350 2.985903 77.07313 -0.06285
air_PR 300 350 2.978923 77.28153 -0.06191
air_PR1 300 350 2.987341 77.55283 -0.06181
air_PG 300 350 2.986049 77.39021 -0.06194
air_IAPWS 500 350 4.976245 76.7544 -0.21041
air_PR 500 350 4.956994 77.28153 -0.20808
air_PR1 500 350 4.980244 77.66013 -0.20852
air_PG 500 350 4.976749 77.39021 -0.20857
air_IAPWS 1000 350 9.950525 75.96566 -0.41166
air_PR 1000 350 9.874817 77.28154 -0.40592
air_PR1 1000 350 9.966496 77.92432 -0.40766
air_PG 1000 350 9.953498 77.39021 -0.40754
air_IAPWS 100 450 0.773947 178.8411 0.508316
air_PR 100 450 0.77368 178.6447 0.507616
air_PR1 100 450 0.77402 178.9301 0.508614
air_PG 100 450 0.774161 178.8375 0.508305
air_IAPWS 300 450 2.320546 178.6841 0.192452
air_PR 300 450 2.318168 178.6447 0.192614
air_PR1 300 450 2.321214 179.1141 0.193362
air_PG 300 450 2.322483 178.8375 0.192949
air_IAPWS 500 450 3.865387 178.5285 0.045314
air_PR 500 450 3.858841 178.6447 0.046337
air_PR1 500 450 3.867254 179.2964 0.046836
air_PG 500 450 3.870805 178.8375 0.046317
air_IAPWS 1000 450 7.719584 178.1459 -0.15491
air_PR 1000 450 7.693924 178.6447 -0.15175
air_PR1 1000 450 7.727111 179.7449 -0.15186
air_PG 1000 450 7.741609 178.8375 -0.15265
Properties of steam and dry air combined according to equations given above sections. The program is called humid_air_PG for mixed dry air and humid_air_PG1 for dry air as a single gas.
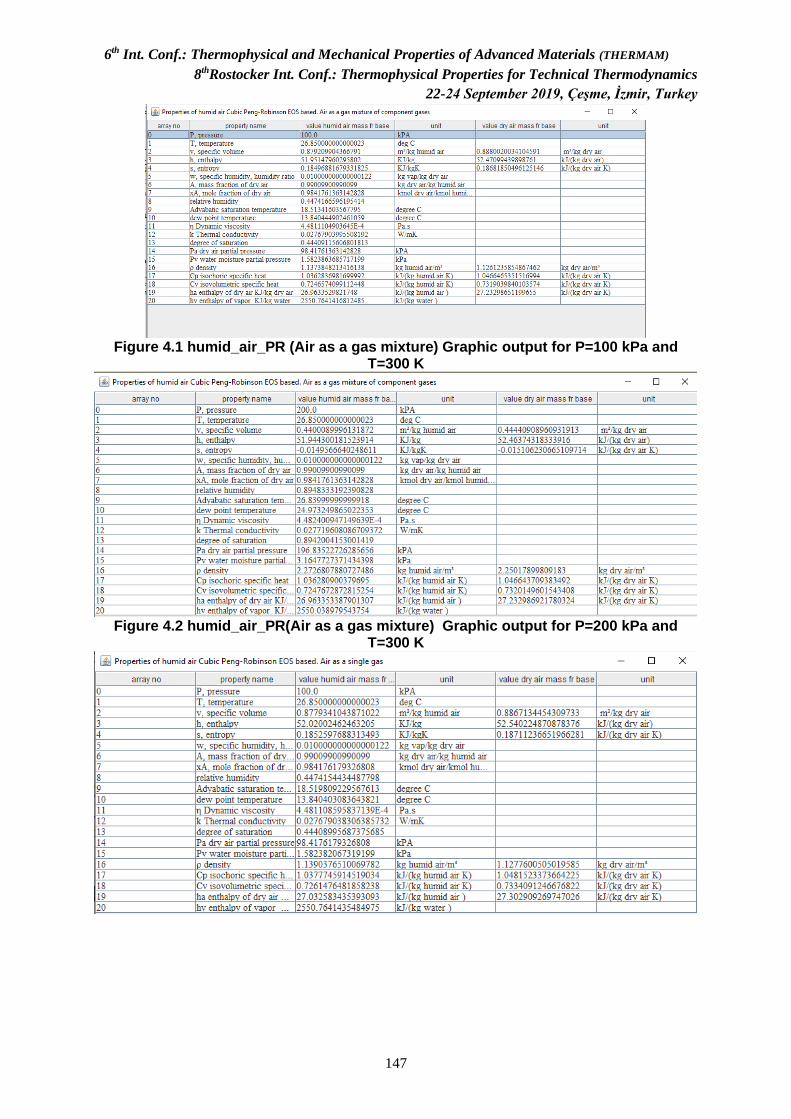
6th Int. Conf.: Thermophysical and Mechanical Properties of Advanced Materials (THERMAM)
8thRostocker Int. Conf.: Thermophysical Properties for Technical Thermodynamics
22-24 September 2019, Çeşme, İzmir, Turkey
147
Figure 4.1 humid_air_PR (Air as a gas mixture) Graphic output for P=100 kPa and
T=300 K
Figure 4.2 humid_air_PR(Air as a gas mixture) Graphic output for P=200 kPa and
T=300 K
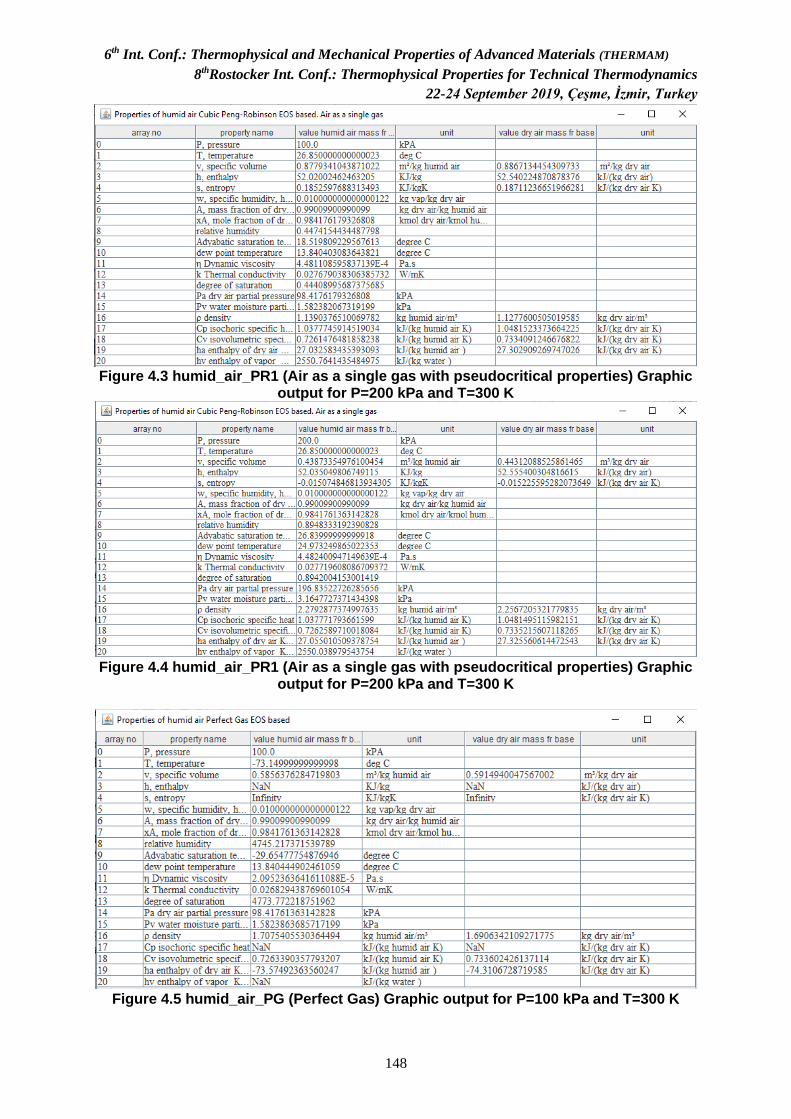
6th Int. Conf.: Thermophysical and Mechanical Properties of Advanced Materials (THERMAM)
8thRostocker Int. Conf.: Thermophysical Properties for Technical Thermodynamics
22-24 September 2019, Çeşme, İzmir, Turkey
148
Figure 4.3 humid_air_PR1 (Air as a single gas with pseudocritical properties) Graphic
output for P=200 kPa and T=300 K
Figure 4.4 humid_air_PR1 (Air as a single gas with pseudocritical properties) Graphic
output for P=200 kPa and T=300 K
Figure 4.5 humid_air_PG (Perfect Gas) Graphic output for P=100 kPa and T=300 K
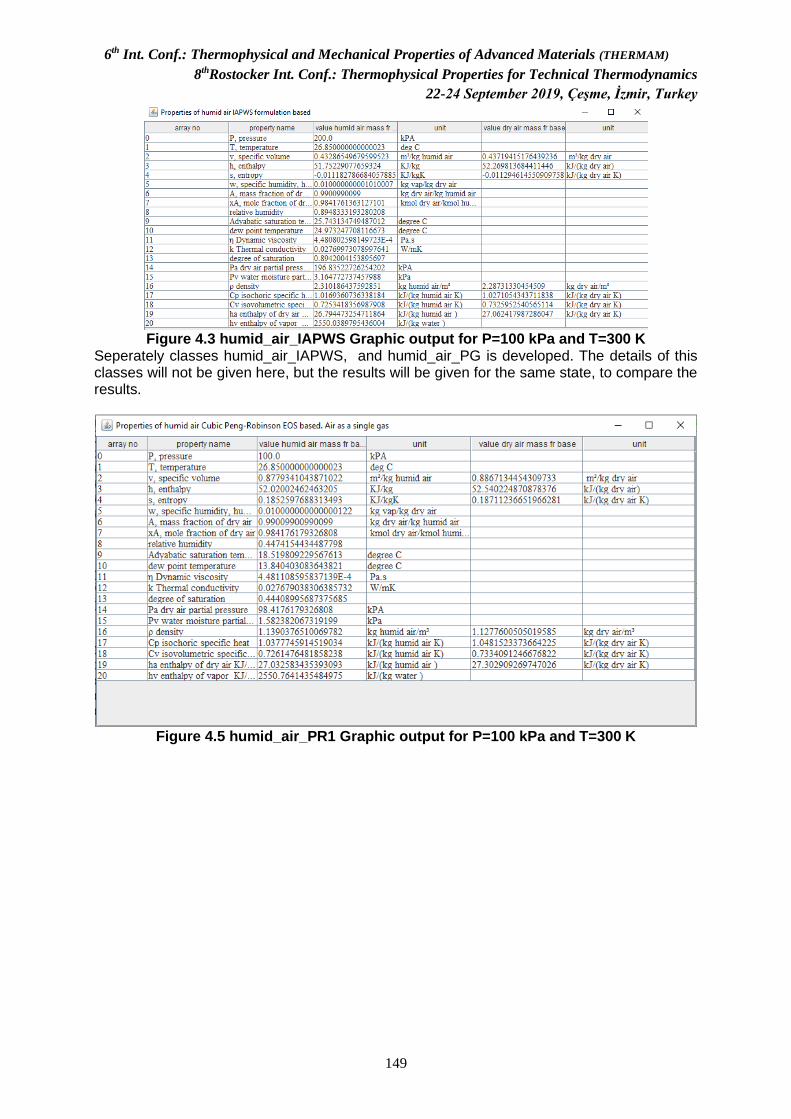
6th Int. Conf.: Thermophysical and Mechanical Properties of Advanced Materials (THERMAM)
8thRostocker Int. Conf.: Thermophysical Properties for Technical Thermodynamics
22-24 September 2019, Çeşme, İzmir, Turkey
149
Figure 4.3 humid_air_IAPWS Graphic output for P=100 kPa and T=300 K
Seperately classes humid_air_IAPWS, and humid_air_PG is developed. The details of this classes will not be given here, but the results will be given for the same state, to compare the results.
Figure 4.5 humid_air_PR1 Graphic output for P=100 kPa and T=300 K
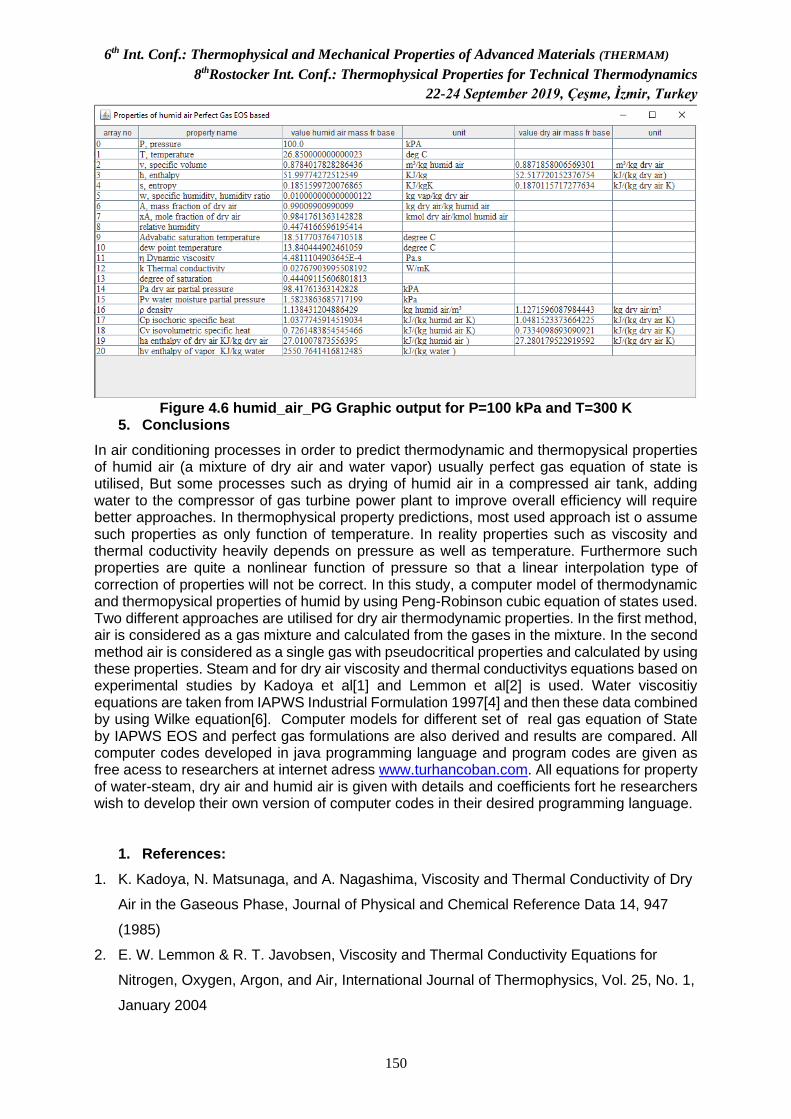
6th Int. Conf.: Thermophysical and Mechanical Properties of Advanced Materials (THERMAM)
8thRostocker Int. Conf.: Thermophysical Properties for Technical Thermodynamics
22-24 September 2019, Çeşme, İzmir, Turkey
150
Figure 4.6 humid_air_PG Graphic output for P=100 kPa and T=300 K
5. Conclusions
In air conditioning processes in order to predict thermodynamic and thermopysical properties of humid air (a mixture of dry air and water vapor) usually perfect gas equation of state is utilised, But some processes such as drying of humid air in a compressed air tank, adding water to the compressor of gas turbine power plant to improve overall efficiency will require better approaches. In thermophysical property predictions, most used approach ist o assume such properties as only function of temperature. In reality properties such as viscosity and thermal coductivity heavily depends on pressure as well as temperature. Furthermore such properties are quite a nonlinear function of pressure so that a linear interpolation type of correction of properties will not be correct. In this study, a computer model of thermodynamic and thermopysical properties of humid by using Peng-Robinson cubic equation of states used. Two different approaches are utilised for dry air thermodynamic properties. In the first method, air is considered as a gas mixture and calculated from the gases in the mixture. In the second method air is considered as a single gas with pseudocritical properties and calculated by using these properties. Steam and for dry air viscosity and thermal conductivitys equations based on experimental studies by Kadoya et al[1] and Lemmon et al[2] is used. Water viscositiy equations are taken from IAPWS Industrial Formulation 1997[4] and then these data combined by using Wilke equation[6]. Computer models for different set of real gas equation of State by IAPWS EOS and perfect gas formulations are also derived and results are compared. All computer codes developed in java programming language and program codes are given as free acess to researchers at internet adress www.turhancoban.com. All equations for property of water-steam, dry air and humid air is given with details and coefficients fort he researchers wish to develop their own version of computer codes in their desired programming language.
1. References:
1. K. Kadoya, N. Matsunaga, and A. Nagashima, Viscosity and Thermal Conductivity of Dry
Air in the Gaseous Phase, Journal of Physical and Chemical Reference Data 14, 947
(1985)
2. E. W. Lemmon & R. T. Javobsen, Viscosity and Thermal Conductivity Equations for
Nitrogen, Oxygen, Argon, and Air, International Journal of Thermophysics, Vol. 25, No. 1,
January 2004
6th Int. Conf.: Thermophysical and Mechanical Properties of Advanced Materials (THERMAM)
8thRostocker Int. Conf.: Thermophysical Properties for Technical Thermodynamics
22-24 September 2019, Çeşme, İzmir, Turkey
151
3. The International Association for the Properties of Water and Steam, Revised Relase on
the IAPWS Formulation 1995 for the Thermodynamic Properties of Ordinary Water
Substance for General and Scientific Use, Prague, Check Republic 2018, IAPWS R6-
95(2018)
4. The International Association for the Properties of Water and Steam, Revised Relase on
the IAPWS Industrial Formulation 1997 for the Thermodynamic Properties of Water and
Steam, Lucerne, Switzerland, August 2007, IAPWS R7(2012)
5. J.R. Cooper, R. B. Dooley, The International Association for the Properties of Water and
Steam, Guideline on an Equation of State for Humid Air in Contact with SeaWater and
Ice, Consistent with the IAPWS Formulation 2008 for the Thermodynamic Properties of
SeaWater
6. Robert C. Reid, John M. Prausnitz, Bruce E. Poling, The Properties of Gases & Liquids,
Fourth Edition, McGraw-Hill ISBN 0-07-051799-1
7. Bruce E. Poling, John M Prausnitz, John P. O’connel, The Properties of Gases & Liquids,
5th edition, 2004, McGraw-Hill ISBN 0-07-051799-1, ISBN-10: 0070116822
8. Numerical Thermodynamics, M. Turhan Coban, www.turhancoban.com
9. Ian H. Bell, Jorrit Wronski, Sylvain Quailin, and Vincent Lemort, Pure and Pseudo-pure
Fluid Thermophysical Property Evaluation and the Open-Source Thermophysical
Property Library CoolProp, Ind Eng Chem Res 2014 Feb 12;53(6) 2498-2508 DOI
10.1021/ie4033999
10. S. G. S. Beirao, A.P.C. Ribeiro, M.J.V. Lourenço, F.J.V. Santos, C.A. Nieto de Castro,
Thermal Conductivity of Humid Air, Int J Thermopys (2012) 33:1686-1703, DOI
10.1007/s10765-012-1245-5
11. Xiaoyan Ji, Thermodynamic properties of Humid air and their application in advanced
power generation cycles, Doctaral Thesis in Chemical Engineering, KTH Royal Institute
of Technology, Energy Processes, SE-100 44 Stockholm, Sweeden, ISBN 91-7178-437-
3
12. R. Feistel, D.G. Wright, D.R. Jackett, K.Miyagawa, J.H. Reissmann, W. Wagner, U.
Overhoff, C. Guder, A. Feistal, G.M. Marion, Numerical implementation and ocenographic
application oft he thermodynamic potentials of liquid water, water vapor, ice, sewater and
humid air- Part 1: Background and equations, Ocean Sci., 6, 663-677,2010 DOI
10.5194/os-6-633-2010
13. R. Feistel, D.G. Wright, D.R. Jackett, K.Miyagawa, J.H. Reissmann, W. Wagner, U.
Overhoff, C. Guder, A. Feistal, G.M. Marion, Numerical implementation and ocenographic
application oft he thermodynamic potentials of liquid water, water vapor, ice, sewater and
6th Int. Conf.: Thermophysical and Mechanical Properties of Advanced Materials (THERMAM)
8thRostocker Int. Conf.: Thermophysical Properties for Technical Thermodynamics
22-24 September 2019, Çeşme, İzmir, Turkey
152
humid air- Part 2: The library routines, Ocean Sci., 6, 695-718,2010 DOI 10.5194/os-6-
695-2010
14. Simeen Sattar, Thermodynamics of Mixing Real Gases, Jornal of Chemical Education
Vol. 77 No 10 October 2000
15. Wolgang Wagner, Hans-Joachim Kretzschmar, International Steam Tables, Properties of
water and steam based on industrial formulation IAPWS-IF97, Springer, ISBN 978-3-540-
21419-9, DOI 10.1007/978-3-540-74234-0
16. Joseph H. Keenan, Frederick G. Keyes, Philip G. Hill, Joan G. Moore, Steam Tables
Thermodynamic properties of Water incuding vapor, liquid and solid phases, Wiley-
Interscience, ISBN 0-471-04210-2
17. E. W. Lemmon1, and R. T Jacobsen , "Viscosity and Thermal Conductivity Equations for
Nitrogen, Oxygen, Argon, and Air", International Journal of Thermophysics, Vol. 25, No.
1, January 2004 (© 2004)
6th Int. Conf.: Thermophysical and Mechanical Properties of Advanced Materials (THERMAM)
8thRostocker Int. Conf.: Thermophysical Properties for Technical Thermodynamics
22-24 September 2019, Çeşme, İzmir, Turkey
153
Thermodynamic and Thermophysical Properties of Humid Exhaust Gases by Using Cubic Peng-Robinson EOS
Mustafa Turhan COBAN
School of Engineering, Department of Mechanical Engineering; Ege University, Bornova, Izmir, Turkey [email protected]
www.turhancoban.com
Keywords: Thermodynamic properties of humid exhaust gases , Peng-Robison EOS, cubic EOS, thermodynamic properties of dry exhaust gases, thermophysial properties of humid exhaust gases 1. Abstract In humid exhaust gas thermodynamic property calculations, it is usually ideal gas EOS is used. The basic reason for this is simplicity of using ideal gas EOS. For some applications with athmospheric pressures it might be sufficient, but when applications with higher pressure zones are considered error level will increased. An equation of state with better accuracy of thermodynamic properties will be required for extreme cases. In this study Peng-Robinson equation of state will be used to establish computer programs in java language to calculate properties of humid exhaust gas. Cubic equation of states are basically defining the gas phase, with a better accuracy compare to ideal gas EOS and can be defined accurate enough results for high pressure applications as well. It is also possible to solve inverse equation v(T,P) by using cubic form oft he equation. Avoiding of more complex iterative root finding process, makes cubic equations a desirable EOS selection. For pure gases Peng-Robinson EOS defined as a function of critical properties and accentric factor. In order to mix gases Harstad, Miller, and Bellan EOSs for gas mixtures, particularly of PR-EOS. In this study the mixing rule proposed by Miller et al. is used to extend the PR equation of state to mixtures. Definition of humid exhaust mixture should be given by the user. All common exhaust gas components such as carbondioxide, carbonmonoxide, nitrogen, oxygene etc. is defined in the program and their properties can be calculated by using user defined name and mixture ratios. Mixing of dry exhaust gas and water is carried out by using PR EOS mixing, but water properties such as saturation vapor pressure, saturation liquid and vapor densities are taken by utilizing IAPWS-97 water and steam industrial EOS. Basic thermodynamic and heat-mass transfer equations are used to define properties such as dew point temperature, adyabatic saturation temperature and wet bulb temperature. In order to calculate thermophysical properties such as viscosity, thermal conductivity etc. combination of cubic surface splines and Wilke, Reichenberg… methods are used. Results of developed equations are compared with ideal gas humid exhaust gas equations. A Graphical user interphase is also developed. All the program codes are listed as free access in www.turhancoban.com adress. As subprograms properties of properties of dry air can also be calculated by using this set of PR EOS programs. All the codes are developed in java programming language. 2. Formulation of the equation of state We will consider two different form Peng-Robinson cubic equation of states in this paper. In the first one air will be treated as a gas mixture. In the second approach air will be considers as a pure gas. In this case pseudocritical properties will be used to calculate air as a single gas Peng-Robinson cubic equation of state. Cubic Equation of State has a general form of equation
𝑃 =𝑅𝑇
𝑣−𝑏−
𝑎
𝑣2+𝑢𝑏𝑣+𝑤𝑏2 2.1
Peng-Robinson EOS coefficients: u=2,w=-1 so that equation took the form:
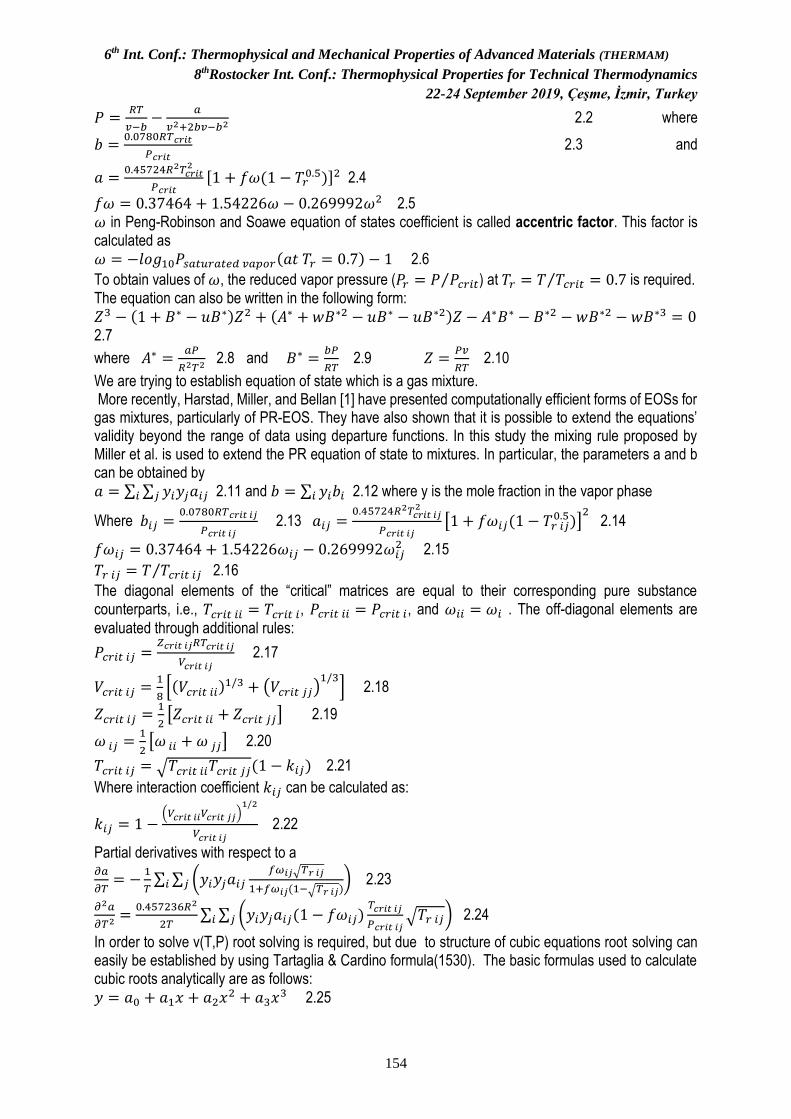
6th Int. Conf.: Thermophysical and Mechanical Properties of Advanced Materials (THERMAM)
8thRostocker Int. Conf.: Thermophysical Properties for Technical Thermodynamics
22-24 September 2019, Çeşme, İzmir, Turkey
154
𝑃 =𝑅𝑇
𝑣−𝑏−
𝑎
𝑣2+2𝑏𝑣−𝑏2 2.2 where
𝑏 =0.0780𝑅𝑇𝑐𝑟𝑖𝑡
𝑃𝑐𝑟𝑖𝑡 2.3 and
𝑎 =0.45724𝑅2𝑇𝑐𝑟𝑖𝑡
2
𝑃𝑐𝑟𝑖𝑡[1 + 𝑓𝜔(1 − 𝑇𝑟
0.5)]2 2.4
𝑓𝜔 = 0.37464 + 1.54226𝜔 − 0.269992𝜔2 2.5 𝜔 in Peng-Robinson and Soawe equation of states coefficient is called accentric factor. This factor is calculated as 𝜔 = −𝑙𝑜𝑔10𝑃𝑠𝑎𝑡𝑢𝑟𝑎𝑡𝑒𝑑 𝑣𝑎𝑝𝑜𝑟(𝑎𝑡 𝑇𝑟 = 0.7) − 1 2.6
To obtain values of 𝜔, the reduced vapor pressure (𝑃𝑟 = 𝑃 𝑃𝑐𝑟𝑖𝑡⁄ ) at 𝑇𝑟 = 𝑇 𝑇𝑐𝑟𝑖𝑡 = 0.7⁄ is required. The equation can also be written in the following form: 𝑍3 − (1 + 𝐵∗ − 𝑢𝐵∗)𝑍2 + (𝐴∗ + 𝑤𝐵∗2 − 𝑢𝐵∗ − 𝑢𝐵∗2)𝑍 − 𝐴∗𝐵∗ − 𝐵∗2 − 𝑤𝐵∗2 − 𝑤𝐵∗3 = 0 2.7
where 𝐴∗ =𝑎𝑃
𝑅2𝑇2 2.8 and 𝐵∗ =
𝑏𝑃
𝑅𝑇 2.9 𝑍 =
𝑃𝑣
𝑅𝑇 2.10
We are trying to establish equation of state which is a gas mixture. More recently, Harstad, Miller, and Bellan [1] have presented computationally efficient forms of EOSs for gas mixtures, particularly of PR-EOS. They have also shown that it is possible to extend the equations’ validity beyond the range of data using departure functions. In this study the mixing rule proposed by Miller et al. is used to extend the PR equation of state to mixtures. In particular, the parameters a and b can be obtained by 𝑎 = ∑ ∑ 𝑦𝑖𝑦𝑗𝑎𝑖𝑗𝑗𝑖 2.11 and 𝑏 = ∑ 𝑦𝑖𝑏𝑖𝑖 2.12 where y is the mole fraction in the vapor phase
Where 𝑏𝑖𝑗 =0.0780𝑅𝑇𝑐𝑟𝑖𝑡 𝑖𝑗
𝑃𝑐𝑟𝑖𝑡 𝑖𝑗 2.13 𝑎𝑖𝑗 =
0.45724𝑅2𝑇𝑐𝑟𝑖𝑡 𝑖𝑗2
𝑃𝑐𝑟𝑖𝑡 𝑖𝑗[1 + 𝑓𝜔𝑖𝑗(1 − 𝑇𝑟 𝑖𝑗
0.5)]2 2.14
𝑓𝜔𝑖𝑗 = 0.37464 + 1.54226𝜔𝑖𝑗 − 0.269992𝜔𝑖𝑗2 2.15
𝑇𝑟 𝑖𝑗 = 𝑇 𝑇𝑐𝑟𝑖𝑡 𝑖𝑗⁄ 2.16
The diagonal elements of the “critical” matrices are equal to their corresponding pure substance counterparts, i.e., 𝑇𝑐𝑟𝑖𝑡 𝑖𝑖
= 𝑇𝑐𝑟𝑖𝑡 𝑖 , 𝑃𝑐𝑟𝑖𝑡 𝑖𝑖 = 𝑃𝑐𝑟𝑖𝑡 𝑖, and 𝜔𝑖𝑖 = 𝜔𝑖 . The off-diagonal elements are
evaluated through additional rules:
𝑃𝑐𝑟𝑖𝑡 𝑖𝑗 =𝑍𝑐𝑟𝑖𝑡 𝑖𝑗𝑅𝑇𝑐𝑟𝑖𝑡 𝑖𝑗
𝑉𝑐𝑟𝑖𝑡 𝑖𝑗 2.17
𝑉𝑐𝑟𝑖𝑡 𝑖𝑗 =
1
8[(𝑉𝑐𝑟𝑖𝑡 𝑖𝑖
)1/3 + (𝑉𝑐𝑟𝑖𝑡 𝑗𝑗 )
1/3] 2.18
𝑍𝑐𝑟𝑖𝑡 𝑖𝑗 =
1
2[𝑍𝑐𝑟𝑖𝑡 𝑖𝑖
+ 𝑍𝑐𝑟𝑖𝑡 𝑗𝑗 ] 2.19
𝜔 𝑖𝑗 =
1
2[𝜔 𝑖𝑖
+ 𝜔 𝑗𝑗 ] 2.20
𝑇𝑐𝑟𝑖𝑡 𝑖𝑗 = √𝑇𝑐𝑟𝑖𝑡 𝑖𝑖
𝑇𝑐𝑟𝑖𝑡 𝑗𝑗 (1 − 𝑘𝑖𝑗) 2.21
Where interaction coefficient 𝑘𝑖𝑗 can be calculated as:
𝑘𝑖𝑗 = 1 −(𝑉𝑐𝑟𝑖𝑡 𝑖𝑖
𝑉𝑐𝑟𝑖𝑡 𝑗𝑗 )
1/2
𝑉𝑐𝑟𝑖𝑡 𝑖𝑗 2.22
Partial derivatives with respect to a 𝜕𝑎
𝜕𝑇= −
1
𝑇∑ ∑ (𝑦𝑖𝑦𝑗𝑎𝑖𝑗
𝑓𝜔𝑖𝑗√𝑇𝑟 𝑖𝑗
1+𝑓𝜔𝑖𝑗(1−√𝑇𝑟 𝑖𝑗))𝑗𝑖 2.23
𝜕2𝑎
𝜕𝑇2=
0.457236𝑅2
2𝑇∑ ∑ (𝑦𝑖𝑦𝑗𝑎𝑖𝑗(1 − 𝑓𝜔𝑖𝑗)
𝑇𝑐𝑟𝑖𝑡 𝑖𝑗
𝑃𝑐𝑟𝑖𝑡 𝑖𝑗√𝑇𝑟 𝑖𝑗)𝑗𝑖 2.24
In order to solve v(T,P) root solving is required, but due to structure of cubic equations root solving can easily be established by using Tartaglia & Cardino formula(1530). The basic formulas used to calculate cubic roots analytically are as follows: 𝑦 = 𝑎0 + 𝑎1𝑥 + 𝑎2𝑥
2 + 𝑎3𝑥3 2.25
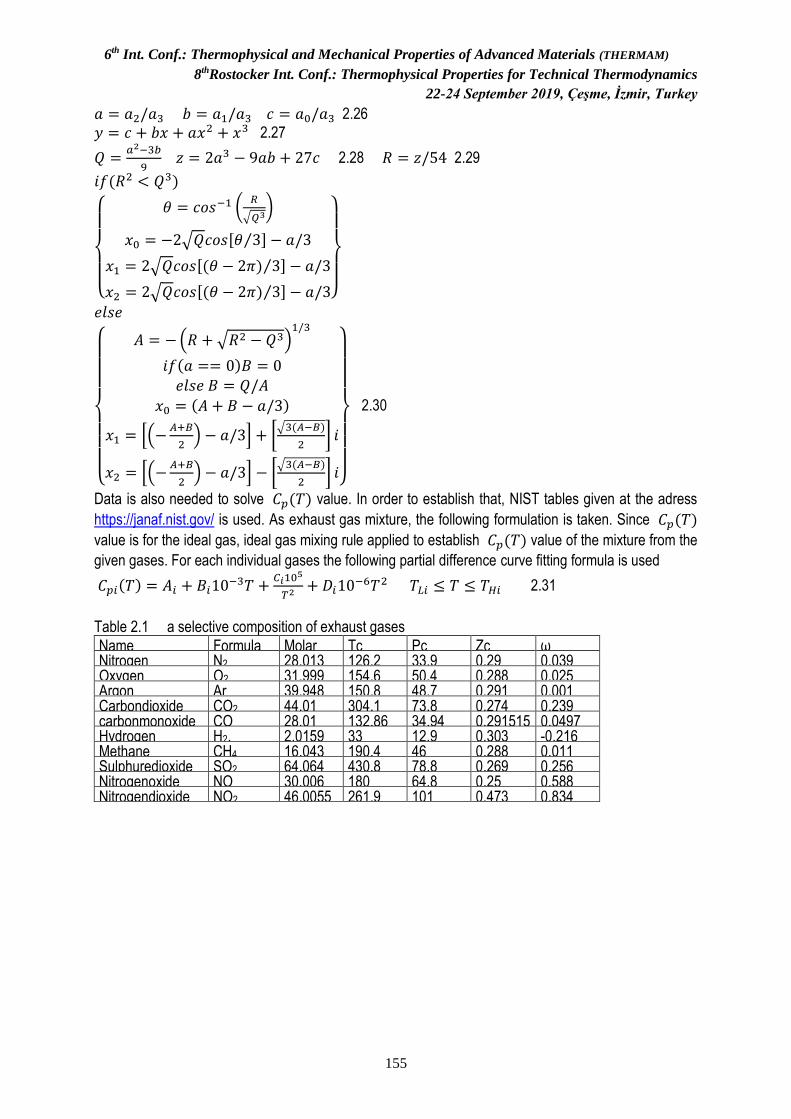
6th Int. Conf.: Thermophysical and Mechanical Properties of Advanced Materials (THERMAM)
8thRostocker Int. Conf.: Thermophysical Properties for Technical Thermodynamics
22-24 September 2019, Çeşme, İzmir, Turkey
155
𝑎 = 𝑎2/𝑎3 𝑏 = 𝑎1/𝑎3 𝑐 = 𝑎0/𝑎3 2.26
𝑦 = 𝑐 + 𝑏𝑥 + 𝑎𝑥2 + 𝑥3 2.27
𝑄 =𝑎2−3𝑏
9 𝑧 = 2𝑎3 − 9𝑎𝑏 + 27𝑐 2.28 𝑅 = 𝑧/54 2.29
𝑖𝑓(𝑅2 < 𝑄3)
{
𝜃 = 𝑐𝑜𝑠−1 (
𝑅
√𝑄3)
𝑥0 = −2√𝑄𝑐𝑜𝑠[𝜃 3⁄ ] − 𝑎/3
𝑥1 = 2√𝑄𝑐𝑜𝑠[(𝜃 − 2𝜋) 3⁄ ] − 𝑎/3
𝑥2 = 2√𝑄𝑐𝑜𝑠[(𝜃 − 2𝜋) 3⁄ ] − 𝑎/3}
𝑒𝑙𝑠𝑒
{
𝐴 = −(𝑅 + √𝑅2 − 𝑄3)
1/3
𝑖𝑓(𝑎 == 0)𝐵 = 0𝑒𝑙𝑠𝑒 𝐵 = 𝑄/𝐴
𝑥0 = (𝐴 + 𝐵 − 𝑎/3)
𝑥1 = [(−𝐴+𝐵
2) − 𝑎/3] + [
√3(𝐴−𝐵)
2] 𝑖
𝑥2 = [(−𝐴+𝐵
2) − 𝑎/3] − [
√3(𝐴−𝐵)
2] 𝑖}
2.30
Data is also needed to solve 𝐶𝑝(𝑇) value. In order to establish that, NIST tables given at the adress
https://janaf.nist.gov/ is used. As exhaust gas mixture, the following formulation is taken. Since 𝐶𝑝(𝑇)
value is for the ideal gas, ideal gas mixing rule applied to establish 𝐶𝑝(𝑇) value of the mixture from the
given gases. For each individual gases the following partial difference curve fitting formula is used
𝐶𝑝𝑖(𝑇) = 𝐴𝑖 + 𝐵𝑖10−3𝑇 +
𝐶𝑖105
𝑇2+ 𝐷𝑖10
−6𝑇2 𝑇𝐿𝑖 ≤ 𝑇 ≤ 𝑇𝐻𝑖 2.31
Table 2.1 a selective composition of exhaust gases
Name Formula Molar mass
Tc Pc Zc ω Nitrogen N2 28.013 126.2 33.9 0.29 0.039 Oxygen O2 31.999 154.6 50.4 0.288 0.025 Argon Ar 39.948 150.8 48.7 0.291 0.001 Carbondioxide CO2 44.01 304.1 73.8 0.274 0.239 carbonmonoxide CO 28.01 132.86 34.94 0.291515 0.0497 Hydrogen H2, 2.0159 33 12.9 0.303 -0.216 Methane CH4 16.043 190.4 46 0.288 0.011 Sulphuredioxide SO2 64.064 430.8 78.8 0.269 0.256 Nitrogenoxide NO 30.006 180 64.8 0.25 0.588 Nitrogendioxide NO2 46.0055 261.9 101 0.473 0.834
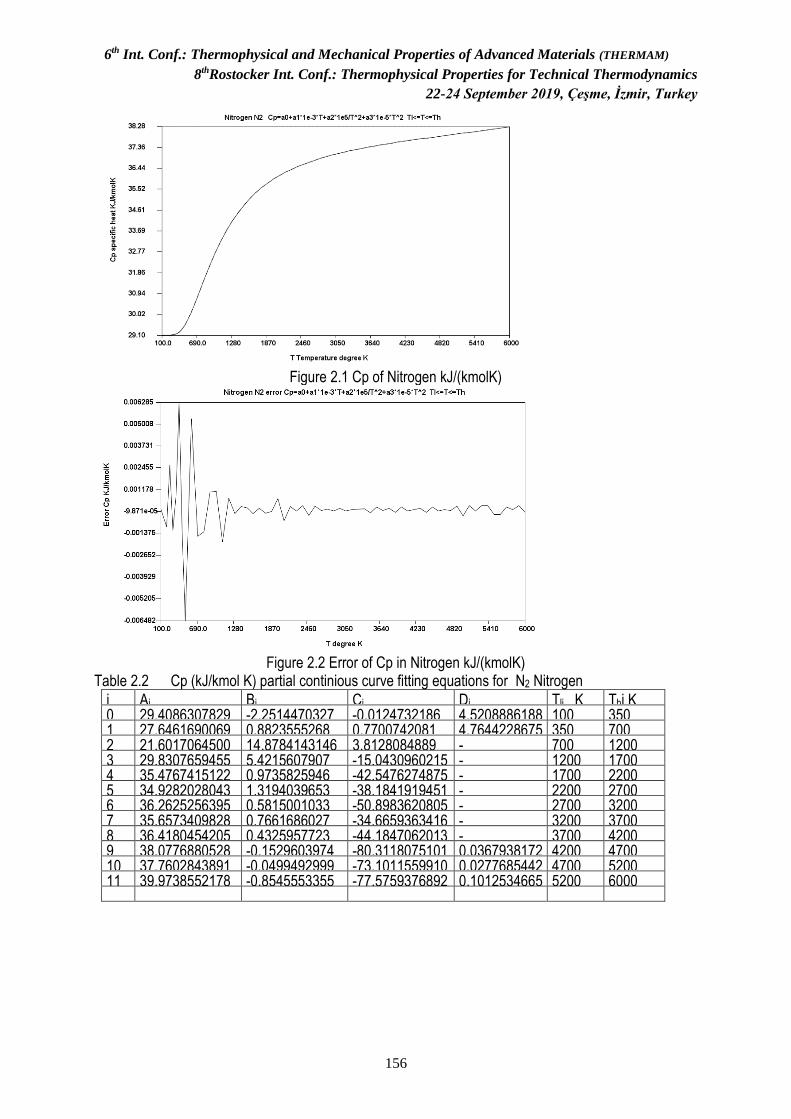
6th Int. Conf.: Thermophysical and Mechanical Properties of Advanced Materials (THERMAM)
8thRostocker Int. Conf.: Thermophysical Properties for Technical Thermodynamics
22-24 September 2019, Çeşme, İzmir, Turkey
156
Figure 2.1 Cp of Nitrogen kJ/(kmolK)
Figure 2.2 Error of Cp in Nitrogen kJ/(kmolK)
Table 2.2 Cp (kJ/kmol K) partial continious curve fitting equations for N2 Nitrogen
i Ai Bi Ci Di Tli K Thi K 0 29.4086307829 -2.2514470327 -0.0124732186 4.5208886188 100 350 1 27.6461690069 0.8823555268 0.7700742081 4.7644228675 350 700 2 21.6017064500 14.8784143146 3.8128084889 -
4.1654669506 700 1200
3 29.8307659455 5.4215607907 -15.0430960215 -1.0896138268
1200 1700 4 35.4767415122 0.9735825946 -42.5476274875 -
0.0974664401 1700 2200
5 34.9282028043 1.3194039653 -38.1841919451 -0.1599114820
2200 2700 6 36.2625256395 0.5815001033 -50.8983620805 -
0.0457311313 2700 3200
7 35.6573409828 0.7661686027 -34.6659363416 -0.0598170521
3200 3700 8 36.4180454205 0.4325957723 -44.1847062013 -
0.0201521727 3700 4200
9 38.0776880528 -0.1529603974 -80.3118075101 0.0367938172 4200 4700 10 37.7602843891 -0.0499492999 -73.1011559910 0.0277685442 4700 5200 11 39.9738552178 -0.8545553355 -77.5759376892 0.1012534665 5200 6000
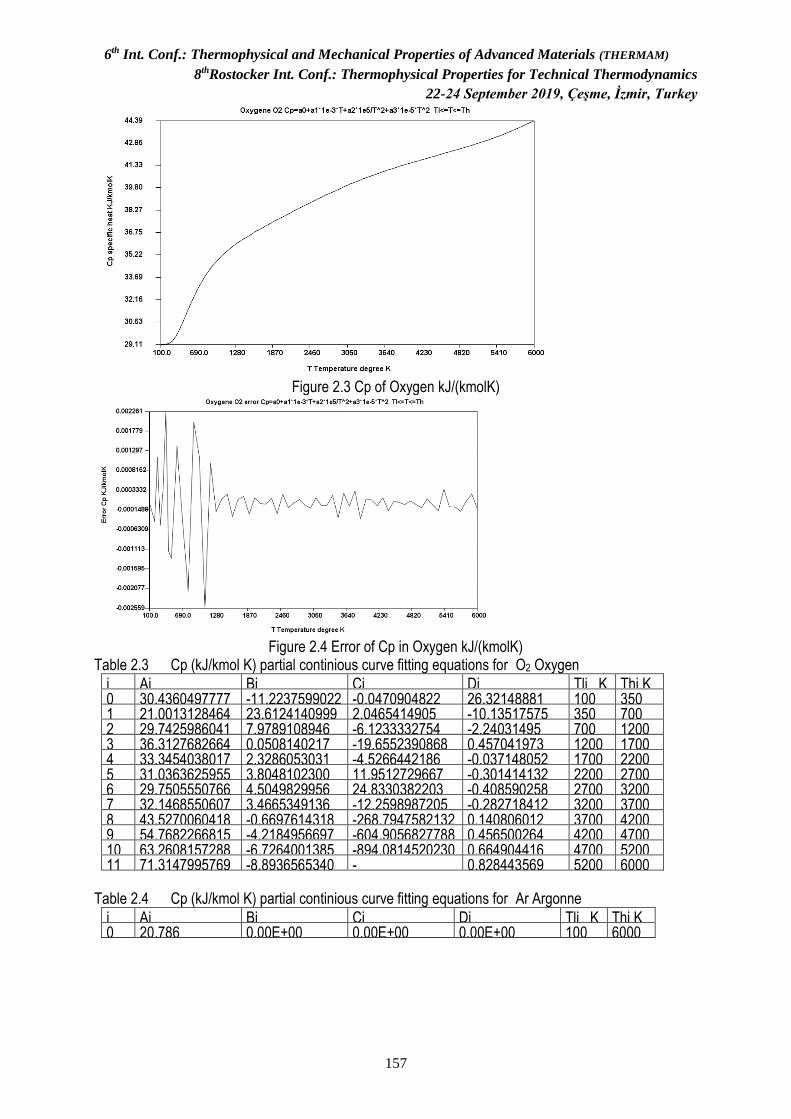
6th Int. Conf.: Thermophysical and Mechanical Properties of Advanced Materials (THERMAM)
8thRostocker Int. Conf.: Thermophysical Properties for Technical Thermodynamics
22-24 September 2019, Çeşme, İzmir, Turkey
157
Figure 2.3 Cp of Oxygen kJ/(kmolK)
Figure 2.4 Error of Cp in Oxygen kJ/(kmolK)
Table 2.3 Cp (kJ/kmol K) partial continious curve fitting equations for O2 Oxygen
i Ai Bi Ci Di Tli K Thi K 0 30.4360497777 -11.2237599022 -0.0470904822 26.32148881 100 350 1 21.0013128464 23.6124140999 2.0465414905 -10.13517575 350 700 2 29.7425986041 7.9789108946 -6.1233332754 -2.24031495 700 1200 3 36.3127682664 0.0508140217 -19.6552390868 0.457041973 1200 1700 4 33.3454038017 2.3286053031 -4.5266442186 -0.037148052 1700 2200 5 31.0363625955 3.8048102300 11.9512729667 -0.301414132 2200 2700 6 29.7505550766 4.5049829956 24.8330382203 -0.408590258 2700 3200 7 32.1468550607 3.4665349136 -12.2598987205 -0.282718412 3200 3700 8 43.5270060418 -0.6697614318 -268.7947582132 0.140806012 3700 4200 9 54.7682266815 -4.2184956697 -604.9056827788 0.456500264 4200 4700 10 63.2608157288 -6.7264001385 -894.0814520230 0.664904416 4700 5200 11 71.3147995769 -8.8936565340 -
1220.2917324495 0.828443569 5200 6000
Table 2.4 Cp (kJ/kmol K) partial continious curve fitting equations for Ar Argonne
i Ai Bi Ci Di Tli K Thi K 0 20.786 0.00E+00 0.00E+00 0.00E+00 100 6000
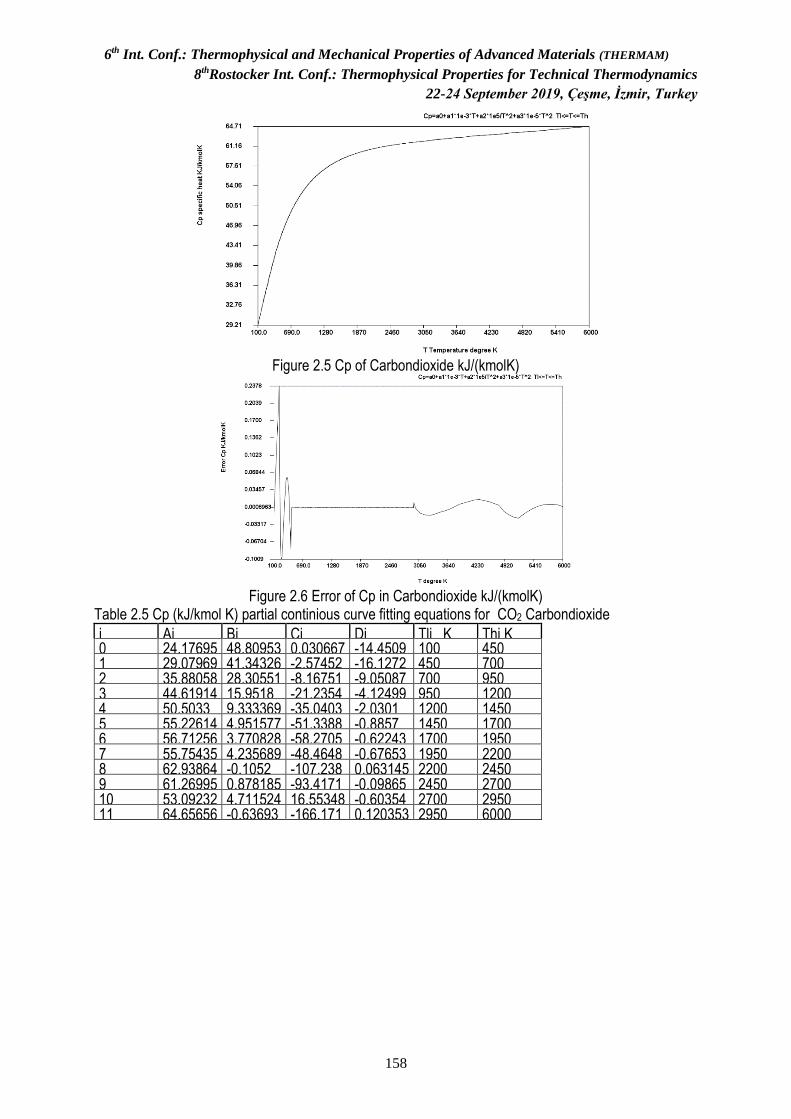
6th Int. Conf.: Thermophysical and Mechanical Properties of Advanced Materials (THERMAM)
8thRostocker Int. Conf.: Thermophysical Properties for Technical Thermodynamics
22-24 September 2019, Çeşme, İzmir, Turkey
158
Figure 2.5 Cp of Carbondioxide kJ/(kmolK)
Figure 2.6 Error of Cp in Carbondioxide kJ/(kmolK)
Table 2.5 Cp (kJ/kmol K) partial continious curve fitting equations for CO2 Carbondioxide
i Ai Bi Ci Di Tli K Thi K 0 24.17695 48.80953 0.030667 -14.4509 100 450 1 29.07969 41.34326 -2.57452 -16.1272 450 700 2 35.88058 28.30551 -8.16751 -9.05087 700 950 3 44.61914 15.9518 -21.2354 -4.12499 950 1200 4 50.5033 9.333369 -35.0403 -2.0301 1200 1450 5 55.22614 4.951577 -51.3388 -0.8857 1450 1700 6 56.71256 3.770828 -58.2705 -0.62243 1700 1950 7 55.75435 4.235689 -48.4648 -0.67653 1950 2200 8 62.93864 -0.1052 -107.238 0.063145 2200 2450 9 61.26995 0.878185 -93.4171 -0.09865 2450 2700 10 53.09232 4.711524 16.55348 -0.60354 2700 2950 11 64.65656 -0.63693 -166.171 0.120353 2950 6000
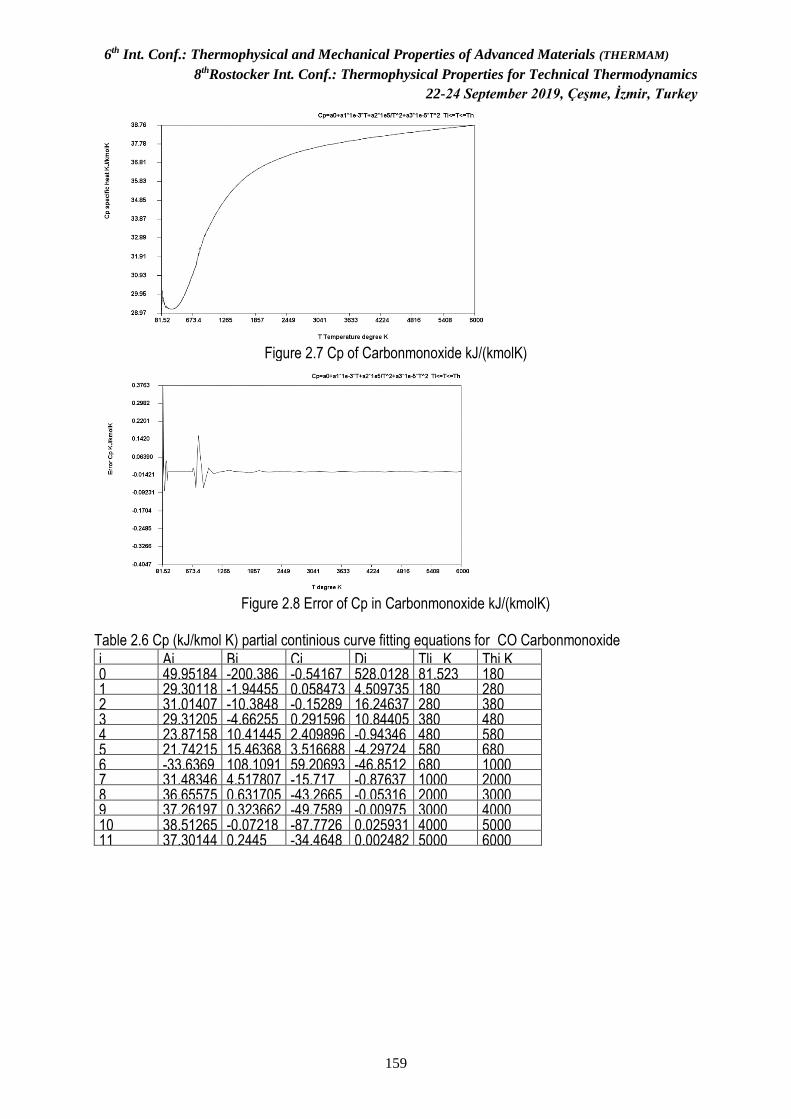
6th Int. Conf.: Thermophysical and Mechanical Properties of Advanced Materials (THERMAM)
8thRostocker Int. Conf.: Thermophysical Properties for Technical Thermodynamics
22-24 September 2019, Çeşme, İzmir, Turkey
159
Figure 2.7 Cp of Carbonmonoxide kJ/(kmolK)
Figure 2.8 Error of Cp in Carbonmonoxide kJ/(kmolK)
Table 2.6 Cp (kJ/kmol K) partial continious curve fitting equations for CO Carbonmonoxide
i Ai Bi Ci Di Tli K Thi K 0 49.95184 -200.386 -0.54167 528.0128 81.523 180 1 29.30118 -1.94455 0.058473 4.509735 180 280 2 31.01407 -10.3848 -0.15289 16.24637 280 380 3 29.31205 -4.66255 0.291596 10.84405 380 480 4 23.87158 10.41445 2.409896 -0.94346 480 580 5 21.74215 15.46368 3.516688 -4.29724 580 680 6 -33.6369 108.1091 59.20693 -46.8512 680 1000 7 31.48346 4.517807 -15.717 -0.87637 1000 2000 8 36.65575 0.631705 -43.2665 -0.05316 2000 3000 9 37.26197 0.323662 -49.7589 -0.00975 3000 4000 10 38.51265 -0.07218 -87.7726 0.025931 4000 5000 11 37.30144 0.2445 -34.4648 0.002482 5000 6000
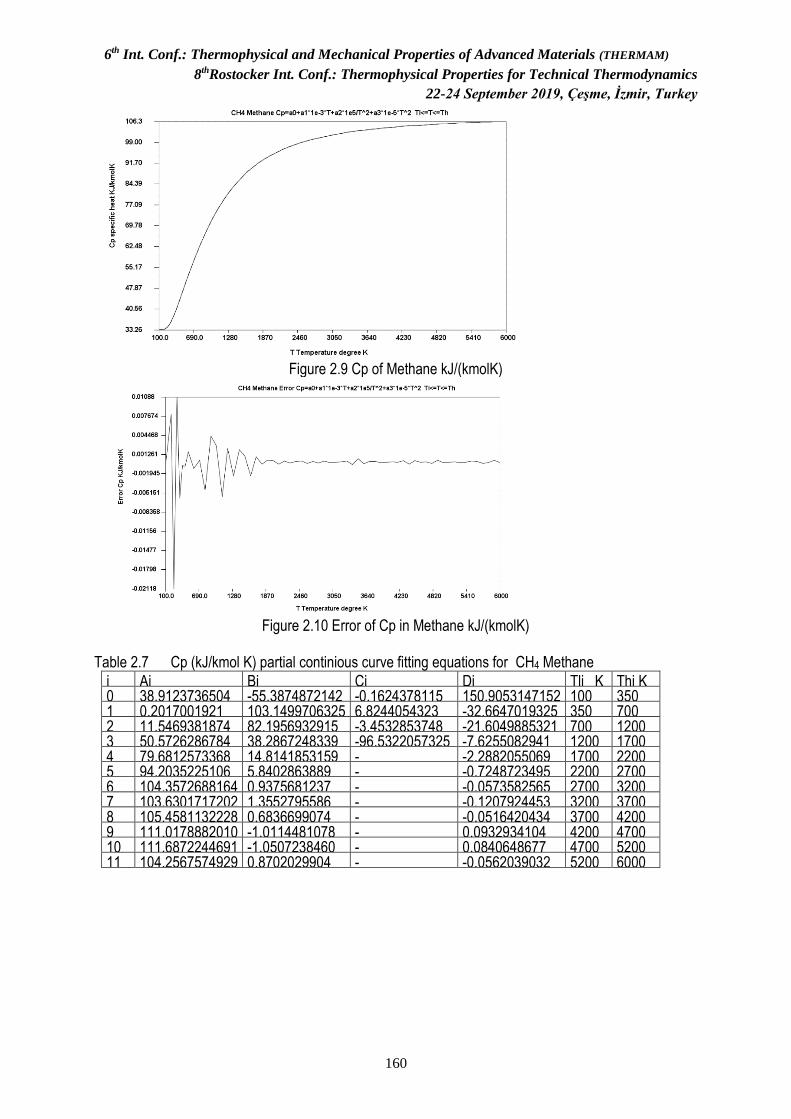
6th Int. Conf.: Thermophysical and Mechanical Properties of Advanced Materials (THERMAM)
8thRostocker Int. Conf.: Thermophysical Properties for Technical Thermodynamics
22-24 September 2019, Çeşme, İzmir, Turkey
160
Figure 2.9 Cp of Methane kJ/(kmolK)
Figure 2.10 Error of Cp in Methane kJ/(kmolK)
Table 2.7 Cp (kJ/kmol K) partial continious curve fitting equations for CH4 Methane
i Ai Bi Ci Di Tli K Thi K 0 38.9123736504 -55.3874872142 -0.1624378115 150.9053147152 100 350 1 0.2017001921 103.1499706325 6.8244054323 -32.6647019325 350 700 2 11.5469381874 82.1956932915 -3.4532853748 -21.6049885321 700 1200 3 50.5726286784 38.2867248339 -96.5322057325 -7.6255082941 1200 1700 4 79.6812573368 14.8141853159 -
230.3204126171 -2.2882055069 1700 2200
5 94.2035225106 5.8402863889 -343.8735028312
-0.7248723495 2200 2700 6 104.3572688164 0.9375681237 -
473.8206804593 -0.0573582565 2700 3200
7 103.6301717202 1.3552795586 -469.7217838104
-0.1207924453 3200 3700 8 105.4581132228 0.6836699074 -
509.3619167972 -0.0516420434 3700 4200
9 111.0178882010 -1.0114481078 -685.2166188470
0.0932934104 4200 4700 10 111.6872244691 -1.0507238460 -
747.2766372898 0.0840648677 4700 5200
11 104.2567574929 0.8702029904 -413.4705005282
-0.0562039032 5200 6000

6th Int. Conf.: Thermophysical and Mechanical Properties of Advanced Materials (THERMAM)
8thRostocker Int. Conf.: Thermophysical Properties for Technical Thermodynamics
22-24 September 2019, Çeşme, İzmir, Turkey
161
Figure 2.11 Cp of Sulphuredioxide kJ/(kmolK)
Figure 2.12 Error of Cp in Sulphuredioxide kJ/(kmolK)
Table 2.8 Cp (kJ/kmol K) partial continious curve fitting equations for SO2 Sulphuredioxide
i Ai Bi Ci Di Tli K Thi K 0 27.04565 47.58204 0.189722 -17.2701 100 500 1 39.52263 25.59534 -8.23243 -9.8155 500 1000 2 53.76983 4.437451 -27.6248 -0.96106 1000 1500 3 58.95975 -0.15624 -47.8644 0.19461 1500 2000 4 54.80818 2.568125 -18.0685 -0.31583 2000 2500 5 58.88664 0.256359 -55.9377 0.053221 2500 3000 6 66.03351 -2.58008 -187.621 0.3671 3000 3500 7 65.37328 -1.93967 -215.805 0.25682 3500 4000 8 57.85293 0.75634 -44.6259 -0.01406 4000 4500 9 32.2836 7.900894 922.2949 -0.57483 4500 5000 10 60.70438 0.064268 -194.933 0.034438 5000 5500 11 26.68717 7.749428 1767.32 -0.45276 5500 6000

6th Int. Conf.: Thermophysical and Mechanical Properties of Advanced Materials (THERMAM)
8thRostocker Int. Conf.: Thermophysical Properties for Technical Thermodynamics
22-24 September 2019, Çeşme, İzmir, Turkey
162
Figure 2.13 Cp of Hydrogen kJ/(kmolK)
Figure 2.14 Error of Cp in Hydrogen kJ/(kmolK)
Table 2.9 Cp (kJ/kmol K) partial continious curve fitting equations for H2 Hydrogen
i Ai Bi Ci Di Tli K Thi K 0 14.7466359163 75.9881404127 0.6855650913 -104.7842726 100 350 1 31.8773831527 -7.0195707811 -1.2522956170 5.578010465 350 700 2 27.0099099507 1.4614189875 3.6026361193 1.374481793 700 1200 3 20.0497436420 9.8952098371 17.7745882168 -1.504385502 1200 1700 4 24.0484325285 6.8102257923 -2.3005034859 -0.832957652 1700 2200 5 29.2156479907 3.6508950604 -43.3579756078 -0.289222932 2200 2700 6 32.3142438373 2.0694485310 -78.1959957855 -0.062964072 2700 3200 7 35.6831488932 0.6762347250 -
136.5501657830 0.099070362 3200 3700
8 35.5630278333 0.8914164594 -156.4897865015
0.060326987 3700 4200 9 21.7272706390 5.3732818954 234.0626600693 -0.347950527 4200 4700 10 13.0199056150 7.8723964969 547.1226571751 -0.549658083 4700 5200 11 6.7479064642 9.5439111926 806.6543827683 -0.674639418 5200 6000
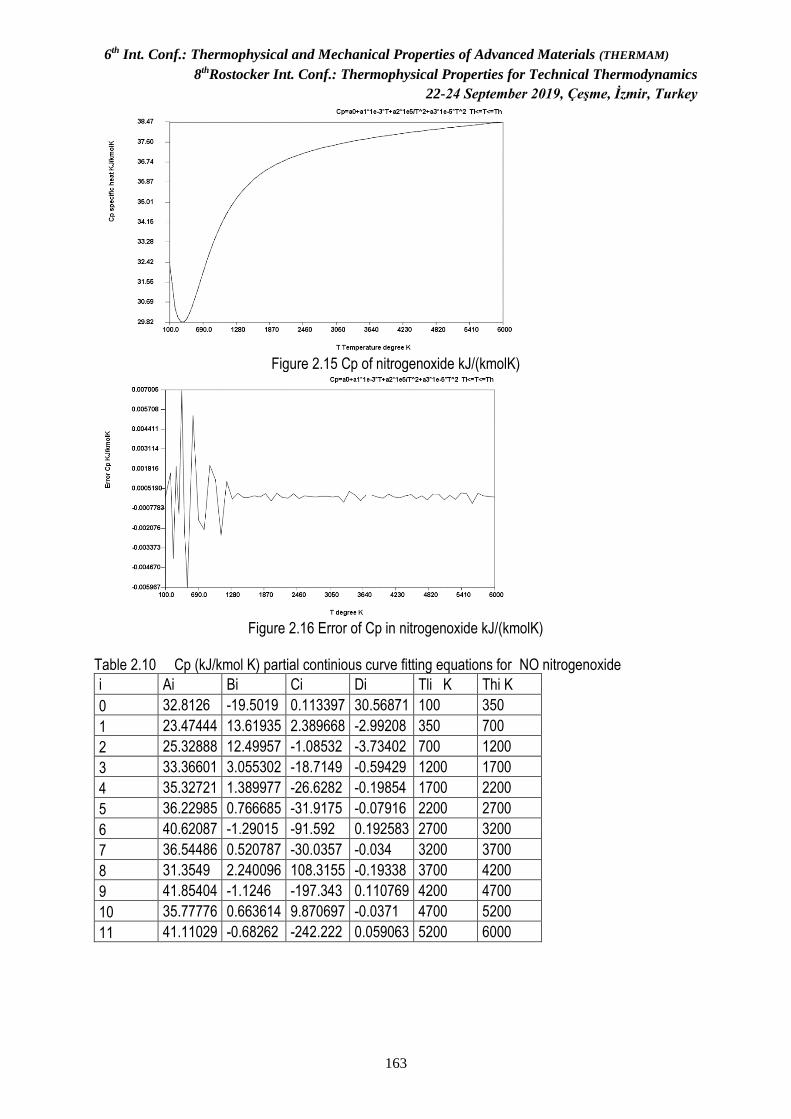
6th Int. Conf.: Thermophysical and Mechanical Properties of Advanced Materials (THERMAM)
8thRostocker Int. Conf.: Thermophysical Properties for Technical Thermodynamics
22-24 September 2019, Çeşme, İzmir, Turkey
163
Figure 2.15 Cp of nitrogenoxide kJ/(kmolK)
Figure 2.16 Error of Cp in nitrogenoxide kJ/(kmolK)
Table 2.10 Cp (kJ/kmol K) partial continious curve fitting equations for NO nitrogenoxide
i Ai Bi Ci Di Tli K Thi K
0 32.8126 -19.5019 0.113397 30.56871 100 350
1 23.47444 13.61935 2.389668 -2.99208 350 700
2 25.32888 12.49957 -1.08532 -3.73402 700 1200
3 33.36601 3.055302 -18.7149 -0.59429 1200 1700
4 35.32721 1.389977 -26.6282 -0.19854 1700 2200
5 36.22985 0.766685 -31.9175 -0.07916 2200 2700
6 40.62087 -1.29015 -91.592 0.192583 2700 3200
7 36.54486 0.520787 -30.0357 -0.034 3200 3700
8 31.3549 2.240096 108.3155 -0.19338 3700 4200
9 41.85404 -1.1246 -197.343 0.110769 4200 4700
10 35.77776 0.663614 9.870697 -0.0371 4700 5200
11 41.11029 -0.68262 -242.222 0.059063 5200 6000
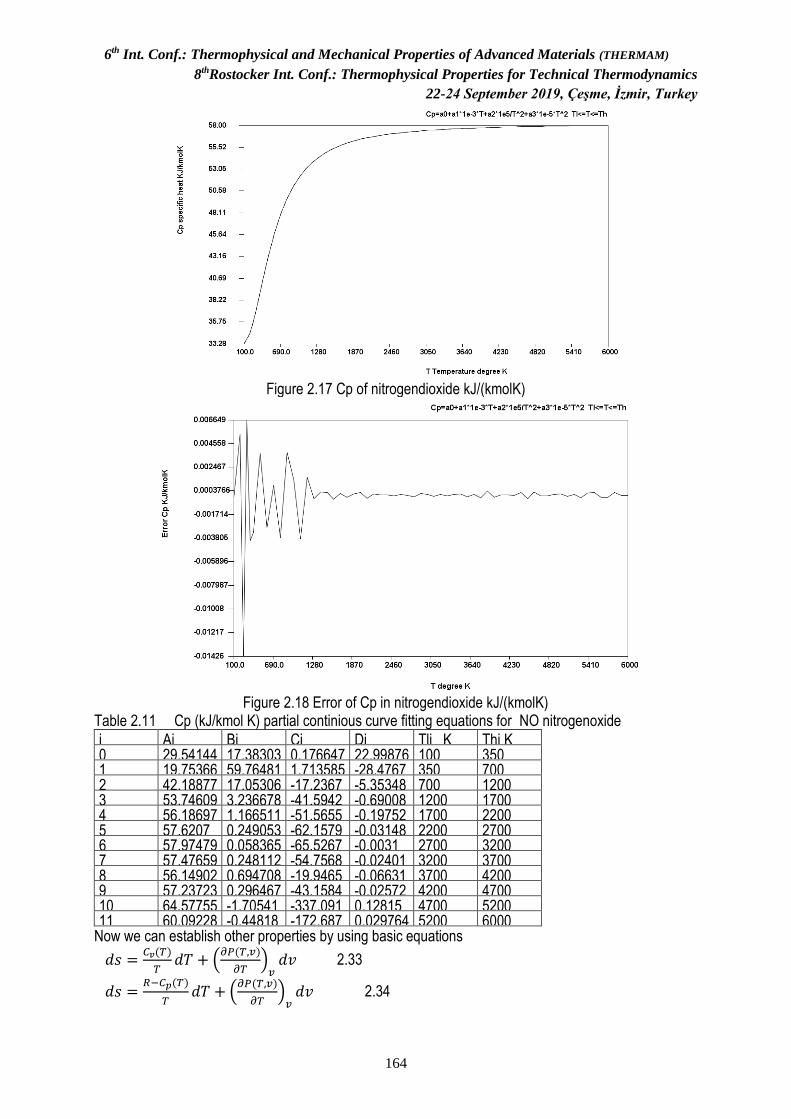
6th Int. Conf.: Thermophysical and Mechanical Properties of Advanced Materials (THERMAM)
8thRostocker Int. Conf.: Thermophysical Properties for Technical Thermodynamics
22-24 September 2019, Çeşme, İzmir, Turkey
164
Figure 2.17 Cp of nitrogendioxide kJ/(kmolK)
Figure 2.18 Error of Cp in nitrogendioxide kJ/(kmolK)
Table 2.11 Cp (kJ/kmol K) partial continious curve fitting equations for NO nitrogenoxide
i Ai Bi Ci Di Tli K Thi K 0 29.54144 17.38303 0.176647 22.99876 100 350 1 19.75366 59.76481 1.713585 -28.4767 350 700 2 42.18877 17.05306 -17.2367 -5.35348 700 1200 3 53.74609 3.236678 -41.5942 -0.69008 1200 1700 4 56.18697 1.166511 -51.5655 -0.19752 1700 2200 5 57.6207 0.249053 -62.1579 -0.03148 2200 2700 6 57.97479 0.058365 -65.5267 -0.0031 2700 3200 7 57.47659 0.248112 -54.7568 -0.02401 3200 3700 8 56.14902 0.694708 -19.9465 -0.06631 3700 4200 9 57.23723 0.296467 -43.1584 -0.02572 4200 4700 10 64.57755 -1.70541 -337.091 0.12815 4700 5200 11 60.09228 -0.44818 -172.687 0.029764 5200 6000
Now we can establish other properties by using basic equations
𝑑𝑠 =𝐶𝑣(𝑇)
𝑇𝑑𝑇 + (
𝜕𝑃(𝑇,𝑣)
𝜕𝑇)𝑣𝑑𝑣 2.33
𝑑𝑠 =𝑅−𝐶𝑝(𝑇)
𝑇𝑑𝑇 + (
𝜕𝑃(𝑇,𝑣)
𝜕𝑇)𝑣𝑑𝑣 2.34
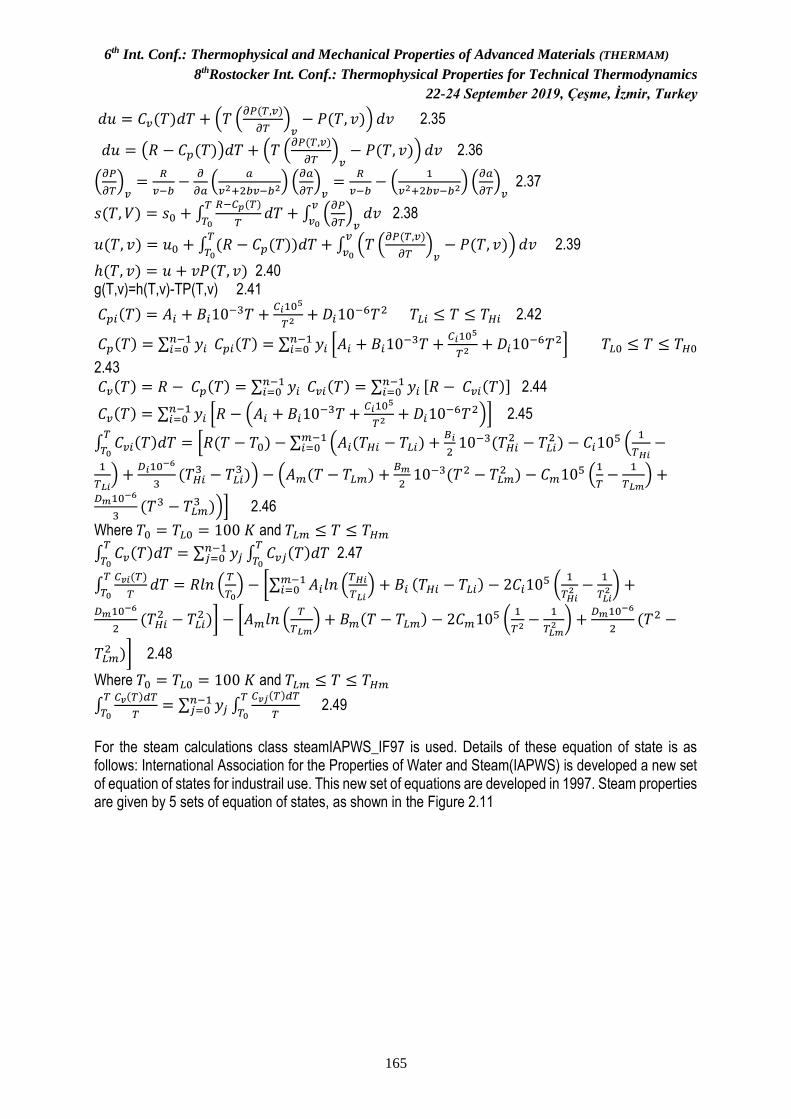
6th Int. Conf.: Thermophysical and Mechanical Properties of Advanced Materials (THERMAM)
8thRostocker Int. Conf.: Thermophysical Properties for Technical Thermodynamics
22-24 September 2019, Çeşme, İzmir, Turkey
165
𝑑𝑢 = 𝐶𝑣(𝑇)𝑑𝑇 + (𝑇 (𝜕𝑃(𝑇,𝑣)
𝜕𝑇)𝑣− 𝑃(𝑇, 𝑣)) 𝑑𝑣 2.35
𝑑𝑢 = (𝑅 − 𝐶𝑝(𝑇))𝑑𝑇 + (𝑇 (𝜕𝑃(𝑇,𝑣)
𝜕𝑇)𝑣− 𝑃(𝑇, 𝑣)) 𝑑𝑣 2.36
(𝜕𝑃
𝜕𝑇)𝑣=
𝑅
𝑣−𝑏−
𝜕
𝜕𝑎(
𝑎
𝑣2+2𝑏𝑣−𝑏2) (
𝜕𝑎
𝜕𝑇)𝑣=
𝑅
𝑣−𝑏− (
1
𝑣2+2𝑏𝑣−𝑏2) (
𝜕𝑎
𝜕𝑇)𝑣
2.37
𝑠(𝑇, 𝑉) = 𝑠0 + ∫𝑅−𝐶𝑝(𝑇)
𝑇𝑑𝑇
𝑇
𝑇0+ ∫ (
𝜕𝑃
𝜕𝑇)𝑣𝑑𝑣
𝑣
𝑣0 2.38
𝑢(𝑇, 𝑣) = 𝑢0 + ∫ (𝑅 − 𝐶𝑝(𝑇))𝑑𝑇𝑇
𝑇0+ ∫ (𝑇 (
𝜕𝑃(𝑇,𝑣)
𝜕𝑇)𝑣− 𝑃(𝑇, 𝑣))
𝑣
𝑣0𝑑𝑣 2.39
ℎ(𝑇, 𝑣) = 𝑢 + 𝑣𝑃(𝑇, 𝑣) 2.40 g(T,v)=h(T,v)-TP(T,v) 2.41
𝐶𝑝𝑖(𝑇) = 𝐴𝑖 + 𝐵𝑖10−3𝑇 +
𝐶𝑖105
𝑇2+ 𝐷𝑖10
−6𝑇2 𝑇𝐿𝑖 ≤ 𝑇 ≤ 𝑇𝐻𝑖 2.42
𝐶𝑝(𝑇) = ∑ 𝑦𝑖𝑛−1𝑖=0 𝐶𝑝𝑖(𝑇) = ∑ 𝑦𝑖
𝑛−1𝑖=0 [𝐴𝑖 + 𝐵𝑖10
−3𝑇 +𝐶𝑖10
5
𝑇2+ 𝐷𝑖10
−6𝑇2] 𝑇𝐿0 ≤ 𝑇 ≤ 𝑇𝐻0
2.43
𝐶𝑣(𝑇) = 𝑅 − 𝐶𝑝(𝑇) = ∑ 𝑦𝑖𝑛−1𝑖=0 𝐶𝑣𝑖(𝑇) = ∑ 𝑦𝑖
𝑛−1𝑖=0 [𝑅 − 𝐶𝑣𝑖(𝑇)] 2.44
𝐶𝑣(𝑇) = ∑ 𝑦𝑖𝑛−1𝑖=0 [𝑅 − (𝐴𝑖 + 𝐵𝑖10
−3𝑇 +𝐶𝑖10
5
𝑇2+ 𝐷𝑖10
−6𝑇2)] 2.45
∫ 𝐶𝑣𝑖(𝑇)𝑑𝑇 = [𝑅(𝑇 − 𝑇0) − ∑ (𝐴𝑖(𝑇𝐻𝑖 − 𝑇𝐿𝑖) +𝐵𝑖
210−3(𝑇𝐻𝑖
2 − 𝑇𝐿𝑖2 ) − 𝐶𝑖10
5 (1
𝑇𝐻𝑖−𝑚−1
𝑖=0𝑇
𝑇01
𝑇𝐿𝑖) +
𝐷𝑖10−6
3(𝑇𝐻𝑖
3 − 𝑇𝐿𝑖3 )) − (𝐴𝑚(𝑇 − 𝑇𝐿𝑚) +
𝐵𝑚
210−3(𝑇2 − 𝑇𝐿𝑚
2 ) − 𝐶𝑚105 (
1
𝑇−
1
𝑇𝐿𝑚) +
𝐷𝑚10−6
3(𝑇3 − 𝑇𝐿𝑚
3 ))] 2.46
Where 𝑇0 = 𝑇𝐿0 = 100 𝐾 and 𝑇𝐿𝑚 ≤ 𝑇 ≤ 𝑇𝐻𝑚
∫ 𝐶𝑣(𝑇)𝑑𝑇 = ∑ 𝑦𝑗𝑛−1𝑗=0 ∫ 𝐶𝑣𝑗(𝑇)𝑑𝑇
𝑇
𝑇0
𝑇
𝑇0 2.47
∫𝐶𝑣𝑖(𝑇)
𝑇𝑑𝑇 = 𝑅𝑙𝑛 (
𝑇
𝑇0) − [∑ 𝐴𝑖𝑙𝑛 (
𝑇𝐻𝑖
𝑇𝐿𝑖) + 𝐵𝑖
𝑚−1𝑖=0 (𝑇𝐻𝑖 − 𝑇𝐿𝑖) − 2𝐶𝑖10
5 (1
𝑇𝐻𝑖2 −
1
𝑇𝐿𝑖2) +
𝑇
𝑇0
𝐷𝑚10−6
2(𝑇𝐻𝑖
2 − 𝑇𝐿𝑖2 )] − [𝐴𝑚𝑙𝑛 (
𝑇
𝑇𝐿𝑚) + 𝐵𝑚(𝑇 − 𝑇𝐿𝑚) − 2𝐶𝑚10
5 (1
𝑇2−
1
𝑇𝐿𝑚2 ) +
𝐷𝑚10−6
2(𝑇2 −
𝑇𝐿𝑚2 )] 2.48
Where 𝑇0 = 𝑇𝐿0 = 100 𝐾 and 𝑇𝐿𝑚 ≤ 𝑇 ≤ 𝑇𝐻𝑚
∫𝐶𝑣(𝑇)𝑑𝑇
𝑇= ∑ 𝑦𝑗
𝑛−1𝑗=0 ∫
𝐶𝑣𝑗(𝑇)𝑑𝑇
𝑇
𝑇
𝑇0
𝑇
𝑇0 2.49
For the steam calculations class steamIAPWS_IF97 is used. Details of these equation of state is as follows: International Association for the Properties of Water and Steam(IAPWS) is developed a new set of equation of states for industrail use. This new set of equations are developed in 1997. Steam properties are given by 5 sets of equation of states, as shown in the Figure 2.11
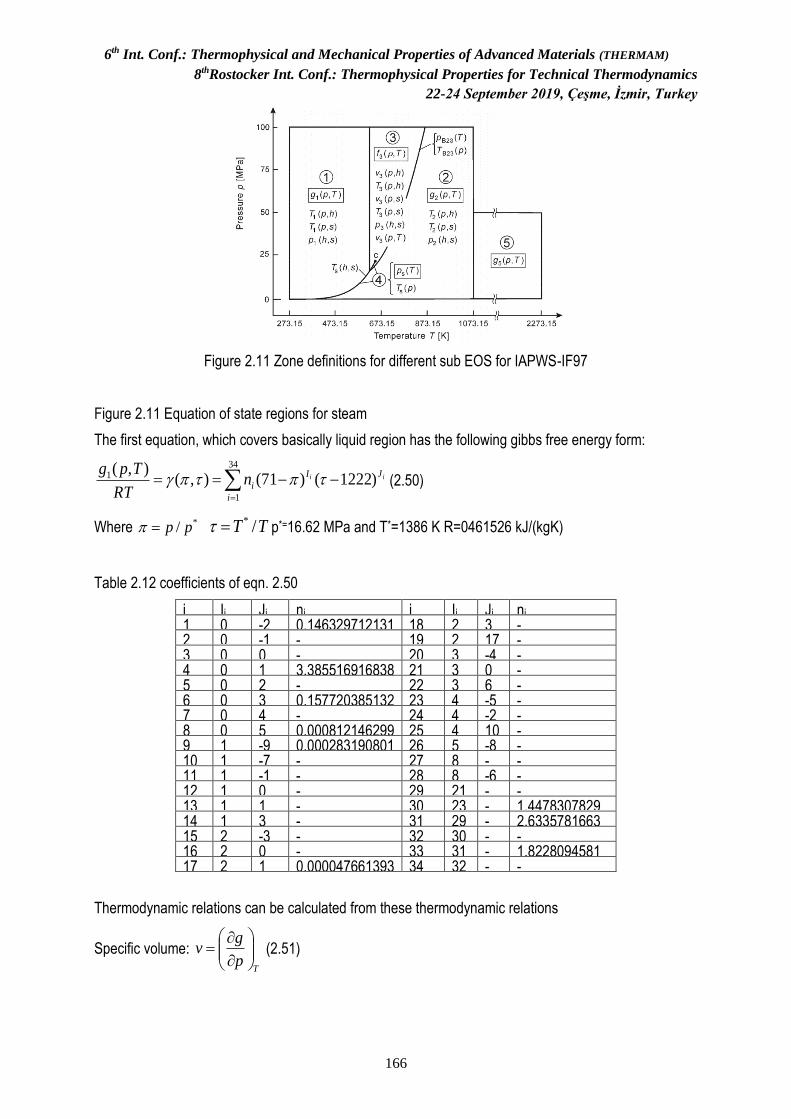
6th Int. Conf.: Thermophysical and Mechanical Properties of Advanced Materials (THERMAM)
8thRostocker Int. Conf.: Thermophysical Properties for Technical Thermodynamics
22-24 September 2019, Çeşme, İzmir, Turkey
166
Figure 2.11 Zone definitions for different sub EOS for IAPWS-IF97
Figure 2.11 Equation of state regions for steam
The first equation, which covers basically liquid region has the following gibbs free energy form:
=
−−==34
1
1 )1222()71(),(),(
i
JI
iiin
RT
Tpg (2.50)
Where */ pp= TT /*= p*=16.62 MPa and T*=1386 K R=0461526 kJ/(kgK)
Table 2.12 coefficients of eqn. 2.50
i Ii Ji ni i Ii Ji ni 1 0 -2 0.146329712131
67 18 2 3 -
4.4141845331E-06
2 0 -1 -0.84548187169114
19 2 17 -7.2694996298E-16
3 0 0 -3.75636036720400
20 3 -4 -3.1679644845E-05
4 0 1 3.38551691683850
21 3 0 -2.8270797985E-06
5 0 2 -0.95791963387872
22 3 6 -8.5205128120E-10
6 0 3 0.15772038513228
23 4 -5 -2.2425281908E-06
7 0 4 -0.01661641719950
24 4 -2 -6.5171222896E-07
8 0 5 0.00081214629984
25 4 10 -1.4341729938E-13
9 1 -9 0.00028319080124
26 5 -8 -4.0516996860E-07
10 1 -7 -0.00060706301566
27 8 -11
-1.2734301742E-09
11 1 -1 -0.01899006821842
28 8 -6 -1.7424871231E-10
12 1 0 -0.03252974877051
29 21 -29
-6.8762131296E-19
13 1 1 -0.02184171717541
30 23 -31
1.4478307829E-20 14 1 3 -
0.00005283835797
31 29 -38
2.6335781663E-23 15 2 -3 -
0.00047184321073
32 30 -39
-1.1947622640E-23
16 2 0 -0.00030001780793
33 31 -40
1.8228094581E-24 17 2 1 0.000047661393
91 34 32 -
41 -9.3537087292E-26
Thermodynamic relations can be calculated from these thermodynamic relations
Specific volume: T
p
gv
= (2.51)

6th Int. Conf.: Thermophysical and Mechanical Properties of Advanced Materials (THERMAM)
8thRostocker Int. Conf.: Thermophysical Properties for Technical Thermodynamics
22-24 September 2019, Çeşme, İzmir, Turkey
167
Specific enthalpy: P
p
gTgh
−= (2.52)
Specific internal energy: TP p
gp
T
gTgu
−
−= (2.53)
Specific entropy: PT
gs
= (2.54)
Specific isobaric heat capacity: P
pT
hC
= (2.55)
Specific isochoric heat capacity: v
vT
uC
= (2.56)
The second equation equation, which covers vapor region has the following gibbs free energy form:
),(),(),(),( 02 r
RT
Tpg+== (2.57)
Where */ pp= TT /*= R=0461526 kJ/(kgK), ),(0 is the ideal gas part of EOS, and ),( r
is the real gas part of the EOS. İdeal gas part equation:
iJ
i
in =
+=9
1
00 ln),( (2.58)
Where p*=1MPa and T*=540 K
Table 2.13 coefficients of eqn. 2.58
i Ji ni0 i Ji ni
0 1 0 -
9.692768650E+00 6 -2 1.4240819171E+00
2 1 1.008665597E+01 7 -1 -4.3839511319E+00 3 -5 -5.608791128E-03 8 2 -2.8408632461E-01 4 -4 7.145273808E-02 9 3 2.1268463753E-02 5 -3 -4.071049822E-01
dimensionless residual part of the basic equation g2( p,T ) is as follows:
ii J
i
I
i
r n )5.0(),(43
1
−= =
(2.60)
Where p*=1MPa and T*=540 K
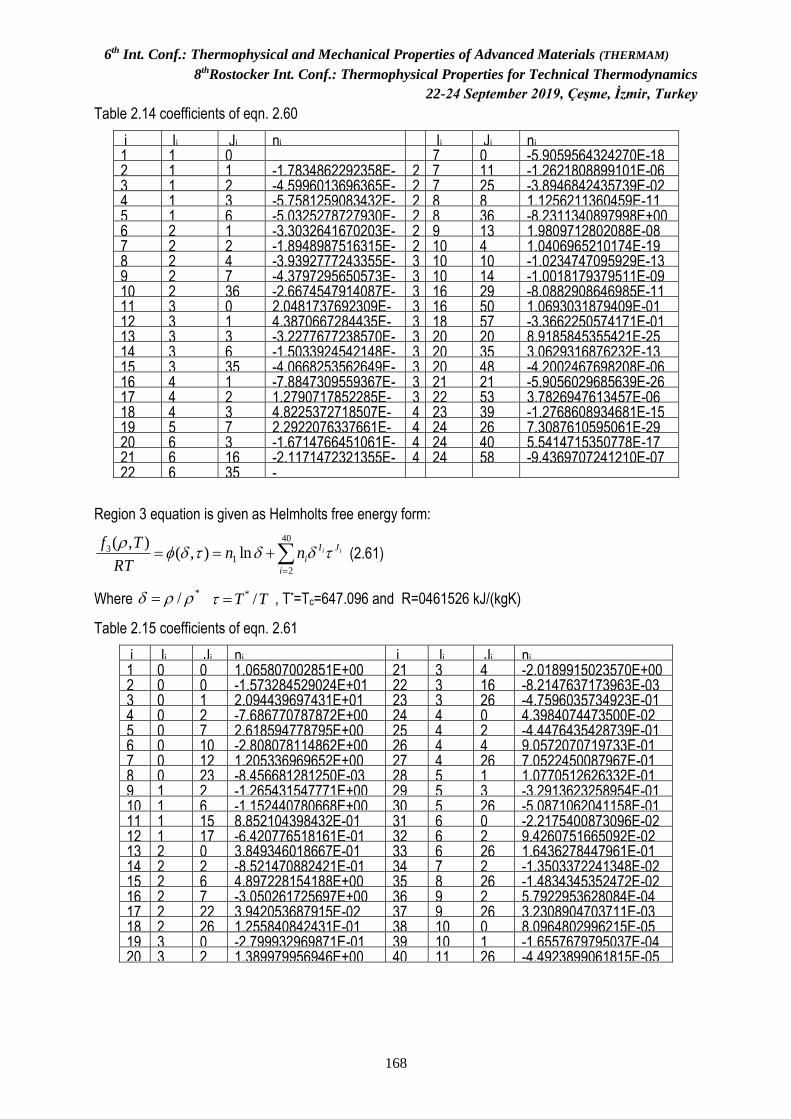
6th Int. Conf.: Thermophysical and Mechanical Properties of Advanced Materials (THERMAM)
8thRostocker Int. Conf.: Thermophysical Properties for Technical Thermodynamics
22-24 September 2019, Çeşme, İzmir, Turkey
168
Table 2.14 coefficients of eqn. 2.60
i Ii Ji ni i
Ii Ji ni
1 1 0 7 0 -5.9059564324270E-18 2 1 1 -1.7834862292358E-
02 24
7 11 -1.2621808899101E-06 3 1 2 -4.5996013696365E-
02 25
7 25 -3.8946842435739E-02 4 1 3 -5.7581259083432E-
02 26
8 8 1.1256211360459E-11 5 1 6 -5.0325278727930E-
02 27
8 36 -8.2311340897998E+00 6 2 1 -3.3032641670203E-
05 28
9 13 1.9809712802088E-08 7 2 2 -1.8948987516315E-
04 29
10 4 1.0406965210174E-19 8 2 4 -3.9392777243355E-
03 30
10 10 -1.0234747095929E-13 9 2 7 -4.3797295650573E-
02 31
10 14 -1.0018179379511E-09 10 2 36 -2.6674547914087E-
05 32
16 29 -8.0882908646985E-11 11 3 0 2.0481737692309E-
08 33
16 50 1.0693031879409E-01 12 3 1 4.3870667284435E-
07 34
18 57 -3.3662250574171E-01 13 3 3 -3.2277677238570E-
05 35
20 20 8.9185845355421E-25 14 3 6 -1.5033924542148E-
03 36
20 35 3.0629316876232E-13 15 3 35 -4.0668253562649E-
02 37
20 48 -4.2002467698208E-06 16 4 1 -7.8847309559367E-
10 38
21 21 -5.9056029685639E-26 17 4 2 1.2790717852285E-
08 39
22 53 3.7826947613457E-06 18 4 3 4.8225372718507E-
07 40
23 39 -1.2768608934681E-15 19 5 7 2.2922076337661E-
06 41
24 26 7.3087610595061E-29 20 6 3 -1.6714766451061E-
11 42
24 40 5.5414715350778E-17 21 6 16 -2.1171472321355E-
03 43
24 58 -9.4369707241210E-07 22 6 35 -
2.3895741934104E+01
Region 3 equation is given as Helmholts free energy form:
=
+==40
2
13 ln),(
),(
i
JI
iiinn
RT
Tf
(2.61)
Where */ = TT /*= , T*=Tc=647.096 and R=0461526 kJ/(kgK)
Table 2.15 coefficients of eqn. 2.61
i Ii Ji ni i Ii Ji ni
1 0 0 1.065807002851E+00 21 3 4 -2.0189915023570E+00 2 0 0 -1.573284529024E+01 22 3 16 -8.2147637173963E-03 3 0 1 2.094439697431E+01 23 3 26 -4.7596035734923E-01 4 0 2 -7.686770787872E+00 24 4 0 4.3984074473500E-02 5 0 7 2.618594778795E+00 25 4 2 -4.4476435428739E-01 6 0 10 -2.808078114862E+00 26 4 4 9.0572070719733E-01 7 0 12 1.205336969652E+00 27 4 26 7.0522450087967E-01 8 0 23 -8.456681281250E-03 28 5 1 1.0770512626332E-01 9 1 2 -1.265431547771E+00 29 5 3 -3.2913623258954E-01 10 1 6 -1.152440780668E+00 30 5 26 -5.0871062041158E-01 11 1 15 8.852104398432E-01 31 6 0 -2.2175400873096E-02 12 1 17 -6.420776518161E-01 32 6 2 9.4260751665092E-02 13 2 0 3.849346018667E-01 33 6 26 1.6436278447961E-01 14 2 2 -8.521470882421E-01 34 7 2 -1.3503372241348E-02 15 2 6 4.897228154188E+00 35 8 26 -1.4834345352472E-02 16 2 7 -3.050261725697E+00 36 9 2 5.7922953628084E-04 17 2 22 3.942053687915E-02 37 9 26 3.2308904703711E-03 18 2 26 1.255840842431E-01 38 10 0 8.0964802996215E-05 19 3 0 -2.799932969871E-01 39 10 1 -1.6557679795037E-04 20 3 2 1.389979956946E+00 40 11 26 -4.4923899061815E-05
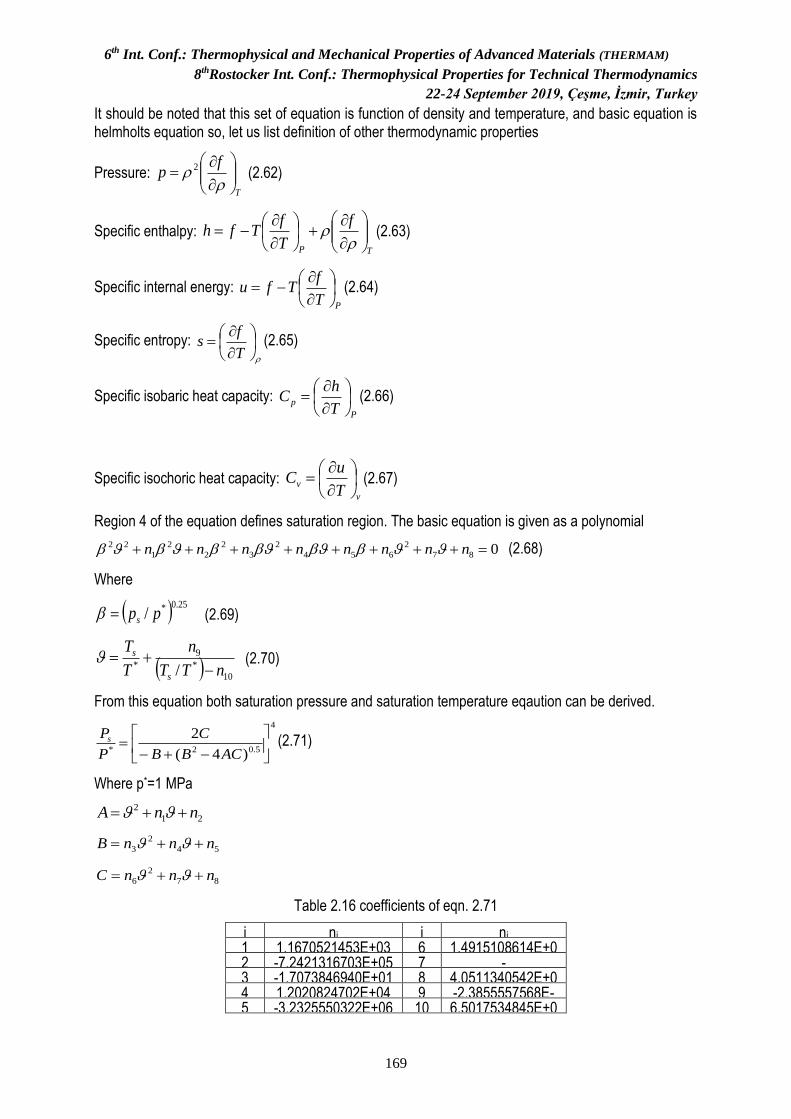
6th Int. Conf.: Thermophysical and Mechanical Properties of Advanced Materials (THERMAM)
8thRostocker Int. Conf.: Thermophysical Properties for Technical Thermodynamics
22-24 September 2019, Çeşme, İzmir, Turkey
169
It should be noted that this set of equation is function of density and temperature, and basic equation is helmholts equation so, let us list definition of other thermodynamic properties
Pressure: T
fp
=
2
(2.62)
Specific enthalpy: TP
f
T
fTfh
+
−=
(2.63)
Specific internal energy: PT
fTfu
−= (2.64)
Specific entropy:
=
T
fs (2.65)
Specific isobaric heat capacity: P
pT
hC
= (2.66)
Specific isochoric heat capacity: v
vT
uC
= (2.67)
Region 4 of the equation defines saturation region. The basic equation is given as a polynomial
087
2
654
2
3
2
2
2
1
22 =++++++++ nnnnnnnn (2.68)
Where
( ) 25.0*/ pps= (2.69)
( ) 10
*
9
* / nTT
n
T
T
s
s
−+= (2.70)
From this equation both saturation pressure and saturation temperature eqaution can be derived.
4
5.02* )4(
2
−+−=
ACBB
C
P
Ps (2.71)
Where p*=1 MPa
21
2 nnA ++=
54
2
3 nnnB ++=
87
2
6 nnnC ++=
Table 2.16 coefficients of eqn. 2.71
i ni i ni
1 1.1670521453E+03 6 1.4915108614E+01 2 -7.2421316703E+05 7 -
4.8232657362E+03
3 -1.7073846940E+01 8 4.0511340542E+05 4 1.2020824702E+04 9 -2.3855557568E-01 5 -3.2325550322E+06 10 6.5017534845E+02

6th Int. Conf.: Thermophysical and Mechanical Properties of Advanced Materials (THERMAM)
8thRostocker Int. Conf.: Thermophysical Properties for Technical Thermodynamics
22-24 September 2019, Çeşme, İzmir, Turkey
170
It is also possible to drive saturation temperature eqaution from the basic polynomial as:
( ) 2
(45.0
109
2
1010
*
DnnDnDn
T
Ts +−+−+= (2.72)
Where T*=1 K
( ) 5.02 4
2
EGFF
GD
−−−=
63
2 nnE ++=
74
2
1 nnnF ++=
85
2
2 nnnG ++=
And the final region for steam is region 5, again given as gibbs free eqaution type EOS
),(),(),(),( 05 r
RT
Tpg+== (2.73)
Where */ pp= TT /*= R=0461526 kJ/(kgK), ),(0 is the ideal gas part of EOS, and ),( r
is the real gas part of the EOS. İdeal gas part equation:
iJ
i
in =
+=9
1
00 ln),( (2.74)
Where p*=1MPa and T*=1000 K
Table 2.17 coefficients of eqn. 2.74
i Ji0 ni
0 i Ji0 ni
0
1 0 -13.1799836742
4 -2 0.3690153498 2 1 6.8540841634 5 -1 -3.1161318214 3 -3 -0.0248051489 6 2 -0.3296162654
The real gas part of the equation
ii J
i
I
i
r n =
=43
1
),( (2.75)
Table 2.18 coefficients of eqn. 2.75
i Ii Ji ni i Ii Ji ni
1 1 1 1.5736404855E-03
4 2 3 2.2440037409E-06 2 1 2 9.0153761674E-
04 5 2 9 -4.1163275453E-06
3 1 3 -5.0270077678E-03
6 3 7 3.7919454823E-08
At reference [8] more detailed set of eqautions are given for this calculations, for example reverse equation sets are given so that instead of additional curve fitting to get the variables this additional sets can be utilized A program in java (steamIAPWS_IF97) is prepared to use this set of EOS. A user interface is also prepared (steamTableIF97.java). The user interface input frame is given in the following figure.
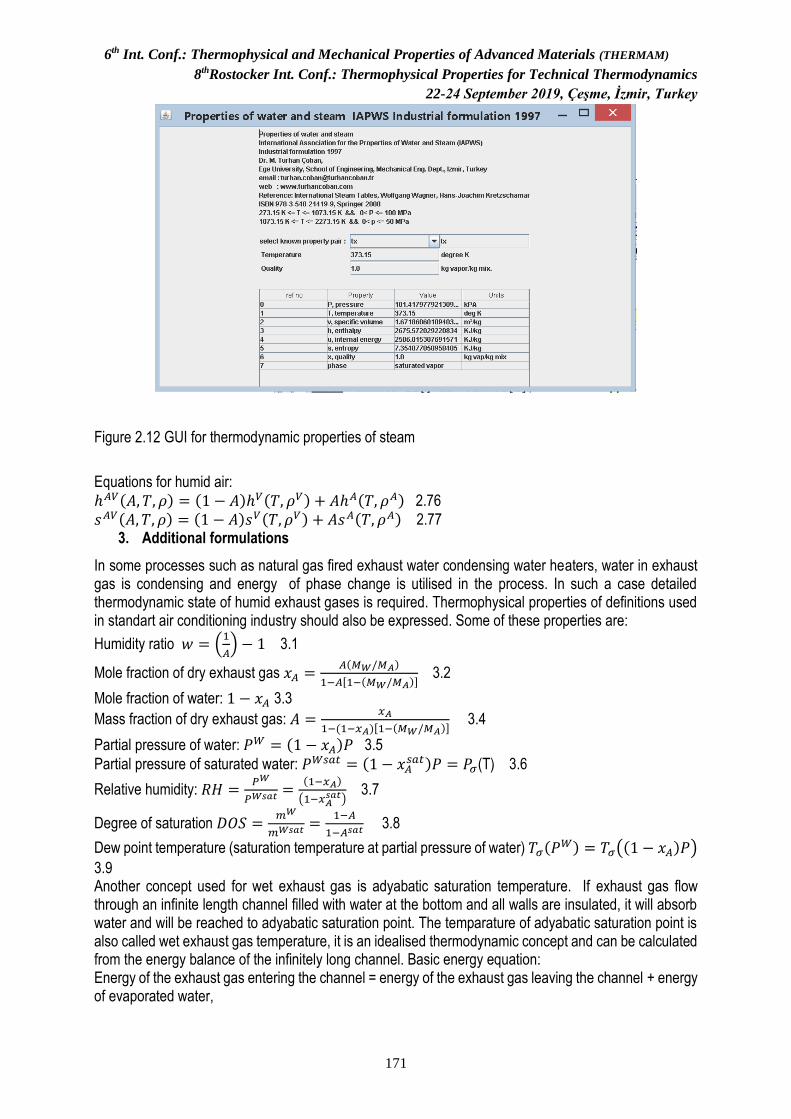
6th Int. Conf.: Thermophysical and Mechanical Properties of Advanced Materials (THERMAM)
8thRostocker Int. Conf.: Thermophysical Properties for Technical Thermodynamics
22-24 September 2019, Çeşme, İzmir, Turkey
171
Figure 2.12 GUI for thermodynamic properties of steam
Equations for humid air:
ℎ𝐴𝑉(𝐴, 𝑇, 𝜌) = (1 − 𝐴)ℎ𝑉(𝑇, 𝜌𝑉) + 𝐴ℎ𝐴(𝑇, 𝜌𝐴) 2.76
𝑠𝐴𝑉(𝐴, 𝑇, 𝜌) = (1 − 𝐴)𝑠𝑉(𝑇, 𝜌𝑉) + 𝐴𝑠𝐴(𝑇, 𝜌𝐴) 2.77 3. Additional formulations
In some processes such as natural gas fired exhaust water condensing water heaters, water in exhaust gas is condensing and energy of phase change is utilised in the process. In such a case detailed thermodynamic state of humid exhaust gases is required. Thermophysical properties of definitions used in standart air conditioning industry should also be expressed. Some of these properties are:
Humidity ratio 𝑤 = (1
𝐴) − 1 3.1
Mole fraction of dry exhaust gas 𝑥𝐴 =𝐴(𝑀𝑊/𝑀𝐴)
1−𝐴[1−(𝑀𝑊/𝑀𝐴)] 3.2
Mole fraction of water: 1 − 𝑥𝐴 3.3
Mass fraction of dry exhaust gas: 𝐴 =𝑥𝐴
1−(1−𝑥𝐴)[1−(𝑀𝑊/𝑀𝐴)] 3.4
Partial pressure of water: 𝑃𝑊 = (1 − 𝑥𝐴)𝑃 3.5
Partial pressure of saturated water: 𝑃𝑊𝑠𝑎𝑡 = (1 − 𝑥𝐴𝑠𝑎𝑡)𝑃 = 𝑃𝜎(T) 3.6
Relative humidity: 𝑅𝐻 =𝑃𝑊
𝑃𝑊𝑠𝑎𝑡 =(1−𝑥𝐴)
(1−𝑥𝐴𝑠𝑎𝑡)
3.7
Degree of saturation 𝐷𝑂𝑆 =𝑚𝑊
𝑚𝑊𝑠𝑎𝑡 =1−𝐴
1−𝐴𝑠𝑎𝑡 3.8
Dew point temperature (saturation temperature at partial pressure of water) 𝑇𝜎(𝑃𝑊) = 𝑇𝜎((1 − 𝑥𝐴)𝑃)
3.9 Another concept used for wet exhaust gas is adyabatic saturation temperature. If exhaust gas flow through an infinite length channel filled with water at the bottom and all walls are insulated, it will absorb water and will be reached to adyabatic saturation point. The temparature of adyabatic saturation point is also called wet exhaust gas temperature, it is an idealised thermodynamic concept and can be calculated from the energy balance of the infinitely long channel. Basic energy equation: Energy of the exhaust gas entering the channel = energy of the exhaust gas leaving the channel + energy of evaporated water,
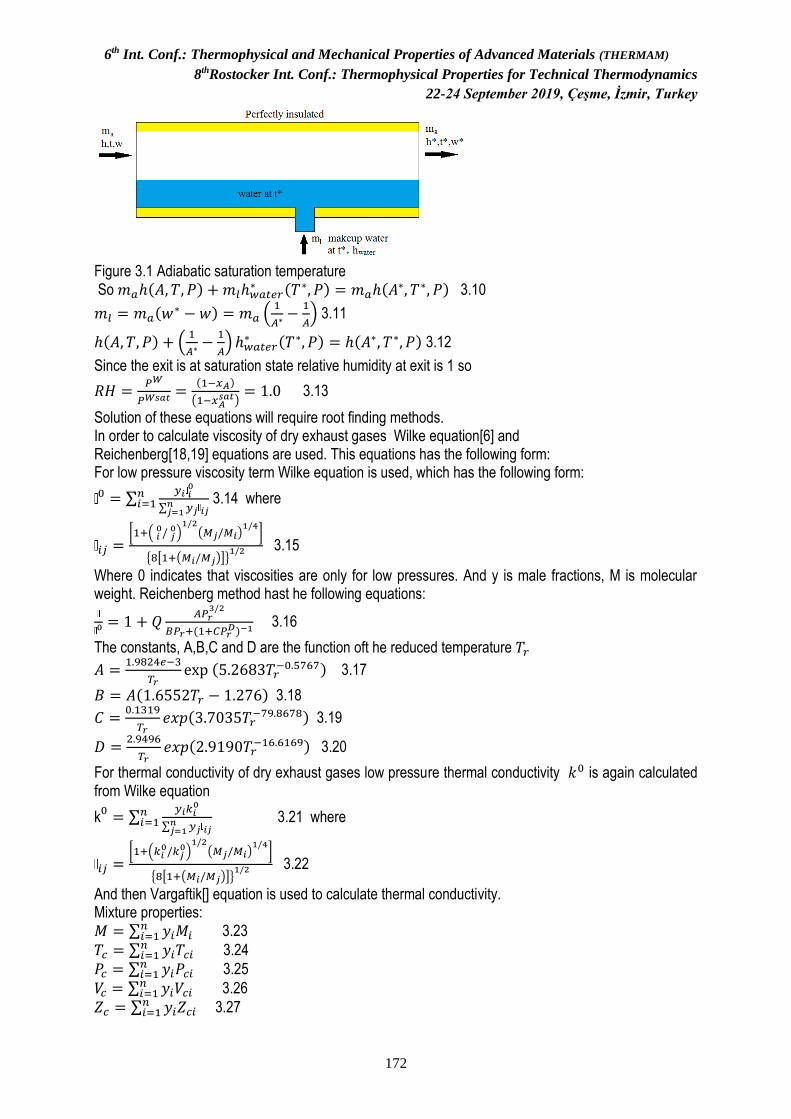
6th Int. Conf.: Thermophysical and Mechanical Properties of Advanced Materials (THERMAM)
8thRostocker Int. Conf.: Thermophysical Properties for Technical Thermodynamics
22-24 September 2019, Çeşme, İzmir, Turkey
172
Figure 3.1 Adiabatic saturation temperature So 𝑚𝑎ℎ(𝐴, 𝑇, 𝑃) + 𝑚𝑙ℎ𝑤𝑎𝑡𝑒𝑟
∗ (𝑇∗, 𝑃) = 𝑚𝑎ℎ(𝐴∗, 𝑇∗, 𝑃) 3.10
𝑚𝑙 = 𝑚𝑎(𝑤∗ − 𝑤) = 𝑚𝑎 (
1
𝐴∗−
1
𝐴) 3.11
ℎ(𝐴, 𝑇, 𝑃) + (1
𝐴∗−
1
𝐴) ℎ𝑤𝑎𝑡𝑒𝑟
∗ (𝑇∗, 𝑃) = ℎ(𝐴∗, 𝑇∗, 𝑃) 3.12
Since the exit is at saturation state relative humidity at exit is 1 so
𝑅𝐻 =𝑃𝑊
𝑃𝑊𝑠𝑎𝑡=
(1−𝑥𝐴)
(1−𝑥𝐴𝑠𝑎𝑡)
= 1.0 3.13
Solution of these equations will require root finding methods. In order to calculate viscosity of dry exhaust gases Wilke equation[6] and Reichenberg[18,19] equations are used. This equations has the following form: For low pressure viscosity term Wilke equation is used, which has the following form:
0 = ∑𝑦𝑖 𝑖
0
∑ 𝑦𝑗 𝑖𝑗𝑛𝑗=1
𝑛𝑖=1 3.14 where
𝑖𝑗 =[1+( 𝑖
0/ 𝑗0)1/2
(𝑀𝑗/𝑀𝑖)1/4
]
{8[1+(𝑀𝑖/𝑀𝑗)]}1/2 3.15
Where 0 indicates that viscosities are only for low pressures. And y is male fractions, M is molecular weight. Reichenberg method hast he following equations:
0 = 1 + 𝑄𝐴𝑃𝑟
3/2
𝐵𝑃𝑟+(1+𝐶𝑃𝑟𝐷)−1
3.16
The constants, A,B,C and D are the function oft he reduced temperature 𝑇𝑟
𝐴 =1.9824𝑒−3
𝑇𝑟exp (5.2683𝑇𝑟
−0.5767) 3.17
𝐵 = 𝐴(1.6552𝑇𝑟 − 1.276) 3.18
𝐶 =0.1319
𝑇𝑟𝑒𝑥𝑝(3.7035𝑇𝑟
−79.8678) 3.19
𝐷 =2.9496
𝑇𝑟𝑒𝑥𝑝(2.9190𝑇𝑟
−16.6169) 3.20
For thermal conductivity of dry exhaust gases low pressure thermal conductivity 𝑘0 is again calculated from Wilke equation
k0= ∑
𝑦𝑖𝑘𝑖0
∑ 𝑦𝑗 𝑖𝑗𝑛𝑗=1
𝑛𝑖=1 3.21 where
𝑖𝑗 =[1+(𝑘𝑖
0/𝑘𝑗0)1/2
(𝑀𝑗/𝑀𝑖)1/4
]
{8[1+(𝑀𝑖/𝑀𝑗)]}1/2 3.22
And then Vargaftik[] equation is used to calculate thermal conductivity. Mixture properties: 𝑀 = ∑ 𝑦𝑖𝑀𝑖
𝑛𝑖=1 3.23
𝑇𝑐 = ∑ 𝑦𝑖𝑇𝑐𝑖𝑛𝑖=1 3.24
𝑃𝑐 = ∑ 𝑦𝑖𝑃𝑐𝑖𝑛𝑖=1 3.25
𝑉𝑐 = ∑ 𝑦𝑖𝑉𝑐𝑖𝑛𝑖=1 3.26
𝑍𝑐 = ∑ 𝑦𝑖𝑍𝑐𝑖𝑛𝑖=1 3.27

6th Int. Conf.: Thermophysical and Mechanical Properties of Advanced Materials (THERMAM)
8thRostocker Int. Conf.: Thermophysical Properties for Technical Thermodynamics
22-24 September 2019, Çeşme, İzmir, Turkey
173
𝑘 − 𝑘0 = 𝑓(𝜌) =
{
1.22𝑒−2[𝑒𝑥𝑝(0.535𝜌𝑟)−1]
𝑍𝑐5 𝜌𝑟 < 0.5
1.14𝑒−2[𝑒𝑥𝑝(0.67𝜌𝑟)−1.069]
𝑍𝑐5 0.5 < 𝜌𝑟 < 2
2.60𝑒−3[𝑒𝑥𝑝(1.155𝜌𝑟)+2.016]
𝑍𝑐5 2 < 𝜌𝑟 < 2.8
3.28
=210 (𝑇𝑐𝑀
3
𝑃𝑐4 )
1/6
3.29
For water vapor viscosity and thermal conductivity values are taken from IAPWS Industrial Formulation 1997[15]. This equations are as follows: Viscosity equations:
ρ (𝛿, 𝜃) = ∗[ 0(𝜃) 1(𝛿, 𝜃)] 3.30
Where ∗ = 10−6 𝑃𝑎𝑠 𝛿 =ρ
𝜌∗ 𝜃 = 𝑇/𝑇∗
with 𝑇∗ = 𝑇𝑐 = 647.096 𝐾 𝜌∗ = 𝜌𝑐 = 322 𝑘𝑔/𝑚3
0(𝜃) = 𝜃0.5[∑ 𝑛𝑖
04𝑖=1 𝜃1−𝑖]
−1 3.31 Coefficients of equation given below:
Table 3.2 Coefficients of equation 3.31
i 𝑛𝑖0
1 0.167752e-1 2 0.220462e-1 3 0.6366564e-2 4 -0.241605e-2
1(𝛿, 𝜃) = 𝑒𝑥𝑝 [𝛿 ∑ 𝑛𝑖21𝑖=1 (𝛿 − 1)𝐼𝑖 (
1
𝜃− 1)
𝐽𝑖] 3.32
Table 3.3 Coefficients of equation 3.32
i Ii Ji Ni i Ii Ji Ni
1 0 0 5.200940E-01 12 2 2 -7.724790E-01 2 0 1 8.508950E-02 13 2 3 -4.898370E-01 3 0 2 -
1.083740E+00 14 2 4 -2.570400E-
01 4 0 3 -2.895550E-01
15 3 0 1.619130E-01 5 1 0 2.225310E-01 16 3 1 2.573990E-01 6 1 1 9.991150E-01 17 4 0 -3.253720E-02 7 1 2 1.887970E+00 18 4 3 6.984520E-02 8 1 3 1.266130E+00 19 5 4 8.721020E-03 9 1 5 1.205730E-01 20 6 3 -4.356730E-03 10 2 0 -2.813780E-
01 21 6 5 -5.932640E-
04 11 2 1 -9.068510E-01
Thermal conductivity equations 𝑘(𝜌,𝑇)
∗ = δ θ 0 θ 1 δ 2 δ θ 3.33
0(θ)=𝜃0.5∑ 𝑛𝑖04
𝑖=1 𝜃𝑖−1 3.34
Table 3.4 Coefficients of equation 3.34
i 𝑛𝑖0
1 0.102811e-1 2 0.299621e-1 3 0.156146e-1 4 -0.422464e-2 1(δ)=𝑛1 + 𝑛2δ+𝑛3𝑒𝑥𝑝[𝑛4(𝛿 + 𝑛5)
2] 3.35 Table 3.5 Coefficients of equation 3.35
i ni 1 0.39707 2 0.400302 3 -0.171587e4 4 -0.239219e1
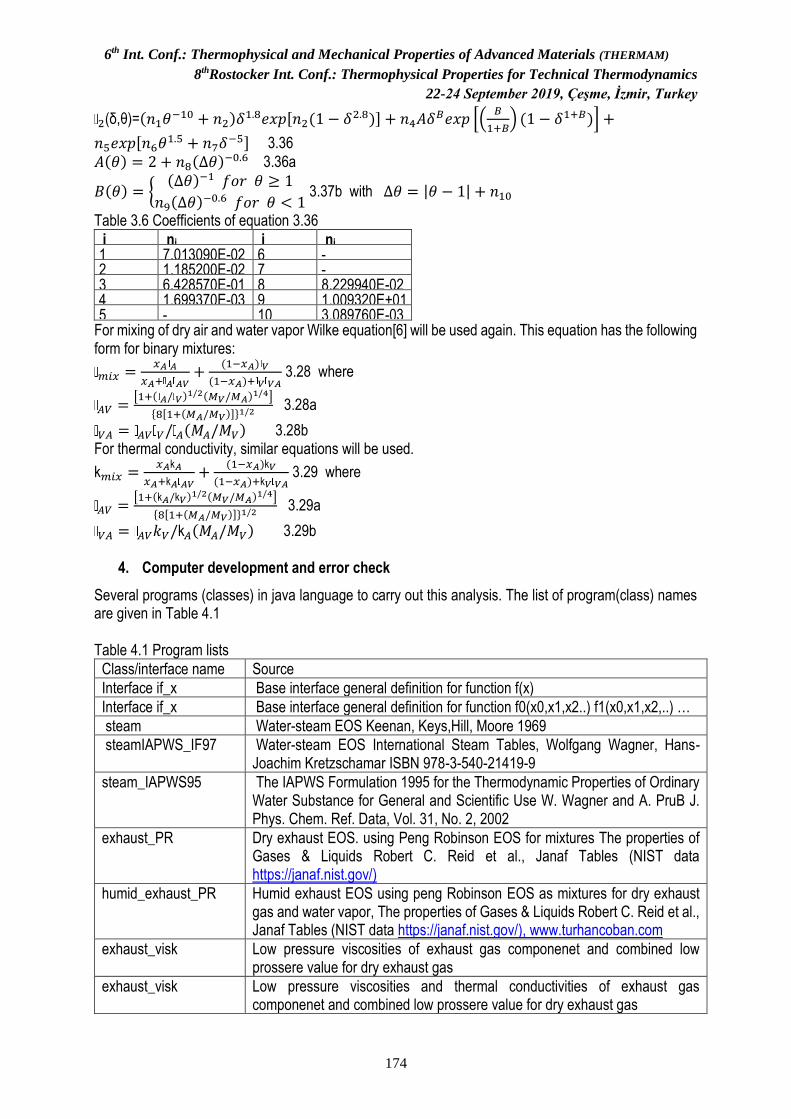
6th Int. Conf.: Thermophysical and Mechanical Properties of Advanced Materials (THERMAM)
8thRostocker Int. Conf.: Thermophysical Properties for Technical Thermodynamics
22-24 September 2019, Çeşme, İzmir, Turkey
174
2(δ,θ)=(𝑛1𝜃−10 + 𝑛2)𝛿
1.8𝑒𝑥𝑝[𝑛2(1 − 𝛿2.8)] + 𝑛4𝐴𝛿
𝐵𝑒𝑥𝑝 [(𝐵
1+𝐵) (1 − 𝛿1+𝐵)] +
𝑛5𝑒𝑥𝑝[𝑛6𝜃1.5 + 𝑛7𝛿
−5] 3.36
𝐴(𝜃) = 2 + 𝑛8(∆𝜃)−0.6 3.36a
𝐵(𝜃) = {(∆𝜃)−1 𝑓𝑜𝑟 𝜃 ≥ 1
𝑛9(∆𝜃)−0.6 𝑓𝑜𝑟 𝜃 < 1
3.37b with ∆𝜃 = |𝜃 − 1| + 𝑛10
Table 3.6 Coefficients of equation 3.36
i ni i ni
1 7.013090E-02 6 -4.117170E+00 2 1.185200E-02 7 -6.179370E+00 3 6.428570E-01 8 8.229940E-02
4 1.699370E-03 9 1.009320E+01 5 -
1.020000E+00 10 3.089760E-03
For mixing of dry air and water vapor Wilke equation[6] will be used again. This equation has the following form for binary mixtures:
𝑚𝑖𝑥 =𝑥𝐴 𝐴
𝑥𝐴+ 𝐴 𝐴𝑉+
(1−𝑥𝐴) 𝑉
(1−𝑥𝐴)+ 𝑉 𝑉𝐴 3.28 where
𝐴𝑉 =[1+( 𝐴/ 𝑉)
1/2(𝑀𝑉/𝑀𝐴)1/4]
{8[1+(𝑀𝐴/𝑀𝑉)]}1/2 3.28a
𝑉𝐴 = 𝐴𝑉 𝑉/ 𝐴(𝑀𝐴/𝑀𝑉) 3.28b For thermal conductivity, similar equations will be used.
k𝑚𝑖𝑥 =𝑥𝐴k𝐴
𝑥𝐴+k𝐴 𝐴𝑉+
(1−𝑥𝐴)k𝑉
(1−𝑥𝐴)+k𝑉 𝑉𝐴 3.29 where
𝐴𝑉 =[1+(k𝐴/k𝑉)
1/2(𝑀𝑉/𝑀𝐴)1/4]
{8[1+(𝑀𝐴/𝑀𝑉)]}1/2 3.29a
𝑉𝐴 = 𝐴𝑉𝑘𝑉/k𝐴(𝑀𝐴/𝑀𝑉) 3.29b
4. Computer development and error check
Several programs (classes) in java language to carry out this analysis. The list of program(class) names are given in Table 4.1 Table 4.1 Program lists
Class/interface name Source
Interface if_x Base interface general definition for function f(x)
Interface if_x Base interface general definition for function f0(x0,x1,x2..) f1(x0,x1,x2,..) …
steam Water-steam EOS Keenan, Keys,Hill, Moore 1969
steamIAPWS_IF97 Water-steam EOS International Steam Tables, Wolfgang Wagner, Hans-Joachim Kretzschamar ISBN 978-3-540-21419-9
steam_IAPWS95 The IAPWS Formulation 1995 for the Thermodynamic Properties of Ordinary Water Substance for General and Scientific Use W. Wagner and A. PruB J. Phys. Chem. Ref. Data, Vol. 31, No. 2, 2002
exhaust_PR Dry exhaust EOS. using Peng Robinson EOS for mixtures The properties of Gases & Liquids Robert C. Reid et al., Janaf Tables (NIST data https://janaf.nist.gov/)
humid_exhaust_PR Humid exhaust EOS using peng Robinson EOS as mixtures for dry exhaust gas and water vapor, The properties of Gases & Liquids Robert C. Reid et al., Janaf Tables (NIST data https://janaf.nist.gov/), www.turhancoban.com
exhaust_visk Low pressure viscosities of exhaust gas componenet and combined low prossere value for dry exhaust gas
exhaust_visk Low pressure viscosities and thermal conductivities of exhaust gas componenet and combined low prossere value for dry exhaust gas

6th Int. Conf.: Thermophysical and Mechanical Properties of Advanced Materials (THERMAM)
8thRostocker Int. Conf.: Thermophysical Properties for Technical Thermodynamics
22-24 September 2019, Çeşme, İzmir, Turkey
175
In Table 4.2 different EOS results compared for 3 thermodynamic states for water vapor properties. A Graphic user interface programs are also given for non-researchers to utilise these programs. For utilisation of researchers a small sample code is given to show calling of thermodynamic and thermophysical properties for a given state. Table 4.2 Comparisons of 3 different EOS for water & Steam thermodynamic properties.
Class P kPa T degree K v m3/kg h kJ/kg u kJ/kg
s kJ/(kgK)
x kg vap/kg
steam 3.535746 300 19.55028 1331.584 1262.459 4.455994 0.5 steamIAPWS_IF97 3.536589 300 19.54153 1331.234 1262.124 4.45533 0.5 steam_IAPWS95 3.536718 300 19.54013 1331.21 1262.102 4.455244 0.5 steam 101.325 300 0.001003 112.7105 112.6089 0.393245 -1.1E-09 steamIAPWS_IF97 101.325 300 0.001003 112.665 112.5634 0.393097 -1 steam_IAPWS95 101.325 300 0.001003 112.6549 112.5532 0.393062 -2 steam 101.325 400 1.801666 2730.178 2547.624 7.495023 2.467381 steamIAPWS_IF97 101.325 400 1.802056 2730.272 2547.679 7.496078 2 steam_IAPWS95 101.325 400 1.801984 2730.301 2547.715 7.496202 2
Figure 4.1 steam_IAPWS95 Graphic user interface By using equations given above a class called exhaust_PR is developed. The result of this class is compared with Peng-Robinson EOS results as a mixing of the gases for air. For comparison an air mixture percentages supply into the exhaust gas mixtures to check the results. (0.781121 N2+0.209535O2+0.009343Ar)
public static void main(String arg[]) { double T3=300; double P3=100; double molpercent[]={0.781121,0.209535,0.009343,0.0,0.0,0,0,0,0,0};
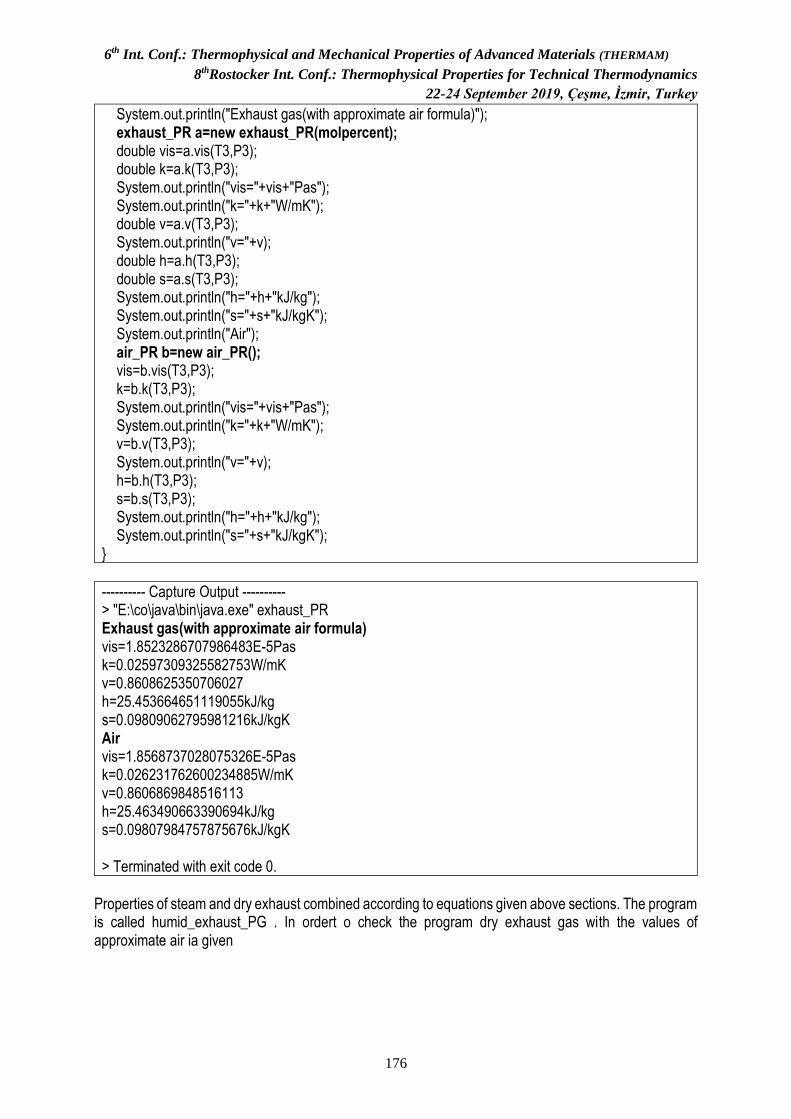
6th Int. Conf.: Thermophysical and Mechanical Properties of Advanced Materials (THERMAM)
8thRostocker Int. Conf.: Thermophysical Properties for Technical Thermodynamics
22-24 September 2019, Çeşme, İzmir, Turkey
176
System.out.println("Exhaust gas(with approximate air formula)"); exhaust_PR a=new exhaust_PR(molpercent); double vis=a.vis(T3,P3); double k=a.k(T3,P3); System.out.println("vis="+vis+"Pas"); System.out.println("k="+k+"W/mK"); double v=a.v(T3,P3); System.out.println("v="+v); double h=a.h(T3,P3); double s=a.s(T3,P3); System.out.println("h="+h+"kJ/kg"); System.out.println("s="+s+"kJ/kgK"); System.out.println("Air"); air_PR b=new air_PR(); vis=b.vis(T3,P3); k=b.k(T3,P3); System.out.println("vis="+vis+"Pas"); System.out.println("k="+k+"W/mK"); v=b.v(T3,P3); System.out.println("v="+v); h=b.h(T3,P3); s=b.s(T3,P3); System.out.println("h="+h+"kJ/kg"); System.out.println("s="+s+"kJ/kgK"); }
---------- Capture Output ---------- > "E:\co\java\bin\java.exe" exhaust_PR Exhaust gas(with approximate air formula) vis=1.8523286707986483E-5Pas k=0.02597309325582753W/mK v=0.8608625350706027 h=25.453664651119055kJ/kg s=0.09809062795981216kJ/kgK Air vis=1.8568737028075326E-5Pas k=0.026231762600234885W/mK v=0.8606869848516113 h=25.463490663390694kJ/kg s=0.09807984757875676kJ/kgK > Terminated with exit code 0.
Properties of steam and dry exhaust combined according to equations given above sections. The program is called humid_exhaust_PG . In ordert o check the program dry exhaust gas with the values of approximate air ia given
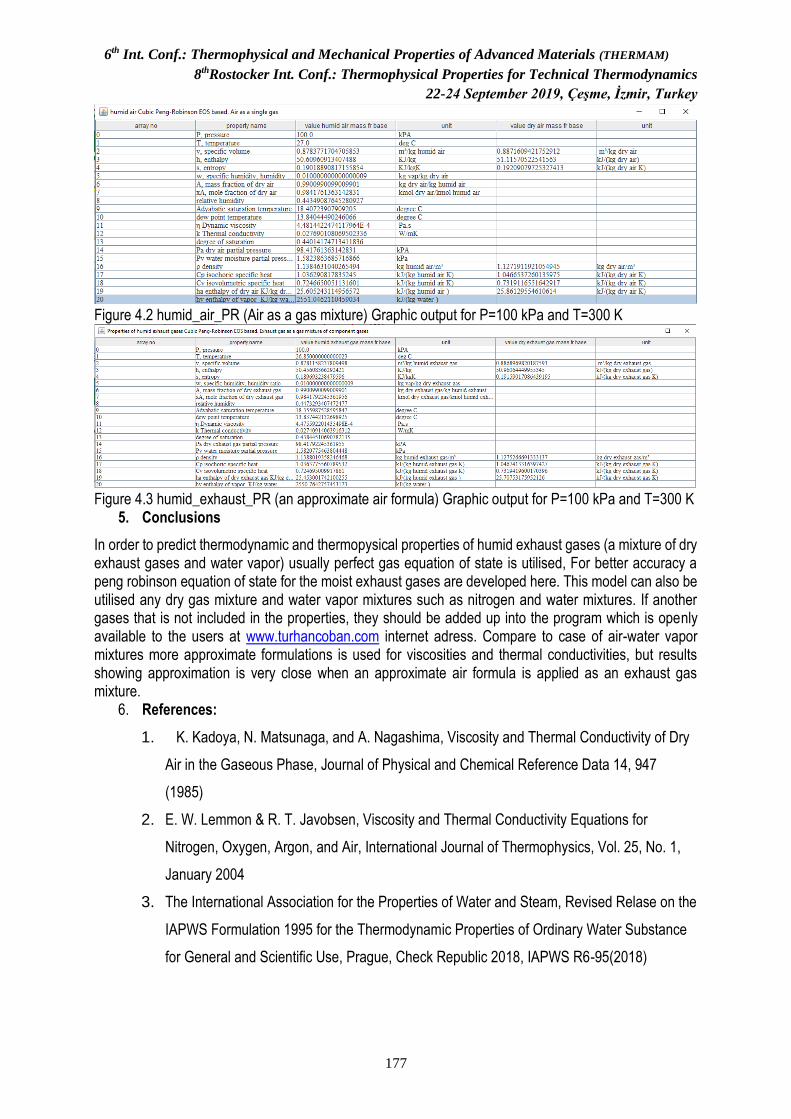
6th Int. Conf.: Thermophysical and Mechanical Properties of Advanced Materials (THERMAM)
8thRostocker Int. Conf.: Thermophysical Properties for Technical Thermodynamics
22-24 September 2019, Çeşme, İzmir, Turkey
177
Figure 4.2 humid_air_PR (Air as a gas mixture) Graphic output for P=100 kPa and T=300 K
Figure 4.3 humid_exhaust_PR (an approximate air formula) Graphic output for P=100 kPa and T=300 K
5. Conclusions
In order to predict thermodynamic and thermopysical properties of humid exhaust gases (a mixture of dry exhaust gases and water vapor) usually perfect gas equation of state is utilised, For better accuracy a peng robinson equation of state for the moist exhaust gases are developed here. This model can also be utilised any dry gas mixture and water vapor mixtures such as nitrogen and water mixtures. If another gases that is not included in the properties, they should be added up into the program which is openly available to the users at www.turhancoban.com internet adress. Compare to case of air-water vapor mixtures more approximate formulations is used for viscosities and thermal conductivities, but results showing approximation is very close when an approximate air formula is applied as an exhaust gas mixture.
6. References:
1. K. Kadoya, N. Matsunaga, and A. Nagashima, Viscosity and Thermal Conductivity of Dry
Air in the Gaseous Phase, Journal of Physical and Chemical Reference Data 14, 947
(1985)
2. E. W. Lemmon & R. T. Javobsen, Viscosity and Thermal Conductivity Equations for
Nitrogen, Oxygen, Argon, and Air, International Journal of Thermophysics, Vol. 25, No. 1,
January 2004
3. The International Association for the Properties of Water and Steam, Revised Relase on the
IAPWS Formulation 1995 for the Thermodynamic Properties of Ordinary Water Substance
for General and Scientific Use, Prague, Check Republic 2018, IAPWS R6-95(2018)
6th Int. Conf.: Thermophysical and Mechanical Properties of Advanced Materials (THERMAM)
8thRostocker Int. Conf.: Thermophysical Properties for Technical Thermodynamics
22-24 September 2019, Çeşme, İzmir, Turkey
178
4. The International Association for the Properties of Water and Steam, Revised Relase on the
IAPWS Industrial Formulation 1997 for the Thermodynamic Properties of Water and Steam,
Lucerne, Switzerland, August 2007, IAPWS R7(2012)
5. J.R. Cooper, R. B. Dooley, The International Association for the Properties of Water and
Steam, Guideline on an Equation of State for Humid Air in Contact with SeaWater and Ice,
Consistent with the IAPWS Formulation 2008 for the Thermodynamic Properties of
SeaWater
6. Robert C. Reid, John M. Prausnitz, Bruce E. Poling, The Properties of Gases & Liquids,
Fourth Edition, McGraw-Hill ISBN 0-07-051799-1
7. Bruce E. Poling, John M Prausnitz, John P. O’connel, The Properties of Gases & Liquids,
5th edition, 2004, McGraw-Hill ISBN 0-07-051799-1, ISBN-10: 0070116822
8. Numerical Thermodynamics, M. Turhan Coban, www.turhancoban.com
9. Ian H. Bell, Jorrit Wronski, Sylvain Quailin, and Vincent Lemort, Pure and Pseudo-pure
Fluid Thermophysical Property Evaluation and the Open-Source Thermophysical Property
Library CoolProp, Ind Eng Chem Res 2014 Feb 12;53(6) 2498-2508 DOI
10.1021/ie4033999
10. S. G. S. Beirao, A.P.C. Ribeiro, M.J.V. Lourenço, F.J.V. Santos, C.A. Nieto de Castro,
Thermal Conductivity of Humid Air, Int J Thermopys (2012) 33:1686-1703, DOI
10.1007/s10765-012-1245-5
11. Xiaoyan Ji, Thermodynamic properties of Humid air and their application in advanced power
generation cycles, Doctaral Thesis in Chemical Engineering, KTH Royal Institute of
Technology, Energy Processes, SE-100 44 Stockholm, Sweeden, ISBN 91-7178-437-3
12. R. Feistel, D.G. Wright, D.R. Jackett, K.Miyagawa, J.H. Reissmann, W. Wagner, U.
Overhoff, C. Guder, A. Feistal, G.M. Marion, Numerical implementation and ocenographic
application oft he thermodynamic potentials of liquid water, water vapor, ice, sewater and
humid air- Part 1: Background and equations, Ocean Sci., 6, 663-677,2010 DOI
10.5194/os-6-633-2010
13. R. Feistel, D.G. Wright, D.R. Jackett, K.Miyagawa, J.H. Reissmann, W. Wagner, U.
Overhoff, C. Guder, A. Feistal, G.M. Marion, Numerical implementation and ocenographic
application oft he thermodynamic potentials of liquid water, water vapor, ice, sewater and
humid air- Part 2: The library routines, Ocean Sci., 6, 695-718,2010 DOI 10.5194/os-6-695-
2010
6th Int. Conf.: Thermophysical and Mechanical Properties of Advanced Materials (THERMAM)
8thRostocker Int. Conf.: Thermophysical Properties for Technical Thermodynamics
22-24 September 2019, Çeşme, İzmir, Turkey
179
14. Simeen Sattar, Thermodynamics of Mixing Real Gases, Jornal of Chemical Education Vol.
77 No 10 October 2000
15. Wolgang Wagner, Hans-Joachim Kretzschmar, International Steam Tables, Properties of
water and steam based on industrial formulation IAPWS-IF97, Springer, ISBN 978-3-540-
21419-9, DOI 10.1007/978-3-540-74234-0
16. Joseph H. Keenan, Frederick G. Keyes, Philip G. Hill, Joan G. Moore, Steam Tables
Thermodynamic properties of Water incuding vapor, liquid and solid phases, Wiley-
Interscience, ISBN 0-471-04210-2
17. E. W. Lemmon1, and R. T Jacobsen , "Viscosity and Thermal Conductivity Equations for
Nitrogen, Oxygen, Argon, and Air", International Journal of Thermophysics, Vol. 25, No. 1,
January 2004 (© 2004)
18. Reichenberg, D, The Viscosities of Gas Mixtures at Moderate Pressures, NPL Rept. Chem.
29, National Physical Labaratory, Tedington, England, May 1974
19. Reichenberg, D, New Simplified Methods fort he Estimation of Viscosities of Gas Mixtures
at Moderate Pressures, Natl. Eng. Lab. Rept. Chem. 53, East Kilbride, Glosgow, Scotland,
1979
6th Int. Conf.: Thermophysical and Mechanical Properties of Advanced Materials (THERMAM)
8thRostocker Int. Conf.: Thermophysical Properties for Technical Thermodynamics
22-24 September 2019, Çeşme, İzmir, Turkey
180
Hybrid Integral Transforms in Nonlinear Heat and Mass Transfer
Renato M. Cotta1,2*, Kleber M. Lisboa3, Péricles C. Pontes1,4,
Carolina P. Naveira-Cotta1, João N. N. Quaresma5, Emanuel N. Macedo5
1Mechanical Eng. Dept., POLI & COPPE, Universidade Federal do Rio de Janeiro, UFRJ, Brazil
2 General Directorate of Nuclear and Technological Development, DGDNTM, Brazilian Navy, Ministry of Defence, RJ, Brazil
3Centro Federal de Educação Tecnológica Celso Suckow da Fonseca, CEFET/RJ, RJ, Brazil
4 Universidade Federal do Sul e Sudeste do Pará, UNIFESSPA, Santana do Araguaia, PA, Brazil
5Chemical Eng. Dept., Graduate Program in Natural Resource Engineering in the Amazon, Institute of Technology, Federal University of Pará, UFPA, PA, Brazil
*Corresponding author: [email protected]
Keywords: Hybrid methods, Integral transforms, Convection-diffusion, Eigenvalue problems,
Direct contact membrane distillation, Liquid supported membrane extraction
Abstract: A hybrid analytical-numerical method known as the Generalized Integral Transform
Technique (GITT), first proposed in the mid 80’s, has been gradually advanced to handle
various classes of nonlinear problems in transport phenomena, including fluid flow, heat and
mass transfer. The aim of this hybrid approach is to offer robust, precise, and cost-effective
simulations in convection-diffusion problems, combining analytical eigenfunction expansions
with numerical solutions of the linear or nonlinear transformed ordinary differential systems.
The present lecture provides a general overview of the methodology, which is based on the
classical integral transform approach, generalized to handle a priori non-transformable
problems, such as in the case of nonlinear formulations. Particular attention is given to recent
extensions on the GITT, including the avoidance of implicit nonlinear transformed systems and
the adoption of nonlinear eigenvalue problems in the proposed expansions, with the resulting
gains in computational performance and convergence enhancement effect. Finally, recent
applications involving desalination with direct contact membrane distillation and metal
extraction with supported liquid membrane are more closely considered.
Introduction/Background: Nonlinear transport phenomena are present in most natural or
man-made processes that involve heat and mass transfer, either characterized by
nonlinearities in the physical properties, or in the convection, diffusion, and dissipation
constitutive relations, or additionally in the boundary and equation source terms. While such
nonlinearities are responsible for some of the most relevant and eventually intriguing physical
6th Int. Conf.: Thermophysical and Mechanical Properties of Advanced Materials (THERMAM)
8thRostocker Int. Conf.: Thermophysical Properties for Technical Thermodynamics
22-24 September 2019, Çeşme, İzmir, Turkey
181
behaviours, the analysis of the corresponding mathematical formulations generally involve a
much higher degree of complexity in comparison to the associated linear versions which might
result from simplifying assumptions. The so-called numerical methods for the solution of partial
differential equations (PDEs), such as the best known finite difference, finite element and finite
volume methods [1-3], are very closely associated with the need of handling more involved
nonlinear formulations that could not be tackled by the classical analytical approaches, after
the development of the digital computer and along the following decades. Such approximate
solution methods involve some sort of discretization process and the reduction of the
differential problem into an algebraic formulation, usually involving some linearization and/or
iteration scheme to computationally solve the discretized system. On the other hand, despite
the efforts in developing analytical methodologies for the exact solution of nonlinear PDEs [4-
6], these are still very restricted in applicability and lack generality to be considered systematic
approaches. In this context, numerical methods have been by far the preferred solution path
for nonlinear problems, under various different and competitive schemes and algorithms.
Nevertheless, further advancements are still required towards making computationally
intensive tasks more feasible, such as in optimization, inverse problem analysis, and
simulation under uncertainty.
Alongside the development of the well-established numerical methods, in light of the
limitations of the classical analytical approaches, a number of ideas have flourished mixing the
two concepts, that led to a few now mature hybrid numerical-analytical methodologies. One
such successful development is known as the Generalized Integral Transform Technique
(GITT) [7-17], which is based on the extension of the classical integral transform method for
linear diffusion problems [5,18]. The GITT application in nonlinear problems was originally
based on the interpretation that the PDEs can be rewritten such that the nonlinear terms can
all be moved into nonlinear source terms at both the equation and boundary conditions, while
keeping linear characteristic coefficients in the redefined formulation, that shall provide the
information to be carried along to the chosen eigenvalue problem. Then, after proposing the
eigenfunction expansion and performing the integral transformation itself, the rewritten
nonlinear PDE leads to a coupled nonlinear infinite transformed ordinary differential system to
be numerically solved. Along the last three decades after the GITT proposition to nonlinear
problems [8], this approach has been progressively extended to handle various classes of
problems, with emphasis on nonlinear formulations with variable physical properties, nonlinear
source terms, moving boundaries, and nonlinear convective or reaction/dissipation terms.
In parallel to the successful application in different classes of problems, the hybrid
approach has been progressively enhanced on both the methodological and algorithmic points
of view. The two main tracks for improving convergence rates in eigenfunction expansions
6th Int. Conf.: Thermophysical and Mechanical Properties of Advanced Materials (THERMAM)
8thRostocker Int. Conf.: Thermophysical Properties for Technical Thermodynamics
22-24 September 2019, Çeşme, İzmir, Turkey
182
have been continuously explored, related to the consideration of more informative eigenvalue
problems and to the filtering of the original formulation to extract information from the source
terms. For instance, we may point out some fairly recent contributions such as the proposition
of a single domain reformulation strategy for complex configurations or heterogeneous media
[19-22], the adoption of convective eigenvalue problems for convergence acceleration [23,24],
and the development of vector eigenfunction expansions for the Navier-Stokes equations [25-
28]. More recently, an alternative solution path based on the proposition of nonlinear
eigenvalue problems has been advanced [29], accounting for all or part of the nonlinear
information in the eigenfunction expansion base. The GITT with nonlinear eigenfunctions was
then applied to the specific case of nonlinear boundary conditions [29,30], which led to a
remarkable improvement on convergence rates, as compared to the more traditional path with
a linear eigenvalue problem.
The present lecture reviews the GITT approach in handling nonlinear diffusion and
convection-diffusion problems, first by considering the traditional formal solution path with a
linear eigenvalue problem, including an algorithm variant that avoids an implicit nonlinear
transformed ODE system, followed by the more recent analysis based on a nonlinear
eigenvalue problem choice. Recently tackled applications in nonlinear heat and mass transfer
are then selected to briefly illustrate the methodologies, related to desalination through direct
contact membrane distillation and metals extraction by liquid supported membranes. In the
first case, the single domain formulation strategy is employed in the nonlinear heat and mass
transfer problem for the distillation process, accounting for the permeate, the membrane and
the distillate regions as one single set of equations with space variable coefficients. In the
second case, the nonlinear coupled mass transfer equations for metal extraction are handled
adopting a nonlinear eigenvalue problem that carries the information on the nonlinear reactive
terms in the boundary conditions at the supported liquid membrane. In both cases, the
convergence of the eigenfunction expansions is illustrated and solution verification is provided
by comparisons against independent numerical simulations, either from available literature
results or obtained from commercial simulation software.
Formal Solutions: Consider a fairly general convection-diffusion problem for M coupled
potentials, ( , )kT tx , =1,2,...k M , with a convective term defined through a nonlinear velocity
vector u(x,t,T) and the nonlinear source terms, ( , , )kP tx T :
( , )( , , ) ( , , ). . ( , , ) ( , , ) ( , , ) , k
k k k k k k k k k k
T tw t T t T K t T T d t T T P t
t
+ = − +
xx u x T x x x T
in , > 0, =1,2,...V t k Mx (1a)
with initial and boundary conditions given by
6th Int. Conf.: Thermophysical and Mechanical Properties of Advanced Materials (THERMAM)
8thRostocker Int. Conf.: Thermophysical Properties for Technical Thermodynamics
22-24 September 2019, Çeşme, İzmir, Turkey
183
( ,0) ( ) , k kT f V = x x x (1b)
( , , ) ( , ) ( , , ) ( , , ) ( , , ) , , t > 0 kk k k k k k k k
Tt T T t t T K t T t S
+ =
x x x x x T x
n (1c)
where w, K, and d are the nonlinear equation coefficients for the transient, diffusion, and dissipation
terms, while and are the nonlinear boundary condition coefficients, that yield the boundary conditions
of first to third type, n is the outward drawn normal vector to surface S, and ( , , )k tx T are the coupling
nonlinear boundary source terms. The nonlinear equation and boundary condition coefficients were here
taken as functions of only the potential ( , )kT tx , while the velocity vector and equation and boundary
source terms are written in terms of the whole vector of potentials, T, thus coupling the various equations
and potentials. This is in fact a quite general formulation, since any missing term within those here
represented can be incorporated into the equation and boundary source terms.
The most usual formal integral transform solution of the nonlinear problem (1) involves
the selection of a linear eigenvalue problem, which offers the basis for the eigenfunction
expansion that represents the potential, as first proposed in [8]. This is in fact equivalent to
rewriting problem (1) with characteristic linear coefficients that have only x dependence, i.e.,
w*(x), K*(x), d*(x), α*(x) and β*(x), while the new nonlinear source terms then incorporate the
remaining nonlinear portions of the equation and boundary conditions operators, including the
nonlinear convection term, in the form:
* * * *( , )( ) . ( ) ( ) ( , , ) , in , > 0, =1,2,...k
k k k k k k
T tw K T d T P t V t k M
t
= − +
xx x x x T x (2a)
with initial and boundary conditions given by
( ,0) ( ) , k kT f V = x x x (2b)
* * * *( ) ( , ) ( ) ( ) ( , , ) , , t > 0 kk k k k k
TT t K t S
+ =
x x x x x T x
n (2c)
where the nonlinear source terms are now given by
* *
* *
( , )( , , ) ( , , ) [ ( , , ) ( )] ( , , ).
.[ ( , , ) ( )] [ ( , , ) ( )]
kk k k k k k
k k k k k k k k
T tP t P t w t T w t T
t
K t T K T d t T d T
= − − − +
+ − − −
xx T x T x x u x T
x x x x
(2d)
* * * *( , , ) ( , , ) [ ( , , ) ( )] ( , ) [ ( , , ) ( , , ) ( ) ( ) ] kk k k k k k k k k k k k
Tt t t T T t t T K t T K
= − − − −
x T x T x x x x x x x
n (2e)
This more traditional approach is thoroughly documented in previous works [8-17], and
therefore is just briefly described here. The chosen characteristic x-dependent coefficients that
appear in eqs. (2) then naturally lead to the preferred linear eigenvalue problem, written as:
* 2 * *
, , ,. ( ) ( ) ( ) ( ) ( ) 0 , k k i k i k k k iK w d V + − = x x x x x x (3a)
with boundary conditions
6th Int. Conf.: Thermophysical and Mechanical Properties of Advanced Materials (THERMAM)
8thRostocker Int. Conf.: Thermophysical Properties for Technical Thermodynamics
22-24 September 2019, Çeşme, İzmir, Turkey
184
,* * *
,
( )( ) ( ) ( ) ( ) 0,
k i
k k i k kK S
+ =
xx x x x x
n (3b)
Then, the following integral transform pair is defined from problem (3):
*
, ,( ) ( ) ( ) ( , ) , transformk i k k i kV
T t w Τ t dv= x x x (4a)
, ,
1 ,
1( , ) ( ) ( ) , inversek k i k i
i k i
Τ t T tN
=
= x x (4b)
with the normalization integrals given by
* 2
, ,( ) ( ) k i k k iV
N w dv= x x (4c)
Application of the integral transformation procedure over eq. (3a) through the operator
,( ) ( ) k iV
dv− x , leads to the ordinary differential system for the transformed potentials, , ( )k iT t
, written as:
, 2
, , ,
( )( ) ( , ), , =1,2, .0 , . 1,2.
k i
k i k i k i
dT tT t g t k M
dt i
t = + = T (5a)
with initial conditions
, ,(0) = k i k iT f (5b)
where,
,*
,* *
, , * *
( ) ( )
( , ) ( ) ( , , ) ( , , ) ( ) ( )
k i
k i k
k i k i k kV S
k k
K
g t P t dv t ds
−
= + +
x x
nT x x T x Tx x
(5c)
*
, ,( ) ( ) ) k i k k i kV
f w f dv= x x (x (5d)
The nonlinear initial value problem (5) is then numerically solved with automatic
accuracy control through available routines in either public domain or scientific subroutines
libraries, or even in symbolic-numerical computation packages, such as the Mathematica
platform [31]. After numerically computing the transformed potentials along the t-variable, the
inverse formula is recalled so as to recover the original potentials.
The formal solution above derived provides the basic working expressions for the
integral transform approach. For an improved computational performance, it is always
recommended to reduce the importance of the equation and boundary source terms so as to
enhance the eigenfunction expansions convergence behavior, for instance through the
proposition of analytical filtering solutions, which essentially remove information from the
source terms into a desirably simple analytical expression. The filter is in general proposed as:
( ) ( ) ( )*
,, , ;k k k fT t T t T t= +x x x (6)
6th Int. Conf.: Thermophysical and Mechanical Properties of Advanced Materials (THERMAM)
8thRostocker Int. Conf.: Thermophysical Properties for Technical Thermodynamics
22-24 September 2019, Çeşme, İzmir, Turkey
185
where the variable t is a parameter in the filter solution proposition, , ( ; )k fT tx . Eventually, a
nonlinear implicit filter formulation can be proposed, for instance, to make the boundary
conditions (1c) homogeneous, even in the presence of nonlinear boundary source terms.
The traditional approach above described, for a nonlinear functional form of the
transient term coefficient in the original problem, eq. (1a), results in a coupling nonlinear
coefficients matrix in the t-derivatives of the transformed system, in light of the potential t-
derivatives present in the redefined nonlinear source term, eq. (2d). From the computational
point of view, such implicit nonlinear formulation would require that the derived nonlinear
coefficients matrix be inverted along the numerical integration process for the transformed
system, as possible in most of the initial value problem solvers, resulting in increased
computational cost. Therefore, it is advantageous to rewrite the problem formulation so as to
offer an explicit linear integral transformation of the transient term, as proposed in [32] and
implemented in the GITT automatic solver coined UNIT (Unified Integral Transforms) [33,34].
Following this idea, the transient term coefficient can be rewritten as:
* * 1
*
( , , )( , , ) ( ) ( ) ( , , )
( )
k kk k k k k k
k
w t Tw t T w w C t T
w
−= =x
x x x xx
(7a)
which leads to the following reformulated equation
* ( , )( ) ( , , ) . ( , , ) ( , , ) ( , , ) ( , , ). ,
in , > 0, =1,2,...
kk k k k k k k k k k k
T tw C t T K t T T d t T T P t t T
t
V t k M
= − + −
xx x x x x T u x T
x
(7b)
or simply,
* ( , )( ) ( , , ) . ( , , ) ( , , ) , in , > 0, =1,2,...k
k k k k k k k
T tw C t T K t T T G t V t k M
t
= +
xx x x x T x (7c)
where
( , , ) ( , , ) ( , , ) ( , , ). ( , , ) k k k k k k k k kG t T C t T P t t T d t T T= − −x x x T u x T x (7d)
Then, the same eigenvalue problem of eqs. (3) and the integral transform pair of eqs.
(4) can be employed in the integral transformation process, which yields the transformed
system below:
,
,
( )( , ), 1, =1,2,.. , , 2.0
k i
k i
dT th t k Mt
dti = = T (8a)
with initial conditions
, ,(0) = k i k iT f (8b)
where, * *
, , ,( , ) ( , ) ( , )k i k i k ih t h t g t= +T T T (8c)
* *
, , , ,( , ) ( ) ( , , ) . ( , , ) ; ( , ) ( ) ( , , ) k i k i k k k k k k i k i kV V
h t C t T K t T T dv g t G t dv= = T x x x T x x T (8d,e)
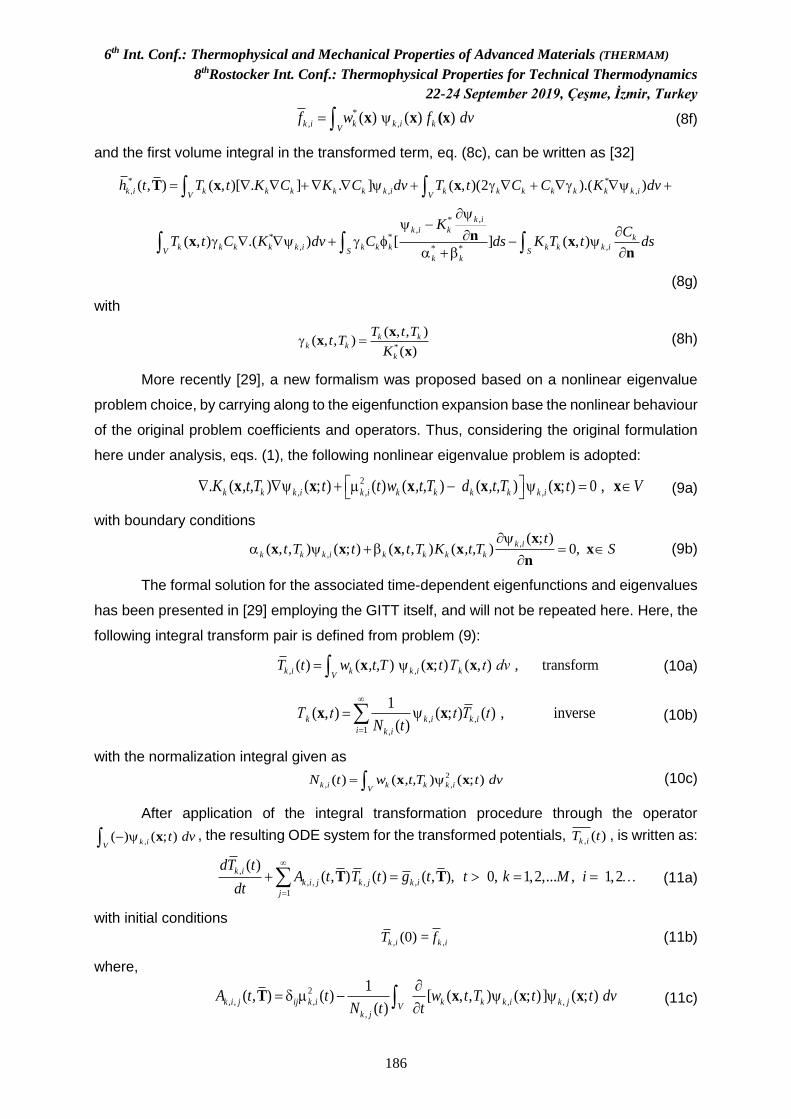
6th Int. Conf.: Thermophysical and Mechanical Properties of Advanced Materials (THERMAM)
8thRostocker Int. Conf.: Thermophysical Properties for Technical Thermodynamics
22-24 September 2019, Çeşme, İzmir, Turkey
186
*
, ,( ) ( ) ) k i k k i kV
f w f dv= x x (x (8f)
and the first volume integral in the transformed term, eq. (8c), can be written as [32]
* *
, , ,
,*
,* *
, ,* *
( , ) ( , )[ . ] . ] ( , )(2 ).( )
( , ) .( ) [ ] ( , )
k i k k k k k k i k k k k k k k iV V
k i
k i kk
k k k k k i k k k k k k iV S S
k k
h t T t K C K C dv T t C C K dv
KC
T t C K dv C ds K T t ds
= + + + +
−
+ − +
T x x
nx xn
(8g)
with
*
( , , )( , , )
( )
k kk k
k
T t Tt T
K =
xx
x (8h)
More recently [29], a new formalism was proposed based on a nonlinear eigenvalue
problem choice, by carrying along to the eigenfunction expansion base the nonlinear behaviour
of the original problem coefficients and operators. Thus, considering the original formulation
here under analysis, eqs. (1), the following nonlinear eigenvalue problem is adopted:
2
, , ,. ( ) ( ; ) ( ) ( ) ( ) ( ; ) 0 , k k k i k i k k k k k iK ,t,T t t w ,t,T d ,t,T t V + − = x x x x x x (9a)
with boundary conditions
,
,
( ; )( , , ) ( ; ) ( , , ) ( ) 0,
k i
k k k i k k k k
tt T t t T K ,t,T S
+ =
xx x x x x
n (9b)
The formal solution for the associated time-dependent eigenfunctions and eigenvalues
has been presented in [29] employing the GITT itself, and will not be repeated here. Here, the
following integral transform pair is defined from problem (9):
, ,( ) ( ) ( ; ) ( , ) , transformk i k k i kV
T t w ,t,T t Τ t dv= x x x (10a)
, ,
1 ,
1( , ) ( ; ) ( ) , inverse
( )k k i k i
i k i
Τ t t T tN t
=
= x x (10b)
with the normalization integral given as
2
, ,( ) ( ) ( ; ) k i k k k iV
N t w ,t,T t dv= x x (10c)
After application of the integral transformation procedure through the operator
,( ) ( ; ) k iV
t dv− x , the resulting ODE system for the transformed potentials, , ( )k iT t , is written as:
,
, , , ,
1
0, 1,2,...( )
( , ) ( , , 1) ( , ) ,2k i
k i j k j k i
j
dT tA t T t g t t k M
di
t
=
== = + T T (11a)
with initial conditions
, ,(0) = k i k iT f (11b)
where,
2
, , , , ,
,
1( , ) ( ) [ ( , , ) ( ; )] ( ; )
( )k i j ij k i k k k i k j
Vk j
A t t w t T t t dvN t t
= −
T x x x (11c)

6th Int. Conf.: Thermophysical and Mechanical Properties of Advanced Materials (THERMAM)
8thRostocker Int. Conf.: Thermophysical Properties for Technical Thermodynamics
22-24 September 2019, Çeşme, İzmir, Turkey
187
,
,
, ,
( ; ) ( )
( , ) ( ; ) ( , , ) ( , , ) ( , , ) ( , , )
k i
k i k k
k i k i k kV S
k k k k
t K ,t,T
g t t P t dv t dst T t T
−
= + +
x x
nT x x T x Tx x
(11d)
, ,( 0 ,0)) ( ;0) ) k i k k k i kV
f w , ,T f dv= x (x x (x (11e)
This more general solution path provides a formal solution that encompasses the usual
formalism with a linear eigenvalue problem and has been shown to result in improved
convergence rates [29,30]. On the other hand, it has the drawback of requiring that the
eigenvalue problem be solved simultaneously with the transformed ODE system, yielding time-
dependent transformed potentials, eigenvalues, and eigenfunctions. The GITT solution of the
nonlinear eigenvalue problem (3) has been presented in [29], by considering an auxiliary linear
eigenvalue problem of known solution to offer an eigenfunction expansion for the nonlinear
eigenfunctions, leading, upon integral transformation, to a nonlinear algebraic eigenvalue
problem that needs to be solved simultaneously with the ODE system (5). Alternatively, the
algebraic eigenvalue problem can be differentiated with respect to the t variable and solved
as a larger coupled ODE system jointly with the transformed potentials, eqs. (11).
Applications:
Direct Contact Membrane Distillation (DCMD)
Water scarcity is an increasingly common problem in several communities around the
globe [35]. At the same time, the consensus of the impact of human activities on climate
change has urged the development of more sustainable energy usage, emphasizing the
importance of the recovery of low-grade waste heat from industrial processes [36]. Membrane
Distillation (MD) has emerged as a viable alternative to tackle both problems, especially for
small communities in remote areas with limited availability of potable water and electrical power
[37]. This process is driven by a vapor pressure difference along a hydrophobic membrane
promoted by flowing hot brackish water or brine on one of its sides. Amongst the different MD
configurations, the Direct Contact Membrane Distillation (DCMD) is the simplest to operate
and to build. DCMD is characterized by the use of a cold distilled water permeate flow and the
condensation of water at the permeate-membrane interface [38].
Experimental investigation on the influence of different parameters in DCMD, especially
regarding the membrane morphology and dimensions, are often cumbersome and expensive.
Therefore, reliable modelling and computer simulations are powerful tools for the optimization
of the desalination modules and the operating conditions [39,40].
In this work, a simplified single-fibre model of a hollow-fibre membrane-based
desalination module is reformulated with the single domain approach and solved through the
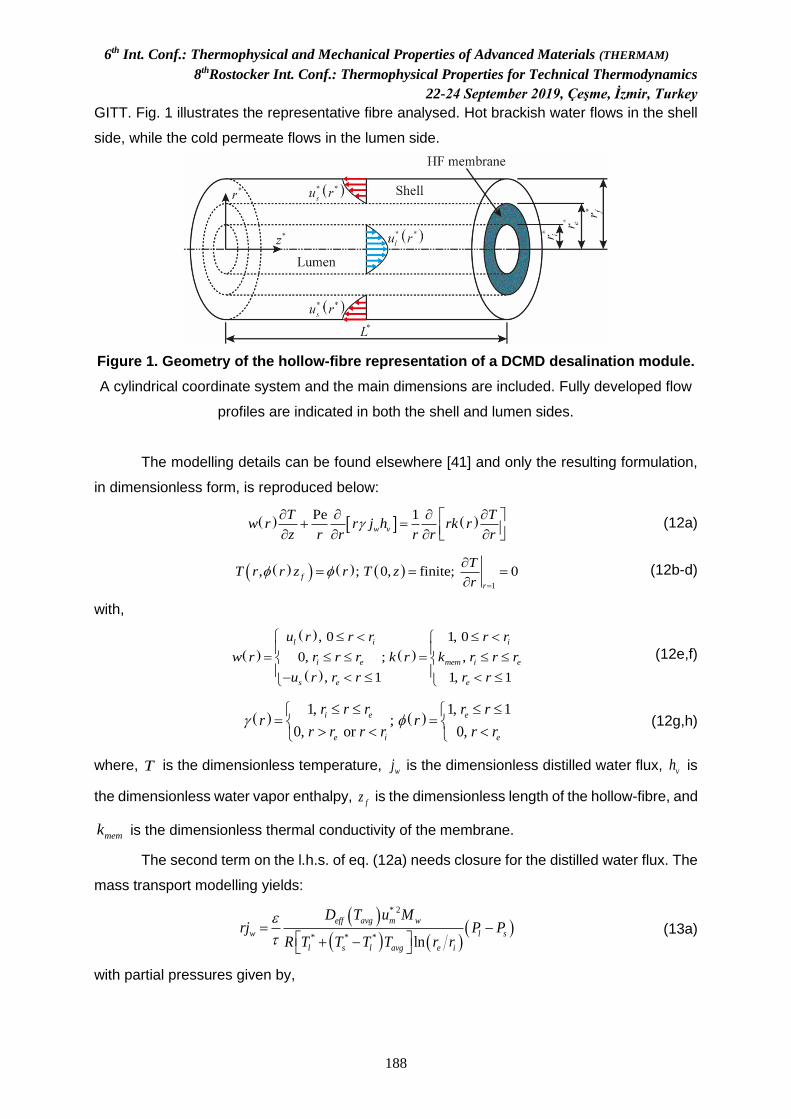
6th Int. Conf.: Thermophysical and Mechanical Properties of Advanced Materials (THERMAM)
8thRostocker Int. Conf.: Thermophysical Properties for Technical Thermodynamics
22-24 September 2019, Çeşme, İzmir, Turkey
188
GITT. Fig. 1 illustrates the representative fibre analysed. Hot brackish water flows in the shell
side, while the cold permeate flows in the lumen side.
Figure 1. Geometry of the hollow-fibre representation of a DCMD desalination module.
A cylindrical coordinate system and the main dimensions are included. Fully developed flow
profiles are indicated in both the shell and lumen sides.
The modelling details can be found elsewhere [41] and only the resulting formulation,
in dimensionless form, is reproduced below:
( ) ( )Pe 1
w v
T Tw r r j h rk r
z r r r r r
+ =
(12a)
( )( ) ( ) ( )1
, ; 0, finite; 0f
r
TT r r z r T z
r
=
= = =
(12b-d)
with,
( )
( )
( )
( )
, 0 1, 0
0, ; ,
, 1 1, 1
l i i
i e mem i e
s e e
u r r r r r
w r r r r k r k r r r
u r r r r r
= = −
(12e,f)
( ) ( )1, 1, 1
; 0, or 0,
i e e
e i e
r r r r rr r
r r r r r r
= =
(12g,h)
where, T is the dimensionless temperature, wj is the dimensionless distilled water flux, vh is
the dimensionless water vapor enthalpy, fz is the dimensionless length of the hollow-fibre, and
memk is the dimensionless thermal conductivity of the membrane.
The second term on the l.h.s. of eq. (12a) needs closure for the distilled water flux. The
mass transport modelling yields:
( )
( ) ( )( )
* 2
* * * ln
eff avg m w
w l s
l s l avg e i
D T u Mrj P P
R T T T T r r
= −
+ −
(13a)
with partial pressures given by,
6th Int. Conf.: Thermophysical and Mechanical Properties of Advanced Materials (THERMAM)
8thRostocker Int. Conf.: Thermophysical Properties for Technical Thermodynamics
22-24 September 2019, Çeşme, İzmir, Turkey
189
( )( ) ( )* * *
, * * 2
3816.44exp 23.1964
, 227.021
l s l i
l NaCl l l
w m
T T T T r zP x a
u
−
+ − + = − (13b)
( )( ) ( )* * *
, * * 2
3816.44exp 23.1964
, 227.021
l s l e
s NaCl s s
w m
T T T T r zP x a
u
−
+ − − = − (13c)
where effD is the dimensionless effective diffusivity through the membrane, lP is the
dimensionless partial pressure of water vapor at the lumen-membrane interface, sP is the
dimensionless partial pressure of water vapor at the shell-membrane interface, ,NaCl lx is the
mole fraction of NaCl at the lumen-membrane interface, ,NaCl sx is the mole fraction of NaCl at
the shell-membrane interface, la is the activity coefficient of water at the lumen-membrane
interface, and sa is the activity coefficient of water at the shell-membrane interface.
A conventional Sturm-Liouville eigenvalue problem, such as the one shown in eqs.
(3a,b), is proposed to solve eqs. (12a-h) through the GITT, given by:
( ) ( ) ( )210i
i i
ddrk r w r r
r dr dr
+ =
(14a)
with boundary conditions given by,
( )1
0 finite; 0ii
r
d
dr
=
= = (14b,c)
The GITT formalism proceeds with the proposition of the transform-inverse pair shown
below:
( ) ( ) ( ) ( ) ( ) ( ) ( )1
01,
1, ; ,i i i i
ii
T z rw r r T r z dr T r z T z rN
=
= =
(15a,b)
where,
( ) ( )1 2
,0
i iN rw r r dr = (15c)
Operating eq. (12a) and eq. (12b) with ( )( )1
0,
1i
i
r r drN
and ( ) ( )( )1
0irw r r dr ,
respectively, we then have,
( ) ( ) ( )2
0
1
Peii i w i p ij j
j
dTT z rj h b c E T z
dz
=
+ = +
(16a)
( ) ( )1 1
0ij j ij j f i
j j
C T D T z f
= =
+ = (16b)
where,
6th Int. Conf.: Thermophysical and Mechanical Properties of Advanced Materials (THERMAM)
8thRostocker Int. Conf.: Thermophysical Properties for Technical Thermodynamics
22-24 September 2019, Çeşme, İzmir, Turkey
190
( ) ( ) ( )0
ir
ij i jC rw r r r dr = (16c)
( ) ( ) ( )1
eij i j
rD rw r r r dr = (16d)
( )1 e
i
ri
ij jr
i
dE r dr
N dr
= (16e)
( ) ( )11
; e
i e
ri
i i ir r
i
db dr f rw r r dr
N dr= =
(16f,g)
The system of ordinary differential equations of eqs. (16a-g) was then truncated to a
finite order N and solved with a dedicated Fortran code using IMSL function DBVPFD [42]. The
temperature field is then recovered after recalling the inverse formula, eq. (15b).
Supported liquid membrane (SLM) extraction
Supported liquid membrane (SLM) is a thin layer formed by an organic extractant phase
immobilized on hydrophobic microporous polymer membranes which operate between two
aqueous phase promoting the separation of solutes from highly diluted solutions. Its main
usage is in industrial and analytical applications involving separation, concentration or
treatment of waste water (usually in extraction of heavy metals) [43]. The organic phase
contains species whose high affinity to the solute lead to a complexation reaction and its
product diffuses through the membrane being separated from the lumen flow. As the pore
structure is hydrophobic, water remains inside the membrane. Thus, important factors in the
separation efficiency are the composition of the organic phase and the kinetic effects.
The theoretical example here addressed is based on a hollow fibre supported liquid
membrane whose mechanism of reaction can be represented by:
1
2
k
kA B C ABC⎯⎯→+ + ⎯⎯ (17)
where A and B represent the solutes fed into the lumen and C is the species in the organic
phase. In this process, only the species A is separated, while B remains in the membrane due
to capillary forces [44]. Figure 2 illustrates a scheme of the membrane and the separation
process.
The dimensionless mathematical model for the concentration of the species A and B
within the mass separator is given by [44]:
( )( ) ( ), ,
, 0 1, 0,n nn
C r z C r zU r r r z n Aor B
z r r r
= =
(18a)
( ),0 1, 0 1,nC r r n A or B = = (18b)
( )
0
,0 , 0,
n
r
C r zz n Aor B
r=
= =
(18c)
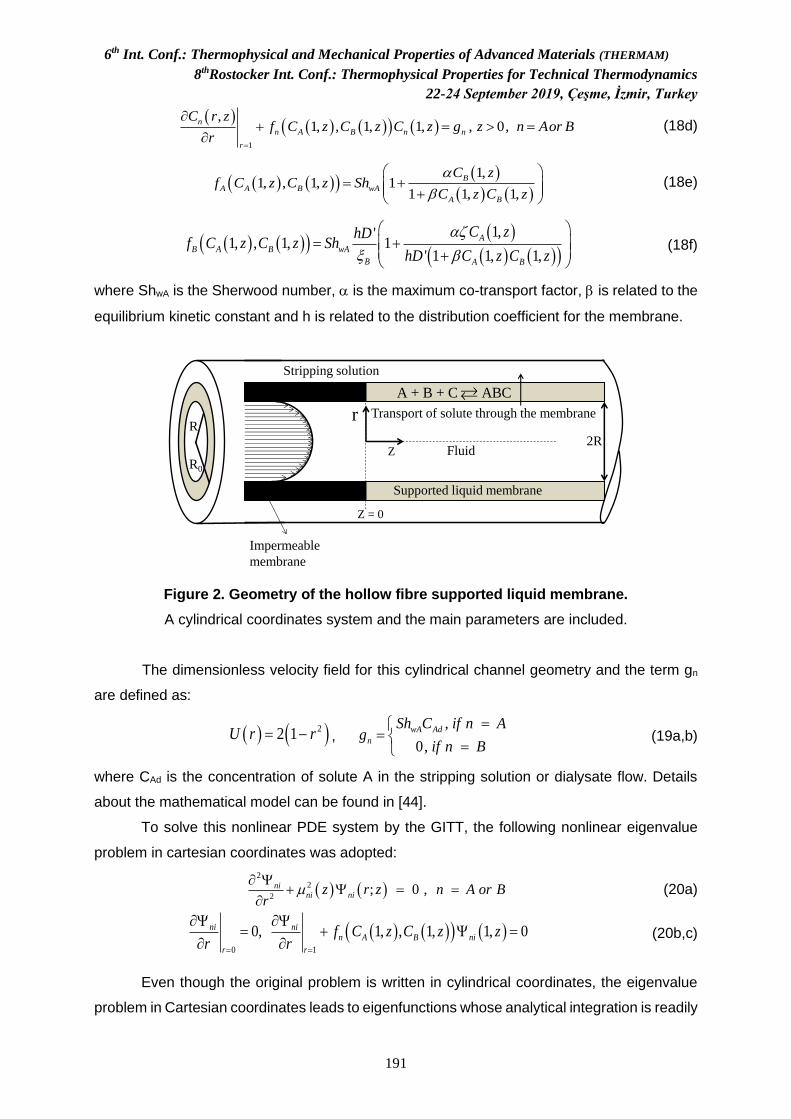
6th Int. Conf.: Thermophysical and Mechanical Properties of Advanced Materials (THERMAM)
8thRostocker Int. Conf.: Thermophysical Properties for Technical Thermodynamics
22-24 September 2019, Çeşme, İzmir, Turkey
191
( )
( ) ( )( ) ( )1
,1, , 1, 1, , 0,
n
n A B n n
r
C r zf C z C z C z g z n Aor B
r=
+ = =
(18d)
( ) ( )( )( )
( ) ( )
1,1, , 1, 1
1 1, 1,
B
A A B wA
A B
C zf C z C z Sh
C z C z
= + +
(18e)
( ) ( )( )( )
( ) ( )( )1,'
1, , 1, 1' 1 1, 1,
A
B A B wA
B A B
C zhDf C z C z Sh
hD C z C z
= +
+
(18f)
where ShwA is the Sherwood number, is the maximum co-transport factor, is related to the
equilibrium kinetic constant and h is related to the distribution coefficient for the membrane.
Figure 2. Geometry of the hollow fibre supported liquid membrane.
A cylindrical coordinates system and the main parameters are included.
The dimensionless velocity field for this cylindrical channel geometry and the term gn
are defined as:
( ) ( )22 1U r r= − , ,
0,
wA Ad
n
Sh C if n Ag
if n B
==
= (19a,b)
where CAd is the concentration of solute A in the stripping solution or dialysate flow. Details
about the mathematical model can be found in [44].
To solve this nonlinear PDE system by the GITT, the following nonlinear eigenvalue
problem in cartesian coordinates was adopted:
( ) ( )2
2
2; 0 , ni
ni niz r z n A or Br
+ = =
(20a)
( ) ( )( ) ( )0 1
0, 1, , 1, 1, 0ni nin A B ni
r r
f C z C z zr r= =
= + =
(20b,c)
Even though the original problem is written in cylindrical coordinates, the eigenvalue
problem in Cartesian coordinates leads to eigenfunctions whose analytical integration is readily
Impermeable
membrane
Z = 0
Supported liquid membrane
Fluid2R
r
Z
R
R0
A + B + C ABC
Transport of solute through the membrane
Stripping solution
6th Int. Conf.: Thermophysical and Mechanical Properties of Advanced Materials (THERMAM)
8thRostocker Int. Conf.: Thermophysical Properties for Technical Thermodynamics
22-24 September 2019, Çeşme, İzmir, Turkey
192
obtainable, avoiding the numerical computation of integrals. For this chosen formulation, the
solution for the eigenfunction is given by:
( ) ( )( ), cos , ni nir z z r n A or B = = (21a)
Equation (20c) is the transcendental equation whose differentiation with respect to the
longitudinal coordinate leads to the ODEs for the axial evolution of the eigenvalues:
( ) ( )( )
( ) ( )( )
( )( ) ( ) ( )( ) ( ) ( )( ) ( )( )
1, , 1,cos
sin cos 1, , 1, sin
n A B
nini
ni ni ni n A B ni
df C z C zzd z dz
dz z z z f C z C z z
=
+ + (21b)
Inlet conditions for the eigenvalues ni(0) can be obtained from the transcendental
equation, eq. (20c), associated with the inlet conditions, eq. (18b), and the inverse formula for
the species concentrations, which are shown below. The transform-inverse pair for the
concentrations of species A and B are defined as:
Inverse ( )( )
( )( )
1
;, ,
ni
n ni
i ni
r zC r z C z n Aor B
N z
=
= = (22a)
Transform ( ) ( ) ( )1
0
; , , ni ni nC z r z C r z dr n Aor B= = (22b)
where Nni(z) is the norm.
The original PDE system is then operated with ( )1
0
;0 __ki r dr , and the transformed
ODE system is obtained as:
( )( )
( ) ( )( ) ( ) ( ) ( ) ( )2
1 1
1;nj
nij n nij nij nj ni n ni n ni n
j j
dC zE z F z G z C z z C z z g
dz
= =
= − − + (23a)
( ) ( )1
0
0 ;0 , ni niC r dr n Aor B = = (23b)
where Enij(z), Fnij(z) and Gnij(z) are coefficients that arise from the integral transformation
procedure, given by:
( )( )
( ) ( ) ( )1
0
1; ; , nij ni nj
nj
E z U r r z r z dr n Aor BN z
= = (23c)
( )( )
( ) ( )1
0
;;1,
njni
nij
nj
r zr zF z dr n Aor B
N z r r
= =
(23d)
( ) ( ) ( )( )
( )
1
0
;; ,
nj
nij ni
nj
r zG z U r r z dr n Aor B
z N z
= =
(23e)
The transformed ODE system was numerically solved through the symbolic-numerical
computational platform Mathematica 10.0 [31] using the NDSolve subroutine. Afterwards, the
inverse formula is recalled to recover the species concentrations anywhere within the
separator.
Results are presented in terms of the average concentration defined as:
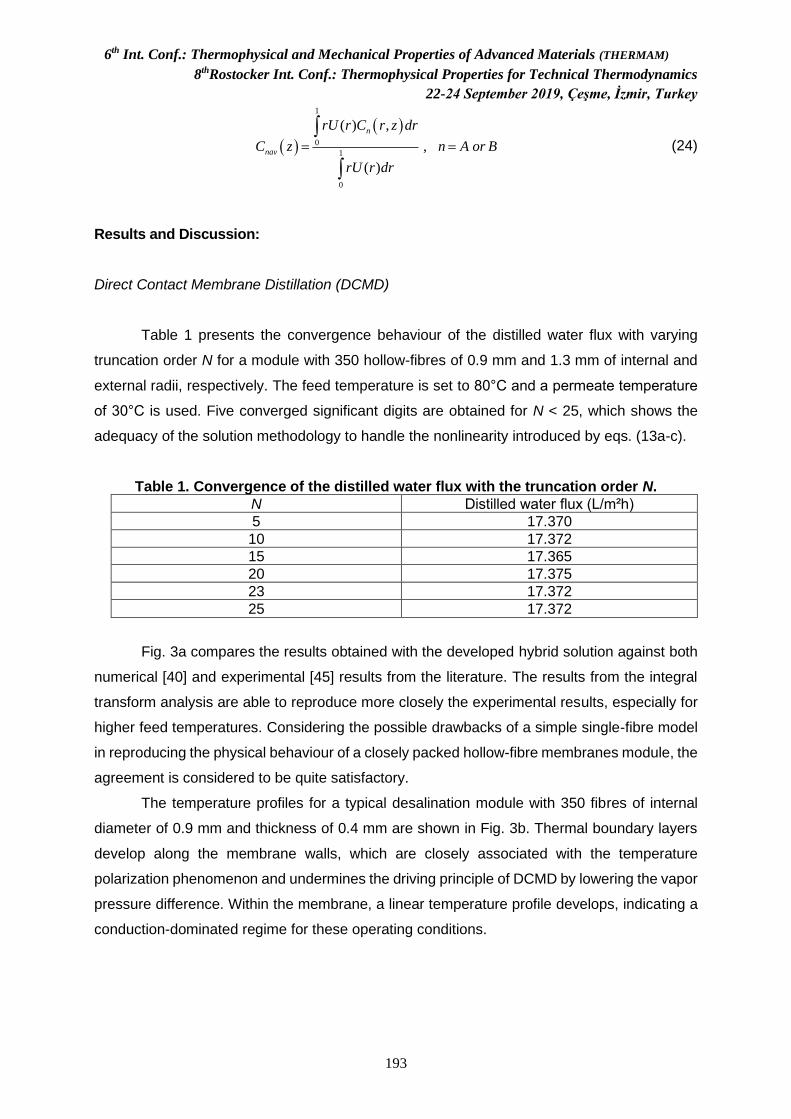
6th Int. Conf.: Thermophysical and Mechanical Properties of Advanced Materials (THERMAM)
8thRostocker Int. Conf.: Thermophysical Properties for Technical Thermodynamics
22-24 September 2019, Çeşme, İzmir, Turkey
193
( )( )
1
0
1
0
( ) ,
,
( )
n
nav
rU r C r z dr
C z n A or B
rU r dr
= =
(24)
Results and Discussion:
Direct Contact Membrane Distillation (DCMD)
Table 1 presents the convergence behaviour of the distilled water flux with varying
truncation order N for a module with 350 hollow-fibres of 0.9 mm and 1.3 mm of internal and
external radii, respectively. The feed temperature is set to 80°C and a permeate temperature
of 30°C is used. Five converged significant digits are obtained for N < 25, which shows the
adequacy of the solution methodology to handle the nonlinearity introduced by eqs. (13a-c).
Table 1. Convergence of the distilled water flux with the truncation order N.
N Distilled water flux (L/m²h)
5 17.370
10 17.372
15 17.365
20 17.375
23 17.372
25 17.372
Fig. 3a compares the results obtained with the developed hybrid solution against both
numerical [40] and experimental [45] results from the literature. The results from the integral
transform analysis are able to reproduce more closely the experimental results, especially for
higher feed temperatures. Considering the possible drawbacks of a simple single-fibre model
in reproducing the physical behaviour of a closely packed hollow-fibre membranes module, the
agreement is considered to be quite satisfactory.
The temperature profiles for a typical desalination module with 350 fibres of internal
diameter of 0.9 mm and thickness of 0.4 mm are shown in Fig. 3b. Thermal boundary layers
develop along the membrane walls, which are closely associated with the temperature
polarization phenomenon and undermines the driving principle of DCMD by lowering the vapor
pressure difference. Within the membrane, a linear temperature profile develops, indicating a
conduction-dominated regime for these operating conditions.

6th Int. Conf.: Thermophysical and Mechanical Properties of Advanced Materials (THERMAM)
8thRostocker Int. Conf.: Thermophysical Properties for Technical Thermodynamics
22-24 September 2019, Çeşme, İzmir, Turkey
194
Figure 3. Comparison with numerical and experimental results for the distilled water
fluxes and temperature profiles. (a) Comparison of the distilled water flux with numerical
[40] (red symbols) and experimental [45] (green symbols) from the literature; (b) Temperature
profiles for feed temperature of 80°C and permeate temperature of 30°C and four longitudinal
positions along the module. Purple vertical lines indicate the shell- and lumen-membrane
interfaces.
Liquid supported membrane extraction (LSME)
Table 2 presents the convergence behaviour of the average concentrations of species
A as obtained by GITT with both choices of a linear and a nonlinear eigenvalue problem. The
parameters were assumed as wASh 0.01= , α = 100 , β = 1, AdC = 2 , ζ = 0.1, h = 1 , Bξ = 1
and 'D = 1. It is noticed a convergence of 5 significant digits with truncation orders as low as
N = 120 in the nonlinear eigenvalue approach, while the classic linear eigenvalue problem
formulation demanded an impressive higher order of N around 2800 terms to converge to only
3 significant digits at higher values for z.
Table 2. Convergence of the average concentration of the solute A.
N GITT with nonlinear eigenvalue problem
z = 10-4 z = 10-2 z = 10-1 z = 1 z = 2
10 0.99994 0.99072 0.91371 0.38847 0.14344
50 0.99990 0.99068 0.91374 0.38888 0.14393
90 0.99990 0.99068 0.91375 0.38893 0.14398
100 0.99990 0.99068 0.91375 0.38893 0.14399
110 0.99990 0.99068 0.91375 0.38894 0.14400
120 0.99990 0.99068 0.91375 0.38894 0.14400
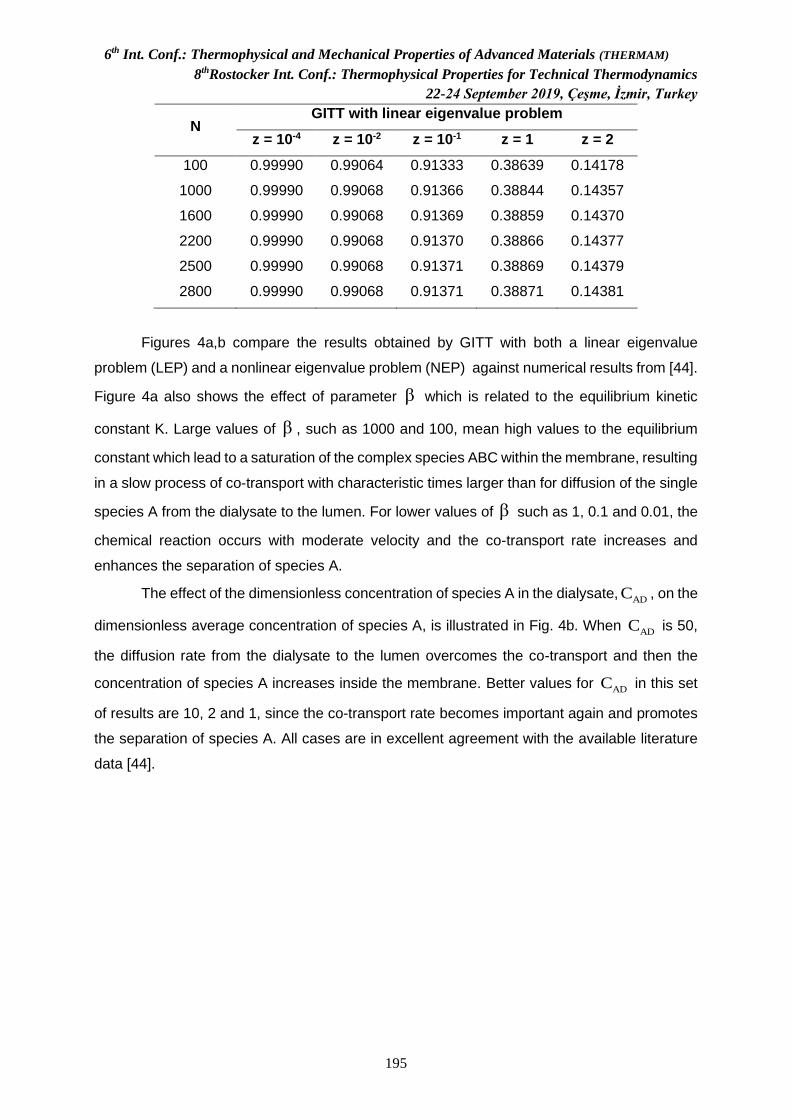
6th Int. Conf.: Thermophysical and Mechanical Properties of Advanced Materials (THERMAM)
8thRostocker Int. Conf.: Thermophysical Properties for Technical Thermodynamics
22-24 September 2019, Çeşme, İzmir, Turkey
195
N GITT with linear eigenvalue problem
z = 10-4 z = 10-2 z = 10-1 z = 1 z = 2
100 0.99990 0.99064 0.91333 0.38639 0.14178
1000 0.99990 0.99068 0.91366 0.38844 0.14357
1600 0.99990 0.99068 0.91369 0.38859 0.14370
2200 0.99990 0.99068 0.91370 0.38866 0.14377
2500 0.99990 0.99068 0.91371 0.38869 0.14379
2800 0.99990 0.99068 0.91371 0.38871 0.14381
Figures 4a,b compare the results obtained by GITT with both a linear eigenvalue
problem (LEP) and a nonlinear eigenvalue problem (NEP) against numerical results from [44].
Figure 4a also shows the effect of parameter β which is related to the equilibrium kinetic
constant K. Large values of β , such as 1000 and 100, mean high values to the equilibrium
constant which lead to a saturation of the complex species ABC within the membrane, resulting
in a slow process of co-transport with characteristic times larger than for diffusion of the single
species A from the dialysate to the lumen. For lower values of β such as 1, 0.1 and 0.01, the
chemical reaction occurs with moderate velocity and the co-transport rate increases and
enhances the separation of species A.
The effect of the dimensionless concentration of species A in the dialysate,ADC , on the
dimensionless average concentration of species A, is illustrated in Fig. 4b. When ADC is 50,
the diffusion rate from the dialysate to the lumen overcomes the co-transport and then the
concentration of species A increases inside the membrane. Better values for ADC in this set
of results are 10, 2 and 1, since the co-transport rate becomes important again and promotes
the separation of species A. All cases are in excellent agreement with the available literature
data [44].
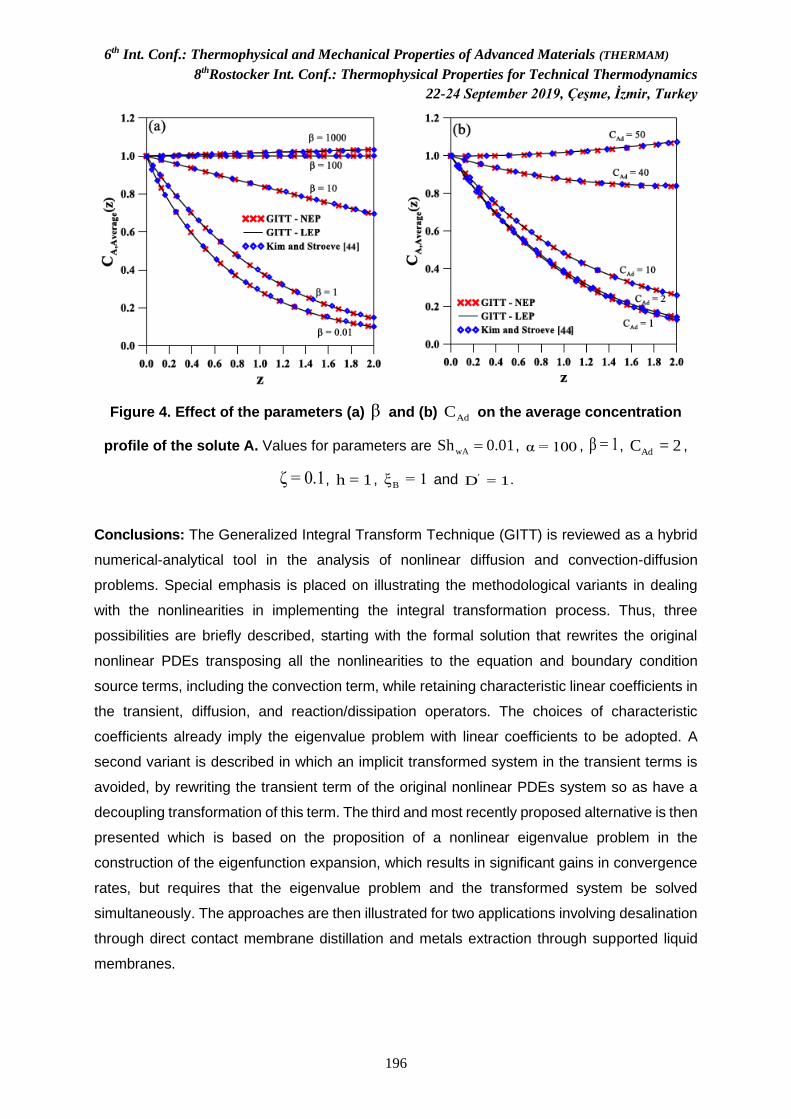
6th Int. Conf.: Thermophysical and Mechanical Properties of Advanced Materials (THERMAM)
8thRostocker Int. Conf.: Thermophysical Properties for Technical Thermodynamics
22-24 September 2019, Çeşme, İzmir, Turkey
196
Figure 4. Effect of the parameters (a) β and (b) AdC on the average concentration
profile of the solute A. Values for parameters are wASh 0.01= , α = 100 , β = 1, AdC = 2 ,
ζ = 0.1, h = 1 , Bξ = 1 and 'D = 1.
Conclusions: The Generalized Integral Transform Technique (GITT) is reviewed as a hybrid
numerical-analytical tool in the analysis of nonlinear diffusion and convection-diffusion
problems. Special emphasis is placed on illustrating the methodological variants in dealing
with the nonlinearities in implementing the integral transformation process. Thus, three
possibilities are briefly described, starting with the formal solution that rewrites the original
nonlinear PDEs transposing all the nonlinearities to the equation and boundary condition
source terms, including the convection term, while retaining characteristic linear coefficients in
the transient, diffusion, and reaction/dissipation operators. The choices of characteristic
coefficients already imply the eigenvalue problem with linear coefficients to be adopted. A
second variant is described in which an implicit transformed system in the transient terms is
avoided, by rewriting the transient term of the original nonlinear PDEs system so as have a
decoupling transformation of this term. The third and most recently proposed alternative is then
presented which is based on the proposition of a nonlinear eigenvalue problem in the
construction of the eigenfunction expansion, which results in significant gains in convergence
rates, but requires that the eigenvalue problem and the transformed system be solved
simultaneously. The approaches are then illustrated for two applications involving desalination
through direct contact membrane distillation and metals extraction through supported liquid
membranes.

6th Int. Conf.: Thermophysical and Mechanical Properties of Advanced Materials (THERMAM)
8thRostocker Int. Conf.: Thermophysical Properties for Technical Thermodynamics
22-24 September 2019, Çeşme, İzmir, Turkey
197
Acknowledgements/Dedication: The authors are grateful for the financial support offered by
the Brazilian Government agencies CNPq, CAPES, and FAPERJ. RMC is also grateful to Prof.
Sebnem Tavman for the very kind invitation to lecture at THERMAM 2019. This lecture is
dedicated to Prof. Ismail Tavman, who left us just too early, but his devotion to scientific work
and contributions to our field shall always be remembered through his students and
collaborators.
References:
28. Jaluria, Y., Torrance, K.E., Computational heat transfer, 2nd ed., Routledge, New York,
2003.
29. Minkowycz, W.J., Sparrow, E.M., Murthy, J.Y., Eds., Handbook of numerical heat transfer,
2nd edition, John Wiley, New York, 2006.
30. Ozisik, M.N., Orlande, H.R.B., Colaço, M.J., Cotta, R.M., Finite difference methods in heat
transfer, 2nd Edition, CRC Press, Boca Raton, FL, 2017.
31. Luikov, A.V., Analytical heat diffusion theory, Academic Press, New York, 1968.
32. Ozisik, M.N., Heat conduction, 2nd ed., Wiley, New York, 1993.
33. Kakaç, S., Yener, Y., Naveira-Cotta, C.P., Heat conduction, 5th ed., CRC Press, Boca
Raton, FL, 2018.
34. Cotta, R.M., Diffusion in media with prescribed moving boundaries: application to metals
oxidation at high temperatures, Proc. of the II Latin American Congress of Heat & Mass
Transfer, vol. 1, pp. 502-513, São Paulo, Brasil, May 1986.
35. Cotta, R.M., Hybrid numerical-analytical approach to nonlinear diffusion problems. Num.
Heat Transfer, Part B, 127 (1990) 217-226.
36. Serfaty, R., Cotta, R.M., Integral transform solutions of diffusion problems with nonlinear
equation coefficients, Int. Comm. Heat & Mass Transfer, 17 (1990) 851-864.
37. Cotta, R.M. and Serfaty, R., Hybrid analysis of transient nonlinear convection-diffusion
problems, Int. J. Num. Meth. Heat & Fluid Flow, 2 (1992) 55-62.
38. Cotta, R.M., Integral transforms in computational heat and fluid flow, CRC Press, Boca
Raton, FL, 1993.
39. Cotta, R.M., Benchmark results in computational heat and fluid flow: - the integral
transform method, Int. J. Heat Mass Transfer (Invited Paper), 37 (1994) 381-394.
40. Cotta, R.M., Mikhailov, M.D., Heat conduction: lumped analysis, integral transforms,
symbolic computation, Wiley, Chichester, 1997.
41. Cotta, R.M., The integral transform method in thermal and fluids sciences and engineering,
Begell House, New York, 1998.
6th Int. Conf.: Thermophysical and Mechanical Properties of Advanced Materials (THERMAM)
8thRostocker Int. Conf.: Thermophysical Properties for Technical Thermodynamics
22-24 September 2019, Çeşme, İzmir, Turkey
198
42. Cotta, R.M., Mikhailov, M.D., Hybrid methods and symbolic computations. In: Handbook
of Numerical Heat Transfer, 2nd edition, Chapter 16, Eds. W.J. Minkowycz, E.M. Sparrow,
and J.Y. Murthy, John Wiley, New York, 2006.
43. Cotta, R.M., Naveira-Cotta, C.P., Knupp, D.C., Zotin, J.L.Z., Pontes, P.C., Almeida, A.P.,
Recent advances in computational-analytical integral transforms for convection-diffusion
problems, Heat & Mass Transfer, Invited Paper, 54 (2018) 2475–2496.
44. Cotta, R.M., Knupp, D.C., Quaresma, J.N.N., Analytical methods in heat transfer. In:
Handbook of Thermal Science and Engineering, F.A. Kulacki et al., Eds., Springer, 2018.
45. Mikhailov, M.D., Özisik, M.N., Unified analysis and solutions of heat and mass diffusion,
John Wiley, New York, 1984; also, Dover Publications,1994.
46. Knupp, D.C., Naveira-Cotta, C.P., Cotta, R.M., Theoretical analysis of conjugated heat
transfer with a single domain formulation and integral transforms, Int. Comm. Heat & Mass
Transfer, 39 (2012) 355-362.
47. Knupp, D.C., Cotta, R.M., Naveira-Cotta, C.P., Kakaç, S., Transient conjugated heat
transfer in microchannels: Integral transforms with single domain formulation, Int. J.
Thermal Sciences, 88 (2015) 248-257.
48. Knupp, D.C., Cotta, R.M., Naveira-Cotta, C.P., Fluid flow and conjugated heat transfer in
arbitrarily shaped channels via single domain formulation and integral transforms, Int. J.
Heat Mass Transfer, 82 (2015) 479-489.
49. Almeida, A.P., Naveira-Cotta, C.P., Cotta, R.M., Integral transforms for transient three-
dimensional heat conduction in heterogeneous media with multiple geometries and
materials, Paper # IHTC16-24583, Proc. of the 16th International Heat Transfer
Conference – IHTC16, Beijing, China, August 10th-15th, 2018.
50. Cotta, R.M., Naveira-Cotta, C.P., Knupp, D.C., Convective eigenvalue problems for
convergence enhancement of eigenfunction expansions in convection-diffusion problems,
ASME J. Thermal Science and Eng. Appl., 10 (2017) 021009.
51. Knupp, D.C., Cotta, R.M., Naveira-Cotta, C.P., Conjugated heat transfer analysis via
integral transforms and convective eigenvalue problems, J. Eng. Physics &
Thermophysics, in press (2019).
52. Lisboa, K.M., Cotta, R.M., Hybrid integral transforms for flow development in ducts partially
filled with porous media, Proc. Royal Society A - Mathematical, Physical and Eng.
Sciences, 474 (2018)1-20.
53. Lisboa, K.M., Cotta, R.M., On the mass transport in membraneless flow batteries of flow-
by configuration, Int. J. Heat & Mass Transfer, 122 (2018) 954-966.

6th Int. Conf.: Thermophysical and Mechanical Properties of Advanced Materials (THERMAM)
8thRostocker Int. Conf.: Thermophysical Properties for Technical Thermodynamics
22-24 September 2019, Çeşme, İzmir, Turkey
199
54. Lisboa, K.M., Su, J., Cotta, R.M., Single domain integral transforms analysis of natural
convection in cavities partially filled with heat generating porous medium, Num. Heat
Transfer, Part A – Applications, 74 (2018) 1068-1086.
55. Lisboa, K.M., Su, J., and Cotta, R.M., Vector eigenfunction expansion in the integral
transform solution of transient natural convection, Int. J. Num. Meth. Heat & Fluid Flow,
29 (2019)1-25, published on line.
56. Cotta, R.M., Naveira-Cotta, C.P., Knupp, D.C., Nonlinear eigenvalue problem in the
integral transforms solution of convection-diffusion with nonlinear boundary conditions, Int.
J. Num. Meth. Heat & Fluid Flow, Invited Paper, 25th Anniversary Special Issue, 26 (2016)
767-789.
57. Pontes, P.C., Almeida, A.P., Cotta, R.M., Naveira-Cotta, C.P., Analysis of mass transfer
in hollow-fiber membrane separator via nonlinear eigenfunction expansions, Multiphase
Science and Technology, 30 (2018) 165-186.
58. Wolfram, S., Mathematica, version 11, Wolfram Research Inc., Champaign, 2017.
59. Cotta, R.M., Santos, C.A.C., and Kakaç, S., Unified hybrid theoretical analysis of nonlinear
convective heat transfer, Proc. of IMECE2007, ASME International Mechanical
Engineering Congress & Exposition, Paper no. IMECE2007-41412, V. 8: Heat Transfer,
Fluid Flows, and Thermal Systems, Parts A and B, pp:1361-1370, Seattle, WA, USA, Nov.
11-15, 2007.
60. Cotta, R.M., Knupp, D.C., Naveira-Cotta, C.P., Sphaier, L.A., Quaresma, J.N.N., Unified
integral transforms algorithm for solving multidimensional nonlinear convection-diffusion
problems, Num. Heat Transfer, part A - Applications, 63 (2013) 1-27.
61. Cotta, R.M., Knupp, D.C., Naveira-Cotta, C.P., Sphaier, L.A., Quaresma, J.N.N., The
unified integral transforms (UNIT) algorithm with total and partial transformation, Comput.
Thermal Sciences, 6 (2014) 507-524.
62. Voutchkov, N., Energy use for membrane seawater desalination – current status and
trends, Desalination, 431 (2018) 2-14.
63. Ammar, Y., Joyce, S., Norman, R., Wang, Y., Roskilly, A.P., Low grade thermal energy
sources and uses from the process industry in the UK, Appl. Energy, 89 (2012) 3-20.
64. Alkhudhiri, A., Darwish, N., Hilal, N., Membrane distillation: a comprehensive review,
Desalination, 287 (2012) 2-18.
65. Ashoor, B.B., Mansour, S., Giwa, A., Dufour, V., Hasan, S.W., Principles and applications
of direct contact membrane distillation (DCMD): a comprehensive review, Desalination,
398 (2016) 222-246.
6th Int. Conf.: Thermophysical and Mechanical Properties of Advanced Materials (THERMAM)
8thRostocker Int. Conf.: Thermophysical Properties for Technical Thermodynamics
22-24 September 2019, Çeşme, İzmir, Turkey
200
66. Andrjesdóttir, Ó., Ong, C.L., Nabavi, M., Paredes, S., Khalil, A.S.G., Michel, B.,
Poulikakos, D., An experimentally optimized model for heat and mass transfer in direct
contact membrane distillation, Int. J. Heat Mass Transf., 66 (2013) 855-867.
67. Kim, A.S., Cylindrical cell model for direct contact membrane distillation (DCMD) of
densely packed hollow fibers, J. Membrane Sci., 455 (2014) 168-186.
68. Lisboa, K.M., Souza, J.R.B., Naveira-Cotta, C.P., Cotta, R.M., Heat and mass transfer in
hollow-fiber modules for direct contact membrane distillation: integral transforms solution
and parametric analysis, Int. Comm. Heat & Mass Transf., to appear.
69. IMSL Library, Rogue Wave Software, Visual Numerics, Boulder, 2010.
70. Parhi, P.K., Supported Liquid Membrane Principle and its Practices: A Short Review,
Journal of Chemistry, (2013) 1-11.
71. Kim, J.I. and Stroeve, P., Uphill transport of a dilute solute in mass separation devices with
reactive co-transport membranes, Journal of Membrane Science, 49 (1990) 37-53.
72. Wang, K.Y., Chung, T.S., Gryta, M., Hydrophobic PVDF hollow fibre membranes with
narrow pore size distribution and ultra-thin skin for fresh water production through
membrane distillation, Chem. Eng. Sci., 63 (2008) 2587-2594.
6th Int. Conf.: Thermophysical and Mechanical Properties of Advanced Materials (THERMAM)
8thRostocker Int. Conf.: Thermophysical Properties for Technical Thermodynamics
22-24 September 2019, Çeşme, İzmir, Turkey
201
Determination of Thermal and Rheological Properties of Collagen Protein
Ozge ATA1, Şebnem TAVMAN1, Ebru ORMANLI2 and Seher KUMCUOĞLU2
1 Department of Food Engineering, Ege University,35040 ,İzmir, TURKEY 2 Department of Food Engineering, Ege University,35040 ,İzmir, TURKEY
*Corresponding author: [email protected]
Keywords: collagen, protein, thermal properties, rheological properties
Abstract: In this study; thermal and rheological properties of collagen protein from the lamb
feet were investigated. Pepsin-soluble collagen (PSC) was extracted from lamb feet by using
pepsin enzyme in lactic acid solution at 4°C for 6h and subsequently ultrasonic treatment (35
kHz, 140 W) was performed for 40 minutes at 20°C. The thermal stability of collagen revealed
denaturation temperature of 41.76°C. Fourier transform infrared (FTIR) spectra of PSC had
regions of amides A, B, I, II and III were 3305, 2923, 1631,1548 and 1237 cm-1 respectively.
Scanning electron microscopy (SEM) studies confirmed the presence of collagen in the
isolated, as fine fibrillar structure. Power Law model was found the best model representing
flow behaviour.
Introduction/Background: Collagen is the most abundant structural protein that contains
about 30% of the total protein in mammals [1]. Recently, at least 29 different collagen types
have been identified [2-4]. Among all these different types, type I collagen is the most abundant
type of collagen in mammals and fish. Owing to its perfect biocompatibility and controlled
biodegradability, collagen is a primary biomaterial used in the pharmaceutical, cosmetic, tissue
engineering and food industry [5]. Collagen is distinguished from other proteins by having a
specific amino acid composition. It contains nineteen amino acids, including hydroxyproline
which does not occur in other proteins. Hydroxyproline, the amino acid characteristic of
collagen, determines the thermal stability of collagen. Hydroxyproline has many functions such
as glycine synthesis in multiple tissues of animals, maintenance of connective tissue structure,
regulation of cellular redox reactions [6, 7].
Traditionally, collagen mainly came from by-products of mammals, especially bovine tendon
and skins of cows and pigs. However, these sources carry potential risks of disease
transmission, such as bovine spongiform encephalopathy (BSE), foot-mouth disease (FMD)
[8-10]. In addition, due to some religious restrictions have led researchers to focus on
searching for new sources of collagen. In recent years, fish by-products are thought to be
alternate and safer for collagen extraction [11]. However, fish collagen have lower thermal
6th Int. Conf.: Thermophysical and Mechanical Properties of Advanced Materials (THERMAM)
8thRostocker Int. Conf.: Thermophysical Properties for Technical Thermodynamics
22-24 September 2019, Çeşme, İzmir, Turkey
202
stability compared to mammalian collagens because fish collagens contain lower contents of
hydroxyproline than mammalian collagens [11, 12]. The objective of this study was to isolate
and characterize pepsin-soluble collagen from lamb feet.
Material and Method:
Lamb feet purchased from a local market in the province of Izmir. The frozen lamb feet were
first thawed at 4 °C and then cut into small pieces. All chemicals and reagents used were of
analytical grade.
1. Collagen Isolation
The pieces were homogenised with 0.05 M Tris-HCI (pH 7.5) at a ratio of 1:20 (w/v). The
mixture was centrifuged at 9000 rpm for 25 min by a centrifuge (Universal 320R, Hettich
Zentrifugen, Germany) and the precipitate was defatted under stirring with 10 volumes of 50%
ethanol for 3 h. The defatted samples were decalcified under stirring with 0.5 M
ethylenediaminetetraacetic acid disodium (EDTA-2Na) at 4°C for 6 h. Then, the treated
samples were soaked over night in 0.1 M NaOH at a ratio of 1:10 (w/v) to remove the non-
collagenous proteins.
After the pre-treatment process, the sample was transferred to beaker and mixed in 5% lactic
acid containing 0.1 % (w/v) pepsin (extracted from porcine gastric mucosa, EC 3.4.23.1; 4500
units/mg protein, Sigma-Aldrich, USA) at 4°C for 6 hours. Then ultrasound-assisted extraction
(35 kHz, 140 W) was performed for 40 minutes at 20°C in ultrasonic bath (Bandelin Sonorex
Digitec, Germany). Afterward, the suspensions were salted out by adding 2.5 M NaCl and
subsequently dialyzed in 0.1 M lactic acid for 24 h and in distilled water for 48 h. Finally, the
pepsin soluble collagen (PSC) was lyophilized with freeze dryer.
2. Analyses
2.1. Attenuate Total Reflection-Fourier transform infrared (ATR-FTIR) spectroscopy: Infrared
spectra of the lyophilized collagens were measured in absorbance mode 4000-400 cm-1 on
FTIR spectrophotometer (Thermo Scientific NICOLET iS10, ABD).
2.2. Scanning electron microscopy (SEM): The morphological characteristics of the collagen
was observed with a scanning electron microscope (ThermoFisher, QUANTA FEG 250, ABD).
2.3. Differential scanning calorimetry (DSC): The maximum transition temperature (Tmax) and
total denaturation enthalpy (ΔH) of collagen were measured according to the method of
Kittiphattanabawon et al. (2005) with some modifications. Collagen sample was rehydrated in

6th Int. Conf.: Thermophysical and Mechanical Properties of Advanced Materials (THERMAM)
8thRostocker Int. Conf.: Thermophysical Properties for Technical Thermodynamics
22-24 September 2019, Çeşme, İzmir, Turkey
203
0.05 M acetic acid at a solid/solution ratio of 1:100 (w/v). Samples were heated from 20 to
80°C at a scanning rate of 1°C min-1 using the Q-2000 Series DSC (TA Instruments, Inc., New
Castle, DE, USA).
2.4. Rheological properties: Flow behavior for 1% (in 0.1 M acetic acid, w/v) collagen solutions
were tested by flow test at at different temperatures (5, 20, 35, 50 °C) using DHR-3 rheometer
(TA Instruments, ABD) with concentric cylinder probe.
Results and Discussion
The SEM image (magnification of 5000x) of PSC are depicted in Fig. 1. SEM observation
revealed that the extracted collagen was in the form of fibrils with regular linkages.
Figure 1. Scanning electron micrographs of lyophilized collagen (x 5000
magnification)
FTIR spectra of PSC from lamb feet had the characteristic peaks of Amide I, II, III, A and B as
shown in Figure 2. This result was in accordance with those of collagen from other collagen
sources [13-15].

6th Int. Conf.: Thermophysical and Mechanical Properties of Advanced Materials (THERMAM)
8thRostocker Int. Conf.: Thermophysical Properties for Technical Thermodynamics
22-24 September 2019, Çeşme, İzmir, Turkey
204
Figure 2. Fourier transforms infrared spectra of pepsin soluble collagen (PSC)
The DSC pattern of collagen showed a single endothermic peak, the maximum transition
temperature (Tmax) and enthalpy (ΔH) are determined as 41.76±0.13°C and 8.2±0.03 J/g,
respectively. Higher levels of cross-linkage of collagens are more likely to contribute to the
higher Tmax. The present study detected that Tmax of PSC from lamb feet bones were in
agreement with a previous report on the collagens extracted from calf skin (40.8 °C) [16], ovine
bones (38.91°C) [13] and seabass scale (39.32°C) [17].
Rheology In Figure 3 and Figure 4 show that the shear stres- shear rate graph and viscosity- shear rate
graph of collagen solutions at 1% concentartion at different temperatures, respectively.
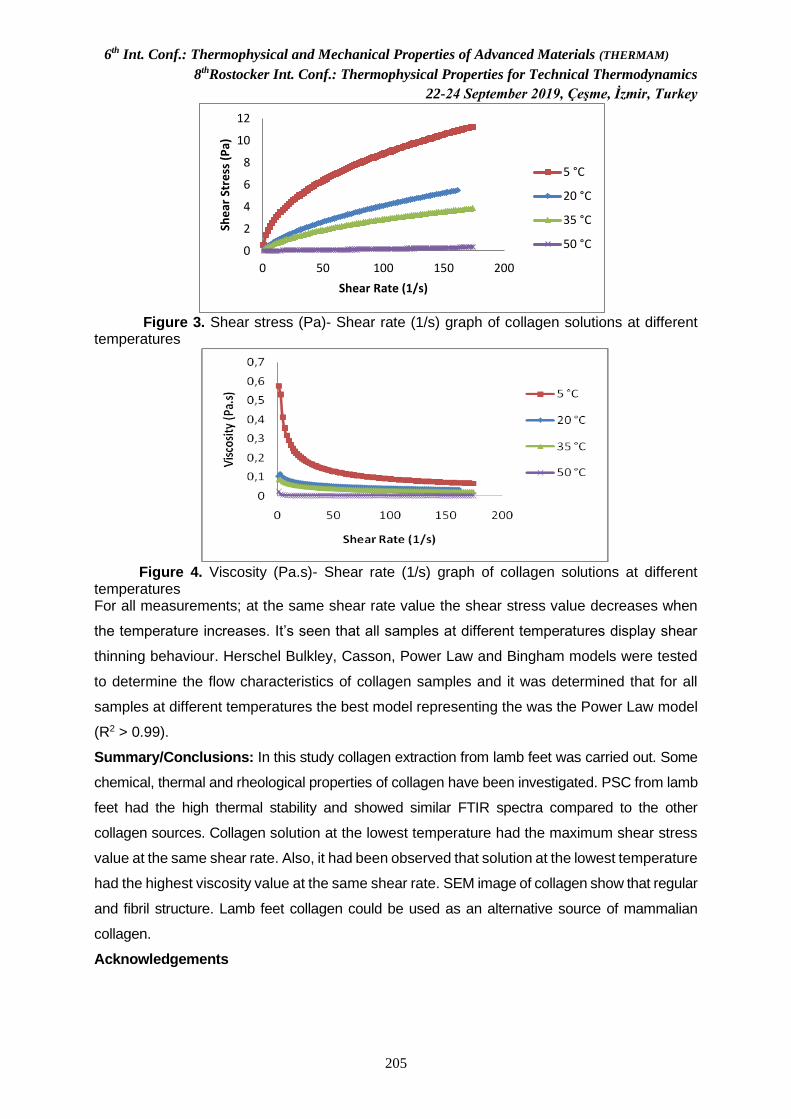
6th Int. Conf.: Thermophysical and Mechanical Properties of Advanced Materials (THERMAM)
8thRostocker Int. Conf.: Thermophysical Properties for Technical Thermodynamics
22-24 September 2019, Çeşme, İzmir, Turkey
205
Figure 3. Shear stress (Pa)- Shear rate (1/s) graph of collagen solutions at different temperatures
Figure 4. Viscosity (Pa.s)- Shear rate (1/s) graph of collagen solutions at different temperatures For all measurements; at the same shear rate value the shear stress value decreases when
the temperature increases. It’s seen that all samples at different temperatures display shear
thinning behaviour. Herschel Bulkley, Casson, Power Law and Bingham models were tested
to determine the flow characteristics of collagen samples and it was determined that for all
samples at different temperatures the best model representing the was the Power Law model
(R2 > 0.99).
Summary/Conclusions: In this study collagen extraction from lamb feet was carried out. Some
chemical, thermal and rheological properties of collagen have been investigated. PSC from lamb
feet had the high thermal stability and showed similar FTIR spectra compared to the other
collagen sources. Collagen solution at the lowest temperature had the maximum shear stress
value at the same shear rate. Also, it had been observed that solution at the lowest temperature
had the highest viscosity value at the same shear rate. SEM image of collagen show that regular
and fibril structure. Lamb feet collagen could be used as an alternative source of mammalian
collagen.
Acknowledgements
0
2
4
6
8
10
12
0 50 100 150 200
She
ar S
tre
ss (
Pa)
Shear Rate (1/s)
5 °C
20 °C
35 °C
50 °C
6th Int. Conf.: Thermophysical and Mechanical Properties of Advanced Materials (THERMAM)
8thRostocker Int. Conf.: Thermophysical Properties for Technical Thermodynamics
22-24 September 2019, Çeşme, İzmir, Turkey
206
This research was supported by the Scientific and Technological Research Council of Turkey (
No. 118O135-Short Term R&D Funding Program 1002) and Ege University Scientific Research
Projects Coordination Unit. Project Number: 17-MUH-020.
References
1. Liu, D., Nikoo, M., Boran, G., Zhou, P. and Regenstein J, M., Collagen and gelatin, Annual
Review of Food Science and Technology, (2015), 6: 527–557.
2. Bhagwat, P. K. and Dandge, P. B., Collagen and collagenolytic proteases: A review,
Biocatalysis and Agricultural Biotechnology, (2018), 15: 43-55.
3. Ehrlich, H., Wysokowski, M., Zółtowska-Aksamitowska, S., Petrenko, I. and Jesionowski,
T., Collagens of Poriferan Origin, Marine Drugs, (2018), 16(3): 1-21.
4. Shoulders, M. D. and Raines, R. T., Collagen structure and stability, Annual review of
Biochemistry, (2009), 78: 929-958.
5. Yang, H., Duan, L., Li, Q., Tian, Z. and Li, G., Experimental and modeling investigation on
the rheological behavior of collagen solution as a function of acetic acid concentration, Journal
of the mechanical behavior of biomedical materials, (2018), 77: 125-134.
6. Liu, H. and Huang, K., Structural Characteristics of Extracted Collagen from Tilapia
(Oreochromis mossambicus) Bone: Effects of Ethylenediaminetetraacetic Acid Solution and
Hydrochloric Acid Treatment, International Journal of Food Properties, (2016), 19(1): 63-75.
7. Li, P. and Wu, G., Roles of dietary glycine, proline, and hydroxyproline in collagen synthesis
and animal growth, Amino acids, (2018), 50(1), 29-38.
8. Liang, Q., Wang, L., Sun, W., Wang, Z., Xu, J. and Ma, H., Isolation and characterization of
collagen from the cartilage of Amur sturgeon (Acipenser schrenckii), Process Biochemistry,
(2014), 49(2): 318–323.
9. Jeevithan, E., Jingyi, Z., Wang, N., He, L., Bao, B. and Wu, W., Physico-chemical,
antioxidant and intestinal absorption properties of whale shark type-II collagen based on its
solubility with acid and pepsin, Process Biochemistry, (2015), 50(3): 463-472.
10. Sun, L., Hou, H., Li, B. and Zhang, Y., Characterization of acid-and pepsin-soluble collagen
extracted from the skin of Nile tilapia (Oreochromis niloticus), International Journal of Biological
Macromolecules, (2017), 99: 8-14.
11. Safandowska, M. and Pietrucha, K., Effect of fish collagen modification on its thermal and
rheological properties, International journal of biological macromolecules, (2013), 53: 32-37.
12. Kittiphattanabawon, P., Benjakul, S., Visessanguan, W., Nagai, T. and Tanaka, M.,
Characterisation of acid-soluble collagen from skin and bone of bigeye snapper (Priacanthus
tayenus), Food chemistry, (2005), 89(3): 363-372.
6th Int. Conf.: Thermophysical and Mechanical Properties of Advanced Materials (THERMAM)
8thRostocker Int. Conf.: Thermophysical Properties for Technical Thermodynamics
22-24 September 2019, Çeşme, İzmir, Turkey
207
13. Gao, L. L., Wang, Z. Y., Li, Z., Zhang, C. X. and Zhang, D. Q., The characterization of acid
and pepsin soluble collagen from ovine bones (Ujumuqin sheep), Journal of Integrative
Agriculture, (2017), 17(3): 704-711.
14. Kaewdang, O., Benjakul, S., Kaewmanee, T. and Kishimura, H., Characteristics of
collagens from the swim bladders of yellowfin tuna (Thunnus albacares), Food Chemistry,
(2014), 155: 264-270.
15. Sinthusamran, S., Benjakul, S. and Kishimura, H., Comparative study on molecular
characteristics of acid soluble collagens from skin and swim bladder of seabass (Lates
calcarifer), Food Chemistry, (2013), 138(4): 2435-2441.
16. Komsa-Penkova, R., Koyonava, R., Kostov, G. and Tenchov, B., Discrete reduction of type
I collagen thermal stability upon oxidation, Biophysical Chemistry, (1999), 83: 185–195.
17. Chuaychan, S., Benjakul, S. and Kishimura, H., Characteristics of acid-and pepsin-soluble
collagens from scale of seabass (Lates calcarifer), LWT-Food Science and Technology,
(2015), 63(1): 71-76.
6th Int. Conf.: Thermophysical and Mechanical Properties of Advanced Materials (THERMAM)
8thRostocker Int. Conf.: Thermophysical Properties for Technical Thermodynamics
22-24 September 2019, Çeşme, İzmir, Turkey
208
Thermodynamic Analysis of a New PV/T Hybrid Food Drying System
D. BARISIK MARASLI1*, N. COLAK GUNES2, S. TAVMAN1
1Department of Food Engineering, University of Ege, Bornova, 35100, Izmir, Turkey. 2Institute of Solar Energy, University of Ege, Bornova, 35100, Izmir, Turkey.
*Corresponding author: [email protected] Keywords: PV/T, Hybrid, Solar Dryer.
Abstract: Drying is an energy intensive industrial process where heat and mass transfer
takes place simultaneously and has been practised for a long time as a preservation method
for agricultural food products. Type of product, energy consumption, dried product quality, food
security and sustainability are critical parameters need to be taken into consideration during
selecting of drying system. About 10-15% of the total world industrial energy is consumed for
drying and the percentage consumption by food sector is 12%. Due to uncertain price rise and
rapid depletion of fossil fuels, development of food drying systems integrated with renewable,
sustainable energy sources became more and more important. As solar energy is abundant,
eco-friendly, cheap and easily applicable, especially studies on solar energy based drying
technologies and improvement of their energy efficiencies have been accelerated in recent
years. Since solar energy is dependent on weather conditions, it is only possible to provide
continuity of the drying process with additional heat sources. In order to prevent disruption of
the drying process and improve to the drying efficiency, many researches show that heat pump
is one of the most suitable thermal technologies.
Solar energy can be converted into thermal and electrical energy by solar thermal collectors
and photovoltaic (PV) modules, respectively. The performance of PV modules decreases when
the ambient temperature rises above a certain level. For overcoming of this problem, a novel
system calls a photovoltaic/thermal (PV/T) hybrid technology was developed. In this system,
excess heat is transferred to the working medium by integration of absorber plate with PV
modules. Although there are lots of studies on food drying, still a need for efficient, economical
and sustainable novel food drying systems.
Therefore, in this study, conceptual design of PV/T and unglazed solar collector integrated
hybrid heat pump drying system was carried out. A thermodynamic analysis of a new PV/T
hybrid food drying system was performed by applying mass, energy and exergy balances for
the each system components.
Introduction/Background:
Type of product, food safety, sustainability and energy consumption are important parameters
for drying process and food safety may be the most essential one cause qualitative and
6th Int. Conf.: Thermophysical and Mechanical Properties of Advanced Materials (THERMAM)
8thRostocker Int. Conf.: Thermophysical Properties for Technical Thermodynamics
22-24 September 2019, Çeşme, İzmir, Turkey
209
quantitative value losses in food occur different stages in food supply chain, especially at a
post harvest stage [1]. Energy demand is likely to increase in the entire world. In order to meet
the needs of the present energy demand without compromising the need of the future, it needs
to be pay attention to energy sustainability, and food is the most important part of this.
Drying is one of the post harvest technology and it needs relatively high amount of energy [2].
Most of the industrialized countries supply power to operate large-scale processes from fossil
fuels and some of developing countries do not have grid connection. People leads to search
alternative, reliable and sustainable energy sources by the reason of increament of food
demand and fossil fuels usage in all food chain [3]. In addition to this, energy sustainability
could drive environmental friendly innovations and solar energy based drying technologies is
promising one [4,5]. Energy and exergy analysis are important tools to identify energy losses,
irreversibilities and possible configurations of the drying system, so as to design economic and
efficient system [6].
So, aims of this paper is to develop self-operating, eco-friendly, economical, efficient and
sustainable hybrid food drying system by integrating two heat technology hybrid PV/T module
and unglazed solar collector as one of the evaporators of the heat pump (HP) drying system.
Modeling of hybrid PV/T-SAHP drying system:
In this study, conceptual design of hybrid SAHP drying system was performed as shown in Fig.
1. The system comprises of hybrid PV/T collector and unglazed flat plate solar collector (USC)
used as one of the evaporators of the HP, drying chamber and HP unit. Both heat and electricity
is produced simultaneously by hybrid PV/T system and so, heat energy of drying air as well as
power consumption of the drying system instruments was aimed to supply [7]. In addition,
electrical conversion efficiency of module is enhanced by working fluid absorbs excess heat
generating by PV cells [8]. In the case of insufficient solar energy, HP operates the drying
process.
The overall performance of the hybrid drying system was evaluated based on thermodynamic
approach, first and second law analysis were conducted. All of the mass, energy, exergy and
exergy destruction balances in the rate form of each hybrid system component derived by
using general conservation equations as can be expressed for steady flow system by the
following equations, respectively [9].
∑��𝑖𝑛 = ∑��𝑜𝑢𝑡 (1)
∑��𝑖𝑛 (ℎ𝑖𝑛 + 𝜈2
2+ 𝑔𝑧) + ��𝑖𝑛 + ��𝑖𝑛 = ∑��out (ℎout +
𝜈2
2+ 𝑔𝑧) + ��out + ��out (2)
∑ ��𝑥𝑖𝑛 − ∑𝐸��out = ∑𝐸��𝑑𝑒𝑠𝑡𝑟𝑜𝑦𝑒𝑑 (3)
𝐼 = 𝑇𝑎 ��𝑔𝑒𝑛 (4)
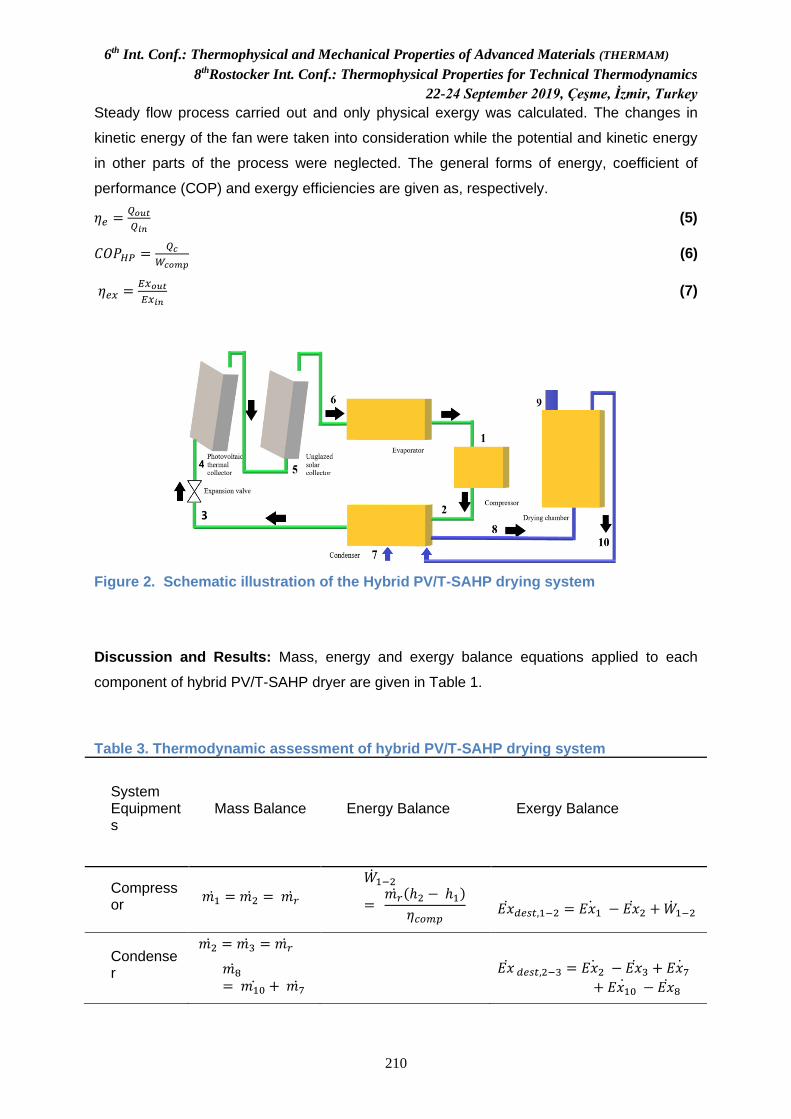
6th Int. Conf.: Thermophysical and Mechanical Properties of Advanced Materials (THERMAM)
8thRostocker Int. Conf.: Thermophysical Properties for Technical Thermodynamics
22-24 September 2019, Çeşme, İzmir, Turkey
210
Steady flow process carried out and only physical exergy was calculated. The changes in
kinetic energy of the fan were taken into consideration while the potential and kinetic energy
in other parts of the process were neglected. The general forms of energy, coefficient of
performance (COP) and exergy efficiencies are given as, respectively.
𝜂𝑒 =𝑄𝑜𝑢𝑡
𝑄𝑖𝑛 (5)
𝐶𝑂𝑃𝐻𝑃 =𝑄𝑐
𝑊𝑐𝑜𝑚𝑝 (6)
𝜂𝑒𝑥 =𝐸𝑥𝑜𝑢𝑡
𝐸𝑥𝑖𝑛 (7)
Figure 2. Schematic illustration of the Hybrid PV/T-SAHP drying system
Discussion and Results: Mass, energy and exergy balance equations applied to each
component of hybrid PV/T-SAHP dryer are given in Table 1.
Table 3. Thermodynamic assessment of hybrid PV/T-SAHP drying system
System Equipments
Mass Balance Energy Balance Exergy Balance
Compressor
𝑚1 = 𝑚2 = 𝑚𝑟
��1−2
= 𝑚𝑟 (ℎ2 − ℎ1)
𝜂𝑐𝑜𝑚𝑝
𝐸��𝑑𝑒𝑠𝑡,1−2 = 𝐸𝑥1 − 𝐸��2 + ��1−2
Condenser
𝑚2 = 𝑚3 = 𝑚𝑟
𝑚8= 𝑚10 + 𝑚7
𝐸�� 𝑑𝑒𝑠𝑡,2−3 = 𝐸𝑥2 − 𝐸��3 + 𝐸𝑥7
+ 𝐸𝑥10 − 𝐸��8
6th Int. Conf.: Thermophysical and Mechanical Properties of Advanced Materials (THERMAM)
8thRostocker Int. Conf.: Thermophysical Properties for Technical Thermodynamics
22-24 September 2019, Çeşme, İzmir, Turkey
211
��2−3 = ��2 − ��3 == ��8− [��7+ ��10]
Expansion Valve
𝑚3 = 𝑚4 = 𝑚𝑟 ℎ3 = ℎ4 𝐸��𝑑𝑒𝑠𝑡,3−4 = 𝐸𝑥3 − 𝐸��4
PV/T Collector
𝑚4 = ��5
= 𝑚𝑟
��𝑆𝑢𝑛 = 𝐴𝑃𝑉(𝜏𝛼)𝐼𝑡= 𝑄��+ 𝑄𝑒𝑙
+ 𝑄𝑙𝑜𝑠𝑡
𝐸��dest,𝑃𝑉/𝑇 = 𝐸��𝑠𝑢𝑛 − 𝐸��𝑒𝑙 − 𝐸��𝑡ℎ
− 𝐸��𝑙
USC ��5 = ��6 = 𝑚𝑟 ��𝑈𝑆𝐶,𝑢 = 𝑚𝑟 (ℎ6 − ℎ5)
𝐸��dest,𝑈𝑆𝐶 = 𝐸��𝑠𝑢𝑛 − 𝐸��𝑡ℎ − 𝐸��𝑙
EV-II
𝑚1 = 𝑚6 = 𝑚𝑟
��6−1 = 𝑚𝑟 (ℎ6 − ℎ1)
𝐸��dest, EV−II=[(𝐸�� 6 − 𝐸��1)]
Drying Chamber
Air 𝑚8= 𝑚10 + 𝑚9
𝑚9 ℎ9 +𝑚10 ℎ10 −𝑚8 ℎ8= 𝑚𝑝 (ℎ𝑝,𝑖− ℎ𝑝,𝑜)
−∑��𝑙
+ ��𝑓𝑎𝑛
𝐸��dest,8−10 = 𝐸��8 + 𝐸��𝑝,𝑖− 𝐸��9 − 𝐸��10− 𝐸��𝑝,𝑜 − 𝐸��𝑙+ ��𝑓𝑎𝑛
Product 𝑚𝑝,𝑖 = 𝑚𝑝,𝑜 = 𝑚𝑝 ℎ𝑝 = 𝑐𝑝(𝑇𝑝,𝑖 − 𝑇𝑎)
𝐸��𝑝 = 𝑚𝑝 (𝜓𝑎 − 𝜓𝑝,𝑖)
The main performance parameters of instantaneous electrical and thermal efficiency of the hybrid PV/T collector, instantaneous thermal efficiency of the unglazed solar collector, COP of HP and hybrid PV/T-SAHP drying system, overall hybrid drying system energy and exergy efficiencies can be defined as, respectively [10]:
ηel =VmaxImax
APVIβ (5)
ηthPV =Qu
APVI (6)
ηthUSG =QU
AUI (7)
COPHP =Qc
Wcomp (8)

6th Int. Conf.: Thermophysical and Mechanical Properties of Advanced Materials (THERMAM)
8thRostocker Int. Conf.: Thermophysical Properties for Technical Thermodynamics
22-24 September 2019, Çeşme, İzmir, Turkey
212
COPPV/T−SAHP =Qu+
WPVηPower⁄
Wcomp (9)
ηoverall = ηthPV + ηthU +ηel
ηPower⁄ (10)
ηEx =Exc+ExPV
ExG+Wcomp (11)
Summary/Conclusions:
By using solar energy based food drying systems, quality and shelf life of goods may be improved
while food waste, energy consumption and greenhouse gas emission reducing. Therefore, the
development and applied of food drying systems integrated with renewable, sustainable energy
sources especially in rural areas where the food losses are high are most needed. Presented
hybrid drying system was designed to be able to reach relatively high temperature by integrating
unglazed solar collector to the HP unit even in the inadequate solar radiation and absence of sun.
Heat and electricity may be generated simultaneously by one collector (PV/T module) and some
part of electrical energy requirement of equipments may be covered by PV module. By applying
thermodynamic analysis to the presented hybrid drying system, irreversibilities and inefficient
equipments can be identified to adjust possible improvements.
References:
1. Puri, M., How access to energy can influence food losses-A brief overview. Rome,
2016.
2. Acar, C., Energetic And Exergetic Investigations of an Integrated Heat Pump System for
Drying Applications. Hittite J Sci Eng 5 (2018) 321–37.
3. Lamidi, R.O., Jiang, L., Pathare, P.B., Wang, Y.D., and Roskilly, A.P., Recent advances
in sustainable drying of agricultural produce: A review. Appl Energy 233–234 (2019) 367–
85.
4. Singh, P., Shrivastava, V., and Kumar, A., Recent developments in greenhouse solar
drying: A review. Renew Sustain Energy Rev 82 (2018) 3250–62.
5. El Hage, H., Herez, A., Ramadan, M., Bazzi, H., and Khaled, M., An investigation on solar
drying: A review with economic and environmental assessment. Energy 157 (2018) 815–
29.
6. Erbay, Z., and Hepbasli, A., Application of conventional and advanced exergy analyses to
evaluate the performance of a ground-source heat pump (GSHP) dryer used in food
drying, Energy Convers Manag 78 (2014) 499–507.
7. Kamel, R.S., Fung A.S., and Dash, P.R.H., Solar systems and their integration with heat
pumps: A review, Energy Build 87 (2015) 395–412.
6th Int. Conf.: Thermophysical and Mechanical Properties of Advanced Materials (THERMAM)
8thRostocker Int. Conf.: Thermophysical Properties for Technical Thermodynamics
22-24 September 2019, Çeşme, İzmir, Turkey
213
8. Mohanraj, M., Belyayev, Y., Jayaraj, S., and Kaltayev A., Research and developments on
solar assisted compression heat pump systems – A comprehensive review (Part-A:
Applications), Renew. Sustain. Energy Rev, 83 (2018) 90–123.
9. Çengel, Y.A., Boles, M.A., and Kanoğlu, M., Thermodynamics:An Engineering Approach.
9th ed. McGraw-Hill Education, 2019.
10. Duffie, J.A., and Beckman, W.A., Flat-Plate Collectors. Sol. Eng. Therm. 4th ed., John
Wiley & Sons, Inc. 2013.
Symbols:
�� Mass flow rate (kg/s)
ℎ Entropy (kJ
kg)
𝜈 Velocity of air (m/s)
𝑔 Gravitational acceleration, (ms−2)
𝑧 Altitude coordinate (m)
𝑐𝑝 𝑆𝑝𝑒𝑐𝑖𝑓𝑖𝑐 ℎ𝑒𝑎𝑡 (𝑘𝐽
𝑘𝑔. 𝐾)
Q Total heat transfer (kJ)
�� Total heat transfer rate (kW)
�� Power (kW)
𝐸�� 𝐸xergy (kW)
𝐸𝑥𝐺 Solar exergy input (kW)
𝐸𝑥𝑐 Exergy output in the condenser (kW)
𝐼 Irreversibility (kW)
��𝑔𝑒𝑛 Entrophy generetion (kJ/K)
𝐴 Total area (m−2)
𝑉𝑚𝑎𝑥 Max. Voltage (V)
𝐼𝑚𝑎𝑥 Max. Current (A)
𝐼 Incident solar irradiance (kW/𝑚−2)
𝑇𝑎 Ambient temperature (K)
𝐸𝑥𝑃𝑉 The electrical exergy efficiency from PV evaporator (kW)
𝑺𝒖𝒃𝒔𝒄𝒓𝒊𝒑𝒕𝒔
𝑖𝑛 input
𝑜𝑢𝑡 outlet
𝑐 condencer
𝑎 ambient
6th Int. Conf.: Thermophysical and Mechanical Properties of Advanced Materials (THERMAM)
8thRostocker Int. Conf.: Thermophysical Properties for Technical Thermodynamics
22-24 September 2019, Çeşme, İzmir, Turkey
214
𝑡ℎ thermal
𝑟 refrigerant
𝑙 lost
𝑢 useful
𝑒𝑙 electrical
𝑝, 𝑜 product, outlet
𝑝, 𝑖 product, inlet
𝑐𝑜𝑚𝑝 compresor
𝑑𝑒𝑠𝑡 destroyed
𝛽 Packing factor
𝑈𝑆𝐶 Unglazed solar collector
𝑓𝑎𝑛 Fan
𝑃𝑉 PV module
𝑃𝑉/𝑇 − 𝑆𝐴𝐻𝑃 photovoltaic − thermal solar assisted heat pump
𝑮𝒓𝒆𝒆𝒌 𝑳𝒆𝒕𝒕𝒆𝒓𝒔
𝜓 stream exergy
𝜂𝑃𝑜𝑤𝑒𝑟 average electrical efficiency of a coal − fired power plant
ηex exergy efficiency
𝜏 transmissivity
𝛼 absorptivity
6th Int. Conf.: Thermophysical and Mechanical Properties of Advanced Materials (THERMAM)
8thRostocker Int. Conf.: Thermophysical Properties for Technical Thermodynamics
22-24 September 2019, Çeşme, İzmir, Turkey
215
Measurement of Viscosity and Specific Heat of Nanofluids of Practical Interest
Maycon C. F. Magalhães1*, Helcio R. B. Orlande1
1Federal University of Rio de Janeiro *Corresponding author: [email protected]
Keywords: Nanofluids, Viscosity, Specific Heat, SiO2 nanoparticle.
Abstract
This work presents the results obtained at Heat Transfer and Transmission Laboratory – LTTC
of PEM/COPPE/UFRJ for the measurement of the physical properties of selected water-based
nanofluids. The physical properties of interest here are specific heat and dynamic viscosity.
The experimental measurements of the specific heat and viscosity were carried out in a
Differential Scanning Calorimeter and a rotational rheometer, respectively. Commercial Water-
based nanofluids containing SiO2 nanoparticles with different volume concentrations were
analysed in a range of temperatures. Particular focus is given for those nanofluids with SiO2
nanoparticles, due to their high stability, without any apparent deposition of nanoparticles. A
new correlation is proposed for the viscosity of the SiO2-water based nanofluids as a function
of volume concentration and temperature.
INTRODUCTION
Nanofluid is envisioned to describe a fluid in which nanometer-sized particles are
suspended in conventional heat transfer basic fluid [1]. This term nanofluids were first
proposed by Choi [2]. Conventional fluids such as ethylene glycol, water and oil have poor
heat transfer properties, but their vast applications in power generation, chemical processes,
heating and cooling processes, transportation, electronics, automotive and other micro-sized
applications make the re-processing of those thermos fluids to have better heat transfer
properties quite essential [3]. The industrial applicability of using nanofluids in heat transfer
systems is limited by the increase of the viscosity of the fluid (which increases the pumping
power). For particles in the nanometer range, the surface forces become predominant, and the
interactions are controlled by short-range forces like Van der Waals attraction force [4].
Currently, studies to models of the effective viscosity of nanofluids based on
experimental data can be found in the literature. Khanafer and Vafai [5] presented a critical
review of the thermophysical properties of nanofluids as effective thermal conductivity and
viscosity reported by several authors. They proposed a new correlation to the viscosity based
on the reported experimental data. Mahbubul and Saidur [3] present a review of the latest

6th Int. Conf.: Thermophysical and Mechanical Properties of Advanced Materials (THERMAM)
8thRostocker Int. Conf.: Thermophysical Properties for Technical Thermodynamics
22-24 September 2019, Çeşme, İzmir, Turkey
216
developments on the viscosity of nanofluids where different characteristics as preparation
methods, temperature, particle, shape and volume concentration are analysed.
Mondragón et Al. [6] characterised nanofluids of SiO2 and Al2O3 water-based in terms
of conductivity, specific heat, viscosity and stability for different nanoparticle volume
concentration and a range of temperature. Namburu et Al. [7] investigated the viscosity and
specific heat of silicon dioxide nanoparticle with various diameters suspended in ethylene
glycol and water mixture.
In this work, the specific heat and viscosity of SiO2 water-based nanofluids with
differents volumetric concentrations are measured in a range of temperature. The nanofluids
were acquired from two different manufacturers: US Research Materials [8] and
Nanostructured & Amorphous Materials [9]. The SiO2 nanoparticle presented spherical
diameter of 30 nm and particle density of 2.20 g/cm3. These nanoparticles were dispersed in
water, very well established and chemically pure according to manufactures. The physical
properties of these nanofluids were applied in an experimental study of laminar forced
convection of nanofluids in a straight, circular tube [10]. Determining the viscosity of the
nanofluid is essential to establishing accurate pumping power, Prandtl and Reynolds numbers
and the convective heat transfer coefficient as well. Specific heat is another essential
thermophysical property since the Prandtl number is also a function of specific heat [7].
Experimental apparatus Specific Heat
The analyses of the specific heat of nanofluids were carried out in a Differential Scanning
Calorimeter (DSC) model 204 F1 Phoenix. The method to calculate the specific heat is based
on the standards DIN 51007 and ASTM E 1269. The uncertainty of this equipment is in order
of 5% of the measured value [11]. The range of analysing vary from -195 up to 700 ºC.
Figure 1 shows the DSC operating principle. The sample is sealed into a crucible to avoid
the loss of material due to evaporation. Based on a homogeneous temperature field in the
furnace of the DSC, equal heat flux flows along the disk-shaped sensor are directed to the
sample and reference sides. If the heat capacities on the sample and reference sides differ, or
if the sample shows a changed heat absorption or loss due to transitions or reactions, the
subsequent different heat flow cause temperature gradients at thermal resistances of the
sensor, which is otherwise a good conductor. Sensitive temperature sensors as can seem in
figure 1 record these gradients and measure, thereby every difference in the heat flow very
quickly and accurately[11].
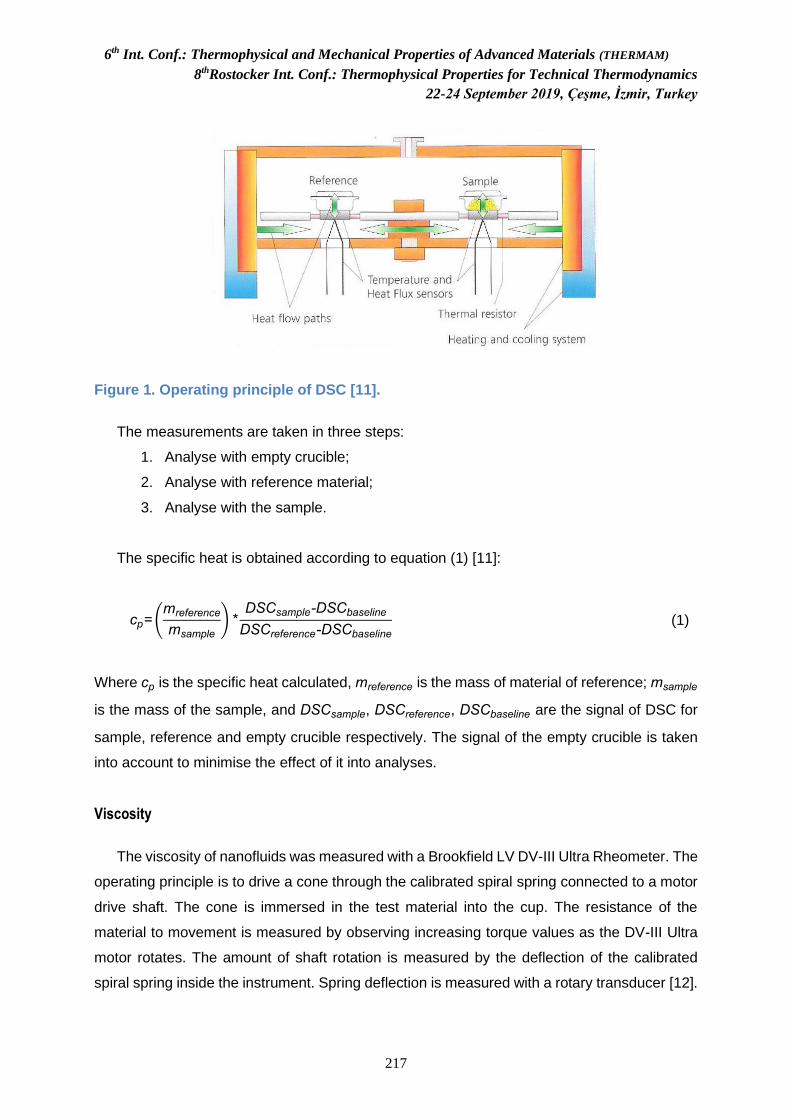
6th Int. Conf.: Thermophysical and Mechanical Properties of Advanced Materials (THERMAM)
8thRostocker Int. Conf.: Thermophysical Properties for Technical Thermodynamics
22-24 September 2019, Çeşme, İzmir, Turkey
217
Figure 1. Operating principle of DSC [11].
The measurements are taken in three steps:
1. Analyse with empty crucible;
2. Analyse with reference material;
3. Analyse with the sample.
The specific heat is obtained according to equation (1) [11]:
cp=(mreference
msample
) *DSCsample-DSCbaseline
DSCreference-DSCbaseline
(1)
Where cp is the specific heat calculated, mreference is the mass of material of reference; msample
is the mass of the sample, and DSCsample, DSCreference, DSCbaseline are the signal of DSC for
sample, reference and empty crucible respectively. The signal of the empty crucible is taken
into account to minimise the effect of it into analyses.
Viscosity
The viscosity of nanofluids was measured with a Brookfield LV DV-III Ultra Rheometer. The
operating principle is to drive a cone through the calibrated spiral spring connected to a motor
drive shaft. The cone is immersed in the test material into the cup. The resistance of the
material to movement is measured by observing increasing torque values as the DV-III Ultra
motor rotates. The amount of shaft rotation is measured by the deflection of the calibrated
spiral spring inside the instrument. Spring deflection is measured with a rotary transducer [12].

6th Int. Conf.: Thermophysical and Mechanical Properties of Advanced Materials (THERMAM)
8thRostocker Int. Conf.: Thermophysical Properties for Technical Thermodynamics
22-24 September 2019, Çeşme, İzmir, Turkey
218
The setup of the rheometer is shown in figure 2. It consists of a controlled thermal bath
connected to the viscometer through the sample cup, with this adjusting the working
temperature. The gap between the cone spindle and the plate must be mechanically adjusted
before measurements. This adjustment is made by moving the plate (built into the sample cup)
up towards the spindle until two small pins (one in the spindle, the second mounted on the
plate) contact slightly, and then by separating (lowering) the plate 0.0005inch (0.013mm). After
this, the cup is filled with 0.5 ml of sample. The cone spindle CPE-40 is used in these tests.
Finally, the thermal bath is set up at the desired working temperature. Enough time is given for
the thermal-bath reaches the setup working temperature.
The rheometer has a viscosity measurement range of 0.15 – 3.065 cP and can be handled
within a temperature range from –10 to 150 ºC, and have ± 1.0% of full-scale range for a
specific spindle running at a particular speed.
The spindle type and combination will produce satisfactory results when the applied torque
between 10 and 100% of the maximum permissible torque. The range of spindle speeds
available in this viscometer is from 0.01 to 250 rpm [12].
Figure 2. Rheometer setup [12].
Theoretical investigation Specific Heat
The specific heat can be determined based on the mixture rule to volumetric specific heat
by assuming thermal equilibrium between the nanoparticles and the based fluid as following
equation [5]:
cef=(1+ϕ
p)cfρf
+ϕpcpρ
p
ρef
(2)
6th Int. Conf.: Thermophysical and Mechanical Properties of Advanced Materials (THERMAM)
8thRostocker Int. Conf.: Thermophysical Properties for Technical Thermodynamics
22-24 September 2019, Çeşme, İzmir, Turkey
219
where ϕp is the concentration of nanoparticle, ρ
p is the density of nanoparticle, ρ
f is the density
of the base fluid ρef
is the density of nanofluid, cp is the heat capacity of nanoparticle, cf is the
specific heat of based fluid, and cef is the nanofluid specific heat.
However, some works found in the literature have used the mixture rule applied directly in
the specific heat equation (2) as shown below, instead of volumetric specific heat.
cef = (1 + ϕp)cf + ϕ
pcp (3)
The equation (3) has not presented a good agreement with experimental data. On the other
hand, equation (2) fitted very well with experimental data.
Viscosity
Viscosity is defined as the resistance between two layers of the fluids. Once the
nanoparticles are dispersed in the liquids, there is a possibility of enhancement in resistance
between the two layers of the fluid, if the fluid subjected to shear resulting in an increased
viscosity of the nanofluids. This increase can be estimated through solid-fluid homogenous
equations [13].
From the theoretical point of view, a nanofluid represents a fascinating new challenge to
researchers in fluid dynamics and heat transfer because it appears very difficult, if not
practically impossible, to formulate any theory that can reasonably predict behaviours of
nanofluids by considering it as a multi-component fluid [14].
Different theoretical models have been developed by researchers to estimate the
effective viscosity nanofluids derivate from Einstein equation [15] which is based on a dilute
suspension of rigid spheres in a viscous liquid as a function of volume fraction (lower than 5%)
as seen in equation (4):
μeff
= (1+2.5ϕp)μ
f (4)
where μeff
is the nanofluid, μf is the based fluid and ϕ
p is the particle volume concentration.
Brinkman [16] extend Einstein’s formula to moderate particle volume concentration up to
4%. The expression is as follow:
μeff
=1
(1+ϕp)2.5
μf (5)
6th Int. Conf.: Thermophysical and Mechanical Properties of Advanced Materials (THERMAM)
8thRostocker Int. Conf.: Thermophysical Properties for Technical Thermodynamics
22-24 September 2019, Çeşme, İzmir, Turkey
220
Batchelor [17] presents a formula based on the Brownian motion on the effectivity viscosity
in a suspension of rigid spherical particles. The equation is expressed by:
μeff
= (1+2.5ϕp+ 6.2 ϕ
p2)μ
f (6)
Lundgren [18] has offered a formula under the form of a Taylor Series in ϕp:
μeff
= (1+2.5ϕp+ 6.25 ϕ
p2 +O ϕ
p3)μ
f (7)
Eilers [19] based on experimental data of suspensions of bitumen spheres developed the
expression:
μeff
= (1+2.5ϕp+ 4.75 ϕ
p2)μ
f (8)
Saito [20] presented the equation based on the Brownian motion of tiny spherical rigid
particle:
μeff
= (1+2.5ϕp+ 2.5 ϕ
p2)μ
f (9)
It is evident that if the term O(ϕ p
2) and higher are neglected all the expressions above
reduces to the Einstein formula.
Results Specific Heat
The specific heat of SiO2-water nanofluids was measured from 25ºC to 60ºC and particle
volume concentration from 4.6% to 14.53%. The calibration of DSC was carried out with
distilled water for the same range of temperature of nanofluids measurements. The results
presented an excellent agreement with the reference values given in the standard textbook
[21].
In figure 3, measured values of SiO2-water nanofluids are compared with the equation (2)
at 25ºC for a range of SiO2 nanoparticle volume concentrations. As expected, the measured
values present a good agreement with theoretical values with uncertainty within ± 5%. Besides,
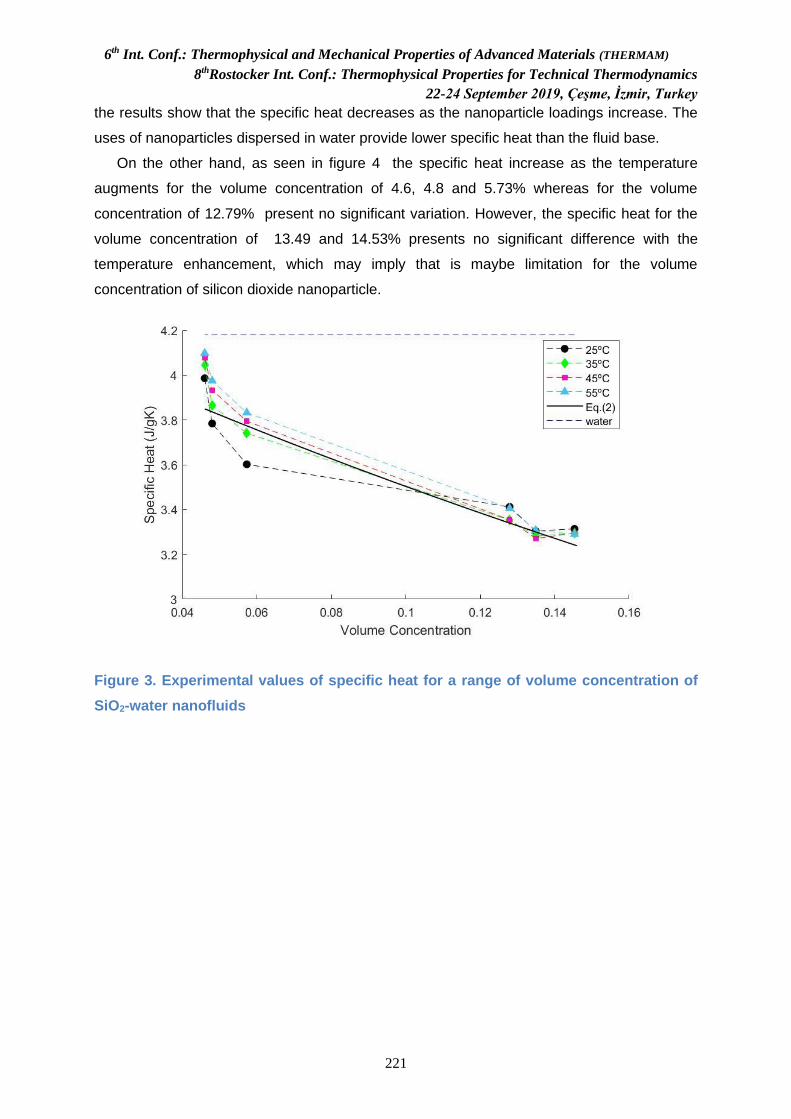
6th Int. Conf.: Thermophysical and Mechanical Properties of Advanced Materials (THERMAM)
8thRostocker Int. Conf.: Thermophysical Properties for Technical Thermodynamics
22-24 September 2019, Çeşme, İzmir, Turkey
221
the results show that the specific heat decreases as the nanoparticle loadings increase. The
uses of nanoparticles dispersed in water provide lower specific heat than the fluid base.
On the other hand, as seen in figure 4 the specific heat increase as the temperature
augments for the volume concentration of 4.6, 4.8 and 5.73% whereas for the volume
concentration of 12.79% present no significant variation. However, the specific heat for the
volume concentration of 13.49 and 14.53% presents no significant difference with the
temperature enhancement, which may imply that is maybe limitation for the volume
concentration of silicon dioxide nanoparticle.
Figure 3. Experimental values of specific heat for a range of volume concentration of
SiO2-water nanofluids
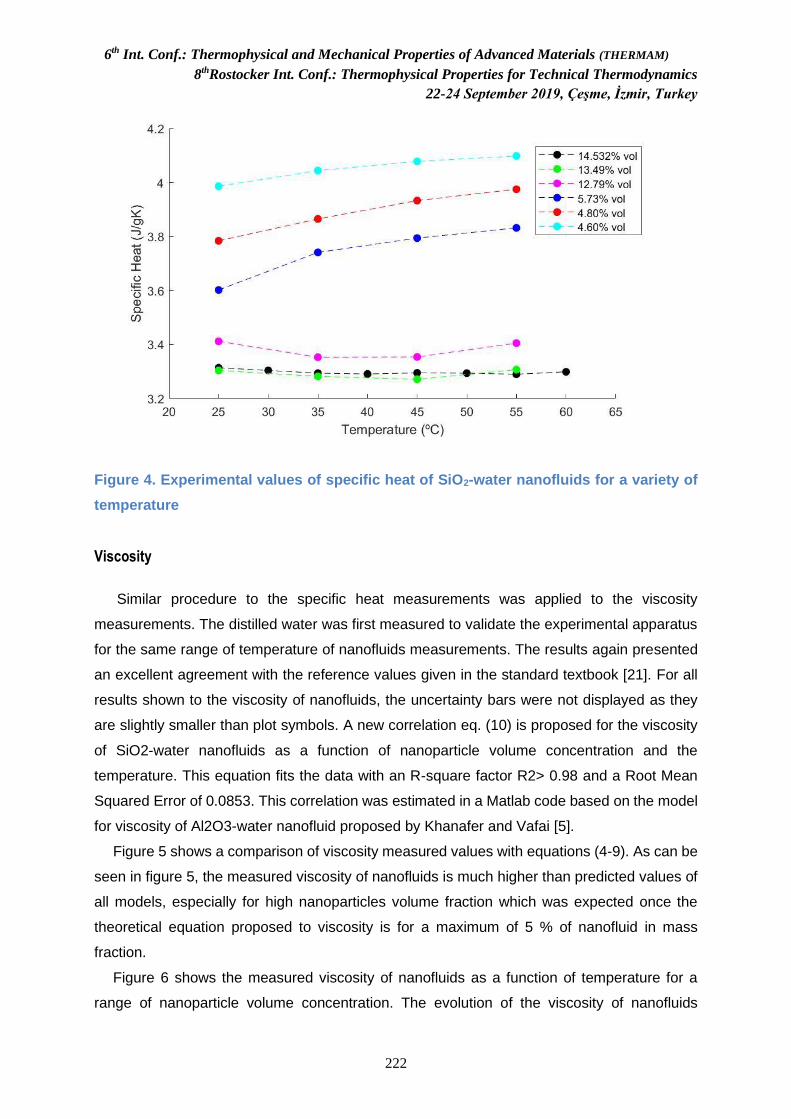
6th Int. Conf.: Thermophysical and Mechanical Properties of Advanced Materials (THERMAM)
8thRostocker Int. Conf.: Thermophysical Properties for Technical Thermodynamics
22-24 September 2019, Çeşme, İzmir, Turkey
222
Figure 4. Experimental values of specific heat of SiO2-water nanofluids for a variety of
temperature
Viscosity
Similar procedure to the specific heat measurements was applied to the viscosity
measurements. The distilled water was first measured to validate the experimental apparatus
for the same range of temperature of nanofluids measurements. The results again presented
an excellent agreement with the reference values given in the standard textbook [21]. For all
results shown to the viscosity of nanofluids, the uncertainty bars were not displayed as they
are slightly smaller than plot symbols. A new correlation eq. (10) is proposed for the viscosity
of SiO2-water nanofluids as a function of nanoparticle volume concentration and the
temperature. This equation fits the data with an R-square factor R2> 0.98 and a Root Mean
Squared Error of 0.0853. This correlation was estimated in a Matlab code based on the model
for viscosity of Al2O3-water nanofluid proposed by Khanafer and Vafai [5].
Figure 5 shows a comparison of viscosity measured values with equations (4-9). As can be
seen in figure 5, the measured viscosity of nanofluids is much higher than predicted values of
all models, especially for high nanoparticles volume fraction which was expected once the
theoretical equation proposed to viscosity is for a maximum of 5 % of nanofluid in mass
fraction.
Figure 6 shows the measured viscosity of nanofluids as a function of temperature for a
range of nanoparticle volume concentration. The evolution of the viscosity of nanofluids
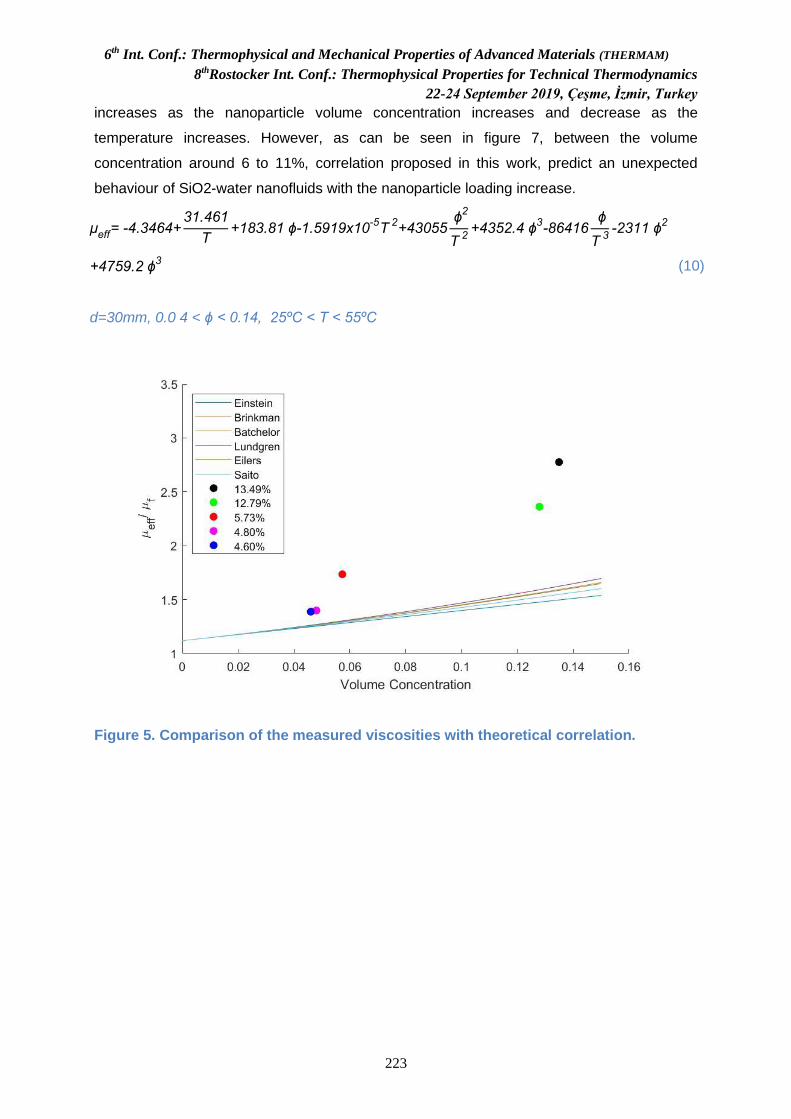
6th Int. Conf.: Thermophysical and Mechanical Properties of Advanced Materials (THERMAM)
8thRostocker Int. Conf.: Thermophysical Properties for Technical Thermodynamics
22-24 September 2019, Çeşme, İzmir, Turkey
223
increases as the nanoparticle volume concentration increases and decrease as the
temperature increases. However, as can be seen in figure 7, between the volume
concentration around 6 to 11%, correlation proposed in this work, predict an unexpected
behaviour of SiO2-water nanofluids with the nanoparticle loading increase.
μeff
= -4.3464+31.461
T+183.81 ϕ-1.5919x10
-5T
2+43055
ϕ2
T 2
+4352.4 ϕ3-86416
ϕ
T 3
-2311 ϕ2
+4759.2 ϕ3
(10)
d=30mm, 0.0 4 < ϕ < 0.14, 25ºC < T < 55ºC
Figure 5. Comparison of the measured viscosities with theoretical correlation.
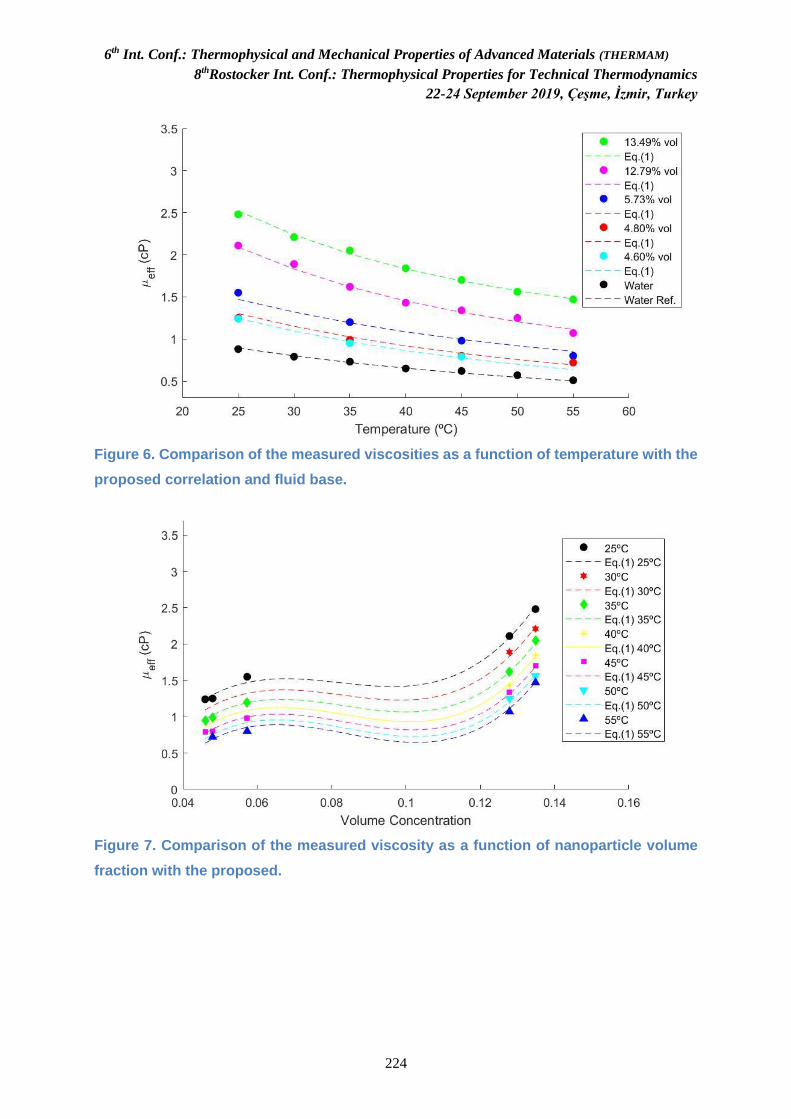
6th Int. Conf.: Thermophysical and Mechanical Properties of Advanced Materials (THERMAM)
8thRostocker Int. Conf.: Thermophysical Properties for Technical Thermodynamics
22-24 September 2019, Çeşme, İzmir, Turkey
224
Figure 6. Comparison of the measured viscosities as a function of temperature with the
proposed correlation and fluid base.
Figure 7. Comparison of the measured viscosity as a function of nanoparticle volume
fraction with the proposed.
6th Int. Conf.: Thermophysical and Mechanical Properties of Advanced Materials (THERMAM)
8thRostocker Int. Conf.: Thermophysical Properties for Technical Thermodynamics
22-24 September 2019, Çeşme, İzmir, Turkey
225
Conclusion
In the present study, the specific heat and viscosity of SiO2-water nanofluids with the
nanoparticle volume concentration of 4.6, 4.8, 5.73, 12.79, 13.49 and 14.53vol.% were
investigated experimentally at temperatures ranging between 25ºC and 55ºC. The specific
heat of nanofluids presented decrease around 5% to lower volume fraction and 21% to the
higher volume fraction at 25ºC when compared with the fluid base. The nanofluids with the
volume fraction of 12.79, 13.49 and 14.53vol.% did not present a significant variation in the
specific heat as the increase of temperature.
The viscosity of nanofluids presented a lower enhancement of around 36% for the volume
concentration of 4.6% and a higher increase of 49% for the volume concentration of 12.79%.
Moreover, for example, the viscosity of 13.49vol% is three times higher than the fluid base,
showing that viscosity is hugely dependent on the nanoparticle volume concentration. Nguyen
et al. [14] explain this behaviour is because increasing concentration would have a direct effect
on the fluid internal shear stress while the temperature effect is obviously due to a weakening
of inter-particle and inter-molecular adhesion forces.
However, a new correlation as a function of temperature and nanoparticle volume
concentration has been developed equation (10) with a correlation factor higher than 0.98 and
a Root Mean Squared Error of 0.0853.
References
[1] S. Kakaç and P. Anchasa, "Review f convective heat transfer enhancement with
nanofluids," International Journal of Heat and Mass Transfer, vol. 52, pp. 3187-3196,
2009.
[2] S. Choi, "Enhancing Thermal Conductivity of Fluids with Nanoparticles," Proceedings of
the 1995 ASME International Mechanical Engineering Congress and Exposition, pp. 99-
105, 1995.
[3] I. M. Mahbubul and M. A. Saidur, "Latest developments on the viscosity of nanofluids,"
International Journal of Heat and Mass, vol. 55, 2012.
[4] D. Quemada and C. Berli, "Energy of interaction in colloids and its implications in
rheological modeling.," Advances in Colloid and Interface Science, vol. 98, pp. 51-85,
2002.
[5] K. Khanafer and K. Vafai, "A critical sysnthesis of thermophysical characteristics of
nanofluids," International Journal of Heat and Mass Transfer, vol. 54, pp. 4410-4428,
2011.
6th Int. Conf.: Thermophysical and Mechanical Properties of Advanced Materials (THERMAM)
8thRostocker Int. Conf.: Thermophysical Properties for Technical Thermodynamics
22-24 September 2019, Çeşme, İzmir, Turkey
226
[6] R. Mondragón, C. Segarra, J. C. Jarque, J. E. Julia, L. Hernández and R. Matínez-
Cuenca, "Characterization of physical properties of nanofluids for heat transfer
application," 6th European Thermal Science Conference ( Eurotherm 2012) -Journal of
Physics , vol. 395, 2012.
[7] P. Namburu, D. Kulkami, A. Dandeakar and D. K. Das, "Experimenatl investigation of
viscosity and specific heat of silicon dioxide nanofluids," Micro & Nano Letters, vol. 2, pp.
66-71, 2007.
[8] "US Research Nanomaterials, Inc.," [Online]. Available: https://www.us-nano.com/.
[Accessed 23 08 2019].
[9] "Nanostructured & Amorphous Materials, Inc.," [Online]. Available:
https://www.nanoamor.com/. [Accessed 23 08 2019].
[10] I. G. S. Cerqueira, L. F. Lage, R. M. Cotta, J. N. N. Quaresma, H. R. B. Orlande and E.
Robertis, "Experimental-Theoretical Analysis of Laminar Forced Convection of Water-
Silica Nanofluids in a Circular Tube," VII Congresso Nacional de Engenharia Mecânica-
CONEM, July 2012.
[11] G. G. Netzsch, "Operating Instructions, DSC Apparatus, DSC 204 F1 Phoenix.," 2011.
[12] I. Laboratories Brookfield Engineering, "Brookfield DV-III ULTRA Programmable
Rheometer," 2005.
[13] L. S. Sundar, K. V. Sharma, M. T. Naik and M. K. Singh, "Empirical and theoretical
correlations on viscosity of nanofluids: A review," Renewable and Sustainable Energy
Reviews, vol. 25, pp. 670-696, 2013.
[14] C. T. Nguyen, F. Desgranges, G. Roy, N. Galanis, T. Maré, S. Boucher and A. H. Mintsa,
"Temperature and particle-size dependent viscosity data for water-based nanofluids -
Hysteresis phenomenon," International Journal of Heat and Fluid Flow, vol. 28, pp. 1942-
1506, 2007.
[15] A. Einstein, "Eine neue bestummung der molekuldimensionen," Ann. Phys., pp. 289-306,
1906.
[16] T. Brinkman, "The viscosity of concentrated suspensions and solutions.," J. Chem. Phys.,
vol. 20, p. 571, 1952.
[17] Batchelor, "The effect of Brownian motion on the bulk stress in a suspension of spheres.,"
J. Fluid Mech., vol. 83, pp. 97-117, 1977.
[18] T. Lundgren, "Slow flow through stationary random beds and suspensions of spheres.,"
J. Fluid Mech., vol. 51, pp. 273-299, 1972.
6th Int. Conf.: Thermophysical and Mechanical Properties of Advanced Materials (THERMAM)
8thRostocker Int. Conf.: Thermophysical Properties for Technical Thermodynamics
22-24 September 2019, Çeşme, İzmir, Turkey
227
[19] Eilers, "Die viskocitat vn emulsionen hochviskoser stoffe als funktion der konzentration,"
Kolloid-Zeitschrift, vol. 97, pp. 313-321, 1941.
[20] N. Saito, "Concentration dependence of viscosity of high polymer solutions.," J. Phys.
Soc. Jpn., vol. 5, pp. 4-8, 1950.
[21] F. P. Incropera and D. P. DeWitt, Fundamentals of Heat and Mass Transfer, John Wiley
& Sons, 2006.
ACKNOWLEDGEMENTS
The authors would like to acknowledge the financial support provided by the Brazilian agencies
Petrobras/CENPES (Convênio CENPES – COPPETEC, PD 01471 – PEM 11332), CNPq, and
FAPERJ. Currently, the corresponding author is PhD candidate at Universitat Rovira i Virgili.

6th Int. Conf.: Thermophysical and Mechanical Properties of Advanced Materials (THERMAM)
8thRostocker Int. Conf.: Thermophysical Properties for Technical Thermodynamics
22-24 September 2019, Çeşme, İzmir, Turkey
228
INDEX
A
Abdelwahade KRIKER, 60
Abilgani ALIYEV, 8
Adel BENCHABANE, 60
Akar DOGAN, 42, 116
Akif OZBAY, 57
Akin ISBILIR, 43, 44, 45
Ali KARA, 21, 22, 87, 99
Almi KENZA, 59
Alpaslan TURGUT, II, IV, 9, 38, 40, 120
Alper Mete GENC, 25, 65
Alper TASDEMIRCI, IV
Amit Kumar MISHRA, 31
Ana MOITA, 11
Anastasiia NIKULINA, 11
António Luis MOREIRA, 11
Artem NIKULIN, 11
Asif MAMMADOV, 55, 56, 82
Aykut BILIR, 20
Aylin SENDEMIR, IV
Aysun BALTACI, 41
Aysun SOFUOĞLU, 35
Aytakin GULUZADE, 8
B
B. B. LAHIRI, 31
Barbaros CETIN, III, 32
Barış Oğuz GURSES, III, 41
Baylar ZARBALIYEV, 33
Bekir BOYACI, 24
Berkay AYDOGAN, 109
Betul Gizem ACAN, 18, 53
Boris KOSOY, IV
Burak ATAKAN, III
C
Cagatay OZADA, 29, 30
Carolina P. NAVEIRA-COTTA, III, 2, 180
Cevdet KAYNAK, IV
Cicek OZES, 42, 64, 116
D
Damla BARISIK MARASLI, 34
Daniel LAGER, 13
Daryush ILA, III
Deniz DONER, 51
Dildare BAŞALP, 35
Dilgam TAGIYEV, 55, 82
Dilshod MUKHITDINOV, 54
Djavid NABIZADE, 33
Dominique BAILLIS, III, 4
E
Ebru ORMANLI, 47,201
Ege Anıl DILER, III
Egon HASSEL, II, III, 8
Elman MAMMADOV, 55, 56, 82
Elsun AZIZOV, 61
Emanuel M. MACEDO, 180
Emre ERBIL, 28
Evgeniy DMITRIEV, 12
F
F.M. ARSLAN, 68
Farida GASIMOVA, 56
Fariz AMIROV, 33, 61
Farrukh ATABAEV, 54
Ferhat ONER, 45
Fidan IBRAHIMOVA, 55, 82
Fikret INAL, 35
Filiz ICIER, 14, 51
Firangiz RAHIMOVA, 63
Funda TIHMINLIOGLU, 35
Furkan ERGIN, 27, 30
G
Gamar SULEYMANOVA, 61
Gokhan DEMIREL, 52
Gozde Sevig Tantug, 43, 44, 45, 48
Gregor GOTZL, 16
Gulnara ALIYEVA, 63
Gulyaz ABDULLAYEVA, 8
Gumru ZAIDOVA, 56
H
H. GUNERHAN, 68
Hakki OZER, 27, 30
Halil ATALAY, 10
Halil Dogacan KOCA, 65
Halis KANDAS, 64
Haluk E. KARACA, III
Hasan ILHAN, 52, 58
Hasan KASIM, 50
Hasan YILDIZ, IV
Hava CEKIN, 44, 48
Helcio R. B. ORLANDE, IV, 49, 215
Heng BAN, III
Hikmet IBRAHIMOV, 66
I
Ibrahim Kursad TURKOGLU, 29
Ibrahim PALABIYIK, 18, 53
Igor MOTOVOY, 11, 12
6th Int. Conf.: Thermophysical and Mechanical Properties of Advanced Materials (THERMAM)
8thRostocker Int. Conf.: Thermophysical Properties for Technical Thermodynamics
22-24 September 2019, Çeşme, İzmir, Turkey
229
Igor NOVAK, IV
Ilker TOPUZ, 109
J
Javid SAFAROV, II, IV, , 8, 61, 63
Jean-Gabriel BAUZIN, 7
Jerzy BODZENTA, III
Johan JACQUEMIN, III
John PHILIP, 31
Joao N. N. QUARESMA, 180
K
Kadir YURDAKOC, IV
Katerina KHANCHYHC, 12
Kemal Levend PARNAS, IV
Kenza ALMI, 60
Kerim ERASLAN, 43
Khagani SULEYMANLI, 8
Kleber M. LISBOA, 180
Konstantin TUMBURKAT, 12
Kubra BURSA, 18, 53
Kutlay SEVER, IV, 37
L
Lakel SAID, 59
Lala AZIZOVA, III
Lala ZAMANOVA, 66
Levent CETIN, 40, 120
Lutfiye ALTAY, III, 37, 43, 44, 45, 46, 48
M
Mahi R. SINGH, IV
Mahir BASHIROV, 8
Mahmut KILICLI, 18, 53
Mahmut Serif YILDIRIM, 52
Malika IMOULA, 15
Maria OMASTOVA, IV, 9
Masahide TERAZIMA, IV
Mastura ISKANDAROVA, 54
Matthias H. BUSCHMANN, 25
Maycon C. F. MAGALHAES, 49, 215
Mehmet Akif EZAN, III, 38
Mehmet GULCU, 18, 53
Mehmet MUTLU, IV
Mehmet Özgür SEYDIBEYOGLU, IV
Mehmet SARIKANAT, II, IV, 37, 41, 43, 44, 45,
46, 48
Melis OZKAYA, 43, 44, 45
Meric ISIK, 21, 22, 87, 99
Mert SENER, 41
Mert Sinan TURGUT, 19
Merve UNAL, 29, 30
Mihai BRANZEI, III
Mihai CHIRTOC, III
Mohammed LACHI, IV
Mohammed LAHCINI, IV
Mohmmad ALABOUD, 26
Mourad REBAY, IV
Moussa El Khodor EL KHODOR, 27
Murat YAZICI, 27, 29, 30
Mustafa Turhan COBAN, III, 19, 37, 124, 153
Mustapha FEKHAR, 15
Mutlu CEVIK, 51
Mürsel ALIŞKIN, 27
N
Nadjat CHAOUCH, 23
Najib LARAQI, IV, 7
Narmina GULIYEVA, 33, 61
Nasim KIAN-POUR, 17
Necdet SAGLAM, IV, 20, 52, 58
Neslihan COLAK GUNES, 34
Nevzat KONAR, 18, 53
Nicolas HORNY, III
Nur COBANOGLU, 25, 26, 65
Nur KARASAHIN, 109
Nuray AHMEDOVA, 55, 82
O
Oguz Emrah TURGUT, 19
Okan OZDEMİR, 64
Olena MELNYK, 11
Olga KHLIYEVA, 11, 12
Olivier FUDYM, III
Omer Burak CE, 22, 87
Omer Faruk COKGEZME, 51
Omer Said TOKER, 18, 53
Orhan EKREN, 65
Orhan KAYA, 14
Ozan KARAMAN, IV
Ozge AKBULBUL, 41
Ozge Andiç Çakır, III
Ozge ATA, 47, 201
P
Pericles C. PONTES, 180
Peter DIEŠKA, 3, 16
R
Rachid BENNACER, III
Rachid SACI, 15
Rahime ALSANGUR, 40, 120
Ramazan AKCAN, 52
Ramazan KARAKUZU, IV, 28
RANJAN DEY, 6
Rasim IPEK, III
Rémi COQUARD, 4
Renato M. COTTA, III, 5, 180
Rupali TIWARI, 3, 16
S
Said BENRAMACHE, 23
Said LAKEL, 23, 60
Sait Cemil SOFUOGLU, 35
6th Int. Conf.: Thermophysical and Mechanical Properties of Advanced Materials (THERMAM)
8thRostocker Int. Conf.: Thermophysical Properties for Technical Thermodynamics
22-24 September 2019, Çeşme, İzmir, Turkey
230
Samet SANBUR, 42, 64, 116
Sami SAYER, 42, 64, 116
Sandra I.G. DIAS, 11
Sebnem TAVMAN, IV, 34, 47, 201, 208
Seher KUMCUOGLU, 47, 201
Sema YILDIZ, 109
Semran SAGLAM, 57
Sena GULEN, 46
Serkan DOGANAY, 40, 120
Shabnam HAJIZADE, 61
Shahla ALIZADEH, 66
Sıla Ovgu KORKUT UYSAL, 25
Sinem OZTURK, 24
Sukru KARATAS, 17
T
T. Raci SERTBAKAN, 57
Tuba ALPYILDIZ, 24
Tuba EVGIN, 9
Tugce UYSALMAN, 43, 44, 45
U
Ugur Omer KOCAMIS, 64
Ugur TAMER, 52, 58
Ulviyya HASANOVA, III, 33
Umran Ceren BASKOSE, 57
Utku VAROL, 24
V
Vagif ABBASOV, III
Vagifa HUSEYNOVA, 56
Viliam VRETENÁR, 3
Vitaly ZHELEZNY, 11, 12
Vladimir BORISOV, 11
Vlastimil BOHÁČ, III, 3, 16
Vugar KHALILOV, 63
Y
Yalcin BOZTOPRAK, 29, 30
Yıldırım AYDOGDU, III
Yigit AKKUS, 32
Yoldas SEKI, IV, 37, 41, 43, 44, 45, 48
Youcef HADJER, 59
Yusif ALIYEV, III
Z
Zafer DURSUNKAYA, 32
Zafer YENIER, 46
Zarema GAKHRAMANOVA, 33, 61
Zdenko SPITALSKY, 9
Ziya Haktan KARADENIZ, IV, 25, 26, 65
6th Int. Conf.: Thermophysical and Mechanical Properties of Advanced Materials (THERMAM)
8thRostocker Int. Conf.: Thermophysical Properties for Technical Thermodynamics
22-24 September 2019, Çeşme, İzmir, Turkey
IV
Ziya Haktan KARADENIZ, Izmir Kâtip Çelebi University, Turkey
Ramazan KARAKUZU, Dokuz Eylül University, Turkey
Ozan KARAMAN, İzmir Katip Çelebi University, Turkey
Cevdet KAYNAK, Middle East Technical University, Turkey
Boris KOSOY, Odessa National Academy of Food Technologies, Ukraine
Mohammed LACHI, University of Reims, France
Mohammed LAHCINI, Cadi Ayyad University, Morocco
Najib LARAQI, Université Paris Nanterre, France
Mehmet MUTLU, TOBB University of Economics and Technology , Turkey
Igor NOVAK, Slovak Academy of Sciences, Slovakia
Maria OMASTOVA, Slovak Academy of Sciences, Slovakia
Helcio R. B. ORLANDE, Federal University of Rio De Janeiro, Brazil
Kemal Levend PARNAS, TED University , Turkey
Mourad REBAY, University of Reims Champagne-Ardenne, France
Javid SAFAROV, University of Rostock, Germany
Necdet SAGLAM, Hacettepe University, Turkey
Mehmet SARIKANAT, Ege University, Turkey
Yoldaş SEKI, Dokuz Eylul University, Turkey
Kutlay SEVER, Izmir Kâtip Çelebi University, Turkey
Mehmet Özgür SEYDIBEYOGLU, İzmir Katip Çelebi University, Turkey
Mahi R. SINGH, Western University, Canada
Aylin SENDEMIR, Ege University, Turkey
Sebnem TAVMAN, Ege University, Turkey
Masahide TERAZIMA, Kyoto University, Japan
Alpaslan TURGUT, Dokuz Eylul University, Turkey
Hasan YILDIZ , Ege University, Turkey
Kadir YURDAKOC, Dokuz Eylul University, Turkey
6th Int. Conf.: Thermophysical and Mechanical Properties of Advanced Materials (THERMAM)
8thRostocker Int. Conf.: Thermophysical Properties for Technical Thermodynamics
22-24 September 2019, Çeşme, İzmir, Turkey
180
SPONSORS