Embed Size (px)
Citation preview

Tampere University of Technology
Organizational culture
CitationTeräväinen, V., Junnonen, J. M., & Ali-Löytty, S. (2018). Organizational culture: Case of the finnish constructionindustry. Construction Economics and Building, 18(1), 48-69. DOI: 10.5130/AJCEB.v18i1.5770
Year2018
VersionPublisher's PDF (version of record)
Link to publicationTUTCRIS Portal (http://www.tut.fi/tutcris)
Published inConstruction Economics and Building
DOI10.5130/AJCEB.v18i1.5770
CopyrightThis work is licensed under a Creative Commons Attribution 4.0 International License. To view a copy of thislicense, visit http://creativecommons.org/licenses/by/4.0/
Take down policyIf you believe that this document breaches copyright, please contact [email protected], and we will remove access tothe work immediately and investigate your claim.
Download date:01.05.2019
Construction Economics and Building
Vol. 18, No. 1 March 2018
© 2018 by the author(s). This is an Open Access article distributed under the terms of the Creative Commons Attribution 4.0 International (CC BY 4.0) License (https://creativecommons.org/licenses/by/4.0/), allowing third parties to copy and redistribute the material in any medium or format and to remix, transform, and build upon the material for any purpose, even commercially, provided the original work is properly cited and states its license.
Citation: Teräväinen, V., Junnonen, J. M., and Ali-Löytty, S. 2018. Organizational Culture: Case of the Finnish Construction Industry. Construction Economics and Building, 18:1, 48-69. http://dx.doi.org/10.5130/AJCEB.v18i1.5770
ISSN 2204-9029 | Published by UTS ePRESS | ajceb.epress.lib.uts.edu.au
RESEARCH ARTICLE
Organizational Culture: Case of the Finnish Construction Industry
Ville Teräväinen1*, Juha-Matti Junnonen2, Simo Ali-Löytty3
1 YIT Corporation, P.O.Box 36, FI-00621 Helsinki, Finland. [email protected] Construction Management and Economics, Tampere University of Technology, P.O.Box 600, FI-33101 Tampere, Finland. [email protected] Department of Mathematics, Tampere University of Technology, P.O.Box 692, FI33101 Tampere, Finland. [email protected]
*Corresponding author: Ville Teräväinen, YIT Corporation, P.O.Box 36, FI-00621 Helsinki, Finland; [email protected]
DOI: http://dx.doi.org/10.5130/AJCEB.v18i1.5770Article History: Received 02/10/2017; Revised 27/02/2018; Accepted 09/03/2018; Published 28/03/2018
AbstractAcademic literature has long recognized the correlation between a company’s organizational culture and its quality performance. The Finnish construction industry is still a highly human powered industry, and thus, organizational culture is seen to have a significant effect on an organization’s efficiency as well. The aim of this study is to examine and determine organizational cultural profiles of organizations in the Finnish construction industry as they are currently perceived and preferred by professionals themselves. In all, 121 professionals working in organizations in the Finnish construction industry were surveyed using the Organizational Culture Assessment Instrument (OCAI). The reliability of characteristics was tested by calculating Cronbach alpha reliability coefficients, and the found differences between the response characteristics were analysed in-depth with paired and independent t-test analyses. The findings show that, on average, construction industry organizations in Finland currently operate with a mixture of clan and hierarchy cultures. Thus, the current organizational culture stresses the point of view of internal focus and integration. However, the organizations desired to emphasize more flexibility and discretion toward individuals. The novelty value of this paper is presenting existing and preferred culture profiles in the Finnish construction industry. These found profiles have the potential to improve management of organizations, which results in better efficiency of the industry through better performance of organizations in the construction industry.
DECLARATION OF CONFLICTING INTEREST The author(s) declared no potential conflicts of interest with respect to the research, authorship, and/or publication of this article. FUNDING The author(s) received no financial support for the research, authorship, and/or publication of this article.
48
KeywordsOrganizational culture, construction industry, Finland, OCAI, efficiency
IntroductionThe influence of organizational culture (OC) on organizational performance and efficiency has long been recognized in the academic literature (e.g. Siehl and Martin 1990; Liu and Zhang 2003). But, OC in the construction industry has not been given serious attention until the late 1990s and early 2000s. The human behaviour aspect in the construction industry seems still to be neglected based on the relatively scarce number of academic studies over the topic (Teräväinen, Suominen, and Kähkönen, 2017; Cheung, Wong and Wu, 2011). This paper presents a one of a kind study conducted in Finland.
Effectiveness issues have plagued the Finnish construction industry during the last two decades, and as OC is regarded as one of the key factors affecting the effectiveness of a company (Alas, Kraus and Niglas, 2009), the heavily human-powered industry is identified to have a great opportunity to enhance its current level of effectiveness through its OC (e.g. Liu and Zhang 2003; Zhang and Liu 2006). The most forward-looking companies have already achieved success by departing from entrenched construction business models and practices (Cheung, Wong and Lam, 2012) as a continuously changing business environment requires fresh perspectives and innovativeness from today’s construction (Nummelin, 2007; Yepes et al. 2016; Monahan, Coates and Clarke-Hagan; Castro et al., 2012).
This paper is a part of an on-going large research project in the Finnish construction industry, which aims to portray the mechanism of the interaction between OC and effectiveness. To achieve a better level of efficiency, an organization must change its way of doing things. It must change its practices and its culture in the long term. Fundamental and long-term cultural changes always require changes in the organization’s basic values (Schein, 1985; Hofstede, Hofstede and Minkov, 2010). This soft side of organizations has often been neglected among practitioners in the construction industry, as the current culture emphasizes engineering skills and process management techniques, which blinds industry leaders and researchers from the industry’s long-term capability to operate at a high efficiency level (e.g. Green and May, 2003).
To achieve a more comprehensive understanding of how OC affects effectiveness, the mechanism between these must be portrayed in a more detailed level. Moreover, as OC has been identified to have an effect on construction efficiency (Zhang and Liu, 2006), the main objectives of this study are (i) to determine the currently perceived and the preferred states of the OC profile of the Finnish construction industry’s organizations with an OCAI questionnaire; (ii) to measure the organizations and respondents’ characteristics’ aspiration to change their OC between flexibility-stability and between internal focus-external focus; (iii) to present and test a more sophisticated method to analyse the OCAI questionnaire results scored with Likert-scaling and presented in the Competing Values Framework (CVF). To address these research goals, first the paper provides a literature review of the relevant studies regarding the concept of OC. Second, the conceptual framework of the CVF is presented, followed by the presentation of the research methodology, where t-test analysing methods are presented and discussed. Subsequently, the results are introduced and discussed. Finally, the main findings and outlines for future research are described in the conclusions.
Organizational Culture: Case of the Finnish Construction Industry
Construction Economics and Building, Vol. 18, No. 1, March 201849

Organizational CultureCulture can be defined as an active living phenomenon, which refers to ideas and values of people and can affect their actions without explicitly being noticed. For instance, Ehlers (2009) has pointed out that culture consists of the following elements: norms and values, patterns of thought, opinions and attitudes, stories and myths about changes, language habits and conducts and collective expectations (e.g. Prajogo and McDermott, 2005; Deshpande and Webster, 1989; Deal and Kennedy, 1982). Members of an organization influence the differentiation of the organization’s cultural patterns through their discourse, which forms a new cultural structure consequently. Literature on OC commonly focuses on two major aspects of culture: content, which signifies the types of values and behaviours held by members of an organization, and strength or the depth and breadth of those behaviours embedded among the members. Both strength and content of culture are important for achieving a high level of performance (Kotter and Heskett, 1992; Sørensen, 2002).
OC, or parts of it, might be managed, controlled and intentionally changed (Peters and Waterman, 1982), i.e. managers can use culture as a “tool” of management. For instance, Ott, (1989) claims that OC provides an emotional sense of involvement and commitment to organizational values and moral codes and strongly affects employee performance and, ultimately, organizational effectiveness (Sathe, 1985). Culture, therefore, is an explanatory variable that distinguishes one organization from another (e.g. Hofstede, Hofstede and Michael, 2010; Schein, 2009).
In addition, prior studies have illustrated that OC (Cameron and Quinn, 2006) can be regarded as a contextual factor or social environment that affects a firm’s learning processes in acquiring and using knowledge (Sanz‐Valle et al., 2011). Some studies have pointed out that the distinct characteristics of OC may have favourable or unfavourable effects on an organization’s mechanisms for gaining and using external knowledge ( Janz and Prasarnphanich, 2003; Harrington and Guimaraes, 2005). Several studies indicate that OC may serve as a kind of contextual factor or social environment; its effect may encourage or impede a firm’s knowledge activities and organizational learning ( Janz and Prasarnphanich, 2003; Alavi, Kayworth and Leidner, 2006; Zheng, Yang and McLean, 2010). According to Ankrah and Langford (2005), the impact of organizational culture in the construction industry needs more emphasizing.
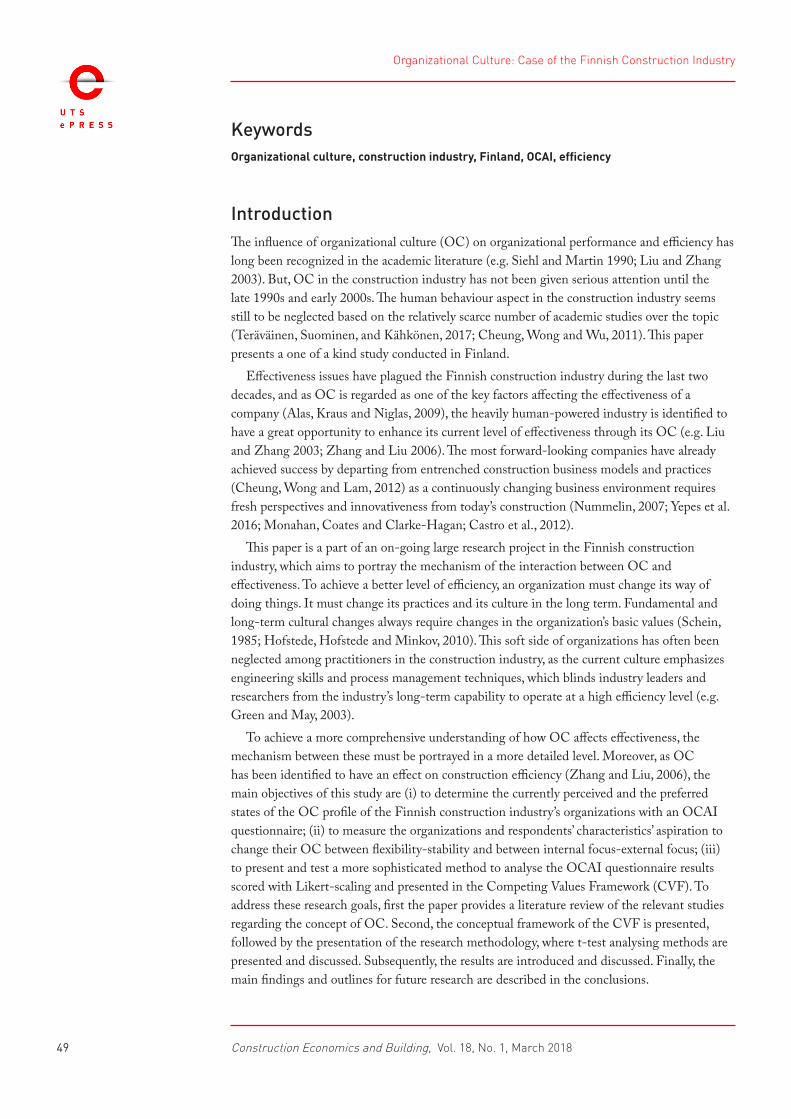
Kumaraswamy et al. (2002) have identified “organisational”, “professional”, “operational” and “individualistic” sub-cultures as the principal elements that come together to evolve culture within a construction project through the different organizational cultures as depicted in Figure 1. The influence between organizational and project cultures is reciprocal. Thus, the organizational culture is influenced by national culture and industry culture and project culture. Project culture could be affected by three other cultures: professional, operational and individual. “Professional sub-cultures” are influenced by factors such as the type of members, origin and history and type of task/function. “Operational sub-cultures” could comprise of quality culture, safety culture, and learning culture. “Individualistic sub-cultures” are influenced by factors such as national culture, ethnic factors, social status and religion. This paper focuses solely on organizational level cultures in the Finnish construction industry.
Teräväinen, Junnonen, and Ali-Löytty
Construction Economics and Building, Vol. 18, No. 1, March 201850
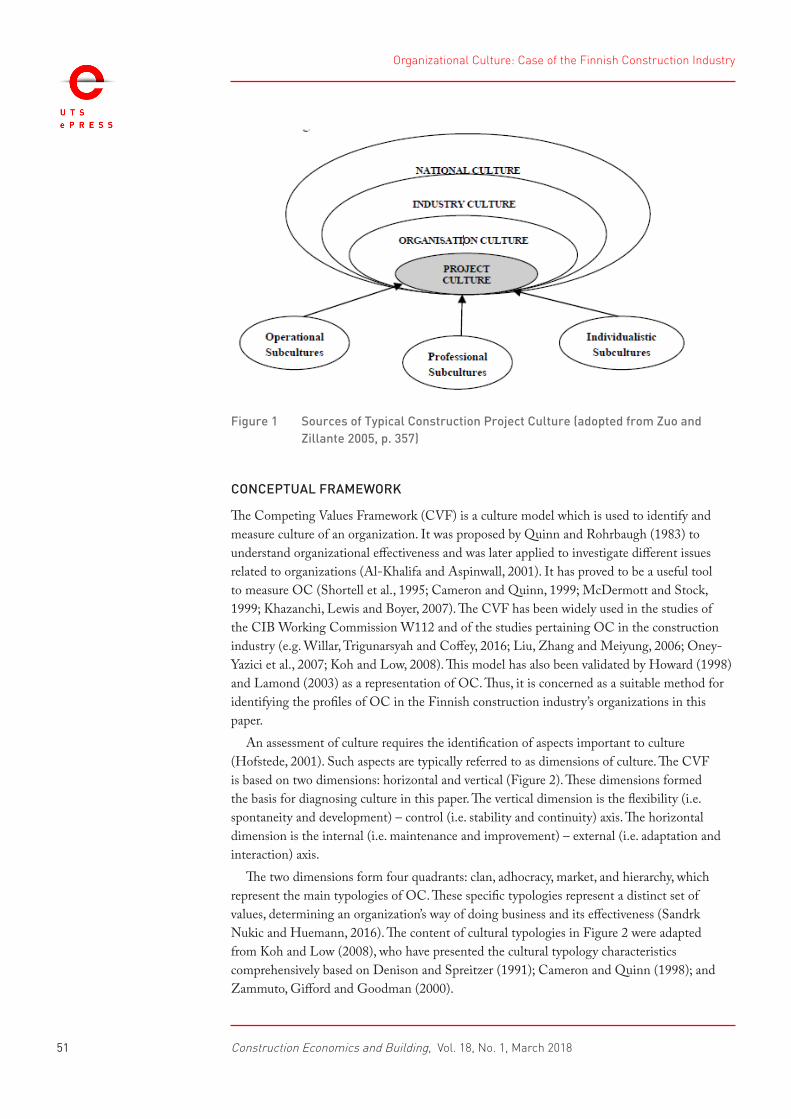
Figure 1 Sources of Typical Construction Project Culture (adopted from Zuo and Zillante 2005, p. 357)
CONCEPTUAL FRAMEWORK
The Competing Values Framework (CVF) is a culture model which is used to identify and measure culture of an organization. It was proposed by Quinn and Rohrbaugh (1983) to understand organizational effectiveness and was later applied to investigate different issues related to organizations (Al-Khalifa and Aspinwall, 2001). It has proved to be a useful tool to measure OC (Shortell et al., 1995; Cameron and Quinn, 1999; McDermott and Stock, 1999; Khazanchi, Lewis and Boyer, 2007). The CVF has been widely used in the studies of the CIB Working Commission W112 and of the studies pertaining OC in the construction industry (e.g. Willar, Trigunarsyah and Coffey, 2016; Liu, Zhang and Meiyung, 2006; Oney-Yazici et al., 2007; Koh and Low, 2008). This model has also been validated by Howard (1998) and Lamond (2003) as a representation of OC. Thus, it is concerned as a suitable method for identifying the profiles of OC in the Finnish construction industry’s organizations in this paper.
An assessment of culture requires the identification of aspects important to culture (Hofstede, 2001). Such aspects are typically referred to as dimensions of culture. The CVF is based on two dimensions: horizontal and vertical (Figure 2). These dimensions formed the basis for diagnosing culture in this paper. The vertical dimension is the flexibility (i.e. spontaneity and development) – control (i.e. stability and continuity) axis. The horizontal dimension is the internal (i.e. maintenance and improvement) – external (i.e. adaptation and interaction) axis.
The two dimensions form four quadrants: clan, adhocracy, market, and hierarchy, which represent the main typologies of OC. These specific typologies represent a distinct set of values, determining an organization’s way of doing business and its effectiveness (Sandrk Nukic and Huemann, 2016). The content of cultural typologies in Figure 2 were adapted from Koh and Low (2008), who have presented the cultural typology characteristics comprehensively based on Denison and Spreitzer (1991); Cameron and Quinn (1998); and Zammuto, Gifford and Goodman (2000).
Organizational Culture: Case of the Finnish Construction Industry
Construction Economics and Building, Vol. 18, No. 1, March 201851
Figure 2 The Competing Values Framework with cultural characteristics of the culture typologies
Clan culture tends to emphasize human factors, focusing on sharing values among people, emphasizing teamwork and empowerment, and developing an environment that stresses human relationships. Its prime aim is for long-term individual development with high morale and cohesion. In contrast to clan culture, market culture is characterized by a result-oriented emphasis driving towards profitability and productivity to achieve competitive advantages. The long-term purpose of this type of culture is to achieve established organizational goals and targets through competitive actions. Adhocracy culture emphasizes adaptive, flexible, and innovative characteristics of organizations. Such organizations readily take risks to employ additional resources and inventions to gain further profits. Adhocracy culture is in direct contrast to hierarchy culture where organizations stress orders, rules, and regulations to govern employees’ work. The organizational effectiveness is measured by stability, predictability, and smooth operations. The hierarchy-type organization is internally focused on its operations, seeking a high degree of integration.
Research Method
RESEARCH DESIGN AND DATA COMPOSITION
Getting a representative data sampling among industry professionals is considerably difficult in such a geographically decentralized industry as the Finnish construction industry. Hence, an online survey was selected as the data gathering method and the survey was conducted with Surveypal (2017). The subjects of the culture profile analysis of this study were (1) contracting organizations (building and infrastructure); (2) design organizations (architectural, structural engineering, and special engineering); (3) construction client organizations; (4) construction consulting organizations; and (5) building product organizations, operating in Finland. These five industry branches are generally seen to form the core of the construction industry in Finland. To reach a representative sampling with adequate quality for the survey, the organization represented by a respondent had to be a member of the Confederation of Finnish Construction Industries RT (CFCI); the Finnish Association of Consulting Firms
Teräväinen, Junnonen, and Ali-Löytty
Construction Economics and Building, Vol. 18, No. 1, March 201852
(SKOL); the Finnish Association of Building Owners and Construction Clients (RAKLI); or the Finnish Construction Managers and Engineers (RKL). The organizations in the above-mentioned associations are well-known companies. Hence, they are assumed to operate under appropriate ethical principles. For example, the member companies of the CFCI are all accepted in the CFCI’s public “trustworthy partner” -list (Rakennusteollisuus RT 2017). The survey was sent to an email address of a professional association member via his/her association. In the OCAI questionnaire, first, a respondent was asked to score the current OC of his/her organization. Second, a respondent was asked to score the preferred OC where his/her organization would perform in higher efficiency level compared to the current level.
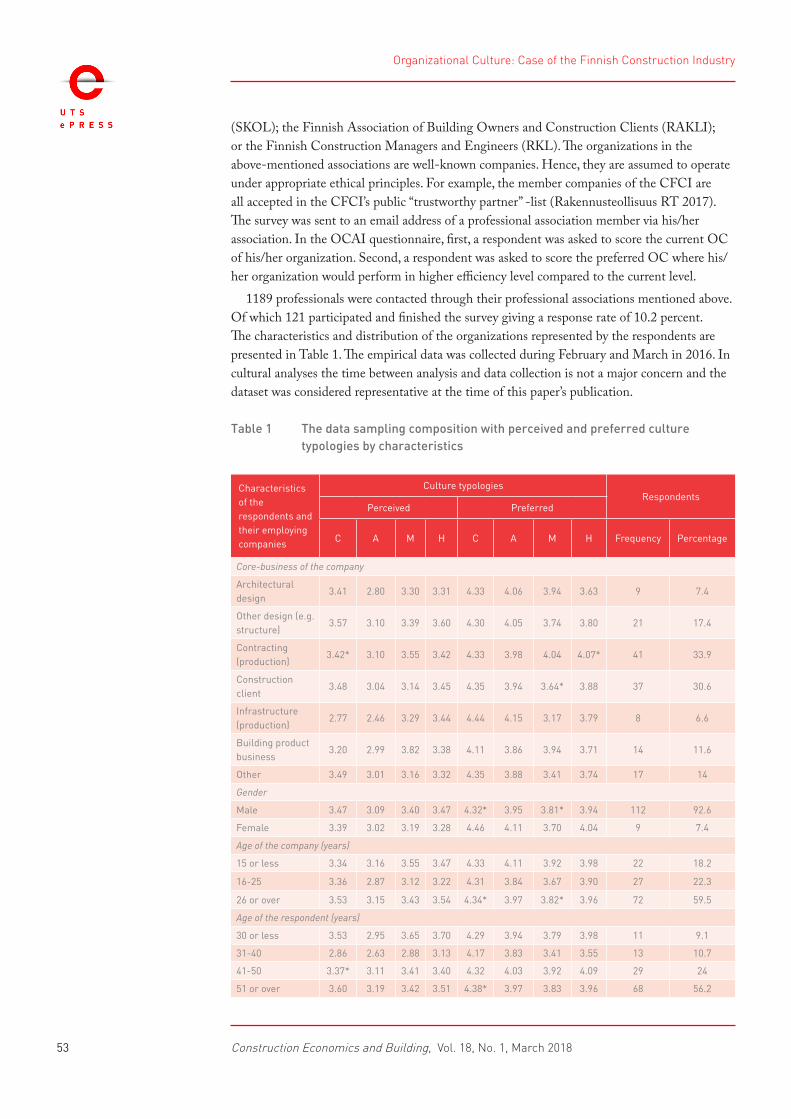
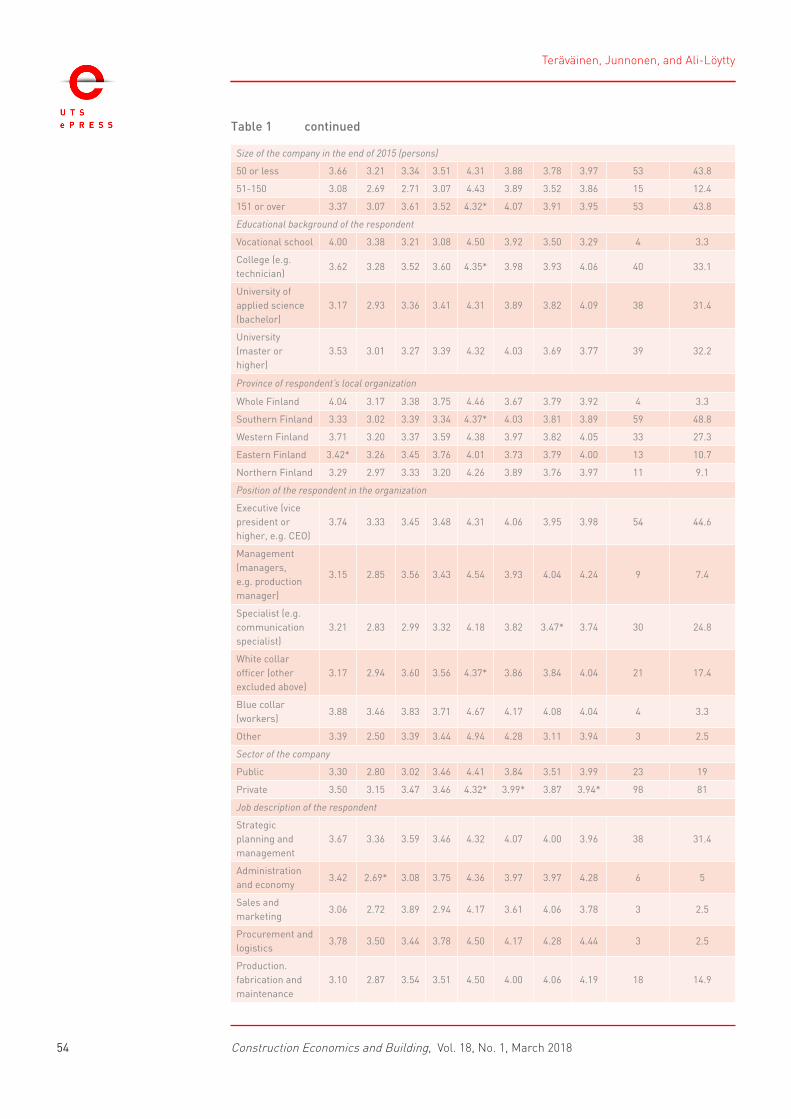
1189 professionals were contacted through their professional associations mentioned above. Of which 121 participated and finished the survey giving a response rate of 10.2 percent. The characteristics and distribution of the organizations represented by the respondents are presented in Table 1. The empirical data was collected during February and March in 2016. In cultural analyses the time between analysis and data collection is not a major concern and the dataset was considered representative at the time of this paper’s publication.
Table 1 The data sampling composition with perceived and preferred culture typologies by characteristics
Characteristics of the respondents and their employing companies
Culture typologiesRespondents
Perceived Preferred
C A M H C A M H Frequency Percentage
Core-business of the company
Architectural design
3.41 2.80 3.30 3.31 4.33 4.06 3.94 3.63 9 7.4
Other design (e.g. structure)
3.57 3.10 3.39 3.60 4.30 4.05 3.74 3.80 21 17.4
Contracting (production)
3.42* 3.10 3.55 3.42 4.33 3.98 4.04 4.07* 41 33.9
Construction client
3.48 3.04 3.14 3.45 4.35 3.94 3.64* 3.88 37 30.6
Infrastructure (production)
2.77 2.46 3.29 3.44 4.44 4.15 3.17 3.79 8 6.6
Building product business
3.20 2.99 3.82 3.38 4.11 3.86 3.94 3.71 14 11.6
Other 3.49 3.01 3.16 3.32 4.35 3.88 3.41 3.74 17 14
Gender
Male 3.47 3.09 3.40 3.47 4.32* 3.95 3.81* 3.94 112 92.6
Female 3.39 3.02 3.19 3.28 4.46 4.11 3.70 4.04 9 7.4
Age of the company (years)
15 or less 3.34 3.16 3.55 3.47 4.33 4.11 3.92 3.98 22 18.2
16-25 3.36 2.87 3.12 3.22 4.31 3.84 3.67 3.90 27 22.3
26 or over 3.53 3.15 3.43 3.54 4.34* 3.97 3.82* 3.96 72 59.5
Age of the respondent (years)
30 or less 3.53 2.95 3.65 3.70 4.29 3.94 3.79 3.98 11 9.1
31-40 2.86 2.63 2.88 3.13 4.17 3.83 3.41 3.55 13 10.7
41-50 3.37* 3.11 3.41 3.40 4.32 4.03 3.92 4.09 29 24
51 or over 3.60 3.19 3.42 3.51 4.38* 3.97 3.83 3.96 68 56.2
Organizational Culture: Case of the Finnish Construction Industry
Construction Economics and Building, Vol. 18, No. 1, March 201853
Size of the company in the end of 2015 (persons)
50 or less 3.66 3.21 3.34 3.51 4.31 3.88 3.78 3.97 53 43.8
51-150 3.08 2.69 2.71 3.07 4.43 3.89 3.52 3.86 15 12.4
151 or over 3.37 3.07 3.61 3.52 4.32* 4.07 3.91 3.95 53 43.8
Educational background of the respondent
Vocational school 4.00 3.38 3.21 3.08 4.50 3.92 3.50 3.29 4 3.3
College (e.g. technician)
3.62 3.28 3.52 3.60 4.35* 3.98 3.93 4.06 40 33.1
University of applied science (bachelor)
3.17 2.93 3.36 3.41 4.31 3.89 3.82 4.09 38 31.4
University (master or higher)
3.53 3.01 3.27 3.39 4.32 4.03 3.69 3.77 39 32.2
Province of respondent’s local organization
Whole Finland 4.04 3.17 3.38 3.75 4.46 3.67 3.79 3.92 4 3.3
Southern Finland 3.33 3.02 3.39 3.34 4.37* 4.03 3.81 3.89 59 48.8
Western Finland 3.71 3.20 3.37 3.59 4.38 3.97 3.82 4.05 33 27.3
Eastern Finland 3.42* 3.26 3.45 3.76 4.01 3.73 3.79 4.00 13 10.7
Northern Finland 3.29 2.97 3.33 3.20 4.26 3.89 3.76 3.97 11 9.1
Position of the respondent in the organization
Executive (vice president or higher, e.g. CEO)
3.74 3.33 3.45 3.48 4.31 4.06 3.95 3.98 54 44.6
Management (managers, e.g. production manager)
3.15 2.85 3.56 3.43 4.54 3.93 4.04 4.24 9 7.4
Specialist (e.g. communication specialist)
3.21 2.83 2.99 3.32 4.18 3.82 3.47* 3.74 30 24.8
White collar officer (other excluded above)
3.17 2.94 3.60 3.56 4.37* 3.86 3.84 4.04 21 17.4
Blue collar (workers)
3.88 3.46 3.83 3.71 4.67 4.17 4.08 4.04 4 3.3
Other 3.39 2.50 3.39 3.44 4.94 4.28 3.11 3.94 3 2.5
Sector of the company
Public 3.30 2.80 3.02 3.46 4.41 3.84 3.51 3.99 23 19
Private 3.50 3.15 3.47 3.46 4.32* 3.99* 3.87 3.94* 98 81
Job description of the respondent
Strategic planning and management
3.67 3.36 3.59 3.46 4.32 4.07 4.00 3.96 38 31.4
Administration and economy
3.42 2.69* 3.08 3.75 4.36 3.97 3.97 4.28 6 5
Sales and marketing
3.06 2.72 3.89 2.94 4.17 3.61 4.06 3.78 3 2.5
Procurement and logistics
3.78 3.50 3.44 3.78 4.50 4.17 4.28 4.44 3 2.5
Production. fabrication and maintenance
3.10 2.87 3.54 3.51 4.50 4.00 4.06 4.19 18 14.9
Table 1 continued
Teräväinen, Junnonen, and Ali-Löytty
Construction Economics and Building, Vol. 18, No. 1, March 201854

R and D 3.06 2.56 3.00 3.39 4.28 4.06 3.78 4.17 3 2.5
Design 3.36 3.01 3.15 3.57 4.29 3.97 3.47 3.65 12 9.9
Consulting 3.56 3.10 3.30 3.35 4.20 3.76 3.68 3.86 18 14.9
Other 3.44 2.99 3.12 3.38 4.36 3.92 3.35 3.80 20 16.5
n=121
*Did not fulfil the normality assumption
QUESTIONNAIRE DESIGN - OCAI
The survey consisted of two parts. First, the metadata of the demographic characteristics of organizations and respondents were collected. The second part was formed by the Organizational Culture Assessment Instrument (OCAI) questionnaire (adapted from Cameron and Quinn, 2011). The OCAI is a tool based on the CVF and was developed to identify OC profiles of organizations. The OCAI identifies fundamental cultural aspects of the organization through the six key dimensions (Cameron, 2004): (i) dominant characteristics; (ii) organizational leadership; (iii) management of employees; (iv) organizational glue; (v) strategic emphases; and (vi) criteria for success. The four main culture typologies (Figure 2) can be identified with these six key dimensions. Every organization possess characteristics from each main typology simultaneously while none of the culture typology is better than the others. Some typologies are more appropriate for a certain business environment (Cameron, 2004; Liu, Zhang and Meiyung, 2006; Coffey, Willar and Trigunarsyah, 2011).
The OC studies in the construction context have mostly utilized the OCAI developed by Cameron and Quinn (Koh and Low, 2008). The original OCAI questionnaire uses a response scale in which a respondent divides 100 points among the four typological alternatives. This is known as an ipsative rating scale. (Cameron and Quinn, 2011) The ipsative response scale does not give independent responses and the resulting scores are always related to each other. It is important to understand that every single response is given by an individual representative of an organization. Thus, every response is an individual’s subjective opinion of the current and the preferred state of OC of organization, based on one’s personal experience, attitude and, for example, ambition. (Cameron and Quinn, 2011) To manage the subjectivity of the single responses, this paper used a 5-Point-Likert-scale where each response could be assumed to be independent, and therefore, the use of statistical t-test analysis was possible (Cameron and Quinn, 2011). A 5-Point-Likert-scale has been commonly used in recent organizational culture analyses in the construction sector (e.g. Oney-Yazici et al., 2007; Willar, Trigunarsyah and Coffey, 2016; Zhang and Liu, 2006; Koh and Low, 2008), and thus it is seen as a reliable scale to use in this study.
THE T-TEST ANALYSIS
A t-test parametric needs to fulfil the normality assumption. The normality assumption was tested with the Shapiro-Wilk test. The characteristics that did not fulfil the assumptions are marked with “*” in Table 1. The two-sample F-test was performed to analyse the data samples’ equality of the variances and is discussed more in the analysis. This paper conducted t-test analyses to identify statistically significant (p ≤ 0.05) differences amongst the characteristic categories. When using a Likert-scale in the OCAI questionnaire, all culture typologies’ scores tend to increase in preferred typologies from the perceived ones (Cameron and Quinn, 2011). In a real-life organization, this cannot happen because the OCAI is derived from the CVF, which postulates that the opposite quadrants in the framework represent opposite cultural
Table 1 continued
Organizational Culture: Case of the Finnish Construction Industry
Construction Economics and Building, Vol. 18, No. 1, March 201855

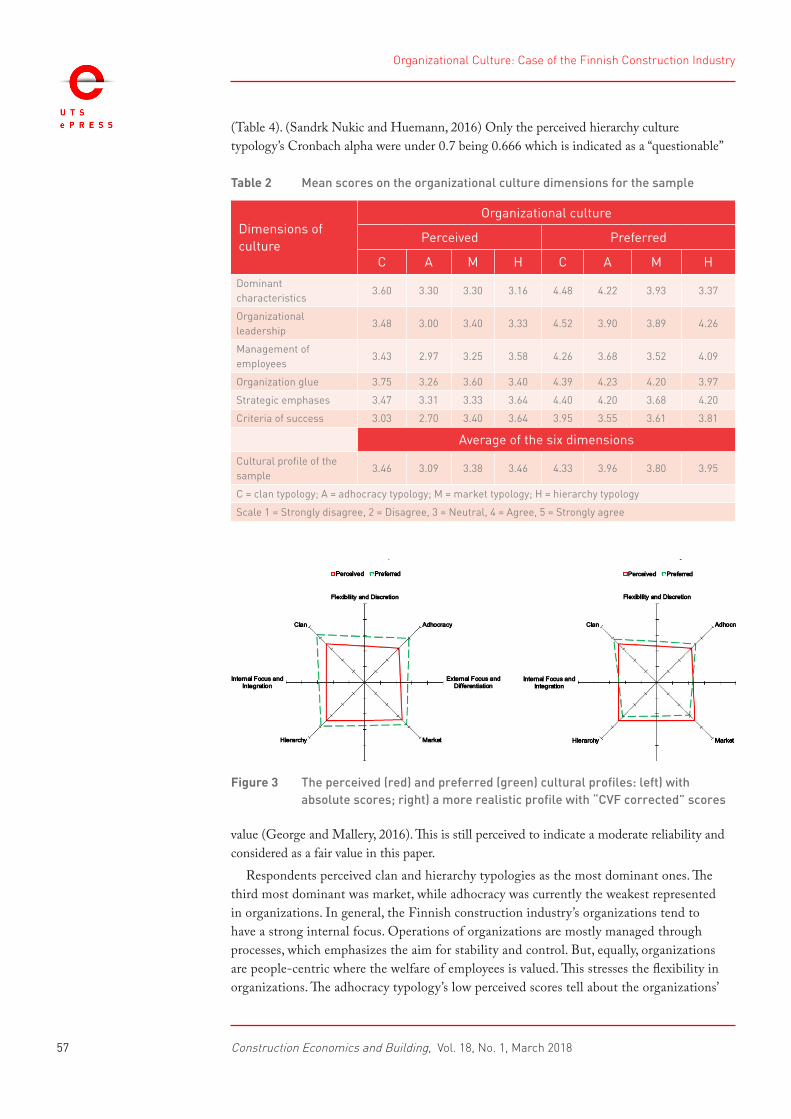
features of OC. Figure 3 shows both the normal Likert-scale scored culture profile and the “CVF corrected” profile. The latter, and more realistic, model was calculated by subtracting the competing (opposite) typologies perceived and preferred scores (delta = ∆) from each other.
First the deltas for each typology are calculated. Second, the new “corrected” score of each typology is calculated by adding or subtracting the “movement” (e.g. ∆C-∆M). The deltas’ subtraction must be ≥ 0. Thus, ∆M is subtracted from ∆C, and this result is added to the perceived Clan score. For example, if the preferred Market score was bigger than the preferred Clan score, the subtraction would be vice versa, and the result would be added to the perceived Market score. In this paper, the calculations are as follows (see also Figure 3):
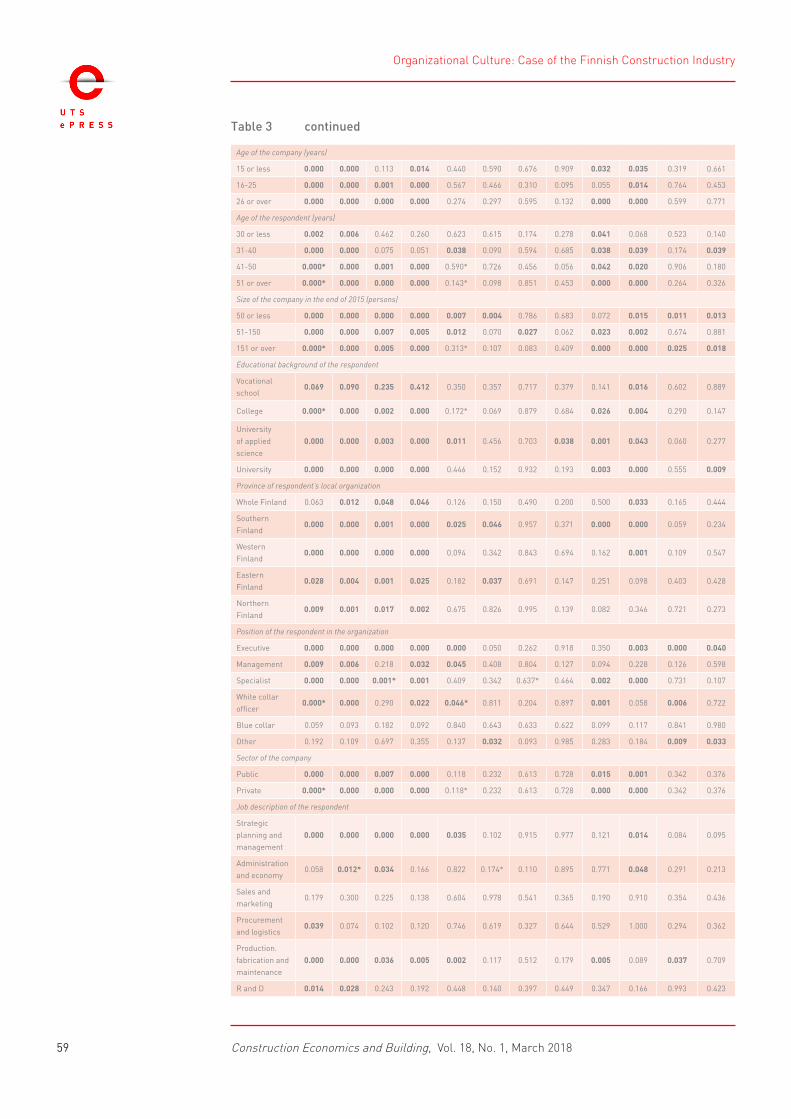
An OC profile tends to move in the CVF, rather than increase the area of a profile (e.g. Figure 3). For example, an organization cannot be highly innovative and entrepreneurial (adhocracy), while it is led through highly formal procedures with strong control of foremen (hierarchy). Therefore, when features of a typology increase, the features of the opposite typology decrease. An ipsative rating scale takes this in account, but its statistical analysis is more limited than with a Likert-scale (Bellot, 2011). In this paper, the “aspiration” of the organizations to switch their perceived culture between the CVF’s vertical and horizontal dimensions (see Figure 2) were analysed with t-tests. It was assumed that a change in scores expressed by a respondent indicated also his/her own commitment toward the change. The results of the t-tests’ p-values are presented in Table 3.
The paired t-test analyses were used among the characteristic’s respondents (“pi” is inner characteristic p-value in Table 3) and the independent t-test analyses were used among the categories so that each single characteristic was compared against the summary of all the others in the category (“pe” is external p-value in Table 3). In this paper, the null hypothesis of the t-test was rejected if p ≤ 0.05 (coloured red in Table 3).
Results and discussionThe perceived cultural scores show how a respondent had currently perceived his/her organization’s OC. The organization was defined as a respondent’s “local organization”, which means the organization where he/she is working daily. Hence, this paper’s analysis and results refer to a respondent’s company’s permanent organization. The preferred scores show how one would have liked to perceive it, so that the OC would support the organization’s efficiency better. Thus, OC profiles are subjective opinions of respondents. And moreover, members of working organizations do not share the same professional ambitions and goals which affect their responses. Culture profiles were obtained by averaging the respondents’ ratings for each cultural typology across the six key dimensions (Table 2). The highest scores of the cultural dimensions are emphasized with colour green, while the lowest scores with colour red. The absolute scores in the OCAI results are irrelevant, and it is more important to understand the movement of the culture profile: which typologies are strong in the current situation and which are strongly preferred. The Cronbach alpha indicated the fairness of culture typologies
Teräväinen, Junnonen, and Ali-Löytty
Construction Economics and Building, Vol. 18, No. 1, March 201856
(Table 4). (Sandrk Nukic and Huemann, 2016) Only the perceived hierarchy culture typology’s Cronbach alpha were under 0.7 being 0.666 which is indicated as a “questionable”
Table 2 Mean scores on the organizational culture dimensions for the sample
Dimensions of culture
Organizational culture
Perceived Preferred
C A M H C A M H
Dominant characteristics
3.60 3.30 3.30 3.16 4.48 4.22 3.93 3.37
Organizational leadership
3.48 3.00 3.40 3.33 4.52 3.90 3.89 4.26
Management of employees
3.43 2.97 3.25 3.58 4.26 3.68 3.52 4.09
Organization glue 3.75 3.26 3.60 3.40 4.39 4.23 4.20 3.97
Strategic emphases 3.47 3.31 3.33 3.64 4.40 4.20 3.68 4.20
Criteria of success 3.03 2.70 3.40 3.64 3.95 3.55 3.61 3.81
Average of the six dimensions
Cultural profile of the sample
3.46 3.09 3.38 3.46 4.33 3.96 3.80 3.95
C = clan typology; A = adhocracy typology; M = market typology; H = hierarchy typology
Scale 1 = Strongly disagree, 2 = Disagree, 3 = Neutral, 4 = Agree, 5 = Strongly agree
Figure 3 The perceived (red) and preferred (green) cultural profiles: left) with absolute scores; right) a more realistic profile with “CVF corrected” scores
value (George and Mallery, 2016). This is still perceived to indicate a moderate reliability and considered as a fair value in this paper.
Respondents perceived clan and hierarchy typologies as the most dominant ones. The third most dominant was market, while adhocracy was currently the weakest represented in organizations. In general, the Finnish construction industry’s organizations tend to have a strong internal focus. Operations of organizations are mostly managed through processes, which emphasizes the aim for stability and control. But, equally, organizations are people-centric where the welfare of employees is valued. This stresses the flexibility in organizations. The adhocracy typology’s low perceived scores tell about the organizations’
Organizational Culture: Case of the Finnish Construction Industry
Construction Economics and Building, Vol. 18, No. 1, March 201857
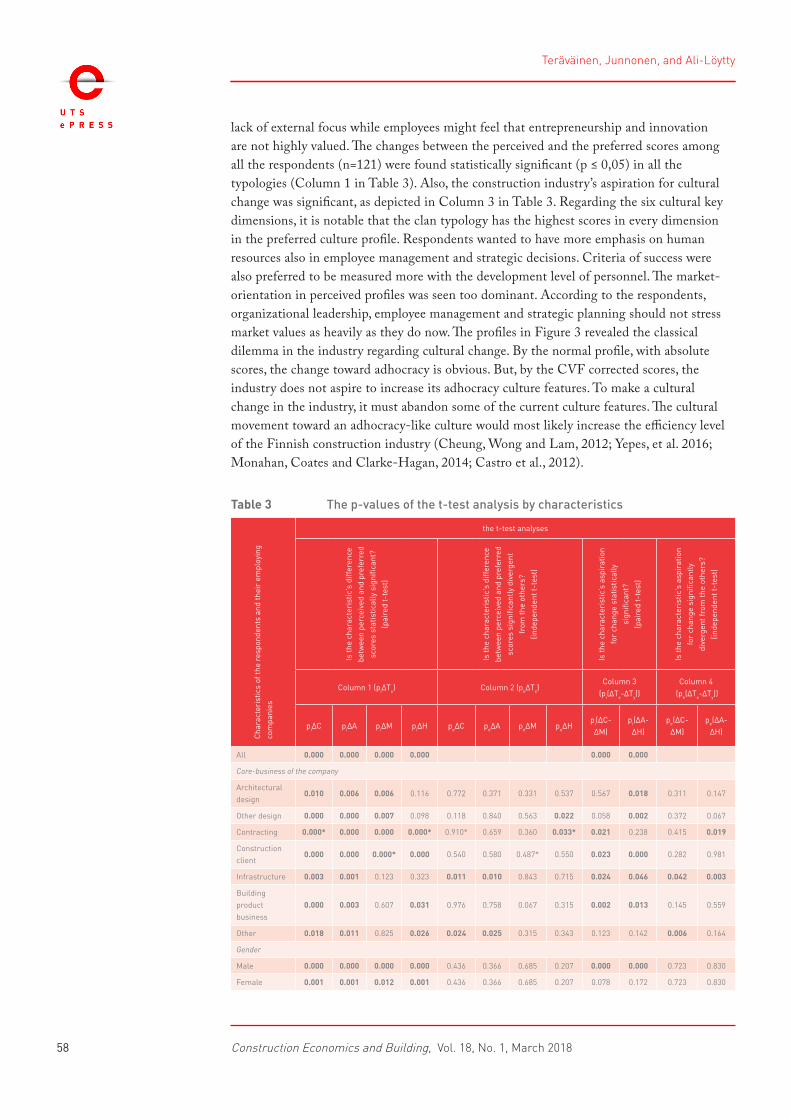
lack of external focus while employees might feel that entrepreneurship and innovation are not highly valued. The changes between the perceived and the preferred scores among all the respondents (n=121) were found statistically significant (p ≤ 0,05) in all the typologies (Column 1 in Table 3). Also, the construction industry’s aspiration for cultural change was significant, as depicted in Column 3 in Table 3. Regarding the six cultural key dimensions, it is notable that the clan typology has the highest scores in every dimension in the preferred culture profile. Respondents wanted to have more emphasis on human resources also in employee management and strategic decisions. Criteria of success were also preferred to be measured more with the development level of personnel. The market-orientation in perceived profiles was seen too dominant. According to the respondents, organizational leadership, employee management and strategic planning should not stress market values as heavily as they do now. The profiles in Figure 3 revealed the classical dilemma in the industry regarding cultural change. By the normal profile, with absolute scores, the change toward adhocracy is obvious. But, by the CVF corrected scores, the industry does not aspire to increase its adhocracy culture features. To make a cultural change in the industry, it must abandon some of the current culture features. The cultural movement toward an adhocracy-like culture would most likely increase the efficiency level of the Finnish construction industry (Cheung, Wong and Lam, 2012; Yepes, et al. 2016; Monahan, Coates and Clarke-Hagan, 2014; Castro et al., 2012).
Table 3 The p-values of the t-test analysis by characteristics
Cha
ract
eris
tics
of th
e re
spon
dent
s an
d th
eir
empl
oyin
g co
mpa
nies
the t-test analyses
Is th
e ch
arac
teri
stic
’s d
iffer
ence
be
twee
n pe
rcei
ved
and
pref
erre
d sc
ores
sta
tistic
ally
sig
nific
ant?
(p
aire
d t-
test
)
Is th
e ch
arac
teri
stic
’s d
iffer
ence
be
twee
n pe
rcei
ved
and
pref
erre
d sc
ores
sig
nific
antl
y di
verg
ent
from
the
othe
rs?
(inde
pend
ent t
-tes
t)
Is th
e ch
arac
teri
stic
’s a
spir
atio
n fo
r ch
ange
sta
tistic
ally
si
gnifi
cant
? (p
aire
d t-
test
)
Is th
e ch
arac
teri
stic
’s a
spir
atio
n fo
r ch
ange
sig
nific
antl
y di
verg
ent f
rom
the
othe
rs?
(inde
pend
ent t
-tes
t)
Column 1 (pi∆Tx) Column 2 (pe∆Tx)Column 3
(pi(∆Tx-∆Ty))Column 4
(pe(∆Tx-∆Ty))
pi∆C pi∆A pi∆M pi∆H pe∆C pe∆A pe∆M pe∆Hpi(∆C-∆M)
pi(∆A-∆H)
pe(∆C-∆M)
pe(∆A-∆H)
All 0.000 0.000 0.000 0.000 0.000 0.000
Core-business of the company
Architectural design
0.010 0.006 0.006 0.116 0.772 0.371 0.331 0.537 0.567 0.018 0.311 0.147
Other design 0.000 0.000 0.007 0.098 0.118 0.840 0.563 0.022 0.058 0.002 0.372 0.067
Contracting 0.000* 0.000 0.000 0.000* 0.910* 0.659 0.360 0.033* 0.021 0.238 0.415 0.019
Construction client
0.000 0.000 0.000* 0.000 0.540 0.580 0.487* 0.550 0.023 0.000 0.282 0.981
Infrastructure 0.003 0.001 0.123 0.323 0.011 0.010 0.843 0.715 0.024 0.046 0.042 0.003
Building product business
0.000 0.003 0.607 0.031 0.976 0.758 0.067 0.315 0.002 0.013 0.145 0.559
Other 0.018 0.011 0.825 0.026 0.024 0.025 0.315 0.343 0.123 0.142 0.006 0.164
Gender
Male 0.000 0.000 0.000 0.000 0.436 0.366 0.685 0.207 0.000 0.000 0.723 0.830
Female 0.001 0.001 0.012 0.001 0.436 0.366 0.685 0.207 0.078 0.172 0.723 0.830
Teräväinen, Junnonen, and Ali-Löytty
Construction Economics and Building, Vol. 18, No. 1, March 201858
Age of the company (years)
15 or less 0.000 0.000 0.113 0.014 0.440 0.590 0.676 0.909 0.032 0.035 0.319 0.661
16-25 0.000 0.000 0.001 0.000 0.567 0.466 0.310 0.095 0.055 0.014 0.764 0.453
26 or over 0.000 0.000 0.000 0.000 0.274 0.297 0.595 0.132 0.000 0.000 0.599 0.771
Age of the respondent (years)
30 or less 0.002 0.006 0.462 0.260 0.623 0.615 0.174 0.278 0.041 0.068 0.523 0.140
31-40 0.000 0.000 0.075 0.051 0.038 0.090 0.594 0.685 0.038 0.039 0.174 0.039
41-50 0.000* 0.000 0.001 0.000 0.590* 0.726 0.456 0.056 0.042 0.020 0.906 0.180
51 or over 0.000* 0.000 0.000 0.000 0.143* 0.098 0.851 0.453 0.000 0.000 0.264 0.326
Size of the company in the end of 2015 (persons)
50 or less 0.000 0.000 0.000 0.000 0.007 0.004 0.786 0.683 0.072 0.015 0.011 0.013
51-150 0.000 0.000 0.007 0.005 0.012 0.070 0.027 0.062 0.023 0.002 0.674 0.881
151 or over 0.000* 0.000 0.005 0.000 0.313* 0.107 0.083 0.409 0.000 0.000 0.025 0.018
Educational background of the respondent
Vocational school
0.069 0.090 0.235 0.412 0.350 0.357 0.717 0.379 0.141 0.016 0.602 0.889
College 0.000* 0.000 0.002 0.000 0.172* 0.069 0.879 0.684 0.026 0.004 0.290 0.147
University of applied science
0.000 0.000 0.003 0.000 0.011 0.456 0.703 0.038 0.001 0.043 0.060 0.277
University 0.000 0.000 0.000 0.000 0.446 0.152 0.932 0.193 0.003 0.000 0.555 0.009
Province of respondent’s local organization
Whole Finland 0.063 0.012 0.048 0.046 0.126 0.150 0.490 0.200 0.500 0.033 0.165 0.444
Southern Finland
0.000 0.000 0.001 0.000 0.025 0.046 0.957 0.371 0.000 0.000 0.059 0.234
Western Finland
0.000 0.000 0.000 0.000 0.094 0.342 0.843 0.694 0.162 0.001 0.109 0.547
Eastern Finland
0.028 0.004 0.001 0.025 0.182 0.037 0.691 0.147 0.251 0.098 0.403 0.428
Northern Finland
0.009 0.001 0.017 0.002 0.675 0.826 0.995 0.139 0.082 0.346 0.721 0.273
Position of the respondent in the organization
Executive 0.000 0.000 0.000 0.000 0.000 0.050 0.262 0.918 0.350 0.003 0.000 0.040
Management 0.009 0.006 0.218 0.032 0.045 0.408 0.804 0.127 0.094 0.228 0.126 0.598
Specialist 0.000 0.000 0.001* 0.001 0.409 0.342 0.637* 0.464 0.002 0.000 0.731 0.107
White collar officer
0.000* 0.000 0.290 0.022 0.046* 0.811 0.204 0.897 0.001 0.058 0.006 0.722
Blue collar 0.059 0.093 0.182 0.092 0.840 0.643 0.633 0.622 0.099 0.117 0.841 0.980
Other 0.192 0.109 0.697 0.355 0.137 0.032 0.093 0.985 0.283 0.184 0.009 0.033
Sector of the company
Public 0.000 0.000 0.007 0.000 0.118 0.232 0.613 0.728 0.015 0.001 0.342 0.376
Private 0.000* 0.000 0.000 0.000 0.118* 0.232 0.613 0.728 0.000 0.000 0.342 0.376
Job description of the respondent
Strategic planning and management
0.000 0.000 0.000 0.000 0.035 0.102 0.915 0.977 0.121 0.014 0.084 0.095
Administration and economy
0.058 0.012* 0.034 0.166 0.822 0.174* 0.110 0.895 0.771 0.048 0.291 0.213
Sales and marketing
0.179 0.300 0.225 0.138 0.604 0.978 0.541 0.365 0.190 0.910 0.354 0.436
Procurement and logistics
0.039 0.074 0.102 0.120 0.746 0.619 0.327 0.644 0.529 1.000 0.294 0.362
Production. fabrication and maintenance
0.000 0.000 0.036 0.005 0.002 0.117 0.512 0.179 0.005 0.089 0.037 0.709
R and D 0.014 0.028 0.243 0.192 0.448 0.140 0.397 0.449 0.347 0.166 0.993 0.423
Table 3 continued
Organizational Culture: Case of the Finnish Construction Industry
Construction Economics and Building, Vol. 18, No. 1, March 201859

Design 0.000 0.001 0.107 0.626 0.792 0.691 0.608 0.022 0.026 0.013 0.528 0.014
Consulting 0.003 0.002 0.108 0.009 0.184 0.171 0.787 0.910 0.173 0.096 0.351 0.141
Other 0.000 0.000 0.116 0.005 0.787 0.754 0.206 0.570 0.009 0.007 0.220 0.412
*Did not fulfil the normality assumption
NOT significant = p>0.05 (roman); SIGNIFICANT = p ≤ 0.05 (bold)
Table 4 Cronbach alpha coefficients
Culture typology Perceived Preferred
Clan 0.887 0.791Adhocracy 0.858 0.793
Market 0.875 0.881Hierarchy 0.666 0.775
α>0.9 (excellent); 0.8<α<0.9 (good); 0.7<α<0.8 (acceptable); 0.6<α<0.7 (questionable); 0.5<α<0.6 (poor); α<0.5 (unacceptable)
The scores tend to increase from the perceived scores to the preferred ones. Thus, it is irrelevant to focus on the inner-group pi∆T -analysis (Column 1 in Table 3). Therefore, the pe∆T-analysis was carried out, which identified if some characteristic had a significantly exceptional difference between perceived and preferred scores compared to other characteristics. But still, the pe∆T -values were suffering the distorting effect of the Likert-scale used. Therefore, to find the influential differences between characteristics’ aspiration to change their OC, the pi(∆Tx-∆Ty)-values and pe(∆Tx-∆Ty)-values had to be calculated. By focusing on Column 4 in Table 3, we can see which characteristics were significantly more “willing” or “unwilling” to change their current OC toward flexibility and discretion, which was the common desire for cultural change of the industry to enhance the current state of the industry’s efficiency. Subsequently, this paper focused on the categories which included significant p-values in Column 4 in Table 3. Addition to the industry’s cultural profile, the exceptional characteristics behind it were the second objective of this paper while the third objective was to present this kind of in-depth t-test analysis with the Likert-scaling based on the desired “realistic movement” in the CVF fourfold.
DESIRED CULTURAL CHANGE IN THE FINNISH CONSTRUCTION INDUSTRY
Generally, the Finnish construction industry wanted to change its current OC toward more clan and adhocracy like, as depicted in Table 2 and Figure 3. But, the aspiration for cultural change varied as presented in Table 3. The aspiration to embrace cultural change revealed characteristic enablers and hinders for the cultural change in the Finnish construction industry. This paper focused mostly on the analysis and discussion of the results presented in Column 4. These values led to identify the most influential characteristics for the cultural change in this paper. To understand values in Column 4, the other columns 1, 2, and 3 are needed for support. All categories without any statistical significances in Column 4 were left out from the analysis: gender, age of companies, location, and sector. Further, the characteristics Contracting (perceived Clan scores), Administration and economy (perceived Adhocracy scores), 51 or over (preferred Clan scores), 151 or over (preferred Clan scores), College (preferred Clan scores), White collar officer (preferred Clan scores), Professional construction client (preferred Market scores) and Specialist (preferred Market scores) did not fulfil the normality assumption. Thus,
Table 3 continued
Teräväinen, Junnonen, and Ali-Löytty
Construction Economics and Building, Vol. 18, No. 1, March 201860
these latter mentioned characteristics’ analyses are most likely relevant but must be considered only as guiding ones.
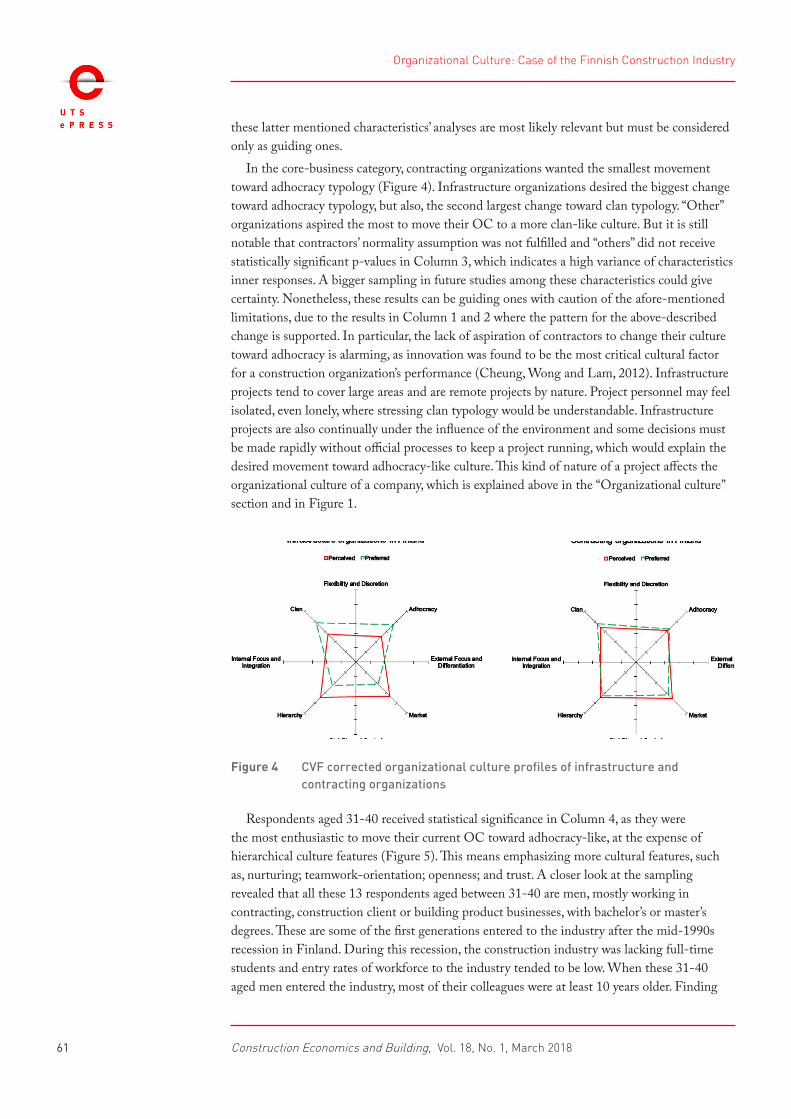
In the core-business category, contracting organizations wanted the smallest movement toward adhocracy typology (Figure 4). Infrastructure organizations desired the biggest change toward adhocracy typology, but also, the second largest change toward clan typology. “Other” organizations aspired the most to move their OC to a more clan-like culture. But it is still notable that contractors’ normality assumption was not fulfilled and “others” did not receive statistically significant p-values in Column 3, which indicates a high variance of characteristics inner responses. A bigger sampling in future studies among these characteristics could give certainty. Nonetheless, these results can be guiding ones with caution of the afore-mentioned limitations, due to the results in Column 1 and 2 where the pattern for the above-described change is supported. In particular, the lack of aspiration of contractors to change their culture toward adhocracy is alarming, as innovation was found to be the most critical cultural factor for a construction organization’s performance (Cheung, Wong and Lam, 2012). Infrastructure projects tend to cover large areas and are remote projects by nature. Project personnel may feel isolated, even lonely, where stressing clan typology would be understandable. Infrastructure projects are also continually under the influence of the environment and some decisions must be made rapidly without official processes to keep a project running, which would explain the desired movement toward adhocracy-like culture. This kind of nature of a project affects the organizational culture of a company, which is explained above in the “Organizational culture” section and in Figure 1.
Figure 4 CVF corrected organizational culture profiles of infrastructure and contracting organizations
Respondents aged 31-40 received statistical significance in Column 4, as they were the most enthusiastic to move their current OC toward adhocracy-like, at the expense of hierarchical culture features (Figure 5). This means emphasizing more cultural features, such as, nurturing; teamwork-orientation; openness; and trust. A closer look at the sampling revealed that all these 13 respondents aged between 31-40 are men, mostly working in contracting, construction client or building product businesses, with bachelor’s or master’s degrees. These are some of the first generations entered to the industry after the mid-1990s recession in Finland. During this recession, the construction industry was lacking full-time students and entry rates of workforce to the industry tended to be low. When these 31-40 aged men entered the industry, most of their colleagues were at least 10 years older. Finding
Organizational Culture: Case of the Finnish Construction Industry
Construction Economics and Building, Vol. 18, No. 1, March 201861

one’s own place in such a conservative cultural environment at an early age might have been difficult and adaptation between generations is still noticeable today. For comparison, Figure 5 presents both profiles of “31-40” and a combined profile of “41-50” and “51 or over” years old respondents.
Figure 5 CVF corrected organizational culture profiles of “31-40” and “51 or over” years old respondents
The small-sized organizations (50 or less personnel) had no aspiration to change their current OC (Figure 6). While, the large-sized organizations (151 or over personnel) had the strongest aspiration to move their OC toward flexibility and discretion from stability and control. This result can be implicitly assumed. Still, it would not be justified to postulate smaller organizations being more flexible and externally focused than bigger ones based on this paper’s results. Perhaps smaller organizations tend to be more satisfied with their current OC than personnel in bigger companies. On the other hand, small-sized companies in the industry do not usually represent the most operationally advanced organizations, whereas large-sized companies do. Thus, the profiles divergence may indicate large-size companies’ requirement for change is to stay the most advanced and effective in the industry. The characteristic “151 or over” did not fulfil the normality assumption in the preferred Clan scores, but the figure below can be a guiding one, and further the scores of all the other typologies (Adhocracy, Market and Hierarchy) did fulfil the normality assumption.
Figure 6 CVF corrected organizational culture profiles of “50 or less” and “151 or over” sized organizations
Teräväinen, Junnonen, and Ali-Löytty
Construction Economics and Building, Vol. 18, No. 1, March 201862

Only respondents with a university background received statistically significant p-values in Column 4, as they desired a seemingly clear change toward adhocracy-like culture compared to the current OC (Figure 7). Other characteristics had also significant values in Column 3, which indicates their inner-characteristic aspiration for change toward the industry’s desired OC, but the variance of the responses was too vast, and the College characteristic did not fulfil the normality assumption in the preferred Clan scores. Further, as the sampling sizes of college and university of applied science characteristics were comparable to university, there was no common perception for the wanted change among them, but their statistically insignificant culture profiles are presented in Figure 7 for comparison.
Figure 7 CVF corrected organizational culture profile of “university” and combined profiles of “college and university of applied science” respondents
Executives in the industry did not want change in the current OC (Figure 8). While white collar officers and others desired a relatively significant change toward flexibility and discretion, emphasizing clan-like cultural features. However, the white-collar officers’ preferred Clan scores did not fulfil the normality assumption. Still, considering all the results of this category, presented in Columns 1, 2, 3, and 4, this paper postulates these profiles being strongly guiding for the industry’s practitioners. Executives are, in general, looking at the macro perspective of their organizations, hence, the truth for the most optimum cultural change is between the profiles of executives, and white-collar officers and others. It is worrying, that there is an obvious gap of desired cultural change between these characteristics.
Figure 8 CVF corrected organizational culture profiles of “executive” and combined profiles of “white collar officer and other” respondents
Organizational Culture: Case of the Finnish Construction Industry
Construction Economics and Building, Vol. 18, No. 1, March 201863
The first step is to increase transparency between organizational levels. It would seem, that one of the industry’s basic problems, the lack of proper knowledge management and transparency between organizational levels, might have caused this divergence. Based on the two-sample F-test, “Executive” characteristic received unequal variance, and hence the executives’ culture profile has to be considered as a guiding one.
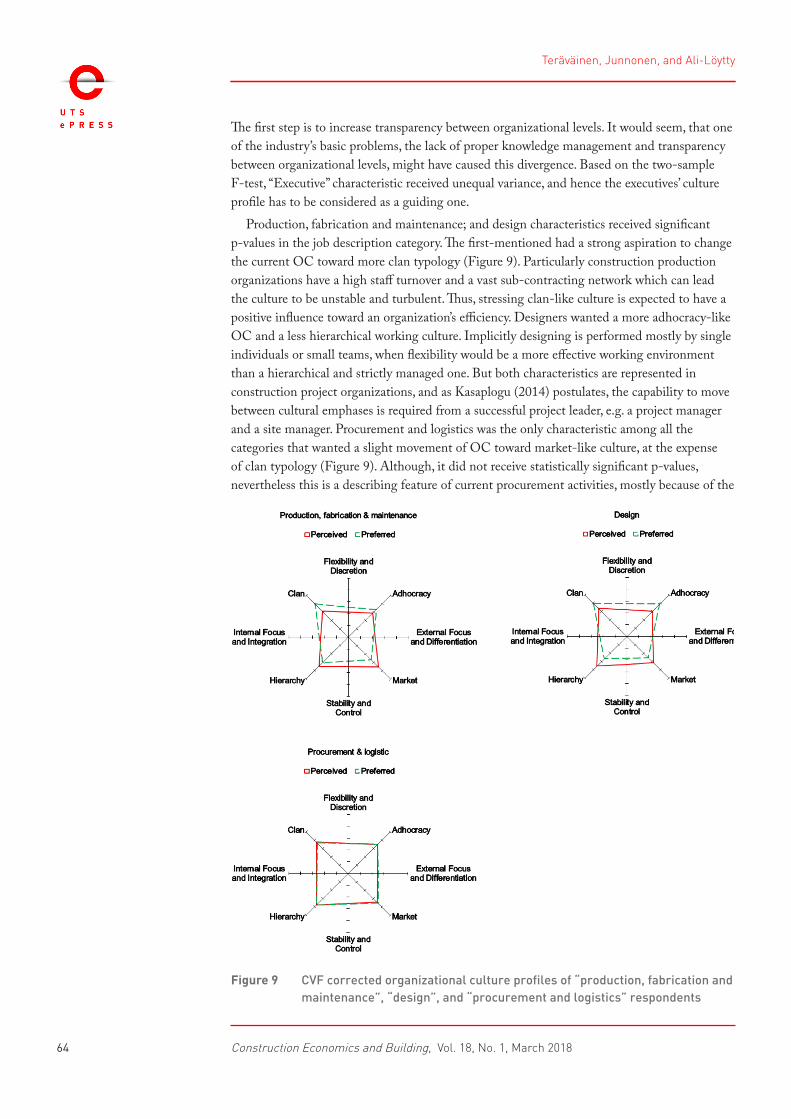
Production, fabrication and maintenance; and design characteristics received significant p-values in the job description category. The first-mentioned had a strong aspiration to change the current OC toward more clan typology (Figure 9). Particularly construction production organizations have a high staff turnover and a vast sub-contracting network which can lead the culture to be unstable and turbulent. Thus, stressing clan-like culture is expected to have a positive influence toward an organization’s efficiency. Designers wanted a more adhocracy-like OC and a less hierarchical working culture. Implicitly designing is performed mostly by single individuals or small teams, when flexibility would be a more effective working environment than a hierarchical and strictly managed one. But both characteristics are represented in construction project organizations, and as Kasaplogu (2014) postulates, the capability to move between cultural emphases is required from a successful project leader, e.g. a project manager and a site manager. Procurement and logistics was the only characteristic among all the categories that wanted a slight movement of OC toward market-like culture, at the expense of clan typology (Figure 9). Although, it did not receive statistically significant p-values, nevertheless this is a describing feature of current procurement activities, mostly because of the
Figure 9 CVF corrected organizational culture profiles of “production, fabrication and maintenance”, “design”, and “procurement and logistics” respondents
Teräväinen, Junnonen, and Ali-Löytty
Construction Economics and Building, Vol. 18, No. 1, March 201864
long-lasting sub-optimizing in the industry. In general, procurement is measured and rewarded based on the first costs which result from acquisition. It is likely this does not increase the efficiency level of an organization.
ConclusionThis paper is a cultural analysis from the OC perspective among the Finnish construction industry’s organizations, and it is continuation to the academic debate “culture in construction” started by Working Commission W112 in the late 1990s. The paper presented an OC survey conducted with the OCAI questionnaire. The current and preferred culture profiles were formed and analysed based on the CVF. The statistically significant characteristic enablers and hinders of the survey categories were identified with the t-test analyses, visualized with “CVF corrected” model, described and discussed. The “CVF corrected” culture profile model was introduced, which allows a more realistic culture profile visualization in the CVF with scores conducted by a Likert-scaling in the OCAI questionnaire.
This paper focused on the organizational and individual level characteristics, while most of the other OC studies in the construction industry have focused only on the organizational characteristics. Particularly, in the construction industry, the whole business is based on projects which consist of individual professionals from different organizations. It is arguable to postulate that individual characteristics play a more significant role regarding a construction project’s efficiency than organizational characteristics. But considering that a company’s organizational culture always affects individuals’ behaviour (Liu and Zhang, 2003; Zhang and Liu, 2006). This influence between a company’s OC, project culture and individual behaviour is left for future research.
Subsequently, this cultural analysis in the Finnish construction industry contributes to a better academic understanding of the topic and presenting a novel approach for a statistical treatment of the OCAI’s Likert-scaling scores and their visualization in the “CVF corrected” model. For practice, the results revealed the best styles to manage the current organizations, but also the best features for future’s successful managers operating in the industry, and the possible direction for positive culture change by the industry’s professionals themselves.
The OCAI is considered to have two main limitations: ipsative scaling (which was addressed in this study) and its qualitative approach, which has never been subjected to psychometric evaluation (Bellot 2011). Also, the response rate was relatively low, although the Cronbach alpha coefficients were acceptable, which most likely limited the number of statistically significant p-values of characteristics.
AcknowledgementThis paper was supported by (i) YIT Corporation (ii) the KIINKO – Real Estate Education, Grant for the doctoral dissertation research 2017 (iii) the Confederation of Finnish Construction Industries RT (CFCI), Grant for Doctoral Dissertation Research 2015.
ReferencesAl-Khalifa, K.N. and Aspinwall, E.M., 2001. Using the competing values framework to investigate the culture of Qatar industries. Total Quality Management, 12(4), pp.417-28 https://doi.org/10.1080/09544120124219.
Organizational Culture: Case of the Finnish Construction Industry
Construction Economics and Building, Vol. 18, No. 1, March 201865
Alas, R., Kraus, A. and Niglas, K., 2009. Manufacturing strategies and choices in cultural contexts. Journal of Business Economics and Management, 10(4), pp.279-89 https://doi.org/10.3846/1611-1699.2009.10.279-289.
Alavi, M., Kayworth, T.R. and Leidner, D.E., 2006. An Empirical Examination of the Influence of Organizational Culture on Knowledge Management Practices. Journal of Management Information Systems, 22(3), pp.191-224 https://doi.org/10.2753/mis0742-1222220307.
Ankrah, N.A. and Langford, D.A., 2005. Architects and contractors: a comparative study of organizational cultures. Construction Management and Economics, 23(6), pp.595-607 https://doi.org/10.1080/01446190500126973.
Bellot, J., 2011. Defining and assessing organizational culture. Nursing forum, 46(1), pp.29-37 https://doi.org/10.1111/j.1744-6198.2010.00207.x.
Cameron, KS., 2004. A process for changing organizational culture. In: T.G. Cummings, ed. The Handbook of Organizational Development. Thousand Oaks, CA: Sage Publications, pp.429–445.
Cameron, K.S. and Quinn, R.E., 1998. Diagnosing and Changing Organisational Culture Based on the Competing Values Framework, Reading, MA: Addison-Wesley.
Cameron, K.S. and Quinn, R.E., 1999. Diagnosing and Changing Organizational Culture: Based on the Competing Values Framework, Reading, MA: Addison-Wesley.
Cameron, K.S. and Quinn, R.E., 2006. Diagnosing and Changing Organizational Culture. San Francisco: Jossey-Bass.
Cameron, K.S. and Quinn, R.E., 2011. Diagnosing and Changing Organizational Culture, Based on the Competing Values Framework Ed 3rd ed. San Fransisco: Jossey-Bass.
Castro, A.L., Yepes, V., Pellicer, E. and Cuellar, A.J., 2012. Knowledge management in the construction industry: state of the art and trends in research. Revista De La Construccion, 11(3), pp.62–73. http://dx.doi.org/10.4067/S0718-915X2012000300006.
Cheung, S.O., Wong, P.S.P. and Lam, A.L., 2012. An investigation of the relationship between organizational culture and the performance of construction organizations. Journal of Business Economics and Management, 13(4), pp.688-704.
Cheung, S.O., Wong, P.S.P. and Wu, A.W.Y., 2011. Towards an organizational culture framework in construction. International Journal of Project Management, 29(1), pp.33-44 https://doi.org/10.1016/j.ijproman.2010.01.014.
Coffey, V., Willar, D. and Trigunarsyah, B., 2011. Profiles of organisational culture in Indonesian construction companies. In ISEC 2011 - 6th International Structural Engineering and Construction Conference: Modern Methods and Advances in Structural Engineering and Construction. Research Publishing Services, pp. 435-40 https://doi.org/10.3850/978-981-08-7920-4_s1-c23-cd.
Deal, T.E. and Kennedy, A.A., 1982. Corporate Cultures: The Rites and Rituals of Corporate Life. Reading, MA: Addison-Wesley https://doi.org/10.1016/0007-6813(83)90092-7.
Denison, D.R. and Spreitzer, G.M., 1991. Organizational culture and organizational development: A competing values approach. Research in Organizational Change and Development, 5, pp.1-21.
Deshpande, R. and Webster, F.E.J., 1989. Organizational culture and marketing: defining the research agenda. Journal of Marketing, 53(1), pp.3-15 https://doi.org/10.2307/1251521.
Teräväinen, Junnonen, and Ali-Löytty
Construction Economics and Building, Vol. 18, No. 1, March 201866
Ehlers, U.D., 2009. Understanding quality culture. Quality Assurance in Education, 17(4), pp.343-63 https://doi.org/10.1108/09684880910992322.
George, D. and Mallery, P., 2016. IBM SPSS Statistics 23 Step by Step 14th ed. New York, NY: Routledge https://doi.org/10.4324/9781315545899.
Green, S. and May, S., 2003. Re-engineering construction: going against the grain. Building Research and Information, 31(2), pp.97-106 https://doi.org/10.1080/09613210301992.
Harrington, S.J. and Guimaraes, T., 2005. Corporate culture, absorptive capacity and IT success. Information and Organization, 15(1), pp.39-63 https://doi.org/10.1016/j.infoandorg.2004.10.002.
Hofstede, G., 2001. Culture’s Consequences: Comparing Values, Behaviors, Institutions and Organizations Across Nations. 2nd ed. Thousand Oaks, CA: Sage Publications https://doi.org/10.2307/3556622.
Hofstede, G., Hofstede, G.J. and Minkov, M., 2010. Cultures and Organizations - software of the mind. 3rd ed. New York: McGraw Hill.
Howard, L.W., 1998. Validating the Competing Values Model As a Representation of. The International Journal of Organizational Analysis, 6(3), pp.231-50 https://doi.org/10.1108/eb028886.
Janz, D.B. and Prasarnphanich, P., 2003. Understanding the Antecedents of Effective Knowledge Management. The Decision Sciences, 34(2), pp.351-84 https://doi.org/10.1111/1540-5915.02328.
Kasapoglu, E., 2014. Leadership Styles in Architectural Design Offices in Turkey. Journal of Construction Engineering and Management, 140(2) https://doi.org/10.1061/(asce)co.1943-7862.0000799.
Khazanchi, S., Lewis, M.W. and Boyer, K.K., 2007. Innovation-supportive culture: The impact of organizational values on process innovation. Journal of Operations Management, 25(4), pp.871-84 https://doi.org/10.1016/j.jom.2006.08.003.
Koh, T.Y. and Low, S.P., 2008. Organizational culture and TQM implementation in construction firms in Singapore. Construction Management and Economics, 26(3), pp.237-48 https://doi.org/10.1080/01446190701874397.
Kotter, J.P. and Heskett, J.L., 1992. Corporate culture and performance. Science, 47(March), p.214.
Kumaraswamy, M., Rowlinson, S., Rahman, M. and Phua, F., 2002 Strategies for triggering the required ‘Cultural Revolution’ in the construction industry, In: Fellows, R.F. and Seymour, D.E., eds. Perspectives on culture in construction, CIB Publication no.275, pp.268-85.
Lamond, D., 2003. The value of Quinn’s competing values model in an Australian context. Journal of Managerial Psychology, 18(1), pp.46-59 https://doi.org/10.1108/02683940310459583.
Liu, A. and Zhang, S., 2003. Organizational culture of the Chinese construction companies: towards a C-E Model. In: 2nd International Conference on Structural and Construction Engineering. pp.431-36.
Liu, A.M.M., Zhang, S. and Meiyung, L., 2006. A framework for assessing organisational culture of Chinese construction enterprises. Engineering, Construction and Architectural Management, 13, pp.327-42 https://doi.org/10.1108/09699980610680153.
McDermott, C.M. and Stock, G.N., 1999. Organizational culture and advanced manufacturing technology implementation. Journal of Operations Management, 17(5), pp.521-33.
Monahan, J, Coates, R and Clarke-Hagan, D., 2014. Overcoming the barriers of green innovation in construction projects through its successful management. In: Raiden, A.B. and Aboagye-Nimo, E. eds. Proceedings of 30th Annual ARCOM Conference, 1-3 September 2014, Portsmouth, UK, Association of Researchers in Construction Management, pp.123-132.
Organizational Culture: Case of the Finnish Construction Industry
Construction Economics and Building, Vol. 18, No. 1, March 201867

Nummelin, J., 2007. Measuring Organizational Culture in Construction Sector - Finnish Sample. VTT Technical Research Centre of Finland, (1980), pp.1-10.
Oney-Yazici, E., Giritli, H., Topcu-Oraz, G. and Acar, E., 2007. Organizational culture: the case of Turkish construction industry. Engineering, Construction and Architectural Management, 14(6), pp.519–531. https://doi.org/10.1108/09699980710828996.
Ott, J.S., 1989. The Organisational Culture Perspective, Pacific Grove, CA: Brooks/Cole.
Peters, T.J. and Waterman, R.H., 1982. In search of excellence, New York, NY: Harper and Row.
Prajogo, D.I. and McDermott, C.M., 2005. The relationship between total quality management practices and organizational culture. International Journal of Operations and Production Management, 25(11), pp.1101-22 https://doi.org/10.1108/01443570510626916.
Quinn, J.B. and Rohrbaugh, J., 1983. A spatial model of effectiveness: criteria towards a competing values approach to organization analysis. Journal of Management Science, 29, pp.363-77 https://doi.org/10.1287/mnsc.29.3.363.
Sandrk Nukic, I. and Huemann, M., 2016. Organizational culture of the Croatian construction industry. Engineering, Construction and Architectural Management, 23(2), pp.237-60 https://doi.org/10.1108/ecam-02-2015-0019.
Sanz‐Valle, R., Naranjo-Valencia, J.C., Jiménez‐Jiménez, D. and Perez‐Caballero, L., 2011. Linking organizational learning with technical innovation and organizational culture. Journal of Knowledge Management, 15(6), pp.997-1015 https://doi.org/10.1108/13673271111179334.
Sathe, V., 1985. Culture and Related Corporate Realities: Text, Cases, and Readings on Organizational Entry, Establishment and Change. Homewood, IL: Richard D Irwin https://doi.org/10.1002/hrm.3930240313.
Schein, E., 1985. Organizational Culture and Leadership. San Francisco, CA: Jossey-Bass.
Schein, E.H., 2009. The Corporate Culture Survival Guide. San Francisco, CA: Jossey-Bass.
Shortell, S.M., O’Brien, J.L., Carman, J.M., Foster, R.W., Hughes, E.F., Boerstler, H. and O’Connor, E.J., 1995. Assessing the impact of continuous quality improvement/total quality management: concept versus implementation. Health Services Research, 30(2), pp.377-401.
Siehl, C. and Martin, J., 1990. Organisational culture: a key to financial performance. In Organisational climate and culture. San Francisco, CA: Jossey-Bass, pp. 241-81.
Surveypal, 2017. Surveypal - homepage. Available at: https://www.surveypal.com/ [Accessed 30 August 2017].
Sørensen, J.B., 2002. The strength of corporate culture and the reliability of firm performance. Administrative Science Quarterly, 47(1), pp.70-91 https://doi.org/10.2307/3094891.
Teräväinen, V., Suominen, A. and Kähkönen, K., 2017. Positioning Organizational Culture Studies Between the Construction Industry and Other Industries. In M. Buser, G. Lindahl, and C. Räisänen, eds. 9th Nordic Conference on Construction Economics and organization. Göteborg, Sweden, pp. 428-41.
Willar, D., Trigunarsyah, B. and Coffey, V., 2016. Organisational culture and quality management system implementation in Indonesian construction companies. Engineering, Construction and Architectural Management, 23(2), pp.114-33.
Yepes, V., Pellicer, E., Correa, C.L. and Alarcón. L.F., 2016. Creative Innovation in Spanish Construction Firms. Journal of professional issues in engineering education and practice, 142(1).
Teräväinen, Junnonen, and Ali-Löytty
Construction Economics and Building, Vol. 18, No. 1, March 201868

Zammuto, R.F., Gifford, B. and Goodman, E.A., 2000. Managerial ideologies, organization culture and the outcomes of innovation: A competing values perspective. In: Handbook of Organizational Culture and Climate. pp.261-78.
Zhang, S. and Liu, A.M.M., 2006. Organisational culture profiles of construction enterprises in China. Construction Management and Economics, 24, pp.817-28 https://doi.org/10.1080/01446190600704604.
Zheng, W., Yang, B. and McLean, G.N., 2010. Linking organizational culture, structure, strategy, and organizational effectiveness: Mediating role of knowledge management. Journal of Business Research, 63(7), pp.763-71 https://doi.org/10.1016/j.jbusres.2009.06.005.
Zuo, J. and Zillante, G., 2005. Project culture within construction projects: a literature review. In IGLC13. pp.353-61.
Organizational Culture: Case of the Finnish Construction Industry
Construction Economics and Building, Vol. 18, No. 1, March 201869