Embed Size (px)
Citation preview

Oracle® Hyperion Planning
User's Guide
Release 11.1.2.3.500
Updated: May 2014

Planning User's Guide, 11.1.2.3.500
Copyright © 2000, 2014, Oracle and/or its affiliates. All rights reserved.
Authors: EPM Information Development Team
Oracle and Java are registered trademarks of Oracle and/or its affiliates. Other names may be trademarks of their respectiveowners.
Intel and Intel Xeon are trademarks or registered trademarks of Intel Corporation. All SPARC trademarks are used underlicense and are trademarks or registered trademarks of SPARC International, Inc. AMD, Opteron, the AMD logo, and theAMD Opteron logo are trademarks or registered trademarks of Advanced Micro Devices. UNIX is a registered trademarkof The Open Group.
This software and related documentation are provided under a license agreement containing restrictions on use anddisclosure and are protected by intellectual property laws. Except as expressly permitted in your license agreement orallowed by law, you may not use, copy, reproduce, translate, broadcast, modify, license, transmit, distribute, exhibit,perform, publish, or display any part, in any form, or by any means. Reverse engineering, disassembly, or decompilationof this software, unless required by law for interoperability, is prohibited.
The information contained herein is subject to change without notice and is not warranted to be error-free. If you findany errors, please report them to us in writing.
If this is software or related documentation that is delivered to the U.S. Government or anyone licensing it on behalf ofthe U.S. Government, the following notice is applicable:
U.S. GOVERNMENT END USERS:
Oracle programs, including any operating system, integrated software, any programs installed on the hardware, and/ordocumentation, delivered to U.S. Government end users are "commercial computer software" pursuant to the applicableFederal Acquisition Regulation and agency-specific supplemental regulations. As such, use, duplication, disclosure,modification, and adaptation of the programs, including any operating system, integrated software, any programs installedon the hardware, and/or documentation, shall be subject to license terms and license restrictions applicable to the programs.No other rights are granted to the U.S. Government.
This software or hardware is developed for general use in a variety of information management applications. It is notdeveloped or intended for use in any inherently dangerous applications, including applications that may create a risk ofpersonal injury. If you use this software or hardware in dangerous applications, then you shall be responsible to take allappropriate fail-safe, backup, redundancy, and other measures to ensure its safe use. Oracle Corporation and its affiliatesdisclaim any liability for any damages caused by use of this software or hardware in dangerous applications.
This software or hardware and documentation may provide access to or information on content, products, and servicesfrom third parties. Oracle Corporation and its affiliates are not responsible for and expressly disclaim all warranties of anykind with respect to third-party content, products, and services. Oracle Corporation and its affiliates will not be responsiblefor any loss, costs, or damages incurred due to your access to or use of third-party content, products, or services.

Contents
Documentation Accessibility . . . . . . . . . . . . . . . . . . . . . . . . . . . . . . . . . . . . . . . . . . . . . . . . . . . . . . . . . . . 9
Documentation Feedback . . . . . . . . . . . . . . . . . . . . . . . . . . . . . . . . . . . . . . . . . . . . . . . . . . . . . . . . . . . . 11
Chapter 1. About Planning . . . . . . . . . . . . . . . . . . . . . . . . . . . . . . . . . . . . . . . . . . . . . . . . . . . . . . . . . . . 13
Overview . . . . . . . . . . . . . . . . . . . . . . . . . . . . . . . . . . . . . . . . . . . . . . . . . . . . . . . . . . . 13
Logging onto Planning . . . . . . . . . . . . . . . . . . . . . . . . . . . . . . . . . . . . . . . . . . . . . . . . . 14
Navigating in Planning . . . . . . . . . . . . . . . . . . . . . . . . . . . . . . . . . . . . . . . . . . . . . . . . . 14
Using Online Help . . . . . . . . . . . . . . . . . . . . . . . . . . . . . . . . . . . . . . . . . . . . . . . . . . . . 15
Using Oracle User Productivity Kit . . . . . . . . . . . . . . . . . . . . . . . . . . . . . . . . . . . . . . . . 15
About Task Lists . . . . . . . . . . . . . . . . . . . . . . . . . . . . . . . . . . . . . . . . . . . . . . . . . . . . . . 16
Logging Off Planning . . . . . . . . . . . . . . . . . . . . . . . . . . . . . . . . . . . . . . . . . . . . . . . . . . 16
Chapter 2. Working with Task Lists . . . . . . . . . . . . . . . . . . . . . . . . . . . . . . . . . . . . . . . . . . . . . . . . . . . . . . 17
About Task Lists and Tasks . . . . . . . . . . . . . . . . . . . . . . . . . . . . . . . . . . . . . . . . . . . . . . 17
Working With Task Lists and Tasks . . . . . . . . . . . . . . . . . . . . . . . . . . . . . . . . . . . . . . . . 18
Completing Tasks . . . . . . . . . . . . . . . . . . . . . . . . . . . . . . . . . . . . . . . . . . . . . . . . . . . . . 19
Viewing Email Alerts . . . . . . . . . . . . . . . . . . . . . . . . . . . . . . . . . . . . . . . . . . . . . . . . . . . 20
Reporting on Task List Status . . . . . . . . . . . . . . . . . . . . . . . . . . . . . . . . . . . . . . . . . . . . 20
Using the Dashboard to View Task List Status . . . . . . . . . . . . . . . . . . . . . . . . . . . . . . . . . 21
Chapter 3. Working with Forms . . . . . . . . . . . . . . . . . . . . . . . . . . . . . . . . . . . . . . . . . . . . . . . . . . . . . . . . 23
Selecting and Opening Forms . . . . . . . . . . . . . . . . . . . . . . . . . . . . . . . . . . . . . . . . . . . . 23
Opening Forms . . . . . . . . . . . . . . . . . . . . . . . . . . . . . . . . . . . . . . . . . . . . . . . . . . . . . . 23
Searching for Forms . . . . . . . . . . . . . . . . . . . . . . . . . . . . . . . . . . . . . . . . . . . . . . . . . . . 24
Specifying Form Member and Alias Display Settings . . . . . . . . . . . . . . . . . . . . . . . . . . . . 24
Specifying Member and Alias Display Settings for the Member Selector . . . . . . . . . . . . . . 24
Expanding Forms and the Data Entry Area . . . . . . . . . . . . . . . . . . . . . . . . . . . . . . . . . . 25
Setting Column Width . . . . . . . . . . . . . . . . . . . . . . . . . . . . . . . . . . . . . . . . . . . . . . . . . 25
Adjusting Row Height . . . . . . . . . . . . . . . . . . . . . . . . . . . . . . . . . . . . . . . . . . . . . . . . . . 26
Hiding Rows or Columns Having No Data or Zeros . . . . . . . . . . . . . . . . . . . . . . . . . . . . 26
Searching in Forms . . . . . . . . . . . . . . . . . . . . . . . . . . . . . . . . . . . . . . . . . . . . . . . . . . . . 27
Sorting Rows and Columns . . . . . . . . . . . . . . . . . . . . . . . . . . . . . . . . . . . . . . . . . . . . . . 27
Contents iii

Filtering Rows and Columns . . . . . . . . . . . . . . . . . . . . . . . . . . . . . . . . . . . . . . . . . . . . . 28
Showing Members in the Outline . . . . . . . . . . . . . . . . . . . . . . . . . . . . . . . . . . . . . . . . . . 28
Viewing Instructions for Forms . . . . . . . . . . . . . . . . . . . . . . . . . . . . . . . . . . . . . . . . . . . 29
Displaying Dimension Names on the Page . . . . . . . . . . . . . . . . . . . . . . . . . . . . . . . . . . . 29
Viewing a Cell's Data History . . . . . . . . . . . . . . . . . . . . . . . . . . . . . . . . . . . . . . . . . . . . . 29
Navigating Among Forms . . . . . . . . . . . . . . . . . . . . . . . . . . . . . . . . . . . . . . . . . . . . . . . 30
Copying Versions . . . . . . . . . . . . . . . . . . . . . . . . . . . . . . . . . . . . . . . . . . . . . . . . . . . . . 30
Launching Smart View from Planning . . . . . . . . . . . . . . . . . . . . . . . . . . . . . . . . . . . . . . 31
About Smart View Formatting in Planning Forms . . . . . . . . . . . . . . . . . . . . . . . . . . . . . . 31
Using Predictive Planning . . . . . . . . . . . . . . . . . . . . . . . . . . . . . . . . . . . . . . . . . . . . . . . 32
Chapter 4. Working with Ad Hoc Grids . . . . . . . . . . . . . . . . . . . . . . . . . . . . . . . . . . . . . . . . . . . . . . . . . . . 33
About Ad Hoc Analysis . . . . . . . . . . . . . . . . . . . . . . . . . . . . . . . . . . . . . . . . . . . . . . . . . 33
Using Ad Hoc Grids . . . . . . . . . . . . . . . . . . . . . . . . . . . . . . . . . . . . . . . . . . . . . . . . 33
Ad Hoc Roles . . . . . . . . . . . . . . . . . . . . . . . . . . . . . . . . . . . . . . . . . . . . . . . . . . . . . 34
Ad Hoc Grids in Smart View . . . . . . . . . . . . . . . . . . . . . . . . . . . . . . . . . . . . . . . . . . 34
Creating and Working With Ad Hoc Grids . . . . . . . . . . . . . . . . . . . . . . . . . . . . . . . . . . . 34
Creating Ad Hoc Grids . . . . . . . . . . . . . . . . . . . . . . . . . . . . . . . . . . . . . . . . . . . . . . 34
Default Properties of New Ad Hoc Grids . . . . . . . . . . . . . . . . . . . . . . . . . . . . . . . . . 35
Starting Ad Hoc Analysis . . . . . . . . . . . . . . . . . . . . . . . . . . . . . . . . . . . . . . . . . . . . . 35
Performing Ad Hoc Actions . . . . . . . . . . . . . . . . . . . . . . . . . . . . . . . . . . . . . . . . . . 36
Saving Ad Hoc Grids . . . . . . . . . . . . . . . . . . . . . . . . . . . . . . . . . . . . . . . . . . . . . . . . 37
Exiting Ad Hoc Analysis . . . . . . . . . . . . . . . . . . . . . . . . . . . . . . . . . . . . . . . . . . . . . 37
Ad Hoc Grid Options . . . . . . . . . . . . . . . . . . . . . . . . . . . . . . . . . . . . . . . . . . . . . . . . . . 38
Ad Hoc Options . . . . . . . . . . . . . . . . . . . . . . . . . . . . . . . . . . . . . . . . . . . . . . . . . . . 38
Suppress Options . . . . . . . . . . . . . . . . . . . . . . . . . . . . . . . . . . . . . . . . . . . . . . . . . . 39
Precision Options . . . . . . . . . . . . . . . . . . . . . . . . . . . . . . . . . . . . . . . . . . . . . . . . . . 39
Replacement Options . . . . . . . . . . . . . . . . . . . . . . . . . . . . . . . . . . . . . . . . . . . . . . . 40
Chapter 5. Entering Data . . . . . . . . . . . . . . . . . . . . . . . . . . . . . . . . . . . . . . . . . . . . . . . . . . . . . . . . . . . . 41
About Entering Data . . . . . . . . . . . . . . . . . . . . . . . . . . . . . . . . . . . . . . . . . . . . . . . . . . . 42
Colors in Forms . . . . . . . . . . . . . . . . . . . . . . . . . . . . . . . . . . . . . . . . . . . . . . . . . . . 42
Aspects of Forms . . . . . . . . . . . . . . . . . . . . . . . . . . . . . . . . . . . . . . . . . . . . . . . . . . 42
Entering Data with Smart Lists . . . . . . . . . . . . . . . . . . . . . . . . . . . . . . . . . . . . . . . . . 43
Entering Data with Shortcut Menus . . . . . . . . . . . . . . . . . . . . . . . . . . . . . . . . . . . . . 43
Entering Percentage Values . . . . . . . . . . . . . . . . . . . . . . . . . . . . . . . . . . . . . . . . . . . 44
Entering Date Values . . . . . . . . . . . . . . . . . . . . . . . . . . . . . . . . . . . . . . . . . . . . . . . . 44
Entering Text Values . . . . . . . . . . . . . . . . . . . . . . . . . . . . . . . . . . . . . . . . . . . . . . . 44
Dynamically Setting User Variables . . . . . . . . . . . . . . . . . . . . . . . . . . . . . . . . . . . . . 45
About Entering Data with Shortcut Menus . . . . . . . . . . . . . . . . . . . . . . . . . . . . . . . . . . . 45
iv Contents
Navigating in Forms . . . . . . . . . . . . . . . . . . . . . . . . . . . . . . . . . . . . . . . . . . . . . . . . . . . 46
Selecting Members Using Pages . . . . . . . . . . . . . . . . . . . . . . . . . . . . . . . . . . . . . . . . . . . 46
Searching for Members . . . . . . . . . . . . . . . . . . . . . . . . . . . . . . . . . . . . . . . . . . . . . . . . . 47
Viewing Member Formulas . . . . . . . . . . . . . . . . . . . . . . . . . . . . . . . . . . . . . . . . . . . . . 47
Viewing and Resolving Data Validation Errors . . . . . . . . . . . . . . . . . . . . . . . . . . . . . . . . 47
Selecting Cell Ranges . . . . . . . . . . . . . . . . . . . . . . . . . . . . . . . . . . . . . . . . . . . . . . . . . . . 48
Copying and Pasting Data . . . . . . . . . . . . . . . . . . . . . . . . . . . . . . . . . . . . . . . . . . . . . . . 48
Copying and Pasting Data Between Microsoft Excel and Planning Forms . . . . . . . . . . . . . 50
About Cell Comments . . . . . . . . . . . . . . . . . . . . . . . . . . . . . . . . . . . . . . . . . . . . . . . . . . 50
Working with Comments . . . . . . . . . . . . . . . . . . . . . . . . . . . . . . . . . . . . . . . . . . . . . . . 51
Printing Comments . . . . . . . . . . . . . . . . . . . . . . . . . . . . . . . . . . . . . . . . . . . . . . . . . . . 52
Using Account Annotations and Custom Links . . . . . . . . . . . . . . . . . . . . . . . . . . . . . . . . 52
Adding, Editing, and Viewing Cell-Level Documents . . . . . . . . . . . . . . . . . . . . . . . . . . . 53
Writing #MISSING Values . . . . . . . . . . . . . . . . . . . . . . . . . . . . . . . . . . . . . . . . . . . . . . 54
Subtotaling Values . . . . . . . . . . . . . . . . . . . . . . . . . . . . . . . . . . . . . . . . . . . . . . . . . . . . 54
Getting the Latest Data . . . . . . . . . . . . . . . . . . . . . . . . . . . . . . . . . . . . . . . . . . . . . . . . . 55
Exporting Data to Microsoft Excel . . . . . . . . . . . . . . . . . . . . . . . . . . . . . . . . . . . . . . . . . 55
Drilling Through to Source Data . . . . . . . . . . . . . . . . . . . . . . . . . . . . . . . . . . . . . . . . . . 56
Saving Data . . . . . . . . . . . . . . . . . . . . . . . . . . . . . . . . . . . . . . . . . . . . . . . . . . . . . . . . . 56
After Entering Data . . . . . . . . . . . . . . . . . . . . . . . . . . . . . . . . . . . . . . . . . . . . . . . . . . . . 56
Printing Data . . . . . . . . . . . . . . . . . . . . . . . . . . . . . . . . . . . . . . . . . . . . . . . . . . . . . . . . 57
Chapter 6. Working With Business Rules . . . . . . . . . . . . . . . . . . . . . . . . . . . . . . . . . . . . . . . . . . . . . . . . . 59
About Launching Business Rules . . . . . . . . . . . . . . . . . . . . . . . . . . . . . . . . . . . . . . . . . . 59
Launching Business Rules . . . . . . . . . . . . . . . . . . . . . . . . . . . . . . . . . . . . . . . . . . . . . . . 60
Entering Runtime Prompts . . . . . . . . . . . . . . . . . . . . . . . . . . . . . . . . . . . . . . . . . . . . . . 60
Runtime Prompts and Approvals . . . . . . . . . . . . . . . . . . . . . . . . . . . . . . . . . . . . . . . . . . 62
Using Business Rules . . . . . . . . . . . . . . . . . . . . . . . . . . . . . . . . . . . . . . . . . . . . . . . . . . . 62
Checking Job Status . . . . . . . . . . . . . . . . . . . . . . . . . . . . . . . . . . . . . . . . . . . . . . . . . . . 63
Chapter 7. Adjusting and Spreading Data . . . . . . . . . . . . . . . . . . . . . . . . . . . . . . . . . . . . . . . . . . . . . . . . . 65
Adjusting Cell Values . . . . . . . . . . . . . . . . . . . . . . . . . . . . . . . . . . . . . . . . . . . . . . . . . . 65
Adjusting Values . . . . . . . . . . . . . . . . . . . . . . . . . . . . . . . . . . . . . . . . . . . . . . . . . . 65
Performing “What If” Analysis . . . . . . . . . . . . . . . . . . . . . . . . . . . . . . . . . . . . . . . . 66
Spreading Data for Time Periods . . . . . . . . . . . . . . . . . . . . . . . . . . . . . . . . . . . . . . . . . . 67
How Spreading Data Works . . . . . . . . . . . . . . . . . . . . . . . . . . . . . . . . . . . . . . . . . . 68
Spreading with Multiple Currencies . . . . . . . . . . . . . . . . . . . . . . . . . . . . . . . . . . . . . 72
Locking Cells . . . . . . . . . . . . . . . . . . . . . . . . . . . . . . . . . . . . . . . . . . . . . . . . . . . . . 72
Examples of Spreading Data with Cell Locking . . . . . . . . . . . . . . . . . . . . . . . . . . . . . 73
Spreading Values Using Grid Spread . . . . . . . . . . . . . . . . . . . . . . . . . . . . . . . . . . . . . . . 73
Contents v
Spreading Values Using Mass Allocations . . . . . . . . . . . . . . . . . . . . . . . . . . . . . . . . . . . . 74
Chapter 8. Working with Supporting Detail . . . . . . . . . . . . . . . . . . . . . . . . . . . . . . . . . . . . . . . . . . . . . . . . 77
Working with Supporting Detail . . . . . . . . . . . . . . . . . . . . . . . . . . . . . . . . . . . . . . . . . . 77
Adding Supporting Detail . . . . . . . . . . . . . . . . . . . . . . . . . . . . . . . . . . . . . . . . . . . . . . . 78
Example of Supporting Detail . . . . . . . . . . . . . . . . . . . . . . . . . . . . . . . . . . . . . . . . . 79
Totaling When Supporting Detail Cells are Blank . . . . . . . . . . . . . . . . . . . . . . . . . . . 79
Order of Supporting Detail . . . . . . . . . . . . . . . . . . . . . . . . . . . . . . . . . . . . . . . . . . . 80
Incorrectly Entering Supporting Detail . . . . . . . . . . . . . . . . . . . . . . . . . . . . . . . . . . . 80
Correctly Entering Supporting Detail . . . . . . . . . . . . . . . . . . . . . . . . . . . . . . . . . . . . 80
Working with the Supporting Detail Hierarchy . . . . . . . . . . . . . . . . . . . . . . . . . . . . . 80
Viewing or Changing Supporting Detail . . . . . . . . . . . . . . . . . . . . . . . . . . . . . . . . . . . . . 81
Synchronizing Supporting Detail with Essbase . . . . . . . . . . . . . . . . . . . . . . . . . . . . . . . . 81
Pasting Multiple Cells into the Supporting Detail Window . . . . . . . . . . . . . . . . . . . . . . . 82
Chapter 9. Working with Currencies . . . . . . . . . . . . . . . . . . . . . . . . . . . . . . . . . . . . . . . . . . . . . . . . . . . . . 83
Working with Multiple Currencies . . . . . . . . . . . . . . . . . . . . . . . . . . . . . . . . . . . . . . . . . 83
Changing the Currency for a Data Cell . . . . . . . . . . . . . . . . . . . . . . . . . . . . . . . . . . . . . . 84
Reporting on Data in Multiple Currencies . . . . . . . . . . . . . . . . . . . . . . . . . . . . . . . . . . . 84
Chapter 10. Managing Planning Units . . . . . . . . . . . . . . . . . . . . . . . . . . . . . . . . . . . . . . . . . . . . . . . . . . . 85
Overview of the Review Process . . . . . . . . . . . . . . . . . . . . . . . . . . . . . . . . . . . . . . . . . . . 85
Planning Unit States . . . . . . . . . . . . . . . . . . . . . . . . . . . . . . . . . . . . . . . . . . . . . . . . 85
Planning Unit Actions . . . . . . . . . . . . . . . . . . . . . . . . . . . . . . . . . . . . . . . . . . . . . . . 87
Viewing Planning Unit Totals . . . . . . . . . . . . . . . . . . . . . . . . . . . . . . . . . . . . . . . . . . . . 88
Using the Approvals Dashboard to View Planning Unit Status . . . . . . . . . . . . . . . . . . . . . 89
Example: Approvals Dashboard and Level Status . . . . . . . . . . . . . . . . . . . . . . . . . . . . . . . 92
Example: Approvals Dashboard and Group Status . . . . . . . . . . . . . . . . . . . . . . . . . . . . . . 95
Validating Planning Units . . . . . . . . . . . . . . . . . . . . . . . . . . . . . . . . . . . . . . . . . . . . . . . 96
Viewing and Resolving Planning Unit Validation Problems . . . . . . . . . . . . . . . . . . . . . . . 98
Changing Planning Unit Status . . . . . . . . . . . . . . . . . . . . . . . . . . . . . . . . . . . . . . . . . . . 99
Adding or Viewing Planning Unit Annotations . . . . . . . . . . . . . . . . . . . . . . . . . . . . . . . 101
Printing Planning Unit Annotations . . . . . . . . . . . . . . . . . . . . . . . . . . . . . . . . . . . . . . . 101
Viewing Planning Unit History Details and Using Annotations . . . . . . . . . . . . . . . . . . . 102
Selecting an Alternate Reviewer . . . . . . . . . . . . . . . . . . . . . . . . . . . . . . . . . . . . . . . . . . 102
Chapter 11. Setting User Preferences . . . . . . . . . . . . . . . . . . . . . . . . . . . . . . . . . . . . . . . . . . . . . . . . . . . 105
Setting Preferences for Application Settings . . . . . . . . . . . . . . . . . . . . . . . . . . . . . . . . . 105
Setting Up Email . . . . . . . . . . . . . . . . . . . . . . . . . . . . . . . . . . . . . . . . . . . . . . . . . . 106
Alias and Member Setting . . . . . . . . . . . . . . . . . . . . . . . . . . . . . . . . . . . . . . . . . . . 106
Where you can Define Alias and Member Display Settings . . . . . . . . . . . . . . . . . 106
vi Contents
Defining Alias and Member Display Options Using Preferences . . . . . . . . . . . . . 107
Setting Approvals Options . . . . . . . . . . . . . . . . . . . . . . . . . . . . . . . . . . . . . . . . . . . 108
Setting the Reporting Currency . . . . . . . . . . . . . . . . . . . . . . . . . . . . . . . . . . . . . . . 108
Setting Preferences for Display Options . . . . . . . . . . . . . . . . . . . . . . . . . . . . . . . . . . . . 109
Changing the Formatting of Numbers . . . . . . . . . . . . . . . . . . . . . . . . . . . . . . . . . . 109
Indenting Members on the Page Drop-Down List . . . . . . . . . . . . . . . . . . . . . . . . . . 111
Enabling Search with a Large Number of Pages . . . . . . . . . . . . . . . . . . . . . . . . . . . . 111
Showing Consolidation Operators . . . . . . . . . . . . . . . . . . . . . . . . . . . . . . . . . . . . . 111
Opening Part of a Form . . . . . . . . . . . . . . . . . . . . . . . . . . . . . . . . . . . . . . . . . . . . . 112
Showing Records on the Dimensions and Assign Access Pages . . . . . . . . . . . . . . . . . 112
Viewing the Interface in Higher Contrast . . . . . . . . . . . . . . . . . . . . . . . . . . . . . . . . 112
Setting Text Size . . . . . . . . . . . . . . . . . . . . . . . . . . . . . . . . . . . . . . . . . . . . . . . . . . 113
Setting the Date Format . . . . . . . . . . . . . . . . . . . . . . . . . . . . . . . . . . . . . . . . . . . . 113
Specifying how Many Form Rows and Columns are Populated . . . . . . . . . . . . . . . . 113
Setting Preferences for Printing Options . . . . . . . . . . . . . . . . . . . . . . . . . . . . . . . . . . . . 114
Setting Preferences for User Variables . . . . . . . . . . . . . . . . . . . . . . . . . . . . . . . . . . . . . 115
Chapter 12. Frequently Asked Questions . . . . . . . . . . . . . . . . . . . . . . . . . . . . . . . . . . . . . . . . . . . . . . . . . 117
Contents vii

viii Contents

Documentation Accessibility
For information about Oracle's commitment to accessibility, visit the Oracle Accessibility Program website athttp://www.oracle.com/pls/topic/lookup?ctx=acc&id=docacc.
Access to Oracle SupportOracle customers have access to electronic support through My Oracle Support. For information, visit http://www.oracle.com/pls/topic/lookup?ctx=acc&id=info or visit http://www.oracle.com/pls/topic/lookup?ctx=acc&id=trs if you are hearing impaired.
9

10 Documentation Accessibility

Documentation Feedback
Send feedback on this documentation to: [email protected]
Follow EPM Information Development on these social media sites:
LinkedIn - http://www.linkedin.com/groups?gid=3127051&goback=.gmp_3127051
Twitter - http://twitter.com/hyperionepminfo
Facebook - http://www.facebook.com/pages/Hyperion-EPM-Info/102682103112642
Google+ - https://plus.google.com/106915048672979407731/#106915048672979407731/posts
YouTube - http://www.youtube.com/user/OracleEPMWebcasts
11

12 Documentation Feedback

1About Planning
In This Chapter
Overview .. . . . . . . . . . . . . . . . . . . . . . . . . . . . . . . . . . . . . . . . . . . . . . . . . . . . . . . . . . . . . . . . . . . . . . . . . . . . . . . . . . . . . . . . . . . . . . . . . . .13
Logging onto Planning ... . . . . . . . . . . . . . . . . . . . . . . . . . . . . . . . . . . . . . . . . . . . . . . . . . . . . . . . . . . . . . . . . . . . . . . . . . . . . . . . . . .14
Navigating in Planning... . . . . . . . . . . . . . . . . . . . . . . . . . . . . . . . . . . . . . . . . . . . . . . . . . . . . . . . . . . . . . . . . . . . . . . . . . . . . . . . . . .14
Using Online Help ... . . . . . . . . . . . . . . . . . . . . . . . . . . . . . . . . . . . . . . . . . . . . . . . . . . . . . . . . . . . . . . . . . . . . . . . . . . . . . . . . . . . . . . .15
Using Oracle User Productivity Kit . . . . . . . . . . . . . . . . . . . . . . . . . . . . . . . . . . . . . . . . . . . . . . . . . . . . . . . . . . . . . . . . . . . . . . . .15
About Task Lists .. . . . . . . . . . . . . . . . . . . . . . . . . . . . . . . . . . . . . . . . . . . . . . . . . . . . . . . . . . . . . . . . . . . . . . . . . . . . . . . . . . . . . . . . . . .16
Logging Off Planning... . . . . . . . . . . . . . . . . . . . . . . . . . . . . . . . . . . . . . . . . . . . . . . . . . . . . . . . . . . . . . . . . . . . . . . . . . . . . . . . . . . . .16
OverviewOracle Hyperion Planning is a budgeting and planning solution that drives collaborative andevent-based operational planning processes throughout your organization for a wide range offinancial and operational needs. It gives web users the ability to enter, analyze, and report ondata, manage the planning process, and personalize data entry forms.
Planning is a comprehensive approach for the complete and closed-loop planning process thatdrives continuous business improvement. With Planning, all decision makers and front-linemanagers can communicate which course of action to take and get budget holders to collaborateso that the planning process is optimized and efficient. When a material event occurs that causesa change in direction, planners have the flexibility to adapt rapidly, ensuring that plans arerelevant and useful.
Planning benefits:
l Facilitates collaboration, communication, and control across multidivisional globalenterprises
l Provides a framework for perpetual planning, with attention to managing volatility andfrequent planning cycles
l Provides ease of use and deployment through the web or Oracle Smart View for Office
l Lowers the total cost of ownership through a shorter roll out and implementation phase,and easier applications maintenance
l Enhances decision-making with reporting, analysis, and planning
l Promotes modeling by including complex business rules and allocations
Overview 13
l Integrates with Smart View so you can design worksheets in Microsoft Excel to enter, format,analyze, and report on data in a Planning application. Using ad hoc grids—focused dataslices—in Smart View, you can also perform ad hoc analysis.
l Enables you to enter and analyze data using Offline Planning when you are disconnectedfrom the Internet—for example, on airplanes or in hotel rooms—and later save the databack to the Planning server. (The administrator must enable this feature for the application.)
l Integrates with other systems to load data
Logging onto Planning
ä To log on:
1 In a web browser, navigate to the Oracle Hyperion Enterprise Performance Management Workspace webpage, and log on.
2 Select Navigate, then Applications, then Planning, and then select your Planning application.
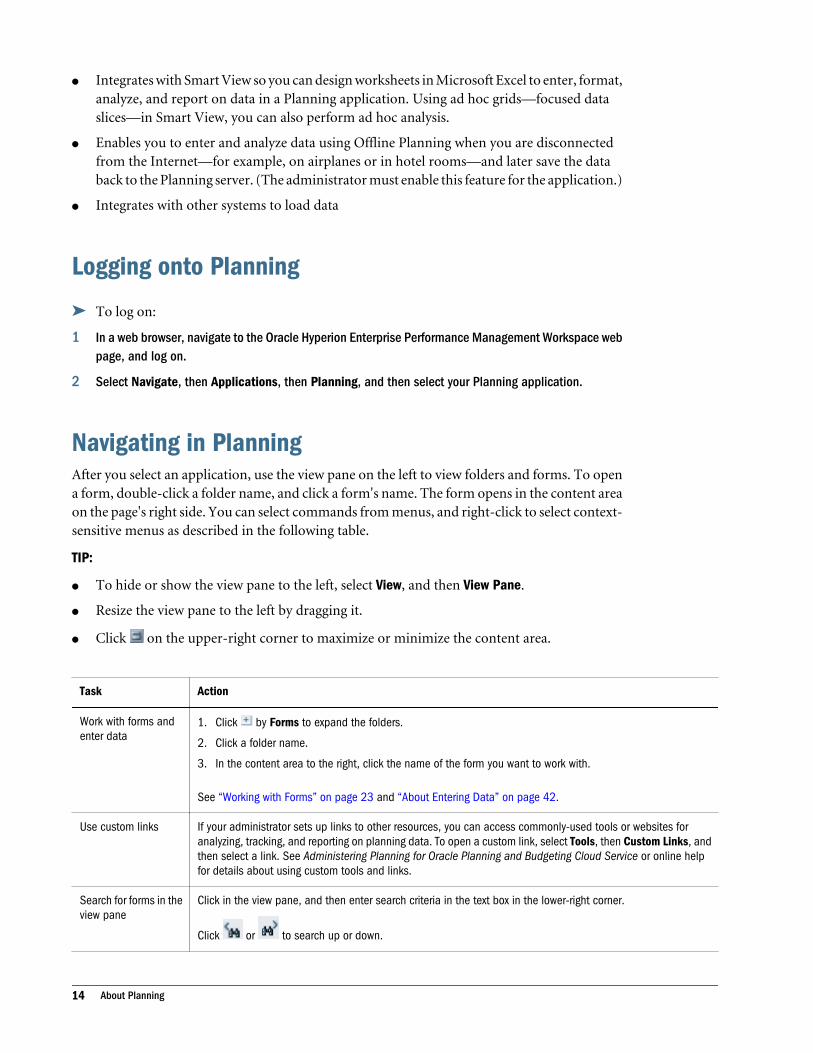
Navigating in PlanningAfter you select an application, use the view pane on the left to view folders and forms. To opena form, double-click a folder name, and click a form's name. The form opens in the content areaon the page's right side. You can select commands from menus, and right-click to select context-sensitive menus as described in the following table.
TIP:
l To hide or show the view pane to the left, select View, and then View Pane.
l Resize the view pane to the left by dragging it.
l Click on the upper-right corner to maximize or minimize the content area.
Task Action
Work with forms andenter data
1. Click by Forms to expand the folders.
2. Click a folder name.
3. In the content area to the right, click the name of the form you want to work with.
See “Working with Forms” on page 23 and “About Entering Data” on page 42.
Use custom links If your administrator sets up links to other resources, you can access commonly-used tools or websites foranalyzing, tracking, and reporting on planning data. To open a custom link, select Tools, then Custom Links, andthen select a link. See Administering Planning for Oracle Planning and Budgeting Cloud Service or online helpfor details about using custom tools and links.
Search for forms in theview pane
Click in the view pane, and then enter search criteria in the text box in the lower-right corner.
Click or to search up or down.
14 About Planning
Task Action
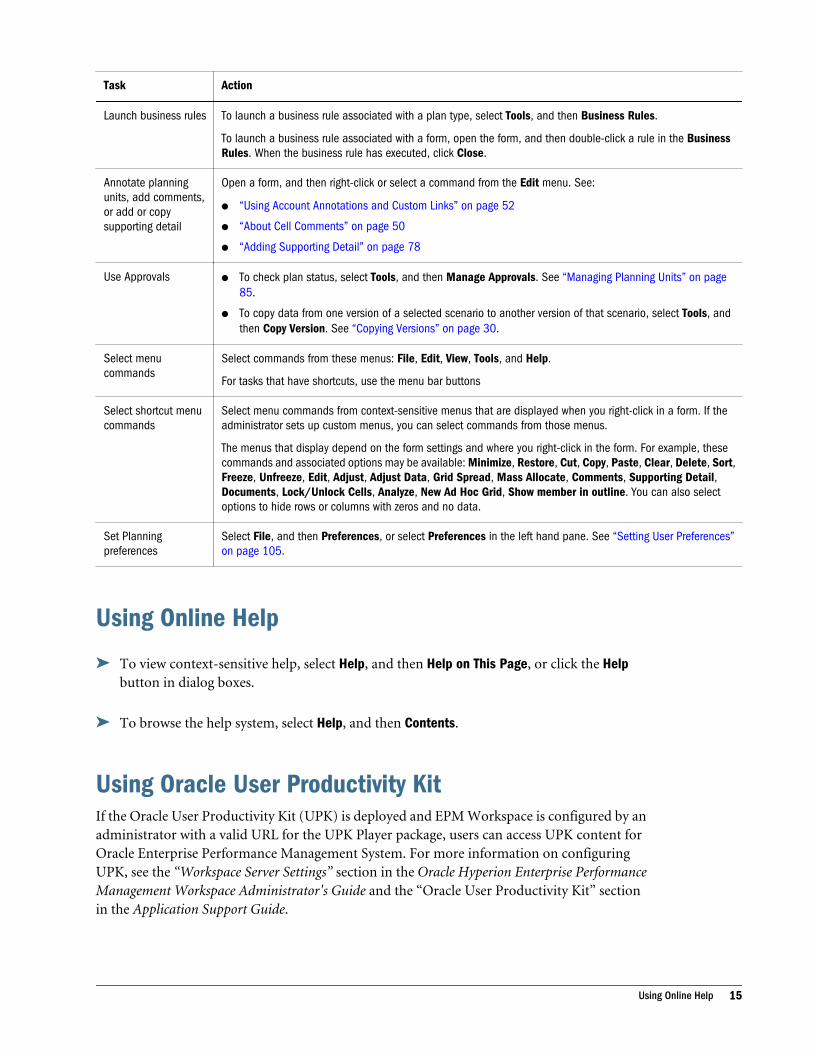
Launch business rules To launch a business rule associated with a plan type, select Tools, and then Business Rules.
To launch a business rule associated with a form, open the form, and then double-click a rule in the BusinessRules. When the business rule has executed, click Close.
Annotate planningunits, add comments,or add or copysupporting detail
Open a form, and then right-click or select a command from the Edit menu. See:
l “Using Account Annotations and Custom Links” on page 52
l “About Cell Comments” on page 50
l “Adding Supporting Detail” on page 78
Use Approvalsl To check plan status, select Tools, and then Manage Approvals. See “Managing Planning Units” on page
85.
l To copy data from one version of a selected scenario to another version of that scenario, select Tools, andthen Copy Version. See “Copying Versions” on page 30.
Select menucommands
Select commands from these menus: File, Edit, View, Tools, and Help.
For tasks that have shortcuts, use the menu bar buttons
Select shortcut menucommands
Select menu commands from context-sensitive menus that are displayed when you right-click in a form. If theadministrator sets up custom menus, you can select commands from those menus.
The menus that display depend on the form settings and where you right-click in the form. For example, thesecommands and associated options may be available: Minimize, Restore, Cut, Copy, Paste, Clear, Delete, Sort,Freeze, Unfreeze, Edit, Adjust, Adjust Data, Grid Spread, Mass Allocate, Comments, Supporting Detail,Documents, Lock/Unlock Cells, Analyze, New Ad Hoc Grid, Show member in outline. You can also selectoptions to hide rows or columns with zeros and no data.
Set Planningpreferences
Select File, and then Preferences, or select Preferences in the left hand pane. See “Setting User Preferences”on page 105.
Using Online Help
ä To view context-sensitive help, select Help, and then Help on This Page, or click the Helpbutton in dialog boxes.
ä To browse the help system, select Help, and then Contents.
Using Oracle User Productivity KitIf the Oracle User Productivity Kit (UPK) is deployed and EPM Workspace is configured by anadministrator with a valid URL for the UPK Player package, users can access UPK content forOracle Enterprise Performance Management System. For more information on configuringUPK, see the “Workspace Server Settings” section in the Oracle Hyperion Enterprise PerformanceManagement Workspace Administrator's Guide and the “Oracle User Productivity Kit” sectionin the Application Support Guide.
Using Online Help 15
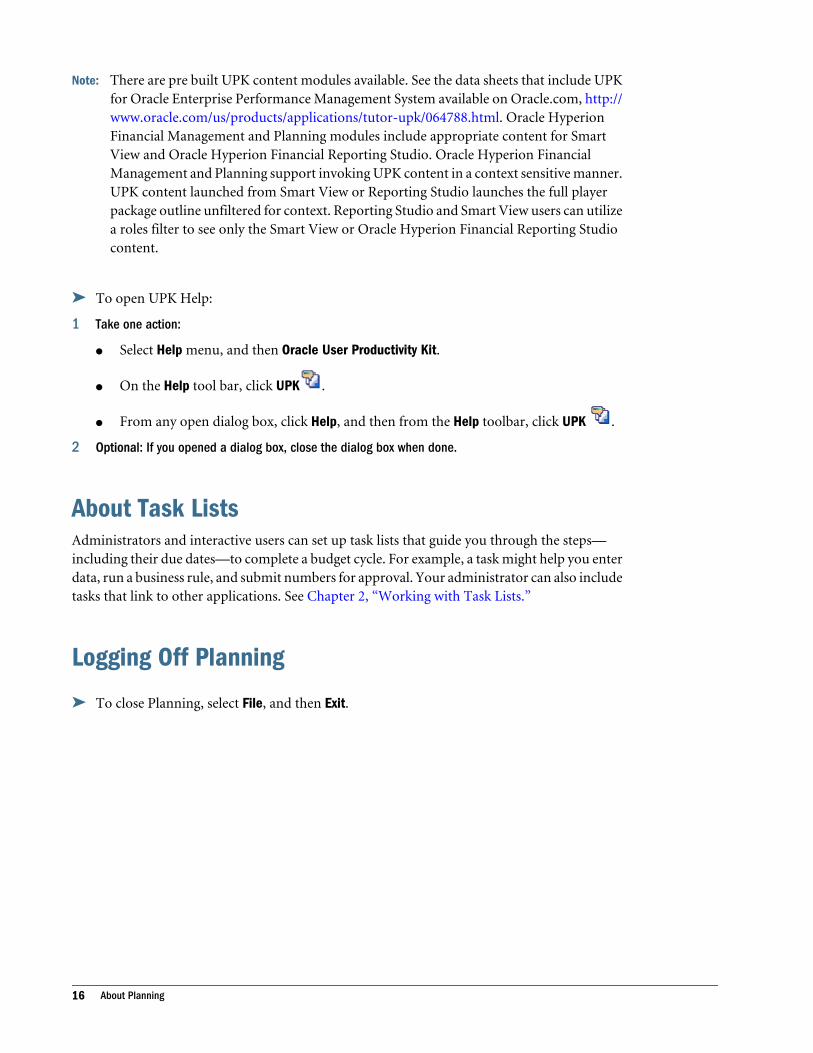
Note: There are pre built UPK content modules available. See the data sheets that include UPKfor Oracle Enterprise Performance Management System available on Oracle.com, http://www.oracle.com/us/products/applications/tutor-upk/064788.html. Oracle HyperionFinancial Management and Planning modules include appropriate content for SmartView and Oracle Hyperion Financial Reporting Studio. Oracle Hyperion FinancialManagement and Planning support invoking UPK content in a context sensitive manner.UPK content launched from Smart View or Reporting Studio launches the full playerpackage outline unfiltered for context. Reporting Studio and Smart View users can utilizea roles filter to see only the Smart View or Oracle Hyperion Financial Reporting Studiocontent.
ä To open UPK Help:
1 Take one action:
l Select Help menu, and then Oracle User Productivity Kit.
l On the Help tool bar, click UPK .
l From any open dialog box, click Help, and then from the Help toolbar, click UPK .
2 Optional: If you opened a dialog box, close the dialog box when done.
About Task ListsAdministrators and interactive users can set up task lists that guide you through the steps—including their due dates—to complete a budget cycle. For example, a task might help you enterdata, run a business rule, and submit numbers for approval. Your administrator can also includetasks that link to other applications. See Chapter 2, “Working with Task Lists.”
Logging Off Planning
ä To close Planning, select File, and then Exit.
16 About Planning
2Working with Task Lists
In This Chapter
About Task Lists and Tasks ... . . . . . . . . . . . . . . . . . . . . . . . . . . . . . . . . . . . . . . . . . . . . . . . . . . . . . . . . . . . . . . . . . . . . . . . . . . . .17
Working With Task Lists and Tasks ... . . . . . . . . . . . . . . . . . . . . . . . . . . . . . . . . . . . . . . . . . . . . . . . . . . . . . . . . . . . . . . . . . . . .18
Completing Tasks ... . . . . . . . . . . . . . . . . . . . . . . . . . . . . . . . . . . . . . . . . . . . . . . . . . . . . . . . . . . . . . . . . . . . . . . . . . . . . . . . . . . . . . . .19
Viewing Email Alerts .. . . . . . . . . . . . . . . . . . . . . . . . . . . . . . . . . . . . . . . . . . . . . . . . . . . . . . . . . . . . . . . . . . . . . . . . . . . . . . . . . . . . . .20
Reporting on Task List Status ... . . . . . . . . . . . . . . . . . . . . . . . . . . . . . . . . . . . . . . . . . . . . . . . . . . . . . . . . . . . . . . . . . . . . . . . . . .20
Using the Dashboard to View Task List Status ... . . . . . . . . . . . . . . . . . . . . . . . . . . . . . . . . . . . . . . . . . . . . . . . . . . . . . . .21
About Task Lists and TasksAdministrators can set up task lists that instruct you in performing specific actions, to help withbudget cycles. For example, a task might help you complete forms, launch business rules, orpromote planning units. Tasks may display instructions, due dates, dependencies, and alerts.Tasks can be of the following type; meaning they invoke or involve the following artifacts orprocesses:
l Web page—Opens a specified URL that you must use to perform or complete a task
l Form—Opens a particular form that you must complete or update
l Approvals—Enables you to start the review process with a specified scenario and version
l Business rules—Launches a business rule
l Copy Version—Copy a form’s data, including supporting detail, annotation, cell text, andcell documents, from a source to a destination version
l Job Console—Launches the Job Console so you can view jobs by user or by type or status
Task lists can also provide validation reports for promotional path rules. For information onviewing validation reports and resolving errors, see “Viewing and Resolving Data ValidationErrors” on page 47.
For information about creating task lists and tasks, see Administering Planning for OraclePlanning and Budgeting Cloud Service.
About Task Lists and Tasks 17
Working With Task Lists and Tasks
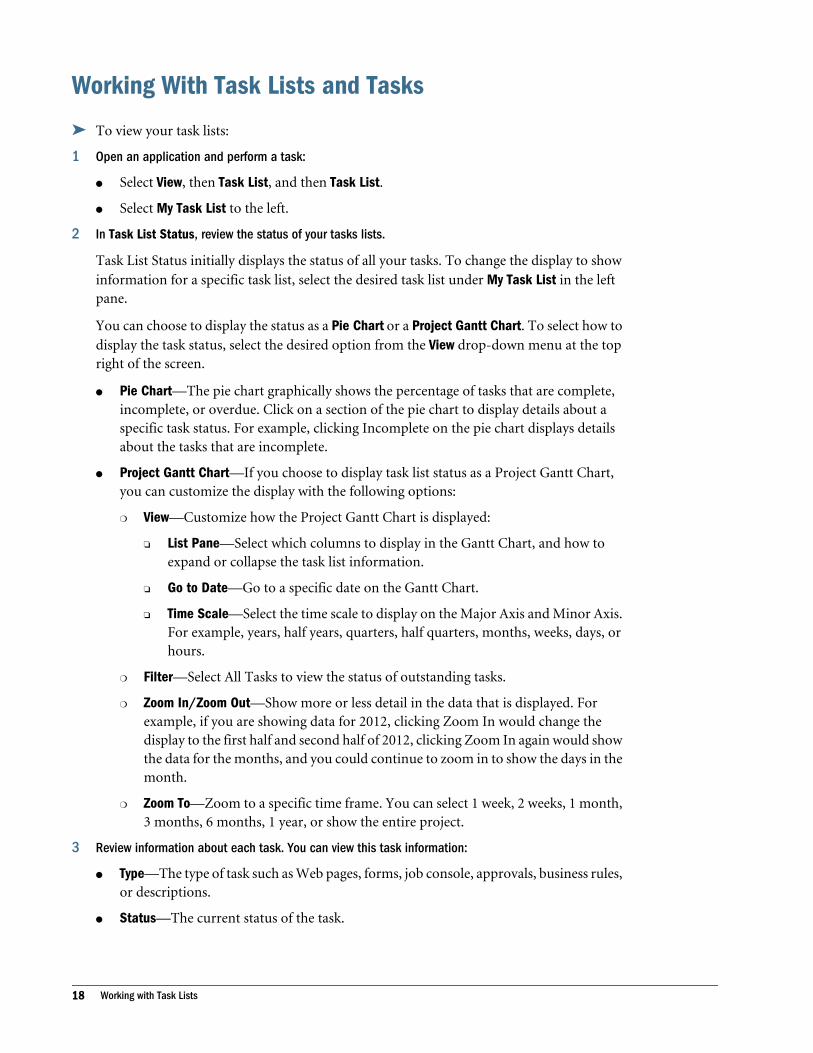
ä To view your task lists:
1 Open an application and perform a task:
l Select View, then Task List, and then Task List.
l Select My Task List to the left.
2 In Task List Status, review the status of your tasks lists.
Task List Status initially displays the status of all your tasks. To change the display to showinformation for a specific task list, select the desired task list under My Task List in the leftpane.
You can choose to display the status as a Pie Chart or a Project Gantt Chart. To select how todisplay the task status, select the desired option from the View drop-down menu at the topright of the screen.
l Pie Chart—The pie chart graphically shows the percentage of tasks that are complete,incomplete, or overdue. Click on a section of the pie chart to display details about aspecific task status. For example, clicking Incomplete on the pie chart displays detailsabout the tasks that are incomplete.
l Project Gantt Chart—If you choose to display task list status as a Project Gantt Chart,you can customize the display with the following options:
m View—Customize how the Project Gantt Chart is displayed:
o List Pane—Select which columns to display in the Gantt Chart, and how toexpand or collapse the task list information.
o Go to Date—Go to a specific date on the Gantt Chart.
o Time Scale—Select the time scale to display on the Major Axis and Minor Axis.For example, years, half years, quarters, half quarters, months, weeks, days, orhours.
m Filter—Select All Tasks to view the status of outstanding tasks.
m Zoom In/Zoom Out—Show more or less detail in the data that is displayed. Forexample, if you are showing data for 2012, clicking Zoom In would change thedisplay to the first half and second half of 2012, clicking Zoom In again would showthe data for the months, and you could continue to zoom in to show the days in themonth.
m Zoom To—Zoom to a specific time frame. You can select 1 week, 2 weeks, 1 month,3 months, 6 months, 1 year, or show the entire project.
3 Review information about each task. You can view this task information:
l Type—The type of task such as Web pages, forms, job console, approvals, business rules,or descriptions.
l Status—The current status of the task.
18 Working with Task Lists

m —Indicates that the task is complete. If a task has dependent tasks, these tasks
must be completed before is displayed for primary tasks.
m —Indicates that the task is incomplete.
m —Indicates that the task is overdue.
l Due Date—The date that the task must be completed.
Due dates are set when you create a task list. See “Managing Task Lists” in OracleHyperion Planning Administrator's Guide.
l Alert—Visual clues about your progress.
m Green: On schedule
m Yellow: Approaching the due date
m Red: Overdue; the due date has passed and the task is incomplete
Alerts are set to display when you create a task list. See “Managing Task Lists” in OracleHyperion Planning Administrator's Guide.
l Completed Date—The date the task was completed.
l Instructions—Click to access information about how to complete tasks.
l Action—Click to launch the Tasklist Wizard where you can enter detailedinformation about task.
Once in the Task Wizard, you can navigate using the options that are appropriate forthe selected task list or task. For example, depending on the task list, task, and status,you can select: Next, Previous, Next Incomplete, or Previous Incomplete. See “CompletingTasks” on page 19.
Completing TasksHow you complete tasks depends on their task type. For example, a task can require you to enterdata, launch a business rule, copy versions, or view job status. Tasks can also display read-onlyinformation, such as reminders or instructions.
After completing task requirements, mark the task as complete. If a task has dependent tasks,you must complete those tasks before completing the primary task.
ä To complete a task:
1 Select a task, as described in “Working With Task Lists and Tasks” on page 18.
The task displays.
2 Complete the task activity.
For example, depending on the task, you can view a Web page, enter data, complete anApprovals task, launch a business rule, read a description, or complete other activities. See
Completing Tasks 19
the appropriate section of this guide, such as “Entering Data” on page 41, “ManagingPlanning Units” on page 85, “Checking Job Status” on page 63, “Copying Versions” onpage 30, or “About Launching Business Rules” on page 59.
3 Complete associated dependent tasks.
Click to view subordinate tasks, also called child tasks.
4 After completing the activities for the task, select Complete.
If the check box is not selectable, you must complete dependent tasks before completing thetask.
After you select Complete, the task is marked as complete and is displayed next to thetask in the view pane.
Viewing Email AlertsIf your administrator sets email alerts, you can receive email reminders about tasks that areapproaching or are past their due date. The timing and frequency of alerts depends on how youradministrator sets up this feature.
ä To view an email alert, open and read the received email message.
Reporting on Task List StatusTo review the status of the planning process, use the Task List Report page to view task list reportsas PDF files or Excel worksheets. The status report displays the task lists, task list owners, duedates, completion dates, and status of the task.
ä To report on task list status:
1 Select View, then Task List, and then Report.
The task lists assigned to you are displayed.
2 For Users and Groups, click the selection icon. Add the users whose status you wish to view to SelectedUsers, and then click OK.
The users displayed are those users who have access to the task lists.
3 For Select Task Lists, click the selection icon. Add the tasks to view to Selected Task Lists, and thenclick OK.
4 Click Go.
5 Click View, and then select one:
l By Status: Display a pie chart for task status, with an option to create a report.
l By Type: Display a pie chart for task type, with an option to create a report.
l By User: Display a bar chart for task users. No report option is available.
20 Working with Task Lists
6 Optional: Select options from the View menu to set up the report.
For example, you can select which columns are visible in the report by selecting View, thenColumns, and then Manage Columns. Then select columns to display, and click OK.
7 Click the Create Report button, and then click PDF or Excel for the report format.
8 In the dialog box that displays, click Open.
9 If you selected:
l PDF—Use the Acrobat toolbar for view and save options.
l Excel—Use Excel view and save options.
Using the Dashboard to View Task List StatusYou can use the task list dashboard to view a graphical representation of task list status. This letsyou better visualize task list status. Clicking on a section of the chart displays detailed informationabout that chart section in the grid displayed below the chart.
ä To use the dashboard to view task list status:
1 Select View, then Task List, and then Report.
The task lists assigned to you are displayed.
2 For Users and Groups, click the selection icon. Add the users whose status you wish to view to SelectedUsers, and then click OK.
The users displayed are those users who have access to the task lists.
3 For Select Task Lists, click the selection icon. Add the tasks to view to Selected Task Lists, and thenclick OK.
4 Click Go.
5 Click View, and then select a view option:
l By Status: Display a pie chart for task status, with an option to create a report.
l By Type: Display a pie chart for task type, with an option to create a report.
l By User: Display a bar chart for task users. No report option is available for this view.
6 Click a section of the chart to display details about that section in the grid below the chart. For example,in the By Status view, clicking Incomplete displays details about incomplete task lists.
In the By Status and By Type views, the grid below the chart displays columns for Task, TaskType, Status, Task Details, Due Date, Due Date Repeat, Alert Date, Alert Repeat, CompletedDate, Dependency, and Instructions.
The By User view shows information for Overdue, Incomplete, and Complete.
7 Optional: If you selected By Status or By Type in step 7, you can create a report. See “Reporting on TaskList Status” on page 20.
Using the Dashboard to View Task List Status 21

22 Working with Task Lists

3Working with Forms
In This Chapter
Selecting and Opening Forms ... . . . . . . . . . . . . . . . . . . . . . . . . . . . . . . . . . . . . . . . . . . . . . . . . . . . . . . . . . . . . . . . . . . . . . . . . .23
Opening Forms .. . . . . . . . . . . . . . . . . . . . . . . . . . . . . . . . . . . . . . . . . . . . . . . . . . . . . . . . . . . . . . . . . . . . . . . . . . . . . . . . . . . . . . . . . . .23
Searching for Forms ... . . . . . . . . . . . . . . . . . . . . . . . . . . . . . . . . . . . . . . . . . . . . . . . . . . . . . . . . . . . . . . . . . . . . . . . . . . . . . . . . . . . .24
Specifying Form Member and Alias Display Settings .. . . . . . . . . . . . . . . . . . . . . . . . . . . . . . . . . . . . . . . . . . . . . . . . .24
Specifying Member and Alias Display Settings for the Member Selector.. . . . . . . . . . . . . . . . . . . . . . . . . . . .24
Expanding Forms and the Data Entry Area .. . . . . . . . . . . . . . . . . . . . . . . . . . . . . . . . . . . . . . . . . . . . . . . . . . . . . . . . . . . .25
Setting Column Width ... . . . . . . . . . . . . . . . . . . . . . . . . . . . . . . . . . . . . . . . . . . . . . . . . . . . . . . . . . . . . . . . . . . . . . . . . . . . . . . . . . .25
Adjusting Row Height .. . . . . . . . . . . . . . . . . . . . . . . . . . . . . . . . . . . . . . . . . . . . . . . . . . . . . . . . . . . . . . . . . . . . . . . . . . . . . . . . . . . . .26
Hiding Rows or Columns Having No Data or Zeros ... . . . . . . . . . . . . . . . . . . . . . . . . . . . . . . . . . . . . . . . . . . . . . . . . . .26
Searching in Forms ... . . . . . . . . . . . . . . . . . . . . . . . . . . . . . . . . . . . . . . . . . . . . . . . . . . . . . . . . . . . . . . . . . . . . . . . . . . . . . . . . . . . . .27
Sorting Rows and Columns ... . . . . . . . . . . . . . . . . . . . . . . . . . . . . . . . . . . . . . . . . . . . . . . . . . . . . . . . . . . . . . . . . . . . . . . . . . . . .27
Filtering Rows and Columns ... . . . . . . . . . . . . . . . . . . . . . . . . . . . . . . . . . . . . . . . . . . . . . . . . . . . . . . . . . . . . . . . . . . . . . . . . . . .28
Showing Members in the Outline ... . . . . . . . . . . . . . . . . . . . . . . . . . . . . . . . . . . . . . . . . . . . . . . . . . . . . . . . . . . . . . . . . . . . . . .28
Viewing Instructions for Forms ... . . . . . . . . . . . . . . . . . . . . . . . . . . . . . . . . . . . . . . . . . . . . . . . . . . . . . . . . . . . . . . . . . . . . . . . . .29
Displaying Dimension Names on the Page ... . . . . . . . . . . . . . . . . . . . . . . . . . . . . . . . . . . . . . . . . . . . . . . . . . . . . . . . . . . .29
Viewing a Cell's Data History.. . . . . . . . . . . . . . . . . . . . . . . . . . . . . . . . . . . . . . . . . . . . . . . . . . . . . . . . . . . . . . . . . . . . . . . . . . . . .29
Navigating Among Forms... . . . . . . . . . . . . . . . . . . . . . . . . . . . . . . . . . . . . . . . . . . . . . . . . . . . . . . . . . . . . . . . . . . . . . . . . . . . . . . .30
Copying Versions... . . . . . . . . . . . . . . . . . . . . . . . . . . . . . . . . . . . . . . . . . . . . . . . . . . . . . . . . . . . . . . . . . . . . . . . . . . . . . . . . . . . . . . . .30
Launching Smart View from Planning ... . . . . . . . . . . . . . . . . . . . . . . . . . . . . . . . . . . . . . . . . . . . . . . . . . . . . . . . . . . . . . . . . .31
About Smart View Formatting in Planning Forms ... . . . . . . . . . . . . . . . . . . . . . . . . . . . . . . . . . . . . . . . . . . . . . . . . . . . .31
Using Predictive Planning ... . . . . . . . . . . . . . . . . . . . . . . . . . . . . . . . . . . . . . . . . . . . . . . . . . . . . . . . . . . . . . . . . . . . . . . . . . . . . . .32
Selecting and Opening FormsUse forms to enter, update, analyze, print, and report on data. If you close a form without savingchanges, a message is displayed. To proceed, respond to the message and save or refresh the data.
Note: Administrators can create messages to notify you if a form's members do not have data.
Opening Forms You can select forms on the page's left side.
Selecting and Opening Forms 23
ä To open forms:
1 To the left, expand Forms, and if necessary expand folders to access their contents.
2 Under Forms, click a folder name to display the form to open.
3 Click the form name in the right pane.
Searching for FormsIf you know a form's name, you can search for it in the view pane.
ä To search for forms:
1 In a form, click in the view pane.
See “Selecting and Opening Forms” on page 23.
2 In the menu bar, enter search criteria in the text box.
3 Click or to search up or down.
Forms that match your search criteria display in the content area.
Specifying Form Member and Alias Display SettingsAlthough your administrator can define them as application default settings, you can overridetheir settings and specify how to display alias and member names on individual forms.
ä To specify member and alias display options for forms:
1 Select Administration, and then select Manage Forms and ad hoc Grids, or expand Forms Folder, thenselect Forms.
2 Select the form, and then click .
3 Select Layout, click the member selector for a row or column, and then select the box for MemberName or Alias under Dimension Properties.
4 Click OK.
Specifying Member and Alias Display Settings for theMember Selector
ä To specify member and alias display options for the member selector:
1 Select Administration, and then select Manage Forms and ad hoc Grids, or expand Forms Folder, thenselect Forms.
2 Select the form, and then click .
24 Working with Forms
3 Select Layout, and then click the member selector for a row or column.
4 On the Member Selector, select a member, click , and then select the display option to use on theform. For example, to display just the alias for the member, select Alias.
5 Click OK.
Expanding Forms and the Data Entry Area You can expand forms and the data entry area—including the view pane—in several ways.
ä To expand forms and the data entry area:
1 Open a form.
2 Take an action:
l Expand: Double-click the thick black line between the row heading and the data cells.The row heading expands to accommodate the row heading.
l Resize: Click the view pane's right border, and then drag to resize it.
l Expand or collapse the view pane: Select View, then the View pane, click the ToggleView pane button in the toolbar, or drag the view pane to resize it.
Setting Column WidthAdministrators can set column width using settings on the Layout tab for forms. Column widthsettings apply to each form page:
l Small: Displays columns 50 pixels wide, enough for approximately seven decimal places.
l Medium: Displays columns 75 pixels wide, enough for approximately ten decimal places.
l Large: Displays columns 100 pixels wide, enough for approximately thirteen decimal places.
l Size-to-Fit: Automatically sizes the column width to fit the widest content in a heading ordata cell.
l Custom: You can enter a pixel width value of up to 999.
l Default: The column width is defined at the grid level.
If a column width is selected that is less than the width of the column contents, the excess datais hidden until the column is widened. While the data is hidden, it is stored and calculated inthe same way as displayed data.
You can adjust column width while viewing a form, regardless of the column width setting inthe form properties. To save the adjusted column width for the remainder of your session, saveor refresh the form.
When you print from the data entry page, the columns print at the width defined in preferences.
In forms, you can perform the tasks in the following table:
Expanding Forms and the Data Entry Area 25

Task Action
Resize column width Drag the column heading to the desired width.
Minimize column width Right-click a column heading, and then select Minimize, or double-click a column heading.
Restore a minimized column Right-click a minimized column heading, and then select Restore, or double-click a columnheading.
Restore all minimized columns Right-click a column heading, and then select Restore All.
Reset column width to the default setting Right-click a column heading, and then select Reset All to Default.
Adjusting Row HeightYou can specify row height on the Layout tab for form properties. Row height settings apply toeach form page:
l Size-to-Fit: Row headings fit in the displayed space
l Custom: Select a custom size in pixels for the row height
l Medium: Rows are displayed at a medium height.
l Default: Row height is defined at the grid level
If a row height is selected that is less than the height of the row contents, the excess data is hiddenuntil the row is adjusted. While the data is hidden, it is stored and calculated in the same way asdisplayed data.
You can drag row headings to adjust row height while viewing a form, regardless of the rowheight setting in the form properties. After you adjust the row, you can add a new line of text tothe row. To save the adjusted row height for the remainder of your session, save or refresh theform.
When you print from the data entry page, the rows print at the height defined in preferences.
Hiding Rows or Columns Having No Data or Zeros
ä To hide rows having no data or containing zeros:
1 Right-click a row member name, and then select Filter.
2 Then select:
l Hide rows with no data: to toggle between hiding and showing rows having no data(displayed as #MISSING or blank, depending on how your administrator set this formproperty). This option does not display if your administrator has set the form's propertyto Suppress Missing Data.
l Hide rows with zeros: to toggle between hiding and showing rows having zeros for values.
26 Working with Forms
l Hide rows with zeros and no data: to toggle between hiding and showing rows havingeither no data or zeros, or both.
3 To switch between showing and hiding rows, select the option again.
ä To hide columns having no data or containing zeros:
1 Right-click column member name, and then select Filter.
2 Then select:
l Hide columns with no data: to toggle between hiding and showing columns having nodata (displayed as #MISSING or blank, depending on how your administrator set thisform property). This option does not display if your administrator has set the form'sproperty to Suppress Missing Data.
l Hide columns with zeros and no data: to toggle between hiding and showing columnshaving either no data or zeros, or both.
3 To switch between showing and hiding columns, select the option again.
Searching in FormsTo navigate to a data cell or member name on a form, use the browser’s Find feature. Find doesnot search minimized columns. For example, if Qtr 1 is minimized, it does not find Feb. Findhighlights values that exactly match, but does not select the cell where the value is found. If youhave difficulty with Find, try clicking off the form before searching.
ä To find and select a data value or member in forms:
1 Open a form.
2 From the web browser, select Edit, and then Find on This Page, or press Ctrl+F.
3 In Find What, enter the value or part of the value to find.
Use the web browser’s Find feature to set the direction of the search, whole word match, orcapitalization match.
Sorting Rows and ColumnsYou can sort rows and columns to view data in ascending or descending order. You can sortwithin the hierarchy or across data.
ä To sort rows and columns:
1 Right-click a row or column member, select Sort, and then select an option:
l Sort Ascending: View information in ascending order, from lowest to highest.
l Sort Descending: View information in descending order, from highest to lowest.
Searching in Forms 27
l Honor Hierarchy: Sort within the hierarchy. If this option is not selected, sort works acrossdata.
2 To stop any sort operations in the form, click Cancel Sort.
Filtering Rows and ColumnsYou can filter rows and columns to select which rows or columns to display in the form. Filterscan keep or exclude members using simple functions that compare against a specified value.
ä To filter rows and columns:
1 Right-click a row or column member, select Filter, and then Filter.
2 In the left-most field in the Filter dialog box, select the filter type:
l Keep: to include rows or columns that meet the filter criteria
l Exclude: to exclude rows or columns that meet the filter criteria
3 In the middle field, select an option to set which values to keep or exclude:
l Equals
l Greater Than
l Greater Than or Equal To
l Less Than
l Less Than or Equal To
4 In the right-most field, enter the value to use for the filter.
5 Click Filter Row or Filter Column.
The form displays only those rows or columns that meet the filter criteria.
6 To cancel the filter, right-click a row or column member, and then select Cancel Filter.
Showing Members in the OutlineWhen you want more information about dimension members in a form, you can view membersin the outline.
ä To show members in the outline:
1 Right-click a row or column member, and then select Show member in outline.
2 To review more member properties, click Edit.
For detailed information about working with dimension members, see Oracle HyperionPlanning Administrator's Guide.
28 Working with Forms
Viewing Instructions for FormsYour administrator can include instructions to guide you in preparing budget data. Ifinstructions are available, a View link displays in the form's Instructions column.
ä To view instructions for a form:
1 Open a form that includes instructions.
2 Complete one of these tasks:
l Click .
l Select View from the menu, and then Instructions.
3 Click Close.
Displaying Dimension Names on the PageYou may find it helpful to display dimension names in front of Page drop-down lists.
ä To display dimension names in front of their members on Page drop-down lists:
1 From View, select Show Dimension Names on Page.
2 Because this menu item is a toggle, to turn off the display of dimension names on the page, selectView, and then select Show Dimension Names on Page again.
Viewing a Cell's Data HistoryIf an administrator has turned on auditing for Data (see Oracle Hyperion Planning Administrator'sGuide), you can view the data history of any numeric, date, or text cell to which you have at leastRead access.
ä To view a cell's data history:
1 In the cell, right-click.
2 Select Show Change History.
A read-only screen displays which users changed the cell's value, when, its previous value,and new value. You can sort the list by ascending or descending order.
Note: Planning does not display data values that are changed by executing business rules;instead, the executed business rule name is displayed.
Viewing Instructions for Forms 29
Navigating Among FormsYour administrator can set up forms so that you can invoke them from right-click (shortcut)menus. If you invoke such forms using right-click menus, you can navigate among them by:
l Clicking the hyperlinked form names at the top of the page. The links reflect your navigationflow (“breadcrumbs”). These “breadcrumb” features enable you to easily navigate from asource form to target forms and then back again, with their context intact. If you navigateto a form without using a right-click menu, the breadcrumbs flow is not displayed.
l Right-clicking and then selecting the form to move to.
Copying VersionsUse the Copy Version page to copy data from one bottom-up or target version of a selectedscenario to another bottom-up or target version within the same scenario. For example, you cancreate a Best Case version, and copy some or all the data in that version to a Worst Case versionto quickly create a starting point for the new version. If the administrator has set up a CopyVersion task, the task runs Copy Version on the current form.
You can copy between bottom-up and target versions. Consider:
l When you copy to a bottom-up version, only the selected level 0 members are copied.
l When you copy to a target version, all selected members are copied.
l To protect data in approved planning units, copying a version does not copy to approvedplanning units.
Note: To copy data successfully, when specifying the copy data criteria, you must select atleast one member for the Scenario, Account, Entity, Period, and Version dimensions.
ä To copy a version:
1 Perform a task:
l In a form, select Tools, and then Copy Version.
l If your administrator has set up a Copy Version task, select the task.
2 In the Scenario list, select the scenario to copy.
3 In the Copy From list, select the version from which to copy data.
4 In the Copy To list, select the version to which to copy data.
5 Click .
The entities for the selected version display in Available Entities.
6 In Available Entities, select the entities to which to copy data.
Available Entities displays the entities (planning units) to which you have write access andthat belong to you. You can copy entities with a Process Status of Not Started or First Pass.
7 Use the buttons to add one or multiple entities to Selected Entities.
30 Working with Forms
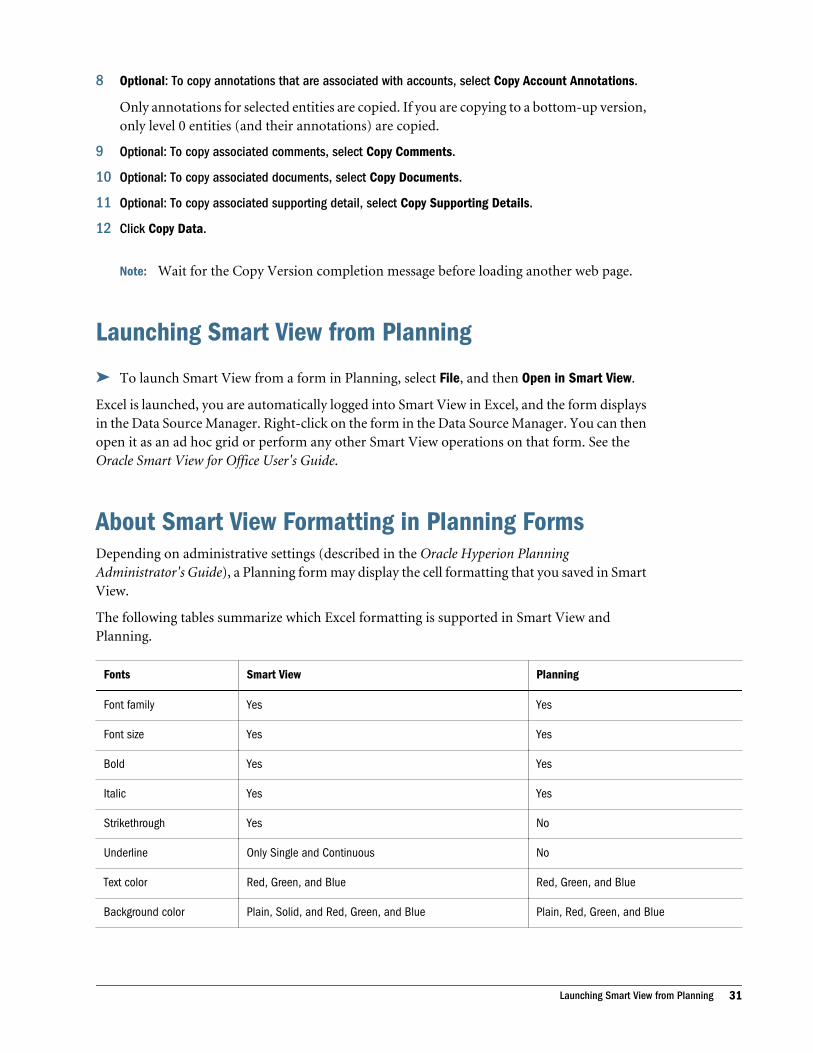
8 Optional: To copy annotations that are associated with accounts, select Copy Account Annotations.
Only annotations for selected entities are copied. If you are copying to a bottom-up version,only level 0 entities (and their annotations) are copied.
9 Optional: To copy associated comments, select Copy Comments.
10 Optional: To copy associated documents, select Copy Documents.
11 Optional: To copy associated supporting detail, select Copy Supporting Details.
12 Click Copy Data.
Note: Wait for the Copy Version completion message before loading another web page.
Launching Smart View from Planning
ä To launch Smart View from a form in Planning, select File, and then Open in Smart View.
Excel is launched, you are automatically logged into Smart View in Excel, and the form displaysin the Data Source Manager. Right-click on the form in the Data Source Manager. You can thenopen it as an ad hoc grid or perform any other Smart View operations on that form. See theOracle Smart View for Office User's Guide.
About Smart View Formatting in Planning FormsDepending on administrative settings (described in the Oracle Hyperion PlanningAdministrator's Guide), a Planning form may display the cell formatting that you saved in SmartView.
The following tables summarize which Excel formatting is supported in Smart View andPlanning.
Fonts Smart View Planning
Font family Yes Yes
Font size Yes Yes
Bold Yes Yes
Italic Yes Yes
Strikethrough Yes No
Underline Only Single and Continuous No
Text color Red, Green, and Blue Red, Green, and Blue
Background color Plain, Solid, and Red, Green, and Blue Plain, Red, Green, and Blue
Launching Smart View from Planning 31

Alignment Smart View Planning
Vertical Top, Center, and Bottom No
Horizontal Left, Center, and Right No
Indent Only Left Indent and five levels of indent No
Word wrap Yes No
Borders Formatting Smart View Planning
Border color Yes, can be set differently for each cell's four borders, and Red, Green, and Blue Yes
Border width Yes, in points Yes
Border style None, Solid, Double, Dotted, Dash, Dash-Dot, Dash-Dot-Dot None, Solid
Number and Dates Smart View Planning
Number format Decimal places, negative and positive suffixes, prefixes, and color, eight colors, Percentage, Scientificformat, presence of thousands separator
No
Date format Long and short dates, Hour, Minutes, Seconds, AM and PM No
Other Smart View Planning
Read-only Yes No
Column width and row height Yes, in points No
For more information on saving and applying cell formatting in Smart View, see the OracleSmart View for Office User's Guide.
Using Predictive PlanningWhen Predictive Planning is installed and a valid form (not an ad hoc grid) is loaded into SmartView, you can use the Predict item on the Planning menu or ribbon to predict performancebased on historical data. To use this feature, administrators must design forms as described inthe “Oracle Hyperion Planning Predictive Planning User's Guide”.
32 Working with Forms
4Working with Ad Hoc Grids
In This Chapter
About Ad Hoc Analysis .. . . . . . . . . . . . . . . . . . . . . . . . . . . . . . . . . . . . . . . . . . . . . . . . . . . . . . . . . . . . . . . . . . . . . . . . . . . . . . . . . . .33
Creating and Working With Ad Hoc Grids ... . . . . . . . . . . . . . . . . . . . . . . . . . . . . . . . . . . . . . . . . . . . . . . . . . . . . . . . . . . . . .34
Ad Hoc Grid Options ... . . . . . . . . . . . . . . . . . . . . . . . . . . . . . . . . . . . . . . . . . . . . . . . . . . . . . . . . . . . . . . . . . . . . . . . . . . . . . . . . . . . .38
About Ad Hoc Analysis
Subtopics
l Using Ad Hoc Grids
l Ad Hoc Roles
l Ad Hoc Grids in Smart View
Using Ad Hoc GridsWith ad hoc grids, users can create and personalize focused data slices that they frequently accessor that others can use. Users with the appropriate access permissions and who are granted theAd Hoc User role, can open ad hoc grids and dynamically change the data slice. If they have theAd Hoc Grid Creator role, users can save the ad hoc grid for their own or others' use (see “AdHoc Roles” on page 34). Ad hoc grids can be created and accessed in a similar ways fromPlanning and Smart View.
At their onset, ad hoc grids reflect the root dimensional layout of the form from which they arecreated. However, users are not confined by the form definition and can completely change thedata intersection and layout of ad hoc grids (assuming that they have access to the members).
Examples:
l Quickly review profit margins in your regions by customizing a grid to look the way youwant it to look
l Open an ad hoc grid that someone else created and change its definition: its members, whichaxis they display on, and so on
Ad hoc actions can also be performed from the root dimensions of the selected plan type, bothfrom the top menu or by right-clicking in forms. This flexibility enables users to start at the plantype's root level and then navigate to any location. Starting from a form enables users to startfrom the form's boundaries and navigate beyond or within its boundaries.
About Ad Hoc Analysis 33
Notes:
l Access permissions to ad hoc grids and their dimension members are honored, so users canview only grids and members to which they are granted Read or Write access.
l If the form from which the ad hoc grid is launched has row or column groupings, themembers are assumed in the ad hoc grid, but the groupings themselves are not.
See “Performing Ad Hoc Actions” on page 36.
Ad Hoc RolesAd hoc roles, set for Planning users in Oracle Hyperion Shared Services:
l Ad hoc User: Can open and personalize ad hoc grids but cannot save them. Ad hoc iconsand functionality are visible only to users with this role.
l Ad hoc Grid Creator: Can create and save ad hoc grids for their own and others' use. Userswith this role can also save over existing grids to which they have access.
Note: The form folders to which the ad hoc grids are saved can be assigned permissions thatenable others to use them.
Ad Hoc Grids in Smart ViewIn Smart View, users can analyze data using ad hoc grids that are created in Planning.
Creating and Working With Ad Hoc Grids
ä To complete ad hoc tasks:
1 Create an ad hoc grid, as described in “Creating Ad Hoc Grids” on page 34, or start ad hoc analysis,as described in “Starting Ad Hoc Analysis” on page 35.
2 Perform ad hoc actions, as described in “Performing Ad Hoc Actions” on page 36.
3 Save ad hoc grids, as described in “Saving Ad Hoc Grids” on page 37.
4 Exit ad hoc analysis, as described in “Exiting Ad Hoc Analysis” on page 37.
Creating Ad Hoc Grids
ä To create an ad hoc grid:
1 Select an action:
l Select Tools, then Ad hoc, and then New Ad Hoc Grid.
l Click New Ad Hoc Grid.
34 Working with Ad Hoc Grids
l Within a form, right-click, and then select New Ad Hoc Grid.
l In the view pane, select an existing ad hoc grid and then click Save.
In the view pane listing, ad hoc grids are denoted by .
2 In New Ad Hoc Grid, select a Plan Type, and then click .
The ad hoc grid is displayed in a new tab in the content area.
3 Perform ad hoc actions.
See “Performing Ad Hoc Actions” on page 36.
Note: Ad hoc grids are saved in form folders and display in the list of forms with the following
icon: .
Default Properties of New Ad Hoc GridsAd hoc grids start with the following properties:
l Dimension root members are selected.
l Account is on the row axis.
l Period and Year are on the column axis.
l Other dimensions in the application are on the page axis, where they are selectable from adrop-down list. (Ad hoc grids have no POV axis.)
l Dimension and member properties (for example, Data Type) are retained.
l Rows and column groupings are retained.
After opening an ad hoc grid, you can then change which members display, pivot the axis, andanalyze the data using ad hoc features (see “Performing Ad Hoc Actions” on page 36).
Note:
l Properties that users set are in effect only for the current session.
l The properties of the form from which the ad hoc grid is originally invoked are not retained.
Starting Ad Hoc Analysis
ä To start ad hoc analysis:
1 Select a form.
See “Selecting and Opening Forms” on page 23.
2 Select from the following:
l Select Tools, then Ad hoc, and then Analyze.
Creating and Working With Ad Hoc Grids 35
l Click Analyze.
l Within a form, right-click, and then select Analyze.
The ad hoc grid is displayed in a new tab in the content area.
3 Perform ad hoc actions.
See “Performing Ad Hoc Actions” on page 36.
Performing Ad Hoc Actions
ä To perform ad hoc actions:
1 Create an ad hoc grid, as described in “Creating Ad Hoc Grids” on page 34, or start ad hoc analysis,as described in “Starting Ad Hoc Analysis” on page 35.
2 Right-click a page or a row or column heading, select Ad hoc, and then select an ad hoc action:
l Pivot To: Moves a dimension to another area. For example, if you select this option withina row, you can move it to the Page axis or Column. You cannot pivot the last dimensionin a row or column.
l Move: Select an option to move a dimension Left, Right, Up, or Down. If an area has onlyone dimension, this option is unavailable.
l Zoom In: Select an option to display the levels below a member of a hierarchy. Forexample, you can select to display the Next level, All levels, or Bottom level children.
l Zoom Out: Displays the levels above a member of a hierarchy. For example, click amember and select Zoom Out to view the member's parents.
l Remove Only: Removes the selected dimension or members from the ad hoc grid. Morethan one member of the dimension must be present on the grid.
l Keep Only: Keeps only the selected members, and removes all other members from thedimension.
l Select Members: Launches the Member Selection dialog box to select members. SeeOracle Hyperion Planning Administrator's Guide.
l Change Alias: Displays a list of alias tables from which to select.
Note: You can control, at a global level, how ad hoc actions are performed or how the adhoc grids are displayed. See “Ad Hoc Grid Options” on page 38.
3 Optional: Save the ad hoc grid.
See “Saving Ad Hoc Grids” on page 37.
4 Exit ad hoc analysis.
See “Exiting Ad Hoc Analysis” on page 37.
36 Working with Ad Hoc Grids
Saving Ad Hoc Grids
ä To save an ad hoc grid:
1 Create an ad hoc grid, as described in “Creating Ad Hoc Grids” on page 34, or start ad hoc analysis,as described in “Starting Ad Hoc Analysis” on page 35.
2 Perform ad hoc actions, as described in “Performing Ad Hoc Actions” on page 36.
3 Take an action:
l Select Tools, then Ad hoc, and then Save Ad Hoc Grid.
l Click Save Ad Hoc Grid.
l Click Save in the screen's lower-right corner.
4 Enter a Name and Description for the grid.
If saving for the first time, you are prompted to select the Form folder in which to save thegrid.
Saved ad hoc grids are displayed in the view pane as a sibling of the forms. In the view pane
listing, ad hoc grids are denoted by .
Exiting Ad Hoc Analysis
ä To exit ad hoc analysis:
1 Create an ad hoc grid, as described in “Creating Ad Hoc Grids” on page 34, or start ad hoc analysis,as described in “Starting Ad Hoc Analysis” on page 35.
2 Perform ad hoc actions, as described in “Performing Ad Hoc Actions” on page 36.
3 Optional: Save the ad hoc grid as described in “Saving Ad Hoc Grids” on page 37.
4 Close the tab displaying the ad hoc grid.
Creating and Working With Ad Hoc Grids 37
Ad Hoc Grid Options
Subtopics
l Ad Hoc Options
l Suppress Options
l Precision Options
l Replacement Options
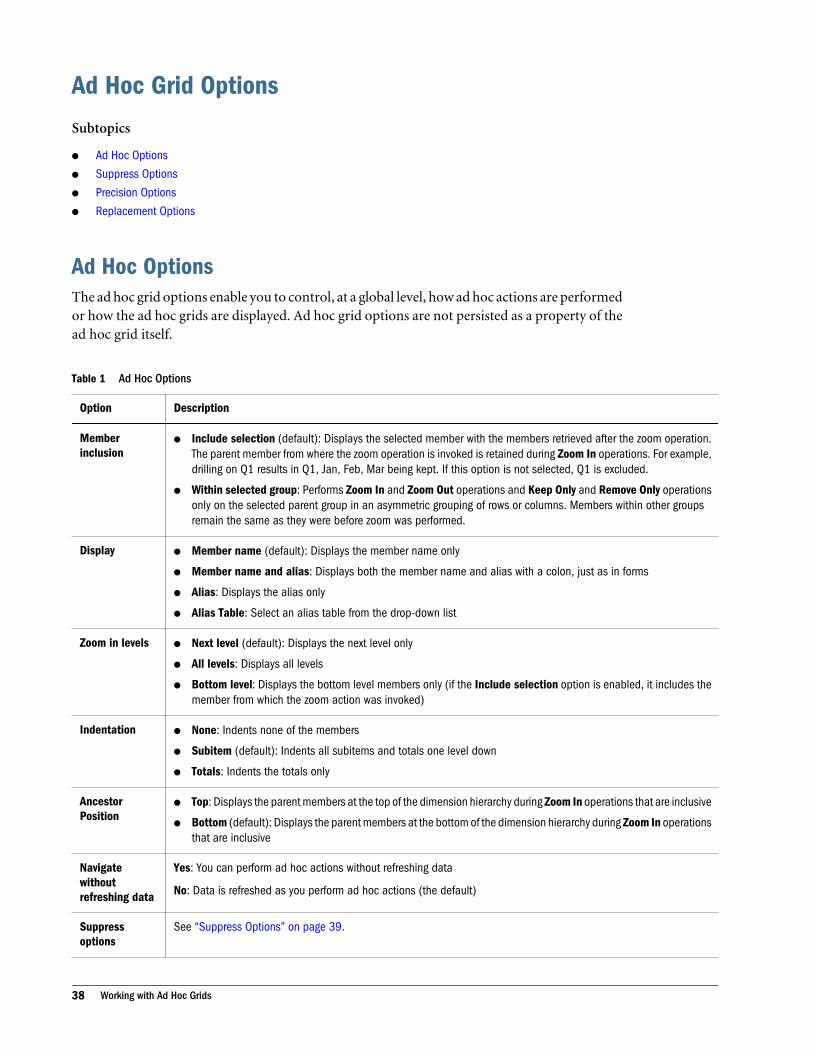
Ad Hoc OptionsThe ad hoc grid options enable you to control, at a global level, how ad hoc actions are performedor how the ad hoc grids are displayed. Ad hoc grid options are not persisted as a property of thead hoc grid itself.
Table 1 Ad Hoc Options
Option Description
Memberinclusion
l Include selection (default): Displays the selected member with the members retrieved after the zoom operation.The parent member from where the zoom operation is invoked is retained during Zoom In operations. For example,drilling on Q1 results in Q1, Jan, Feb, Mar being kept. If this option is not selected, Q1 is excluded.
l Within selected group: Performs Zoom In and Zoom Out operations and Keep Only and Remove Only operationsonly on the selected parent group in an asymmetric grouping of rows or columns. Members within other groupsremain the same as they were before zoom was performed.
Displayl Member name (default): Displays the member name only
l Member name and alias: Displays both the member name and alias with a colon, just as in forms
l Alias: Displays the alias only
l Alias Table: Select an alias table from the drop-down list
Zoom in levelsl Next level (default): Displays the next level only
l All levels: Displays all levels
l Bottom level: Displays the bottom level members only (if the Include selection option is enabled, it includes themember from which the zoom action was invoked)
Indentationl None: Indents none of the members
l Subitem (default): Indents all subitems and totals one level down
l Totals: Indents the totals only
AncestorPosition
l Top: Displays the parent members at the top of the dimension hierarchy during Zoom In operations that are inclusive
l Bottom (default): Displays the parent members at the bottom of the dimension hierarchy during Zoom In operationsthat are inclusive
Navigatewithoutrefreshing data
Yes: You can perform ad hoc actions without refreshing data
No: Data is refreshed as you perform ad hoc actions (the default)
Suppressoptions
See “Suppress Options” on page 39.
38 Working with Ad Hoc Grids
Option Description
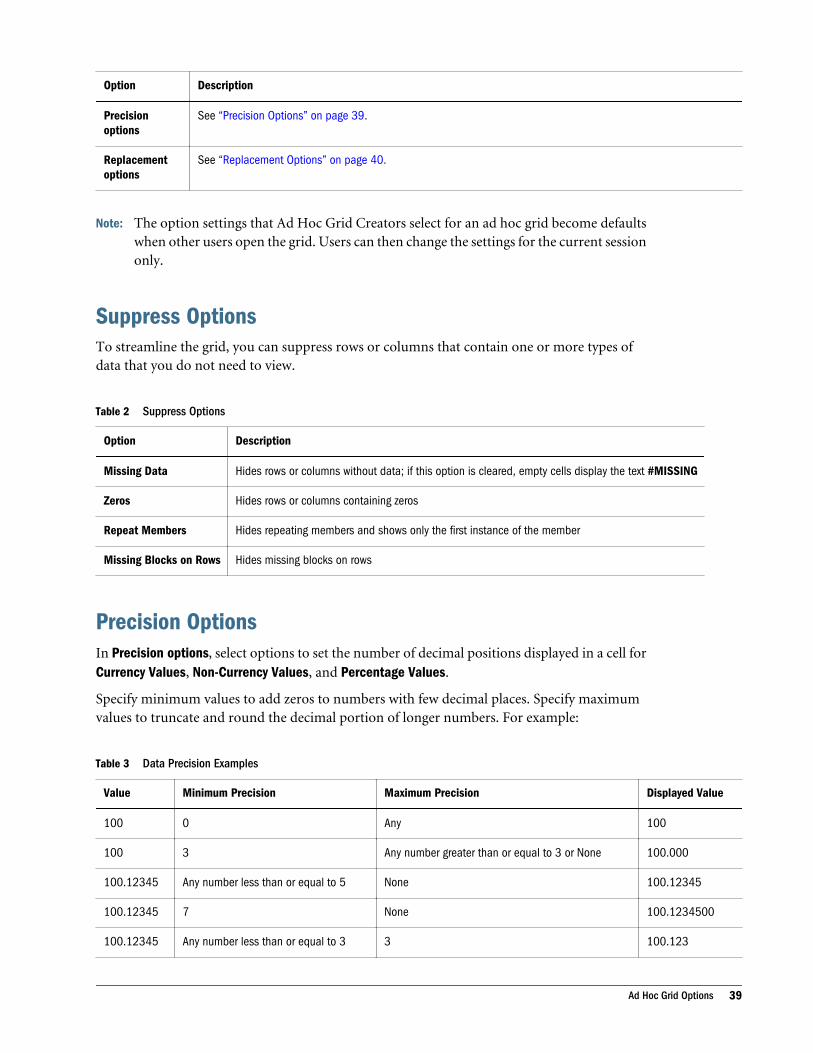
Precisionoptions
See “Precision Options” on page 39.
Replacementoptions
See “Replacement Options” on page 40.
Note: The option settings that Ad Hoc Grid Creators select for an ad hoc grid become defaultswhen other users open the grid. Users can then change the settings for the current sessiononly.
Suppress OptionsTo streamline the grid, you can suppress rows or columns that contain one or more types ofdata that you do not need to view.
Table 2 Suppress Options
Option Description
Missing Data Hides rows or columns without data; if this option is cleared, empty cells display the text #MISSING
Zeros Hides rows or columns containing zeros
Repeat Members Hides repeating members and shows only the first instance of the member
Missing Blocks on Rows Hides missing blocks on rows
Precision OptionsIn Precision options, select options to set the number of decimal positions displayed in a cell forCurrency Values, Non-Currency Values, and Percentage Values.
Specify minimum values to add zeros to numbers with few decimal places. Specify maximumvalues to truncate and round the decimal portion of longer numbers. For example:
Table 3 Data Precision Examples
Value Minimum Precision Maximum Precision Displayed Value
100 0 Any 100
100 3 Any number greater than or equal to 3 or None 100.000
100.12345 Any number less than or equal to 5 None 100.12345
100.12345 7 None 100.1234500
100.12345 Any number less than or equal to 3 3 100.123
Ad Hoc Grid Options 39
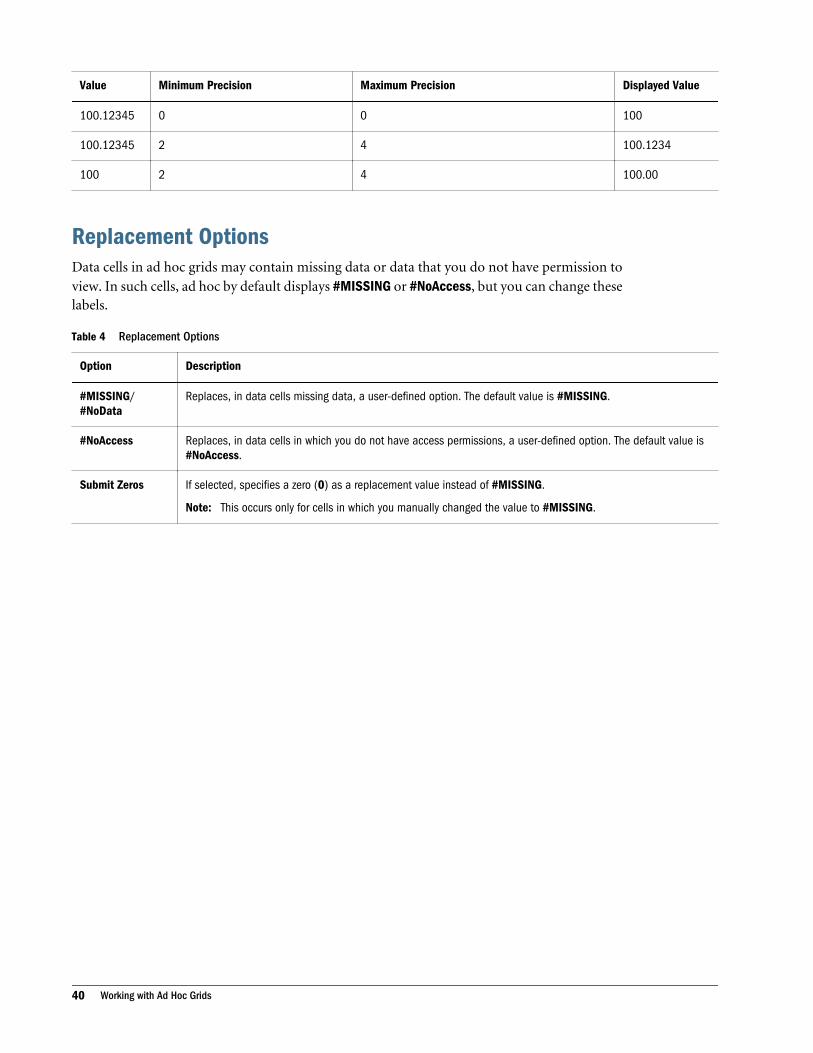
Value Minimum Precision Maximum Precision Displayed Value
100.12345 0 0 100
100.12345 2 4 100.1234
100 2 4 100.00
Replacement OptionsData cells in ad hoc grids may contain missing data or data that you do not have permission toview. In such cells, ad hoc by default displays #MISSING or #NoAccess, but you can change theselabels.
Table 4 Replacement Options
Option Description
#MISSING/#NoData
Replaces, in data cells missing data, a user-defined option. The default value is #MISSING.
#NoAccess Replaces, in data cells in which you do not have access permissions, a user-defined option. The default value is#NoAccess.
Submit Zeros If selected, specifies a zero (0) as a replacement value instead of #MISSING.
Note: This occurs only for cells in which you manually changed the value to #MISSING.
40 Working with Ad Hoc Grids
5Entering Data
In This Chapter
About Entering Data ... . . . . . . . . . . . . . . . . . . . . . . . . . . . . . . . . . . . . . . . . . . . . . . . . . . . . . . . . . . . . . . . . . . . . . . . . . . . . . . . . . . . .42
About Entering Data with Shortcut Menus... . . . . . . . . . . . . . . . . . . . . . . . . . . . . . . . . . . . . . . . . . . . . . . . . . . . . . . . . . . . .45
Navigating in Forms... . . . . . . . . . . . . . . . . . . . . . . . . . . . . . . . . . . . . . . . . . . . . . . . . . . . . . . . . . . . . . . . . . . . . . . . . . . . . . . . . . . . . .46
Selecting Members Using Pages ... . . . . . . . . . . . . . . . . . . . . . . . . . . . . . . . . . . . . . . . . . . . . . . . . . . . . . . . . . . . . . . . . . . . . . .46
Searching for Members... . . . . . . . . . . . . . . . . . . . . . . . . . . . . . . . . . . . . . . . . . . . . . . . . . . . . . . . . . . . . . . . . . . . . . . . . . . . . . . . . .47
Viewing Member Formulas .. . . . . . . . . . . . . . . . . . . . . . . . . . . . . . . . . . . . . . . . . . . . . . . . . . . . . . . . . . . . . . . . . . . . . . . . . . . . . .47
Viewing and Resolving Data Validation Errors.. . . . . . . . . . . . . . . . . . . . . . . . . . . . . . . . . . . . . . . . . . . . . . . . . . . . . . . . . .47
Selecting Cell Ranges ... . . . . . . . . . . . . . . . . . . . . . . . . . . . . . . . . . . . . . . . . . . . . . . . . . . . . . . . . . . . . . . . . . . . . . . . . . . . . . . . . . .48
Copying and Pasting Data... . . . . . . . . . . . . . . . . . . . . . . . . . . . . . . . . . . . . . . . . . . . . . . . . . . . . . . . . . . . . . . . . . . . . . . . . . . . . . .48
Copying and Pasting Data Between Microsoft Excel and Planning Forms ... . . . . . . . . . . . . . . . . . . . . . . . . .50
About Cell Comments ... . . . . . . . . . . . . . . . . . . . . . . . . . . . . . . . . . . . . . . . . . . . . . . . . . . . . . . . . . . . . . . . . . . . . . . . . . . . . . . . . . .50
Working with Comments... . . . . . . . . . . . . . . . . . . . . . . . . . . . . . . . . . . . . . . . . . . . . . . . . . . . . . . . . . . . . . . . . . . . . . . . . . . . . . . . .51
Printing Comments... . . . . . . . . . . . . . . . . . . . . . . . . . . . . . . . . . . . . . . . . . . . . . . . . . . . . . . . . . . . . . . . . . . . . . . . . . . . . . . . . . . . . . .52
Using Account Annotations and Custom Links ... . . . . . . . . . . . . . . . . . . . . . . . . . . . . . . . . . . . . . . . . . . . . . . . . . . . . . . .52
Adding, Editing, and Viewing Cell-Level Documents .. . . . . . . . . . . . . . . . . . . . . . . . . . . . . . . . . . . . . . . . . . . . . . . . . .53
Writing #MISSING Values ... . . . . . . . . . . . . . . . . . . . . . . . . . . . . . . . . . . . . . . . . . . . . . . . . . . . . . . . . . . . . . . . . . . . . . . . . . . . . . .54
Subtotaling Values ... . . . . . . . . . . . . . . . . . . . . . . . . . . . . . . . . . . . . . . . . . . . . . . . . . . . . . . . . . . . . . . . . . . . . . . . . . . . . . . . . . . . . . .54
Getting the Latest Data... . . . . . . . . . . . . . . . . . . . . . . . . . . . . . . . . . . . . . . . . . . . . . . . . . . . . . . . . . . . . . . . . . . . . . . . . . . . . . . . . .55
Exporting Data to Microsoft Excel .. . . . . . . . . . . . . . . . . . . . . . . . . . . . . . . . . . . . . . . . . . . . . . . . . . . . . . . . . . . . . . . . . . . . . . .55
Drilling Through to Source Data ... . . . . . . . . . . . . . . . . . . . . . . . . . . . . . . . . . . . . . . . . . . . . . . . . . . . . . . . . . . . . . . . . . . . . . . .56
Saving Data ... . . . . . . . . . . . . . . . . . . . . . . . . . . . . . . . . . . . . . . . . . . . . . . . . . . . . . . . . . . . . . . . . . . . . . . . . . . . . . . . . . . . . . . . . . . . . .56
After Entering Data... . . . . . . . . . . . . . . . . . . . . . . . . . . . . . . . . . . . . . . . . . . . . . . . . . . . . . . . . . . . . . . . . . . . . . . . . . . . . . . . . . . . . . .56
Printing Data .. . . . . . . . . . . . . . . . . . . . . . . . . . . . . . . . . . . . . . . . . . . . . . . . . . . . . . . . . . . . . . . . . . . . . . . . . . . . . . . . . . . . . . . . . . . . . .57
41
About Entering Data
Subtopics
l Colors in Forms
l Aspects of Forms
l Entering Data with Smart Lists
l Entering Data with Shortcut Menus
l Entering Percentage Values
l Entering Date Values
l Entering Text Values
l Dynamically Setting User Variables
Your administrator sets up forms to show certain dimensions and members, reflected by therow and column headings. Cells display the data for the selected members.
Colors in FormsBackground colors indicate:
l White: default
l Yellow: “dirty” cells, whose values changed but are not yet saved
l Grayish blue: read-only cells
l Tan: locked cells (see “Locking Cells” on page 72)
l Teal: cells having supporting detail
Aspects of FormsForms can include:
l Point of View (POV): Shows information about other members that are valid for the definedrow and column members. POVs identify the database members that populate a form, anddefine data intersections. Members on the rows, columns, and POV axes are constant (exceptwhen they have dynamic user variables).
l Page axis: At the top of the form, displays different views (pages) of selected membercombinations that can span dimensions, enabling you to work with various membercombinations.
l Segments: Can include read-only or hidden areas and borders on rows and columns. Thehierarchy can be suppressed for rows or columns, so that rows are not indented and columnsexclude line breaks.
l Smart Lists: Lists from which you can select text options, such as locations or descriptions.See “Entering Data with Smart Lists” on page 43.
42 Entering Data

l Menus: Shortcut menus accessed by right-clicking that can open features such as URLs,forms, Approvals, Copy Version, Job Console, and business rules. See “Entering Data withShortcut Menus” on page 43.
l User variables: Selectable members on the row, column, page axis, or POV. Before you canopen a form having a user variable, you must select a value in preferences. After that, youcan change the variable on the form or in preferences. See “Dynamically Setting UserVariables” on page 45.
l Rolling forecast: If the administrator has designed a form for a rolling forecast, right-clickon the column to change substitution variables for the rolling forecast.
l Data validation rules: If the administrator sets up data validation rules, a Data ValidationMessages pane displays information to help resolve data entry issues. See “Viewing andResolving Data Validation Errors” on page 47.
l Composite forms: Display members from several forms simultaneously so you can, forexample, enter data into one grid and see the results—such as Total Revenue—aggregatedin another.
Entering Data with Smart ListsYour administrator can set up forms with Smart Lists that help you enter data in cells. If a cell
contains a dimension that is linked to a Smart List, is displayed when you click in the cell.
ä To enter data with Smart Lists:
1 Open a form containing Smart Lists.
2 Click in a cell.
3 Select a value from the list.
Note: You can skip to a value by typing its first one or two letters. For example, in a list ofmonths, skip to June by typing ju.
After you select a value, the information in the cell is updated. Your administratordetermines what is displayed when the cell contains no data: no value, #MISSING, None,or another value.
Entering Data with Shortcut MenusYour administrator can set up forms that include shortcut menus. With shortcut menus, youright-click a member and select a menu item to open features such as URLs, forms, Approvals,Job Console, Copy Version, or business rules. For example, a menu item might open anotherform to get more information about the data, go to another scenario and version in the planningunit, launch a calculation, or open other features.
About Entering Data 43
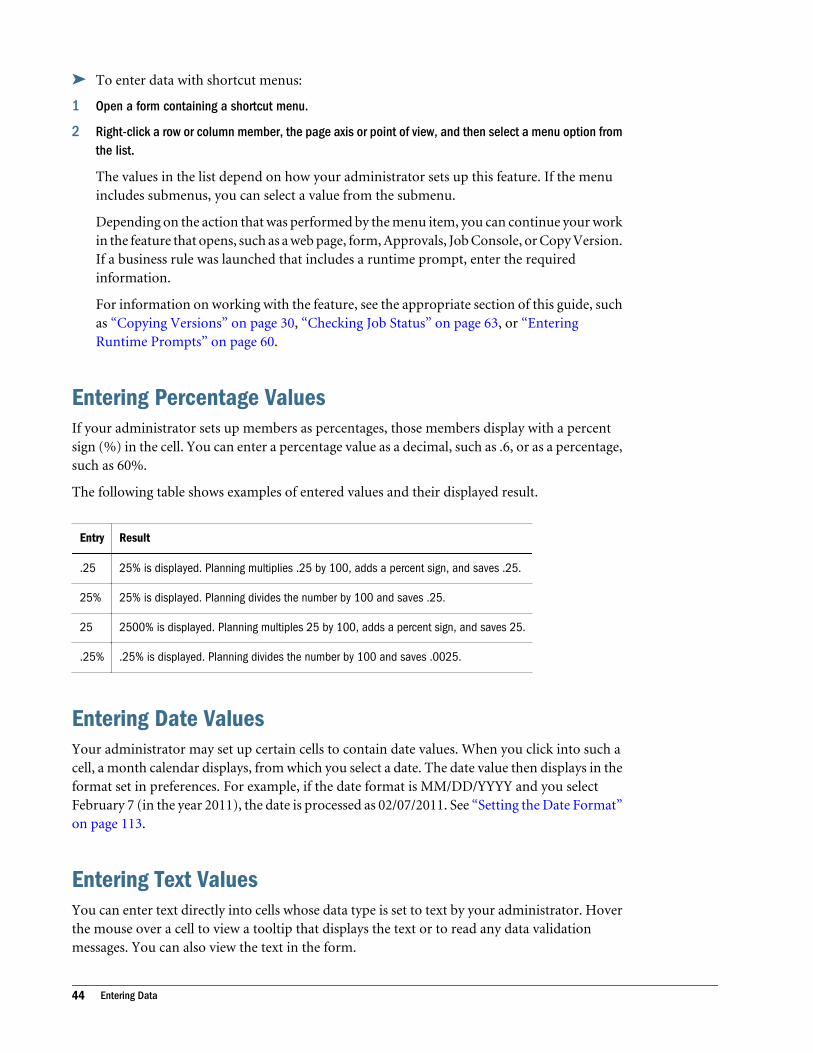
ä To enter data with shortcut menus:
1 Open a form containing a shortcut menu.
2 Right-click a row or column member, the page axis or point of view, and then select a menu option fromthe list.
The values in the list depend on how your administrator sets up this feature. If the menuincludes submenus, you can select a value from the submenu.
Depending on the action that was performed by the menu item, you can continue your workin the feature that opens, such as a web page, form, Approvals, Job Console, or Copy Version.If a business rule was launched that includes a runtime prompt, enter the requiredinformation.
For information on working with the feature, see the appropriate section of this guide, suchas “Copying Versions” on page 30, “Checking Job Status” on page 63, or “EnteringRuntime Prompts” on page 60.
Entering Percentage ValuesIf your administrator sets up members as percentages, those members display with a percentsign (%) in the cell. You can enter a percentage value as a decimal, such as .6, or as a percentage,such as 60%.
The following table shows examples of entered values and their displayed result.
Entry Result
.25 25% is displayed. Planning multiplies .25 by 100, adds a percent sign, and saves .25.
25% 25% is displayed. Planning divides the number by 100 and saves .25.
25 2500% is displayed. Planning multiples 25 by 100, adds a percent sign, and saves 25.
.25% .25% is displayed. Planning divides the number by 100 and saves .0025.
Entering Date ValuesYour administrator may set up certain cells to contain date values. When you click into such acell, a month calendar displays, from which you select a date. The date value then displays in theformat set in preferences. For example, if the date format is MM/DD/YYYY and you selectFebruary 7 (in the year 2011), the date is processed as 02/07/2011. See “Setting the Date Format”on page 113.
Entering Text Values You can enter text directly into cells whose data type is set to text by your administrator. Hoverthe mouse over a cell to view a tooltip that displays the text or to read any data validationmessages. You can also view the text in the form.
44 Entering Data
Note: When you enter text in cells whose data type is text, do not use angle brackets < or >.
Dynamically Setting User VariablesIf the administrator defined a form with at least one user variable and enabled dynamic uservariables, you can dynamically select and change user variable values directly in the form. Forexample, for a variable called Department, you can select Sales members to plan sales expensesand then select Marketing members to plan marketing expenses. You can also set values for uservariables in user preferences (see “Setting Preferences for User Variables” on page 115).
If the form was defined with the Use Context option, user variables can be used in the POV. Withthis setting, the value of the user variable changes dynamically based on the context of the form.
Note: You must select a value for user variables before working in the form.
ä To dynamically change values for user variables in forms:
1 Open a form containing a user variable and for which dynamic user variables are enabled.
2 Click the text that displays the user variable.
The variable and its currently selected value display under the POV. If the form was definedwith the Use Context option, the variable displays above the form.
3 Select members:
l To select, click .
l To remove, click .
l To remove all, click .
l To move a member in the list, click or .
4 Click Submit.
The form displays the selected members.
About Entering Data with Shortcut MenusWhen entering data in forms, you can right-click to use context-sensitive shortcut menus.
l For information about using shortcut menus, see “Navigating in Planning” on page 14 and“About Entering Data with Shortcut Menus” on page 45.
l For information about the tasks you can complete with shortcut menus, see Chapter 3,“Working with Forms”.
About Entering Data with Shortcut Menus 45

Navigating in FormsHow you navigate depends on whether you have just clicked in a cell or are editing cell data. Forexample, when you click in a cell, you can press the Right Arrow to move to the next cell in therow. When you are editing data in a cell, you must press Tab to move to the next cell.
When clicking in a cell and not entering or editing cell data, to move:
l Forward, backward, up, or down, press the Right Arrow, Left Arrow, Up Arrow, or DownArrow key.
l To the next cell in the column, press Enter.
l To the previous cell in the column, press Shift + Enter.
When entering or editing data in cells, to move:
l Forward or backward within the cell data, press the Left Arrow key or the Right Arrow key.
l To the next cell in the row, press Tab or click in the next cell.
l To the previous cell in the row, press Shift + Tab.
l To the next cell in the column, press Enter.
l To the previous cell in the column, press Shift + Enter.
See also “Navigating Among Forms” on page 30.
Selecting Members Using PagesIf the administrator sets up multiple page axes, you can select from among pages to select thedata with which to work. The form designer can create up to 18 page drop-down lists.
Use the page axis to work with different views (pages) of selected member combinations thatcan span dimensions. The members defined on the rows, columns, and POV axes are constant(except when they have dynamic user variables). You see only the members to which you areassigned access.
With some forms, you can also select a user variable to determine which data is displayed. See“Dynamically Setting User Variables” on page 45.
ä To work with other page members:
1 Open a form containing multiple page axes.
2 From the Page drop-down list, select a page.
indicates that the search facility is available. See “Enabling Search with a Large Numberof Pages” on page 111.
3 Click Go.
46 Entering Data

Tip: On Preferences, select Display Options, and then select Remember Selected PageMembers. Planning remembers the last page or POV member selection, so theinformation is available when you return to the current form.
Searching for MembersIf you select the display preference option Allow Search When Number of Pages Exceeds __ andthe number of members on the open form exceeds the number you set, then the Search icon isenabled. (See “Enabling Search with a Large Number of Pages” on page 111.)
ä To search for a member in a form:
1 Open a form, and then click at the top of the form.
2 In Search, enter part or all of the member name.
You can search by member name or alias. If the selected member in the drop-down list isthe first member of the hierarchy and you search up, the search starts from the last memberof the hierarchy. Similarly, if the selected member is the last member in the hierarchy, thesearch starts with the first member.
3 Click or to search up or down the hierarchy.
4 When the member name displays in the drop-down list, click .
Viewing Member Formulas
ä To view a member's formula:
1 In the form, click the formula icon to the right of the member name.
2 View the read-only member formula, and then click Close.
Viewing and Resolving Data Validation ErrorsFor forms that include data validation, your administrator can include data validation messagesthat display when you hover over a cell, and can specify colors that display in cells when datavalidation errors occur. For example, a tooltip can instruct you to enter data that meets certaincriteria or data that fits within a specific range.
If forms contain data validation errors, a Data Validation Messages pane displays on the rightside of the form. For detailed information on how rules are set up and processed, see OracleHyperion Planning Administrator's Guide.
ä To view and resolve data validation errors:
1 In a form that contains data validation errors, click on the right side of the form.
Searching for Members 47
2 In the Data Validation Messages pane, view any informational messages and error messages provided.
For composite forms, select a form from the drop-down list.
Informational messages are displayed as hyperlinks. You can click the message to go to theappropriate location in the form.
Error messages are displayed with a bracketed number showing the number of errors, andhyperlinked numbers that go to the cells with errors. For example, if an error message
displays , there are five errors related to this issue, and the following hyperlinks
go to the errors.
3 For each error, click the hyperlink to go to the cell that needs to be corrected.
If the administrator provided a data validation message, you can hover the mouse over cellsto view information to assist with resolving the error.
4 Update the form as necessary to resolve the errors, and then save the form.
After an error is resolved, it no longer displays in the Data Validation Messages pane. Whenall errors are resolved, the Data Validation Messages pane is not displayed in the form.
Selecting Cell RangesYou can select and work with multiple cells if the selection is rectangular and contiguous.
ä To select a cell range, a row, or a column:
1 Open a form.
2 Take an action:
l To select a cell range, click in the range's upper-left cell, press Shift, and then click inthe range's lower-right cell.
l To select a row or column, click in its heading.
After you select a group of cells, you can copy and paste them or adjust the data values. See:
l “Copying and Pasting Data” on page 48
l “Adjusting Cell Values” on page 65
Copying and Pasting DataYou can copy data within a form, from one form to another, or from another application, suchas Microsoft Excel. (For information on copying and pasting data between Microsoft Excel andPlanning forms, see “Copying and Pasting Data Between Microsoft Excel and Planning Forms”on page 50.) In one copy and paste operation, you can copy from one cell to another cell, fromone cell to many cells, or from many cells to many cells.
48 Entering Data

Note: Because Planning applies spreading logic to pasted values, understand how data valuesare spread before you paste values into time periods. See “How Spreading Data Works”on page 68.
ä To copy and paste data:
1 Select the cells that contain the data to copy.
See “Selecting Cell Ranges” on page 48.
2 Right-click, select Edit, and then select an option:
l Cut to remove the cell values
l Copy to copy the cell values. Select the cells to which to paste the data. Right-click, andthen select Paste.
Paste inserts the Clipboard contents at the insertion point, replacing any selection.
l Clear to clear the cell values
About copying and pasting data:
l If the destination selected area is an exact multiple of the size and shape of the copied selectedarea, the data is repeatedly pasted into the destination area. For example, if you copy thecontents of two rows, and select six rows to paste the data into, Planning copies the contentsof the two rows three times, to fill the six destination rows.
l Planning does not paste data into read-only cells.
l Planning copies and pastes cells' stored values, not the values that are displayed based onthe precision setting.
l When pasting data to time periods, Planning applies the spreading rules for each cell insuccession, starting from left to right and top to bottom. The resulting data from a pasteoperation may not match the original copied data. For information on how pasting datamay affect cells' values, see “How Spreading Data Works” on page 68.
l When you copy data, a message may display if you disabled Internet Explorer’s setting forAllow Paste Operations via Script.
l Copying and pasting data from a text editor (for example, TextPad, Notepad, or WordPad)fails if the data is space delimited. Use Tab-delimited values instead.
l For information on copying and pasting data between Microsoft Excel and Planning forms,see “Copying and Pasting Data Between Microsoft Excel and Planning Forms” on page50.
The following features are supported only in the Internet Explorer browser:
l Copying data from Planning forms and pasting it into Microsoft Excel
l Copying data from one Planning form to another
l Copying and pasting nonnumeric data, for example, Smart List, Date, and Text data types
Copying and Pasting Data 49
Copying and Pasting Data Between Microsoft Excel andPlanning Forms
ä To copy and paste data from Microsoft Excel to Planning forms:
1 In Microsoft Excel, highlight the data in a single cell or a range of cells and press Ctrl+C to copy thedata onto the clipboard.
2 Highlight and select the target cell or cells in the Planning form, and press Ctrl+V.
3 When the Clipboard helper displays, press Ctrl+V again. The data is pasted to the Clipboard helper.
4 Click Paste to paste the data into the Planning form.
Note: Data that is copied and pasted from Microsoft Excel to Planning reflects the formattingthat is set up in Microsoft Excel. For example, if the number of decimal places in MicrosoftExcel is set to zero, when you enter the value 459.123 in Microsoft Excel, the value isdisplayed as 459. If you copy this value into a Planning form, the value 459 is pasted.
About Cell CommentsUsers with write access permissions to cells can add comments to cells, for example, explanationsof variances or rolling forecasts. Multiple users can add comments to the same cells.
Users can view the cell's comments history, including:
l All the comments
l Who entered each comment
l The date each comment was made
You can add comments:
l To a range of cells
l To cells at any level, including summary periods and non-level 0 members (bottom-upversions)
l Across multiple dimensions
l To calculated cells (dynamic calc) and read-only cells
You can also:
l Sort comments by user or date.
l View comments in a PDF file or a printed report. See “Printing Comments” on page 52.
l Delete your own comments, but you cannot change already-submitted comments, nor canyou change others' comments.
l Use supporting detail to build and communicate bottom-up values such as travel, where youcalculate aggregate values. See “Working with Supporting Detail” on page 77.
50 Entering Data

l Add account annotations to comment on account data. You can annotate differentcombinations of scenarios, versions, and entities. See “Using Account Annotations andCustom Links” on page 52.
l Enter text directly into cells whose data type is set to text (see “Entering Text Values ” onpage 44).
l Add multiple cell-level document attachments (see “Adding, Editing, and Viewing Cell-Level Documents ” on page 53.)
See “Working with Comments” on page 51.
Working with CommentsSee also “About Cell Comments” on page 50.
ä To add, view, or delete comments:
1 Open the form to which you want to add or view comments.
2 Click a cell or select a range of contiguous cells.
A small square in the cell's upper-right corner indicates that it contains comments. Hoveringover the red square displays the cell's intersecting members and whether the cell(s) containscomments (or drill-through data or document attachments).
3 Right-click, and then select Comments.
The top of the Comments dialog box displays the POV and the cell member intersection. Theselected cells are displayed in the drop-down list. If you selected a range, from the drop-down list, select one cell. Alternately, to apply the comment to the range of cells from Step2, select the Apply to all selected cells check box.
4 To add a comment:
a. Expand the Insert Comments pane by clicking to the left of the Insert Commentsheading.
b. Enter your comment.
By default, you can enter up to 1,500 characters. If you selected a cell range, you canenter comments for each cell. To begin a new line of text within a cell comment, pressShift+Enter.
c. Click Add.
You may need to scroll down to see the Add button.
5 To edit a comment:
a. Expand the Existing Comments pane.
b. Select the comment to edit.
c. Expand the Insert Comments pane.
d. Add to or edit the comment text and click Add.
Working with Comments 51
In the comment table, you now see the modified comment with your name and a newdate stamp.
6 To delete one of your previously-submitted comments, select the row from the table, and then clickDelete.
7 Click OK.
Printing CommentsYou can print comments—notes that are associated with individual or groups of cells—to a PDFfile. When you print forms with the Show Comments option selected in the Printing Options page,comments are displayed to the dimension's right, on the same row as the dimension. See“Printing Data ” on page 57.
ä To print comments:
1 Open a form containing comments.
2 Select File, and then Print.
3 Select the Show Comments option, and then click Print Preview.
4 In the PDF file, select File, and then Print.
5 In Print, select a printer and then click OK.
Using Account Annotations and Custom LinksIf your administrator has enabled this feature, you can add annotations to accounts. Annotationscan be plain text, or can include custom links to, for example, a project website, a spreadsheet,or PDF file on a server.
ä To add or view account annotations:
1 In a form, select View, and then either View Account Annotations or Edit Account Annotations.
2 In account rows, in the column to the right of account member names, enter a comment or URL of upto 1,500 characters.
You can include custom links to these file types on a server or FTP site: TXT, DOC, XLS(Microsoft Office Suite), and PDF. For example, to create a link to a spreadsheet on a sharedserver, you might enter: file://C:/BudgetDocs/Timeline.xls where C represents theserver drive.
3 When you are finished, click View Account Annotation.
To view account comments or to access associated custom links on the page, read the commentsor click the URL to the right of the account member's name. If you click a URL, your web browserdisplays the source information in a new window.
52 Entering Data

Adding, Editing, and Viewing Cell-Level Documents If your administrator selects the Enable Cell-Level Document property for the form, from formcells, you can add, delete, and view multiple EPM Workspace documents, even in a single cell.These documents can be a website or any file type (for example, an XLS file). For example, youcould associate a cell with several documents with updated assumptions behind the cell's sales
data. The icon in a cell indicates that it is associated with a document.
Note: Before you add a cell-level document, the document must be added to the EPMWorkspace repository. See Oracle Hyperion Enterprise Performance ManagementWorkspace User's Guide.
ä To add cell-level documents:
1 Open the form to which you want to add or view comments.
2 Select the cell or range of cells.
A small square in the cell's upper-right corner indicates that it contains cell-level documents(or drill-through data or comments). Hovering over the square displays the cell's intersectingmembers and the comments.
3 Right-click, and then select Document Attachments.
The top of the Document Attachments dialog box displays the POV and the cell memberintersection. The selected cells are displayed in the drop-down list. If you selected a range,from the drop-down list, select one cell. Alternately, to apply the document attachment tothe range of cells from Step 2, select the Apply to all selected cells check box.
4 Click the Document Attachments icon.
5 In the Document Attachments dialog, enter the Description and the Reference.
Either:
l In the Reference text box, enter the URL to the document (for example, http://mymachine:<port>/documents/Sales.doc).
l Click to browse to the file's location.
Specify the Name, Type, and Version of the document.
See Oracle Hyperion Enterprise Performance Management Workspace User's Guide forspecifics.
6 To edit a document attachment, select the row in the table, and then click the Edit icon.
To delete a document attachment, select the row in the table, and then click the Delete icon.
7 Click OK.
ä To view documents associated with a cell:
1 Select a cell or range of cells.
Adding, Editing, and Viewing Cell-Level Documents 53
2 Click near the lower-right corner of the cell.
The website or file is launched.
Writing #MISSING Values#MISSING in a cell indicates the cell contains no data, whereas zero in a cell is a data value.#MISSING decreases the database size and improves performance.
You can replace #MISSING by selecting the cell and typing a value. You can also replace irrelevantdata in a cell and save the cell as #MISSING, which writes #MISSING to the database.
ä To write #MISSING to cells:
1 Select the cells to change.
You can select a range of contiguous cells by clicking in the upper-left cell in the range, andthen pressing Shift + click to select the lower-right cell in the range. You can select rows andcolumns by clicking row and column headings. Select a range of rows or columns by usingShift + click.
If the designer sets a form to suppress missing data, and an entire row contains #MISSING(no data), that row does not display on the form.
2 Take an action:
l Press Delete.
l Enter #missing.
You can also enter #MISSING using Smart Lists. See “Entering Data with Smart Lists” onpage 43.
3 Click Save.
The cells are set to #MISSING when you save the form.
Subtotaling ValuesHow values are subtotaled and totalled in forms:
l Member subtotals are calculated based on factors set by your administrator, such as thehierarchies and logic of the outline, and member properties.
l To recalculate subtotals on the page, click Save. If the Calculate Form business rule selectedto launch during Save, all subtotals in the form are recalculated based on their members’aggregation properties and the form’s design and layout.
l Saving data automatically calculates members that are set to dynamically calculate, excludinglevel 0 members. The form does not require a business rule to calculate these members.
l Calculations are based on the stored (not the displayed) values. Displayed values might bebased on scaling or precision settings.
54 Entering Data

l Only displayed members are calculated. If you have read but not write access to somemembers, subtotals correctly include their values even if they are read-only.
See also “Adjusting Cell Values” on page 65 and “How Spreading Data Works” on page68.
Getting the Latest DataTo ensure that you are working with the latest data, especially if other people are working onthe same budget, refresh data. To retrieve the latest values from the database, open a form, selectView, and then Refresh.
Exporting Data to Microsoft ExcelExporting data from the form to Microsoft Excel lets you explore “what-if” scenarios in Excelbefore copying and pasting values back to Planning. It also provides an alternative to PDFprinting.
About exporting data:
l Planning does not export to Excel: numerical formatting, the application name, user, formfolder, attributes, currency tags, or percentages.
l Member names are indented based on their level in the hierarchy. They are also indented ifyou print the form to a PDF file.
l Supporting detail is printed.
l Aliases are displayed on the rows, columns, page, and POV if they are present for a member,if your Service Administrator or administrator selected the Display Alias option.
l Values pasted back to Planning from Excel must be non-formatted data.
ä To export data from forms to Microsoft Excel:
1 Open a form.
2 Select Tools, and then Export as Spreadsheet.
3 Depending on how you want to export the data, take an action:
l Select Save, and then save the file.
l Select Open, and then work with the data in the browser instance of Microsoft Excel thatdisplays.
Use standard Excel procedures to make and save your changes.
Getting the Latest Data 55
Drilling Through to Source DataData is loaded from a source using Oracle Hyperion Financial Data Quality Management orOracle Hyperion Financial Data Quality Management, Enterprise Edition. You can drill throughto view details of the data source.
When working with forms that contain drill-through information, keep in mind that formulticurrency applications, all currencies for an entity in the source system can be loaded.Exchange rate conversions are done within Planning.
ä To drill through to source data:
1 Open a form containing source data loaded using FDM or FDMEE.
A triangle in the cell's upper-right corner indicates that it contains drillable data (orcomments or cell-level documents).
2 Click twice in a cell that contains drill-through data.
A drill-through icon is displayed above and to the right of the cell.
3 Click the icon.
The source information displays on a tab in EPM Workspace for Oracle Hyperion FinancialData Quality Management, Enterprise Edition, or in a new browser window for OracleHyperion Financial Data Quality Management.
4 When you finish viewing the source, you can return to the form by closing the EPM Workspace tab orbrowser window.
Saving DataIn a form, you can save data values you entered, changed, or calculated. Saving also runs businessrules that are designed to launch when the form is saved.
ä To save data:
1 Open a form.
2 In the form, make your changes.
3 Select File, and then Save.
If you close a form without saving changes, a message prompts you to save or refresh the data.
After Entering DataAfter you enter data, annotate your assumptions, and are satisfied with your plan’s data, youcan promote your numbers (as a planning unit) to another user, typically for review or approval.To do this, go to the Manage Approvals page, and start or promote the planning unit. After youpromote a planning unit, its new owner can write to it (assuming the owner has write access),
56 Entering Data

but you can no longer write to the planning unit. See “Managing Planning Units” on page85.
Printing Data You can print data in forms as PDF files (including supporting detail, comments, and accountannotations) if Adobe Acrobat Reader 5.0 or later is installed on your computer. Youradministrator can also set up reports with custom shading, page size, orientation, font, font size,headers, percentage of page used for headers, number of data columns per page, and precision.
See “Printing Comments” on page 52 and “Printing Planning Unit Annotations” on page 101.
ä To print data to a PDF file:
1 With a form open, select File, and then Print.
2 Optional: To reset the printing options to the settings that were assigned to the form when it was created,click Restore Form Settings.
3 Optional: Set your preferences, as described in the following table.
Option Action
Format data Apply number format settings from the form.
Apply precision Apply the form’s precision settings to the displayed data. If the form displays high precision numbers(numbers with many digits to the right of the decimal point), consider limiting precision in the PDFfile.
Include supporting detail Include supporting detail in extra rows. Select either:
l Normal Order: inserts the supporting detail in the same order in which it displays in the SupportingDetail page, after the member that it is associated with.
l Reverse Order: inserts the supporting detail before the member it is associated with, and thesupporting detail entries are reversed. Supporting detail for children displays above their parents,and the order of siblings is preserved.
Show accountannotations
If the form designer enables account annotations, show annotations that are assigned to the form.
Show comments Show comments that are associated with cells.
Show attribute members Show attribute members assigned to the form.
Show currency codes Show currency codes if the form supports multiple currencies per entity.
4 Optional: To save your settings for subsequent PDF files, select Remember my changes.
Your settings override the default options assigned to all forms.
5 Optional: To display the PDF onscreen, click Print Preview.
6 Select File, and then Print.
7 Set print options, and then click OK.
Printing Data 57

58 Entering Data
6Working With Business Rules
In This Chapter
About Launching Business Rules... . . . . . . . . . . . . . . . . . . . . . . . . . . . . . . . . . . . . . . . . . . . . . . . . . . . . . . . . . . . . . . . . . . . . . .59
Launching Business Rules ... . . . . . . . . . . . . . . . . . . . . . . . . . . . . . . . . . . . . . . . . . . . . . . . . . . . . . . . . . . . . . . . . . . . . . . . . . . . . .60
Entering Runtime Prompts ... . . . . . . . . . . . . . . . . . . . . . . . . . . . . . . . . . . . . . . . . . . . . . . . . . . . . . . . . . . . . . . . . . . . . . . . . . . . . .60
Runtime Prompts and Approvals .. . . . . . . . . . . . . . . . . . . . . . . . . . . . . . . . . . . . . . . . . . . . . . . . . . . . . . . . . . . . . . . . . . . . . . . .62
Using Business Rules... . . . . . . . . . . . . . . . . . . . . . . . . . . . . . . . . . . . . . . . . . . . . . . . . . . . . . . . . . . . . . . . . . . . . . . . . . . . . . . . . . . .62
Checking Job Status ... . . . . . . . . . . . . . . . . . . . . . . . . . . . . . . . . . . . . . . . . . . . . . . . . . . . . . . . . . . . . . . . . . . . . . . . . . . . . . . . . . . . .63
About Launching Business RulesYou can use business rules to calculate data. Some business rules prompt you to enterinformation, called a runtime prompt. After you enter required information and launch abusiness rule, the data is updated.
Your administrator can set up forms to automatically launch business rules when you open orsave forms. You can also launch business rules from several contexts.
ä To launch a business rule:
1 Depending on where you are working:
l When a form is open, its associated business rules are listed in the left bottom pane.Double-click any business rule.
l With a form open, from the top menu, select Tools, and then Business Rules. Select thebusiness rules to launch, and then click Launch.
l If menus are set up in a form, right-click a row or column member in the form, andthen select a business rule from the shortcut menu. See “Entering Data with ShortcutMenus” on page 43.
l From a task list, see Chapter 2, “Working with Task Lists.”
l Outside of forms, from the menu, select Tools, and then Business Rules.
See “Launching Business Rules” on page 60.
2 If the business rule includes runtime prompts, enter the required information, launch the business rule,and then click Close (see “Entering Runtime Prompts” on page 60).
If the calculation is successful, the values in the database reflect the calculation results.
About Launching Business Rules 59
3 Click Refresh to see the updated values in the form.
Launching Business Rules
ä To launch business rules from the Tools menu:
1 Select Tools, and then Business Rules.
2 On the Business Rules page, select the plan types for which you want to display the associated businessrules.
3 From Rule Type, select whether to display rules, rulesets, calc scripts, or all calculation types.
To view the business rules in rulesets, expand the hierarchy. Business rules are displayed inthis format:
rule_name application_name plan_type
where application_name plan_type indicate the application and the plan type to which thebusiness rule is deployed and will be launched against.
4 Optional: By default, only calculations to which you have access are displayed. To display all calculationsassociated with the selected plan type, clear the option Display only launchable rules, rulesets, andcalc scripts.
5 Click the Launch link for the business rule, ruleset, or calculation script you want to launch.
None indicates that you do not have access to a business rule.
The launched calculation may include runtime prompts. See “Entering Runtime Prompts”on page 60.
See also “About Launching Business Rules” on page 59.
Entering Runtime PromptsWhen launched, a business rule can prompt you to enter variable information, called a runtimeprompt. The business rule designer sets up runtime prompts. To learn how the display and valuesof runtime prompts are affected by certain settings and conditions, see “Understanding RuntimePrompts” in Oracle Hyperion Planning Administrator's Guide.
Notes:
l If a business rule has a runtime prompt and Use Members on Forms is selected, the defaultmember on the runtime prompt window matches the current member in the page or POVaxes of the open form.
l Members and substitution variables on the Member Selection page are filtered by your accesspermissions and limitations set for the runtime prompt (for example, only Descendants ofQ1). You cannot select a shared member in a runtime prompt.
l If multiple business rules having runtime prompts are launched when saving the form, entervalues for each one successively, using the Next button.
60 Working With Business Rules
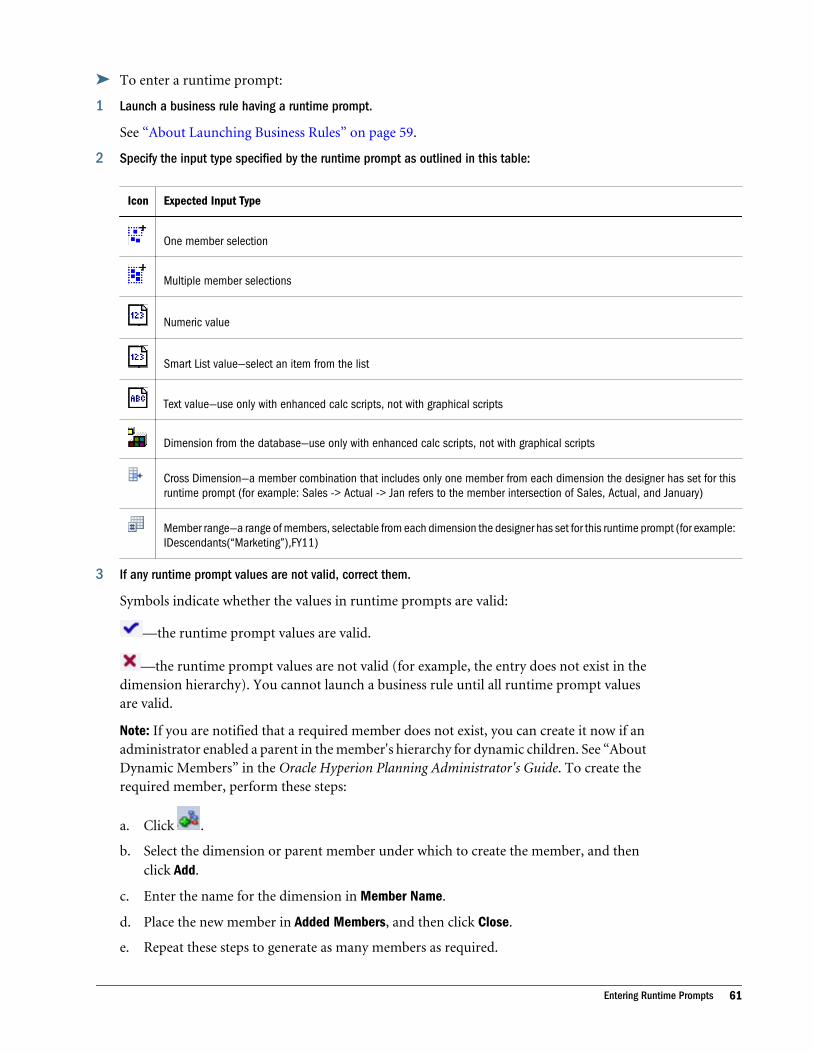
ä To enter a runtime prompt:
1 Launch a business rule having a runtime prompt.
See “About Launching Business Rules” on page 59.
2 Specify the input type specified by the runtime prompt as outlined in this table:
Icon Expected Input Type
One member selection
Multiple member selections
Numeric value
Smart List value—select an item from the list
Text value—use only with enhanced calc scripts, not with graphical scripts
Dimension from the database—use only with enhanced calc scripts, not with graphical scripts
Cross Dimension—a member combination that includes only one member from each dimension the designer has set for thisruntime prompt (for example: Sales -> Actual -> Jan refers to the member intersection of Sales, Actual, and January)
Member range—a range of members, selectable from each dimension the designer has set for this runtime prompt (for example:IDescendants(“Marketing”),FY11)
3 If any runtime prompt values are not valid, correct them.
Symbols indicate whether the values in runtime prompts are valid:
—the runtime prompt values are valid.
—the runtime prompt values are not valid (for example, the entry does not exist in thedimension hierarchy). You cannot launch a business rule until all runtime prompt valuesare valid.
Note: If you are notified that a required member does not exist, you can create it now if anadministrator enabled a parent in the member's hierarchy for dynamic children. See “AboutDynamic Members” in the Oracle Hyperion Planning Administrator's Guide. To create therequired member, perform these steps:
a. Click .
b. Select the dimension or parent member under which to create the member, and thenclick Add.
c. Enter the name for the dimension in Member Name.
d. Place the new member in Added Members, and then click Close.
e. Repeat these steps to generate as many members as required.
Entering Runtime Prompts 61
4 Optional: To generate a file containing the runtime prompt values, select Create runtime prompt valuesfile.
The file is saved as rule_name.XML, in the EPM_ORACLE_INSTANCE/planning/Planning1/RTP/user_name folder. Administrators specify this generated file whenlaunching business rules with the CalcMgrCmdLineLauncher.cmd utility (see the OracleHyperion Planning Administrator's Guide).
5 Click Launch.
If the calculation is successful, the values in the database reflect the calculation results. Seealso “Checking Job Status” on page 63.
If you are using an Oracle Essbase substitution variable as the runtime prompt value and thevalue of that substitution variable is outside of the variable limits, the limits are ignored, and therule launches successfully.
Runtime Prompts and ApprovalsDepending on how the administrator has designed a business rule, to be able to execute a businessrule, planners must have write access to all members selected in runtime prompts and own theaffected planning units members. For example, a business rule can be designed such that if youhave already promoted a planning unit containing entity A, you cannot change the data for Ausing a runtime prompt. Runtime prompts display only members to which you have access.
Using Business RulesYou can work with business rules if your task includes them.
ä To launch a business rule when tasks include forms:
1 In a task that includes a form, open the form.
See Chapter 2, “Working with Task Lists.”
2 Select Tools, and then Business Rules.
3 In Launch Business Rules, select a business rule, and then click Launch.
If the calculation is successful, the database values reflect the calculation results. See also“Checking Job Status” on page 63.
4 After a confirmation message displays in Launch Business Rules, click Close.
ä To launch a business rule when tasks include business rules:
1 Open a task list that includes a business rule.
If more than one task list is assigned to you, select the task list from the quick-launch list. Ifthe task includes a business rule, the business rule page opens in a browser window.
2 In the Business Rules area, select a business rule, and then click Launch.
62 Working With Business Rules
If the calculation is successful, the values in the database reflect the calculation results.
3 After a message confirms that the rule launched successfully, close the browser window.
Checking Job StatusOn the Job Console page, you can check the status (processing, completed, completed withthreshold violation, and error) of these job types: Business Rules, Ruleset, Sequence, Clear CellDetails, Copy Data, and Push Data.
Notes:
l You cannot cancel or start a job from the Job Console page.
l Administrators can view all jobs and their status. All other users can view only their ownjobs and their status.
ä To check the execution status of jobs:
1 Perform a task:
l Select Tools, and then Job Console.
l Open Job Console type task.
This job information is displayed:
l Job ID: The sequential number that the database generates for each started job.
l Job Type: Business Rule, Ruleset, Clear Cell Details, Copy Data, or Push Data.
l Job Name: The business rule, sequence, or ruleset's name. To expand rulesets to see thebusiness rules and rulesets they include, click . Planning automatically assigns a nameto Clear Cell Details and Copy Data operations.
l User Name: The name of the user who launched the job.
l Start Time: When the job was started.
l End Time: If the job was completed or ended in an error, the time the job ended.
l Run Status: Current job state such as Processing or Completed.
Note: Use the Completed with Threshold Violations status to identify jobs that ransuccessfully, but that came close to exceeding the recommended performancethresholds. See “Monitoring and Optimizing Application Integrity andPerformance” in Administering Planning for Oracle Planning and Budgeting CloudService.
When viewing job status from a task list, information is displayed for the current user.
2 To filter which jobs are displayed, specify any of the following:
l Start Time—When jobs were run. Click to specify the day, month, year, and time.
Checking Job Status 63
l End Time—The date by which jobs were completed. Click to specify the day, month,year, and time.
l Job Type—The kind of job performed or the artifact involved, such as Ruleset, Push Dataor Copy Decision Packages.
l Status— The current state of jobs such as Processing or Completed.
Use the Completed with Threshold Violations status to filter for jobs that ran successfully,but do not comply to the recommended performance thresholds. See “Monitoring andOptimizing Application Performance” in the PlanningAdministrator's Guide.
l Job Name—Job name
l User—The ID of the user who submitted the job
3 Click .
The Job Console displays the jobs matching your selection criteria.
4 To view this job information, under Run Status, click the links to the log files:
l For Clear Comments: the dimensional intersection of the cleared details
l For Copy Data: the dimensional intersection for the copied data
l Cell-level Document: the dimensional intersection for the cleared documents
l For business rules and rulesets: the application, plan type, and runtime values. If therule generated an error, a text box displays the error.
Note: Information on rulesets display as expandable hierarchies, and status is displayedindividually for each embedded rule and ruleset as they are processed.
Tip: For administrators only: Because checking for runtime values for many users consumessystem resources, to improve performance, you can turn off this function by selectingAdministration, then Application, then Properties, then Application Properties tab, addingthe property CAPTURE_RTP_ON_JOB_CONSOLE, and then setting its value to FALSE.See Oracle Hyperion Planning Administrator's Guide.
5 Optional: For administrators only: To remove selected jobs from the list and to remove their job recordsfrom the database, click Delete.
You cannot delete jobs that are processing, only jobs that are completed or have errors.
To remove all jobs from the list and remove their job records from the database, select thecheck box left of the header Job ID.
64 Working With Business Rules

7Adjusting and Spreading Data
In This Chapter
Adjusting Cell Values ... . . . . . . . . . . . . . . . . . . . . . . . . . . . . . . . . . . . . . . . . . . . . . . . . . . . . . . . . . . . . . . . . . . . . . . . . . . . . . . . . . . .65
Spreading Data for Time Periods ... . . . . . . . . . . . . . . . . . . . . . . . . . . . . . . . . . . . . . . . . . . . . . . . . . . . . . . . . . . . . . . . . . . . . . .67
Spreading Values Using Grid Spread ... . . . . . . . . . . . . . . . . . . . . . . . . . . . . . . . . . . . . . . . . . . . . . . . . . . . . . . . . . . . . . . . . .73
Spreading Values Using Mass Allocations... . . . . . . . . . . . . . . . . . . . . . . . . . . . . . . . . . . . . . . . . . . . . . . . . . . . . . . . . . . . .74
Adjusting Cell Values
Subtopics
l Adjusting Values
l Performing “What If” Analysis
You can increase or decrease values by a specific amount or by a percentage. You can also enteroperators in a cell (see “Adjusting Values ” on page 65 and “Performing “What If” Analysis”on page 66).
Adjusting Values
ä To increase or decrease data values:
1 Select the cells to adjust.
You can adjust data for multiple cells simultaneously, if the writable cells are at the samelevel. For example, you can adjust the data for February and March simultaneously, but notfor March and Q1. See “Selecting Cell Ranges” on page 48.
2 Select Edit, and then Adjust.
3 Perform an action:
l To increase or decrease values by a specified amount, from Adjust Data, select ByValue, select Increase by or Decrease by, and then enter the value to spread.
l To increase or decrease values by a percentage, from Adjust Data, select By Percentage,select Increase by or Decrease by, and then enter the percent value.
You must enter a numeric value.
Adjusting Cell Values 65
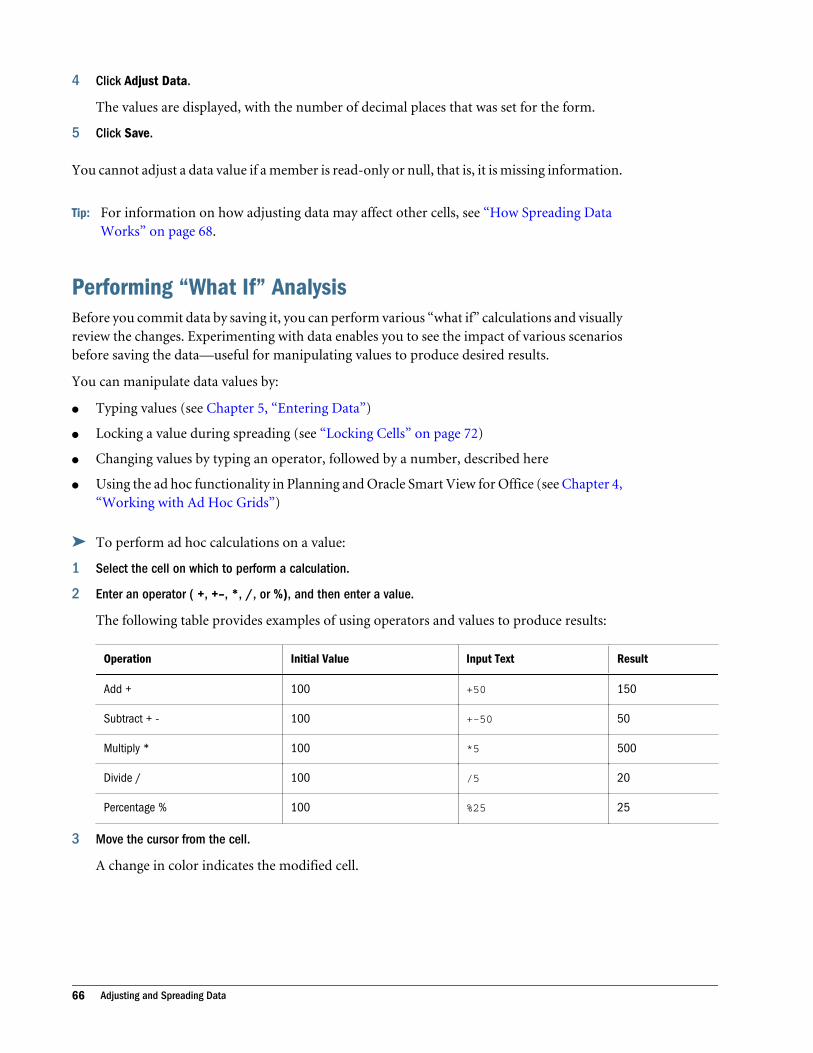
4 Click Adjust Data.
The values are displayed, with the number of decimal places that was set for the form.
5 Click Save.
You cannot adjust a data value if a member is read-only or null, that is, it is missing information.
Tip: For information on how adjusting data may affect other cells, see “How Spreading DataWorks” on page 68.
Performing “What If” AnalysisBefore you commit data by saving it, you can perform various “what if” calculations and visuallyreview the changes. Experimenting with data enables you to see the impact of various scenariosbefore saving the data—useful for manipulating values to produce desired results.
You can manipulate data values by:
l Typing values (see Chapter 5, “Entering Data”)
l Locking a value during spreading (see “Locking Cells” on page 72)
l Changing values by typing an operator, followed by a number, described here
l Using the ad hoc functionality in Planning and Oracle Smart View for Office (see Chapter 4,“Working with Ad Hoc Grids”)
ä To perform ad hoc calculations on a value:
1 Select the cell on which to perform a calculation.
2 Enter an operator ( +, +–, *, /, or %), and then enter a value.
The following table provides examples of using operators and values to produce results:
Operation Initial Value Input Text Result
Add + 100 +50 150
Subtract + - 100 +-50 50
Multiply * 100 *5 500
Divide / 100 /5 20
Percentage % 100 %25 25
3 Move the cursor from the cell.
A change in color indicates the modified cell.
66 Adjusting and Spreading Data
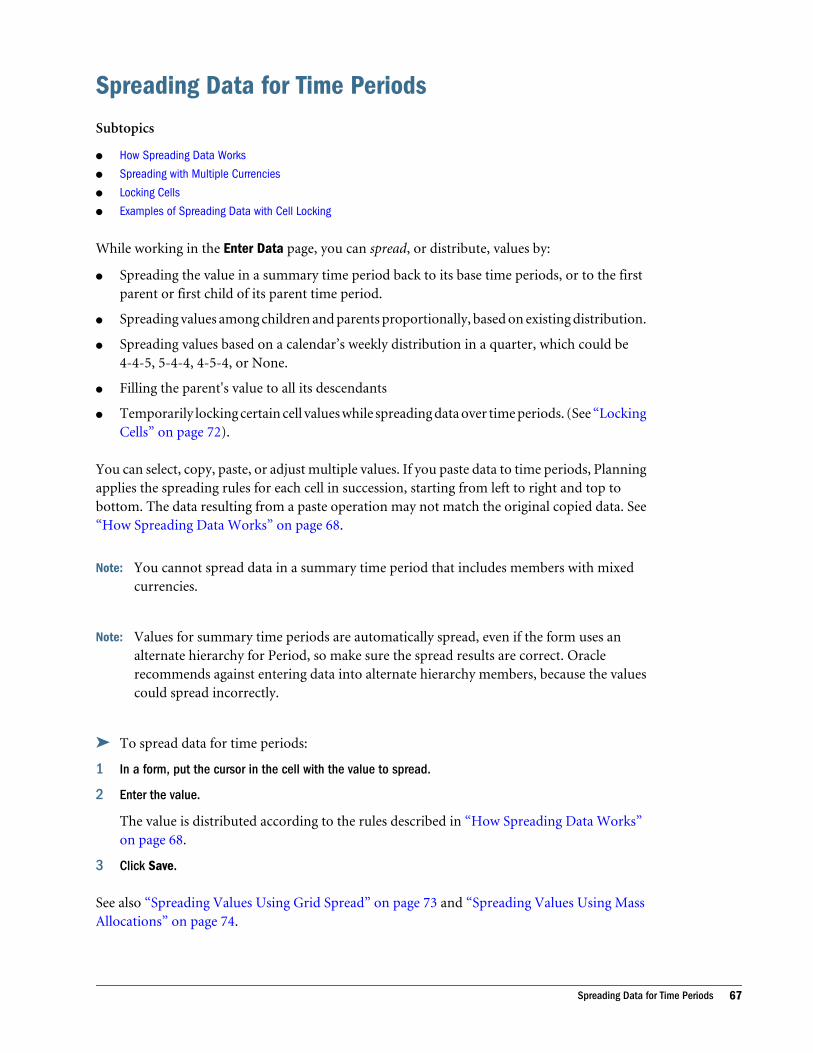
Spreading Data for Time Periods
Subtopics
l How Spreading Data Works
l Spreading with Multiple Currencies
l Locking Cells
l Examples of Spreading Data with Cell Locking
While working in the Enter Data page, you can spread, or distribute, values by:
l Spreading the value in a summary time period back to its base time periods, or to the firstparent or first child of its parent time period.
l Spreading values among children and parents proportionally, based on existing distribution.
l Spreading values based on a calendar’s weekly distribution in a quarter, which could be4-4-5, 5-4-4, 4-5-4, or None.
l Filling the parent's value to all its descendants
l Temporarily locking certain cell values while spreading data over time periods. (See “LockingCells” on page 72).
You can select, copy, paste, or adjust multiple values. If you paste data to time periods, Planningapplies the spreading rules for each cell in succession, starting from left to right and top tobottom. The data resulting from a paste operation may not match the original copied data. See“How Spreading Data Works” on page 68.
Note: You cannot spread data in a summary time period that includes members with mixedcurrencies.
Note: Values for summary time periods are automatically spread, even if the form uses analternate hierarchy for Period, so make sure the spread results are correct. Oraclerecommends against entering data into alternate hierarchy members, because the valuescould spread incorrectly.
ä To spread data for time periods:
1 In a form, put the cursor in the cell with the value to spread.
2 Enter the value.
The value is distributed according to the rules described in “How Spreading Data Works”on page 68.
3 Click Save.
See also “Spreading Values Using Grid Spread” on page 73 and “Spreading Values Using MassAllocations” on page 74.
Spreading Data for Time Periods 67

How Spreading Data WorksFactors such as account type, the Time Balance property, existing distribution, memberhierarchies, and data type affect how values are distributed, assuming that no data cells are locked(see “Locking Cells” on page 72).
Note: Date and text values are excluded when spreading data.
The following table shows examples of the effect on data of entering or changing a currency ornon-currency value:
Time Balance Propertyof the Account New Value Distribution Examples
FLOW
Revenue, Expense,Saved Assumption(where the TimeBalance property is setto Flow)
To all its children and its parents proportionally,based on the existing distribution. The valueaffects the entire Summary Period Rollupshierarchy so that the parent time period is thesum of its children.
If no distribution exists (that is, the values for allthe children are zeros or are missing), and thechanged value is a Quarter, the value spreadsdown proportionally, based on the weeklydistribution (which can be 4-4-5, 4-5-4, 5-4-4,or evenly distributed if the account's spreading isset to None).
If the changed parent is a Year Total or someother kind of summary time period, the value isspread evenly.
Example 1
You change Qtr 1 from 250 to 500, with these currentvalues for its months:
Jan = 100
Feb = 50
Mar = 100
Result: 500 is distributed to its children proportionally,replacing their previous values with:
Jan = 200
Feb = 100
Mar = 200
The increment of 250 is aggregated to the parents of Qtr1. If Year Total was 1000, its new value is 1250.
Example 2
You change March from 100 to 200.
Result: March, Qtr 1, and Year Total all increment by 100.Jan and Feb remain unchanged.
68 Adjusting and Spreading Data
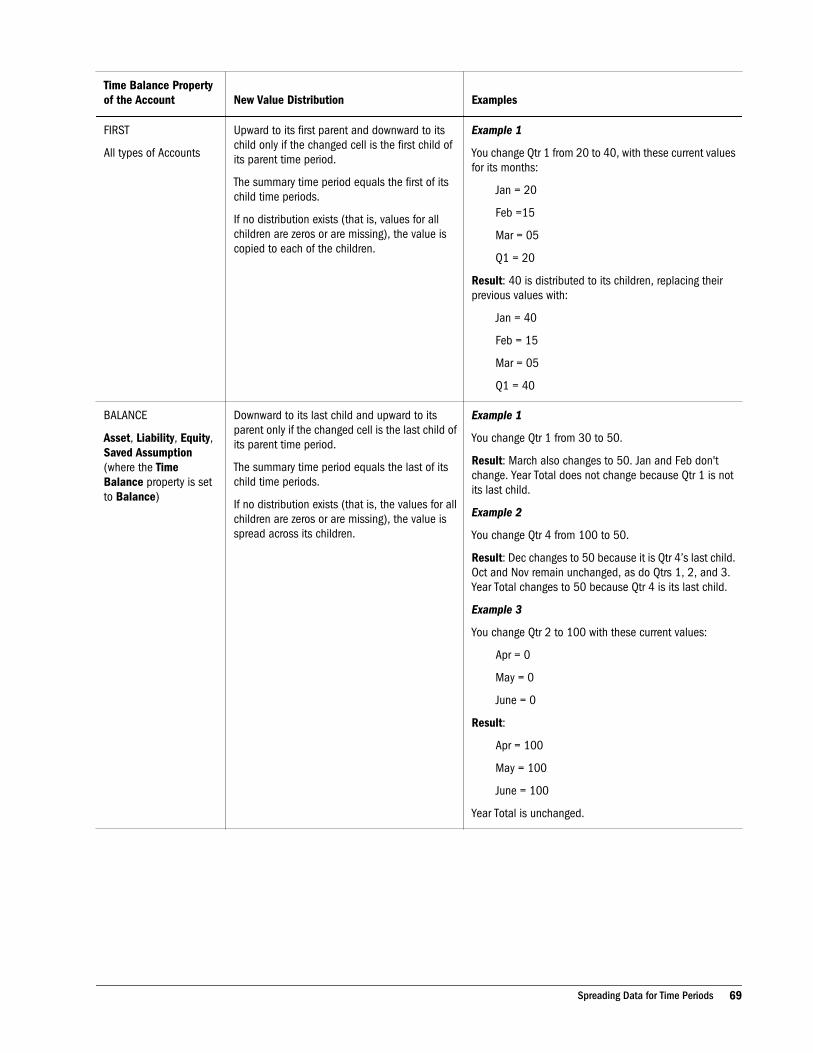
Time Balance Propertyof the Account New Value Distribution Examples
FIRST
All types of Accounts
Upward to its first parent and downward to itschild only if the changed cell is the first child ofits parent time period.
The summary time period equals the first of itschild time periods.
If no distribution exists (that is, values for allchildren are zeros or are missing), the value iscopied to each of the children.
Example 1
You change Qtr 1 from 20 to 40, with these current valuesfor its months:
Jan = 20
Feb =15
Mar = 05
Q1 = 20
Result: 40 is distributed to its children, replacing theirprevious values with:
Jan = 40
Feb = 15
Mar = 05
Q1 = 40
BALANCE
Asset, Liability, Equity,Saved Assumption(where the TimeBalance property is setto Balance)
Downward to its last child and upward to itsparent only if the changed cell is the last child ofits parent time period.
The summary time period equals the last of itschild time periods.
If no distribution exists (that is, the values for allchildren are zeros or are missing), the value isspread across its children.
Example 1
You change Qtr 1 from 30 to 50.
Result: March also changes to 50. Jan and Feb don'tchange. Year Total does not change because Qtr 1 is notits last child.
Example 2
You change Qtr 4 from 100 to 50.
Result: Dec changes to 50 because it is Qtr 4’s last child.Oct and Nov remain unchanged, as do Qtrs 1, 2, and 3.Year Total changes to 50 because Qtr 4 is its last child.
Example 3
You change Qtr 2 to 100 with these current values:
Apr = 0
May = 0
June = 0
Result:
Apr = 100
May = 100
June = 100
Year Total is unchanged.
Spreading Data for Time Periods 69
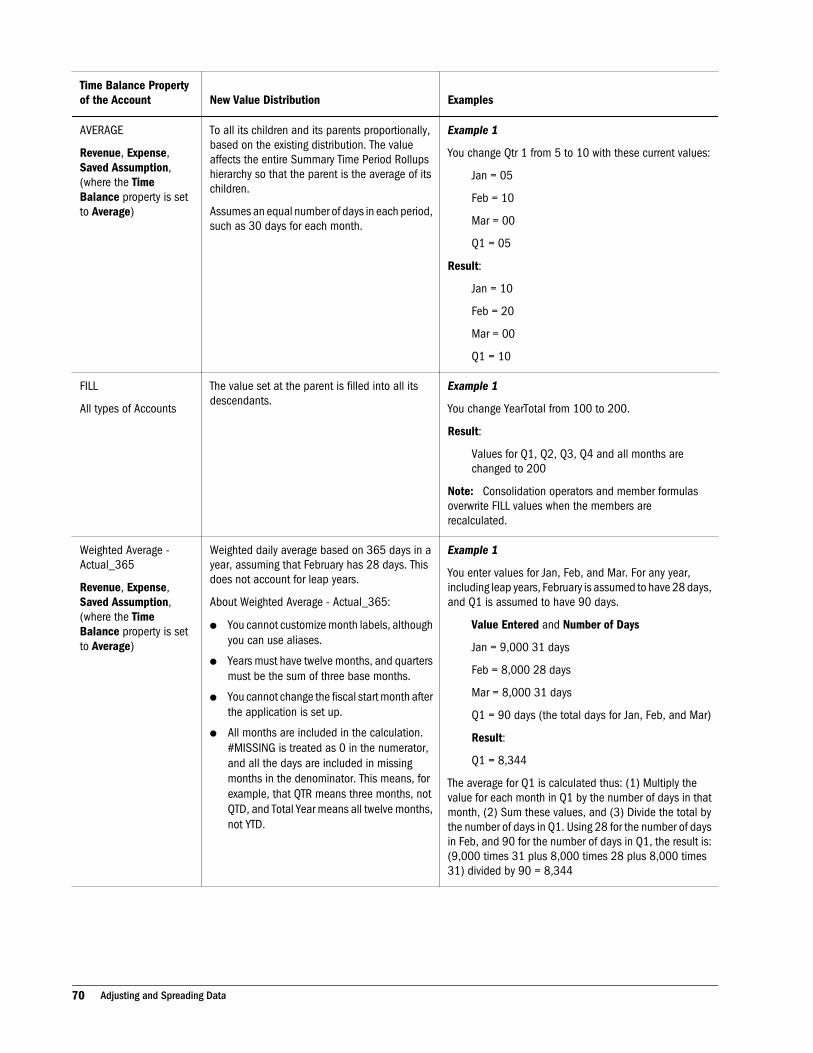
Time Balance Propertyof the Account New Value Distribution Examples
AVERAGE
Revenue, Expense,Saved Assumption,(where the TimeBalance property is setto Average)
To all its children and its parents proportionally,based on the existing distribution. The valueaffects the entire Summary Time Period Rollupshierarchy so that the parent is the average of itschildren.
Assumes an equal number of days in each period,such as 30 days for each month.
Example 1
You change Qtr 1 from 5 to 10 with these current values:
Jan = 05
Feb = 10
Mar = 00
Q1 = 05
Result:
Jan = 10
Feb = 20
Mar = 00
Q1 = 10
FILL
All types of Accounts
The value set at the parent is filled into all itsdescendants.
Example 1
You change YearTotal from 100 to 200.
Result:
Values for Q1, Q2, Q3, Q4 and all months arechanged to 200
Note: Consolidation operators and member formulasoverwrite FILL values when the members arerecalculated.
Weighted Average -Actual_365
Revenue, Expense,Saved Assumption,(where the TimeBalance property is setto Average)
Weighted daily average based on 365 days in ayear, assuming that February has 28 days. Thisdoes not account for leap years.
About Weighted Average - Actual_365:
l You cannot customize month labels, althoughyou can use aliases.
l Years must have twelve months, and quartersmust be the sum of three base months.
l You cannot change the fiscal start month afterthe application is set up.
l All months are included in the calculation.#MISSING is treated as 0 in the numerator,and all the days are included in missingmonths in the denominator. This means, forexample, that QTR means three months, notQTD, and Total Year means all twelve months,not YTD.
Example 1
You enter values for Jan, Feb, and Mar. For any year,including leap years, February is assumed to have 28 days,and Q1 is assumed to have 90 days.
Value Entered and Number of Days
Jan = 9,000 31 days
Feb = 8,000 28 days
Mar = 8,000 31 days
Q1 = 90 days (the total days for Jan, Feb, and Mar)
Result:
Q1 = 8,344
The average for Q1 is calculated thus: (1) Multiply thevalue for each month in Q1 by the number of days in thatmonth, (2) Sum these values, and (3) Divide the total bythe number of days in Q1. Using 28 for the number of daysin Feb, and 90 for the number of days in Q1, the result is:(9,000 times 31 plus 8,000 times 28 plus 8,000 times31) divided by 90 = 8,344
70 Adjusting and Spreading Data
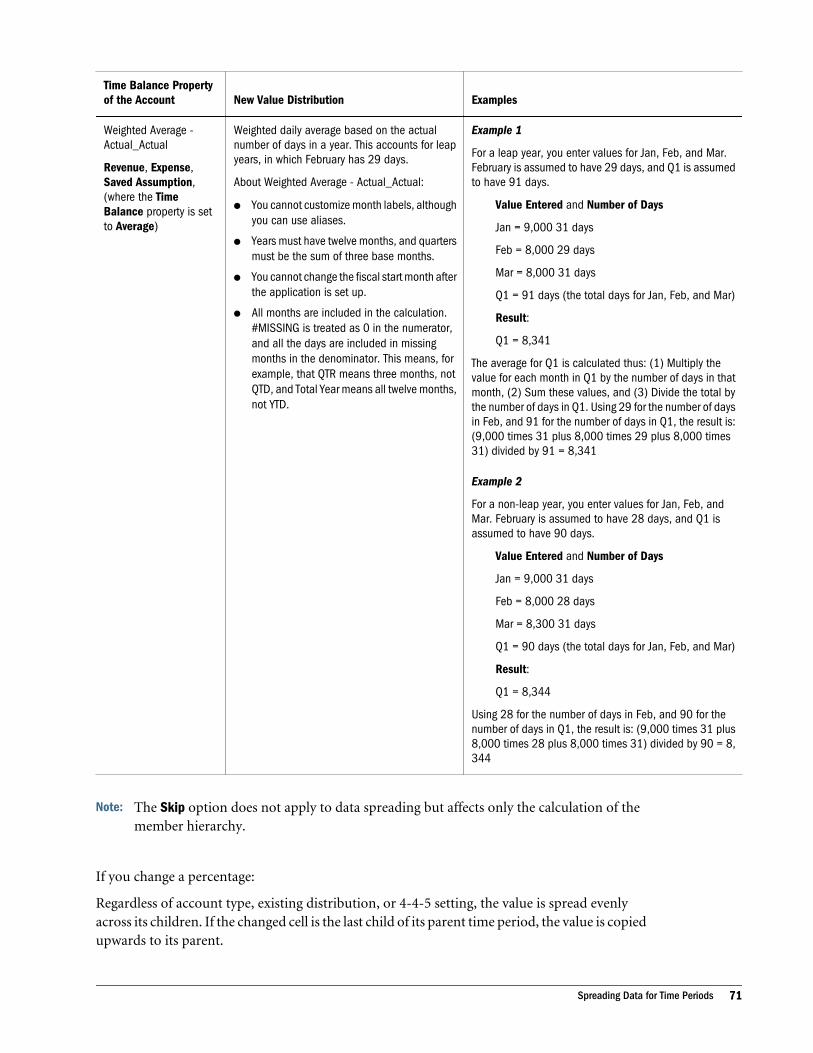
Time Balance Propertyof the Account New Value Distribution Examples
Weighted Average -Actual_Actual
Revenue, Expense,Saved Assumption,(where the TimeBalance property is setto Average)
Weighted daily average based on the actualnumber of days in a year. This accounts for leapyears, in which February has 29 days.
About Weighted Average - Actual_Actual:
l You cannot customize month labels, althoughyou can use aliases.
l Years must have twelve months, and quartersmust be the sum of three base months.
l You cannot change the fiscal start month afterthe application is set up.
l All months are included in the calculation.#MISSING is treated as 0 in the numerator,and all the days are included in missingmonths in the denominator. This means, forexample, that QTR means three months, notQTD, and Total Year means all twelve months,not YTD.
Example 1
For a leap year, you enter values for Jan, Feb, and Mar.February is assumed to have 29 days, and Q1 is assumedto have 91 days.
Value Entered and Number of Days
Jan = 9,000 31 days
Feb = 8,000 29 days
Mar = 8,000 31 days
Q1 = 91 days (the total days for Jan, Feb, and Mar)
Result:
Q1 = 8,341
The average for Q1 is calculated thus: (1) Multiply thevalue for each month in Q1 by the number of days in thatmonth, (2) Sum these values, and (3) Divide the total bythe number of days in Q1. Using 29 for the number of daysin Feb, and 91 for the number of days in Q1, the result is:(9,000 times 31 plus 8,000 times 29 plus 8,000 times31) divided by 91 = 8,341
Example 2
For a non-leap year, you enter values for Jan, Feb, andMar. February is assumed to have 28 days, and Q1 isassumed to have 90 days.
Value Entered and Number of Days
Jan = 9,000 31 days
Feb = 8,000 28 days
Mar = 8,300 31 days
Q1 = 90 days (the total days for Jan, Feb, and Mar)
Result:
Q1 = 8,344
Using 28 for the number of days in Feb, and 90 for thenumber of days in Q1, the result is: (9,000 times 31 plus8,000 times 28 plus 8,000 times 31) divided by 90 = 8,344
Note: The Skip option does not apply to data spreading but affects only the calculation of themember hierarchy.
If you change a percentage:
Regardless of account type, existing distribution, or 4-4-5 setting, the value is spread evenlyacross its children. If the changed cell is the last child of its parent time period, the value is copiedupwards to its parent.
Spreading Data for Time Periods 71

Example 1
You change Qtr 1 from 10 to 20.
Result: Jan, Feb, and Mar also change to 20. However, Year Total does not change because Qtr1 is not its last child.
Example 2
You change Feb from 10 to 20.
Result: Jan and Mar do not change because neither one is a child or parent of Feb. Qtr 1 (andtherefore Year Total) does not change because Feb is not its last child.
Example 3
You change Qtr 4 from 30 to 20.
Result: Oct, Nov, and Dec also change to 20 because the value is copied to Qtr 4’s children. YearTotal also changes to 20 because Qtr 4 is its last child.
Note: See “Adjusting Cell Values” on page 65 and “Spreading with Multiple Currencies” onpage 72.
Spreading with Multiple CurrenciesWhen data is spread from a parent member to children of mixed currencies, the children assumethe currency type of the parent time period, and data is spread as described in “How SpreadingData Works” on page 68.
When currencies are mixed and a child time period is changed, the currency of the parent timeperiod assumes the currency type of the child only if that time period does not have childrenwith multiple currencies.
Locking CellsWhen spreading or manipulating data, you can temporarily lock cells while Planning calculatesand fills in other values. You can visually review the changes before saving them. See “Examplesof Spreading Data with Cell Locking” on page 73.
ä To temporarily lock values:
1 Select the cells to lock.
2 Select Edit, and then Lock/Unlock Cells.
A tan background indicates that a cell is locked. If you lock multiple cells, some of whichare already locked, all the unlocked cells become locked.
You can now spread or manipulate the other data. (See “Spreading Data for Time Periods”on page 67 and “How Spreading Data Works” on page 68.)
3 To unlock cells, select Edit, and then Lock/Unlock Cells or enter !.
72 Adjusting and Spreading Data
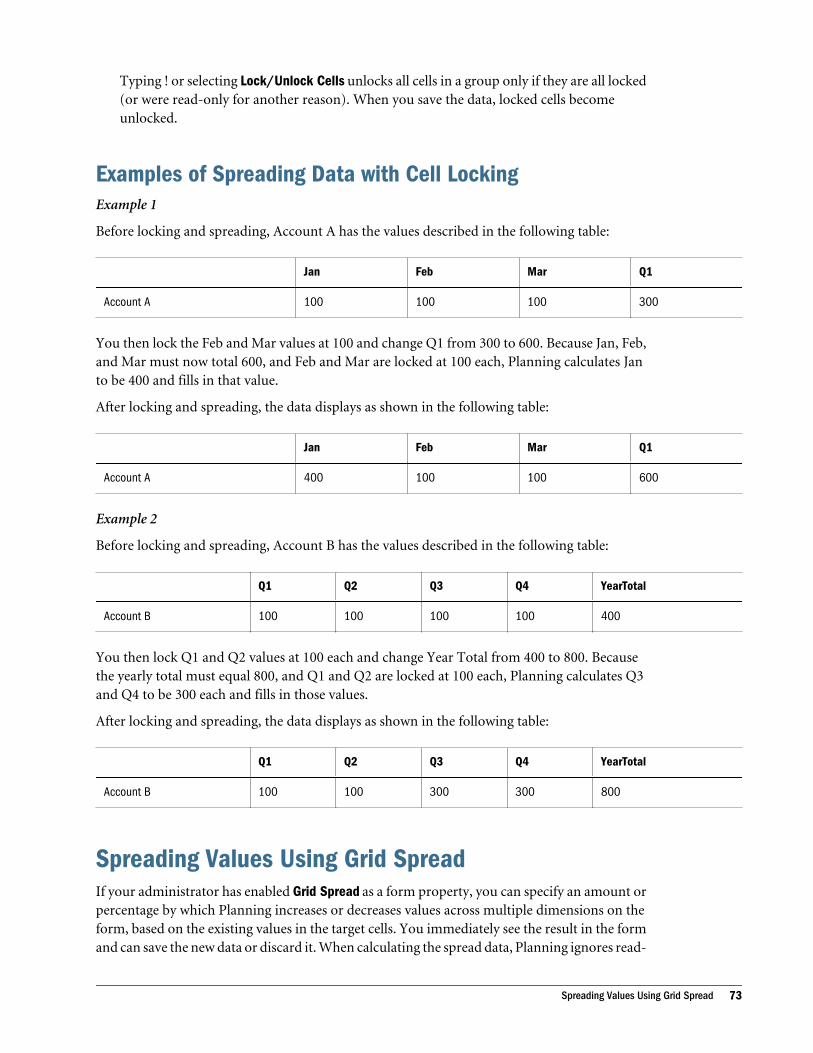
Typing ! or selecting Lock/Unlock Cells unlocks all cells in a group only if they are all locked(or were read-only for another reason). When you save the data, locked cells becomeunlocked.
Examples of Spreading Data with Cell LockingExample 1
Before locking and spreading, Account A has the values described in the following table:
Jan Feb Mar Q1
Account A 100 100 100 300
You then lock the Feb and Mar values at 100 and change Q1 from 300 to 600. Because Jan, Feb,and Mar must now total 600, and Feb and Mar are locked at 100 each, Planning calculates Janto be 400 and fills in that value.
After locking and spreading, the data displays as shown in the following table:
Jan Feb Mar Q1
Account A 400 100 100 600
Example 2
Before locking and spreading, Account B has the values described in the following table:
Q1 Q2 Q3 Q4 YearTotal
Account B 100 100 100 100 400
You then lock Q1 and Q2 values at 100 each and change Year Total from 400 to 800. Becausethe yearly total must equal 800, and Q1 and Q2 are locked at 100 each, Planning calculates Q3and Q4 to be 300 each and fills in those values.
After locking and spreading, the data displays as shown in the following table:
Q1 Q2 Q3 Q4 YearTotal
Account B 100 100 300 300 800
Spreading Values Using Grid SpreadIf your administrator has enabled Grid Spread as a form property, you can specify an amount orpercentage by which Planning increases or decreases values across multiple dimensions on theform, based on the existing values in the target cells. You immediately see the result in the formand can save the new data or discard it. When calculating the spread data, Planning ignores read-
Spreading Values Using Grid Spread 73
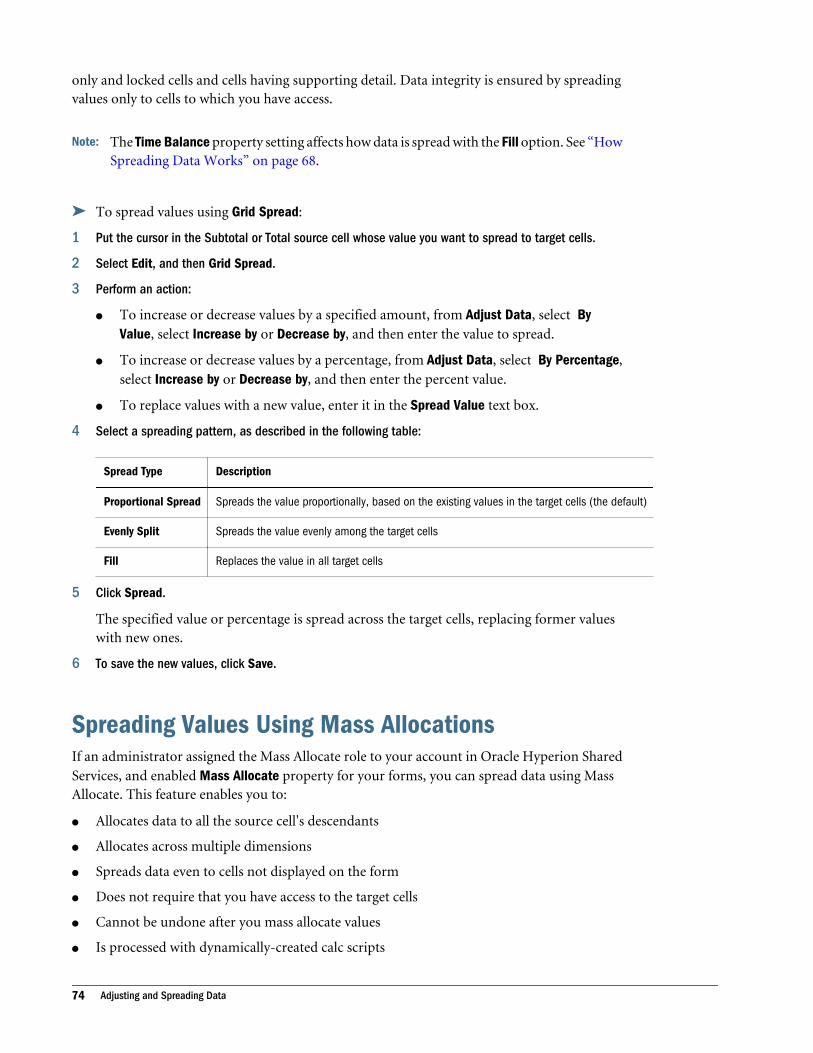
only and locked cells and cells having supporting detail. Data integrity is ensured by spreadingvalues only to cells to which you have access.
Note: The Time Balance property setting affects how data is spread with the Fill option. See “HowSpreading Data Works” on page 68.
ä To spread values using Grid Spread:
1 Put the cursor in the Subtotal or Total source cell whose value you want to spread to target cells.
2 Select Edit, and then Grid Spread.
3 Perform an action:
l To increase or decrease values by a specified amount, from Adjust Data, select ByValue, select Increase by or Decrease by, and then enter the value to spread.
l To increase or decrease values by a percentage, from Adjust Data, select By Percentage,select Increase by or Decrease by, and then enter the percent value.
l To replace values with a new value, enter it in the Spread Value text box.
4 Select a spreading pattern, as described in the following table:
Spread Type Description
Proportional Spread Spreads the value proportionally, based on the existing values in the target cells (the default)
Evenly Split Spreads the value evenly among the target cells
Fill Replaces the value in all target cells
5 Click Spread.
The specified value or percentage is spread across the target cells, replacing former valueswith new ones.
6 To save the new values, click Save.
Spreading Values Using Mass AllocationsIf an administrator assigned the Mass Allocate role to your account in Oracle Hyperion SharedServices, and enabled Mass Allocate property for your forms, you can spread data using MassAllocate. This feature enables you to:
l Allocates data to all the source cell's descendants
l Allocates across multiple dimensions
l Spreads data even to cells not displayed on the form
l Does not require that you have access to the target cells
l Cannot be undone after you mass allocate values
l Is processed with dynamically-created calc scripts
74 Adjusting and Spreading Data

l Executes the calc scripts against the Essbase server, against all dimension combinations
l Can use customized spreading patterns, created by an administrator (see Oracle HyperionPlanning Administrator's Guide)
Note: The Time Balance property setting affects how data is spread with the Fill option. See “HowSpreading Data Works” on page 68.
ä To spread values using Mass Allocate:
1 Put the cursor in the Subtotal or Total cell whose value you want to spread.
2 Select Edit, and then Mass Allocate.
3 Perform an action:
l To increase or decrease values by a specified amount, from the Adjust Data drop-downlist, select By Value, select Increase by or Decrease by, and then enter the value to spread.
l To increase or decrease values by a percentage, from the Adjust Data drop-down list,select By Percentage, select Increase by or Decrease by, and then enter the percent value.
l To replace values with a new value, enter it in the Spread Value text box.
4 Select the Spread Type for allocating the specified value or percentage across the target cells, asdescribed in the following table.
Spread Type Description
Proportional Spread Spreads the value proportionally, based on the existing values in the target cells (the default)
Relational Spread Spreads into the selected cells, based on values that exist in a different source location. Selecting this optiondisplays the currently selected members for each dimension in the Selected column.
Under Relative, select the members you select that identify the base values to be spread, creating a pattern
based on the existing values in the relative cells. To select members, click , and, on the MemberSelection page, select members for the dimension, either directly or based on relationships (see OracleHyperion Planning Administrator's Guide).
Evenly Split Spreads the value evenly among the target cells
Fill Replaces the value in all target cells
5 Click Spread.
Spreading Values Using Mass Allocations 75

76 Adjusting and Spreading Data
8Working with Supporting Detail
In This Chapter
Working with Supporting Detail . . . . . . . . . . . . . . . . . . . . . . . . . . . . . . . . . . . . . . . . . . . . . . . . . . . . . . . . . . . . . . . . . . . . . . . . . . .77
Adding Supporting Detail. . . . . . . . . . . . . . . . . . . . . . . . . . . . . . . . . . . . . . . . . . . . . . . . . . . . . . . . . . . . . . . . . . . . . . . . . . . . . . . . . .78
Viewing or Changing Supporting Detail . . . . . . . . . . . . . . . . . . . . . . . . . . . . . . . . . . . . . . . . . . . . . . . . . . . . . . . . . . . . . . . . . .81
Synchronizing Supporting Detail with Essbase ... . . . . . . . . . . . . . . . . . . . . . . . . . . . . . . . . . . . . . . . . . . . . . . . . . . . . . . .81
Pasting Multiple Cells into the Supporting Detail Window ... . . . . . . . . . . . . . . . . . . . . . . . . . . . . . . . . . . . . . . . . .82
Working with Supporting DetailSupporting detail serves as a built-in calculator for developing data that is not in the memberoutline. It also provides a way to better understand the basis of the data. For example, if thebottom-level member in your outline is pens, you can add line items in supporting detail forballpoint, fountain, marker, and so on. Then you can aggregate their values to the pen member.
Supporting detail helps you build and communicate bottom-up values when planning suchcorporate expenses as travel and projects, where you must calculate aggregate values. Supportingdetail can include text, values, and operators that define how data aggregates.
About supporting detail:
l Supporting detail does not change members in the outline.
l To create, change, or delete supporting detail, you must have write access to cells. You musthave read access to view supporting detail.
l To protect values, you cannot enter, adjust, spread, and save data into aggregate values thathave supporting detail. The aggregate values are read-only.
l You can add supporting detail to target and bottom-up versions.
l You cannot add supporting detail to Summary Time Periods—such as Quarters—but onlyto base time periods (level 0 members).
l Number and precision formatting is not reflected in the Supporting Detail window.
l The sequence of operators follows the same logic as is used to process multiple operators ina complex calculation.
l You can print supporting detail.
l When using Copy Versions, you can copy supporting detail from one version to another.
Working with Supporting Detail 77

l Your administrator can copy data, including supporting detail, from one dimensionalintersection to another. For example, administrators can copy Budget, FY13, Final toForecast, FY14, First Draft. They can also copy data from one business unit to another, orfrom FY13 to FY14 to prepare a budget.
See “Adding Supporting Detail” on page 78.
Adding Supporting Detail
Subtopics
l Example of Supporting Detail
l Totaling When Supporting Detail Cells are Blank
l Order of Supporting Detail
l Incorrectly Entering Supporting Detail
l Correctly Entering Supporting Detail
l Working with the Supporting Detail Hierarchy
Use the Supporting Detail window to set how detail items aggregate to cell values in a form.
ä To add supporting detail that calculates values in a form:
1 Open a form, and then select the cells.
You can select one cell or a range of contiguous cells in a row or column. The section cannotinclude a combination of rows and columns. Select cells that are in the local currency so thatyou can write to them.
2 Select Edit, and then Supporting Detail.
The Supporting Detail window reflects your cell selection.
3 Use the buttons to create or change the indented hierarchy to reflect the desired structure andcalculations.
For example, click Add Child to add a line item directly below the selected item. See “Workingwith the Supporting Detail Hierarchy” on page 80.
4 In the Label column, enter a description.
The text and its associated operator must be unique among children of the same parent. Bydefault, you can enter up to 1,500 characters.
5 Set the mathematical relationships among the line items by selecting an operator for each of them.
Select from these operators: + (add), - (subtract), * (multiply), / (divide), and ~ (ignore).
6 Enter data to set or calculate.
Enter numbers using the same scaling that was set up for the form.
7 Click Save.
78 Working with Supporting Detail
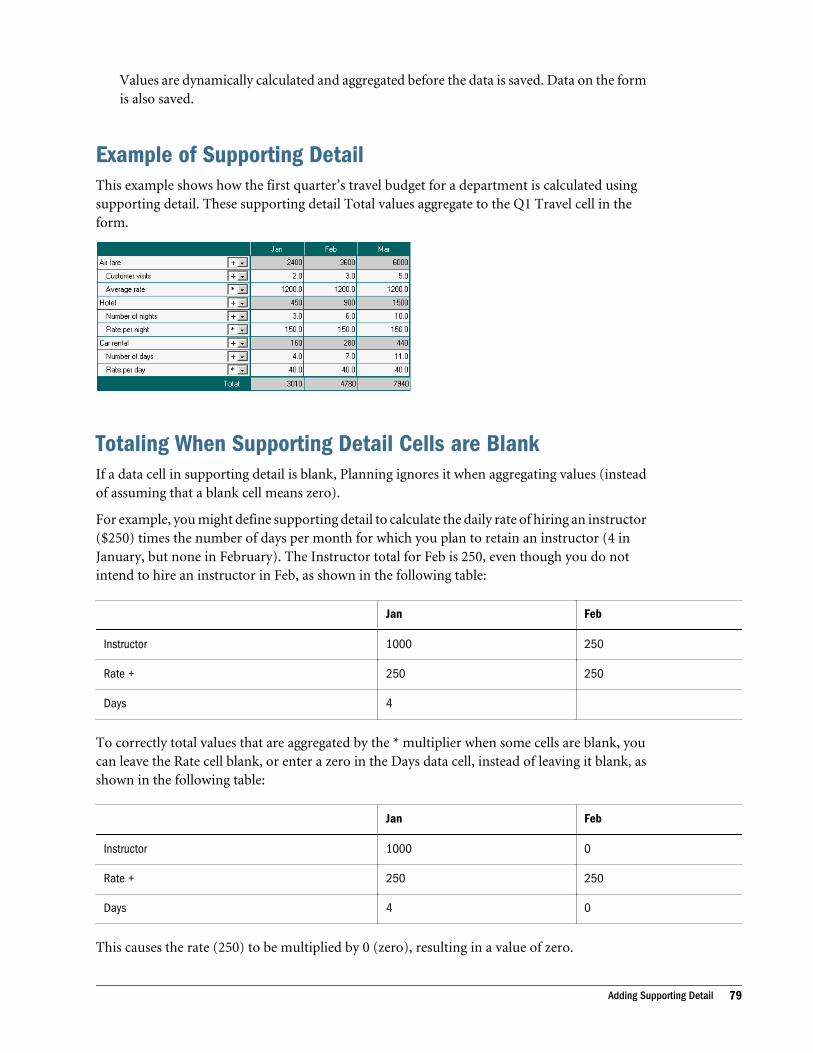
Values are dynamically calculated and aggregated before the data is saved. Data on the formis also saved.
Example of Supporting DetailThis example shows how the first quarter’s travel budget for a department is calculated usingsupporting detail. These supporting detail Total values aggregate to the Q1 Travel cell in theform.
Totaling When Supporting Detail Cells are BlankIf a data cell in supporting detail is blank, Planning ignores it when aggregating values (insteadof assuming that a blank cell means zero).
For example, you might define supporting detail to calculate the daily rate of hiring an instructor($250) times the number of days per month for which you plan to retain an instructor (4 inJanuary, but none in February). The Instructor total for Feb is 250, even though you do notintend to hire an instructor in Feb, as shown in the following table:
Jan Feb
Instructor 1000 250
Rate + 250 250
Days 4
To correctly total values that are aggregated by the * multiplier when some cells are blank, youcan leave the Rate cell blank, or enter a zero in the Days data cell, instead of leaving it blank, asshown in the following table:
Jan Feb
Instructor 1000 0
Rate + 250 250
Days 4 0
This causes the rate (250) to be multiplied by 0 (zero), resulting in a value of zero.
Adding Supporting Detail 79

Order of Supporting DetailThe supporting detail order affects the resulting value that is saved to Essbase. Understandingthe calculation order helps you correctly enter supporting detail. Supporting detail leverages thecalculation order of + (addition), - (subtraction), * (multiplication), and / (division). A simpleUnit times Rates example demonstrates how to correctly enter supporting detail.
Incorrectly Entering Supporting DetailBecause Rate in this following table is set to the unary operator +, the calculation order first addsthe Rate and then multiplies by the Unit, resulting in incorrect data being saved.
Jan Feb Mar
Rate + 250 250 250
Unit * 10
Total: 2500 250 250
Correctly Entering Supporting DetailThis following table demonstrates the correct order of the Units times Rates calculation, withcorrect values saved.
Jan Feb Mar
Unit + 10.0
Rate * 250.0 250.0 250.0
Total: 2500
Verify the supporting detail order, ensuring that correct values are calculated and saved.
Working with the Supporting Detail HierarchyThe supporting detail hierarchy should reflect the type of information that supports the cellvalues and the mathematical operators that create the relationships.
ä To create or change the supporting detail hierarchy:
1 In a form, select the cells with supporting detail.
2 Select Edit, and then Supporting Detail.
3 Create or change the rows in the hierarchy that provide the detail for the data values by putting thecursor on an item and clicking the options in this table:
80 Working with Supporting Detail
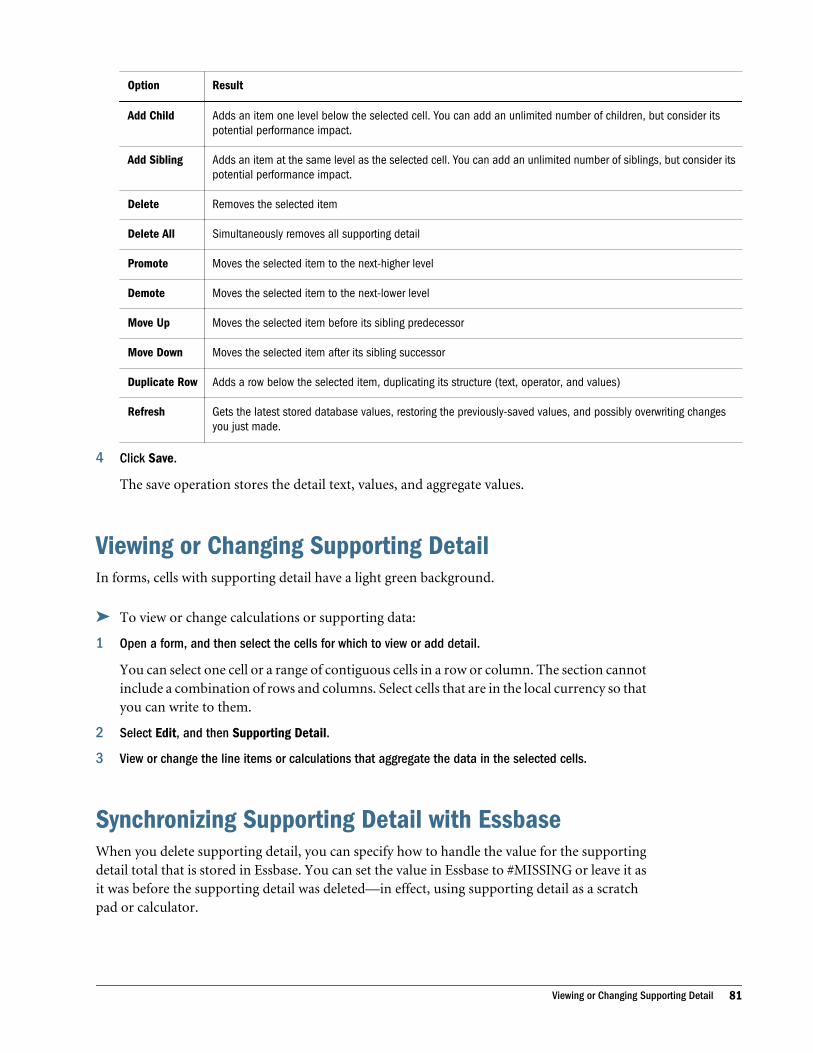
Option Result
Add Child Adds an item one level below the selected cell. You can add an unlimited number of children, but consider itspotential performance impact.
Add Sibling Adds an item at the same level as the selected cell. You can add an unlimited number of siblings, but consider itspotential performance impact.
Delete Removes the selected item
Delete All Simultaneously removes all supporting detail
Promote Moves the selected item to the next-higher level
Demote Moves the selected item to the next-lower level
Move Up Moves the selected item before its sibling predecessor
Move Down Moves the selected item after its sibling successor
Duplicate Row Adds a row below the selected item, duplicating its structure (text, operator, and values)
Refresh Gets the latest stored database values, restoring the previously-saved values, and possibly overwriting changesyou just made.
4 Click Save.
The save operation stores the detail text, values, and aggregate values.
Viewing or Changing Supporting DetailIn forms, cells with supporting detail have a light green background.
ä To view or change calculations or supporting data:
1 Open a form, and then select the cells for which to view or add detail.
You can select one cell or a range of contiguous cells in a row or column. The section cannotinclude a combination of rows and columns. Select cells that are in the local currency so thatyou can write to them.
2 Select Edit, and then Supporting Detail.
3 View or change the line items or calculations that aggregate the data in the selected cells.
Synchronizing Supporting Detail with EssbaseWhen you delete supporting detail, you can specify how to handle the value for the supportingdetail total that is stored in Essbase. You can set the value in Essbase to #MISSING or leave it asit was before the supporting detail was deleted—in effect, using supporting detail as a scratchpad or calculator.
Viewing or Changing Supporting Detail 81
ä To synchronize supporting detail with Essbase:
1 Click in the cell with supporting detail.
2 Select Edit, and then Supporting Detail.
3 In Supporting Detail, delete the information, and then click Save.
4 In the displayed message, specify how Essbase handles the changes:
l To delete the supporting detail in Essbase, click Yes, set the value(s) to #MISSING.
l To leave the data in Essbase as it was before you deleted the supporting detail, click No,leave the value(s) as is.
Pasting Multiple Cells into the Supporting DetailWindow You can copy supporting detail from multiple cells in Microsoft Excel or another applicationand paste it into the Supporting Detail window. For example, you can export forms to Excelspreadsheets, work on supporting detail in spreadsheets, and copy it back to Planning.
About copying and pasting supporting detail:
l The cell range of the data that you paste must exist in the Supporting Detail window.
l You can copy and paste cell labels and cell data.
l The pasted data does not retain the original formatting.
ä To copy supporting detail from Microsoft Excel spreadsheets:
1 Open a Planning form.
2 In Planning, select a cell or range of cells, and then click Supporting Detail.
3 In Supporting Detail, note the range of cells with supporting detail, or add cells with supporting detail,and then click OK.
4 Select Tools, and then Export as Spreadsheet.
A browser instance of Microsoft Excel is displayed with the exported information, and youcan modify the supporting detail.
5 In Excel, select the range of cells containing supporting detail, and then press Ctrl+C to copy the data.
6 In Planning, open the form to which to add supporting detail.
7 Select the cell with the details to modify, and then click Supporting Detail.
8 In Supporting Detail, click in the range's upper-left cell for which to paste supporting detail, and thenpress Ctrl+V.
9 Click Save.
82 Working with Supporting Detail

9Working with Currencies
In This Chapter
Working with Multiple Currencies ... . . . . . . . . . . . . . . . . . . . . . . . . . . . . . . . . . . . . . . . . . . . . . . . . . . . . . . . . . . . . . . . . . . . . . .83
Changing the Currency for a Data Cell . . . . . . . . . . . . . . . . . . . . . . . . . . . . . . . . . . . . . . . . . . . . . . . . . . . . . . . . . . . . . . . . . . .84
Reporting on Data in Multiple Currencies... . . . . . . . . . . . . . . . . . . . . . . . . . . . . . . . . . . . . . . . . . . . . . . . . . . . . . . . . . . . . .84
Working with Multiple CurrenciesYou can plan and analyze your financial information in one currency or in multiple currencies,if certain conditions are met.
If multiple currencies are enabled, cells show the currency code. You can:
l Enter data in local currencies
l View or report on data in reporting currencies
On forms where the Allow multiple currencies per entity option is enabled, no currency codesare displayed for parent entities, even if they have single- or multiple-currency children.
When you launch the Currency Conversion business rule, all currencies on the page areconverted. For example, you can select local, USD, and EUR currency members on the page axisand enter data in the local currency. The Currency Conversion business rule dynamicallycalculates the entered data for all currencies selected for that page. In this example, the businessrule converts local currency to USD and to EUR.
Currency conversion converts all levels except the Time Period dimension, where it convertsonly level 0 time periods and then aggregates the summary displayed time periods.
Note: Launch the Currency Conversion business rule frequently to ensure correct totals.
See:
l Oracle Hyperion Planning Administrator's Guide to set up currencies.
l “Changing the Currency for a Data Cell” on page 84.
l “Reporting on Data in Multiple Currencies” on page 84.
l “Spreading with Multiple Currencies” on page 72.
Working with Multiple Currencies 83
Changing the Currency for a Data CellIf an administrator has enabled the functionality, you can enter data into cells in a currencyother than the base currency of the cells. Currencies listed in the Available Currencies list can beused for input as a local currency.
Note: To override the base currency for an entity, the cell must be displayed in the local currency,and its version must be bottom-up.
ä To enter data in a local currency other than the cell's base currency:
1 In a form, select a local currency member for the cell.
2 Optional: To look up the currency's code, select View, then Currency.
Available Currencies shows the application's currencies. Note the Currency Code for thecurrency you want to work with, and close the window. If you cannot select View, thenCurrency, multiple currencies are not enabled for this application or form.
3 In the right part of a data cell, enter the Currency Code for the cell's currency.
Doing this overrides the entity's base currency. The left part of the cell is for the value itself.
4 Enter or view the data in the left part of the cell.
5 Select File, and then Save to calculate and save the value.
If the Calculate Currencies business rule is set to run when the form is saved, and the formis enabled for multiple currencies, the data value is displayed in the currency you selected.
Reporting on Data in Multiple Currencies
ä To see data values in a reporting currency other than the base currency, in a form, selectanother reporting currency.
You can look up the currency code for a currency by selecting View, then Currency.
The Available Currencies list shows which currencies are set up for the application. Note theCurrency Code for the currency you want to work with, and close the window. (If you cannotselect View, then Currency, multiple currencies are not enabled for this application or form.)
Note: You cannot enter data into a reporting currency. You can enter data only into a localcurrency.
84 Working with Currencies
10Managing Planning Units
In This Chapter
Overview of the Review Process ... . . . . . . . . . . . . . . . . . . . . . . . . . . . . . . . . . . . . . . . . . . . . . . . . . . . . . . . . . . . . . . . . . . . . . . .85
Viewing Planning Unit Totals .. . . . . . . . . . . . . . . . . . . . . . . . . . . . . . . . . . . . . . . . . . . . . . . . . . . . . . . . . . . . . . . . . . . . . . . . . . . . .88
Using the Approvals Dashboard to View Planning Unit Status ... . . . . . . . . . . . . . . . . . . . . . . . . . . . . . . . . . . . . .89
Example: Approvals Dashboard and Level Status . . . . . . . . . . . . . . . . . . . . . . . . . . . . . . . . . . . . . . . . . . . . . . . . . . . . .92
Example: Approvals Dashboard and Group Status . . . . . . . . . . . . . . . . . . . . . . . . . . . . . . . . . . . . . . . . . . . . . . . . . . . .95
Validating Planning Units.. . . . . . . . . . . . . . . . . . . . . . . . . . . . . . . . . . . . . . . . . . . . . . . . . . . . . . . . . . . . . . . . . . . . . . . . . . . . . . . . .96
Viewing and Resolving Planning Unit Validation Problems... . . . . . . . . . . . . . . . . . . . . . . . . . . . . . . . . . . . . . . . . . .98
Changing Planning Unit Status ... . . . . . . . . . . . . . . . . . . . . . . . . . . . . . . . . . . . . . . . . . . . . . . . . . . . . . . . . . . . . . . . . . . . . . . . .99
Adding or Viewing Planning Unit Annotations ... . . . . . . . . . . . . . . . . . . . . . . . . . . . . . . . . . . . . . . . . . . . . . . . . . . . . . . 101
Printing Planning Unit Annotations ... . . . . . . . . . . . . . . . . . . . . . . . . . . . . . . . . . . . . . . . . . . . . . . . . . . . . . . . . . . . . . . . . . . 101
Viewing Planning Unit History Details and Using Annotations ... . . . . . . . . . . . . . . . . . . . . . . . . . . . . . . . . . . . . 102
Selecting an Alternate Reviewer .. . . . . . . . . . . . . . . . . . . . . . . . . . . . . . . . . . . . . . . . . . . . . . . . . . . . . . . . . . . . . . . . . . . . . . . 102
Overview of the Review ProcessPlanning tracks budgets by planning units—a slice of data at the intersection of a scenario, aversion, and an entity or part of an entity. It is the basic unit for preparing, annotating, reviewing,and approving plan data.
The following sections discuss:
l Planning Unit States
l Planning Unit Actions
l Viewing Planning Unit Totals
Planning Unit StatesPlanning units are in one of the following states:
l Not Started—Initial state of all planning units. An administrator begins the review processby starting a planning unit using the Start action, which changes a planning unit's state. InFreeForm, the Start action changes the planning unit state to First Pass. In Bottom Up, theStart action changes the planning unit state to “Under Review” and it goes to first in
Overview of the Review Process 85
promotion path. In Distribute, the Start action changes the planning unit state to “UnderReview” and it goes to last in promotion path.
Note: First and Last in the promotion path are not states but locations of where and whoowns the planning unit.
l First Pass—Beginning state of planning units selected for the budgeting process. Planningunits have no owners during First Pass. Users having access can enter data and promoteplanning units during the First Pass state. During this state, administrators may excludesome or all members from planning units.
When a planning unit is ready for review, users select one of several actions, changingplanning unit status and passing ownership. To be notified by email if you become the ownerof a planning unit, see “Setting Up Email” on page 106.
Note: When using the Free Form template for approvals, ownership does not automaticallypass to another user. Users must assign the next owner.
l Under Review—Occurs after a Promote or Submit action, and signifies that someone isreviewing the planning unit. Only the current owner or administrators can modify data onplanning units whose state is Under Review. While Under Review, planning units may undergoiterations of promotions, submissions, signoffs, and rejections until they are finallyapproved.
l Frozen—All related data in descendant planning units is locked (read only). The owner whofroze the planning units, or an owner above that user, selects Unfreeze to reverse this action.
l Distributed—Multiple users are reviewing the budget. The reviewers are filtered bypermissions and specified reviewers for the distribute action selected (Distribute, DistributeChildren, or Distribute Owner, see “Changing Planning Unit Status” on page 99).
l Signed Off—Occurs when Sign Off is selected. Only the current owner or administrator canmodify data or perform an action on planning units whose state is Signed Off. Ownershipdoes not change when a planning unit is signed off.
l Not Signed Off—Occurs when Reject is selected. Only the current owner or administratorcan modify data or perform an action on a planning unit whose state is Not Signed Off.
l Approved—Occurs when Approve is selected. The last user in the promotional path (the ownerof the planning unit) becomes the owner, regardless of whether they are an owner or areviewer. Owners can edit the data if they have write access to the member combination thatdefines the planning unit, and can perform the Approve action. Reviewers who are the lastuser in the promotional path cannot edit the data in the planning unit, but can perform theApprove action. After all planning units are approved, the budgeting cycle is complete.
Notes:
l In all states except the Not Started state, users with read access can view data, view theapproval state, view the history, and read and enter annotations.
l A planning unit may skip approval states.
l The review process can be managed at a higher level with parent planning units.
86 Managing Planning Units

l Planning unit owners and reviewers can be individual users, or they can be a group. Forinformation about assigning a group as the owner or the reviewer, see “About Group-basedApprovals” in Oracle Hyperion Planning Administrator's Guide.
Note: The actions available when changing planning unit status depend on which Approvalstemplate is selected. For example, when using the Distribute template, users can selectSubmit to pass ownership to the next user in the promotional path. When using the BottomUp template, however, Submit is not available. Instead, users select Promote to passownership to the next user in the promotional path. The Freeze and Unfreeze actions areonly available for the Bottom-up template and Distribute.
Planning Unit ActionsThere are several actions that can be performed in a planning unit. The available actions varydepending on what state the planning unit is in.
l Start—Starts the planning unit
New planning unit state: First Pass for FreeForm, Under Review for Bottom Up, Distributed
l Exclude—Stops the planning unit and deletes all its history
New planning unit state: Not Started
l Originate: Bottom Up—Moves the planning unit to first in the promotion path
New planning unit state: Under Review
l Promote—FreeForm moves the planning unit to anyone in the list. Bottom Up moves theplanning unit to the next position in the promotion path.
New planning unit state: Under Review
l Reject—FreeForm moves the planning unit to anyone in the list list. Bottom Up, Distributedmoves the planning unit to anyone previous in the promotion path
New planning unit state: Not Signed Off
l Sign Off—Moves the planning unit to the Signed Off state
l Delegate—Delegates the planning unit to a newly-selected owner
New planning unit state: Under Review
l Take Ownership—Takes ownership away from the current owner. For Groups, claimsownership of the planning unit from the group.
New planning unit state: Under Review
l Return—Returns ownership to Group
New planning unit state: Under Review
l Pass—When in a group, passes ownership to another user in the group
New planning unit state: Under Review
l Freeze—Freezes the planning unit from data entry
Overview of the Review Process 87

New planning unit state: Frozen
l Unfreeze—Unfreezes the planning unit and allows data entry again
New planning unit state: Under Review
l Distribute—Moves the planning unit to previous in the promotion path
New planning unit state: Distributed
l Distribute Children—Moves the planning unit to previous in the promotion path. Appliedto children of the selected planning unit.
New planning unit state: Distributed
l Distribute Owner—Moves the planning unit to first in the promotion path
New planning unit state: Distributed
l Submit—Moves the planning unit to next in the promotion path
New planning unit state: Under Review
l Submit to Top—Moves the planning unit to last in the promotion path
New planning unit state: Under Review
l Approve—Approves the planning unit. This completes the approval process, and plannerscannot perform any additional actions.
New planning unit state: Approved
l Reopen—Reopens an approved planning unit. Reopen is available to planners andinteractive users who are last in the promotion path.
New planning unit state: Under Review
Viewing Planning Unit TotalsWith your administrator's support, you can view the total value of a planning unit. For example,you can see your budget's total before you approve it.
To set up a planning unit so you can view its total value:
l An administrator selects members for all dimensions (see “Assigning Planning Unit Ownersand Reviewers” in the Oracle Hyperion Planning Administrator's Guide).
l An administrator selects the plan type from which the aggregated planning unit values arederived (see “Setting Planning Unit Hierarchy Name, Scope, and Template” in the OracleHyperion Planning Administrator's Guide).
l In a multicurrency application, you can set the reporting currency in which to display totalplanning unit values (see “Setting the Reporting Currency” on page 108). To ensure thatthe totals are calculated correctly, launch the Currency Conversion business rule.
88 Managing Planning Units
Using the Approvals Dashboard to View Planning UnitStatusYou can use the approvals dashboard to view a graphical representation of approvals. This letsyou better visualize approvals status information. Using a view selection option, you can easilyswitch between four different views (Process Status view, Level Status view, Group Status view,and Tree view). Clicking on a section of the chart displays detailed information about that chartsection in the grid displayed below the chart.
ä To use the approvals dashboard to view planning unit status:
1 Select Tools, and then Manage Approvals.
2 From Scenario, select a valid scenario, and then from Version, select a valid version.
3 Click Go.
The list of planning units to which you have access is displayed.
4 From the View drop-down menu at the top right of the screen, select how to display the informationabout the planning unit.
The following views are available:
l Process Status—Shows the percentage of planning units that are under various statuses,such as under review or approved. You can customize the following information:
m Chart Type—Select Pie or Bar.
m Group By—Select to further define the criteria by which to group the information.If you choose to group by approvals status, select whether to display planning unitsthat are under review and whether to list the information by owner or by location.
Click on a section of the pie chart or bar chart to display specific details about that chartsection in the grid below the chart. For example, clicking Under Review on the chartdisplays details about the planning units that are under review.
l Level Status—Shows the percentage of planning units that are pending or complete bylevel. You can customize the following information:
m Level Reached—Select My Level or the number of levels below my level.
m Group By—Select to further define the criteria by which to group the information.If you choose to group by status, select whether to display pending or completeplanning units and whether to list the information by owner or by location.
Click on a section of the pie chart to display specific details about that chart section inthe grid below the chart. For example, clicking pending planning units in Administrationand Finance on the chart displays specific details about those planning units.
l Group Status—Shows the percentage of planning units that are pending or completegrouped by levels. You can customize the following information:
m Level Reached—Select My Level or the number of levels below my level.
Using the Approvals Dashboard to View Planning Unit Status 89
m Group By—Select My Level or the number of levels below my level.
m List By—Select whether to group the information by owner or by location.
Click on a section of the bar chart to display specific details about that chart section inthe grid below the chart. For example, clicking complete planning units in Educationon the chart displays specific details about those planning units.
l Tree View—Displays planning units as a hierarchy. You can search for a specific planningunit by name, by alias, or both.
Note: The Tree View is only visible to the administrator and to users provisioned withroles to manage tree views.
The grid below the chart in the Process Status, Level Status, and Group Status views displayscolumns for Planning Unit, Approvals Status, Sub-Status, Current Owner, Location, Path,and other Details. Above the grid, you can select an option from the Actions menu or clickan icon to perform the following actions:
l Display My Planning Units— Display only the planning units for which you arethe owner.
l Clear All Filters— Clear all the filters that you have set.
l Default Sort— Sort alphabetically in the default hierarchical sort order.
l Validate—Validate data for the selected planning unit against any existingvalidation rules.
l Change Status— Change the status of the planning unit.
l Refresh— Refresh the screen to ensure that all the change you have made aredisplayed.
In addition to the above actions, you can use the View menu to select which columns to
display or to reorder the columns, and click (or select Detach from the View menu)to detach the panel collection and render the table over the page that contains it.
For the Tree View, the grid displays columns for Planning Unit, Plan Cycle (where you canstart or exclude a planning unit), Approvals Status, Sub-Status, Current Owner, Location,Path, and other Details. Above the grid, use the menus and icons to perform the followingactions:
l Actions—Select Refresh to ensure that all the change you have made are displayed. You
can also click to refresh the data.
90 Managing Planning Units
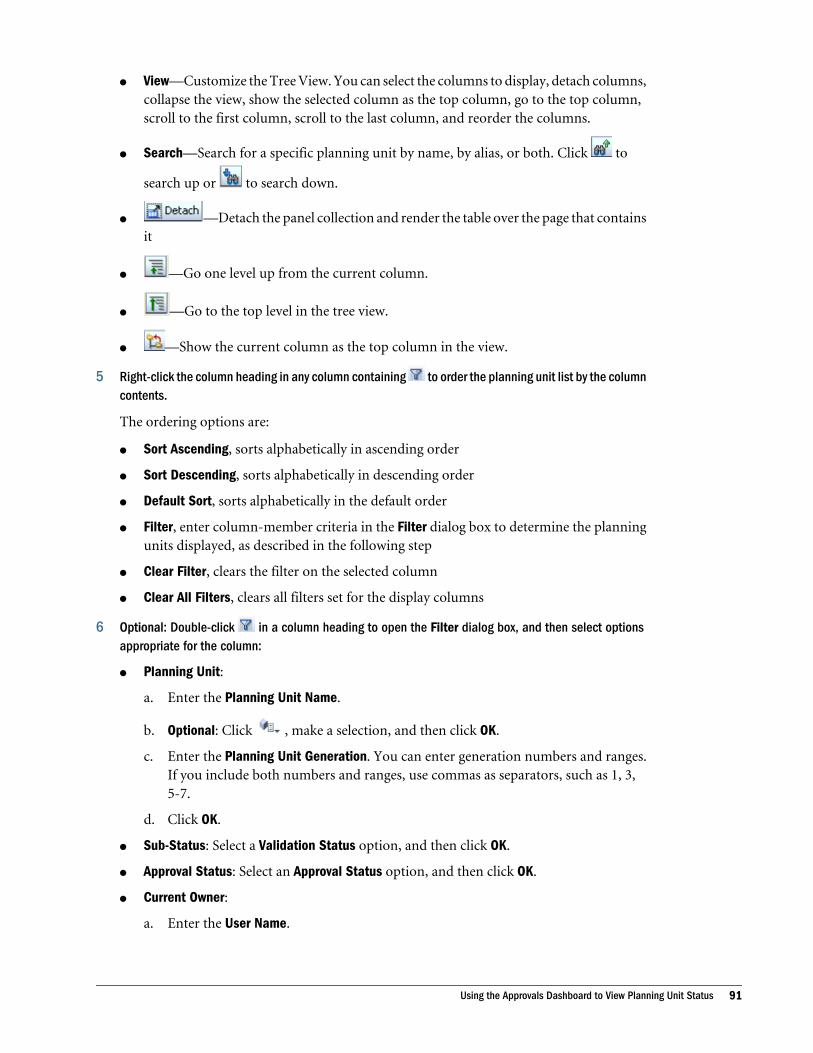
l View—Customize the Tree View. You can select the columns to display, detach columns,collapse the view, show the selected column as the top column, go to the top column,scroll to the first column, scroll to the last column, and reorder the columns.
l Search—Search for a specific planning unit by name, by alias, or both. Click to
search up or to search down.
l —Detach the panel collection and render the table over the page that containsit
l —Go one level up from the current column.
l —Go to the top level in the tree view.
l —Show the current column as the top column in the view.
5 Right-click the column heading in any column containing to order the planning unit list by the columncontents.
The ordering options are:
l Sort Ascending, sorts alphabetically in ascending order
l Sort Descending, sorts alphabetically in descending order
l Default Sort, sorts alphabetically in the default order
l Filter, enter column-member criteria in the Filter dialog box to determine the planningunits displayed, as described in the following step
l Clear Filter, clears the filter on the selected column
l Clear All Filters, clears all filters set for the display columns
6 Optional: Double-click in a column heading to open the Filter dialog box, and then select optionsappropriate for the column:
l Planning Unit:
a. Enter the Planning Unit Name.
b. Optional: Click , make a selection, and then click OK.
c. Enter the Planning Unit Generation. You can enter generation numbers and ranges.If you include both numbers and ranges, use commas as separators, such as 1, 3,5-7.
d. Click OK.
l Sub-Status: Select a Validation Status option, and then click OK.
l Approval Status: Select an Approval Status option, and then click OK.
l Current Owner:
a. Enter the User Name.
Using the Approvals Dashboard to View Planning Unit Status 91
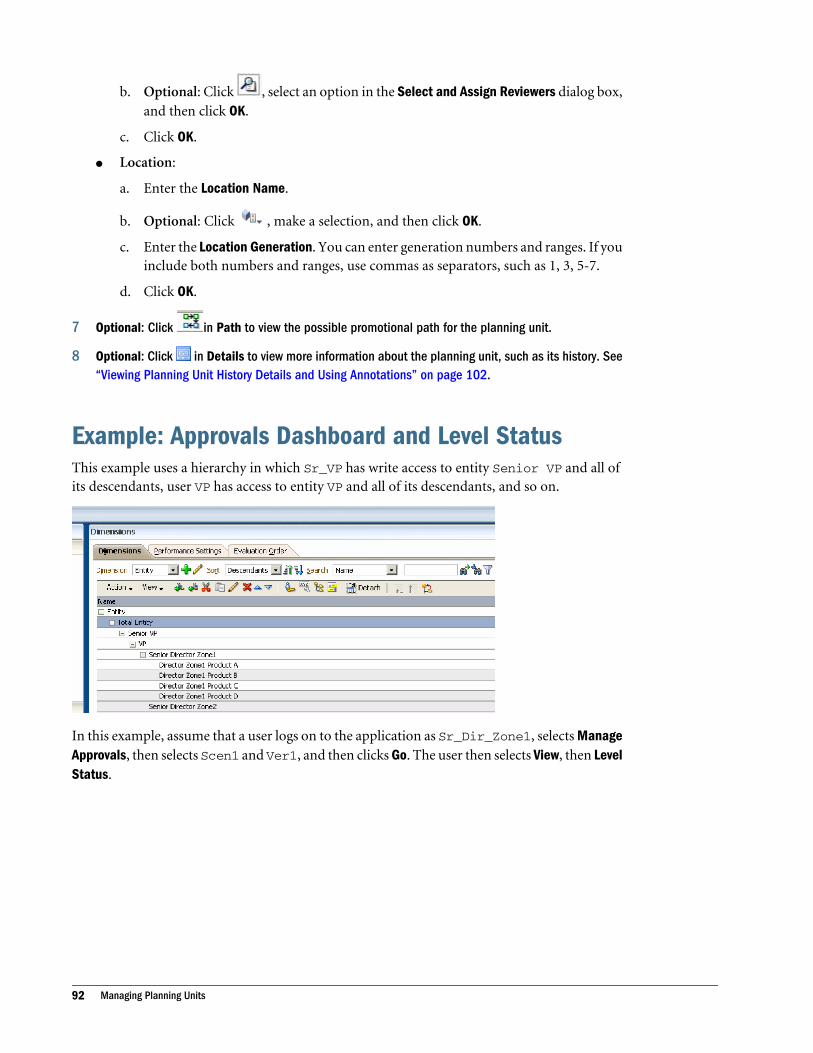
b. Optional: Click , select an option in the Select and Assign Reviewers dialog box,and then click OK.
c. Click OK.
l Location:
a. Enter the Location Name.
b. Optional: Click , make a selection, and then click OK.
c. Enter the Location Generation. You can enter generation numbers and ranges. If youinclude both numbers and ranges, use commas as separators, such as 1, 3, 5-7.
d. Click OK.
7 Optional: Click in Path to view the possible promotional path for the planning unit.
8 Optional: Click in Details to view more information about the planning unit, such as its history. See“Viewing Planning Unit History Details and Using Annotations” on page 102.
Example: Approvals Dashboard and Level StatusThis example uses a hierarchy in which Sr_VP has write access to entity Senior VP and all ofits descendants, user VP has access to entity VP and all of its descendants, and so on.
In this example, assume that a user logs on to the application as Sr_Dir_Zone1, selects ManageApprovals, then selects Scen1 and Ver1, and then clicks Go. The user then selects View, then LevelStatus.
92 Managing Planning Units
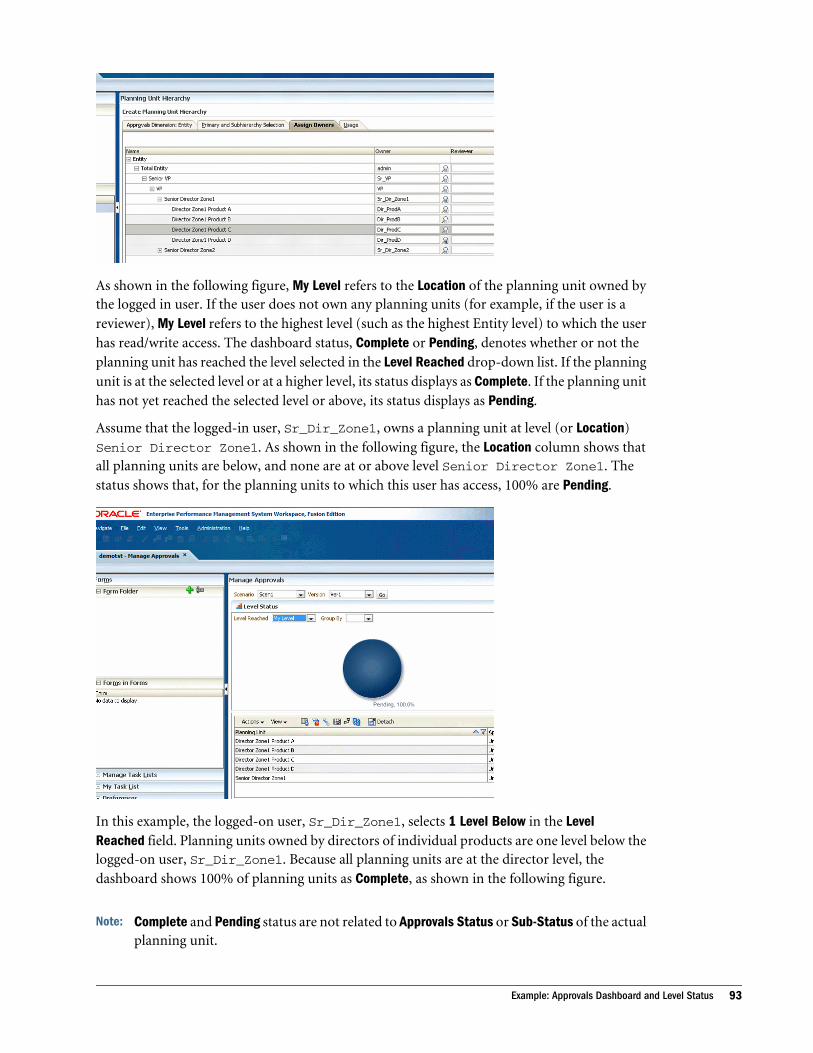
As shown in the following figure, My Level refers to the Location of the planning unit owned bythe logged in user. If the user does not own any planning units (for example, if the user is areviewer), My Level refers to the highest level (such as the highest Entity level) to which the userhas read/write access. The dashboard status, Complete or Pending, denotes whether or not theplanning unit has reached the level selected in the Level Reached drop-down list. If the planningunit is at the selected level or at a higher level, its status displays as Complete. If the planning unithas not yet reached the selected level or above, its status displays as Pending.
Assume that the logged-in user, Sr_Dir_Zone1, owns a planning unit at level (or Location)Senior Director Zone1. As shown in the following figure, the Location column shows thatall planning units are below, and none are at or above level Senior Director Zone1. Thestatus shows that, for the planning units to which this user has access, 100% are Pending.
In this example, the logged-on user, Sr_Dir_Zone1, selects 1 Level Below in the LevelReached field. Planning units owned by directors of individual products are one level below thelogged-on user, Sr_Dir_Zone1. Because all planning units are at the director level, thedashboard shows 100% of planning units as Complete, as shown in the following figure.
Note: Complete and Pending status are not related to Approvals Status or Sub-Status of the actualplanning unit.
Example: Approvals Dashboard and Level Status 93
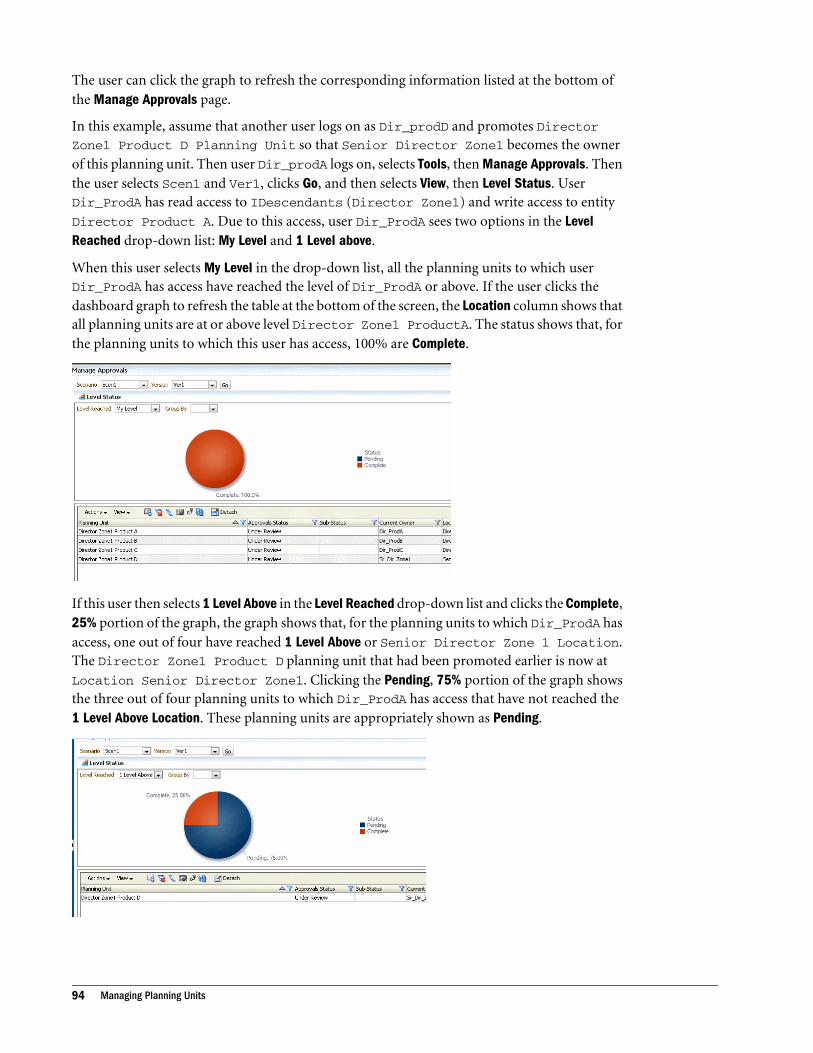
The user can click the graph to refresh the corresponding information listed at the bottom ofthe Manage Approvals page.
In this example, assume that another user logs on as Dir_prodD and promotes DirectorZone1 Product D Planning Unit so that Senior Director Zone1 becomes the ownerof this planning unit. Then user Dir_prodA logs on, selects Tools, then Manage Approvals. Thenthe user selects Scen1 and Ver1, clicks Go, and then selects View, then Level Status. UserDir_ProdA has read access to IDescendants (Director Zone1) and write access to entityDirector Product A. Due to this access, user Dir_ProdA sees two options in the LevelReached drop-down list: My Level and 1 Level above.
When this user selects My Level in the drop-down list, all the planning units to which userDir_ProdA has access have reached the level of Dir_ProdA or above. If the user clicks thedashboard graph to refresh the table at the bottom of the screen, the Location column shows thatall planning units are at or above level Director Zone1 ProductA. The status shows that, forthe planning units to which this user has access, 100% are Complete.
If this user then selects 1 Level Above in the Level Reached drop-down list and clicks the Complete,25% portion of the graph, the graph shows that, for the planning units to which Dir_ProdA hasaccess, one out of four have reached 1 Level Above or Senior Director Zone 1 Location.The Director Zone1 Product D planning unit that had been promoted earlier is now atLocation Senior Director Zone1. Clicking the Pending, 75% portion of the graph showsthe three out of four planning units to which Dir_ProdA has access that have not reached the1 Level Above Location. These planning units are appropriately shown as Pending.
94 Managing Planning Units

Example: Approvals Dashboard and Group StatusGroup Status is a different way of visualizing the information shown by the Level Status option.As with the previous example, this example uses a hierarchy in which user Sr_VP has write accessto entity Senior VP and all of its descendants, user VP has access to entity VP and all of itsdescendants, and so on.
In this example, consider that a user logs on as Dir_prodA, selects Tools, then ManageApprovals, then selects Scen1 and Ver1, and then clicks Go. The user then selects View, thenGroup Status. As shown in “Example: Approvals Dashboard and Level Status” on page 92, whenuser Dir_ProdA selects My Level, all planning units to which this user has access have reachedthis level or a higher level, so all planning units are shown as complete. As shown in followingfigure, four planning units at My Level are also displayed as Complete.
Assume that Dir_ProdA then selects 1 Level Above in the Level Reached drop-down list, selectsMy Level in the Group By drop-down list, and then selects Location from the List By drop-downlist. As shown in the following figure, the graph shows that 1 Level Above is associated withLocation Senor Director Zone1. One planning unit, Director Zone 1 Product D,has reached this level. The other three planning units have not yet reached this level. Threeplanning units are displayed as Pending, and one planning unit is displayed as Complete.
Example: Approvals Dashboard and Group Status 95

In this example, assume that the user selects 1 Level Above in the Group By drop-down list. Theuser can then click portions of the graph to view the details displayed in the table at the bottomof the screen. Note that the Group By and List By selections do not change the content of theinformation shown for the Level Reached option. Selecting different options in the Group Bydrop-down list changes the visual representation of the information displayed by the optionselected in the Level Reached drop-down list. Selecting different options from the List By drop-down list changes the label on the horizontal axis of the graph.
Validating Planning UnitsThe planning unit moves from one reviewer to another until the budget process is complete.Each reviewer must validate the planning unit before sending the budget to the next reviewer.
96 Managing Planning Units

The validation runs all data validation rules defined for the planning unit with which the revieweris working, and reports any data errors or changes in the planning unit promotional path.
The selected Approvals template determines the first user to review the budget. The first usercompletes the assigned tasks, then promotes (Bottom Up template) or submits (Distributetemplate) the budget. If approvals notifications are set in preferences, the next owner is alertedthat the budget requires attention. Other users may also be notified when the budget passes fromone user to another.
The review process follows the promotional path unless an event triggers a change. Events thataffect the promotional path include:
l Exceeding or not reaching expense boundaries for budget items such as salaries, new hiresor capital equipment
l The current owner returning the budget to the previous owner for additional information
l The current owner requesting help from an authorized user who is not necessarily on thepromotional path
ä To validate planning units:
1 Select Tools, and then Manage Approvals.
2 For Scenario, select a scenario.
3 For Version, select a version.
4 Click Go to display the planning units associated with the selected scenario and version combination.
The planning units listed are enabled for approvals. You can display planning unit membersas a tree or a flat list, expand the hierarchy, and click a column header to sort the list.
5 Order the planning unit list by its contents by right-clicking the column heading in any column containing
. Filter the list by double-clicking in a column heading to open the Filter dialog box, and then selectingoptions appropriate for the column.
For detailed information on ordering and filtering planning units, see steps 5 and 6 in “Usingthe Approvals Dashboard to View Planning Unit Status” on page 89.
6 Select Process View, select the planning unit, and then click Validate to run all data validation rulesassociated with the planning unit.
If the conditions in all associated data validation rules are met, the message No AdditionalApproval Needed is displayed in Sub-Status. This indicates that the planning unit can bepromoted.
7 If any other message is displayed, review the data validation report, and then take any necessary actions.See “Viewing and Resolving Planning Unit Validation Problems” on page 98.
Note: You cannot validate a planning unit that has not been started.
Note: Selecting Promote also runs the validation rules defined for the planning unit. If theconditions in all associated data validation rules are met, the planning unit ispromoted to the next owner defined in the planning unit promotional path.
Validating Planning Units 97
Viewing and Resolving Planning Unit ValidationProblemsWhen planning unit validation returns a message indicating a problem, review the validationreport, correct any data errors found, and take any other necessary actions.
If an administrator used the application monitor to perform diagnostics and evaluate theapplication or application artifacts, some of the validations sub statuses identified in thefollowing procedure could occur due to the internal checks the application monitor performsat runtime. See Administering Planning for Oracle Planning and Budgeting Cloud Service forinformation.
ä To view and resolve validation problems:
1 Check the message in Sub-Status for the planning unit, and then make the necessary changes to fixthe problem.
For example, if the message is “Failed: Unauthorized New Owner,” specify an authorizedowner as the next reviewer. The possible problem messages in Sub-Status are:
l Failed: Unexpected error
l Failed: Not Enough Access
l Failed: No Rule Defined For Action
l Failed: Unauthorized New Owner
l Failed: Incorrect Owner Specified
l Failed: Invalid Data
l Failed: Additional Approval Required
l Failed: Ambiguous Automatic User
l Failed: Circular Out of Office
l Failed: No Essbase Connection
l Failed: Threshold Exceeded
l Failed: Intelligent Page Reduction
2 If the message is “Failed: Invalid Data,” or “Failed: Additional Approval Required,” click the messageto view the validation report, and then find and resolve the problems as follows:
a. Review the validation report messages.
Note: Depending on whether you are working in EPM Workspace or StandalonePlanning, the validation report opens in a new tab or a new browser window.
b. In the left pane, click each page name to view the forms containing the error or message,and then click each page combination to open the form and display its validation errorsand messages.
c. Resolve any data errors and take any necessary actions for each page, and then clickSave to save the changes.
98 Managing Planning Units
d. Close the tab or browser to close the validation report, and then select the Approvalspage.
e. Click Validate again to ensure that the planning unit no longer has any validationproblems.
If problems exist, fix them, and then revalidate until all problems are resolved.
Changing Planning Unit StatusPlanning units change status each time reviewers pass the budget to another reviewer. Planningunits are assigned a status based on what action a reviewer takes to send the budget to anotherreviewer.
Note: If the status of a parent planning unit changes, all its children change too, unless they wereexcluded during the First Pass state or were approved.
ä To change planning unit status:
1 Select Tools, and then Manage Approvals.
2 From Scenario, select a valid scenario, and then from Version, select a valid version.
3 Click Go.
4 Click Details for the appropriate planning unit.
5 From Select Action, select:
l Originate: Changes the ownership of all selected planning units (including alldescendants) to the first owner defined for that planning unit in the planning unithierarchy.
Note: The planning unit first owner differs between the Distribute and Bottom Uptemplates. With the Distribute template, the first owner is the owner at the topof the planning unit hierarchy. With the Bottom Up template, the first owner isan owner at the bottom of the planning unit hierarchy.
l Start: Begins the budget process, and changes the planning unit status to First Pass. Thisaction is available in Tree View.
l Promote: Passes the planning unit to another user to review. This action assignsownership of a planning unit the first time, and thereafter transfers ownership of aplanning unit from one reviewer to another. Promote causes an implicit sign-off by thecurrent owner and changes the planning unit status to Under Review.
l Exclude: Excludes a planning unit from the budget process. This action is available inTree View.
l Reject: Indicates the planning unit requires more work from the previous owner. Rejecttypically requires the previous owner to create another iteration. By default, Reject
Changing Planning Unit Status 99

returns planning unit ownership to the previous owner, but you may select the nextowner. Reject changes the planning unit status to Not Signed Off.
l Approve: Approves the planning unit and changes its status to Approved. With theDistribute or Bottom Up templates, only the last owner in the promotional path canapprove the planning unit. With the Free Form template, a user can approve planningunits from any status except Not Started. Only an administrator can approve from a NotSigned Off or First Pass status.
Approving a planning unit is an implicit reviewer sign-off. Typically, a planning unit isapproved only once. However, an administrator can reject an approved planning unit,requiring a second approval.
l Delegate: Passes ownership to a user not on the promotional path. Select a user fromSelect Next Owner to pass ownership to that user. The specified user selects Promote whendone to return the budget to the first approver on the promotional path. This action isavailable with the Bottom Up and Distribute templates.
l Take Ownership: Become the owner of the planning unit and any level 0 planning unitsunder a selected parent planning unit. Available to the current user and users above thecurrent planning unit owner in the planning unit hierarchy.
l Freeze: Locks all related data in descendant planning units. This action makes all relateddata read only, but does not change ownership of any planning unit.
l Distribute, Distribute Children, or Distribute Owner: Passes planning unit ownership tomultiple users. Distribute actions work differently, depending on the current locationof the budget in the planning unit hierarchy. These actions are for a planning unithierarchy using the Distribute template.
Distribute assigns ownership to the members at the current level of the planning unithierarchy. Distribute Children assigns planning unit ownership to the children of thecurrent owner. Distribute Owner assigns planning unit ownership to the level 0 ownerdefined during planning unit hierarchy creation.
l Sign Off: Signs off on a planning unit. Sign Off does not transfer ownership of the planningunit, but changes its state to Signed Off.
l Submit: Submit the planning unit to the next level.
l Submit to Top: Give ownership to the top user defined in the hierarchy.
l Reopen: Reopen an approved planning unit.
6 Optional: Click Add Annotation to enter comments.
See “Adding or Viewing Planning Unit Annotations” on page 101.
7 Click Done.
100 Managing Planning Units

Adding or Viewing Planning Unit AnnotationsAnnotations are comments about the data in a started planning unit. You must have at leastread access to the planning unit to view or add an annotation. Annotations can vary bycombinations of scenario, version, and planning unit members.
ä To add a planning unit annotation:
1 Select Tools, and then Manage Approvals.
2 From Scenario, select a valid scenario, and then from Version, select a valid version.
3 Click Go.
4 Click Details for the appropriate planning unit.
5 Click Add Annotation.
6 In Enter Title, enter an annotation title.
7 In Enter Annotation, enter your comments (up to 1500 characters; however, on multibyte systems,Oracle recommends limiting annotations to 750 characters).
Note: You can enter a URL that will display as a hyperlink when the annotation is viewed.
8 Click Submit.
Note: You can also add annotations to planning units from the Enter Data page. To displaythis page, select a planning unit, click Edit, and then click Annotate Planning Units.
ä To view annotations for a planning unit:
1 Select Tools, and then Manage Approvals.
2 From Scenario, select a valid scenario, and then from Version, select a valid version.
3 Click Go.
4 Click Details for the planning unit to view.
5 Under Existing Annotations, read the planning unit's comments.
6 Click Done.
Printing Planning Unit AnnotationsAdministrators can print planning unit annotation reports.
Adding or Viewing Planning Unit Annotations 101
Viewing Planning Unit History Details and UsingAnnotationsAccessing planning unit details enables you to perform these tasks using the two tabs that aredisplayed:
l View historic information pertaining to the planning units to which you have read accessusing the History tab. This tab provides information such as the last action performed on theplanning unit, when the action was taken, the planning units approval status, and its currentowner. You can also modify planning unit status on this tab.
l Read and create annotations to view or provide additional information about planning unitsusing the Annotations tab.
ä To view planning unit details:
1 Select Tools, and then Manage Approvals.
2 From Scenario, select a valid scenario, and, from Version, select a valid version.
3 Click Go.
4 Click in Details to display additional information about the planning unit's history.
5 On History, select Change Status to change the status of the planning unit (for example, promote theplanning unit). See “Changing Planning Unit Status” on page 99. You can also view the users or groupsto which you can submit the planning unit for consideration by selecting Action and then PotentialPromotional Path.
6 Select Annotations to read or attach notes to the planning unit.
Selecting an Alternate ReviewerWhen a reviewer is out of the office during the budget review process, you can select an alternatereviewer to handle review responsibilities while the user is away. Use the Out of OfficeAssistant to return review responsibilities to users when they return.
ä To select an alternate reviewer:
1 Select Tools, and then Manage Approvals.
2 Click the link for Out of Office Assistant.
3 Select I am currently out of the office.
4 From Select Action, select an action:
l Promote
l Reject
l Delegate
l Submit
102 Managing Planning Units
5 Select an alternate reviewer from Select Next Owner.
6 Optional: Enter an annotation.
7 When the user returns, clear I am currently out of the office.
8 Click Save.
ä To return review responsibilities when users return:
1 Select Tools, and then Manage Approvals.
2 Click the link for the Out of Office Assistant.
3 In the Out of Office Assistant dialog box, clear I am currently out of the office.
4 Click Save.
Selecting an Alternate Reviewer 103

104 Managing Planning Units
11Setting User Preferences
In This Chapter
Setting Preferences for Application Settings ... . . . . . . . . . . . . . . . . . . . . . . . . . . . . . . . . . . . . . . . . . . . . . . . . . . . . . . . 105
Setting Preferences for Display Options ... . . . . . . . . . . . . . . . . . . . . . . . . . . . . . . . . . . . . . . . . . . . . . . . . . . . . . . . . . . . . 109
Setting Preferences for Printing Options ... . . . . . . . . . . . . . . . . . . . . . . . . . . . . . . . . . . . . . . . . . . . . . . . . . . . . . . . . . . . . 114
Setting Preferences for User Variables ... . . . . . . . . . . . . . . . . . . . . . . . . . . . . . . . . . . . . . . . . . . . . . . . . . . . . . . . . . . . . . . 115
Setting Preferences for Application Settings
Subtopics
l Setting Up Email
l Alias and Member Setting
l Setting Approvals Options
l Setting the Reporting Currency
In the Preferences page, use the Application Settings tab to set preferences:
l Set up email for Approvals and job notifications. See “Setting Up Email” on page 106.
l Select a set of alias names for displaying dimension and member names. See “Alias andMember Setting” on page 106.
l Set Approvals options and out of office settings. See “Setting Approvals Options” on page108 and “Selecting an Alternate Reviewer” on page 102.
l In a multicurrency application, set the reporting currency in which to display aggregatedplanning unit values. See “Setting the Reporting Currency” on page 108.
Note: To reset an option to the value set by an administrator, select Use ApplicationDefault.
Set other preferences on these tabs:
l Display Options: See “Setting Preferences for Display Options” on page 109
l User Variable Options: See “Setting Preferences for User Variables” on page 115
Setting Preferences for Application Settings 105
Setting Up EmailWhen email is set up and notification is enabled, Planning notifies users when they become theplanning unit's owner or are named as a user to notify for a specific budget action.
ä To set up and enable email notification for yourself:
1 Select File, and then Preferences or select Preferences in the left hand frame.
2 Click the Planning icon, and then select Application Settings.
3 In Email Address, enter your email address.
4 From Task List Notification and Approvals Options, select Yes or No.
5 From Job Console Notification, select Yes if you want to be notified by email when a job that you launch(for example, a business rule) is completed or generates an error.
6 Click OK.
You now receive email notifications when you become a planning unit's owner or a user tonotify. The Subject line is formatted as: NEW OWNER: Abc Plan (Scenario, Version, Entity).
7 Repeat these steps for each application for which you want email notification enabled.
Alias and Member Setting
Subtopics
l Where you can Define Alias and Member Display Settings
l Defining Alias and Member Display Options Using Preferences
To make dimensions and members more easily recognizable, administrators can assign alternate,descriptive names called aliases, to Account, Entity, Currency, Scenario, Period, Version, Year,and user-defined dimensions and members. If they do, you can select which set of aliases to usefor displaying dimension and member names. For example, one alias table could displaymembers in French, and another could display members in German.
You can apply the following member and alias display options in various locations. See “Whereyou can Define Alias and Member Display Settings” on page 106.
l Default—Display the data determined by the form, grid, or dimension settings
l Member name—Just member names
l Alias—Just member aliases, if defined
l Member name : Alias—Names followed by aliases, if defined
l Alias:Member name—Alias, if defined, followed by the names
Where you can Define Alias and Member Display SettingsMember and alias display settings can be defined as follows:
106 Setting User Preferences
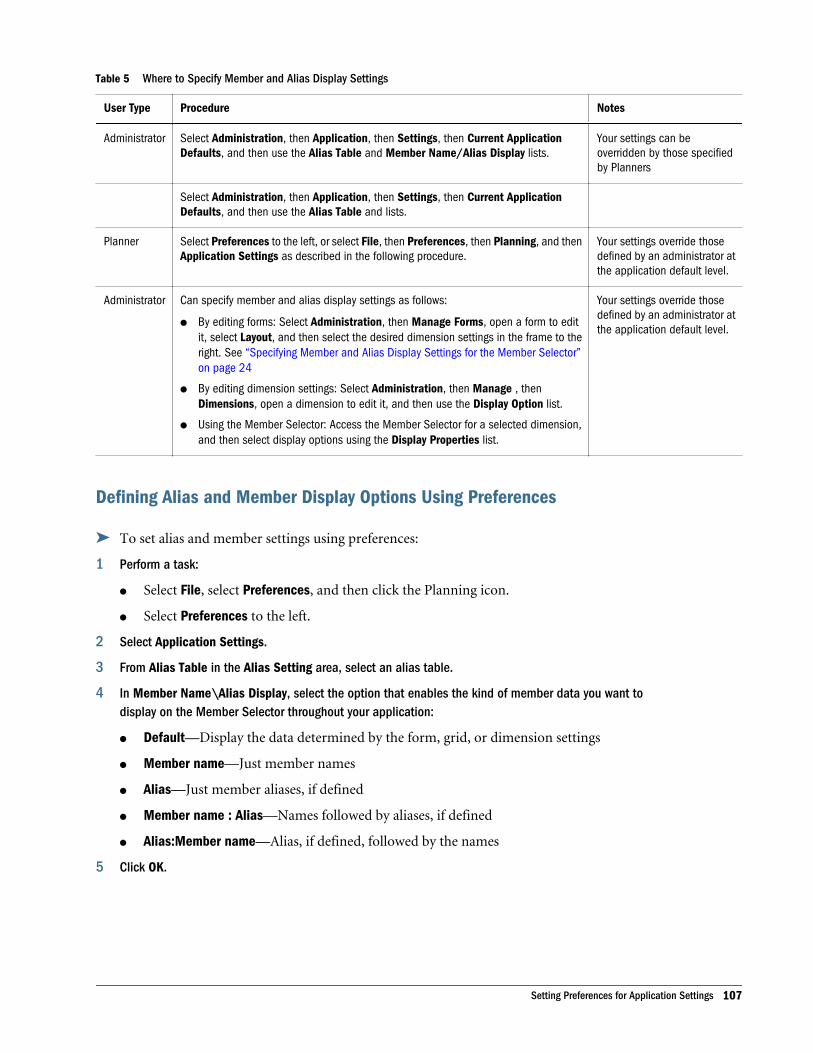
Table 5 Where to Specify Member and Alias Display Settings
User Type Procedure Notes
Administrator Select Administration, then Application, then Settings, then Current ApplicationDefaults, and then use the Alias Table and Member Name/Alias Display lists.
Your settings can beoverridden by those specifiedby Planners
Select Administration, then Application, then Settings, then Current ApplicationDefaults, and then use the Alias Table and lists.
Planner Select Preferences to the left, or select File, then Preferences, then Planning, and thenApplication Settings as described in the following procedure.
Your settings override thosedefined by an administrator atthe application default level.
Administrator Can specify member and alias display settings as follows:
l By editing forms: Select Administration, then Manage Forms, open a form to editit, select Layout, and then select the desired dimension settings in the frame to theright. See “Specifying Member and Alias Display Settings for the Member Selector”on page 24
l By editing dimension settings: Select Administration, then Manage , thenDimensions, open a dimension to edit it, and then use the Display Option list.
l Using the Member Selector: Access the Member Selector for a selected dimension,and then select display options using the Display Properties list.
Your settings override thosedefined by an administrator atthe application default level.
Defining Alias and Member Display Options Using Preferences
ä To set alias and member settings using preferences:
1 Perform a task:
l Select File, select Preferences, and then click the Planning icon.
l Select Preferences to the left.
2 Select Application Settings.
3 From Alias Table in the Alias Setting area, select an alias table.
4 In Member Name\Alias Display, select the option that enables the kind of member data you want todisplay on the Member Selector throughout your application:
l Default—Display the data determined by the form, grid, or dimension settings
l Member name—Just member names
l Alias—Just member aliases, if defined
l Member name : Alias—Names followed by aliases, if defined
l Alias:Member name—Alias, if defined, followed by the names
5 Click OK.
Setting Preferences for Application Settings 107
Setting Approvals OptionsFor Approvals tasks, you can specify a reviewer to replace a reviewer who is out of the office.You can also set these display options:
l Members’ names (which may be cryptic) or their aliases, if they have them
l Planning units that are not started with those that are started
ä To set Approvals options
1 Select Preferences in the left hand frame, or select File, and then Preferences.
2 Click the Planning icon, and then select Application Settings.
3 Under Approvals Options, select Yes to set these display preferences:
l Show Planning Units As Aliases: Displays members’ aliases instead of their names onApprovals pages
l Show Planning Units That Are Not Started: Displays planning units that are started andnot started. (This option affects only the flat list view, not the tree list view.)
4 Optional: Click the link for the Out of Office Assistant to set up an alternate budget reviewer while thecurrent reviewer is out of the office, or to reset reviewer responsibilities when the reviewer returns. See“Selecting an Alternate Reviewer” on page 102.
5 Click OK.
Setting the Reporting CurrencyIn multicurrency applications, users can set the reporting currency in which to display aggregatedplanning unit values (if an administrator has fully defined the planning unit intersection). Forexample, before approving your budget, you can see your total budget's value. The value isformatted using your preference as described in this section, or the application settings if theUse Application Defaults option is selected. The selected reporting currency member determinesthe precision, scale, and currency symbol settings. If you do not set the reporting currency in amulticurrency application, the aggregated planning unit value is displayed in the application'sbase currency.
ä To set the reporting currency:
1 Select File, and then Preferences.
2 Click the Planning icon, and then select Application Settings.
3 Under Reporting Currency, click the member selector.
4 Select the currency in which to display aggregated planning units, and then click OK.
108 Setting User Preferences
Setting Preferences for Display Options
Subtopics
l Changing the Formatting of Numbers
l Indenting Members on the Page Drop-Down List
l Enabling Search with a Large Number of Pages
l Showing Consolidation Operators
l Opening Part of a Form
l Showing Records on the Dimensions and Assign Access Pages
l Viewing the Interface in Higher Contrast
l Setting Text Size
l Setting the Date Format
l Specifying how Many Form Rows and Columns are Populated
In the Preferences page, use the Display Options tab to:
l Specify the number of grid rows and columns to populate for loaded forms. This enablesyou to determine the size of the form users will scroll. If you do not specify this setting, 25rows and 17 columns are fetched.
l Change how numbers display in forms. See “Changing the Formatting of Numbers” on page109.
l Set aspects of page display. See “Enabling Search with a Large Number of Pages” on page111, and “Indenting Members on the Page Drop-Down List” on page 111.
l Control the display of consolidation operators in forms. See “Showing ConsolidationOperators” on page 111.
l Enable warning for large forms.
l Open part of a form.
l Set how many members to display on each page of the Dimensions page.
l Set how many users and groups display on each Assign Access page.
l Increase the Planning interface contrast. See “Viewing the Interface in Higher Contrast” onpage 112.
l Enlarge the screen text size.
l Set the display of dates. See “Setting the Date Format” on page 113.
Changing the Formatting of NumbersOn the User Preferences page, you can change the formatting of numbers in the DisplayOptions tab. Your selections apply to all currencies, in all forms that you have access to in thecurrent application. These choices override the settings for individual currencies set by youradministrator.
Setting Preferences for Display Options 109
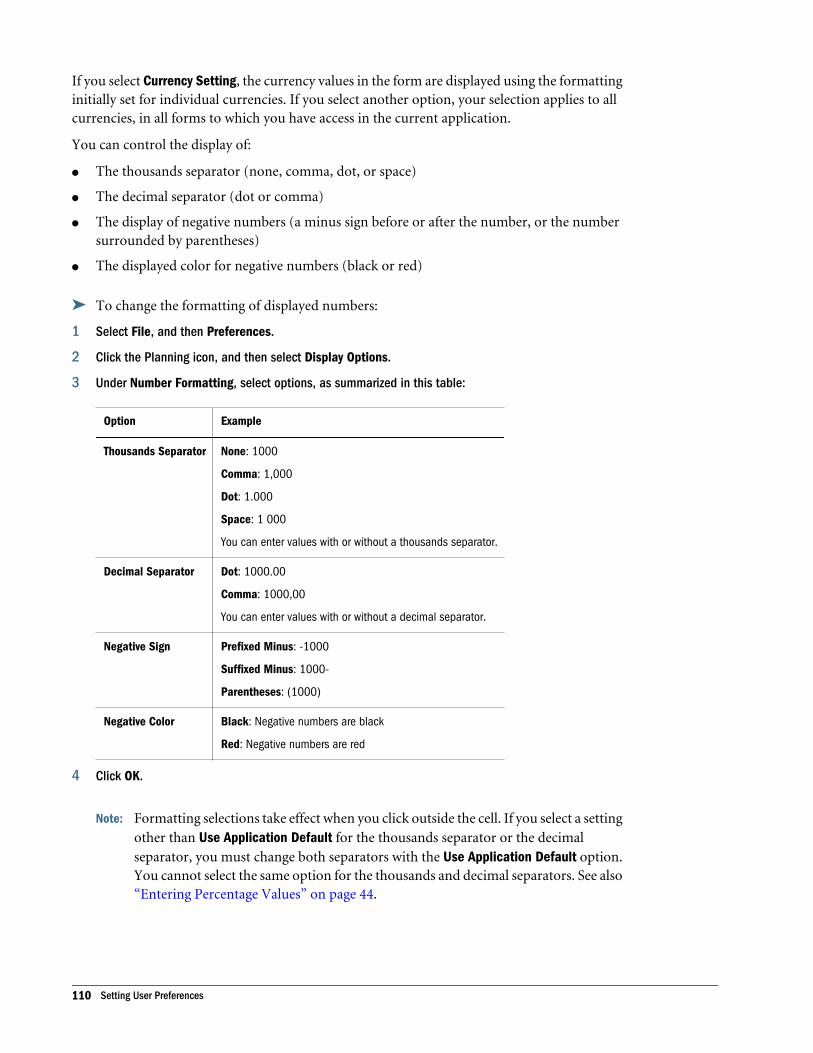
If you select Currency Setting, the currency values in the form are displayed using the formattinginitially set for individual currencies. If you select another option, your selection applies to allcurrencies, in all forms to which you have access in the current application.
You can control the display of:
l The thousands separator (none, comma, dot, or space)
l The decimal separator (dot or comma)
l The display of negative numbers (a minus sign before or after the number, or the numbersurrounded by parentheses)
l The displayed color for negative numbers (black or red)
ä To change the formatting of displayed numbers:
1 Select File, and then Preferences.
2 Click the Planning icon, and then select Display Options.
3 Under Number Formatting, select options, as summarized in this table:
Option Example
Thousands Separator None: 1000
Comma: 1,000
Dot: 1.000
Space: 1 000
You can enter values with or without a thousands separator.
Decimal Separator Dot: 1000.00
Comma: 1000,00
You can enter values with or without a decimal separator.
Negative Sign Prefixed Minus: -1000
Suffixed Minus: 1000-
Parentheses: (1000)
Negative Color Black: Negative numbers are black
Red: Negative numbers are red
4 Click OK.
Note: Formatting selections take effect when you click outside the cell. If you select a settingother than Use Application Default for the thousands separator or the decimalseparator, you must change both separators with the Use Application Default option.You cannot select the same option for the thousands and decimal separators. See also“Entering Percentage Values” on page 44.
110 Setting User Preferences
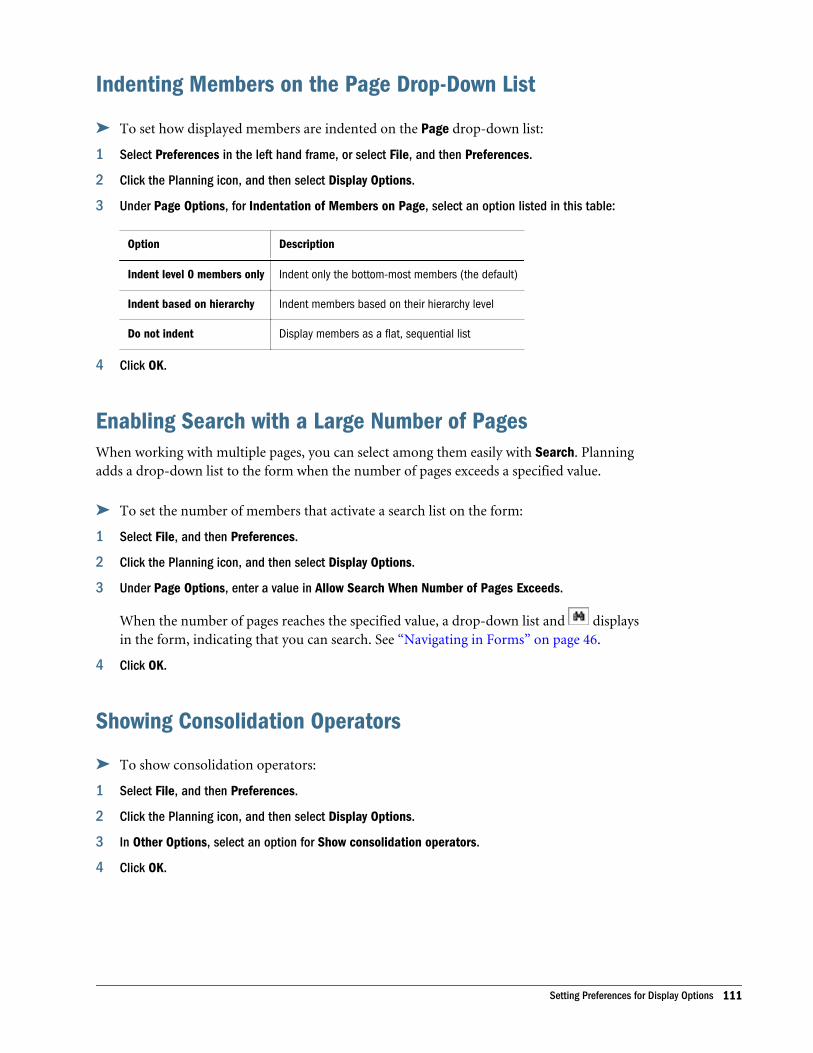
Indenting Members on the Page Drop-Down List
ä To set how displayed members are indented on the Page drop-down list:
1 Select Preferences in the left hand frame, or select File, and then Preferences.
2 Click the Planning icon, and then select Display Options.
3 Under Page Options, for Indentation of Members on Page, select an option listed in this table:
Option Description
Indent level 0 members only Indent only the bottom-most members (the default)
Indent based on hierarchy Indent members based on their hierarchy level
Do not indent Display members as a flat, sequential list
4 Click OK.
Enabling Search with a Large Number of PagesWhen working with multiple pages, you can select among them easily with Search. Planningadds a drop-down list to the form when the number of pages exceeds a specified value.
ä To set the number of members that activate a search list on the form:
1 Select File, and then Preferences.
2 Click the Planning icon, and then select Display Options.
3 Under Page Options, enter a value in Allow Search When Number of Pages Exceeds.
When the number of pages reaches the specified value, a drop-down list and displaysin the form, indicating that you can search. See “Navigating in Forms” on page 46.
4 Click OK.
Showing Consolidation Operators
ä To show consolidation operators:
1 Select File, and then Preferences.
2 Click the Planning icon, and then select Display Options.
3 In Other Options, select an option for Show consolidation operators.
4 Click OK.
Setting Preferences for Display Options 111

Opening Part of a FormIf unusually large forms require significant time to open, you can select an option to open partof the form by setting the Partial Grid Fetch Size display option, and specifying the number ofrows and columns to open. When using this display option, use care to set the number of rowsand columns to the smallest possible number. Setting this option to higher numbers couldimpact performance on the form.
ä To open part of a form:
1 Select File, and then Preferences.
2 Click the Planning icon, and then select Display Options.
3 In Other Options, in Partial Grid Fetch Size option, enter the number of rows and columns, separatedby a comma (,).
Caution! The number of rows and columns specified for the Partial Grid Fetch Size optionshould be as small as possible. If large numbers are used, the form will load moreslowly, and operations on the form will take more time.
4 Click OK.
Showing Records on the Dimensions and Assign AccessPagesAdministrators can set how many records display on each page of the Dimensions and AssignAccess pages.
ä To set the number of records displayed:
1 Select File, and then Preferences.
2 Click the Planning icon, and then select Display Options.
3 In Other Options:
l To set the number of members displayed on the Dimensions page: Enter a number inShow the Specified Members on Each Dimensions Page.
l To set the number of users or groups displayed on the Assign Access page: Enter anumber in Show the Specified Records on Each Assign Access Page.
4 Click OK.
Viewing the Interface in Higher ContrastFor better accessibility, you can view the Planning interface in higher contrast. The highercontrast lasts only for the current session.
112 Setting User Preferences
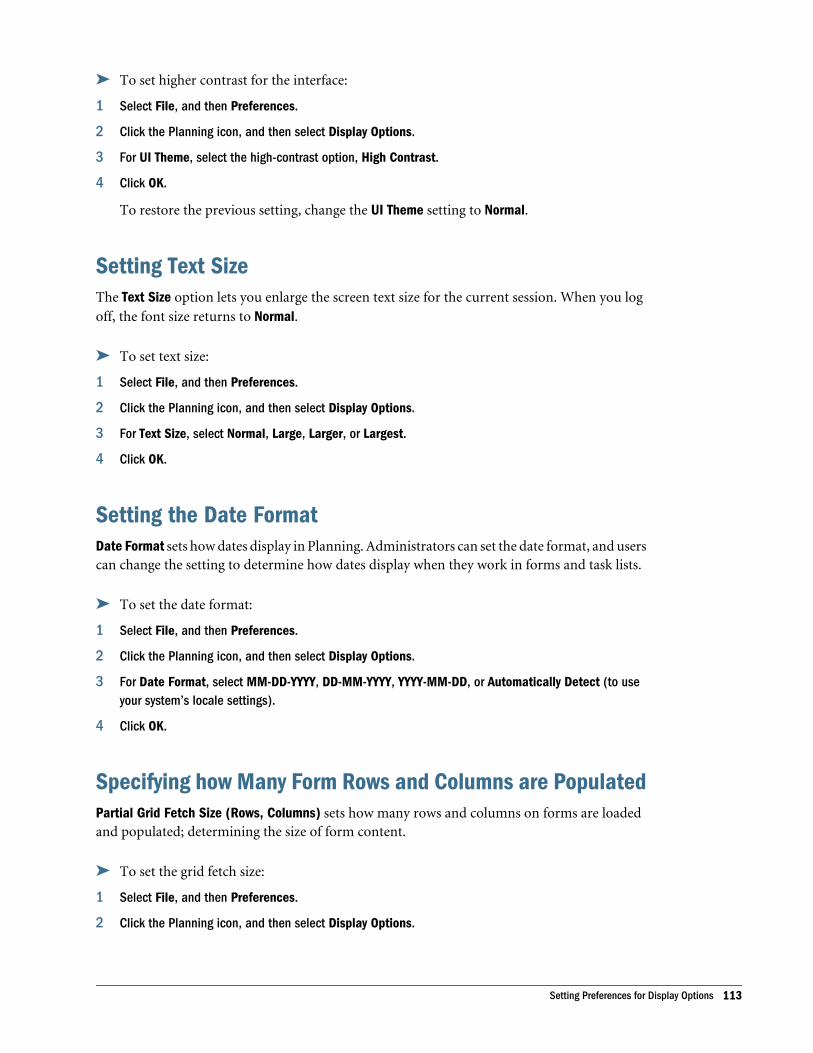
ä To set higher contrast for the interface:
1 Select File, and then Preferences.
2 Click the Planning icon, and then select Display Options.
3 For UI Theme, select the high-contrast option, High Contrast.
4 Click OK.
To restore the previous setting, change the UI Theme setting to Normal.
Setting Text SizeThe Text Size option lets you enlarge the screen text size for the current session. When you logoff, the font size returns to Normal.
ä To set text size:
1 Select File, and then Preferences.
2 Click the Planning icon, and then select Display Options.
3 For Text Size, select Normal, Large, Larger, or Largest.
4 Click OK.
Setting the Date FormatDate Format sets how dates display in Planning. Administrators can set the date format, and userscan change the setting to determine how dates display when they work in forms and task lists.
ä To set the date format:
1 Select File, and then Preferences.
2 Click the Planning icon, and then select Display Options.
3 For Date Format, select MM-DD-YYYY, DD-MM-YYYY, YYYY-MM-DD, or Automatically Detect (to useyour system’s locale settings).
4 Click OK.
Specifying how Many Form Rows and Columns are PopulatedPartial Grid Fetch Size (Rows, Columns) sets how many rows and columns on forms are loadedand populated; determining the size of form content.
ä To set the grid fetch size:
1 Select File, and then Preferences.
2 Click the Planning icon, and then select Display Options.
Setting Preferences for Display Options 113
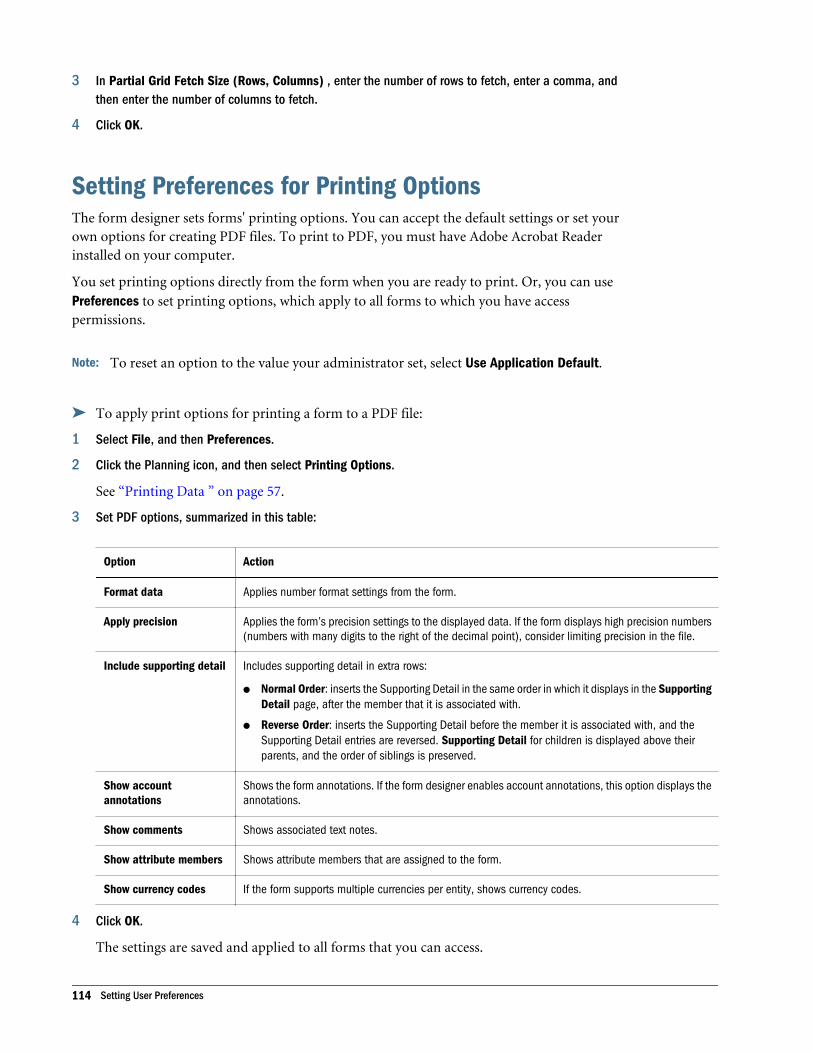
3 In Partial Grid Fetch Size (Rows, Columns) , enter the number of rows to fetch, enter a comma, andthen enter the number of columns to fetch.
4 Click OK.
Setting Preferences for Printing OptionsThe form designer sets forms' printing options. You can accept the default settings or set yourown options for creating PDF files. To print to PDF, you must have Adobe Acrobat Readerinstalled on your computer.
You set printing options directly from the form when you are ready to print. Or, you can usePreferences to set printing options, which apply to all forms to which you have accesspermissions.
Note: To reset an option to the value your administrator set, select Use Application Default.
ä To apply print options for printing a form to a PDF file:
1 Select File, and then Preferences.
2 Click the Planning icon, and then select Printing Options.
See “Printing Data ” on page 57.
3 Set PDF options, summarized in this table:
Option Action
Format data Applies number format settings from the form.
Apply precision Applies the form’s precision settings to the displayed data. If the form displays high precision numbers(numbers with many digits to the right of the decimal point), consider limiting precision in the file.
Include supporting detail Includes supporting detail in extra rows:
l Normal Order: inserts the Supporting Detail in the same order in which it displays in the SupportingDetail page, after the member that it is associated with.
l Reverse Order: inserts the Supporting Detail before the member it is associated with, and theSupporting Detail entries are reversed. Supporting Detail for children is displayed above theirparents, and the order of siblings is preserved.
Show accountannotations
Shows the form annotations. If the form designer enables account annotations, this option displays theannotations.
Show comments Shows associated text notes.
Show attribute members Shows attribute members that are assigned to the form.
Show currency codes If the form supports multiple currencies per entity, shows currency codes.
4 Click OK.
The settings are saved and applied to all forms that you can access.
114 Setting User Preferences
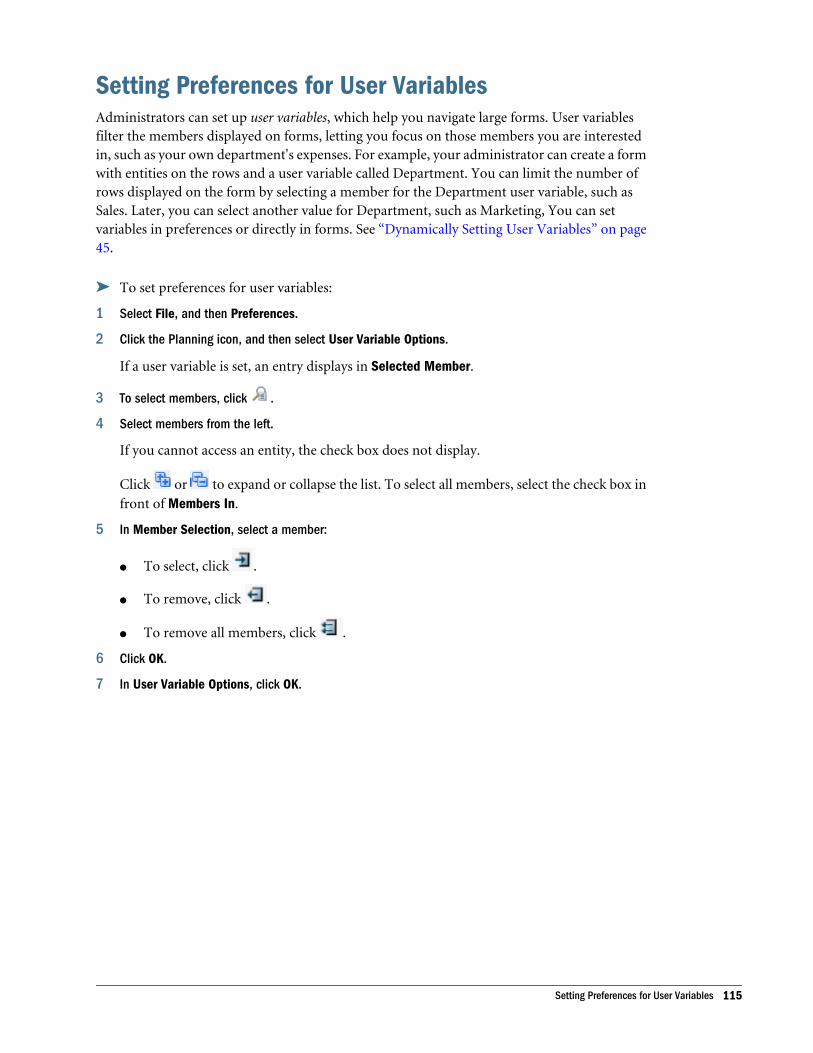
Setting Preferences for User VariablesAdministrators can set up user variables, which help you navigate large forms. User variablesfilter the members displayed on forms, letting you focus on those members you are interestedin, such as your own department's expenses. For example, your administrator can create a formwith entities on the rows and a user variable called Department. You can limit the number ofrows displayed on the form by selecting a member for the Department user variable, such asSales. Later, you can select another value for Department, such as Marketing, You can setvariables in preferences or directly in forms. See “Dynamically Setting User Variables” on page45.
ä To set preferences for user variables:
1 Select File, and then Preferences.
2 Click the Planning icon, and then select User Variable Options.
If a user variable is set, an entry displays in Selected Member.
3 To select members, click .
4 Select members from the left.
If you cannot access an entity, the check box does not display.
Click or to expand or collapse the list. To select all members, select the check box infront of Members In.
5 In Member Selection, select a member:
l To select, click .
l To remove, click .
l To remove all members, click .
6 Click OK.
7 In User Variable Options, click OK.
Setting Preferences for User Variables 115

116 Setting User Preferences
12Frequently Asked Questions
This topic provides answers to common questions about using Planning.
How can I switch from one application to another?
Select the tab of the second application. See “Logging onto Planning” on page 14.
What audit capabilities does the system provide?
When you change the state of a planning unit, add an annotation that explains what you changedand why. You can use annotations to create a written history or audit trail of a plan’s evolution.Administrators can also set up audit trails for certain application changes.
Can I change how my form displays?
Yes. Select File, then Preferences, click the Planning icon, and then select Display Options to setoptions for number formatting, page selection, printing, and other options. To make ad hocchanges, see Chapter 4, “Working with Ad Hoc Grids.”
In a large hierarchy, how can I find specific members?
You can set the number of members that enable a search and find feature, and search up or downthe hierarchy by member name or alias to find members. See “Enabling Search with a LargeNumber of Pages” on page 111 and “Navigating in Forms” on page 46.
Can I cut, copy, paste, and delete data while I'm entering data?
Yes, you can use the Copy and Paste shortcuts, or right-click in a cell, and then select Cut, Copy,Paste, or Delete. To adjust data, select Edit, then Adjust. You can work with multiple cellssimultaneously.
How can I easily enter values across multiple cells?
Planning can allocate values across cells. For example, select multiple cells and select AdjustData to increase or decrease their values by a certain percentage. See Chapter 7, “Adjusting andSpreading Data.”
How can I add a text note or custom link to data?
You can add comments or a custom link to accounts if the feature is enabled and you have writeaccess to the members (account, entity, scenario, and version). For example, to create a link toa spreadsheet file on a shared server, you might enter: file://C:/BudgetDocs/Timeline.xls where C represents the server's drive.
117
If your administrator selected the Enable Cell Level Document property for the form, you can linka cell to an Oracle Hyperion Enterprise Performance Management Workspace document. See“Adding, Editing, and Viewing Cell-Level Documents ” on page 53.
How can I set up calculations for cells?
Select cells, and then click Supporting Detail to add text, values, and operators that define howdata aggregates.
See “Working with Supporting Detail” on page 77.
Can I select the language or terminology in which the members display?
Yes, if an administrator sets up multiple alias tables, you can select from among them. Theselected alias table determines how members are displayed in the form. For example, each aliastable might display members in another language. The display of aliases in a form must beenabled as a property. Select the alias table to use by selecting File, and then Preferences. Clickthe Planning icon, select the Application Settings tab, and then select the alias table under AliasSetting. Planning retains this setting for subsequent sessions.
How can I replace irrelevant data with no data value?
In a form, select the cell or range of cells you want to change. Enter #missing, then and savethe form. The cells are saved to the database at the next Refresh.
How can I associate a business rule to a form?
Only administrators and interactive users can associate business rules to forms. This enablesothers to launch those business rules.
When should I launch business rules?
Your administrator can set up forms to automatically launch business rules when you open theform. If so, you can skip steps 1 and 2.
ä Before you begin entering data:
1 Select View, and then Refresh so you get the latest values from Oracle Essbase.
2 Select Tools, and then Business Rules to start a prepared calculation script.
3 Enter your data into the form.
4 Select Tools, and then Business Rules again before you promote the planning unit (in case the databasevalues were updated in the meantime).
How can I see the business rules associated with my page?
Open the form, and review the Business Rules list in the lower-left corner of the form.
118 Frequently Asked Questions

What is a planning unit?
A planning unit is a slice of data at the intersection of a scenario, a version, and an entity. Inaddition, an administrator an create more granular planning units within an entity by addingmembers from another dimension. See Chapter 10, “Managing Planning Units”
How do I promote a planning unit so that it can be reviewed?
Change the planning unit status to a status that sends the budget to the appropriate reviewer.For details, see “Changing Planning Unit Status” on page 99
How can I automatically get notified by email when I become the owner of a planning unit?
Set up Planning to notify you by email when you become the owner of a planning unit. See“Setting Up Email” on page 106.
How can I track the approval process of my planning units?
From the Process Definition page, you can view the status of a planning unit, including its history,the last action taken, and the dates and times the status changed. See “Viewing Planning UnitHistory Details and Using Annotations” on page 102.
Can I promote an entire area (region, business unit, and so on)?
Areas of an organization, such as divisions and regions are represented as entities in OracleHyperion Planning. You can promote an entire entity or portions of it.
Can I change my plan after I have promoted it to a reviewer?
After you promote a planning unit, you are no longer its owner, and only the current owner orthe budget administrator can change the plan. To make changes, ask the current owner or budgetadministrator to reject he planning unit back to you.
Can I create a copy of my plan for myself so that I can compare it to the approved version?
To create a copy of the plan, ask the administrator to set up a “personal” bottom up version foryou. Before you promote your data, copy it (using Copy Versions) to a personal version, givingyou a record of the data before you promote it.
Can I read all reviewers’ comments?
You can read all annotations for planning units to which you have access.
Who can review my plan?
Others having access to your portions of the planning unit can view and, depending on theiraccess level, change your sections.
When should I use the Copy Versions option?
Use Copy Versions to:
119
l Create a copy of the data for your records. For example, use the copy as a baseline to compareagainst future versions of data.
l Create a starting point for subsequent bottom up versions. For example, copy your FirstPass version to a Second Pass version, and then make your changes to it.
What should I do when I cannot run a Currency Conversion business rule because the errormessage tells me the FIX statement cannot contain a dynamic calc member?
Contact your administrator if you get this error message. It means that the business rule thatyou are trying to run contains a scenario, version, or currency that is a dynamic calc member,or that all account members are dynamic for this view.
120 Frequently Asked Questions