Embed Size (px)
Citation preview
Oracle® Hyperion Financial Reporting
Oracle Hyperion Financial Reporting Charting
Release 11.1.2.4.700
Financial Reporting Oracle Hyperion Financial Reporting Charting, 11.1.2.4.700
Copyright © 2016, Oracle and/or its affiliates. All rights reserved.
Authors: EPM Information Development Team
This software and related documentation are provided under a license agreement containing restrictions on use anddisclosure and are protected by intellectual property laws. Except as expressly permitted in your license agreement orallowed by law, you may not use, copy, reproduce, translate, broadcast, modify, license, transmit, distribute, exhibit,perform, publish, or display any part, in any form, or by any means. Reverse engineering, disassembly, or decompilationof this software, unless required by law for interoperability, is prohibited.
The information contained herein is subject to change without notice and is not warranted to be error-free. If you findany errors, please report them to us in writing.
If this is software or related documentation that is delivered to the U.S. Government or anyone licensing it on behalf ofthe U.S. Government, then the following notice is applicable:
U.S. GOVERNMENT END USERS:
Oracle programs, including any operating system, integrated software, any programs installed on the hardware, and/ordocumentation, delivered to U.S. Government end users are "commercial computer software" pursuant to the applicableFederal Acquisition Regulation and agency-specific supplemental regulations. As such, use, duplication, disclosure,modification, and adaptation of the programs, including any operating system, integrated software, any programs installedon the hardware, and/or documentation, shall be subject to license terms and license restrictions applicable to the programs.No other rights are granted to the U.S. Government.
This software or hardware is developed for general use in a variety of information management applications. It is notdeveloped or intended for use in any inherently dangerous applications, including applications that may create a risk ofpersonal injury. If you use this software or hardware in dangerous applications, then you shall be responsible to take allappropriate fail-safe, backup, redundancy, and other measures to ensure its safe use. Oracle Corporation and its affiliatesdisclaim any liability for any damages caused by use of this software or hardware in dangerous applications.
Oracle and Java are registered trademarks of Oracle and/or its affiliates. Other names may be trademarks of their respectiveowners.
Intel and Intel Xeon are trademarks or registered trademarks of Intel Corporation. All SPARC trademarks are used underlicense and are trademarks or registered trademarks of SPARC International, Inc. AMD, Opteron, the AMD logo, and theAMD Opteron logo are trademarks or registered trademarks of Advanced Micro Devices. UNIX is a registered trademarkof The Open Group.
This software or hardware and documentation may provide access to or information about content, products, and servicesfrom third parties. Oracle Corporation and its affiliates are not responsible for and expressly disclaim all warranties of anykind with respect to third-party content, products, and services unless otherwise set forth in an applicable agreementbetween you and Oracle. Oracle Corporation and its affiliates will not be responsible for any loss, costs, or damages incurreddue to your access to or use of third-party content, products, or services, except as set forth in an applicable agreementbetween you and Oracle.

Contents
Documentation Accessibility . . . . . . . . . . . . . . . . . . . . . . . . . . . . . . . . . . . . . . . . . . . . . . . . . . . . . . . . . . . 5
Documentation Feedback . . . . . . . . . . . . . . . . . . . . . . . . . . . . . . . . . . . . . . . . . . . . . . . . . . . . . . . . . . . . . 7
Chapter 1. Introduction . . . . . . . . . . . . . . . . . . . . . . . . . . . . . . . . . . . . . . . . . . . . . . . . . . . . . . . . . . . . . . . 9
Chapter 2. Overall Appearance . . . . . . . . . . . . . . . . . . . . . . . . . . . . . . . . . . . . . . . . . . . . . . . . . . . . . . . . 11
Chapter 3. Chart Data Point Sizing and Display . . . . . . . . . . . . . . . . . . . . . . . . . . . . . . . . . . . . . . . . . . . . . 13
Line Chart Example . . . . . . . . . . . . . . . . . . . . . . . . . . . . . . . . . . . . . . . . . . . . . . . . . . . 13
Bar Chart Example . . . . . . . . . . . . . . . . . . . . . . . . . . . . . . . . . . . . . . . . . . . . . . . . . . . . 14
Pie Chart Example . . . . . . . . . . . . . . . . . . . . . . . . . . . . . . . . . . . . . . . . . . . . . . . . . . . . 16
Chapter 4. Font Angles . . . . . . . . . . . . . . . . . . . . . . . . . . . . . . . . . . . . . . . . . . . . . . . . . . . . . . . . . . . . . . 19
Chapter 5. Tabs in the Format Chart Dialog Box . . . . . . . . . . . . . . . . . . . . . . . . . . . . . . . . . . . . . . . . . . . . . 21
Appearance Tab . . . . . . . . . . . . . . . . . . . . . . . . . . . . . . . . . . . . . . . . . . . . . . . . . . . . . . 21
Grid Depth Differences . . . . . . . . . . . . . . . . . . . . . . . . . . . . . . . . . . . . . . . . . . . . . . 23
Legend Tab . . . . . . . . . . . . . . . . . . . . . . . . . . . . . . . . . . . . . . . . . . . . . . . . . . . . . . . . . 23
Axes Tab . . . . . . . . . . . . . . . . . . . . . . . . . . . . . . . . . . . . . . . . . . . . . . . . . . . . . . . . . . . 26
Element Style Tab . . . . . . . . . . . . . . . . . . . . . . . . . . . . . . . . . . . . . . . . . . . . . . . . . . . . . 27
Themes . . . . . . . . . . . . . . . . . . . . . . . . . . . . . . . . . . . . . . . . . . . . . . . . . . . . . . . . . 27
Bar and Pie Fill . . . . . . . . . . . . . . . . . . . . . . . . . . . . . . . . . . . . . . . . . . . . . . . . . . . . 29
Bar Shape . . . . . . . . . . . . . . . . . . . . . . . . . . . . . . . . . . . . . . . . . . . . . . . . . . . . . . . . 30
Bar Options Tab . . . . . . . . . . . . . . . . . . . . . . . . . . . . . . . . . . . . . . . . . . . . . . . . . . . . . . 32
Type = Rows . . . . . . . . . . . . . . . . . . . . . . . . . . . . . . . . . . . . . . . . . . . . . . . . . . . . . 32
Bar Border Style . . . . . . . . . . . . . . . . . . . . . . . . . . . . . . . . . . . . . . . . . . . . . . . . . . . 33
Element Style Tab . . . . . . . . . . . . . . . . . . . . . . . . . . . . . . . . . . . . . . . . . . . . . . . . . . . . . 34
Dot Dashed as a Line Style . . . . . . . . . . . . . . . . . . . . . . . . . . . . . . . . . . . . . . . . . . . . 35
Line Marker Styles and Sizing . . . . . . . . . . . . . . . . . . . . . . . . . . . . . . . . . . . . . . . . . 36
Pie Options Tab . . . . . . . . . . . . . . . . . . . . . . . . . . . . . . . . . . . . . . . . . . . . . . . . . . . . . . 38
iii

iv
Documentation Accessibility
For information about Oracle's commitment to accessibility, visit the Oracle Accessibility Program website athttp://www.oracle.com/pls/topic/lookup?ctx=acc&id=docacc.
Access to Oracle SupportOracle customers that have purchased support have access to electronic support through My Oracle Support.For information, visit http://www.oracle.com/pls/topic/lookup?ctx=acc&id=info or visit http://www.oracle.com/pls/topic/lookup?ctx=acc&id=trs if you are hearing impaired.
5

6
Documentation Feedback
Send feedback on this documentation to: [email protected]
Follow EPM Information Development on these social media sites:
LinkedIn - http://www.linkedin.com/groups?gid=3127051&goback=.gmp_3127051
Twitter - http://twitter.com/hyperionepminfo
Facebook - http://www.facebook.com/pages/Hyperion-EPM-Info/102682103112642
Google+ - https://plus.google.com/106915048672979407731/#106915048672979407731/posts
YouTube - https://www.youtube.com/user/EvolvingBI
7

8
1Introduction
In Release 11.1.2.4.700, Oracle Hyperion Financial Reporting has an updated charting enginefor an overall improved charting presentation and user experience.
There are inherent differences between the old and new charting product features andfunctionality that may affect the rendered chart output and behavior. While best efforts havebeen made to keep the existing charting functionality, chart output may differ.
This document highlights the major differences between the charting engines.
9

10

2Overall Appearance
Aside from functionality and rendering differences in specific charting user interfacecomponents, the following overall chart rendering differences exist:
l Default Axis Scaling—The default vertical axis scaling (without any custom rangesspecified) may differ.
l Axis Tick Marks—The tick marks that appeared in the vertical and horizontal axes are nolonger supported.
l Default Bar Width—The default bar width differs between the two charting engines.
l Legend Spacing—The spacing of the chart legend element data sets differs between the twocharting engines.
Figure 1 Overall Appearance in the Original Charting Engine
11
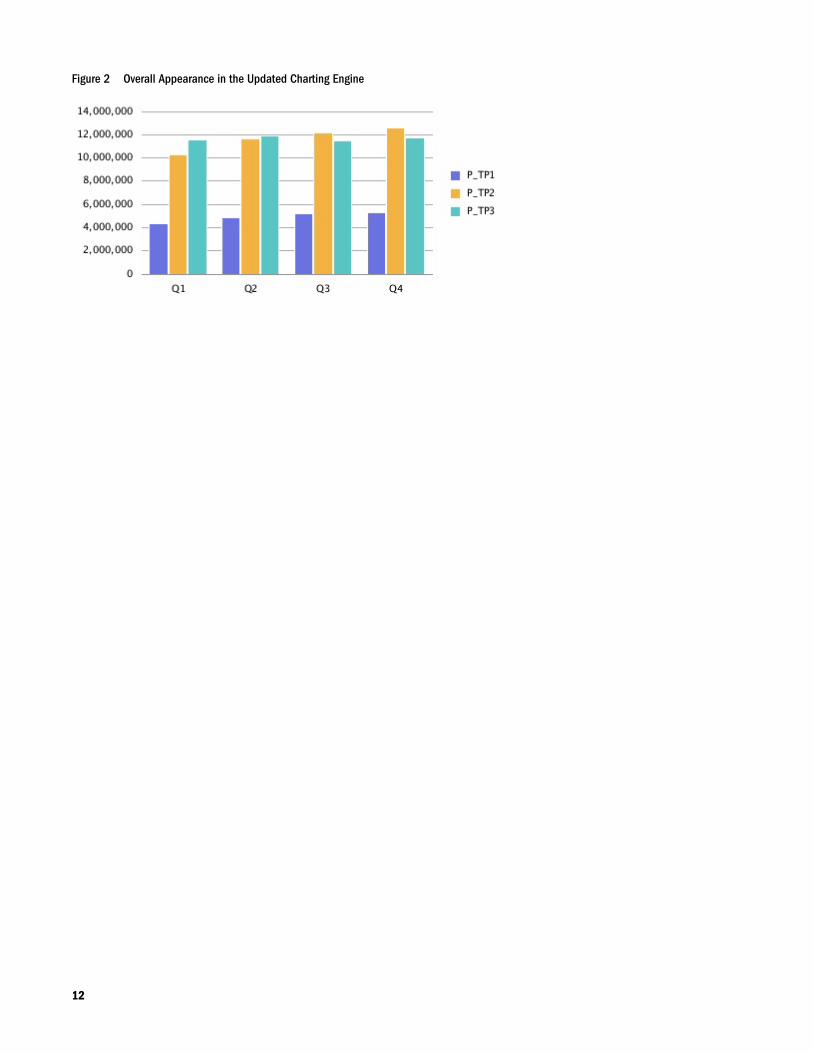
Figure 2 Overall Appearance in the Updated Charting Engine
12
3Chart Data Point Sizing and
Display
In This Chapter
Line Chart Example ... . . . . . . . . . . . . . . . . . . . . . . . . . . . . . . . . . . . . . . . . . . . . . . . . . . . . . . . . . . . . . . . . . . . . . . . . . . . . . . . . . . . . .13
Bar Chart Example ... . . . . . . . . . . . . . . . . . . . . . . . . . . . . . . . . . . . . . . . . . . . . . . . . . . . . . . . . . . . . . . . . . . . . . . . . . . . . . . . . . . . . . .14
Pie Chart Example ... . . . . . . . . . . . . . . . . . . . . . . . . . . . . . . . . . . . . . . . . . . . . . . . . . . . . . . . . . . . . . . . . . . . . . . . . . . . . . . . . . . . . . .16
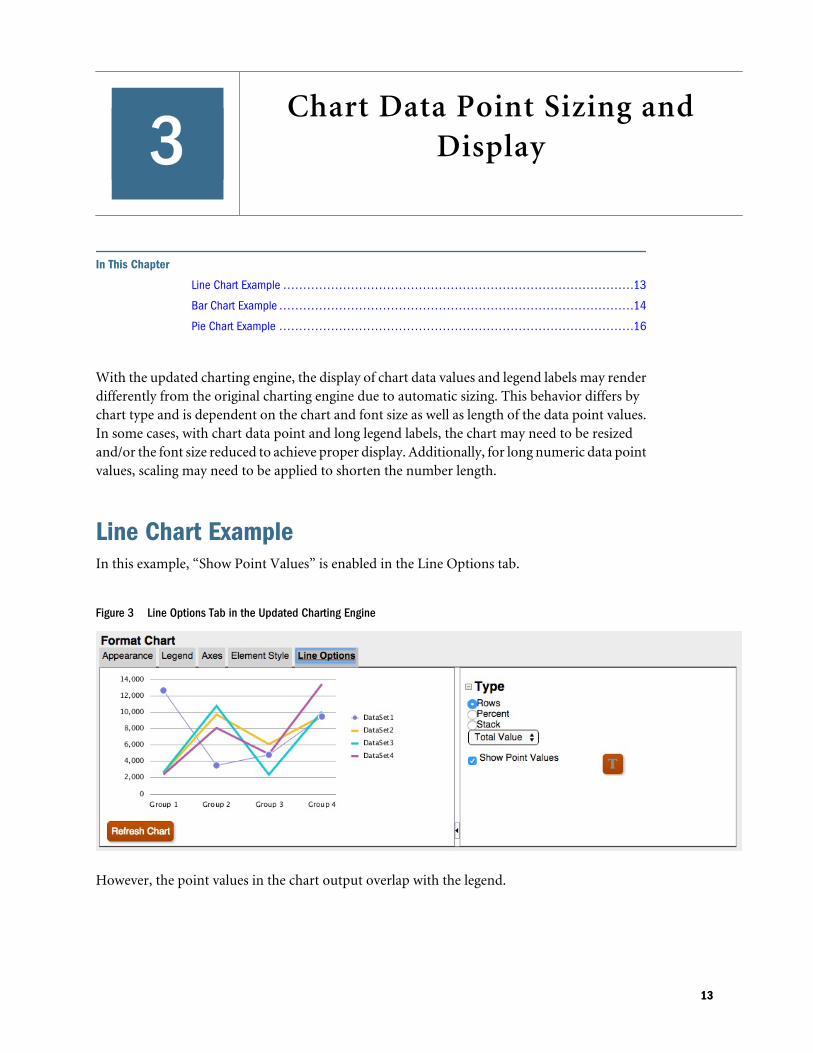
With the updated charting engine, the display of chart data values and legend labels may renderdifferently from the original charting engine due to automatic sizing. This behavior differs bychart type and is dependent on the chart and font size as well as length of the data point values.In some cases, with chart data point and long legend labels, the chart may need to be resizedand/or the font size reduced to achieve proper display. Additionally, for long numeric data pointvalues, scaling may need to be applied to shorten the number length.
Line Chart ExampleIn this example, “Show Point Values” is enabled in the Line Options tab.
Figure 3 Line Options Tab in the Updated Charting Engine
However, the point values in the chart output overlap with the legend.
13
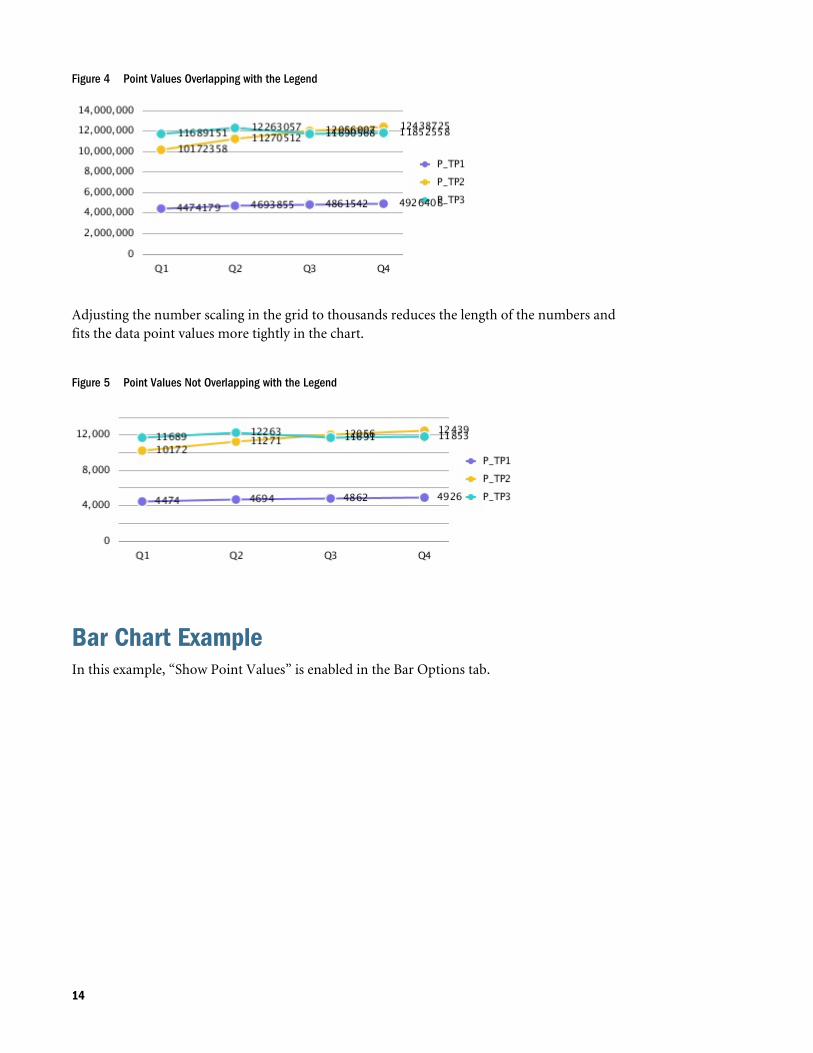
Figure 4 Point Values Overlapping with the Legend
Adjusting the number scaling in the grid to thousands reduces the length of the numbers andfits the data point values more tightly in the chart.
Figure 5 Point Values Not Overlapping with the Legend
Bar Chart ExampleIn this example, “Show Point Values” is enabled in the Bar Options tab.
14

Figure 6 Bar Options Tab in the Updated Charting Engine
However, the point values do not appear in the bar since they are too wide to fit within the bar.
Figure 7 Point Values Do Not Display in the Bars
Widening the chart size on the report canvas, changing the grid width to 100, and setting thelegend placement to the bottom of the chart fits the long data point values within the chart.
Figure 8 Point Values Display in the Bars
15
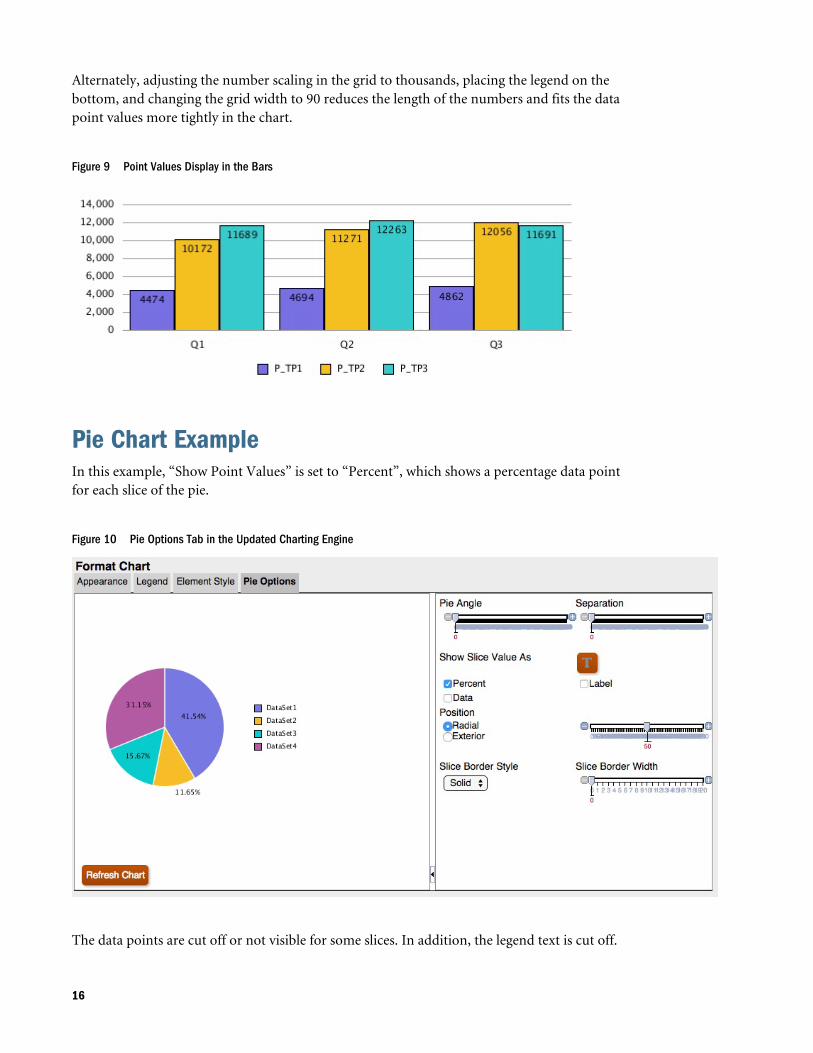
Alternately, adjusting the number scaling in the grid to thousands, placing the legend on thebottom, and changing the grid width to 90 reduces the length of the numbers and fits the datapoint values more tightly in the chart.
Figure 9 Point Values Display in the Bars
Pie Chart ExampleIn this example, “Show Point Values” is set to “Percent”, which shows a percentage data pointfor each slice of the pie.
Figure 10 Pie Options Tab in the Updated Charting Engine
The data points are cut off or not visible for some slices. In addition, the legend text is cut off.
16
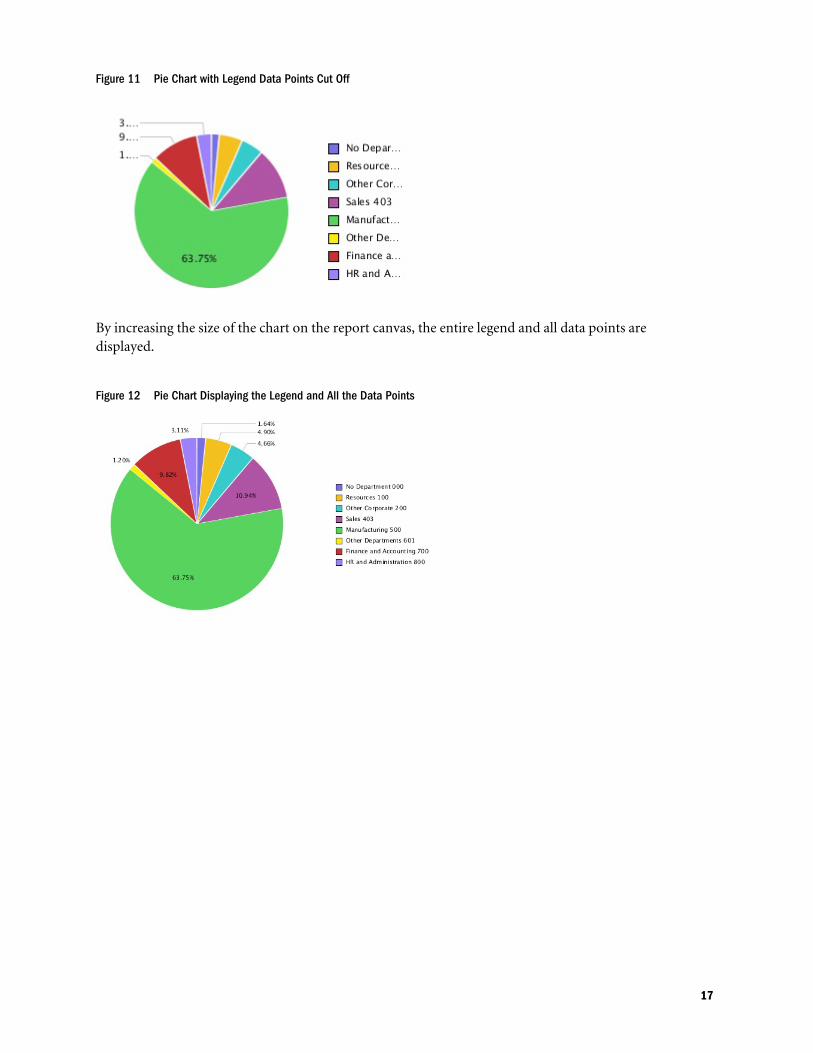
Figure 11 Pie Chart with Legend Data Points Cut Off
By increasing the size of the chart on the report canvas, the entire legend and all data points aredisplayed.
Figure 12 Pie Chart Displaying the Legend and All the Data Points
17

18
4Font Angles
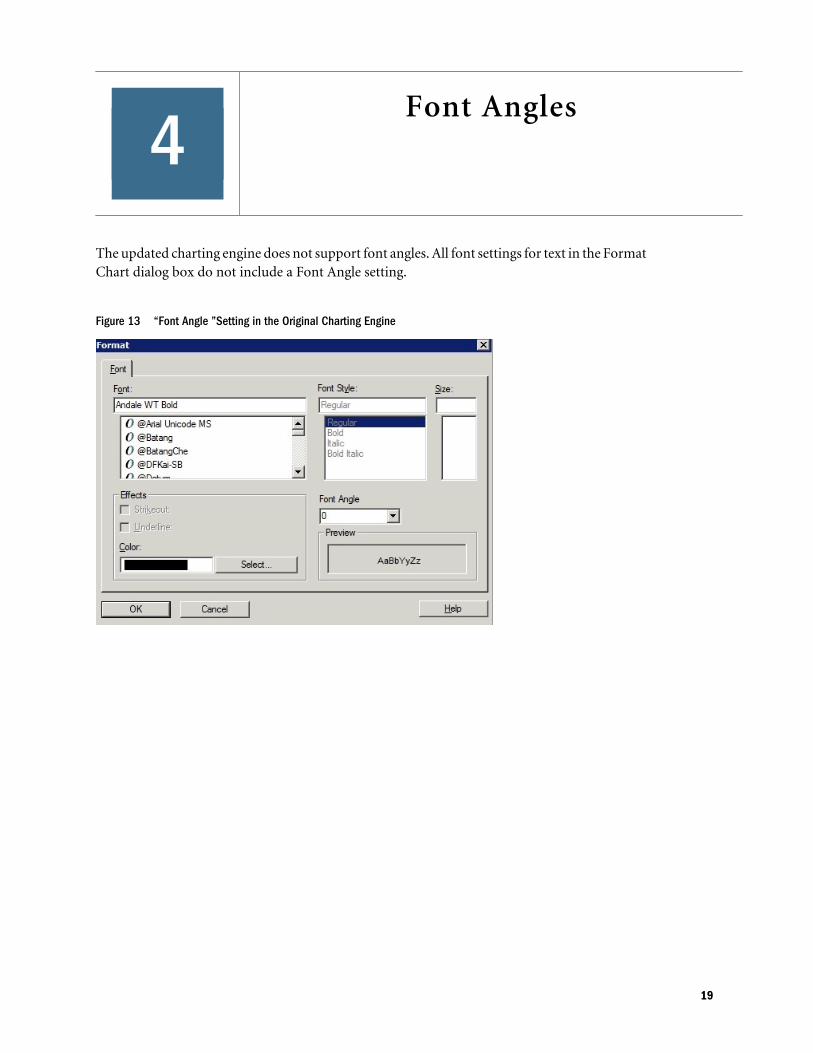
The updated charting engine does not support font angles. All font settings for text in the FormatChart dialog box do not include a Font Angle setting.
Figure 13 “Font Angle ”Setting in the Original Charting Engine
19
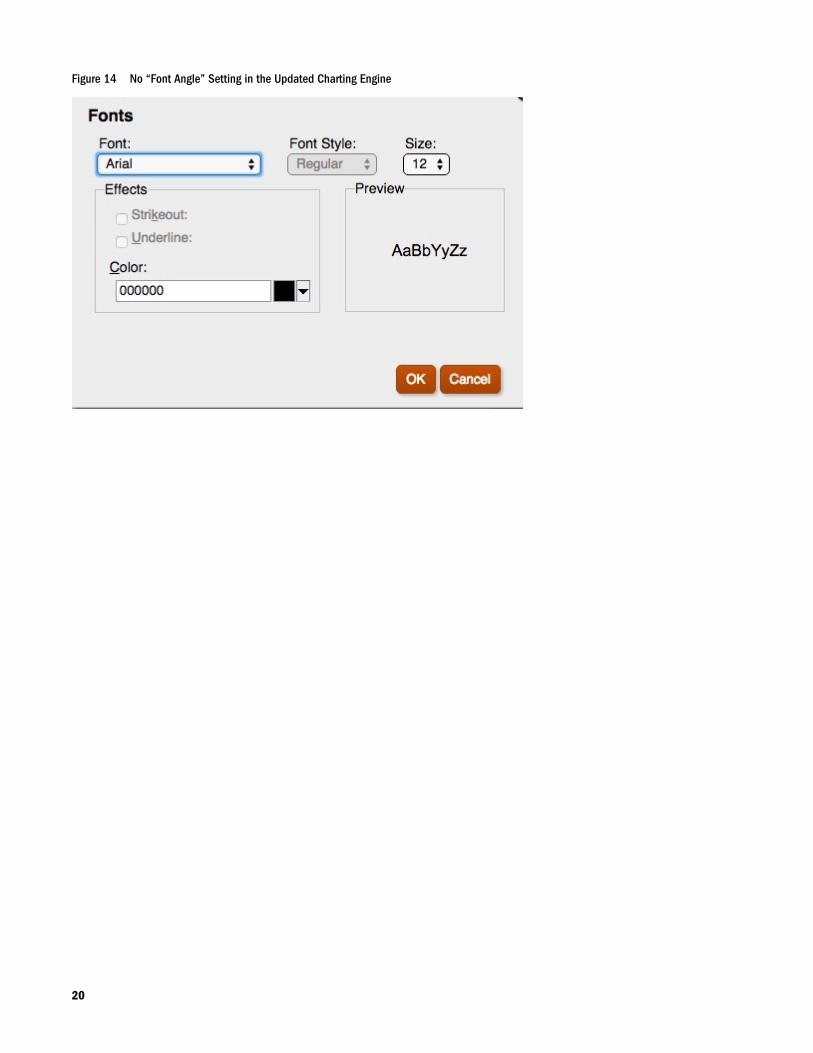
Figure 14 No “Font Angle” Setting in the Updated Charting Engine
20
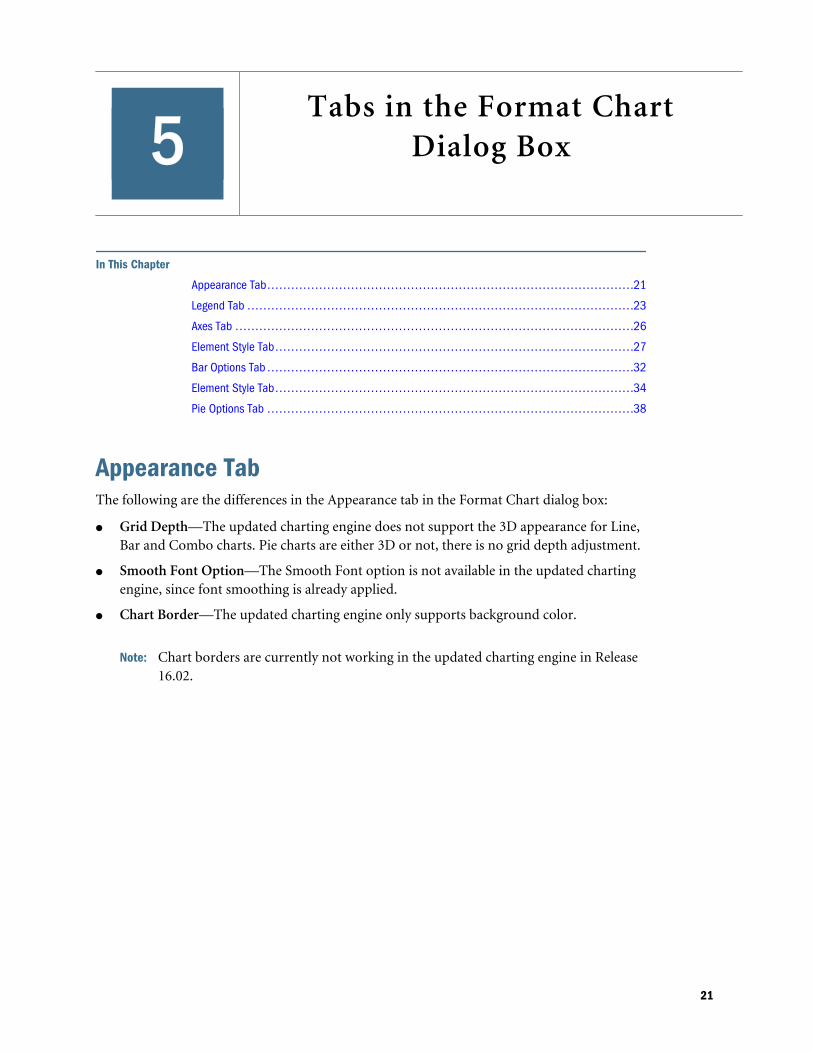
5Tabs in the Format Chart
Dialog Box
In This Chapter
Appearance Tab... . . . . . . . . . . . . . . . . . . . . . . . . . . . . . . . . . . . . . . . . . . . . . . . . . . . . . . . . . . . . . . . . . . . . . . . . . . . . . . . . . . . . . . . . .21
Legend Tab ... . . . . . . . . . . . . . . . . . . . . . . . . . . . . . . . . . . . . . . . . . . . . . . . . . . . . . . . . . . . . . . . . . . . . . . . . . . . . . . . . . . . . . . . . . . . . . .23
Axes Tab ... . . . . . . . . . . . . . . . . . . . . . . . . . . . . . . . . . . . . . . . . . . . . . . . . . . . . . . . . . . . . . . . . . . . . . . . . . . . . . . . . . . . . . . . . . . . . . . . . .26
Element Style Tab... . . . . . . . . . . . . . . . . . . . . . . . . . . . . . . . . . . . . . . . . . . . . . . . . . . . . . . . . . . . . . . . . . . . . . . . . . . . . . . . . . . . . . . .27
Bar Options Tab ... . . . . . . . . . . . . . . . . . . . . . . . . . . . . . . . . . . . . . . . . . . . . . . . . . . . . . . . . . . . . . . . . . . . . . . . . . . . . . . . . . . . . . . . . .32
Element Style Tab... . . . . . . . . . . . . . . . . . . . . . . . . . . . . . . . . . . . . . . . . . . . . . . . . . . . . . . . . . . . . . . . . . . . . . . . . . . . . . . . . . . . . . . .34
Pie Options Tab ... . . . . . . . . . . . . . . . . . . . . . . . . . . . . . . . . . . . . . . . . . . . . . . . . . . . . . . . . . . . . . . . . . . . . . . . . . . . . . . . . . . . . . . . . .38
Appearance TabThe following are the differences in the Appearance tab in the Format Chart dialog box:
l Grid Depth—The updated charting engine does not support the 3D appearance for Line,Bar and Combo charts. Pie charts are either 3D or not, there is no grid depth adjustment.
l Smooth Font Option—The Smooth Font option is not available in the updated chartingengine, since font smoothing is already applied.
l Chart Border—The updated charting engine only supports background color.
Note: Chart borders are currently not working in the updated charting engine in Release16.02.
21

Figure 15 Appearance Tab in the Original Charting Engine
Figure 16 Appearance Tab in the Updated Charting Engine
22
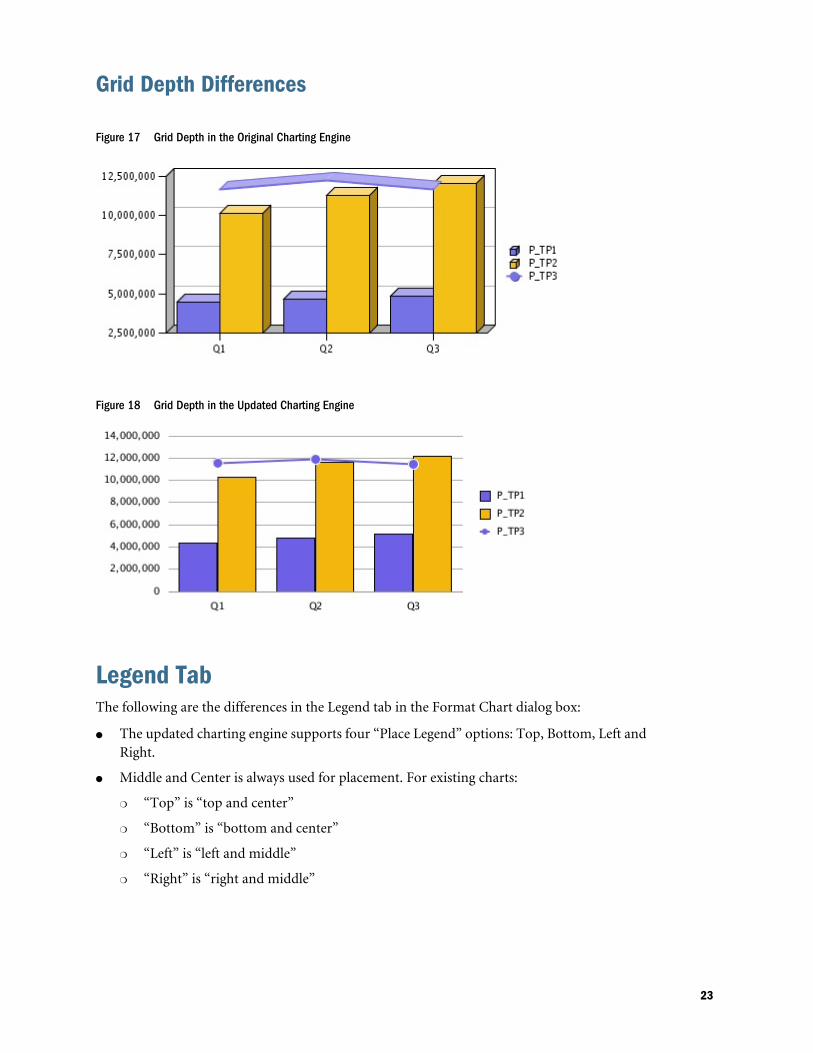
Grid Depth Differences
Figure 17 Grid Depth in the Original Charting Engine
Figure 18 Grid Depth in the Updated Charting Engine
Legend TabThe following are the differences in the Legend tab in the Format Chart dialog box:
l The updated charting engine supports four “Place Legend” options: Top, Bottom, Left andRight.
l Middle and Center is always used for placement. For existing charts:
m “Top” is “top and center”
m “Bottom” is “bottom and center”
m “Left” is “left and middle”
m “Right” is “right and middle”
23
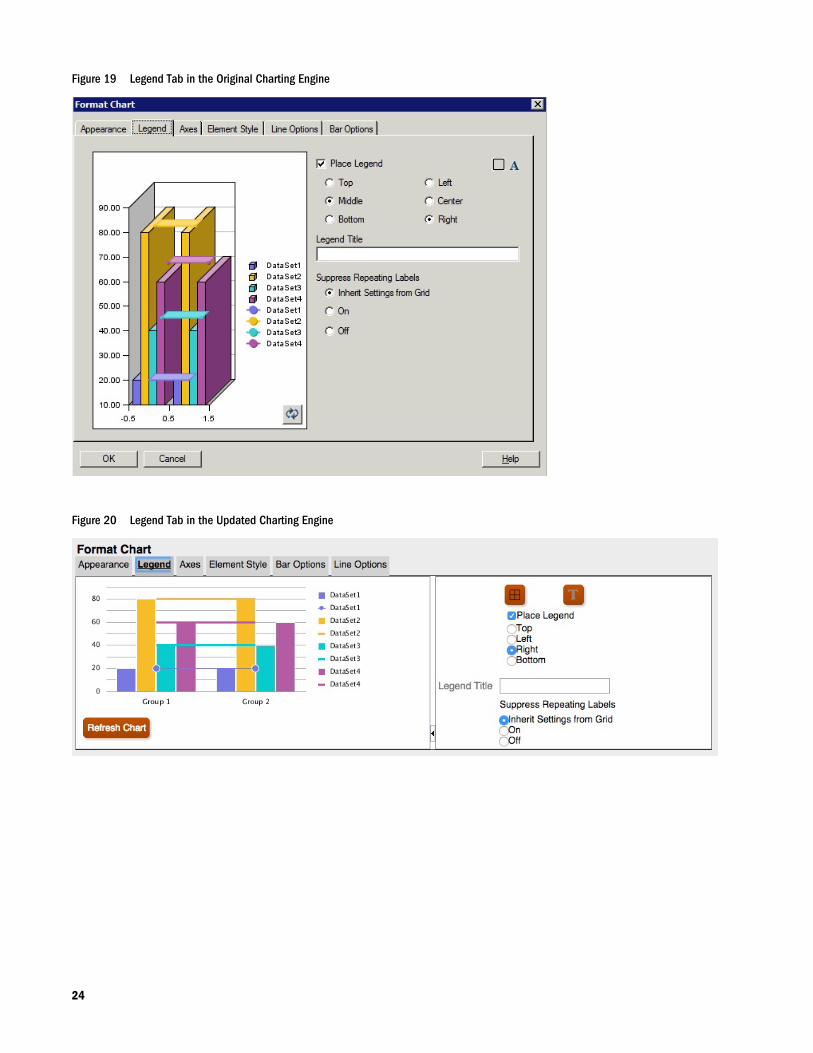
Figure 19 Legend Tab in the Original Charting Engine
Figure 20 Legend Tab in the Updated Charting Engine
24
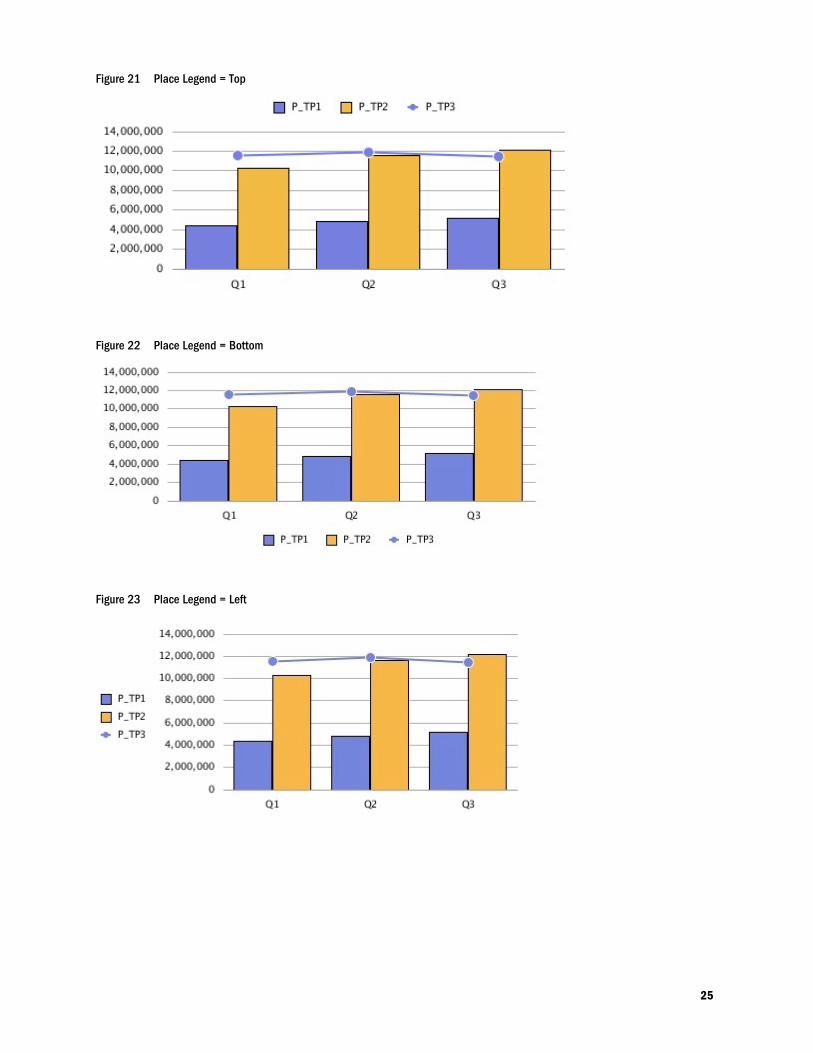
Figure 21 Place Legend = Top
Figure 22 Place Legend = Bottom
Figure 23 Place Legend = Left
25
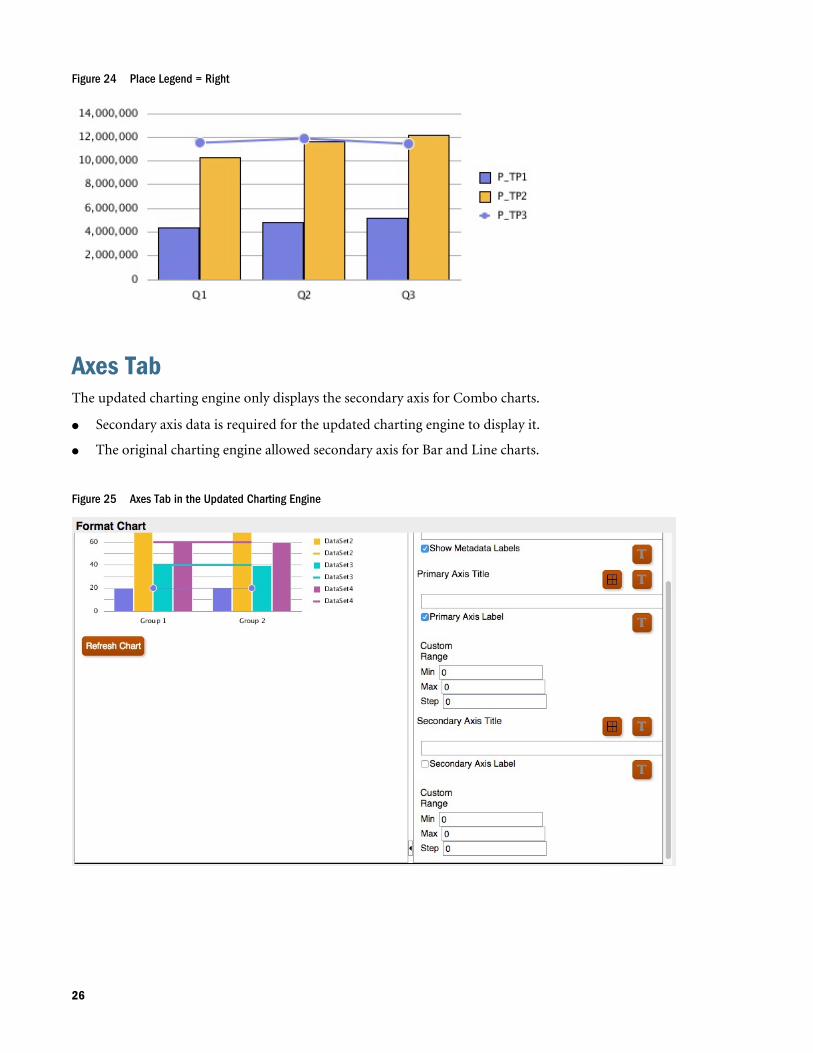
Figure 24 Place Legend = Right
Axes TabThe updated charting engine only displays the secondary axis for Combo charts.
l Secondary axis data is required for the updated charting engine to display it.
l The original charting engine allowed secondary axis for Bar and Line charts.
Figure 25 Axes Tab in the Updated Charting Engine
26

Figure 26 Secondary Axis in the Original Charting Engine
Figure 27 Secondary Axis in the Updated Charting Engine
Element Style Tab
Subtopics
l Themes
l Bar and Pie Fill
l Bar Shape
In the updated charting engine, in the Element Style tab in the Format Chart dialog box, eachitem is broken out into its own separate section.
ThemesThemes are a new feature that you can define in the Element Style tab in the updated chartingengine.. The following new data element color themes have been added with preset colorselection:
l Classic—Legacy Oracle Hyperion Financial Reporting colors
27
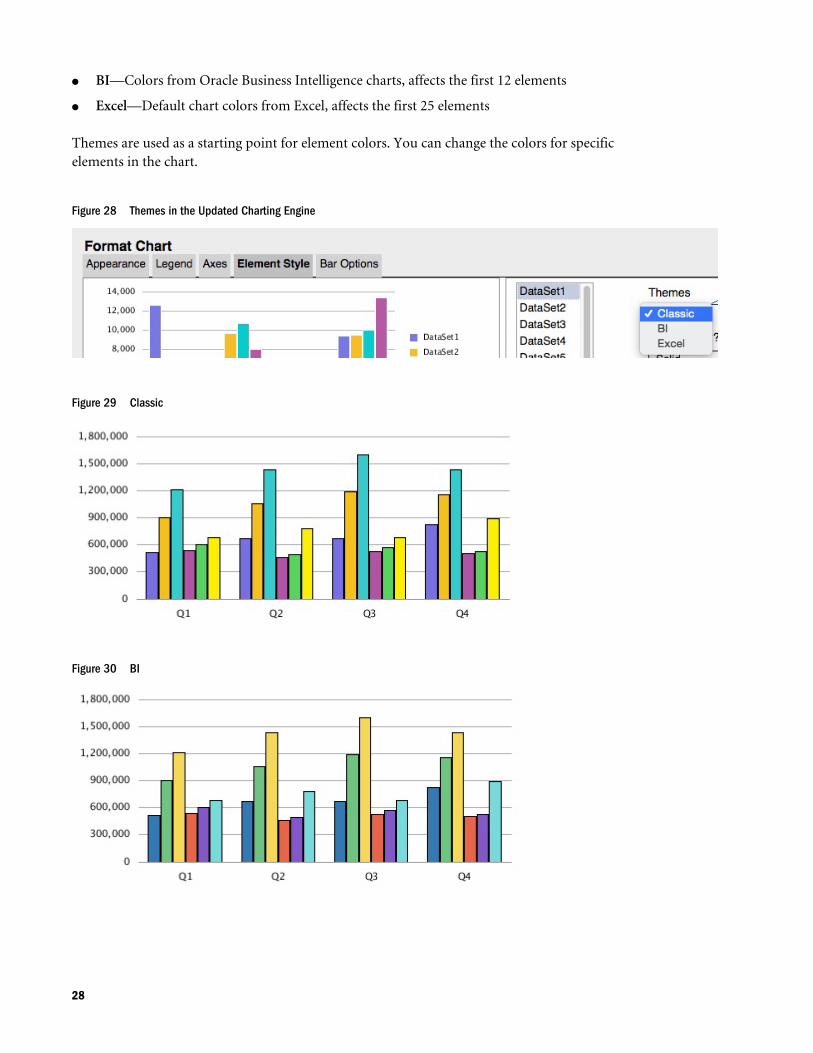
l BI—Colors from Oracle Business Intelligence charts, affects the first 12 elements
l Excel—Default chart colors from Excel, affects the first 25 elements
Themes are used as a starting point for element colors. You can change the colors for specificelements in the chart.
Figure 28 Themes in the Updated Charting Engine
Figure 29 Classic
Figure 30 BI
28
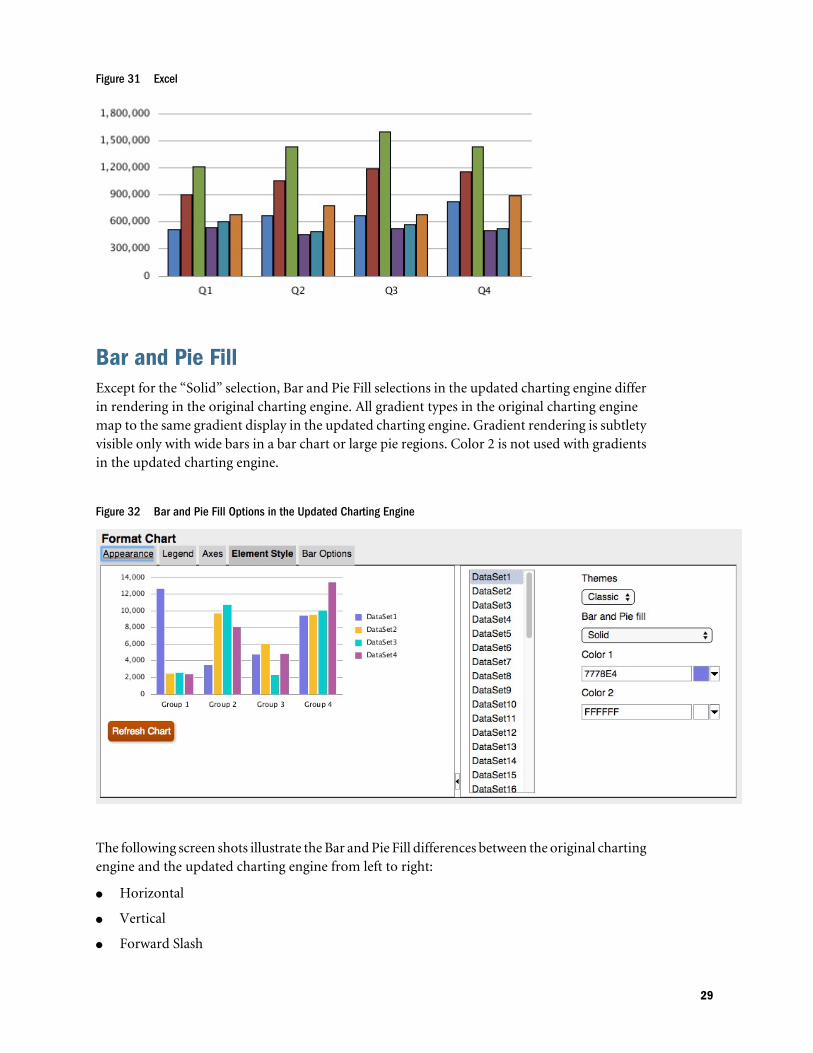
Figure 31 Excel
Bar and Pie FillExcept for the “Solid” selection, Bar and Pie Fill selections in the updated charting engine differin rendering in the original charting engine. All gradient types in the original charting enginemap to the same gradient display in the updated charting engine. Gradient rendering is subtletyvisible only with wide bars in a bar chart or large pie regions. Color 2 is not used with gradientsin the updated charting engine.
Figure 32 Bar and Pie Fill Options in the Updated Charting Engine
The following screen shots illustrate the Bar and Pie Fill differences between the original chartingengine and the updated charting engine from left to right:
l Horizontal
l Vertical
l Forward Slash
29
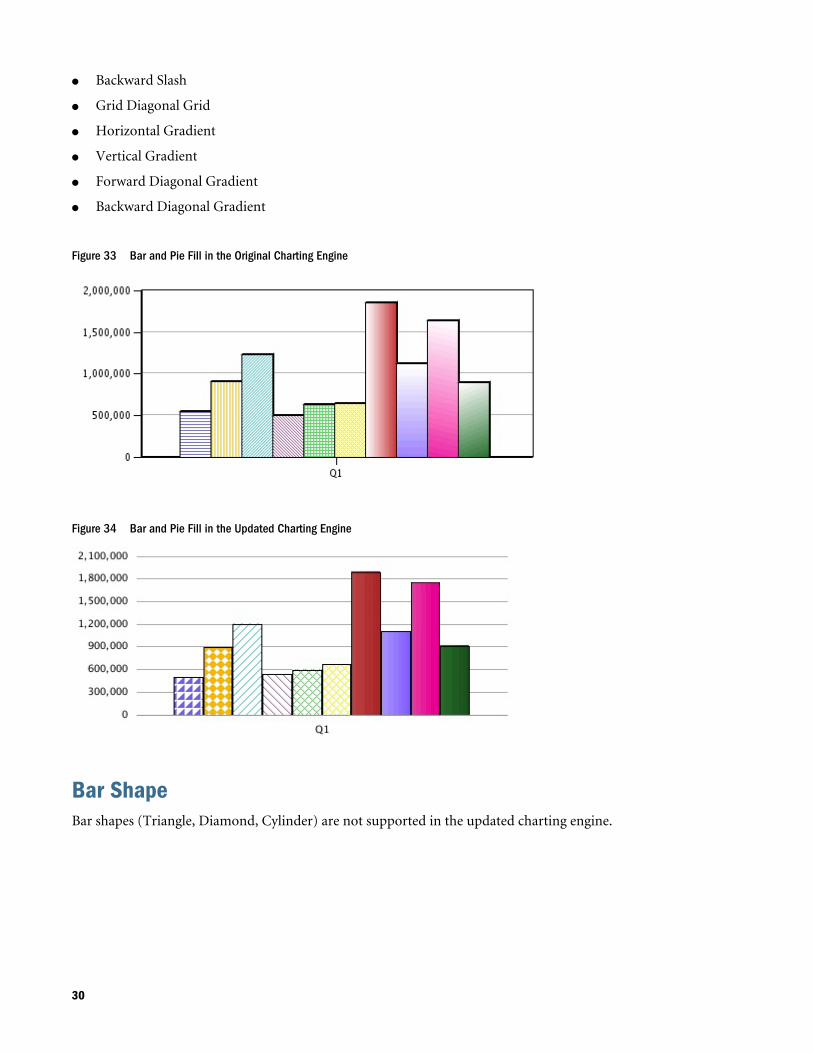
l Backward Slash
l Grid Diagonal Grid
l Horizontal Gradient
l Vertical Gradient
l Forward Diagonal Gradient
l Backward Diagonal Gradient
Figure 33 Bar and Pie Fill in the Original Charting Engine
Figure 34 Bar and Pie Fill in the Updated Charting Engine
Bar ShapeBar shapes (Triangle, Diamond, Cylinder) are not supported in the updated charting engine.
30

Figure 35 Bar Shape Options in the Original Charting Engine
Figure 36 No Bar Shape Options in the Updated Charting Engine
31

Figure 37 Bar Shapes in the Rendered Output in the Original Charting Engine
Figure 38 No Bar Shapes in the Rendered Output in the Updated Charting Engine
Bar Options TabIn the updated charting engine, in the Bar Options tab in the Format Chart dialog box, eachitem is broken out into its own separate section.
Type = RowsThe option of “Rows” as a “Type” in the Bar Options tab is not supported in the updated chartingengine, since it is 3D-specific rendering.
32
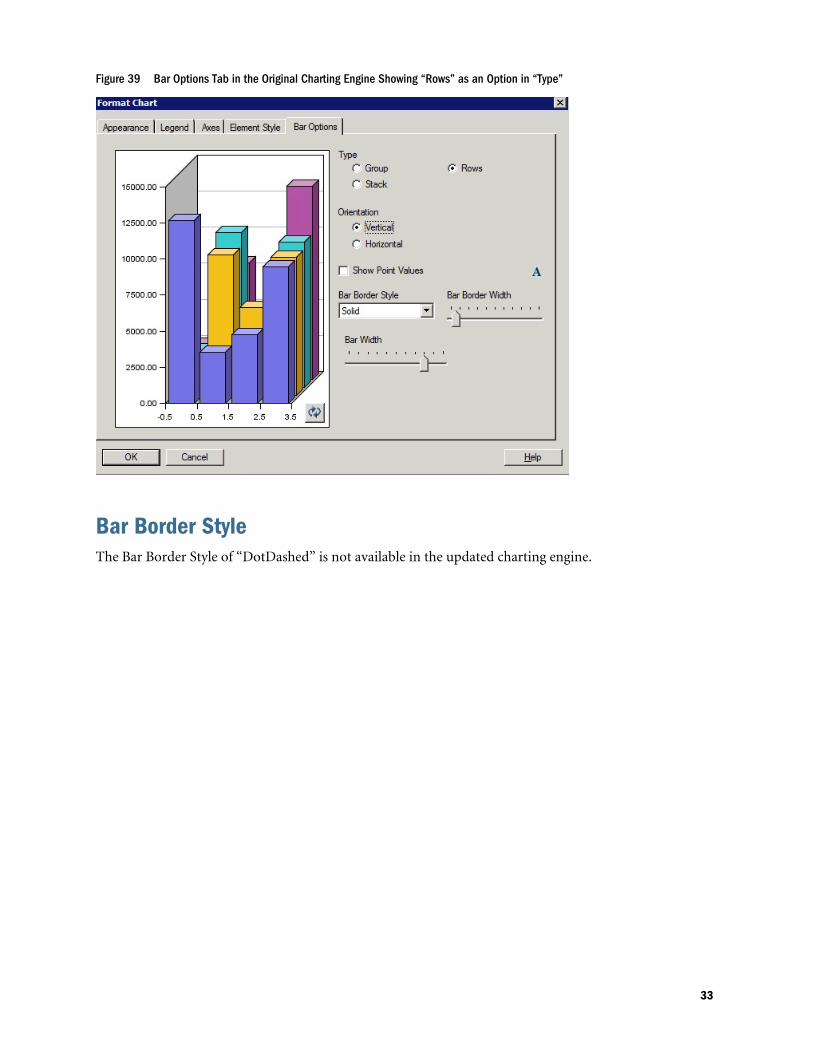
Figure 39 Bar Options Tab in the Original Charting Engine Showing “Rows” as an Option in “Type”
Bar Border StyleThe Bar Border Style of “DotDashed” is not available in the updated charting engine.
33
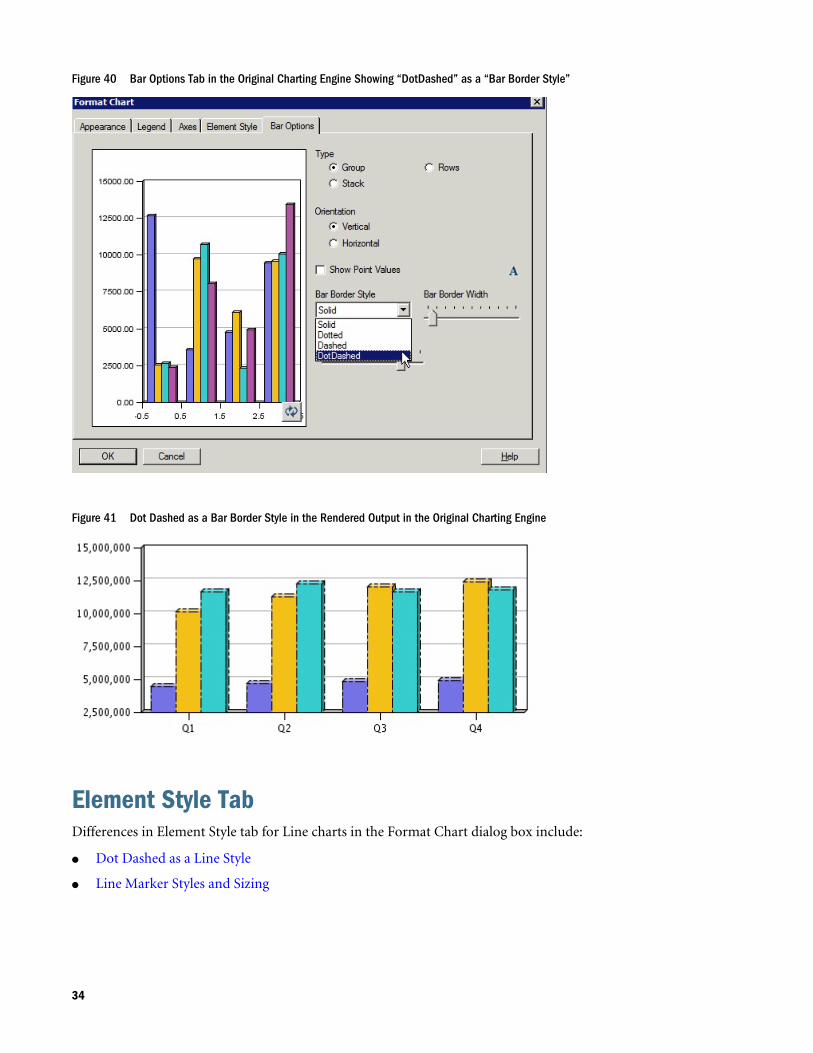
Figure 40 Bar Options Tab in the Original Charting Engine Showing “DotDashed” as a “Bar Border Style”
Figure 41 Dot Dashed as a Bar Border Style in the Rendered Output in the Original Charting Engine
Element Style TabDifferences in Element Style tab for Line charts in the Format Chart dialog box include:
l Dot Dashed as a Line Style
l Line Marker Styles and Sizing
34
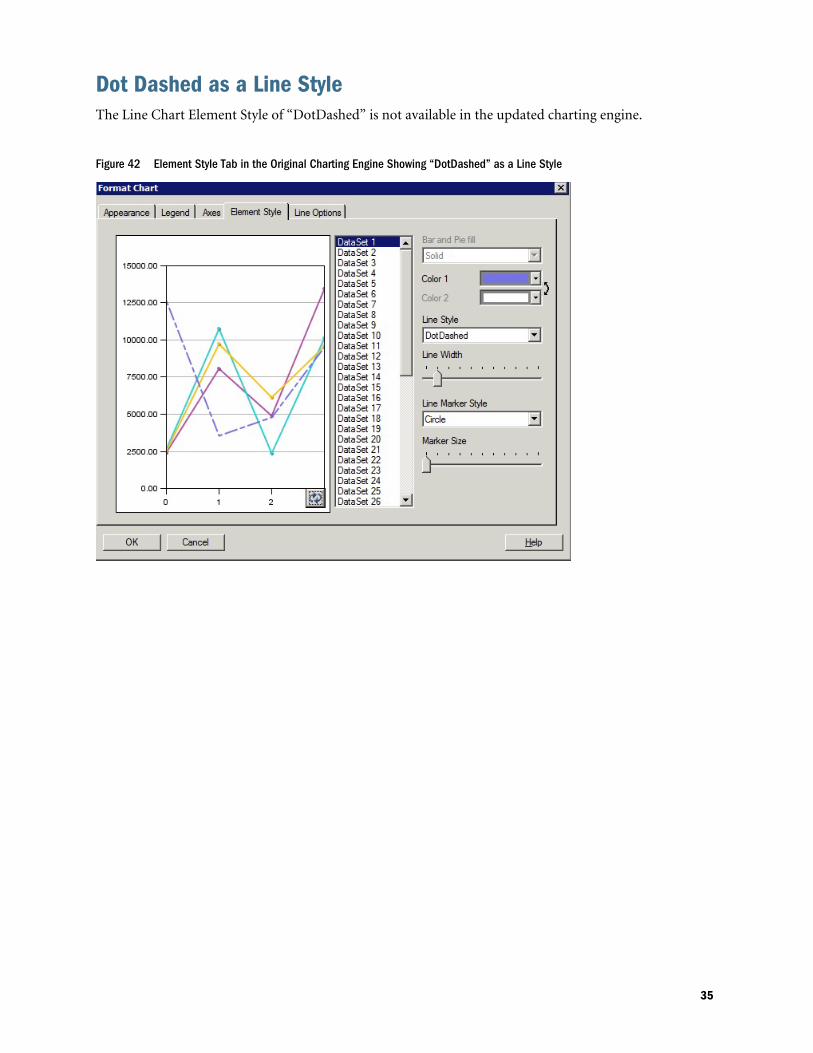
Dot Dashed as a Line StyleThe Line Chart Element Style of “DotDashed” is not available in the updated charting engine.
Figure 42 Element Style Tab in the Original Charting Engine Showing “DotDashed” as a Line Style
35
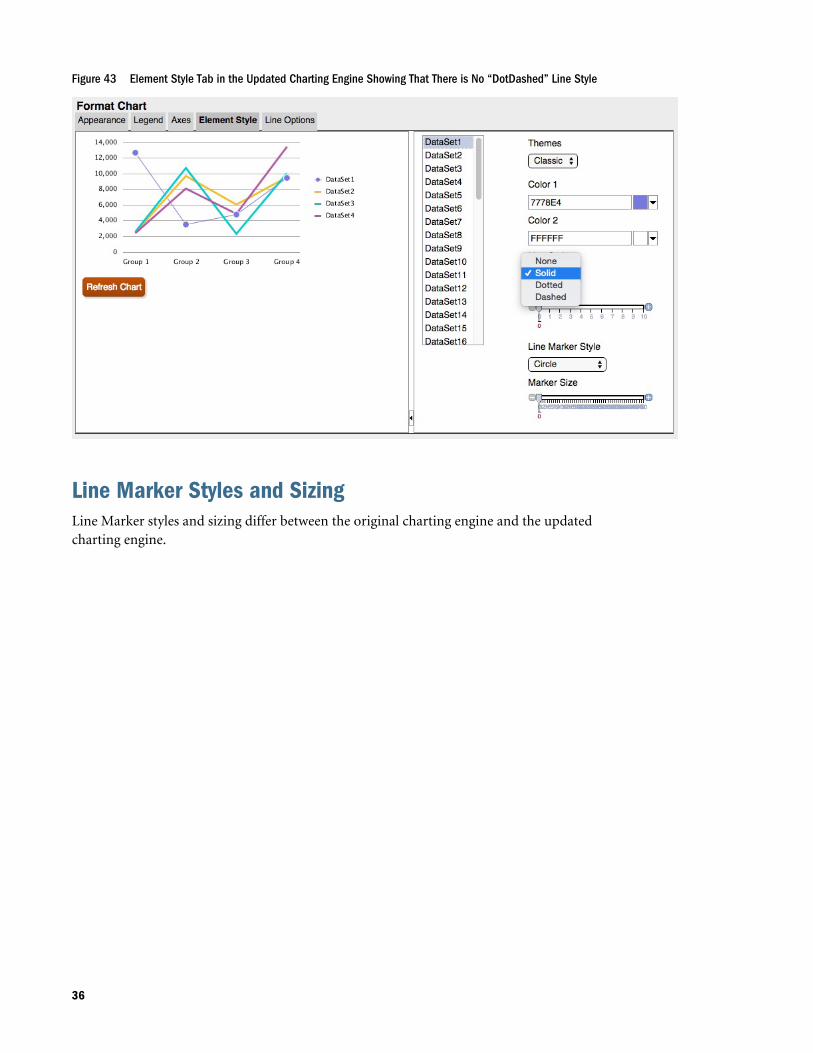
Figure 43 Element Style Tab in the Updated Charting Engine Showing That There is No “DotDashed” Line Style
Line Marker Styles and SizingLine Marker styles and sizing differ between the original charting engine and the updatedcharting engine.
36
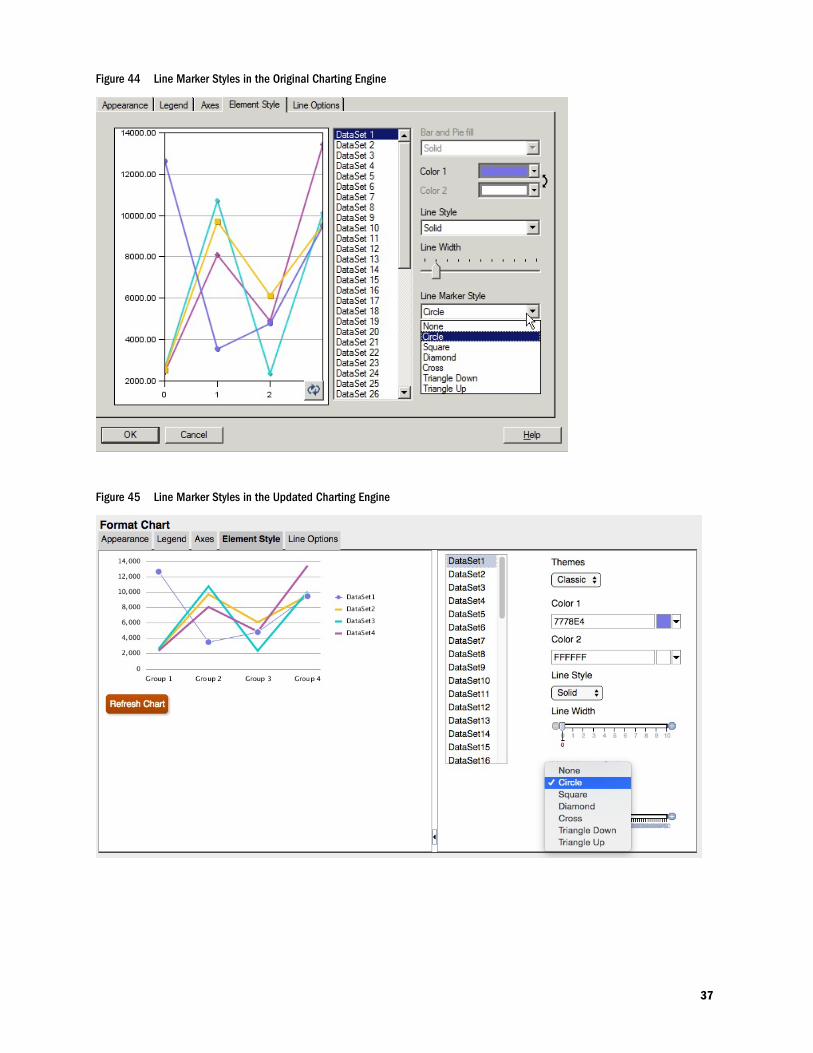
Figure 44 Line Marker Styles in the Original Charting Engine
Figure 45 Line Marker Styles in the Updated Charting Engine
37
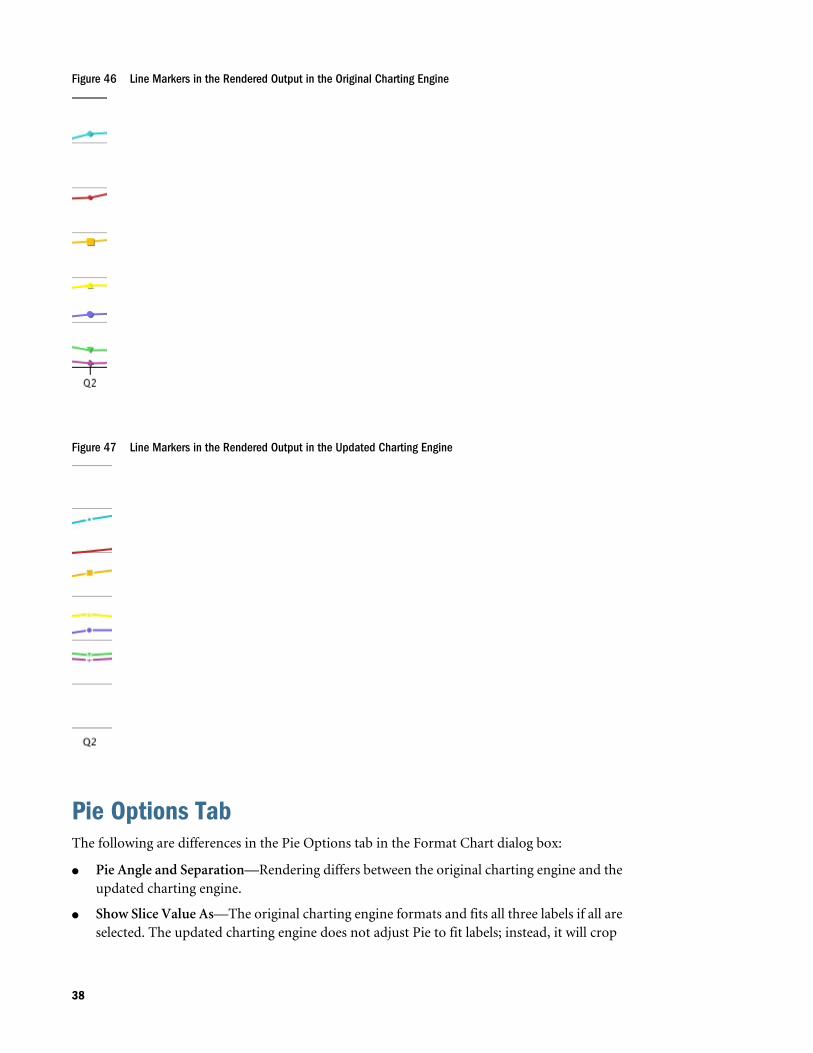
Figure 46 Line Markers in the Rendered Output in the Original Charting Engine
Figure 47 Line Markers in the Rendered Output in the Updated Charting Engine
Pie Options TabThe following are differences in the Pie Options tab in the Format Chart dialog box:
l Pie Angle and Separation—Rendering differs between the original charting engine and theupdated charting engine.
l Show Slice Value As—The original charting engine formats and fits all three labels if all areselected. The updated charting engine does not adjust Pie to fit labels; instead, it will crop
38
labels or not display them if the labels do not fit within the size of the Preview Window orchart output rendering.
l Position—In the updated charting engine, “radial” or “exterior” are supported withoutadditional adjustments.
With “radial” positioning, if the label cannot fit within the slice, it will either be placedoutside of the slice or not displayed at all.
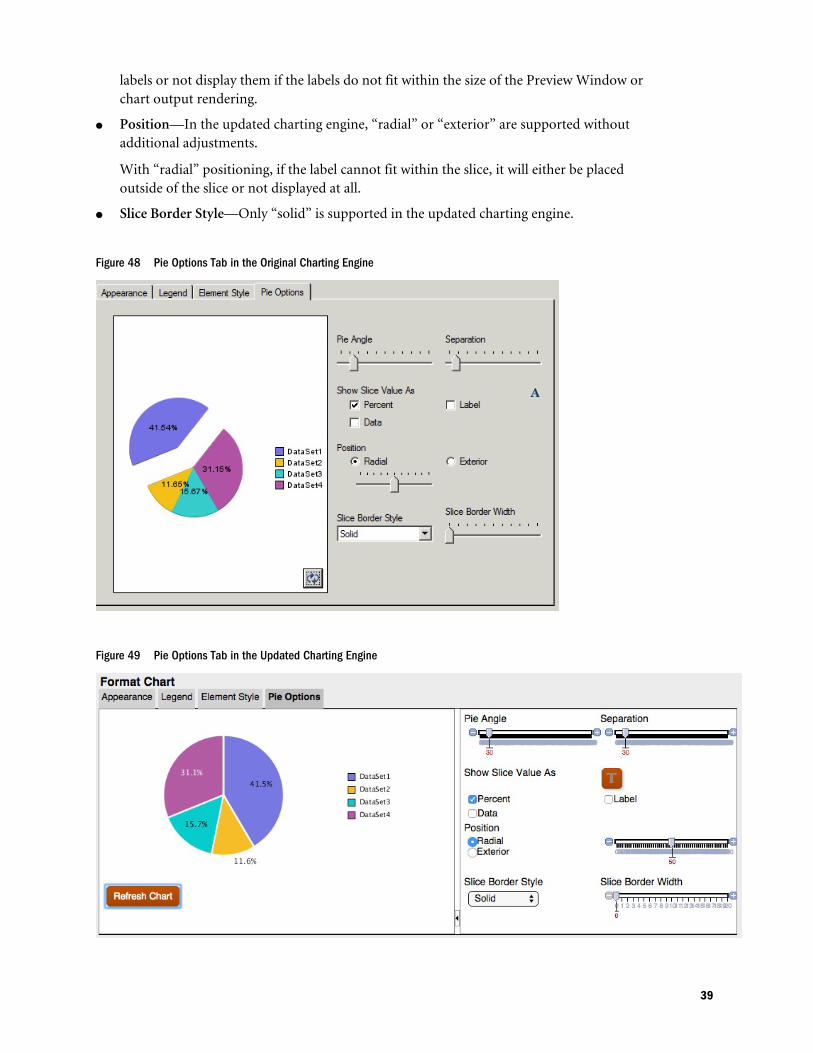
l Slice Border Style—Only “solid” is supported in the updated charting engine.
Figure 48 Pie Options Tab in the Original Charting Engine
Figure 49 Pie Options Tab in the Updated Charting Engine
39
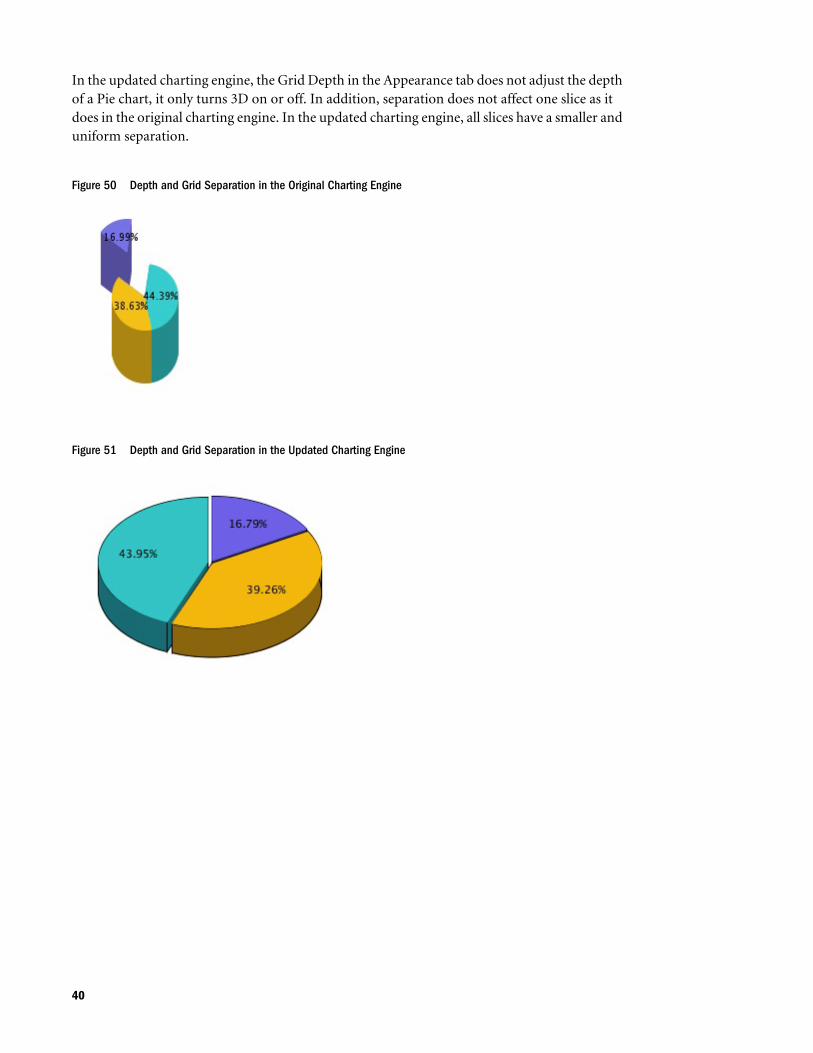
In the updated charting engine, the Grid Depth in the Appearance tab does not adjust the depthof a Pie chart, it only turns 3D on or off. In addition, separation does not affect one slice as itdoes in the original charting engine. In the updated charting engine, all slices have a smaller anduniform separation.
Figure 50 Depth and Grid Separation in the Original Charting Engine
Figure 51 Depth and Grid Separation in the Updated Charting Engine
40