Embed Size (px)
Citation preview
OPTICAL AND CONFOCAL MICROSCOPIC
STUDIES ON DISSOLUTION OF RICE STRAW
PARTICLES IN 1-ETHYL-3-
METHYLIMIDAZOLIUM ACETATE
Hlaing Hlaing Myint 1, 2
, W. Kurniawan 1, H. Hinode
1, N.N.Sein
2, J.S. Cross
1
1Department of International Development Engineering, Tokyo Institute of Technology,
Ookayama, Meguro-Ku, Tokyo, Japan 2 Department of Chemistry, University of Yangon, Kamayut, Yangon, Myanmar,
Tel./Fax. (+81)3-5734-3723, Email: [email protected], [email protected]
Received Date: February 25, 2016
Abstract
Abundant agriculture residue such as rice straw needs an effective pretreatment method in order to
efficiently and economically process it into biofuels and chemicals. In order to develop an
economical liquefaction process for pretreatment of rice straw, a 3D particle based-dissolution
process model needs to be investigated. As a result, this study was undertaken to develop a
dissolution model of ball milled rice straw (RS) particles in 1-Ethyl-3-Methylimidazolium Acetate
[Emim][OAc], at 120°, 140° and 160°C using optical and confocal microscopes. These results
showed the rectangular particle swelled in-plane during the heat treatment in [Emim][OAc] but the
thickness and volume decreased with heating time. As the particle swelling progressed, the particle
light intensity ratio increased which was confirmed by confocal and optical microscopy. Both the
particle light intensity ratio and volume ratio measurement were used to estimate the particle
dissolution end point. Heating at 160ºC accelerated particle dissolution and swelling significantly.
Decreasing the temperature from 160ºC to 120ºC extended the dissolving time changing from 10
min to 1 h. This new imaging analysis process model utilizing particle light intensity and volume
ratios allows significant improvement in dissolution process modeling for endpoint determination
and prediction. The dissolution process also has applications to other types of biomass.
Keywords: Ball-Milled Rice Straw Particle, Confocal Microscopy, Dissolution, 1-Ethyl-3-Methyl
imidazolium Acetate, Ionic Liquid, Optical Microscopy
Introduction
Lignocellulosic biomass such as rice straw is a sustainable and underutilized renewable
potential feedstock to produce biofuels that is an alternative to petroleum derived fuels.
Lignocellulosic biomass is composed of cellulose, hemicellulose and lignin. Cellulose is
insoluble in water and many organic solvents because of the rigid long chains and strong
hydrogen bonds within. Moreover, crystalline cellulose in biomass is more difficult to
dissolve than its amorphous phase [1]. Previously, crystalline to amorphous transformation
of cellulose was investigated at higher temperatures and pressures by in-situ microscopic
observation that showed complete dissolution in water where cellulose’s relative brightness
was monitored by micrographs [ 2 ]. Therefore, dissolution process models of
lignocellulosic biomass are needed in order to promote economic process development [3].
The group of Rogers discovered that several imidazolium-based ILs can dissolve large
amounts of cellulose [4]. Zavrel et al. observed that among the ionic liquids tested
[Emim][OAc] is the most efficient for dissolving cellulose [ 5]. Sun et al. reported that
[Emim][OAc] is a better solvent for wood treatment than 1-butyl-3-methylimidazolium
chloride [C4mim][Cl] because [C2mim][OAc] dissolved approximately 98.5% of the wood
ASEAN Engineering Journal Part B, Vol 5 No 2, ISSN 2286-7694 p.4
sample during the treatment, whereas [C4mim][Cl] dissolved only 52.6% of the wood
sample treated under the same conditions [6]. In addition, Nguyen et al. (2010) concluded
that [Emim][OAc] is a better solvent for rice straw treatment than 1-butyl-3-methyl
imidazolium chloride [Bmim]Cl) [7]. Ionic Liquid (IL) pretreatment of biomass is a
relatively new technology and it can decrease lignin content of biomass and also dissolve
microcrystalline cellulose in lignocellulosic biomass [8].
In first published paper of this study, we proposed the dissolution model based on
dissolution of ball milled rice straw particles at different milling temperatures of 60°C,
25°C, and -196°C (cryogenically) in [Emim][OAc] at three different temperatures (120°C-
160°C) and applied this model to the optical microscope [9]. We departed from our earlier
proposed the basic characterization of rice straw powder of different milling temperatures.
In doing so successfully predicted the particle dissolution time and changes particle
swelling behavior using optical image analysis. In this study, to better understand the
dissolution process model, the three dimensions (3D) image analysis is needed at the
microscopic particle level. Previously, a published observation on the dissolution
mechanism of lignocellulosic biomass in IL has shown particle swelling using optical
microscopy [10]. Zavrel et al. noted that scattered light intensities are sufficient to follow
physical changes during dissolution using in-situ image monitoring of cellulose by using
optical microscope but did not model the dissolution endpoint [5].
Confocal laser microscopy provides greater insight into the structure of biomass during
pretreatment because it allows for physical and chemical related measurements. On the
other hand, optical microscopes are widely used for mapping RS particle surface features
and there are numerous literature publications on this topic [2, 10]. Previous studies
showed that thin specimen sample preparation of switchgrass can destroy and alter the
sample features which makes sample or particle dissolution studies using this technique
impractical [11]. Luterbacher et al. investigated auto fluorescence intensity behavior effect
on the hydrolysis by using the fluorescence imaging [12]. However, they did not measure
localized light intensity change and compare systematically the relationship between the
biomass particle structure and background’s light intensity changes. What is currently
lacking in the literature is a comprehensive and quantitative study that evaluates the
dissolution of RS particles using both optical microscopy and confocal laser microscopy.
Furthermore, how to estimate the end point of particle dissolution of lignocellulosic
biomass based upon particle thickness, light intensity and particle volume has not yet been
investigated in detail.
Therefore, in this study the objective was to measure rice straw particle light intensity
ratio, volume ratio, and area ratio during dissolution in [Emim][OAc] by ex-situ heating at
120º, 140º and 160ºC utilizing both optical and confocal microscopy. This allowed us to
develop two new particle light intensity ratio model and volume ratio model of the rice
straw particle dissolution process and end point determination which we believe can be
extended to other temperatures and applicable to other types of biomass.
Material and Methods
Preparation of Milled Rice Straw powder
Dried rice straw (RS) stalks were obtained from a Machida City, Tokyo, Japan Tatami mat
vendor in the Naruse district. Dried rice straw stalks were cut into a length of 1 cm. A
stainless steel milling jar containing 3 g of 1 cm cut rice straw strips with a 25 mm stainless
steel ball was kept in an oven at room temperature for 2 h prior to grinding. The RS pieces
were milled with a Mill Mixer (Retsch MM400, Germany) at a frequency of 28 Hz with a
25 mm stainless steel ball for 2 min followed by screening to achieve powder particle size
ASEAN Engineering Journal Part B, Vol 5 No 2, ISSN 2286-7694 p.5
ranges from 75 to 100 µm using a Vibratory Sieve-Shaker (ANALYSETTE3, Germany).
Dissolution Procedure of Rice Straw Particle in [Emim][OAc]
Ionic liquid 1-ethyl-3-methylimidazoliumacetate [Emim][OAc] (97% purity) was
purchased from Sigma Aldrich and used without further purification. Ball milled RS
particles having dimensions between 75-100 µm were put on a hot plate and dried at 140°C
for 5 min in air on a glass slide to desorb moisture prior to adding [Emim][OAc]. In a
typical dissolution trial, 0.01 mg of rice straw was added to 10 µL [Emim][OAc] on a 1.0
mm thick glass slide and heated on a hot plate (HP-1S, As One, Japan) at 120°C. The glass
slide containing the RS particles in the [Emim][OAc] drop was removed from the hot plate
and observed periodically by an optical microscope (Olympus BX41, Japan) with a
Olympus E330 Hyper Crystal LCD digital camera (Japan) as well as using a Confocal
Laser Scanning Microscope (CLSM) (Olympus FLUOVIEW, FV 1200, Japan) after fixed
intervals of time. For the comparison of quantitative measurement of dissolution
mechanism, the RS particles heated in [Emim][OAc] at 120°, 140°, and 160°C were also
observed with both microscopes. In addition, heating at 160°C was done in triplicate on
particles to confirm microscopic reproducibility. Therefore, we only report the triplicate
results since they were done precisely using the same conditions.
Advanced Imaging Analysis for Rice Straw Particle Dissolution
For optical microscopy imaging, dissolution of RS particle was monitored using the above
noted optical microscope for measurements of particle dimensions a Dino-Lite calibration
grid was used and the magnification was 60 times in microphotographs using a 20 X
objective lens. In confocal laser scanning microscopy imaging system, fluorescence of the
RS particles in [Emim][OAc] were imaged without inverting the glass slide with fixed
excitation laser power at 2% (transmissivity). Alexa Fluor 488 dye was used with an
excitation wavelength of 473 nm and the emission spectra wavelength of 520 nm was
detected with a meta-detector scan range of 405-700 nm. Olympus image analysis software
(FV10-ASW; Ver. 04.00) was employed for controlling the confocal microscope and
image acquisition and area/volume measurements.
Particle Volume Measurement with Confocal Laser Scanning Microscopy
For the acquisition of 3D images and for calculating the particle volume, multiple 2D
images were taken after which the stage was raised (z dimension) with a stepping motor
under computer control [ 13 ]. The particle height or thickness was determined from
imaging the top and bottom of the particle while in focus. The stage was moved by
dividing the thickness into 11 steps or slices and scanning at each of the intermediate steps.
The particle area was determined by measuring the particle perimeter outline from the 2D
images and calculating the area. The measured thickness of the particle was multiplied
together by the particle area to estimate the particle volume in the case of manual volume
measurements.
Figures of Merit - Ratios
The optical microscope particle images were analyzed using ImageJ software to measure
the area and confocal microscope images were also analyzed to determine the particle areas
and light intensity ratios. The cross-sectional area ratio of particle was calculated using the
particle areas as a function of heating time (t) versus the initial area prior to heating (t=0)
by equation 1.
ASEAN Engineering Journal Part B, Vol 5 No 2, ISSN 2286-7694 p.6
Particle Area ratio (t)
(1)
The particle light intensity ratio was calculated based upon integrating the average
color intensity of the particle over the selected area defined above with optical and
confocal microscopy compared to [Emim][OAc] background intensity as shown in
equation 2,
Particle Light intensity ratio (t) =
(2)
The RS particle volume ratio as a function of heating time was calculated using
equation 3 below from the confocal microscope image results where volume was
calculated from the particle area that was multiplied by the particle thickness,
Particle volume ratio
(3)
Inorganic Material Analysis by ICP-AES
The RS powder was heated with an electric furnace at 500°C for 5 hr, dissolved in
concentrated Hydrogen Fluoride (HI) and analyzed by ICP-AES using standards (SPS
7800, Plasma Spectrometer, SII Seiko instruments Inc. Japan).
Results and Discussion
RS particle dissolution experiments were carried out separately in [Emim][OAc] at
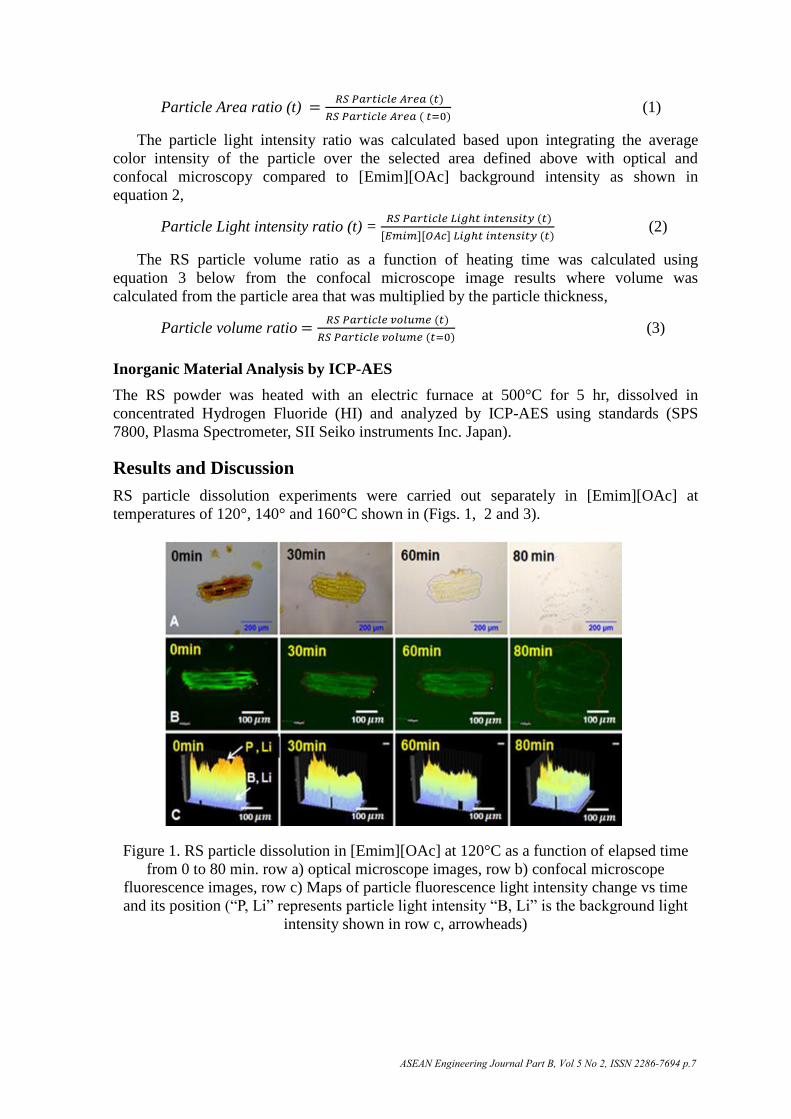
temperatures of 120°, 140° and 160°C shown in (Figs. 1, 2 and 3).
Figure 1. RS particle dissolution in [Emim][OAc] at 120°C as a function of elapsed time
from 0 to 80 min. row a) optical microscope images, row b) confocal microscope
fluorescence images, row c) Maps of particle fluorescence light intensity change vs time
and its position (“P, Li” represents particle light intensity “B, Li” is the background light
intensity shown in row c, arrowheads)
ASEAN Engineering Journal Part B, Vol 5 No 2, ISSN 2286-7694 p.7
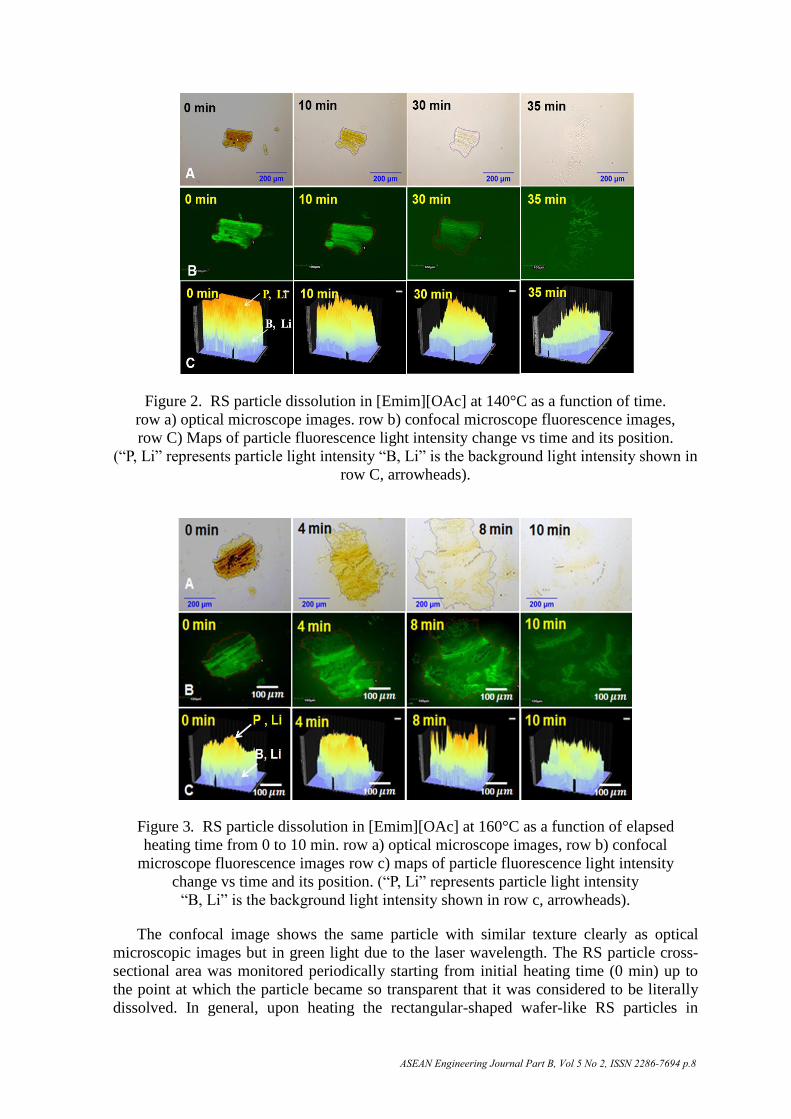
Figure 2. RS particle dissolution in [Emim][OAc] at 140°C as a function of time.
row a) optical microscope images. row b) confocal microscope fluorescence images,
row C) Maps of particle fluorescence light intensity change vs time and its position.
(“P, Li” represents particle light intensity “B, Li” is the background light intensity shown in
row C, arrowheads).
Figure 3. RS particle dissolution in [Emim][OAc] at 160°C as a function of elapsed
heating time from 0 to 10 min. row a) optical microscope images, row b) confocal
microscope fluorescence images row c) maps of particle fluorescence light intensity
change vs time and its position. (“P, Li” represents particle light intensity
“B, Li” is the background light intensity shown in row c, arrowheads).
The confocal image shows the same particle with similar texture clearly as optical
microscopic images but in green light due to the laser wavelength. The RS particle cross-
sectional area was monitored periodically starting from initial heating time (0 min) up to
the point at which the particle became so transparent that it was considered to be literally
dissolved. In general, upon heating the rectangular-shaped wafer-like RS particles in
ASEAN Engineering Journal Part B, Vol 5 No 2, ISSN 2286-7694 p.8
[Emim][OAc], the circumference gradually increased with an expanding cross-sectional
area as the heating time progressed. It was observed that the rectangular particle surface
gradually dissolved, becoming thinner and the particle circumference became larger as
noted from left to right in Figs. 1, 2 and 3. Therefore, our dissolution model may be applied
for use to the other type of biomass that consist of flat particles. However, for fibrous
materials, the dissolution is accompanied by swelling also known as ballooning (Navard et
al., 2011) [14]. In view of this image analysis, and the fact that published work has not
investigated such matters, i.e. measuring composition of dissolved RS particles are difficult.
The particle heated at 120ºC dissolved in about 60 min, whereas the particle heated at
160ºC dissolved in 10 min. Actually, the end point dissolution time of rice straw particle at
120°C occurred at 80 min. Mantanis and coauthor pointed out that two stages are involved
in dissolution process: first, the particle (polymer) swelling followed by the dissolution
step [15].
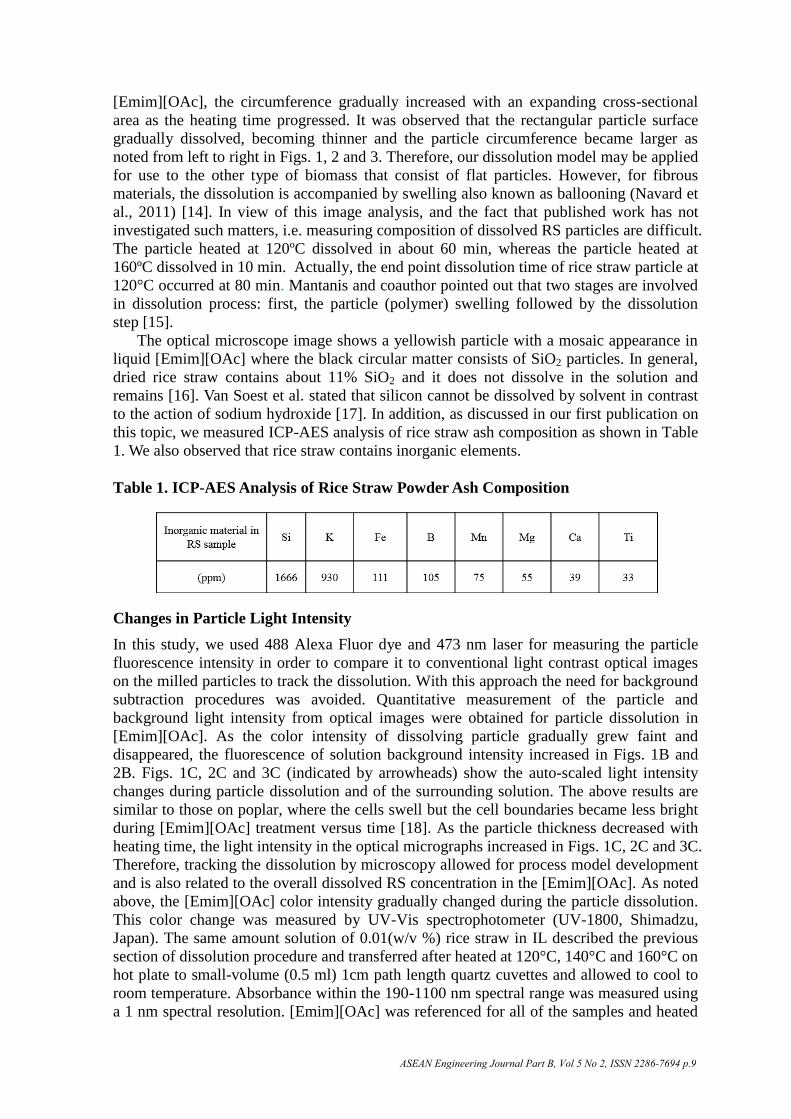
The optical microscope image shows a yellowish particle with a mosaic appearance in
liquid [Emim][OAc] where the black circular matter consists of SiO2 particles. In general,
dried rice straw contains about 11% SiO2 and it does not dissolve in the solution and
remains [16]. Van Soest et al. stated that silicon cannot be dissolved by solvent in contrast
to the action of sodium hydroxide [17]. In addition, as discussed in our first publication on
this topic, we measured ICP-AES analysis of rice straw ash composition as shown in Table
1. We also observed that rice straw contains inorganic elements.
Table 1. ICP-AES Analysis of Rice Straw Powder Ash Composition
Changes in Particle Light Intensity
In this study, we used 488 Alexa Fluor dye and 473 nm laser for measuring the particle
fluorescence intensity in order to compare it to conventional light contrast optical images
on the milled particles to track the dissolution. With this approach the need for background
subtraction procedures was avoided. Quantitative measurement of the particle and
background light intensity from optical images were obtained for particle dissolution in
[Emim][OAc]. As the color intensity of dissolving particle gradually grew faint and
disappeared, the fluorescence of solution background intensity increased in Figs. 1B and
2B. Figs. 1C, 2C and 3C (indicated by arrowheads) show the auto-scaled light intensity
changes during particle dissolution and of the surrounding solution. The above results are
similar to those on poplar, where the cells swell but the cell boundaries became less bright
during [Emim][OAc] treatment versus time [18]. As the particle thickness decreased with
heating time, the light intensity in the optical micrographs increased in Figs. 1C, 2C and 3C.
Therefore, tracking the dissolution by microscopy allowed for process model development
and is also related to the overall dissolved RS concentration in the [Emim][OAc]. As noted
above, the [Emim][OAc] color intensity gradually changed during the particle dissolution.
This color change was measured by UV-Vis spectrophotometer (UV-1800, Shimadzu,
Japan). The same amount solution of 0.01(w/v %) rice straw in IL described the previous
section of dissolution procedure and transferred after heated at 120°C, 140°C and 160°C on
hot plate to small-volume (0.5 ml) 1cm path length quartz cuvettes and allowed to cool to
room temperature. Absorbance within the 190-1100 nm spectral range was measured using
a 1 nm spectral resolution. [Emim][OAc] was referenced for all of the samples and heated
ASEAN Engineering Journal Part B, Vol 5 No 2, ISSN 2286-7694 p.9
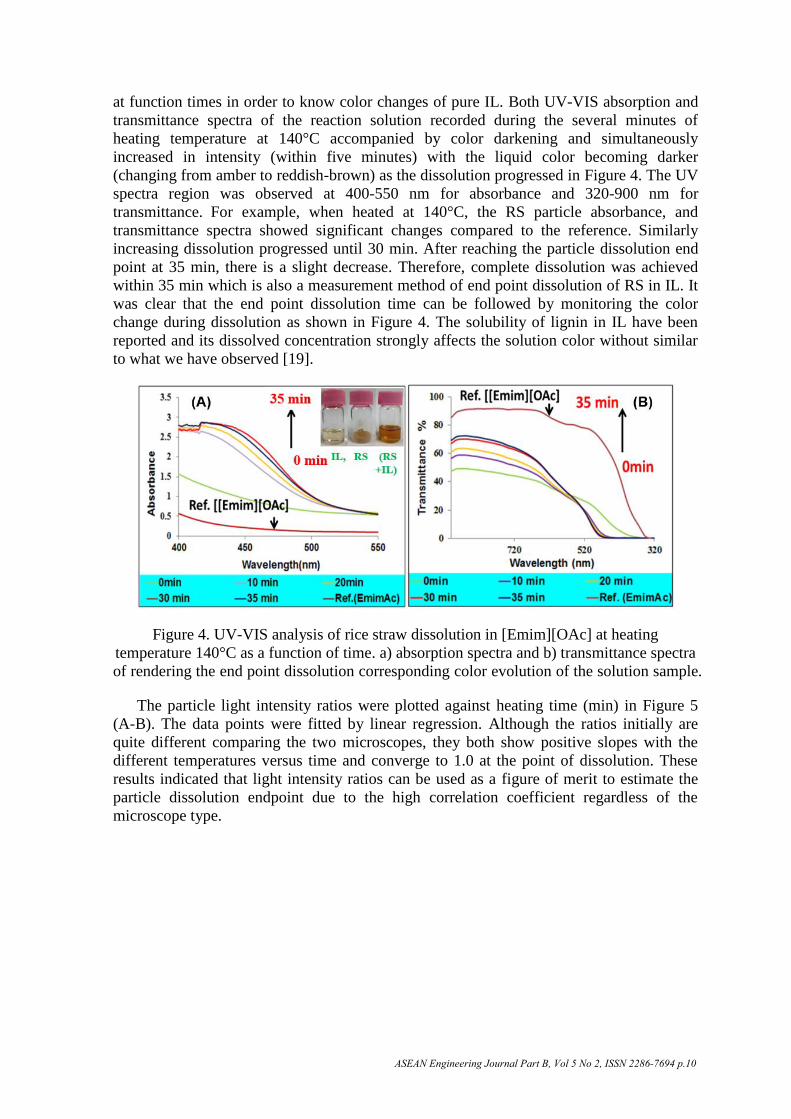
at function times in order to know color changes of pure IL. Both UV-VIS absorption and
transmittance spectra of the reaction solution recorded during the several minutes of
heating temperature at 140°C accompanied by color darkening and simultaneously
increased in intensity (within five minutes) with the liquid color becoming darker
(changing from amber to reddish-brown) as the dissolution progressed in Figure 4. The UV
spectra region was observed at 400-550 nm for absorbance and 320-900 nm for
transmittance. For example, when heated at 140°C, the RS particle absorbance, and
transmittance spectra showed significant changes compared to the reference. Similarly
increasing dissolution progressed until 30 min. After reaching the particle dissolution end
point at 35 min, there is a slight decrease. Therefore, complete dissolution was achieved
within 35 min which is also a measurement method of end point dissolution of RS in IL. It
was clear that the end point dissolution time can be followed by monitoring the color
change during dissolution as shown in Figure 4. The solubility of lignin in IL have been
reported and its dissolved concentration strongly affects the solution color without similar
to what we have observed [19].
Figure 4. UV-VIS analysis of rice straw dissolution in [Emim][OAc] at heating
temperature 140°C as a function of time. a) absorption spectra and b) transmittance spectra
of rendering the end point dissolution corresponding color evolution of the solution sample.
The particle light intensity ratios were plotted against heating time (min) in Figure 5
(A-B). The data points were fitted by linear regression. Although the ratios initially are
quite different comparing the two microscopes, they both show positive slopes with the
different temperatures versus time and converge to 1.0 at the point of dissolution. These
results indicated that light intensity ratios can be used as a figure of merit to estimate the
particle dissolution endpoint due to the high correlation coefficient regardless of the
microscope type.
ASEAN Engineering Journal Part B, Vol 5 No 2, ISSN 2286-7694 p.10
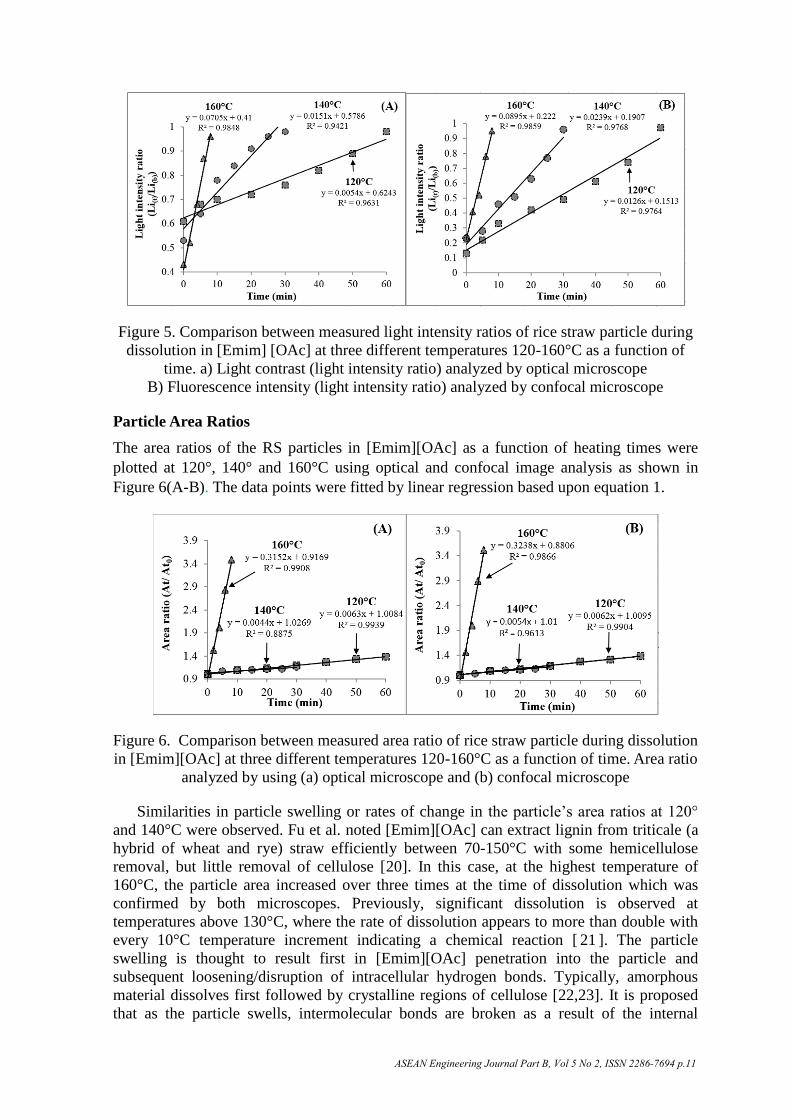
Figure 5. Comparison between measured light intensity ratios of rice straw particle during
dissolution in [Emim] [OAc] at three different temperatures 120-160°C as a function of
time. a) Light contrast (light intensity ratio) analyzed by optical microscope
B) Fluorescence intensity (light intensity ratio) analyzed by confocal microscope
Particle Area Ratios
The area ratios of the RS particles in [Emim][OAc] as a function of heating times were
plotted at 120°, 140° and 160°C using optical and confocal image analysis as shown in
Figure 6(A-B). The data points were fitted by linear regression based upon equation 1.
Figure 6. Comparison between measured area ratio of rice straw particle during dissolution
in [Emim][OAc] at three different temperatures 120-160°C as a function of time. Area ratio
analyzed by using (a) optical microscope and (b) confocal microscope
Similarities in particle swelling or rates of change in the particle’s area ratios at 120°
and 140°C were observed. Fu et al. noted [Emim][OAc] can extract lignin from triticale (a
hybrid of wheat and rye) straw efficiently between 70-150°C with some hemicellulose
removal, but little removal of cellulose [20]. In this case, at the highest temperature of
160°C, the particle area increased over three times at the time of dissolution which was
confirmed by both microscopes. Previously, significant dissolution is observed at
temperatures above 130°C, where the rate of dissolution appears to more than double with
every 10°C temperature increment indicating a chemical reaction [ 21 ]. The particle
swelling is thought to result first in [Emim][OAc] penetration into the particle and
subsequent loosening/disruption of intracellular hydrogen bonds. Typically, amorphous
material dissolves first followed by crystalline regions of cellulose [22,23]. It is proposed
that as the particle swells, intermolecular bonds are broken as a result of the internal
ASEAN Engineering Journal Part B, Vol 5 No 2, ISSN 2286-7694 p.11
stresses resulting in swelling [24]. Mantanis et al. observed that that mild swelling is
confined entirely to the amorphous portion of the particle [1515]. Therefore, higher
temperature promotes reactions and amorphization of the cellulose which reduce the
cellulose crystalline regions [25]. This result was in agreement with previous reports,
which attributed that rice straw particles were disrupted when heated between 160-190ºC
for 1-5 min in dilute acid [26]. Rice straw consists of heterogeneous regions such as
hydrophilic amorphous cellulose and hemicellulose which can induce readily swell at
higher temperatures [27]. Similar pretreatment on switchgrass showed enlarged cell walls
at elevated temperature [ 28 ]. Another reason for more rapid dissolution is the
[Emim][OAc] viscosity decreases with increasing temperature which promotes higher
mass transfer to and away from the dissolving particle surface [29].
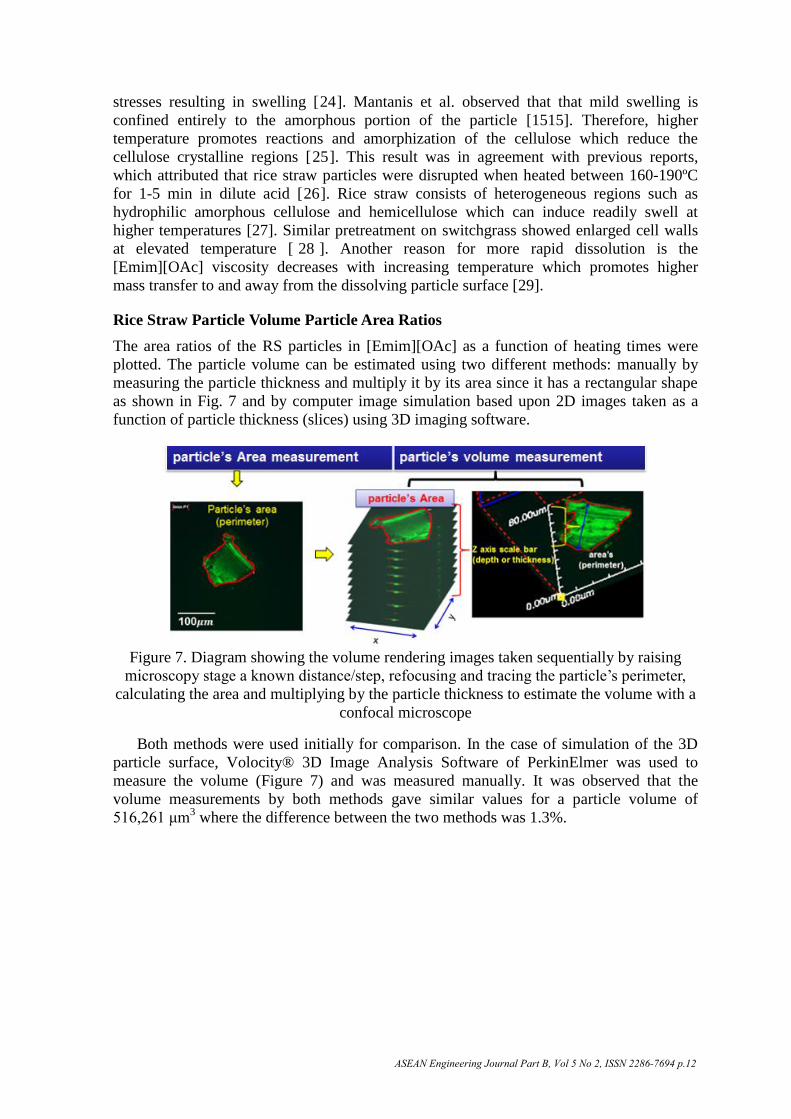
Rice Straw Particle Volume Particle Area Ratios
The area ratios of the RS particles in [Emim][OAc] as a function of heating times were
plotted. The particle volume can be estimated using two different methods: manually by
measuring the particle thickness and multiply it by its area since it has a rectangular shape
as shown in Fig. 7 and by computer image simulation based upon 2D images taken as a
function of particle thickness (slices) using 3D imaging software.
Figure 7. Diagram showing the volume rendering images taken sequentially by raising
microscopy stage a known distance/step, refocusing and tracing the particle’s perimeter,
calculating the area and multiplying by the particle thickness to estimate the volume with a
confocal microscope
Both methods were used initially for comparison. In the case of simulation of the 3D
particle surface, Volocity® 3D Image Analysis Software of PerkinElmer was used to
measure the volume (Figure 7) and was measured manually. It was observed that the
volume measurements by both methods gave similar values for a particle volume of
516,261 μm3 where the difference between the two methods was 1.3%.
ASEAN Engineering Journal Part B, Vol 5 No 2, ISSN 2286-7694 p.12
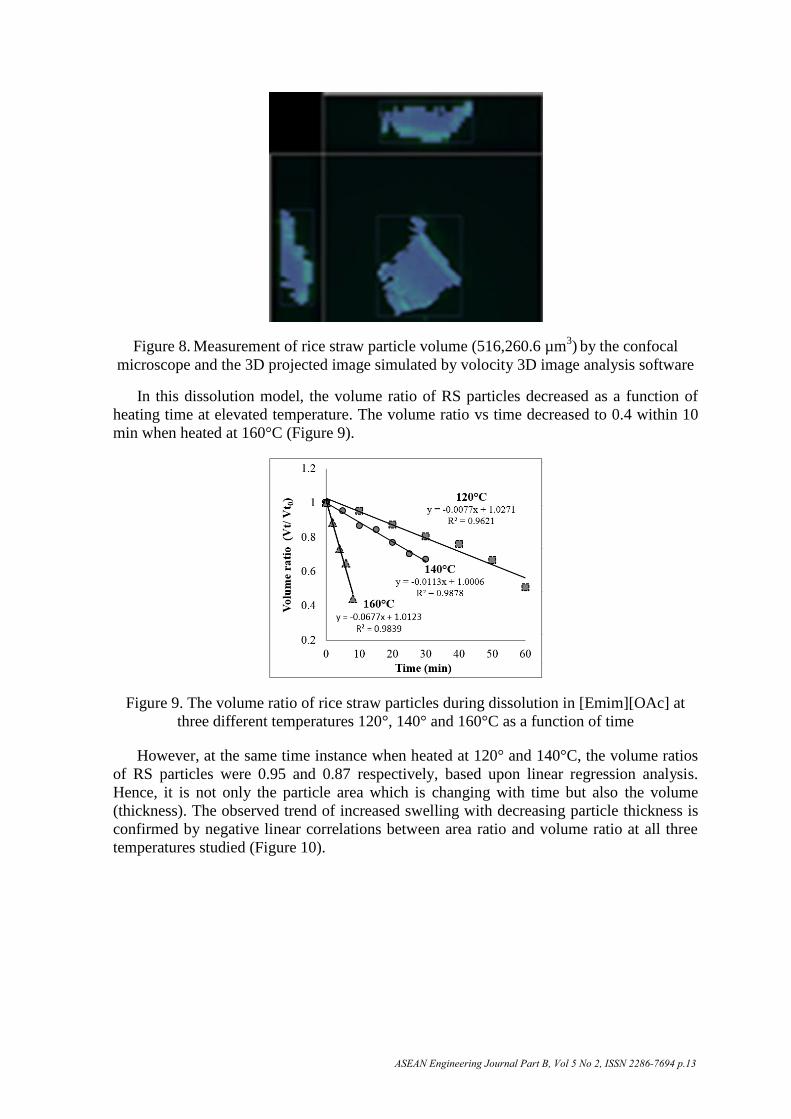
Figure 8. Measurement of rice straw particle volume (516,260.6 µm3)
by the confocal
microscope and the 3D projected image simulated by volocity 3D image analysis software
In this dissolution model, the volume ratio of RS particles decreased as a function of
heating time at elevated temperature. The volume ratio vs time decreased to 0.4 within 10
min when heated at 160°C (Figure 9).
Figure 9. The volume ratio of rice straw particles during dissolution in [Emim][OAc] at
three different temperatures 120°, 140° and 160°C as a function of time
However, at the same time instance when heated at 120° and 140°C, the volume ratios
of RS particles were 0.95 and 0.87 respectively, based upon linear regression analysis.
Hence, it is not only the particle area which is changing with time but also the volume
(thickness). The observed trend of increased swelling with decreasing particle thickness is
confirmed by negative linear correlations between area ratio and volume ratio at all three
temperatures studied (Figure 10).
ASEAN Engineering Journal Part B, Vol 5 No 2, ISSN 2286-7694 p.13
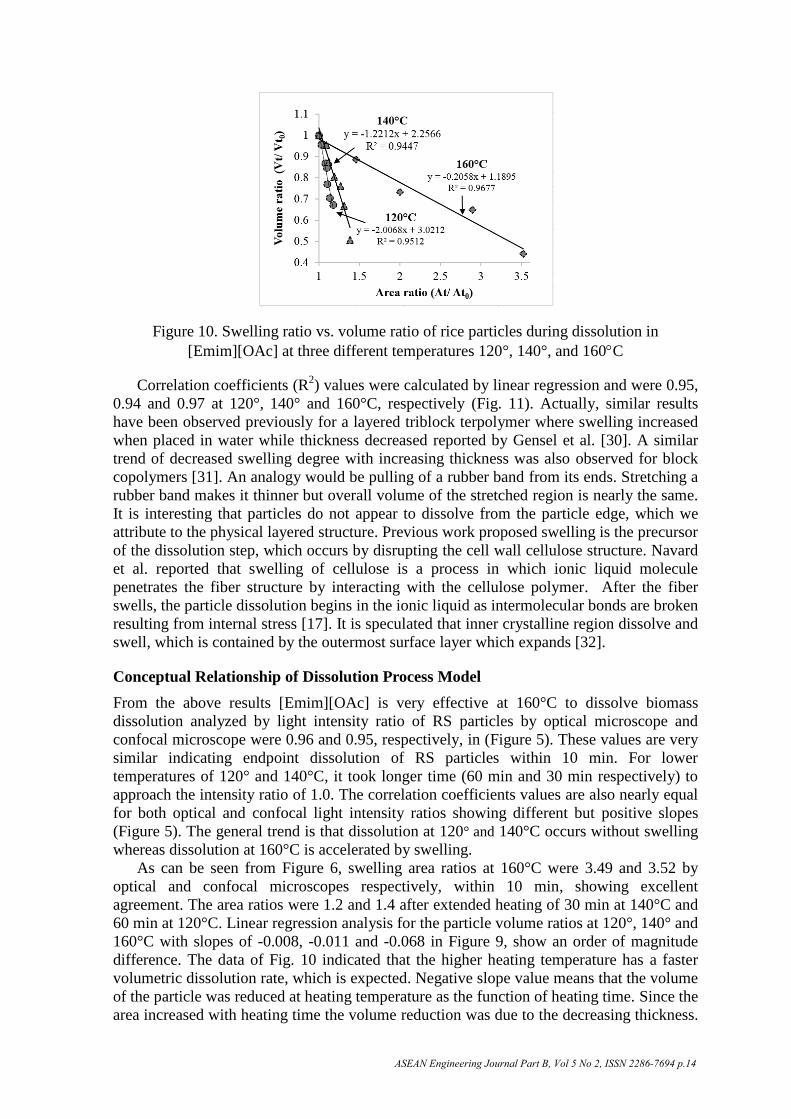
Figure 10. Swelling ratio vs. volume ratio of rice particles during dissolution in
[Emim][OAc] at three different temperatures 120°, 140°, and 160C
Correlation coefficients (R2) values were calculated by linear regression and were 0.95,
0.94 and 0.97 at 120°, 140° and 160°C, respectively (Fig. 11). Actually, similar results
have been observed previously for a layered triblock terpolymer where swelling increased
when placed in water while thickness decreased reported by Gensel et al. [30]. A similar
trend of decreased swelling degree with increasing thickness was also observed for block
copolymers [31]. An analogy would be pulling of a rubber band from its ends. Stretching a
rubber band makes it thinner but overall volume of the stretched region is nearly the same.
It is interesting that particles do not appear to dissolve from the particle edge, which we
attribute to the physical layered structure. Previous work proposed swelling is the precursor
of the dissolution step, which occurs by disrupting the cell wall cellulose structure. Navard
et al. reported that swelling of cellulose is a process in which ionic liquid molecule
penetrates the fiber structure by interacting with the cellulose polymer. After the fiber
swells, the particle dissolution begins in the ionic liquid as intermolecular bonds are broken
resulting from internal stress [17]. It is speculated that inner crystalline region dissolve and
swell, which is contained by the outermost surface layer which expands [32].
Conceptual Relationship of Dissolution Process Model
From the above results [Emim][OAc] is very effective at 160°C to dissolve biomass
dissolution analyzed by light intensity ratio of RS particles by optical microscope and
confocal microscope were 0.96 and 0.95, respectively, in (Figure 5). These values are very
similar indicating endpoint dissolution of RS particles within 10 min. For lower
temperatures of 120° and 140°C, it took longer time (60 min and 30 min respectively) to
approach the intensity ratio of 1.0. The correlation coefficients values are also nearly equal
for both optical and confocal light intensity ratios showing different but positive slopes
(Figure 5). The general trend is that dissolution at 120° and 140°C occurs without swelling
whereas dissolution at 160°C is accelerated by swelling.
As can be seen from Figure 6, swelling area ratios at 160°C were 3.49 and 3.52 by
optical and confocal microscopes respectively, within 10 min, showing excellent
agreement. The area ratios were 1.2 and 1.4 after extended heating of 30 min at 140°C and
60 min at 120°C. Linear regression analysis for the particle volume ratios at 120°, 140° and
160°C with slopes of -0.008, -0.011 and -0.068 in Figure 9, show an order of magnitude
difference. The data of Fig. 10 indicated that the higher heating temperature has a faster
volumetric dissolution rate, which is expected. Negative slope value means that the volume
of the particle was reduced at heating temperature as the function of heating time. Since the
area increased with heating time the volume reduction was due to the decreasing thickness.
ASEAN Engineering Journal Part B, Vol 5 No 2, ISSN 2286-7694 p.14
Correlation coefficient value (R2) of area and volume ratios was higher than 0.9 indicating
a good fit.
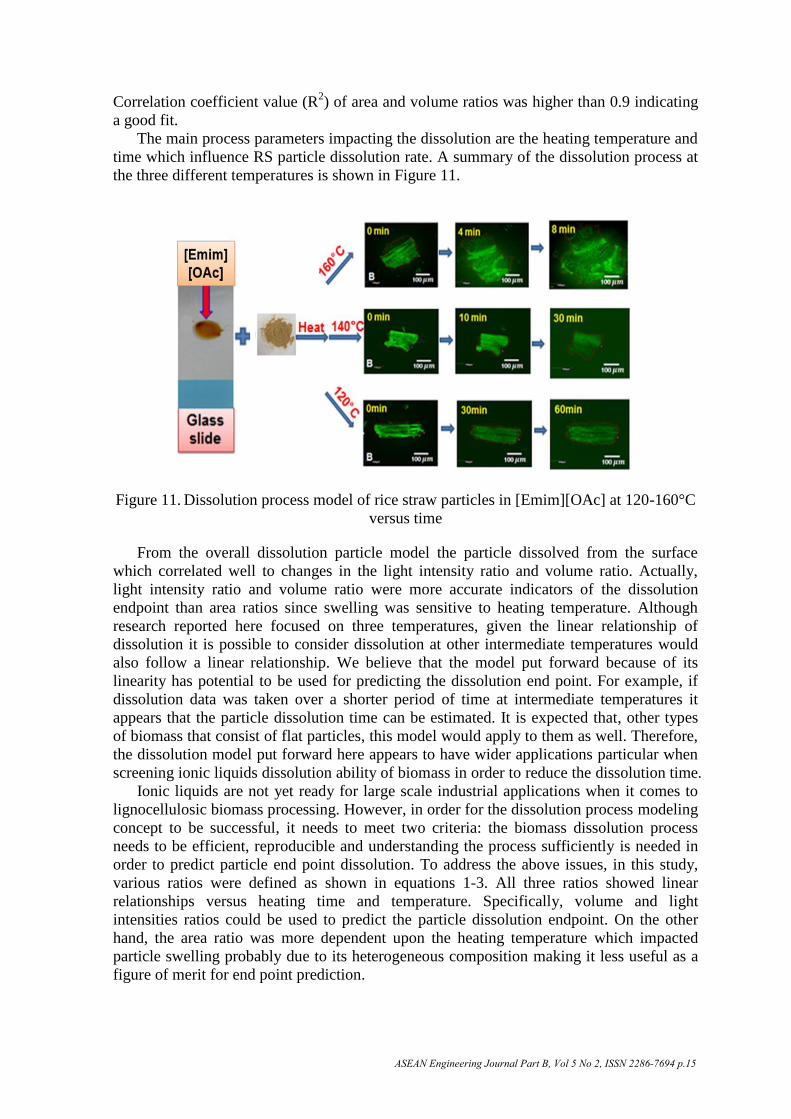
The main process parameters impacting the dissolution are the heating temperature and
time which influence RS particle dissolution rate. A summary of the dissolution process at
the three different temperatures is shown in Figure 11.
Figure 11. Dissolution process model of rice straw particles in [Emim][OAc] at 120-160°C
versus time
From the overall dissolution particle model the particle dissolved from the surface
which correlated well to changes in the light intensity ratio and volume ratio. Actually,
light intensity ratio and volume ratio were more accurate indicators of the dissolution
endpoint than area ratios since swelling was sensitive to heating temperature. Although
research reported here focused on three temperatures, given the linear relationship of
dissolution it is possible to consider dissolution at other intermediate temperatures would
also follow a linear relationship. We believe that the model put forward because of its
linearity has potential to be used for predicting the dissolution end point. For example, if
dissolution data was taken over a shorter period of time at intermediate temperatures it
appears that the particle dissolution time can be estimated. It is expected that, other types
of biomass that consist of flat particles, this model would apply to them as well. Therefore,
the dissolution model put forward here appears to have wider applications particular when
screening ionic liquids dissolution ability of biomass in order to reduce the dissolution time.
Ionic liquids are not yet ready for large scale industrial applications when it comes to
lignocellulosic biomass processing. However, in order for the dissolution process modeling
concept to be successful, it needs to meet two criteria: the biomass dissolution process
needs to be efficient, reproducible and understanding the process sufficiently is needed in
order to predict particle end point dissolution. To address the above issues, in this study,
various ratios were defined as shown in equations 1-3. All three ratios showed linear
relationships versus heating time and temperature. Specifically, volume and light
intensities ratios could be used to predict the particle dissolution endpoint. On the other
hand, the area ratio was more dependent upon the heating temperature which impacted
particle swelling probably due to its heterogeneous composition making it less useful as a
figure of merit for end point prediction.
ASEAN Engineering Journal Part B, Vol 5 No 2, ISSN 2286-7694 p.15
Conclusions
This study investigated the rice straw particle dissolution process analytically in
[Emim][OAc] while at heating temperatures of 120°, 140° and 160°C using optical and
confocal laser microscopy. The results showed that this dissolution process can be clearly
divided into two stages, 1) penetration of IL inside the RS particle inducing its surface
dissolution and swelling, 2) as the particle dissolved, it became thinner and the light
intensity ratio increased with heating time. The key process parameters were temperature
and heating time, with temperature having the largest impact. Observing the dissolution of
RS particle by confocal and optical microscopy allowed for the development of key
process ratios and a 3D dissolution particle model. Scientific research on light intensity
change and using it to model the dissolution of biomass by confocal microscopy is still
rather undeveloped. In this work we put forward several different ratios to quantify the
dissolution rate and observed that the light intensity ratio is the best figure of merit to
model dissolution. We speculate that the reason why particles dissolve from the surface is
due to the preferential ionic liquid penetration along the cell walls and disruption of
hydrogen bonds within the biomass. We anticipate that the proposed model has wider
ranging applications to predict particulate dissolutions at intermediate temperatures, predict
dissolution endpoints without waiting for complete dissolution and potential use for
screening other ionic liquids for biomass dissolution and process optimization.
References
[1] B. Lindman, G. Karlström, and L. Stigsson, “On the mechanism of dissolution of
cellulose”, Journal of Molecular Liquid, Vol. 156, pp. 76-81, 2010.
[2] S. Deguchi, K. Tsujii, and K. Horikoshi, “Crystalline-to-amorphous transformation of
cellulose in hot and compressed water and its implications for hydrothermal
conversion”, Green Chemistry, Vol. 10, pp. 191-196, 2008.
[3] B. Yang, and C.E. Wyman, “Pretreatment: the key to unlocking low-cost cellulosic
ethanol”, Biofuels Bioprodocts and Biorefining, Vol. 2, pp. 26-40, 2008.
[4] R.P. Swatloski, S.K. Spear, J.D. Holbrey, and R.D. Rogers, “Dissolution of cellulose
with ionic liquids”, Journal American Chemical Society, Vol. 124, No.18, pp. 4974-
4975, 2002.
[5] M. Zavrel, D. Bross, M. Funke, J. Büchs, and A.C. Spiess, “High-throughput
screening for ionic liquids dissolving (ligno-)cellulose”, Bioresource Technology,
Vol. 100, pp. 2580-2587, 2009.
[6] N. Sun, M. Rahman, Y. Qin, L. M. Mirela, R. Hector, and R.D. Rogers, “Complete
dissolution and partial delignification of wood in the ionic liquid 1-ethyl-3-methyl
imidazolium acetate”, Green Chemistry, Vol. 11, pp. 646–655, 2009.
[7] T.A.D. Nguyen, K.R. Kim, S.J. Han, H.Y. Cho, J. W. Kim, S. M. Park, J. C. Park JC,
and S. J. Sim, “Pretreatment of rice straw with ammonia and ionic liquid for
lignocellulose conversion to fermentable sugars”, Bioresource Technology, Vol. 101,
pp. 7432–7438, 2010.
[8] A. Brandt, J. Gräsvik, J.P. Hallett, and T. Welton, “Deconstruction of lignocellulosic
biomass with ionic liquids”, Green Chemistry, Vol. 15, pp. 550-583, 2013.
[9] H.H. Myint, W. Kurniawan, H. Hinode, N.N. Sein, C. Salim, and J.S. Cross,
“Dissolution model of ball milled rice straw particles in 1-ethyl-3-methylimidazolium
acetate at elevated temperature”, J Bioprocess Biotech, Vol. 5, No. 11, 2015.
ASEAN Engineering Journal Part B, Vol 5 No 2, ISSN 2286-7694 p.16
[10] M.B. Rahman, Z.I. Ishak, D.K. Abdullah, A.A. Abdul, M. Basri, and A.B. Salleh,
“Swelling and dissolution of oil palm biomass in ionic liquids”, Journal of Oil Palm
Research, Vol. 24, pp. 1267-1276, 2012.
[11] Z. Ji, D. Ding, Z. Ling, X. Zhang, X. Zhou, and F. Xu, “In situ microscopic
investigation of plant Cell walls deconstruction in biorefinery”, Méndez-Vilas, ed.:
Microscopy: Advances in Scientific Research and Education, Spain, pp. 426-433,
2014.
[12] J.S. Luterbacher, J.M. Moran-Mirabal, E.W. Burkholder, and L.P. Walker,
“Modeling enzymatic hydrolysis of lignocellulosic substrates using fluorescent
confocal microscopy II: pretreated biomass”, Biotechnology Bioengineering, Vol.
112, No.1, pp. 32-42, 1996.
[13] H. Satoh, L.M. Delbridge, L.A. Blatter, and D.M. Bers, “Surface: volume
relationship in cardiac myocytes studied with confocal microscopy and membrane
capacitance measurements: pecies dependence and developmental effects”,
Biophysical Journal, Vol. 70, pp. 1494-1504, 1996.
[14] P. Navard, and C. Cuissinat. “Cellulose swelling and dissolution as a tool to study the
Fiber structure”, The 7th International Symposium: Alternative Cellulose:
Manufacturing, Forming, Properties, Rudolstadt, Germany, 2006.
[15] G.I. Mantanis, R.A. Young, and R. M. Rowell, “Swelling of compressed cellulose
fiberwebs in organic liquids”, Cellulose, Vol. 2, pp.1-22, 1995.
[16] P. Lu, and Y.L. Hsieh, “Highly pure amorphous silica nano-disks from rice straw”,
Powder Technology, Vol. 225, pp. 149-155, 2012.
[17] P. J. Van Soest, “Rice straw, the role of silica and treatments to improve quality”,
Animal Feed Science and Technology, Vol. 130, 137-171, 2006.
[18] M. Lucas, G.L. Wagner, Y. Nishiyama, L. Hanson, I.P. Samayam, C.A. Schall, P.
Langan, and K.D. Rector, “Reversible swelling of the cell wall of poplar biomass by
ionic liquid at room temperature”, Bioresource Technology, Vol. 102, No. 6, pp.
4518–4523, 2011.
[19] A. Diop, A.H. Bouazza, C. Daneault, and D. Montplaisir, “New ionic liquid for the
dissolution of lignin”, BioResources, Vol. 8, No.3, pp.4270-4282, 2013.
[20] D. Fu, G. Mazza, and Y. Tamaki, “Lignin extraction from straw by ionic liquids and
enzymatic hydrolysis of the cellulosic residues”, Journal Agricultural Food
Chemistry, Vol. 58, No.5, pp. 2915-2922, 2010.
[21] N Sun, M. Rahman, Y Qin, M.L. Maxim, H. Rodrıguez, and R.D. Rogers, “Complete
dissolution and partial delignification of wood in the ionic liquid 1-ethyl-3-methyl
imidazolium acetate”, Green Chemistry, Vol. 11, pp.646-655, 2009.
[22] H. Liu, K.L. Sale, B.M. Holmes, B.A. Simmons, and S. Singh, “Understanding the
interactions of cellulose with ionic liquids: a molecular dynamics study”, Journal
Physical Chemistry, Vol. 14, No. 12, pp. 4293-4301, 2010.
[23] S. Mc Queen- Manson, and D.J. Cosgrove, “Disruption of hydrogen bonding between
plant cell wall polymers by proteins that induce wall extension”, Proceeding of
National Academy of Sciences of the United State of America, Vol. 9, pp. 6574-6578,
1994.
[24] H. Khademieslam, M. Kalagar, E.M. Moridani, R. Hosienpoor, and A. Tavakkoli,
“The influence of rice straw flour silane treatment on the physical and mechanical
properties composite”, World Applied Sciences Journal, Vol. 27, pp. 663-666, 2013.
[25] M. Polettoa, V. Pistor, R.M.C. Santana, and A.J. Zattera, “Materials produced from
plant bomass part II: evaluation of crystallinity and degradation kinetics of cellulose”,
Materials Research, Vol. 15, No.3, pp. 421-427, 2012.
ASEAN Engineering Journal Part B, Vol 5 No 2, ISSN 2286-7694 p.17
[26] T.C. Hsu, G.L. Guo, W.H. Chen, and W.S. Hwang, “Effect of dilute acid
pretreatment of rice straw on structural properties and enzymatic hydrolysis”,
Bioresource Technology, Vol. 101, pp. 4907- 4913, 2010.
[27] A. Célino, S. Fréour, F. Jacquemin, and P. Casari, “The hygroscopic behavior of
plant fibers: a review”, Frontier in Chemistry, Vol. 1, No. 43, pp.1-12, 2014.
[28] S. Singh, B.A. Simmons, and K.P. Vogel, “Visualization of biomass solubilization
and Cellulose regeneration during ionic liquid pretreatment of switchgrass”,
Biotechnology Bioengineering, Vol. 104, pp. 68-75, 2009.
[29] A. Pinkert, K.L. Ang, K.N. Marsh, and S. Pang, “Density, viscosity and electrical
conductivity of protic alkanolammonium ionic liquids”, Physical Chemistry
Chemical Physics, Vol. 13, pp. 5136-5143, 2011.
[30] J. Gensel, I. Dewald, J. Erath, E. Betthausen, A.H. E. Muller, and A. Fery,
“Reversible swelling transitions in stimuli-responsive layer-by-layer films containing
block copolymer micelles”, Chemical Science, Vol. 4, pp. 325-334, 2013.
[31] J. Gensel, C. Liedel, H.G. Schoberth, and L. Tsarkova, “Micro-structure-macro-
response relationship in swollen block copolymer films”, Soft Matter, Vol. 5, No. 13,
pp. 2534-2537, 2009.
[32] S. Zhang, W.C. Wang, F.X. Li, and J.Y. Yu, “ Swelling and dissolution of cellulose
in NaOH aqueous solvent systems”, Cellulose Chemistry and Technology, Vol. 47,
No. 9-10, pp. 671-679, 2012.
ASEAN Engineering Journal Part B, Vol 5 No 2, ISSN 2286-7694 p.18