Embed Size (px)
Citation preview

In cooperat ion wi th
2015 REPORT
opportunities for Poland opportunities for Poland
5


1
opportunities for Poland5
October 2015

2
About McKinsey & Company
McKinsey & Company is a global management consulting firm, deeply committed to helping institutions in the private, public and social sectors achieve lasting success. For over eight decades, our primary objective has been to serve as our clients’ most trusted external advisor. With consultants in more than 100 offices in 61 countries, across industries and functions, we bring unparalleled expertise to clients anywhere in the world. We work closely with teams at all levels of an organization to shape winning strategies, mobilize for change, build capabilities and drive successful execution.
McKinsey’s Polish office opened in 1993. Over the last 20 years, the office has served as trusted advisor to Poland’s largest companies as well as key public and government institutions. We are proud to have shared the transformation and growth journey with the industry leaders in banking and insurance, basic materials, consumer goods, energy, oil, telecommunications, and many other sectors. McKinsey & Company is the largest strategic advisor in Poland, with nearly 800 experienced professionals, including 13 Polish partners, serving clients from its consulting office in Warsaw, the Polish Knowledge Centre in Wrocław and the EMEA Shared Services Centre in Poznań.
For more, visit www.mckinsey.pl

3
The Polish economy has been growing continuously for almost a quarter century now. That is a phenomenon of global proportions, comparable with China, India or Norway. Even the global crisis did not halt Poland’s growth trend, despite slowing it down substantially. Today, a return to economic growth at pre-crisis rates, combined with people’s expectations of even better living standards, higher wages, and improved public services, represents the next stage of the transformation process – one that will by no means be easy to realize.
5 opportunities for Poland is a McKinsey & Company report developed in cooperation with Forbes Poland. It presents the most pressing tasks facing Poland if the country is to achieve further growth. The report is based on our analyses and insights from surveys of ordinary citizens and business leaders. 5 opportunities for Poland further develops the ideas proposed in the McKinsey report Poland 2025: Europe’s new growth engine, published early this year.
For the purposes of our research, we asked 2,000 Polish citizens what improvements in their standard of living they expected to see and what they would be willing to do to achieve these improvements. We also asked around 300 chief executive officers of the largest Polish firms, owners of capital, and owners of the fastest-growing enterprises in Poland what they considered priorities for stimulating growth.
The good news is that annual GDP growth at above four percent is possible. But it will require bold decisions. Specifically, Poland needs to close the productivity gap between itself and the developed economies of the European Union and bring the management of state-controlled assets into line with market practice.
Today, Poland’s economy is competitive largely thanks to its low manufacturing costs. This needs to change. Faster adoption of new technology would raise the value added of products and services. Investment needs to grow by an average of 200 billion zlotys a year over the coming ten years. The lack of skilled workers will be a limiting factor unless the country opens up the labor market to immigrants and develops its vocational and technical education.
The work on this report was led by Michał Broniatowski, Editor-in-Chief of Forbes Poland, and Daniel Boniecki, Director at McKinsey & Company, together with a team consisting of McKinsey partners and consultants: Amadeusz Andrzejewski, Joanna Iszkowska, Wojciech Krok, Tomasz Marciniak, and Wiktor Namysł, with Grzegorz Cydejko, Senior Editor at Forbes.
We would like to take this opportunity to thank the McKinsey Global Institute and the McKinsey Directors Eric Labaye, Pål Erik Sjåtil, and Sven Smit for their inspiration and guidance.
We are also grateful for the contributions made by many of our colleagues, especially Dorota Machaj, and Jakub Urbaniak.
Preface

4
Contents
Introduction 5
5 opportunities for Poland 8
What do business leaders say? 8
1. Close the productivity gap: Raise the efficiency and value of Polish products and services 9
Introduction of market-based management practices to state-controlled companies 10
Fund managing state-owned companies 12
Improving position of Polish companies in the value chain 13
What do business leaders say? 14
2. Create additional investment projects and secure capital of up to 2 trillion Polish zlotys for their financing 16
What do business leaders say? 21
3. Increase innovation in the economy 22
What do business leaders say? 24
4. Reverse the negative demographic trend in the labor market 25
What do business leaders say? 27
5. Enable further growth of businesses and improve the level of public services 28
Ease of doing business 28
Better public services 29
What do business leaders say? 32
Conclusion 34
Endnotes 35

5
Introduction
Poland has achieved enormous economic success since the beginning of the transformation process more than 25 years ago. Real GDP has more than doubled,1 and Poland was the only country in the European Union to avoid recession during the financial crisis. Today Poland is the eighth-biggest economy in the EU in terms of real GDP and can look back with pride at two decades of uninterrupted growth.
Since setting off on its path of transformation, Poland has significantly closed the gap with Western Europe.2 In 1990, GDP per capita at purchasing power parity (PPP) was 66 percent lower than the average for the EU-15 countries; in 2014, it was just 37 percent lower (Exhibit 1). Yet that means Poles are still only halfway to achieving the standard of living enjoyed by their Western European peers.
EXHIBIT 1
Although Poland’s GDP per capital vs. rich EU countries shows it is still developing, its purchasing power is relatively high, and income inequality is near the EU-15 average
GDP per capita (USD, purchasing power parity PPP)
-37%
24,882
5 countries with lowestGDP per capita in EU
Poland
22,572
EU-153 39,333
46,8175 countries with highest GDP per capita in EU2
GDP per capita (USD)
12,623
14,423
65,955
41,927
Income inequality(Gini index,1 %)
34
31
30
24
1 Statistical measure of income concentration in a society, expressed as a value between 0% and 100%. The higher the value, the greater the income inequalityin the country2 European Union, excluding Luxembourg3 The EU-15 comprises Austria, Belgium, Denmark, Finland, France, Germany, Greece, Ireland, Italy, Luxembourg, the Netherlands, Portugal, Spain, Sweden, and the United Kingdom. These are the countries that constituted the European Union between 1995 and the expansion of 2004Note: Averages for 5 countries with highest and lowest GDP per capita in the EU and for the EU-15 states combined have been weighted by population sizeSOURCE: World Bank (GDP data for 2014); Eurostat (Gini index for 2013-14); McKinsey Global Institute; McKinsey analysis
Poland has the potential to join the ranks of highly developed countries. However, to do so, it will need to redefine its growth strategy and identify new sources of development. A question often asked in public debate is how today’s Poles assess the effects of the transformation and whether they are prepared to undertake further efforts. According to research by McKinsey Global Institute,3 the share of people unhappy about the situation in their country is in fact lower in Poland than in any of the seven other EU countries investigated (Exhibit 2).

6
EXHIBIT 2
Compared with other Europeans, Poles are among the most satisfied with their country
Level of satisfaction with their country (% of respondents, by country)
35
31
28
27
23
10
5
4
34
43
48
39
30
26
23
19
31
27
23
34
47
64
73
77Italy
Spain
Romania
Poland
United Kingdom
France
Sweden
Germany
Satisfied/very satisfied Neutral Dissatisfied/very dissatisfied
SOURCE: A window of opportunity for Europe: Detailed analysis, McKinsey Global Institute, 2015
The same research showed that Poles want to see changes that will enable them to catch up with their Western European peers in terms of living standards. The priorities for Poles are healthcare, security, education, and greater purchasing power. To achieve these goals, they are willing to work more effectively (Exhibit 3) and allow their salary increases to be linked to performance – an idea supported by 85 percent of respondents. In this respect, Poland stands out from the other countries surveyed, whose populations would prefer to see the necessary funds required for achieving their goals to be sourced mainly from cuts in social benefits.
EXHIBIT 3
In order to increase standards of living, Poles say they are prepared to substantially raise labor productivity but less willing to increase their working hours
Willingness to increase labor productivity (% increase in productivity)
2.9
4.4
4.6
8.4
10.6
11.8
11.9
4.6
France N/A1
Sweden
Italy
Germany
Poland
Romania
United Kingdom
Spain
Europe
Willingness to accept longer working hours (number of extra working hours per week)
0.5
1.1
1.3
1.6
2.0
2.0
2.5
2.7
1.8
France
Romania
United Kingdom
Germany
Spain
Europe
Sweden
Italy
Poland
1 The French were the only nation in the survey not prepared to raise productivity in order to increase spending on areas such as healthcare and educationSOURCE: A window of opportunity for Europe: Detailed analysis, McKinsey Global Institute, 2015

7
Today, Poles already work significantly longer hours than most Europeans.4 Despite that, according to the research, they are willing to work even harder – as long as they see an increase in purchasing power and improvements in the quality of public services.
To establish a starting point for further growth for Poland, we analyzed approximately 50 indicators for social and economic development. On this basis, we then established Poland’s position relative to the average of other EU countries, Norway, and Switzerland (Europe-30). Poland scores best among the Europe-30 countries on one of the 50 indicators, namely average GDP growth in 2008-2013.
To structure the 50 indicators, we grouped them into seven categories (Exhibit 4). It turned out that availability and deployment of capital, and innovation are major areas of improvement for the country. On “market”, “productivity and competitiveness” as well as “support for business”, Poland comes midway in the ranking.
In terms of productivity and competitiveness, Poland has managed to close the gap to some extent, mainly thanks to its dynamic GDP-per-capita growth based partly on low labor costs. However, if its cost advantage weakens and the country fails to exploit other growth engines, Poland may become slower in the process of catching up with Europe’s leading economies.
EXHIBIT 4
Poland’s gap to European averages is biggest for capitalization and innovation
1 Multiple standard deviation from average for Europe-30 countries2 Companies’ ability to compete in international market as indicated by size of exports, among others 3 Index of strength of labor market, based on employment rate, workforce participation of women, workforce participation of older people, etc.SOURCE: Eurostat; OECD; UN Educational, Scientific and Cultural Organization (UNESCO); UN Office on Drugs and Crime (UNODC); World Bank; WorldEconomic Forum (WEF); World Health Organization (WHO); Central Intelligence Agency (CIA); national statistical offices; McKinsey analysis
Comparison of condition of economies (normalized scores1 compared with average for 30 countries EU members, Switzerland, and Norway)
Countries ranked: 2nd
Innovativeness
Productivity andcompetitiveness
Capital
Market2
Labor3
Public services
Support for business
Conditionof economy
Institutionalsupport
Average
3rd
2.4Luxembourg
-1.0 Switzerland Belgium
3.0Ireland
-0.7 Luxembourg Switzerland
1.5Sweden
-1.4 Switzerland Finland
-1.4 1.6Norway
Sweden Switzerland
1.3Norway
-0.9 Luxembourg Sweden
0.7Netherlands
-0.7 Switzerland Luxembourg
3.0Denmark
-1.2 Norway United Kingdom

8
5 opportunities for Poland
How can Poland put itself among the front-runners in Europe? What would the government and policy makers need to focus on, to achieve long-term impact? Based on the country’s performance compared with the rest of Europe, our analyses and the insights from our survey of business leaders, which included the CEOs of Poland’s biggest firms, we have identified five opportunities for Poland:
1. Increase productivity across all sectors with special focus on four of them where the gap with Western Europe is biggest (mining, energy, agriculture, manufacturing), and improve the position of Polish firms in the value chain
2. Create additional investment projects and secure capital of up to 2 trillion Polish zlotys for their financing in the coming decade
3. Invest in innovations, entering a new phase of growth following the stage based on low costs
4. Counteract negative demographic trends in the labor market
5. Enable further growth of businesses and improve the level of public services
What do business leaders say?
According to Polish business leaders, raising productivity, supporting innovations, improving public services, and removing barriers to business are the key steps to ensure continued economic development. These are the results of the survey carried out by McKinsey and Forbes Poland in Q3 2015, which obtained responses from the CEOs of Poland’s biggest companies, the country’s largest investors, the top managers of fast-growing small and medium-sized enterprises (SMEs), and Polish firms recognized for their focus on innovations (Exhibit 5).5
EXHIBIT 5
What is the most important action that will ensure the Polish economy continues developing?
SOURCE: Survey of Polish business leaders, McKinsey/Forbes, Q3 2015
Improving productivity and competitiveness of economy
Increasing innovativeness in economy
Improving level of public services and limiting barriers to doing business
Securing sufficient capital for economic growth
Mitigating negative impact of demographic change on labor supply
Increasing openness of economy to competition and outside world
2.8
2.8
2.8
3.5
4.4
4.6
Average score on a scale of 1-6, where 6 = most important, 1 = least important
SURVEY OF BUSINESS LEADERS – RESULTS
The survey also revealed that the businesses are not overly concerned with the upcoming demographic challenge and do not feel under particular pressure to secure investment capital.

9
1. Close the productivity gap: Raise the efficiency and value of Polish products and services
Poland’s high growth rates in recent years have come partly on the back of its cost-effective and skilled labor force. As wages rise, however, this competitive advantage will shrink. Hence, to achieve further economic development, Poland would need to increase its levels of productivity based on higher value added and increased effectiveness.
Productivity is a measure of how well a country or organization uses its human and technical resources in the production of goods and the provisioning of services. The productivity of a country depends on how effectively it uses the resources at its disposal, such as raw materials, labor, skills, equipment, land, intellectual property, management capabilities, and capital.
Poland has made enormous progress in this area. Since joining the EU in 2004, the country has managed to close 27 percent of the productivity gap versus Western Europe. However, despite this progress, Poland’s comparative labor productivity remains low, at two-thirds of the average level in Western Europe – a difference that is also responsible for most of Poland’s gap in GDP compared with its Western European peers.6
McKinsey analysis shows that four sectors in particular – agriculture, manufacturing, mining, and energy – are responsible for 60 percent of the productivity gap between Poland and countries in Western Europe. Raising productivity in these sectors may require introducing improvements to regulations and procedures, or making difficult decisions during economic slowdowns, such as closing down unprofitable individual mining zones or even entire operations. Nonetheless, such steps might be essential, as underperforming businesses tie up human resources that otherwise could be employed in other, more effective sectors of the economy (Exhibit 6).
EXHIBIT 6
Four sectors of the economy account for 60% of the productivity gap between Poland and the EU-15 – the retail industry example shows that gap can be closed
Value added, 2011(EUR bn)
Theoretical increase in value added if EU-15 productivity level is achieved1
(EUR bn)
Gap to EU-15, 2011 (%)
40
19
10
20
46
19
15
69
38
Retail
Energy
Mining
Manufacturing
554Total2
Business services
Telecom and mail
Transportation
Construction
Agriculture
44
77
48
25
42
48
13
1 0
3
9
14
15
17
51
54
56
297
60%
40%2
1 Incremental value added in the sector, assuming employment level as in Poland and productivity level as in EU-152 Including public sector and financial institutionsSOURCE: Eurostat; McKinsey analysis
59
35

10
Introduction of market-based management practices to state-controlled companies
Sectors controlled by state ownership generate 20 percent of GDP in Poland. They include logistics (railroads, airports, postal services), mining, gas, energy, and the fuel industries (Exhibit 7).
EXHIBIT 7
State Treasury is dominant in strategically important sectors of Poland’s economy, such as energy, fuel, and transportation
1 2013 data2 Q3 2014 data3 Excluding cooperative banksSOURCE: Financial reports; Civil Aviation Authority; Energy Market Agency; Energy Regulatory Office; Office of Electronic Communications; Office of RailTransport; Rzeczpospolita TOP500 ranking; Emerging Markets Information Service database
Market share, strategic industries, 2014 (%) Share-calculation methodology
98
94
94
78
61
61
46
38
25
20
6
6
22
39
39
54
62
75
80Banking3
Insurance2
Fuel
Rail, freight transport
Energy1
Gas1
Mining
Postal services
Air transport
2Rail, passenger transport
Private companiesCompanies controlled by State Treasury
Revenue from black coal, lignite, and copper
Number of passengers transported
Revenue from natural gas
Terawatt-hours for generation, distribution, and sale of electrical energy
Weight of transported cargo
Revenue from postal services
Number of retail fuel outlets
Premiums for property and life insurance
Number of passengers in Polish airports
Deposit and loan balances in banks
Out of Poland’s 50 biggest companies, 17 (34 percent) are controlled by the state. That percentage is significantly higher than in most developed Western economies. Moreover, all six Polish firms that make it into the Forbes Global 2000 rankings are state controlled (Exhibit 8).
We shall not try to identify the correct ownership structure for Poland’s biggest companies here; rather, we would like to highlight the need for implementing management and governance practices that are in line with market standards.
State control does not necessarily restrict development, innovation, and business activity on a global scale. The list of Europe’s biggest global corporations contains many companies that are partly state owned. However, the success of these companies is built on effective management, which attracts capital as well as the best managers and workers.

11
EXHIBIT 8
Proportion of big, state-controlled companies is higher in Poland than in more advanced economies, however, lower than in developing countries
1 Share of private and state-owned companies in Poland calculated for the 50 largest companies based on the Rzeczpospolita TOP500 ranking2 Companies owned more than 50% by the government treasury; for Poland, companies controlled by the State TreasurySOURCE: 2011 Forbes Global 2000 ranking; State-Owned Enterprises, OECD, 2012; McKinsey analysis
Proportion of state-owned and private companies in Forbes Global 2000 ranking (%) Number of companies in Forbes Global 2000 ranking
100
99
99
92
90
86
81
80
61
47
40
66
8
10
14
19
20
39
53
60
34Poland1
Russia
China
India
Norway
Brazil
Switzerland
France
Turkey
Japan
1
United States 1
United Kingdom
State-owned enterprises2Private firms
260
543
93
63
10
43
37
10
23
57
117
6
Over the last 26 years of transformation, the management model deployed by the government in Poland has improved significantly. Yet appointments to management and supervisory boards are not always free from politically motivated pressure.
This high turnover rate does not encourage risk taking among key decision makers at state-owned enterprises. This, in turn, may contribute to the relatively low level of investment activity by Polish companies overseas, failure to exploit innovation potential, and the allocation of capital to projects with insufficient potential returns.
If we look at the world’s largest 3,000 companies based on total economic value created in years 2009-2013, among the top 250 value creating non-financial companies, there was only one Polish enterprise.7 One of the reasons for this, may be that Poland’s national industrial champions have reached the limits of growth within the domestic economy and have not achieved significant growth beyond Polish borders.
Analysis of the 80 largest listed Polish companies8 shows that the average spread of return on invested capital (ROIC) less weighted average cost of capital (WACC) is higher for private companies, at around 9.0 percent, than for companies controlled or influenced by the state, at around 3.5 percent (Exhibit 9). The larger the spread between ROIC and WACC, the higher economic profit a company generates – in other words, the more value it creates for its shareholders. Thus, large difference in spread between privately controlled and state-controlled or influenced enterprises can be another argument for implementing management
and governance practices that are in line with best-in-class private-market standards.

12
EXHIBIT 9
Poland’s state-influenced companies have a two to three times lower ROIC-WACC spread than privately controlled enterprises
1 Difference between return on invested capital (ROIC) and weighted average cost of capital (WACC).Analysis of top 80 Polish companies quoted on the Warsaw Stock Exchange (excluding financial institutions). Firms with insufficient data to calculateaccurate average profits for 2009-2013 excluded2 Company controlled or influenced by the State TreasurySOURCE: McKinsey Strategy Practice; McKinsey Corporate Performance Analytical Tool
ROIC-WACC spread1 (%)
3.5
8.9
State-influenced2
Privately controlled
Control Share of companies with positive and negativespreads (%)
78
50
22
50
Positive Negative
Given that Poles are willing to work more effectively, as seen in the aforementioned survey results, one option would be to strengthen the degree to which the compensation of managers and rank-and-file employees is linked to the results of their work. This could be done by setting ambitious but realistic long-term targets for at least three years ahead. If the targets are met, board members and staff could be rewarded in line with the increase in the value of the enterprise.
In accordance with global best practices, 35 to 40 percent of managers’ compensation could depend on the increase in enterprise value. Taking into account the scale and complexity of the largest Polish companies controlled by the state, the level of compensation, including any bonuses, can be in line with compensation levels in the private sector (for both Polish and foreign firms).
Fund managing state-owned companies
One way to improve efficiency at state-controlled enterprises would be to adopt a market-based models for managing state assets that have been tested elsewhere, such as in Scandinavia or Singapore.
The Scandinavian model is based on the idea of separating the management of state assets from political decisions. Investments by the state are managed in line with business best practices. In Sweden, for example, the national rail carrier has targets for return on equity (ROE) and debt-to-equity ratio that are at least on par with market standards. Likewise, in Norway, the government administration tasks specific commercial companies partly owned by the state with achieving an adequate level of returns. This target return rate is intended to promote operational efficiency.9
Singapore has adopted a model based on transferring state assets to a dedicated organization. Temasek Holdings, a wholly owned subsidiary of the Ministry of Finance, acts as an investment fund with a portfolio of companies in which the government has a stake. Temasek is run purely according to market practices, and its primary objective is to maximize the value of its businesses through balanced long-term growth.10 Executive salaries are on a par with those of the best-paid managers in the private sector and depend on the achievement of measurable financial and qualitative targets.

13
Regardless of which model Poland chooses in the future, the key would be to make the state supervision of companies more objective, focus on generating return on capital (state’s assets) on par with market level, and introduce performance based compensation. This is particularly important, as half of the state-controlled enterprises did not generate positive economic returns in the years 2009 to 2013 (as shown in Exhibit 9).
The first step in the desired direction would be to introduce objective criteria over appointments to management and supervisory boards of state-controlled enterprises. Doing so would enable these companies to follow a consistent path of long-term value growth for shareholders.
Improving position of Polish companies in the value chain
Moving Polish companies up the value chain requires a change of approach. Rather than trying to attract the simplest low-paid jobs to Poland, the country would be well advised to focus on attracting more advanced business activities that can generate more value added.
Today Poland is attractive to investors mainly due to its low labor costs and skilled workforce, including widespread knowledge of foreign languages among young people (Exhibit 10). But as the economy develops, labor costs will inevitably go up and Poland’s competitive advantage will diminish.
EXHIBIT 10
Polish labor market is characterized by skilled workers and low labor costs
SOURCE: Eurostat
16
17
20
22
22
23
27
27
30
34
34
35
36
39
Average 27
France
Netherlands
Slovakia
Spain
Italy
Hungary
Romania
Poland
Germany
Czech Republic
Portugal
Austria
Denmark
Sweden
Share of university graduates, 2014 (% of peopleaged 25-64)
Cost of labor, 2014 (EUR per hour)
40
37
35
34
32
31
28
21
13
10
9
8
7
5
Germany
Denmark
Austria
Average 22
France
Netherlands
Sweden
Italy
Spain
Portugal
Czech Republic
Poland
Hungary
Slovakia
Romania
Therefore, the country could follow more broadly the example set by sectors of the economy where Poland has been able to successfully move up the value chain. A good example is advanced business services: by the end of 2016, employment in this sector may grow by around 30 percent.11 Thanks to Poland’s cultural and geographical proximity to Western markets, along with its convenient time zone, language skills, and educated workforce, international corporations view Poland as a key potential location for their advanced services centers.

14
In the past, companies often chose Poland for their back-office services – relatively simple business processes such as accounting and payroll. Today companies are also choosing Poland for their “middle offices” – more advanced functions such as the departments in charge of valuation of investment funds units as well as global command centers for critical processes requiring 24/7 support.
Polish firms in other sectors should try to move up the value chain by stepping up investment in R&D, adopting new technologies, and investing in strengthening Polish brands. In terms of improving productivity in manufacturing, the focus should be on sectors with major growth potential, such as the automotive industry, furniture, chemicals, and advanced electric and electronic devices, as prime candidates (Exhibit 11).
EXHIBIT 11
In manufacturing, greatest potential to bridge productivity gap lies in automotive, furniture, textile, and apparel industries
1 Coefficient of productivity gain for sectors of Polish industry necessary to reach level of EU-152 Calculated as product of coefficient of potential productivity gain and gross value addedSOURCE: Eurostat; McKinsey analysis
-0.2
0
0.2
0.4
0.6
0.8
1.0
1.2
1.4
1.6
1.8
2.0
0 5 10
Coke and petroleum processing
Rubber and plasticsPrint and media
Metal productsRepair and installationof machinery/equipment
Video and television production
AutomotiveChemicals
Computers,electronics,and optical equipment
Furniture
Electronicdevices
Publishing
Textiles and apparel
Manufacturing industries in Poland by gross value added, taking into account productivity gap vs. EU-15
Coe
ffici
ent o
f pot
entia
l pro
duct
ivity
gai
n1
Value added (PPP), 2011 (EUR bn)
Scientific and technological advance
Growth and innovation drivers
Development of complex systems Economies of scale and efficiency
Market innovation
Size of potential gain2
Moreover, Poland’s armed-forces modernization program, worth approximately 130 billion zlotys by 2022,12 might give the country a unique chance to develop its aviation, defense, telecommunications, software-development, and electrical-engineering industries.
What do business leaders say?
In the survey, the business leaders pointed out that further improvements in productivity will depend mainly on the effective introduction of innovation in the area of products, processes, and organization. Some 92 percent of respondents considered this factor important or very important (Exhibit 12). Clearly top managers are aware
that the simple options for raising productivity in Poland have already been exhausted.

15
EXHIBIT 12
What would significantly improve your company’s productivity?
% of business leaders
Increased employee skills
Capital investment
53
36
24
39
38
30 54
74
92
Very important Important
Innovation (products, processes, organization)
SOURCE: Survey of Polish business leaders, McKinsey/Forbes, Q3 2015
SURVEY OF BUSINESS LEADERS – RESULTS
Interestingly, relatively few respondents (54 percent) considered capital investment a priority. We may assume that the problem of undercapitalization in the economy as a whole is not a major concern for individual companies, especially the larger ones, which currently operate in an environment of low interest rates, relatively cheap capital, and a high level of deposits.
When asked to identify the “important” and “very important” possible improvements in the management of fully or partially state-owned companies, 80 percent of the business leaders in the survey chose three of the solutions proposed (Exhibit 13). These are completing the privatization process, abolishing compensation caps for top managers and linking their compensation to market performance, and deregulating markets dominated by state-controlled companies. Closely ranked behind those three actions was support for a fourth solution: establishing a nonpolitical fund to manage state assets (selected by 70 percent of respondents).
The respondents assign particular importance to improving the management of state-controlled assets, indicating that this is a pressing issue for the Polish economy.
EXHIBIT 13
What further improvements in management of fully or partially state-owned companies in Poland would drive growth in their value?
SURVEY OF BUSINESS LEADERS – RESULTS
SOURCE: Survey of Polish business leaders, McKinsey/Forbes, Q3 2015
% of business leaders
44
35
24
44
36
45
56
29 73
80
80
80
ImportantVery important
Removing compensation caps for management boards and linking compensation to market performance
Deregulating markets dominated by State Treasury-controlled companies
Completing privatization process for largest enterprises
Establishing a nonpolitical fund to manage State Treasury assets and appoint members of their supervisory boards

16
For more than ten years, the Polish economy has enjoyed almost unlimited access to capital, given its requirements defined by investment portfolio. Poland has been one of the most popular destinations in the world for overseas investment (Exhibit 14) and has also received substantial injections of money from the EU’s structural funds.
EXHIBIT 14
Despite shrinking in 2012-2013, Poland has regained its ranking among countries with biggest share of net FDI in GDP (2.5%)
0
1
2
3
4
5
6
7
8
9
World
Slovakia
Net FDI inflow relative to GDP (% of GDP)
Turkey
11 20140605
Poland
13
Czech Republic
0807 12092004 10
SOURCE: World Bank; Polish Information and Foreign Investment Agency
This comfortable situation is set to change over the course of the next decade. To maintain its dynamic growth rate, Poland needs to strive to increase its share of investment in GDP from the present level of 20 percent to the level of other countries in the region – for example, 26 percent in the Czech Republic and Estonia, and 24 percent in Lithuania.
Investments stimulate demand and improve quality of infrastructure and technological advancement of enterprises. They are a key driver of country’s economic development. Our analysis indicates that up to an additional 140 billion Polish zlotys in investment will be required each year after 2015, and up to an additional 230 billion Polish zlotys per year after 2020 (Exhibit 15). In other words, in the period 2015–2025, Poland will need to secure up to 2 trillion Polish zlotys in additional capital to raise the current share of investment in GDP from 20 to 25 percent.
2. Create additional investment projects and secure capital of up to 2 trillion Polish zlotys for their financing

17
EXHIBIT 15
Poland needs up to additional PLN 140 billion a year in 2015-2020 and up to PLN 230 billiona year in 2020-2025 to ensure investment level required for long-term growth
1 Projections, assuming constant level of FDI and an increase of national funds in line with forecasted GDP growth (3-4% annually)2 IHS World Industry Service forecast (April 2015)3 Assumes share of investment in GDP at average level for Czech Republic in 2009-20144 Assumes that for 2004-2014, approximately 80% of transfers from European Union were allocated to investments, e.g., infrastructure.5 For 2004-2013, capital in transit is excluded from FDI in Poland. Due to lack of data, 2014 is not correctedA similar assumption was made for EU perspective for 2014-2020SOURCE: McKinsey analysis based on Central Statistical Office data; National Bank of Poland; GDP and investment growth forecastsby IHS World Industry Service (April 2015); data from the European Commission, Infrastructure and Development Ministry, and PolishInformation and Foreign Investment Agency
Annual investment balance by investment source and year (PLN bn annually, constant prices from 2014)
390-510
300
330-340
50
39
270-280
40
13
2015-2020P1
199
40
222
38
30-140
41
480-610
2020P-2025P1
110-230
2007-20142004-2006
145
2019
National funds (other)
FDI inflow5
EU funds inflow4
Additional capital needs based on assumed share of investment in GDP
212-263 212-263
Share of investmentin GDP (%)
It will be particularly important to maintain investment in infrastructure, as expanding the infrastructure will likely foster development of Polish cities, especially the smaller ones that find it more difficult to compete for investments.
Cities of more than 100,000 inhabitants with relatively high unemployment and low labor costs could become a magnet for investors. Among them are such cities as Radom, Koszalin, Tarnów, Wałbrzych, Białystok, Lublin, and Kielce (Exhibit 16). Some additionally constitute thriving academic centers where it is comparatively easy to find skilled workers. Economic success is attainable, as shown by Rzeszów, a medium-size city that is located close to the A4 national highway and boasts a busy airport and several institutions of higher education. A cluster known as “Aviation Valley” has grown up around Rzeszów and brings together approximately 90 percent of Polish aircraft production.

18
EXHIBIT 16
Rzeszów
Sosnowiec
Płock
Szczecin
Warsaw
RybnikRuda Śląska
Radom
Poznań
Olsztyn
LublinŁódź
Opole
Legnica
Cracow
Koszalin
Bydgoszcz
Białystok
Gdynia
Gliwice
Dąbrowa Górnicza
Kalisz
Elbląg
CzęstochowaKielce
Gdańsk
Chorzów
Katowice
Tarnów
Bytom
Bielsko-Biała
Wrocław
Włocławek
GorzówWielkopolski
Tychy
ToruńZielonaGóra
ZabrzeWałbrzych
Cities with above average levels of unemployment and below average salaries have the potential to attract investment
SOURCE: Central Statistical Office
Average monthly gross salary (PLN)
Biggest opportunityNumber of inhabitants Trend line
Une
mpl
oym
ent r
ate
(%)
0
2
4
6
8
10
12
14
16
18
20
22
3,200 3,400 3,600 3,800 4,000 4,200 4,400 4,600 4,800 5,000 5,200 5,400 5,600
Boosting investment is also essential due to the low level of capitalization of Polish firms (Exhibit 17),13 as well as the need to focus on development that is driven by technology and value added, rather than mostly by low production costs, as previously discussed. Unless Poland speeds up its rate of investment, it will not be able to close the fourfold difference with Western Europe in terms of the country’s capitalization.
EXHIBIT 17
To match current EU-15 levels, Poland would need a fourfold increase in its capitalization – approximately increasing by 50% its annual rate of investments to GDP over the next 25 years
1 Excluding construction and real estate industriesSOURCE: Eurostat; World Bank
Total capitalization per employee,1 2013(USD ths)
64
80
127
245
-74%
Poland
Hungary
Czech Republic
EU-15 combined
Gross fixed capital formation, average, 2009-2014 (% of GDP)
One-fourth of EU-15
19.8
20.6
26.2
19.7
+1%
Same as EU-15

19
Today, the biggest source of capital in Poland is deposits held by Polish households and businesses (Exhibit 18). These deposits currently contribute around 75 percent of the funds for investment. Their level relative to GDP (17.4 percent in 2012) is at a record high; however, it still remains lower than the average for Central and Eastern Europe (21.2 percent).14
EXHIBIT 18
Corporate and household deposits are at their highest level since 2005
SOURCE: National Bank of Poland
166
66
985
14
267
11
894797
243
58
223
86
971
144126
13
845
1210
720
605
599
132
498
554
06
208
09
227
659
519
08
139
225
07
482
136
435 151
183
Jun 2015
86
388
112
367
190205
2005
111
337426
105 137
624
110
OtherHouseholdsCompanies
10.1
10.8
9.0
10.4
Structure of deposits in Poland (PLN bn) Average annual growth,2005-Jun 2015 (%)
According to experts at the World Bank,15 reducing this gap will require a reform of current policy, which does not encourage enough private individuals to save. For example, the tax on capital gains is higher than the average for the Czech Republic, Slovakia, and Hungary. Another factor that might have even a stronger impact would be to create tax incentives for investments by companies.
Apart from domestic deposits, a second stream of investments can come from EU regional funds, which have been a significant source of capital in Poland. It is unlikely, however, that these funds will maintain their current level in the new EU perspective after 2020.
The third major source of capital in Poland, both now and in the past, is foreign direct investment (FDI). Over the last decade, FDI has provided around 15 percent of the money dedicated to investments.16 The problem here is that FDI fluctuates widely. In the short term, it depends on what businesses are currently available for privatization, while in the long term, it depends on the economic situation in the EU and the perceived attractiveness of Poland for investment. Given the signs of slowdown appearing in the economies of developing countries in summer 2015, securing such capital may be even harder and competition for it even fiercer in the future.
To date, investment in Poland has mainly stemmed from Western Europe, the source of as much as 98 percent of all the money invested in 2009-13 (Exhibit 19). In other words, Poland is failing to tap into two-thirds of the funds available worldwide, which come from Asia and North America. Hungary and Slovakia have shown that countries in the region are able to attract such funds, and Poland could potentially follow their example.

20
EXHIBIT 19
Poland mainly attracts European capital, while Turkey and other countries in CEE region attract global capital to a greater extent
1 Countries with which Poland often competed for foreign investments; for 2009-2013 in Poland; for 2009-2012 in other countriesSOURCE: UN Conference on Trade and Development (UNCTAD); Eurostat; National Bank of Poland
Average annual value of FDI and its structure in Poland and in selected CEEcountries1 (%)
98
94
91
89
85
79
72
54
3
7
15
23
2
2
4
4
10
7
6
2
43
3
2
1
1.5
6.4
Slovakia
Turkey 9.6
Hungary
Lithuania
1
3.2Romania
Poland 11.4
Czech Republic
Bulgaria
1
0.7
5.5
1
1
2.1
OtherEurope North AmericaAsia
Average annual FDI(USD bn)
Our analysis shows that to significantly increase the level of foreign investment Poland could focus on 4 key actions:
1. Effectively inform potential investors of the exceptionally favorable conditions for investment in Poland: the country’s fast growth rate, relatively low corruption level, highly skilled workforce, comparatively low factor costs, and past investments by global corporations and investment funds. This information would need to be targeted mainly at investors outside Europe, who may be less aware of the success of Polish economy than investors from the EU countries
2. Open up large infrastructure investments to foreign capital, including public-private partnerships that meet the criteria of scale used by the biggest funds in the United States, Canada, and the Middle East. The requirement of approximately 200 billion zlotys annually in additional investment calls for much more ambitious development plans and openness to new partnerships
3. Actively attract foreign capital through co-investment by major Polish financial institutions, such as BGK (the Polish development bank) and PIR (Polish Development Investments). This would reduce the level of risk for funds that may be investing in Poland for the first time. Co-investment can be an effective way to attract capital to emerging markets and allow for proactive selection of investment partners
4. Enhance the functioning of the Polish administration responsible for handling investments, so it can react effectively to the specific needs of investors. In particular, this body could coordinate actions of different government institutions and promote Poland and its investment portfolio. Another possibility for attracting capital is to partner with global financial institutions, rather than working mainly with local administrative bodies and carrying out economic diplomacy

21
What do business leaders say?
According to our survey, business leaders believe there is an additional key factor that would effectively boost investment: 90 percent of them said that stability of the regulatory environment would be an “important” or “very important” factor in encouraging their own firms to increase investment in Poland (Exhibit 20). This sends a clear signal to parliament and the government that long-term strategies are needed for the main branches of the economy. Such strategies would allow companies to assign more money to long-term investments. Stability of tax regulations and the infrastructure strategy would be particularly relevant.
EXHIBIT 20
What would encourage you to increase your own investment in Poland?
SOURCE: Survey of Polish business leaders, McKinsey/Forbes, Q3 2015
% of business leaders
Positive assessment of long-term investments by owners and investors, rather than an emphasis on short-term profits
Lower financing costs
A more stable regulatory environment, making projects more attractive
Significantly greater tax benefits and/or subsidies than at present
61
33
12
30
29
44
56
29
77
59
68
90
Very important Important
SURVEY OF BUSINESS LEADERS – RESULTS
The respondents point out that a more positive attitude toward long-term investments on the part of owners and investors also would increase overall investment level. Interestingly, the surveyed business leaders considered lower financing costs and greater tax breaks or subsidies to be less important. The biggest problem is evidently not access to financing, but the uncertainty regarding the regulatory environment’s stability and positive assessment of the long-term investment horizon.

22
3. Increase innovation in the economy
Spending on R&D in Poland since 2000 has varied between 0.7 and 0.9 percent of GDP. This compares with a spend increase from 1.8 percent to 2.0 percent on average in EU countries; the Czech Republic, for example, has seen an increase from 1.1 percent to 1.9 percent (Exhibit 21).
EXHIBIT 21
Polish R&D spending as a share of GDP and its growth rate are among the slowest in the EU
SOURCE: Eurostat; McKinsey analysis
0
0.5
1.0
1.5
2.0
2.5
3.0
Spain
08
Czech Republic
R&D spending (% of GDP)
Romania
Bulgaria
11
EU-28
France
United Kingdom
Hungary
12
Lithuania
Germany
201310
Poland
092000 0402 05 0703 0601
Change(percentage points)
0.45
-0.10
0.15
0.79
0.35
0.62
0.36
0.16
0.03
0.23
0.22
Polish businesses are slow to adopt new technology and do little to develop their own technology. On the positive side, some sectors have been able to almost close the gap to Western European countries in the area of innovation. For instance, the solutions employed in Polish retail and banking are close to the European standards or in some cases even go beyond them.
Innovation, especially the effective, rapid adoption of new technology, needs to become a pillar of our further economic growth. Today, the sectors, in which Poland already effectively competes on international markets, albeit primarily within the European Union, comprise above all manufacturing based on adapted technology and low costs. This segment represents around 11 percent of gross value added (compared with 2 percent for sectors based on advanced technology) and has been the engine of export expansion.17
South Korea is an interesting example of country-wide innovation development. In 2014, the South Korean government announced a three-year plan for economic development based on innovations. The plan includes increasing spending on R&D from approximately 4 percent of GDP to 5 percent.18 The plan assumes a return to a growth rate of 4 percent annually.
The South Korean strategy builds on three pillars:
1. Creation of centers of innovation in the 17 biggest cities in the country as platforms for cooperation between central government, regional governments, and the private sector

23
2. Establishment of a “technology bank” that seeks out unused patents, ideas, and know-how held by research institutions and firms and transfers these to entrepreneurs and start-ups willing to test their business potential
3. Increasing the funds available for start-ups to more than $600 million, along with the government working with global venture-capital companies to set up a special fund of almost $170 million
Another example of an ambitious and complex program of innovation is the German High-Tech Strategy 2020.19 This program involves actions along all steps of the innovation value chain—from research and development to the commercialization and dissemination of technologies. The German government has selected ten forward-looking projects for targeted support; the programs focus around the environment, quality of life, support for business, and solutions to key societal problems. One of the ten projects is Industry 4.0., which aims at increasing innovations in manufacturing.
In the area of research and development, German businesses will enjoy tax incentives for investments, and institutes of higher education will see a modernization of their research approach. The entire system will become more focused on international cooperation. Importantly, the planned initiatives involve the two main sources of innovation: public institutions and business.
In the area of commercialization, the German plan involves clarifying intellectual-property law, streamlining legal procedures for start-ups to accelerate the transition to production, and significantly reducing bureaucracy, including simplifying more than 330 regulations.
In the area of dissemination, the plan is to support standardization of solutions so as to enable a rapid increase in their application, and to foster the implementation of new technology in procurement processes at public institutions.
The differences in the models of support for innovation in Germany and Poland are evident in the structure of spending on R&D. In Poland, businesses account for a smaller share of total spending on R&D – 44 percent, compared with 67 percent in Germany and 63 percent on average in the EU (Exhibit 22).
EXHIBIT 22
R&D spending in Poland is low in private companies, too
Structure of R&D spending, 2013(%)
R&D spending as % of GDP
15
18
19
27
18
27
28
29
67
23
54
53
44
12 63
Poland
13.0
3.4
Spain
Czech Republic 3.0
EU-28 271.61
Germany 80.2
Private NGOs1 State institutions Higher education Private companies
0.4
0.7
1.0
1.3
1.9
-80%
1/4 of spending in Germany
1 Nongovernmental organizationsSOURCE: Eurostat; McKinsey analysis
R&D spending (EUR bn)
Public institutions generally concentrate on financing basic research and are less interested in financing commercialization or the optimization of expensive solutions. This role is usually performed by the companies they cooperate with, which in the case of Poland occurs to a lesser extent.
24
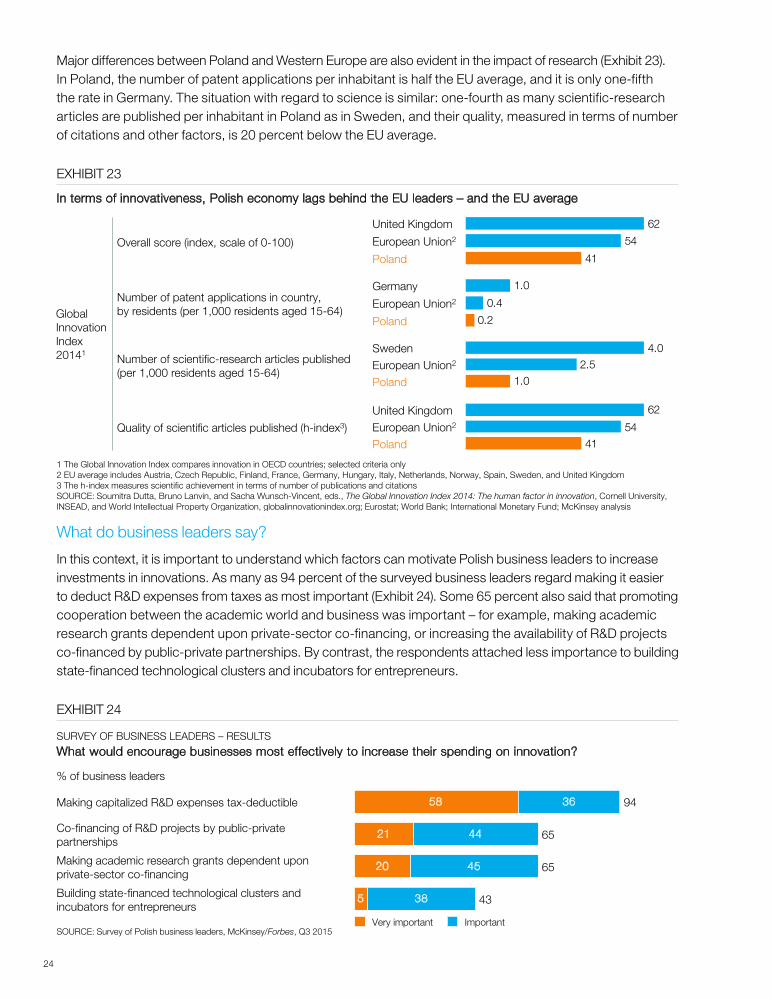
Major differences between Poland and Western Europe are also evident in the impact of research (Exhibit 23). In Poland, the number of patent applications per inhabitant is half the EU average, and it is only one-fifth the rate in Germany. The situation with regard to science is similar: one-fourth as many scientific-research articles are published per inhabitant in Poland as in Sweden, and their quality, measured in terms of number of citations and other factors, is 20 percent below the EU average.
EXHIBIT 23
In terms of innovativeness, Polish economy lags behind the EU leaders – and the EU average
1 The Global Innovation Index compares innovation in OECD countries; selected criteria only2 EU average includes Austria, Czech Republic, Finland, France, Germany, Hungary, Italy, Netherlands, Norway, Spain, Sweden, and United Kingdom3 The h-index measures scientific achievement in terms of number of publications and citationsSOURCE: Soumitra Dutta, Bruno Lanvin, and Sacha Wunsch-Vincent, eds., The Global Innovation Index 2014: The human factor in innovation, Cornell University,INSEAD, and World Intellectual Property Organization, globalinnovationindex.org; Eurostat; World Bank; International Monetary Fund; McKinsey analysis
GlobalInnovationIndex20141
Overall score (index, scale of 0-100)
Number of patent applications in country, by residents (per 1,000 residents aged 15-64)
Number of scientific-research articles published (per 1,000 residents aged 15-64)
Quality of scientific articles published (h-index3)
41
54
62
Poland
European Union2
United Kingdom
0.2
0.4
1.0
Poland
Germany
European Union2
1.02.5
4.0
Poland European Union2
Sweden
4154
62
Poland European Union2
United Kingdom
What do business leaders say?
In this context, it is important to understand which factors can motivate Polish business leaders to increase investments in innovations. As many as 94 percent of the surveyed business leaders regard making it easier to deduct R&D expenses from taxes as most important (Exhibit 24). Some 65 percent also said that promoting cooperation between the academic world and business was important – for example, making academic research grants dependent upon private-sector co-financing, or increasing the availability of R&D projects co-financed by public-private partnerships. By contrast, the respondents attached less importance to building state-financed technological clusters and incubators for entrepreneurs.
EXHIBIT 24
What would encourage businesses most effectively to increase their spending on innovation?
SOURCE: Survey of Polish business leaders, McKinsey/Forbes, Q3 2015
% of business leaders
Co-financing of R&D projects by public-private partnerships
Making academic research grants dependent upon private-sector co-financing
Making capitalized R&D expenses tax-deductible
Building state-financed technological clusters and incubators for entrepreneurs
58
21
20
5
36
44
45
38
94
65
43
65
ImportantVery important
SURVEY OF BUSINESS LEADERS – RESULTS

25
4. Reverse the negative demographic trend in the labor market
As in many other European countries, Poland will have to deal with sizable demographic challenges in the coming years. Three negative trends in particular will lead to a shrinking of the workforce. This process, combined with Poland’s productivity gap with Western Europe, will weaken the economy on a scale unseen since the beginning of the transformation.
In the first place, the labor supply will decline. The size of the population in Poland aged 15-59 may fall significantly – by as much as 2.7 million by 2025, according to McKinsey analysis. This would lower the ratio of people of prime working age to the total population to approximately 59 percent, compared with 65 percent in the EU-15 (Exhibit 25).
EXHIBIT 25
Poland’s working-age population (aged 15-59) is expected to shrink by 2.7 million by 2025
SOURCE: Central Statistical Office 2002 and 2011 censuses, Central Statistical Office forecast adjusted for consistency with census data; McKinsey analysis
7.3 5.8 5.8
6.55.0 3.8
16.517.3
16.5
3.02.3
6.4 7.59.6
1.6
38.3
2000 2025 estimate
15-24
38.038.6
55-59
2012
<15
>60
25-54
Polish population (mln inhabitants) Change (mln)
+2.1
-0.8
-1.2
-0.7
-0.6
Second, the labor-force participation rate in Poland for people aged 15-64 is 68 percent, compared with 73 percent in the EU-15.20 This considerable difference is mainly due to lower participation rates for women, seniors (aged 55-64), and young people (aged 15-24). Lower participation rates in society by people of working age translates into increased pressure and a greater burden on working people if pension and benefit levels are to be maintained. Moreover, the imbalance on the labor market is set to grow further due to the low birth rate and increasing life expectancy – demographic phenomena typical of developed economies in the 21st century.
The third cause for concern regarding demographic change is the fact that Poland is experiencing negative net migration. Around 2.2 million Poles are currently living abroad.21
These three phenomena result in a reduction in Poland’s production capacity, hampering the potential for growth. That is why it is so important to take steps to counteract them. According to McKinsey analysis, efforts to increase labor-force participation among selected demographic groups and targetted migration
programs could bring an additional 2.4 million people into the Polish workforce by 2025 (Exhibit 26).

26
EXHIBIT 26
Increase rate of labor-market participation by women, young people, and seniors
Poland could counter negative demographic trends with levers that have been successful in other EU countries, potentially gaining additional 2.4 million economically active people by 2025
1 Gap between Poland and Sweden (top country in this category) is 8 percentage points; assumes 50% closure of the gap2 Gap between Poland and EU-15 is 14 percentage points; assumes complete closure of the gap3 Gap between EU-15 and Poland for 55-59 age group is 14 percentage points; assumes complete closure of the gap. Also assumes 7-percentage-point growthfor 60-64 age group, vs. 50% growth for 55-59 age group4 Hartz reforms were a comprehensive reform of the German labor market, including long-term training, salary subsidies, and subsidies for business starters5 Assumes number of immigrants settling in Poland is twice the level of foreigners working in the country6 Assumes 16% of the 2.5 million Poles living abroad return to PolandSOURCE: OECD; Social Insurance Institution; Ministry of Finance; Economic and Financial Affairs Council; Working Group on Ageing Population and Sustainabilitywithin Economic Policy Committee; Eurostat; McKinsey analysis
0.4
0.4
0.3
0.5
0.5
0.3
Immigration5
17.3
Seniors3
Returnees from abroad6
Unemployment reform4
Young people2
Theoretical maximum potential,2025
Women1
14.92025 base
1.3
0.3
0.8
Number of working people in Poland (mln)
Reduce unemployment by means of Hartz-like reforms
Create favorable conditions for Poles to return from abroad and a carefully designed immigration scheme
Act
ivat
ion
Under the current model, the retirement age in Poland in 2025 will be 67 for men and 63 for women (with the ultimate target retirement age for women being reached in 2040). This increase will boost the base level of the workforce by around 400,000 people. Other initiatives aimed at bringing more women, young people, and seniors into the labor market could expand the workforce by an additional 1.3 million. The key to increasing labor-force participation will be access to flexible forms of employment, such as part-time contracts for people engaged in education or child care. Currently, only 8 percent of employees work part-time in Poland, compared with 28 percent in Germany and 38 percent in Switzerland.22
Young people. The Polish system of education is not well aligned to the needs of the economy, as reflected in the unemployment rate of 24 percent for people under 25. According to the Study of Human Capital in Poland conducted by the Polish Agency for Enterprise Development, in 2014 some 80 percent of employers had difficulty finding suitable workers. To close the gap between employers’ requirements and candidates’ skills, Poland will need to introduce a system of vocational training based on the actual needs of employers, taking into account economic forecasts. This could mean creating education programs focused on the specific skills required by people working in industry or business-process outsourcing (BPO), for example.
Women. Polish women are much less active in the labor market than, for instance, their Swedish counterparts, known for a very high employment rate. For example, in the 55-64 age group, 35 percent of Polish women work (in Sweden, 75 percent).23 One key area where much has been done is the availability of child-care services. Making such services even more accessible, combined with increased opportunities for part-time work, could boost the number of women in the workforce by as many as 300,000.

27
Seniors. Labor-force participation by seniors in Poland will grow over time, due to the gradual increase in the retirement age – that is, unless the trend is reversed as a result of political decisions. Flexible forms of employment and part-time contracts would enable a further increase in labor-force participation by older workers. Potential steps for the government could include the following:
• Withholding early-retirement options (where this does not affect the workers’ safety) or introducing financial incentives for working longer
• Improving the healthcare system, which would boost life expectancy and the health of older people, thereby increasing the number of people who remain in the workforce
Immigrants. Currently, Poland is not considered an attractive labor market for immigrants. In the Global Competitiveness Index published by the World Economic Forum, Poland ranked 124th out of 144 countries with regard to its ability to attract talented workers from overseas.
One option for Poland would be to adopt a carefully designed immigration policy encouraging workers with specific skills to settle in Poland, at the same time attracting cheap labor to perform simple jobs.
What do business leaders say?
Among the surveyed business leaders, 92 percent said that developing vocational training is “very important” or “important” for increasing labor-force participation in Poland (Exhibit 27). Some 74 percent of the respondents also said it is important to increase workforce participation by women and seniors, the two groups that according to our analysis have the greatest potential for improvement in labor market participation relative to the EU. Once again, the survey showed that tax benefits – in this case, for “re-emigrants” – were the least popular solution among business leaders.
EXHIBIT 27
What programs are needed in Poland to increase workforce participation?
SOURCE: Survey of Polish business leaders, McKinsey/Forbes, Q3 2015
% of business leaders
24
17 39
3359
33
32
24
35
50
57
67
56
92
74
Very important Important
A program aimed at increasing workforce participation by women and older people
Extension of active working life (retirement age, limited pension privileges)
Development of vocational training
A carefully designed immigration scheme for selected professional groups from selected countries
Temporary tax benefits for employing Poles returning from abroad (e.g., those who have worked abroad for at least 2 years)
SURVEY OF BUSINESS LEADERS – RESULTS

28
Ease of doing business
Over the past five years, Poland has moved up by 40 places in the World Bank’s “Doing Business” ranking. It now ranks 32nd of the 189 countries included in the index. Poland performs particularly well in areas such as getting credit, ease of starting a business, protection for minority investors, and its low level of corruption.
This is a significant improvement – but it’s not enough, say the business leaders. Respondents point to further improvement in the conditions for doing business as one of the three priorities for Poland. According to the survey, simplifying the tax system, making it easier to obtain permits, and improving the justice system would particularly improve the situation in the country.
Simplify the tax system. The tax burden on Polish firms is no greater than that in other developed countries. In fact, the CIT rates and the “tax wedge” (total taxation of labor) are lower than the EU average, while the basic VAT rate of 23 percent is only slightly above the average of 21.6 percent for the EU-28 (Exhibit 28).24
EXHIBIT 28
56
28
43
36
Ireland(EU minimum)
Czech Republic
Belgium(EU maximum)
Poland
27
18
21
23
Hungary(EU maximum)
Poland
Malta(EU minimum)
Czech Republic
35
10
19
19Poland
Malta(EU maximum)
Bulgaria(EU minimum)
CzechRepublic
The tax burden on Polish companies is roughly in line with the EU average
1 The “tax wedge” includes PIT and social security contributions paid by employee and employer. Estimate based on effective taxation of labor for a person withno family, earning an average salarySOURCE: Eurostat; Tax Foundation; Doing business 2015: Going beyond efficiency, World Bank, 2014, doingbusiness.org; EU member states’ websites; OECD
CIT rate, 2014 (%) VAT rate, 2014 (%) Taxation of labor,1 2014 (%)
Average EU-2822%
Average EU-2822%
Average OECD36%
The biggest challenge for Polish firms is thus not the level of taxation but the complexity of the tax system. Polish firms spend an average of 285 hours each year dealing with tax-related procedures, compared, for instance, with just 80 hours in Ireland.25 According to the Polish Association of Employers and Entrepreneurs (ZPP), Polish VAT laws have already been amended some 500 times.26 The Polish tax system needs to be simplified. It would be worth ensuring its stability and guaranteeing interpretation of unclear regulations in favor of the taxpayer – the latter is key for estimating the cost of risks associated with doing business in Poland.
5. Enable further growth of businesses and improve the level of public services

29
Improve the justice system. The length of judicial proceedings and the number of procedures involved represent a fundamental challenge for the Polish justice system. In Poland, it takes on average 685 days for commercial disputes to be settled, compared with just 300 days in Lithuania, which is at the top of the OECD ranking for this criterion (Exhibit 29).27 The slowness of Polish courts is thus not due to a lack of human or financial resources. Poland spends 0.5 percent of GDP on its courts, compared with 0.3 percent on average in the “old” EU countries.28 The country has 26 judges per 100,000 inhabitants, compared with an average of 21 in the EU.29
EXHIBIT 29
A key area of support for business in Poland is improving the effectiveness of the courts, including faster processing of cases
Effectiveness
1 World Bank index based on a series of indicators, including method of enforcing court decisions, length of court proceedings2 Europe-30 average: European Union, Switzerland, NorwaySOURCE: Doing Business 2015; World Bank; EU Justice Scoreboard, European Commission, europa.eu
Trust
Cost
Lowestscore
Highestscore
Rule of law, 2013(index of confidence in the police and rule of law, incl. enforcement of contracts, property rights, etc.)1
2.4 NO: 4.5EU2: 3.7 PL: 3.3
Number of judges, 2013(number of judges per 100,000 inhabitants)
3 SI: 46PL: 26EU28: 21
Length of judicial proceedings, 2014(length of proceedings from filing a lawsuit in a commercial dispute to payment of compensation)
1,580 LT: 300OECD:539
PL: 685
Number of procedures, 2014(average number of procedures involved in enforcing a contract in court)
43 IE: 21OECD: 31PL: 33
Cost of litigation, 2014(cost of proceeding – court fees, attorneys’ fees – as % of contested amount in commercial dispute)
40% LU: 10%OECD: 21% PL: 19%
State of Polish justice system
Polish courts have low efficiency. Despite a bigger budget and more judges than in Western European countries, Poland performs significantly worse on indexes for the effectiveness of the justice system. The main challenge here is to improve the speed of judicial proceedings. This in turn would boost the public’s trust in the rule of law, which is lower in Poland than on average in Europe.30 Lack of effective oversight of the speed of investigations by the public prosecutors and resolving court cases means that businesses regularly wait three to five years for a final judgment.
Better public services
Poland today spends 42 percent of GDP on public services – approximately on par with other countries
in the region (Exhibit 30).

30
EXHIBIT 30
30
35
40
45
50
55
60
32 3414 2012 22 2416 261810 3028
France
United Kingdom
SlovakiaPoland
Hungary
Sweden
Netherlands
Italy
Lithuania
Finland
Austria
Slovenia
LatviaRomania
Portugal
Malta
Croatia
Greece
Estonia
Czech Republic
Bulgaria
Belgium
Ireland
Spain
Denmark
GermanyNew EU
Advancedeconomies
Ratio of public spending to GDP in Poland is in line with economies with comparable GDP per capita
Pub
lic s
pend
ing
as %
of G
DP,
201
3
GDP per capita, 2013 (EUR ths, PPP)SOURCE: Eurostat
Based on the trends seen in Western Europe, it is fair to assume that as GDP grows in Poland, the proportion of funds dedicated to public services will also increase. If the sector is to meet the growing needs of Polish citizens and provide necessary support for the continued expansion of Polish enterprises, it requires significant reforms such as efficiency improvements, increased customer orientation, performance management, automation, and digitalization.
Pension levels and social privileges. Poland spends around 9 percent of GDP on pensions, compared with 11 percent in Western Europe.31 As the population ages, the burden placed on the budget from the “intergenerational contract” – the basis for the country’s pension system – will become heavier. The solution to this problem as of September 2015 assumes increasing the retirement age by an average of 1.4 years for men by 2020 and 6.4 years for women by 2040.32 Looking at the demographic trends, an even higher retirement age will likely be needed within the next 10 or 20 years. Some countries such as Italy are already introducing legislation under which the retirement age goes up automatically in line with life expectancy. Moreover, if we look at all EU member states, as many as 20 countries plan to increase the statutory retirement age for men and women. Furthermore, 11 states consider increasing the retirement age to at least 67 years for both men and women, and Greece has already introduced such initiative.
Raising the retirement age and sticking to the ultimate target age of 67, as in the current model, would help Poland reduce the ratio of people drawing a pension to those paying into the system. For this reason, any potential changes to the retirement age in Poland – particularly if they involve lowering it – should be made only after extensive analysis and with full clarity about expected costs of such actions.
In line with European Commission recommendations, an important step toward raising the efficiency of the pension system in Poland might be withholding pension privileges for selected professions – in particular

31
in agriculture and mining. The privileges enjoyed by these professions and others not only place a direct burden on the state budget, but also restrict professional mobility and create hidden unemployment. This is particularly relevant in agriculture, where more than 11 percent of the Polish workforce is employed – twice the EU average – although the sector only contributes around 3 percent to GDP.
Healthcare. Spending on healthcare in Poland is on par with other countries in Central and Eastern Europe. However, the private sector contributes a substantial part of the burden in Poland (30 percent per capita, compared with just 17 percent in the neighboring Czech Republic, for instance).33 According to the European Health Consumer Index, the Polish healthcare sector is one of the worst in Europe (Exhibit 31). The key problems involve long waiting times for treatment and low effectiveness. One of its strengths, in contrast, is cardiac care.
EXHIBIT 31
Euro Health Consumer Index (EHCI) ranks quality of Poland’s healthcare system among the lowest in Europe
400
450
500
550
600
650
700
750
800
850
900
0 500 1,000 1,500 2,000 2,500 3,000 3,500 4,000 4,500 5,000 5,500 6,000 6,500
Slovenia
Albania
United Kingdom
Croatia
Switzerland
Romania
Lithuania
Germany
NetherlandsEstonia
Poland
Hungary
Denmark
France
Macedonia
Czech Republic
Latvia
Slovakia
Bulgaria
Qua
lity
of h
ealth
care
, 201
4 (E
HC
Ipoi
nts1
)
Size of populationPublic and private spending on healthcare per capita, 2013 (USD PPP)
1 In the EHCI methodology, European healthcare systems are evaluated on the basis of 38 indicators across 6 categories: (1) patient rightsand information, (2) accessibility (waiting time for treatment), (3) outcomes, (4) range and reach of services, (5) prevention, and (6) pharmaceuticalsSOURCE: WHO; EHCI 2014; World Bank; McKinsey analysis
Low spend effectiveness in healthcare is another issue. Compared with similar countries, Poland could achieve an improvement of 30 to 50 percent in this respect, which would bring it up to the level of Estonia, Croatia, or Latvia.34
Education. Poland spends 5.3 percent of GDP on education, 10 percent more than the Western European average.35 The country performs well on PISA tests,36 and a high proportion of people have higher education (Exhibit 32). Despite these obvious successes, the Polish education system faces the challenge of aligning itself with the needs of the economy.
In recent years, innovative technologies have changed the face of many industries. Consequently, workers need to constantly learn new skills. The Polish education system, including its vocational schools, should teach students soft skills and flexibility with regard to the labor market, along with a “lifelong learning” mentality. Greater openness on the part of higher-education institutions to dialogue with the private sector
also is key.

32
EXHIBIT 32
The Polish education system is not effective enough at educating young people according to the needs of the economy
Europe-30 average: European Union, Norway, Switzerland
Lowestscore
Fit with economy
Theory
Highestscore
State of education system
1 Composite index developed by World Economic Forum. Scale of 1 to 7, where 7 is maximum2 Scale of 0-1,000 points. Scores are scaled so that the OECD average in each domain (mathematics, reading and science) is 500 and the standard deviation is 100SOURCE: https://nces.ed.gov/pubs2014/2014024_tables.pdf, Eurostat; McKinsey Global Institute analysis
Competitiveness,1 2014(degree to which the education system meets needs of economy)
2.8 EU: 4.3PL: 3.6 CH: 6
Youth unemployment, 2014(unemployment rate for people under 25, %)
53% EU-28: 22%PL: 24% DE: 8%
Average PISA score,2 2012(points on a math, reading, and science test for schoolchildren)
440 EU: 498 PL: 521 FI: 529
Skills match, 2013(index of adequacy of level of education of labor force)
1.3 EU: 0.97 NO: 0.6PL: 1.05
Higher education, 2012(% of people aged 30-34 with higher education)
22% EU: 37% PL: 41% IE: 53%
What do business leaders say?
The surveyed business leaders believe that public services require significant reform. A striking 97 percent said speeding up and simplifying administrative procedures is “important” or “very important” (Exhibit 33). More than 85 percent also agreed that it is important to stop “lowest price” from being the main criterion in public tenders, to link the compensation of public servants to their performance, and to speed up the settlement of financial disputes by the courts.
EXHIBIT 33
What improvements in public services would best support faster economic growth in Poland?
SOURCE: Survey of Polish business leaders, McKinsey/Forbes, Q3 2015
% of business leaders
Stopping “lowest price” being the main criterion in public tenders
Linking compensation of public servants to their performance
Speeding up and simplifying administrative procedures
Faster settlement of financial disputes by courts
77
52
61
58
20
38
27
29
88
90
97
87
ImportantVery important
SURVEY OF BUSINESS LEADERS – RESULTS

33
97 percent of respondents stated that simplifying the tax system and reducing the time taken for administrative decisions were key factors in further developing business in Poland (Exhibit 34). Interestingly, the respondents were much less convinced of the importance of reducing tax rates.
EXHIBIT 34
What action would best support further business development in Poland?
SOURCE: Survey of Polish business leaders, McKinsey/Forbes, Q3 2015
% of business leaders
76
67
39
35
32
21
29
38
33
30 62
68
96
77
97
ImportantVery important
Reducing time taken for administrative decisions
Wider availability of flexible forms of employment
Simplifying tax system
Reducing tax rates (e.g., VAT, CIT)
Broader deregulation of professions
SURVEY OF BUSINESS LEADERS – RESULTS

34
Poland can be proud of its last 25 years of economic transformation. Thanks to the enormous efforts made by country it has doubled its GDP and transformed itself into a model of economic growth for the rest of the world.
Yet the country is still only halfway along the road to complete success: the goal of catching up with the most advanced economies in Europe. Per capita GDP at purchasing power parity (PPP) is 36 percent lower than the EU-15 average, and Poles want to achieve the standards of living seen in Western European. The people are willing continue along the path of change – but they need a new game plan that identifies new growth engines for the economy and strategies for overcoming the challenges of the coming decade.
Poland can aspire to more than 4 percent GDP growth annually, reaching a higher level of per capita GDP (PPP) than countries such as Italy and Portugal. However, this will require difficult decisions and more efforts by politicians, entrepreneurs, academics, opinion leaders, and above all ordinary Polish citizens.
In this report we present five key areas to be addressed. They include increasing investment levels to strengthen demand-side stimulus, attracting more capital from new types of investors and markets, narrowing the productivity gap, and boosting value-creation by state-owned enterprises. Demographics call for immediate action as shrinkage of the labor market is a key threat for future growth. At the same time, accommodating the expectations of business leaders for tax reform in respect of support for domestic innovation will be critical. And improving the quality of public services, especially those directly affecting entrepreneurship (e.g., the efficiency of the judicial system), will be fundamental to economic growth.
Most of these issues require action as early as 2016. The public debate around appropriate solutions should start today. Poles stand before a historical opportunity and face decisions that will impact the standard of living and welfare of generations to come.
Conclusion

35
Endnotes
1 Poland 2025: Europe’s new growth engine, McKinsey & Company, 2015
2 In this report, we use the term Western Europe to mean the old EU-15 (i.e., the EU member states in the years 1995-2004): Austria, Belgium, Denmark, Finland, France, Germany, Greece, Ireland, Italy, Luxembourg, the Netherlands, Portugal, Spain, Sweden, and the United Kingdom
3 A window of opportunity for Europe: Detailed analysis, McKinsey Global Institute, June 2015
4 2014 data from the Organisation for Economic Co-operation and Development (OECD)
5 The online questionnaire was administered to the CEOs of the 100 biggest firms in Poland (based on the top 500 Rzeczpospolita ranking for 2014), the Forbes 100 richest Poles in 2015, and the CEOs of innovative firms (based on the Rzeczpospolita 2014 ranking of innovative firms, Wprost’s 2014 list of innovators, the Red Herring Top 100 Europe, and the Deloitte Technology Fast 500 Europe, Middle East & Africa [EMEA] 2014), the CEOs of the small and medium-sized enterprises on the mWIG40 and sWIG80, the winners of the EY Entrepreneur of the Year for 2010-14, the Forbes Diamonds list, and the leaders of the main economic associations in Poland
6 Poland 2025: Europe’s new growth engine, McKinsey & Company, 2015
7 Analysis conducted for the top 3,000 companies by revenues in 2011. Firms with insufficient data to calculate accurate average profits for 2009-13 excluded from findings
8 Analysis conducted for the top 80 Polish companies quoted on Warsaw Stock Exchange. Financial sector and companies with insufficient data to calculate accurate average profits for 2009-13 excluded from findings. Total sample size: 61 companies
9 International Monetary Fund (IMF) and the Norwegian Ministry of Trade and Industry
10 Temasek Charter (www.temasek.com.sg)
11 Sektor Nowoczesnych Usług Biznesowych w Polsce 2015 (The modern business services sector in Poland 2015), Association of Business Service Leaders in Poland (ABSL), 2015
12 “MON chce przeznaczyć 130 mld zł na modernizację armii,” Forbes, April 30, 2015, http://www.forbes.pl/mon-chce-przeznaczyc-130-mld-zl-na-modernizacje-armii,artykuly,193908,1,1.html; Zbigniew Lentowicz, “Czas modernizacji armii i przemysłu,” Rzeczpospolita, April 19, 2015, http://www.ekonomia.rp.pl/artykul/1194910.html
13 According to 2013 data from Eurostat, net assets per employee were $64,000 in Poland – approximately four times below the EU-15 average
14 McKinsey analysis based on 2012 data from Eurostat
15 Oszczędzanie z myślą o przyszłości: Wspieranie rozwoju gospodarczego i wzrostu standardu życia w starzejącej się Polsce (Saving with a view to the future: Supporting economic development and growth in living standards in an aging Poland), World Bank, 2014
16 McKinsey analysis based on data from the Polish Central Bureau of Statistics, the National Bank of Poland, and the Polish Information and Foreign Investment Agency
17 Poland 2025: Europe’s new growth engine, McKinsey & Company, 2015
18 Jeon Han and Limb Jae-un, “President Park announces three-year plan for economic innovation,” Korea.net, February 27, 2014, www.korea.net/NewsFocus/Policies/view?articleId=117839
19 Bundesministerium für Bildung und Forschung (German Federal Ministry of Education and Research), “Die neue Hightech-Strategie” (The new high-tech strategy), hightech-strategie.de
20 Eurostat data for 2014
21 Polish Central Bureau of Statistics
22 Eurostat data for 2014
23 Eurostat data
24 Doing business 2015: Going beyond efficiency, World Bank, 2014, doingbusiness.org
25 Doing business 2015, World Bank, 2014
26 October 8, 2014, http://zpp.net.pl/aktualnosci/run,niech-sie-nie-da-pani-zmanipulowac,page,3,article,755.html
27 Doing Business 2015, World Bank. Data and position in the ranking for “enforcing contracts” based on a hypothetical dispute over a sales contract worth twice the size of the annual income per capita of the country in question
28 EU Justice Scorecard, European Commission
29 2013 data from Eurostat
30 “Rule of law” indicator published by the World Bank
31 2013 data from Eurostat
32 “Law of May 11, 2012 on changes to the law on pensions from the Social Security Fund and certain other laws”, Journal of Laws of 2012, Number 637
33 2013 data from the World Health Organization (WHO)
34 European Health Consumer Index
35 Eurostat data
36 Test measuring the math, reading, and science performance of schoolchildren; scores from 2012

© 2015, McKinsey & Company, Forbes Polskawww.mckinsey.pl, www.forbes.pl