Embed Size (px)
Citation preview
Operational performance improvement in industrial companies
Recognizing and exploiting cost reduction and improve-ment opportunities
By Dr. Markus Böttcher and Dr.-Ing. Klaus Neuhaus

Dr. Markus Böttcher is a partner in the Munich office of Bain & Company. He is a leader of the Performance Improvement practice in Europe. Dr.-Ing. Klaus Neuhaus is a partner in the Düsseldorf office of Bain & Company. He leads the Industrial Goods and Services practice in Germany and Switzerland.
Copyright © 2015 Bain & Company, Inc. All rights reserved.

Operational performance improvement in industrial companies
1
Introduction
Bain & Company has developed a state-of-the-art program
for operational performance improvement. Our program
applies 10 performance improvement levers without
losing sight of long-term company goals. Using Bain’s
Performance Improvement DiagnosticSM, also known as
the PI X-ray, a company’s efficiency can be screened both
accurately and quickly. This process identifies areas with
high optimization potential. It also develops and pri-
oritizes suitable improvement initiatives. Companies
can then focus on projects and initiatives that promise
genuine success.
Virtually every company is familiar with the broad chal-
lenge of improving work efficiency and streamlining
costs to boost profitability. By simplifying operational
procedures and focusing the product ranges, companies
can reduce complexity in specific areas and increase
revenue while reducing costs. Companies can also achieve
long-term structural improvements by, for example, opti-
mizing plant networks, inventory management and distri-
bution structures.
Regardless of their individual circum-stances, companies usually ask them-selves the same question: Where does the operational full potential lie along the value chain, and how do we achieve it?
Examining operational performance
Regardless of its financial situation, every company should
carry out an operational performance improvement
program every once in a while. However, the motivations
for conducting such a program vary substantially. Typical
reasons include urgency to achieve financial targets,
exhausted cost-reduction potentials, a challenging strate-
gic and competitive position, and evolving market conditions.
Bain assumes three different starting situations:
Expanding leadership positions
Successful market leaders work constantly to improve
a good cost structure. However, some market leaders
achieve a satisfactory profit margin but fail to fully exploit
their profitability potential. Bain refers to these companies
as “happy underperformers.”
Closing cost gaps
Next we find companies with a size handicap that pre-
vents them from realizing the same “leadership eco-
nomics” as the market leaders in their sector. The key is
to determine the extent to which the current profitability
and cost gap results from operational inefficiencies.
Operational restructuring
Companies experiencing stormy weather are often con-
fronted with drastic changes in market conditions. Es-
pecially in capital-intensive sectors, cyclical or structural
market weaknesses quickly lead to revenue losses and
dwindling profits. In this situation, companies must
optimize their operational business, usually under
time constraints.
The Performance Improvement X-ray
Regardless of their individual circumstances, companies
usually ask themselves the same question: Where does
the operational full potential lie along the value chain, and
how do we achieve it? Bain’s PI X-ray involves a thorough
screen of key performance dimensions, including procure-
ment, production, service, distribution and administra-
tion. The result is a dashboard of the most important
cost and improvement potentials across the entire com-
pany. The main areas of action can be defined, goals
determined and concrete measures planned.

2
Operational performance improvement in industrial companies
However, benchmarking has its limits. Benchmarks
indicate how good “good” really is, but they do not indi-
cate whether it’s possible to be better than just “good.”
Nor do they show companies how to achieve perfor-
mance improvements.
In addition to benchmarking, Bain draws on the func-
tional expertise of experienced specialists in different
fields as well as its own experience in best practices
across many industries.
Operational performance improvement potential
Bain’s X-ray is geared to 10 performance levers that have
proved valuable over many years (see Figure 1). These
levers are:
• Reducing procurement costs
• Optimizing production
• Optimizing distribution
The X-ray is based on a sound understanding of the four
critical parameters of operational improvement: cost,
market position, customer trends and complexity, which
is probably the most underestimated.
Complexity arises from several causes. Insufficient knowl-
edge of customer needs can create technical complexity
due to a needlessly broad range of products. On the
other hand, unclear responsibilities can create overly
complex processes and organizational structures.
Whatever the cause, Bain studies reveal that the least
complex companies grow 30% to 50% more quickly than
the peer average.
Benchmarks are good, but not good enough
Using the PI X-ray, Bain applies proprietary benchmarks
and databases as well as a variety of leading cross-sector
and sector-specific databases. The point of benchmarking
is to determine the targets for numerous Key Performance
Indicators (KPIs) that embrace all company functions.
Figure 1: Ten focused initiatives can improve profitability and cash flow quickly
Profit and loss
Revenues
Material cost
Other costof goods sold
Operatingexpenses
EBIT
Balance sheet
Inventories
Fixed assets
Accountsreceivable
Equity
Cash flow
EBIT+ Depreciation and amortization+/– Change working capital– Capex+/– Financing cash flowNet cash flow
• Reducing procurement costs• Optimizing production• Optimizing distribution• Optimizing after-sales service• Reducing overhead costs• Optimizing IT• Reducing product complexity• Reducing product costs
• Sales enhancement• Pricing optimization
Cash and capital optimization
• Reducing working capital• Optimizing capital expenditure
Liabilities
Accountspayable
Revenue improvement Cost reduction
Source: Bain & Company

Operational performance improvement in industrial companies
3
Key improvement levers
At practically every company, measures promising rapid
return on the capital employed can be identified at short
notice. But equally important are the levers to be applied
over the longer term, defined as three years or more.
Reducing procurement costs
Purchasing is a crucial area for industrial companies,
where material costs frequently account for 50% of rev-
enue or more. Industrial companies with whom we have
worked have saved an average of 8% to 12% of their mate-
rial procurement costs. This yields a 4% to 6% expansion
in the operating margin, or the difference between good
and bad profitability.
In general, three steps must be taken to identify potential
cost reductions in procurement:
• Optimizing after-sales service
• Reducing overhead costs
• Optimizing IT
• Reducing product complexity
• Reducing product costs
• Reducing working capital
• Optimizing capital expenditure
We apply different approaches to each lever (see Figure 2).
For example, benchmarking can help estimate potential
savings in overhead costs or working capital require-
ments. In contrast, it takes considerable functional exper-
tise to estimate potential improvements in procurement
or production efficiency.
Figure 2: Different initiatives require a different X-ray approach
Initiative Approach
• Reducing procurement costs
• Optimizing production
• Optimizing distribution
• Optimizing after-sales service
• Reducing overhead costs
• Optimizing IT
• Reducing product complexity
• Reducing product costs
• Reducing working capital
• Optimizing capital expenditureCash and capital optimization
Cost reduction
Expertise
Expertise
Expertise
Expertise
Benchmarking
Expertise
Analytics
Benchmarking
Benchmarking
Benchmarking
Source: Bain & Company

4
Operational performance improvement in industrial companies
Optimizing production
At many industrial companies production has not been
systematically optimized. Plant networks often have
evolved historically rather than as a result of strategic
planning. Optimizing production requires companies
to answer three fundamental questions:
• What do we want to produce ourselves, and what do
we want to purchase?
• What plant network do we require?
• How do we implement lean production at world-
class levels in all plants?
The entire diagnostic process can usually be completed within the space of a few weeks. The result is an integrated imple-mentation plan that addresses operational cost levers along with concrete organiza-tional, IT and procedural improvements.
To make or to buy
Industrial companies often maintain great vertical inte-
gration and attribute strategic importance to many of
their production processes. In these situations, companies
rarely leverage outsourcing opportunities to the full
extent. These opportunities include:
• Unit degression: Few manufacturers would consider
producing their own ball bearings, but many com-
panies still produce components that can be pur-
chased more efficiently from suppliers with scale
effects from larger production volumes.
• Creating transparency: This starts with creating
transparency on which products have been ordered
in which quantities for which plants—and from
which suppliers in which quantities and for which
prices. Companies must also reconcile all expen-
ditures with the profit-and-loss account to ensure
that all external spending is captured.
• Identifying savings opportunities: As soon as the
necessary transparency has been achieved, we work
with the responsible buyers to conduct a systematic
analysis of all procurement categories. Are all cost-
reduction levers being exploited? Such levers fall
under five main headings: demand control, price
negotiations, volume allocation, design-to-cost and
system cost reduction. The result is a list of concrete
improvement initiatives, including the estimated
cost reduction target and the milestones, responsi-
bilities and necessary implementation requirements.
We prioritize the list by potential and ease of imple-
mentation with regard to the implementation of
each initiative.
• Organizational optimization: In a parallel process,
Bain identifies organizational and procedural improve-
ment needs. Here we consider procurement organi-
zation, competencies, processes, tools and systems
as well as the incentive system. This work identifies
initiatives with the objective to improve the current
procurement organization to world-class level.
The entire diagnostic process can usually be completed
within the space of a few weeks. The result is an inte-
grated implementation plan that addresses operational
cost levers along with concrete organizational, IT and
procedural improvements. We then move to the imple-
mentation phase, which happens in several waves over
a period of 12 to 24 months.
Our clients typically achieve savings of 8% to 12% of their
entire procurement volume. In some categories, it is
possible to achieve savings of up to 40%. We also find
that our clients can achieve an annual procurement
productivity by an average of 2% to 4% per year after
conducting a comprehensive procurement program.

Operational performance improvement in industrial companies
5
Figure 3: Many producers give away cost reduction by engaging in-house resources in high-cost, non-core activities
LE-Case
LA-Case
GA-Case
GE-CaseVanes
Die rings
Diffusor
Caps
ShaftsShafts
Core competence (index)
100
75
50
25
0
30 20 10 0 –10 –20 –30%
Total cost difference vs. outsourcing
Oil pan
Separation wall
BushingsFlanges
Bases
Outsourcing potential
Source: Bain & Company
nents or operational steps in question to fill in the frame-
work (see Figure 3). The components and process
steps in the lower left quadrant are then typically out-
sourcing candidates.
This process usually yields outsourcing savings of 10%
to 20% of total production costs for the components and
products concerned.
Optimizing the plant network
Production costs are frequently too high because there
are too many plants, an excessively complex interplay
between plants or an abundance of labor-intensive pro-
cesses at high labor cost locations. These conditions often
arise after as a result of acquisitions, especially if the
issue of plant network optimization is not raised during
the integration phase.
Optimizing a plant network encompasses four elements:
consolidation, specialization, migration and expansion.
• Specialization advantages: Some components require
specific production processes. For example, a certain
manufacturing process might require noncritical
components with a specific surface treatment. In
such situations, specialized suppliers can generally
operate more cost-efficiently.
• Factor cost differences: It is often attractive for com-
panies to outsource to a suppliers in low-cost countries,
particularly for labor-intensive component production.
For example, this often pays off for production of
cable harnesses and castings.
To identify the outsourcing scope, manufacturers need
to calculate the true production costs for each component
or operational step in question and need to estimate the
outsourcing cost based on a quantification of the above
described levers. This results in an estimate of the poten-
tial savings through outsourcing. In addition, companies
must determine the strategic significance of the compo-

6
Operational performance improvement in industrial companies
for individual plant moves. Finally, we provide recom-
mendations for a medium- and long-term plant network
optimization program.
Cost reductions from plant network optimi-zation can range from 10% to as much as 30% of total production costs. Such pro-grams are especially worthwhile if a signif-icant migration to low labor cost countries appears worthwhile and is feasible.
In economically strong regions such as Europe, North
America and the developed Asian economies, the analy-
sis tends to show that only a few manufacturing sites
are required. Consider a German producer of industrial
equipment operating more than 70 plants worldwide.
The optimal development of a greenfield footprint revealed
that only about 15 plants were necessary. The implemented
brownfield footprint then allowed for 40 plants.
Cost reductions from plant network optimization gen-
erally can range from 10% to as much as 30% of total
production costs. Such programs are especially worth-
while if a significant migration to low labor cost countries
appears worthwhile and is feasible.
Lean production
Industrial companies often do not apply and manage
lean production systematically. In many plants, the 5S
principles are neglected and KPIs are not diligently
applied. Workflows are suboptimal and huge inven-
tories make it difficult to retain clear oversight of pro-
duction processes.
Achieving lean production at a single site is a laborious
task. Even more challenging is to realize lean production
• Consolidation: Companies can often realize signifi-
cant efficiencies by merging two or more under-
utilized sites involving the same production steps.
The economics tend to be far less attractive in cases
that involve merging two or more sites in the same
labor cost environment while carrying out extensive
new construction. For example, an electro-mechan-
ical components producer in Germany was consid-
ering a production-optimized “super site” that would
replace five existing sites. The company decided not
to proceed with this plan after Bain’s feasibility study
showed that the business case was weak.
• Specialization: In cases where all plants produce all
products, typically unit costs are higher compared with
a situation where each plant is specialized on certain
product lines with optimized processes and equip-
ment. A good example here is a manufacturer of
forklift trucks that produced all types of forklift trucks
at all of its plants. A clear specialization of plants on
product types allowed a significant reduction in
manufacturing costs.
• Migration: Industrial companies frequently display
a lack of consistency about migrating labor-intensive
processes to low labor cost countries. Nonetheless,
cost savings of 20% and more are possible, provided
that relocation costs do not spiral out of control.
• Expansion: By establishing new plants, industrial
companies can more effectively serve new markets
with specific demand profiles. The key is to achieve
closer proximity to customers as well as local service
units. Ideally, products customized to particular
markets should be developed locally and produced
with locally purchased components.
Bain addresses the optimization of a company’s plant
footprint in four steps. First, we conduct a detailed ex-
amination of the existing plant network. We then draft
a hypothetical optimal solution based on the assumption
of new plant construction (greenfield approach). Next
we consider options to come closer to the optimal solu-
tion while still allowing for acceptable payback periods

Operational performance improvement in industrial companies
7
• A procedure for formulating and monitoring im-
provement measures
• The deployment of a lean task force to support under-
performing plants
These measures need to be implemented directly on the
shop floor and equally on the overhead functions in pro-
duction (see Figure 4).
The examination routine should include a yearly assess-
ment that tracks each plant’s progress on its “Journey
to Lean.” Subsequent adjustments can be made to the
goals if required.
The KPIs are short-term management tools. They are
useful for planning concrete measures with plant man-
agers and for tracking whether measures have been
implemented and have led to success. In practice, it pays
at the highest performance level across a worldwide
plant network. We recommend a package of measures
with the following elements:
• An examination routine that determines the lean
status of each plant
• Clearly defined and comprehensibly formulated best
practices and processes
• Central administration for all documented Best Dem-
onstrated Practices, tools and operating procedures
• A set of KPIs to measure the operational perfor-
mance of each plant at short notice—in the categories
of safety, customer service, quality, cost and inventories
• A procedure for regular performance measurement
Figure 4: Bain’s approach to plant performance optimization examines 18 areas of improvement
• Personnel cost reduced by 15%–30%• Nonpersonnel cost reduced by 10–20%• Defects/yield loss reduced by 30%–50% • Lead time reduced by more than 50%• Service level gaps reduced by 30%–50%• Inventory reduced by up to 50%• Capex reduced by 10%–20%• Area reduced by up to 50%
Shop floor improvement (Lean direct production)
Improvement enablers
Plant layout/flowoptimizationCell/line processimprovement
Utilization/overall equipmentefficiency improvement
Logistics/inventoryoptimization
Wor
kfor
ce o
rgan
izat
ion/
FTE
right
-sizi
ng
Wor
kfor
ce o
rgan
izat
ion/
FTE
right
-sizi
ng
Yield/quality improvement
Overhead streamlining (Lean indirect production)
Production engineering/standards
Production planning andscheduling
Total quality managementTotal productivemaintenance
Lean administration/support functions
2.1
2.2
2.3
2.4
2.5
3.1
3.2
3.3
3.4
3.5
2.6 3.6
Performance management, routines, leadership
5S KPIs/visualization
CIP/Kaizen
Six Sigma Team
Skillbuilding
1.1 1.2 1.4 1.51.3
1.6
Typical improvements:
Source: Bain & Company

8
Operational performance improvement in industrial companies
Bain’s warehouse network analysis begins by mapping all
customer locations with direct shipments. The optimal
locations for various scenarios are then modeled and a cal-
culation is made of the total costs for warehousing and
transport. By taking this step-by-step approach, the optimal
warehouse configuration can be established quickly and
accurately. In this way, clients with previously complex
warehouse networks achieve cost savings of between 10%
and 20% for warehousing and transportation costs.
A central team should be tasked with doc-umenting and rolling out Best Demonstrated Practices, along with associated tools and operating procedures. The deployment of a team of experienced engineers trained in lean production is also indispensable.
Outsourcing distribution
This can be a good option if current warehouse locations
are too small to operate efficiently, if the company needs
a cost structure with maximum variability or if there
are significant gaps in internal logistics competencies.
Outsourcing distribution typically achieves cost reduc-
tions of 20% or more.
Optimizing distribution processes
For companies that have not optimized their distribution
processes, a structured lean approach frequently leads
to cost reductions of 5% to 15% and inventory reductions
of 30% to 50%.
to have the managers of the best and worst evaluated
plants join forces to develop solutions for improving
each lean element.
A central team should be tasked with documenting and
rolling out Best Demonstrated Practices, along with
associated tools and operating procedures. The deploy-
ment of a team of experienced engineers trained in lean
production is also indispensable. Even if certain plants
consistently implement lean production, other facilities
will still need support to redevelop the production lay-
out and work flow, boost statistical measures of quality
or significantly reduce inventories in production.
Companies that adopt all of these lean production
measures can typically reduce production costs by 5%
to 15%.
Optimizing distribution
In many cases, industrial companies develop inventory
management structures that are neither efficiently
nor effectively managed. As a consequence, service
suffers and inventories balloon. Optimizing distribution
requires companies to answer three key questions:
• Which warehouse network is required?
• Does the company require its own warehouses or
is outsourcing the better option?
• How can lean distribution processes be implemented
at all sites?
Optimizing the warehouse network
A systematic analysis often shows that industrial com-
panies have too many warehouses, and often too many
levels and channels of distribution. A company that ships
products on a tight delivery schedule to a fragmented
customer base all over Europe can usually get by with
approximately 10 European warehouses. In many cases,
one central warehouse will suffice.

Operational performance improvement in industrial companies
9
• Lowering labor costs by reducing overtime and using
fewer subcontractors
• Optimizing overhead by rationalizing and auto-
mating tasks
Continuous improvement
The best service organizations never stop questioning
the status quo. They optimize their processes continuously
by applying the same instruments:
• Performance benchmarking exposes the top service
locations and teams.
• Best practices are documented and distributed
throughout the entire organization.
• Standard operating procedures are developed on
the basis of established and time-tested best practices,
and employees are appropriately trained.
• New technologies such as smartphones and tablets
are used to improve service and staff efficiency—
through GPS tracking, online support and expertise
sharing, for example.
Reducing overhead costs
Overhead reduction is one of the main goals of any oper-
ational performance improvement program. The reasons
for bloated overhead vary greatly but often include over-
staffing, complex organization structures, inefficient
and unclear processes, and/or inadequate IT systems.
Many companies estimate potential overhead reductions
by benchmarking their overhead costs as a percentage
of revenue. In reality, simple benchmarking can neither
quantify potential savings nor explain how overhead
reductions should be achieved.
Bain applies benchmarks at both functional and activity
levels. As a rule, “functional costs as percentage of
revenue” is a useful benchmark to identify potential
cost reductions. An activity benchmark such as “pro-
Optimizing after-sales service
Most industrial goods producers find significant perfor-
mance differences between service centers and between
individual service technicians. We often see efficiency
differences amounting to a factor of two or three for
identical service tasks.
Companies can realize enormous revenue and profit
growth by converging these differences to an adequate
efficiency level. For example, one coatings service pro-
vider was able to improve its service gross margin by
10% within four years by introducing rigorous perfor-
mance management.
Structural efficiency
Service efficiency starts with the structure of the service
center network. Companies need to find the right balance
between dispersed service units that deliver routine support
in close proximity to customers and centralized units that
provide technical expertise for more complex tasks such as
coaching customer teams or upgrading machinery.
Staff efficiency
Personnel are a service organization’s biggest cost. For
this reason, industrial companies that seek to optimize
profitability in the service business should concentrate
on improving staff efficiency. A number of time-tested
levers can be applied here:
• Increasing the number of billable hours by reducing
unproductive work through improvement of first-
time right ratio, for instance
• Improving the work cycle of technicians by opti-
mizing workflows and ensuring that the right tools
are available locally
• Reducing problem-solving times by training techni-
cians and simplifying their access to expert support
• Shortening travel times by improving route planning
and optimizing staff deployment

10
Operational performance improvement in industrial companies
industry managed to lower its PC-related costs by
40% by introducing a harmonized infrastructure
and outsourcing.
• Purchasing optimization: In our experience, IT depart-
ments frequently display less procurement discipline
compared with other corporate functions. Companies
can address this issue by separating the procure-
ment role from that of specifying IT requirements,
and by implementing license and support agree-
ments throughout the organization.
• Outsourcing: IT is well suited to outsourcing
because independent service providers often
achieve significant scale effects and work with
greater professionalism compared with internal
tech teams. PC infrastructure and server host-
ing are only two examples of how outsourcing
can significantly lower costs.
IT expenditures are high at many indus-trial companies. A systematic examina-tion of IT efficiency and effectiveness can reveal potential savings while identi-fying ways in which IT can better support the business.
IT projects
An examination of current IT projects often reveals a lack of coordination between the project roadmap and the company’s operational needs. Project manage-ment in the IT area can be optimized for compliance
with budgeted costs and project goals.
cessed creditor accounts per employee and month” is
even more precise. No benchmark can show a company
how to reduce overhead. Bain applies a wide range of
best practices to achieve efficient process redesigns
for every overhead function. By combining bench-
marking and process redesign, we often help our clients
reduce overhead by 10% to 20%.
Optimizing IT
IT expenditures are high at many industrial companies.
A systematic examination of IT efficiency and effective-
ness can reveal potential savings while identifying ways
in which IT can better support the business.
Pure IT benchmarking frequently suggests a simple
top-down savings potential. Bain considers IT more
intensively by focusing on the following three areas:
• IT administration
• IT infrastructure
• IT projects
IT administration
IT departments are frequently overstaffed. In these
cases, cost savings of more than 20% can be achieved
by applying a best practices approach and correspond-
ing reorganization.
IT infrastructure
The most important levers for lowering IT infrastructure
costs are complexity reduction, capacity adjustment and
procurement/outsourcing optimization.
• Complexity reduction: At many industrial companies,
different PC infrastructures, software platforms and
ERP systems exist side by side. Companies can
lower IT costs significantly by reducing this com-
plexity. For example, a client from the construction

Operational performance improvement in industrial companies
11
compiling a structured inventory of product attributes,
including special features as well as data on the number
of SKUs, revenue and margin, we separate the prod-
uct range into four groups (see Figure 5).When pos-
sible, problematic products should be replaced by core
products. If problematic products can’t be eliminated,
their price should be raised. For question mark prod-
ucts, a detailed analysis must be carried out to establish
whether production costs are too high or whether prod-
uct pricing is too low.
• Long list: By systematically working through the
morphological box, we create a long list of potential
actions. These include product elimination, prod-
uct replacement, price decisions or reduction of
production costs.
• Coordinating with marketing and distribution: Coor-
dinating the long list with marketing and distribution
ensures proper consideration of strategic issues
such as the need for entry-level products, cross-selling
Reducing product complexity
Many industrial companies recognize that they offer too
many products. However, it is not always possible to
scrap unprofitable products because the portfolio is fre-
quently based on complete solutions. Even so, companies
can often reduce their product range by only 5% to 10%
via internal initiatives. To meet this challenge, we recom-
mend the following four steps:
• Create portfolio and profitability transparency
• Develop a preliminary catalogue of measures (long list)
• Coordinate the long list with marketing and distribution
• Decide the final catalogue of measures (short list)
Portfolio and profitability transparency
Bain identifies opportunities to reduce product com-
plexity using a tool called the “morphological box.” After
Figure 5: Framework for product portfolio evaluation
High complexity and high profitability= Products with “good” or “acceptable” complexity
High complexity and low profitability= Problematic products
Low complexity and low profitability= Question mark products
Low complexity and high profitability= Core products
Prof
itabi
lity
Low
Hig
h
Complexity LowHigh
Source: Bain & Company

12
Operational performance improvement in industrial companies
Marginal cost and marginal benefit analysis
By using tools such as marginal benefit calculation, margin
analysis and feature benchmarking, companies can iden-
tify potential compromises between economic and tech-
nical considerations. Technical and marketing staff can
then determine the viability of each compromise.
A full Design-to-X action plan includes the results of
these four steps. X can stand for cost, value or manu-
facturability. Each potential opportunity receives its
own business case based on inputs such as customer
feedback, internal analysis and external expertise.
Bain has deep Design-to-X expertise and can advise
clients on all aspects of product optimization. Our
Design-to-X projects typically achieve cost savings in
the range of 5% to 20% of product costs. With the help
of quick wins, we frequently ensure a rapid return
on Capex.
Design-to-X projects typically achieve cost savings in the range of 5% to 20% of product costs. With the help of quick wins, we frequently ensure a rapid return on Capex.
Reducing working capital
In-depth benchmarking can help reduce a company’s
working capital requirements. Bain has access to various
benchmarking databases that help us identify potential
improvements swiftly and accurately.
In many cases, accounts receivables and accounts pay-
ables can be optimized significantly by optimizing debit
and credit management. Certain core processes, how-
or special regional requirements. This process typi-
cally restores a number of products that were slated
for elimination.
• Short list: We then compile a short list of product
simplification measures that has been approved by
all key stakeholders.
This approach has succeeded in lowering the range of
products at article number level by 50% or more. Because
complexity has a negative impact on the entire value-
added chain, the cost reduction effect is difficult to quan-
tify. In cases where we have made a detailed calculation
of the savings volume, savings ranged from 2% to 4%
of total costs.
Reducing product costs
Industrial companies can frequently achieve significant
cost reductions by applying so-called Design-to-Cost or
Design-to-X approaches.
Value analysis
This method specifies the value that customers and
experts attribute to specific product qualities and ser-
vices, thereby addressing common problems such
as overengineering.
Competitor analysis
This involves gathering information on the most effective
products and features offered by rival manufacturers.
A detailed analysis also helps companies understand how
their competitors make cost and performance decisions.
Idea generation
Structured discussion and brainstorming sessions can
help companies identify product-distinguishing features
and cost optimization opportunities. By considering
disparate factors such as technology, marketing, customers
and buyers, companies can gain new insights into their
own products.

Operational performance improvement in industrial companies
13
We divide Capex into three main categories:
Maintenance investment
The aim is to preserve the status quo of buildings, installa-
tions and equipment while keeping Capex as low as possible.
Rationalization investment
This is about achieving the greatest rationalization effect
on the capital employed. It requires rigorous analysis
of all possible rationalization projects, including cost-
benefit effects.
Growth investment
This type of investment typically does not come up every
year—one reason why costs and time schedules of major
expansion projects tend to spiral out of control. Key mea-
sures for keeping growth investment under control include:
• Strict examination of every aspect of the invest-
ment plan
• Structuring of the investment projects into sub-
projects that are given clearance in stages
• Reducing implementation risks by creating minimal
interdependencies between various project activities,
• Active management of the critical path
• Continuous Capex controls
By systematically analyzing Capex, industrial companies
can typically achieve investment reductions in the range
of 20% to 40%.
Where should the focus be placed?
Bain’s diagnostic X-ray can quickly and reliably identify
improvement levers that can be applied at short notice,
as well as initiatives that are important for the long term
(see Figure 6).
ever, must typically be re-drafted. This is especially true
when individual functions don’t integrate well or when
the company’s debit or credit procedures are excessively
time consuming.
Lowering inventories involves comparatively more work.
In many cases, the key is to improve operational proce-
dures or reduce product complexity before addressing
inventory reduction directly. Here, too, we often find
low-hanging fruit that is quick and simple to pick. For
example, many companies use the wrong parameters
in their inventory planning processes. At other com-
panies, inventory management responsibilities are
unclear, with the result that nobody feels responsible
for certain inventories. Both issues can be quickly iden-
tified and rectified.
By applying these methods, industrial companies can
typically achieve working capital improvements of
20% to 50%.
Optimizing capital expenditure
Capital expenditure (Capex) is another area where bench-
marking can help achieve significant improvements.
Companies with very high Capex relative to benchmarks
are generally deficient in the principles of investment
cost management. These principles include:
• Structured budgeting processes for investment projects
• Clear valuation principles for investment budgets
• Clear responsibilities for investment decisions
• Controlling for investment projects
If these principles are applied, industrial companies can
optimize Capex in all areas. Our experience shows that
the examination should span a five-year period to balance
out any Capex waves.

14
Operational performance improvement in industrial companies
• 50% of the companies succeeded in reaching more
than half their targets.
• 38% achieved fewer than half their goals.
Successful performance improvement programs require
the following elements:
Program definition
All project targets need to be translated into feasible
performance improvement ratios. All activities must
contribute to defined projects, which in turn must fit
into an all-encompassing program. Employees must
be given clear tasks, and managers must set clear goals
that include direct impact on the balance sheet.
Employee competence
For organizations to change, people must also change.
To deliver the results expected of them in an opera-
tional performance improvement process, employees
Financially appealing improvement options always exist
alongside strategically interesting ones. For example, pro-
curement costs and working capital reductions are usually
located in the “Greatest potential/quick wins” quadrant in
the upper right. Production improvements are generally
found in the bottom left quadrant due to the low address-
able cost base but comparatively high one-time costs and
Capex involved in the implementation.
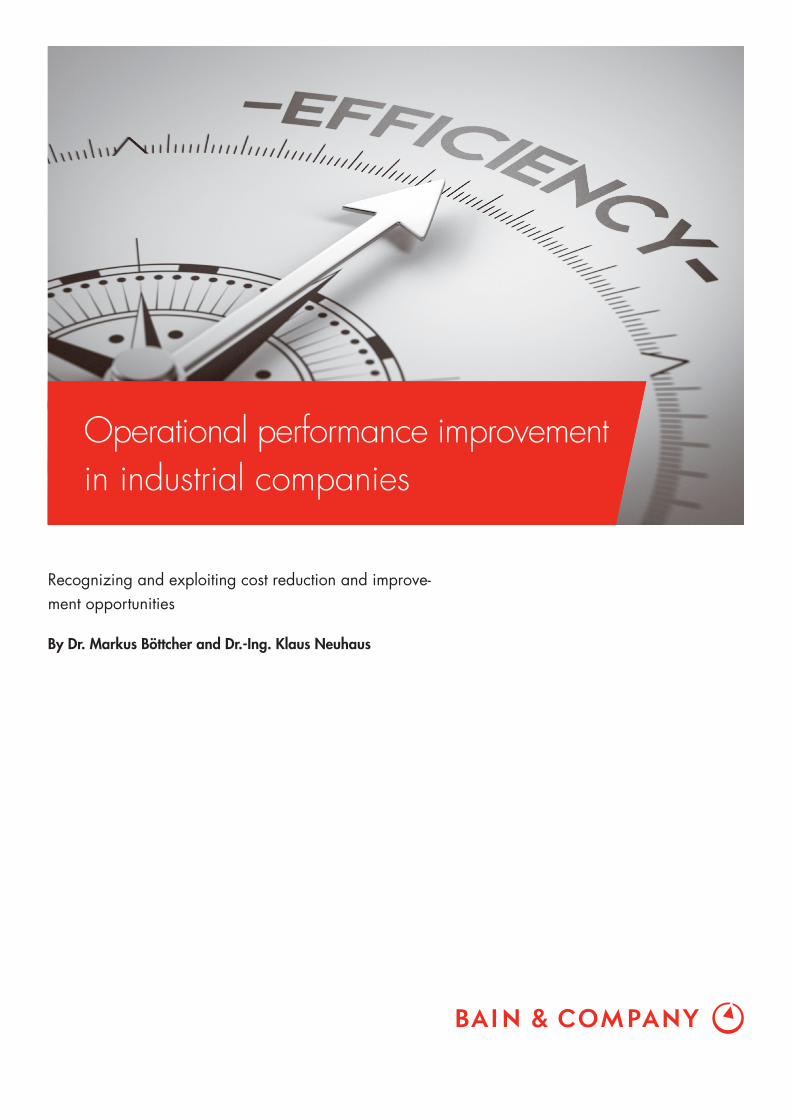
The final result of the PI X-ray and client prioritization
work is an improvement program with a concrete imple-
mentation time plan (see Figure 7).
How we achieve results
A recent Bain study of operational performance improve-
ment programs at several hundred companies revealed
the following:
• 12% of the companies reached or exceeded their
program targets.
Figure 6: High-level prioritization to select PI levers with greatest opportunity for further detailing
€XM
Ease of implementation
Valu
e of
opp
ortu
nity
(EBI
TDA
/cas
h)
Pricingoptimization
Salesenhancement
Productcomplexityreduction
Productionimprovement
NWCreduction
Purchasingcost
reduction
Supply chainoptimization
Capexoptimization
SG&A streamlining
IT optimization
Low High
Hig
hLo
w
Limitedopportunity
Breakthrough opportunity Greatest potential/quick wins
Lowervalue
Key PI initiatives selected for furtherdetail
Note: Revenue enhancement impact translated into EBITDA impactSource: Bain & Company
Operational performance improvement in industrial companies
15
• They ensure sustainability: Feedback channels and
checkback possibilities ensure effective learning and
lasting solutions.
Process tracking and intervention
Whereas some things are easy to measure, others take
too long or the measurement doesn’t function properly
or fails to have the desired effect. Having identified the
most promising improvement levers, we can help set
priorities and define a time plan based on the customer’s
particular goals.
Conclusion: “What gets measured gets done.”
With the aid of operational performance improvement,
Bain clients typically boost their margins by an average
of seven percentage points within two to three years.
Areas that tend to show rapid and significant improve-
ment include procurement with its high cost impact, a
reduction in working capital (cash management) and
a critical examination of current Capex.
will need to change their behavior and experience a
sense of achievement from these changes. It is there-
fore vital that companies invest in coaching measures
to ensure that these new behavior patterns have positive
and consistent consequences.
Companies can achieve high employee competency by
focusing on four factors:
• They live the future: A clear and convincing story
about the desired changes ensures that everyone
works toward a common goal.
• They engender commitment: Executive staff must
collaborate effectively and demonstrate clear support
for the performance improvement program.
• They keep their feet on the ground: A realistic
implementation plan focuses on achieving goals
while bearing in mind that there are limits to each
individual’s ability to change.
Figure 7: The implementation roadmap defines timing and the phasing of prioritized initiatives
SalesenhancementPricingoptimization Product complexityreduction Purchasing cost reductionProductionimprovement Supply chainoptimization SG&Astreamlining
IT optimization
NWC reduction
Capexoptimization
2013 20141Q 2Q 3Q 4Q 1Q 2Q 3Q 4Q
Sales effective-ness pilot
Quick-wins Pricing roll-outProduct pricing
Wave IIIWave II
Quick-wins and Win I
A/P Inventory
Complexitydiagnostic
Portfolio optimizationPostponement and redesign
Outsourcing FootprintLean production efficiency program
Shared services center implementation Benchmarks Organization and process redesign
Activity mapping
Project reviewProcess
Sales effectiveness roll-out
Leakage analysisPricing strategy
WarehousingS/Dplanning Supply-chain integration inbound and outbound
A/R
Strategy
Spendinganalysis,plan
Data center outsourcing
Retire applications, re-platform ERP system
Purchasingdiagnostic
Priority 1 Priority 2 Priority 3
Source: Bain & Company

16
Operational performance improvement in industrial companies
Projects that display performance improvement in the
medium term include outsourcing, new plant networks,
inventory management systems and measures to reduce
complexity. Projects that typically need more time include
the introduction of lean management, reducing product
complexity and systematically trimming product costs.
Bain’s X-ray diagnostic identifies potential short-term
improvements as well as longer-term improvements
that can result from changes in production or product
configuration. The priorities set by the client decide
which of these potentials to leverage.
About the study
Bain supports its clients worldwide in identifying and
achieving their full operational potential. We apply both
a holistic approach that spans the entire customer
organization as well as a single-attribute approach for
targeted improvement of specific problem areas. The
study is based on the project experience and extensive
expertise of Bain & Company in the field of performance
improvement. You can find the study “Operational
Performance Improvement in Industrial Companies” on
our websites www.bain.de and www.bain-company.ch.
Performance Improvement DiagnosticSM is a trademark of Bain & Company, Inc.

Shared Ambition, True Results
Bain & Company is the management consulting firm that the world’s business leaders come to when they want results.
Bain advises clients on strategy, operations, technology, organization, private equity and mergers and acquisitions. We develop practical, customized insights that clients act on and transfer skills that make change stick. Founded in 1973, Bain has 51 offices in 33 countries, and our deep expertise and client roster cross every industry and economic sector. Our clients have outperformed the stock market 4 to 1.
What sets us apart
We believe a consulting firm should be more than an adviser. So we put ourselves in our clients’ shoes, selling outcomes, not projects. We align our incentives with our clients’ by linking our fees to their results and collaborate to unlock the full potential of their business. Our Results Delivery® process builds our clients’ capabilities, and our True North values mean we do the right thing for our clients, people and communities—always.

For more information, visit www.bain.com
Key contacts in Bain & Company’s Performance Improvement practice in Germany:
Dr. Markus Böttcher in Munich ([email protected]) Dr.-Ing. Klaus Neuhaus in Dusseldorf ([email protected])