Embed Size (px)
Citation preview

Operation and Control Microgrid and Distributed Generation
Mohammad ShahidehpourIllinois Institute of Technology

Outline Introduction - Microgrids
High Reliability Distribution Systems
Perfect Power System – IIT Microgrid Optimal Control of Microgrid Reliability Evaluation
Stochastic Solution Islanding and Synchronization
2

Introduction – Microgrids Microgrids are considered as viable options for electrification
where the main grid expansion is either impossible or has noeconomical justification.
The decentralized operation and control of microgrids could alsoreduce the transmission burden on power utility systems.
3

Introduction – Microgrids Microgrids can provide higher reliability and power quality for
loads. Once in grid- connected mode, any grid failure will lead to
microgrid islanding. In the island mode, the master controller relies on microgrid
generation and storage to serve the microgrid load and preventcurtailments.
The load restoration procedure in microgrids could depend onthe reliability requirements of loads.
Microgrid topology could play a crucial role in supplyingmicrogrid loads with diverse reliability requirements.
4

DER in Microgrids Distributed energy resources (DER) in a microgrid would
include photovoltaic (PV), small wind turbines (WT), heat orelectricity storage, combined heat and power (CHP), andcontrollable loads.
DER applications would increase the efficiency of energy supplyand reduce the electricity delivery cost and carbon footprint in amicrogrid.
DER applications would also make it possible to imposeintentional islanding in microgrids.
The proximity of generation to loads in microgrids wouldimprove the power quality and reliability (PQR) at load points.
5

Storage in Microgrid Storage devices including batteries, supercapacitors, and
flywheels could be used to match generation with demand inmicrogrids.
Storage can supply generation deficiencies, reduce load surgesby providing ride-through capability for short periods, reducenetwork losses, and improve the protection system bycontributing to fault currents.
V2G and EV mobility can reduce the microgrid reliance on thegrid supply.
6

Introduction – Control Devices Hierarchical control performed by master controller ensures the
economical and secure operation of microgrids by maintainingthe frequency and voltage in microgrids.
Master controller uses SCADA to monitor and regulatefrequency and voltage in microgrids according to “P-f” and “Q-V”droop characteristics.
IIT microgrid is considered as a test-bed to evaluate the effectsof intelligent switching and storage implementation on reliabilityand economic operation of microgrid.
7

High Reliability Distribution System (HRDS) Implementation of microgrid loops is made possible by the use
of automatic switches in HRDS. HRDS switches can sense the cable faults and isolate the
faulted section with no impact on other sections in a microgrid. Master controller will monitor the status of each HRDS switch
using the supervisory control and data acquisition (SCADA) system.
Master controller is responsible for economic operation of the microgrid based on signals received from switches on the status of distribution branches.
8

HRDS vs. No HRDS HRDS vs. No HRDS
9
No HRDS
HRDS
S15S16

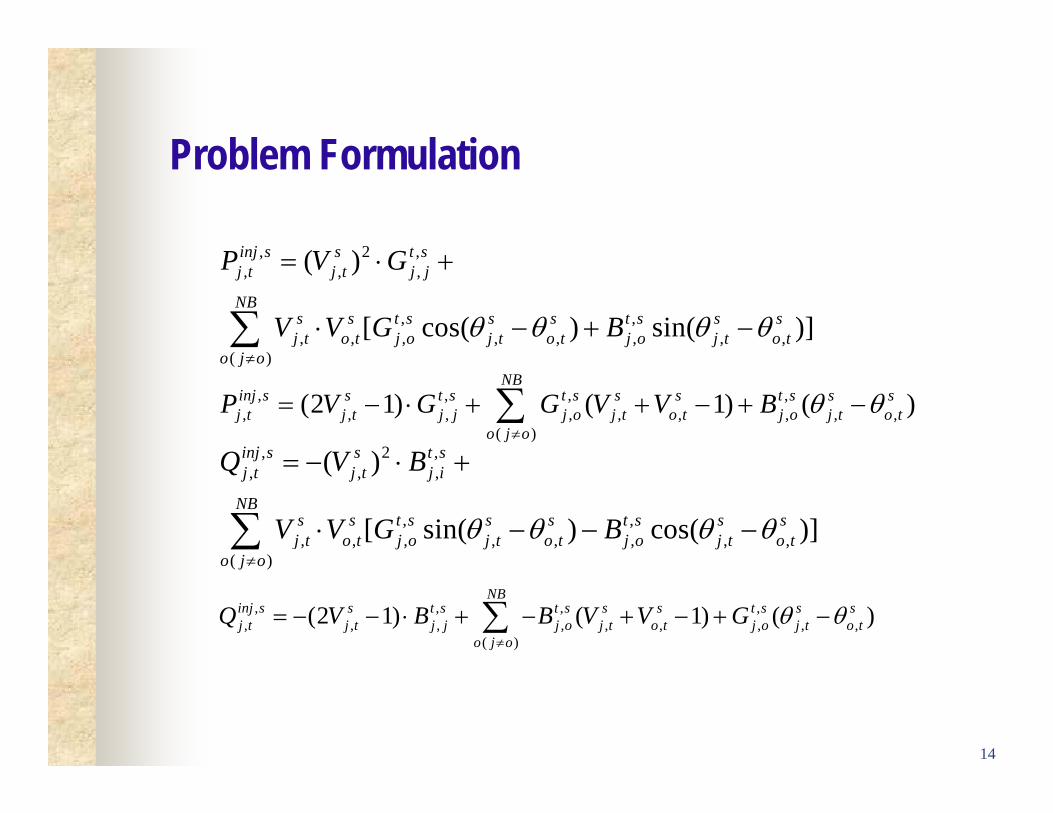
Problem Formulation Random outages of grid-connection facilities, microgrid DG, and
microgrid distribution lines are considered. Monte Carlo representation of outages is applied and the Latin
Hypercube Sampling (LHS) technique is used to develop alarge number of scenarios with equal probabilities.
A two-state Markov chain process is utilized to representmicrogrid outages according to the microgrid component failureand repair rates.
Since the computation time of stochastic optimization isdependent on the number of scenarios, the scenario reductiontechnique is utilized to reduce the number of generatedscenarios to an acceptable level with the correspondingprobabilities.
10

Master Controller Formulation Stochastic Formulation
11
, , , ,
, ,, , ,
( )
.( )
s s s sc i i t i t i t
t iss D s d ss t g t b t b t
t b
F P SU SDMin p
P VOLL P P
, , , , s s s si t g t k t D t
i kP P P P
, , , 1( ) s s si t i i t i tSU CS I I
, , 1 ,( ) s s si t i i t i tSD CD I I
min max, , , , , s s s s s
i i t i t i t i i t i tP UX I P P UX Imin max
, , , s s sg g t g t g g tP UX P P UX

Problem Formulation
12
,, , , ,,
, , , , ,
net s s sdc k t k c k tk t
s s sk t dc k t c k t
E P P
P P P
, , , , 1 s sdc k t c k tI I
min max, , , , , , , ,
min max, , , , , , , ,
s s sc k t c k c k t c k t c ks s sdc k t dc k dc k t dc k t dc k
I P P I P
I P P I P
min max, , , , , , , , ,( ) ( ) s s s s
k dc k t c k t k t k dc k t c k tQ I I Q Q I I
,, , 1 ,
min max,
,0 ,
s s net sk t k t k t
sk k t k
k k NT
E E E
E E E
E E

Problem Formulation
13
,,, , , ,,i g k d
j j j j
inj ss s s d si t g t k t j tD t
i D g D k D d DP P P P P
,,, , , ,,i g k d
j j j j
inj ss s s d si t g t k t j tD t
i D g D k D d DQ Q Q Q Q
, ,, ,, ,, , ,
, , , 2 2 2 2, , , ,
t s t so j o jo j o jt s t s t s
o j o j o jo j o j o j o j
r U x Uy g jb j
r x r x
Problem Formulation
14
, 2 ,, , ,
, ,, , , , , , , ,
( )
( )
[ sin( ) cos( )]
inj s s t sj t j t j i
NBs s t s s s t s s sj t o t j o j t o t j o j t o t
o j o
Q V B
V V G B
, , , ,, , , , , , , , ,
( )(2 1) ( 1) ( )
NBinj s s t s t s s s t s s sj t j t j j j o j t o t j o j t o t
o j oQ V B B V V G
, 2 ,, , ,
, ,, , , , , , , ,
( )
( )
[ cos( ) sin( )]
inj s s t sj t j t j j
NBs s t s s s t s s sj t o t j o j t o t j o j t o t
o j o
P V G
V V G B
, , , ,
, , , , , , , , ,( )
(2 1) ( 1) ( )NB
inj s s t s t s s s t s s sj t j t j j j o j t o t j o j t o t
o j oP V G G V V B

Problem Formulation
15
, 2 , 2 , 2, , ,( ) ( ) ( )t s t s t s
j o j o j oQL PL SL
, max, ,
t sj o j oSL SL
, 2 ,, , ,
, ,, , , , , , , ,
( )
[ cos( ) sin( )]
t s s t sj o j t j j
s s t s s s t s s sj t o t j o j t o t j o j t o t
PL V G
V V G B
, , , , , , ,, , ,( ) ( )t s t s t s t s t s t s t s
j o j o j o j o j oPL G V V B , 2 ,, , ,
, ,, , , , , , , ,
( )
[ sin( ) cos( )]
t s s t sj o j t j j
s s t s s s t s s sj t o t j o j t o t j o j t o t
QL V B
V V G B
, , , , , , ,, , ,( ) ( )t s t s t s t s t s t s t s
j o j o o j j o j oQL B V V G
, , , ,, , , ,
t s t s t s t sj o j o j o j oSL PL QL

Perfect Power System – IIT Microgrid
16

Perfect Power System – IIT Microgrid
17

Perfect Power System – IIT Microgrid
18

Perfect Power System – IIT Microgrid IIT demand is supplied by three 12.47 KV circuits fed from the
Fisk substation that is owned by ComEd. The peak load at IIT isapproximately 10 MW.
19

Perfect Power System – Components Renewable energy sources include wind and solar generation.
An 8 kW Viryd wind turbine is installed on the north side of thecampus in Stuart soccer field.
PV cells will be installed on building rooftops to supply portionsof campus load.
A 500-kWh ZBB storage will increase the reliability andefficiency of the microgrid.
Several electric vehicle charging stations will be deployed oncampus, facilitating small energy storage and providing greenenergy for electric vehicles.
20

Perfect Power System – Components• 6 five‐hour
charging stations
• 1 DC Quick Charge (15‐20 minutes)
• FREE Charging for Electric Vehicles (for now)
21

Perfect Power System – Components
22

Perfect Power System – Components
23

Perfect Power System – Components• Energy
Efficiency
• Demand Response
• Islanding Mode
• Real‐time information
24

Perfect Power System – IPPSC Intelligent Perfect Power System Controller (IPPSC)
IPPSC manages the campus electricity distribution system andelectricity usage.
IPPSC utilizes SCADA at all hours for reliable and economicoperations of microgrid.
IPPSC coordinates HRDS controllers, on-site generation,storage facilities and building controllers.
Intelligent switching and advanced coordination technologiesthrough communication systems facilitates rapid faultassessment and isolation
25

Microgrid Reliability Evaluation Study Cases :
Case 1: IIT network is not equipped with HRDS switches Case 2: IIT network is equipped with HRDS switches Case 3: IIT is equipped with HRDS switches and a storage
26
HermannHall (kWh)
SiegelHall (kWh)
WishnickHall (kWh)
PerlsteinHall (kWh)
Total(kWh)
Case 1 0 0 0 173.236 173.236
Case 2 0 0 0 0 0
Case 3 0 0 0 0 0

Reliability Evaluation – Stochastic Solution The installation of HRDS and storage will lead to the best
expected reliability and economic indices.
27
Case No HRDS HRDS HRDS + StorageExp. SAIDI 1.22 0.18 0.04Exp. SAIFI 3.29 0.59 0.37Exp. CAIDI 1.73 0.36 0.04Exp. CAIFI 2.69 0.68 0.29
Exp. Operation Cost 224,073 146,899 120,038Exp. Energy not Supplied 1,216.21 251.07 175.10
LOLE 13.153 2.360 1.467

Optimal Control of Microgrid
28
00.511.522.533.544.5
-400
-200
0
200
400
600
800
1000
1200
1 2 3 4 5 6 7 8 9 10 11 12 13 14 15 16 17 18 19 20 21 22 23 24
Pow
er (k
W)
Time (Hours)
Main grid supplyBattery supplyTotal DemandMain grid price
Ele
ctri
city
Pri
ce (¢
/kW
h)

Optimal Control of Microgrid
29
012345678910
-1500
-1000
-500
0
500
1000
1500
1 2 3 4 5 6 7 8 9 10 11 12 13 14 15 16 17 18 19 20 21 22 23 24
Pow
er (k
W)
Time (Hours)
Grid DispatchPower Plant DispatchPrice
Ele
ctri
city
Pri
ce (¢
/kW
h)

Islanding and Synchronization
30

Microgrid Fault Analysis No HRDS
Fault takes 30 cycles to clear. The system is radial. Once the breaker opens, all the loads
downstream will be disconnected. HRDS
Fault takes 6 cycles to clear. The system is loop. Once the breakers open, only the faulted
cable is isolated.
31

Fault Simulation Relative Voltage Angle of Gen. 2- No HRDS
32
0 20 40 60 80 100-20
-15
-10
-5
0
5
10
15
Time (second)
Rel
ativ
e A
ngle
(deg
ree)
Gen. 2
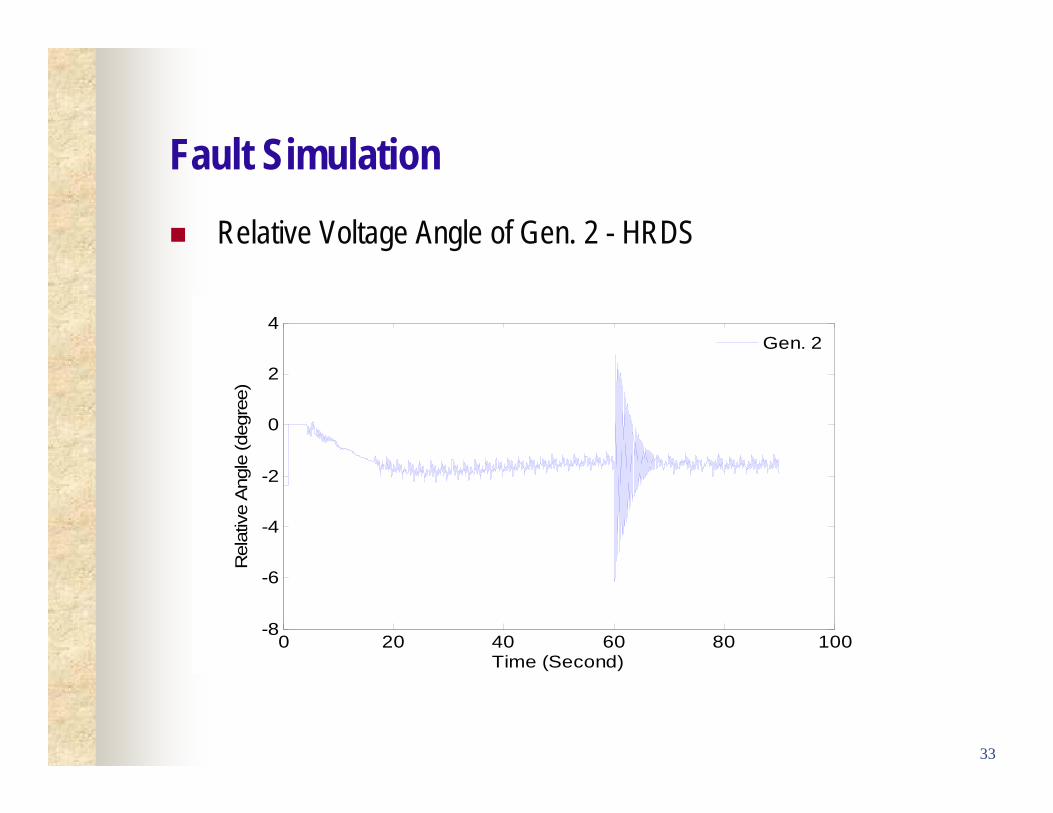
Fault Simulation Relative Voltage Angle of Gen. 2 - HRDS
33
0 20 40 60 80 100-8
-6
-4
-2
0
2
4
Time (Second)
Rel
ativ
e A
ngle
(deg
ree)
Gen. 2

Building Restoration Sequence Building Restoration Sequence:
34
T=30 sec T=45 sec T=60 sec T=75 sec T=85 sec
3410 Central CTA Facility Perlstein Hall Stuart Bldg. IIT Tower
3424 Central Cunningham Quad TBC Incubator
Alumni Hall Eng1 S.R. Crown TS3424 Keating
Carman Galvin Siegel Hall Vandercook Life Science
Carr Gunsaulus Metal S.1 Whishnick Life Science Research
MTCC Hermann Hall Metal S. 2 SSV Main
- - - - Metal N.

Load Restoration
35
0 50 100 1500
0.1
0.2
0.3
0.4
0.5
0.6
0.7
Time (Second)
Dem
and
(MW
)
Alumni HallLife Science ResearchWishnick HallSiegel HallEngineering 1

Load Sharing Among Generators
36
0 50 100 150-2
0
2
4
6
8
Time (Second)
Pow
er (M
W)
Gen 1Gen 2 Load Increment

Synchronization (frequency check)
37
0 50 100 15052
54
56
58
60
62
64
66
Time (Second)
Freq
uenc
y (H
z)
Freq. Deviation < 1 Hz

Synchronization (voltage angle check)
38
0 50 100 150-15
-10
-5
0
5
Time (Second)
Vol
tage
Ang
le (d
egre
e)
North SS South SSVoltage Angle Diff. < 30⁰

Synchronization (voltage check)
39
0 50 100 1503
3.5
4
4.5
5
Time (Second)
Vol
tage
(kV
)
North SSVoltage Diff. at switching instance
Conclusion and Summary Application of HRDS, local generation, and storage is presented
and the reliability and economic evaluation of microgrid isevaluated: AC formulation is offered to solve the unit commitment and
economic dispatch in microgrids. Integration of HRDS and evaluation of reliability and economic
indices of microgrids are considered as compared to those intraditional distribution systems.
Provision of stochastic solution to two proposed topologies isconsidered for the comparison of reliability indices.
Assessment of the role of energy storage on the economicoperation of microgrids is considered and improved reliabilityindices at load points are calculated.
40

Conclusion and Summary HRDS will clear the fault faster and has less effect on the
stability of the system specially in islanded mode Once islanded, the local generation will maintain the frequency
and voltage of the system. In order to synchronize with the main grid, frequency deviation,
voltage deviation and voltage angle deviation should be withinthe acceptable limits.
Two generators will share the loads based on their droopcharacteristics.
Once the first generator reaches its maximum capacity thesecond generator would maintain the frequency of the systemby providing enough active power.
41

Conclusion and Summary HRDS and automatic switches can reduce the expected
frequency and duration of interruptions and the expected energynot supplied in the system.
Storage can reduce the operation cost of the system by demandresponse and preventing load curtailments.
Local generation helps mitigate the expected interruptionduration and frequency in the system and improve the reliabilityof the customers in microgrid.
42