Embed Size (px)
Citation preview
J00I00
Maryland Aviation Administration Maryland Department of Transportation
Note: Numbers may not sum to total due to rounding. For further information contact: Jonathan D. Martin Phone: (410) 946-5530
Analysis of the FY 2014 Maryland Executive Budget, 2013 1
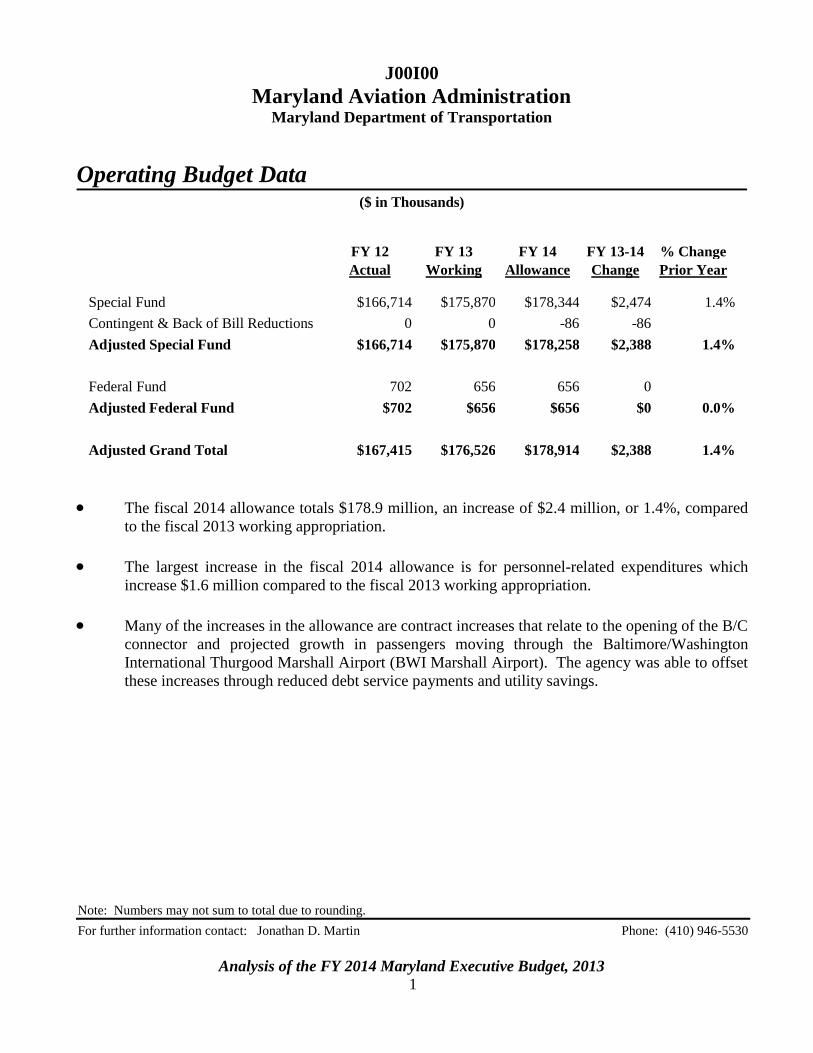
Operating Budget Data
($ in Thousands)
FY 12 FY 13 FY 14 FY 13-14 % Change
Actual Working Allowance Change Prior Year
Special Fund $166,714 $175,870 $178,344 $2,474 1.4%
Contingent & Back of Bill Reductions 0 0 -86 -86
Adjusted Special Fund $166,714 $175,870 $178,258 $2,388 1.4%
Federal Fund 702 656 656 0
Adjusted Federal Fund $702 $656 $656 $0 0.0%
Adjusted Grand Total $167,415 $176,526 $178,914 $2,388 1.4%
The fiscal 2014 allowance totals $178.9 million, an increase of $2.4 million, or 1.4%, compared
to the fiscal 2013 working appropriation.
The largest increase in the fiscal 2014 allowance is for personnel-related expenditures which
increase $1.6 million compared to the fiscal 2013 working appropriation.
Many of the increases in the allowance are contract increases that relate to the opening of the B/C
connector and projected growth in passengers moving through the Baltimore/Washington
International Thurgood Marshall Airport (BWI Marshall Airport). The agency was able to offset
these increases through reduced debt service payments and utility savings.
J00I00 – MDOT – Maryland Aviation Administration
Analysis of the FY 2014 Maryland Executive Budget, 2013 2
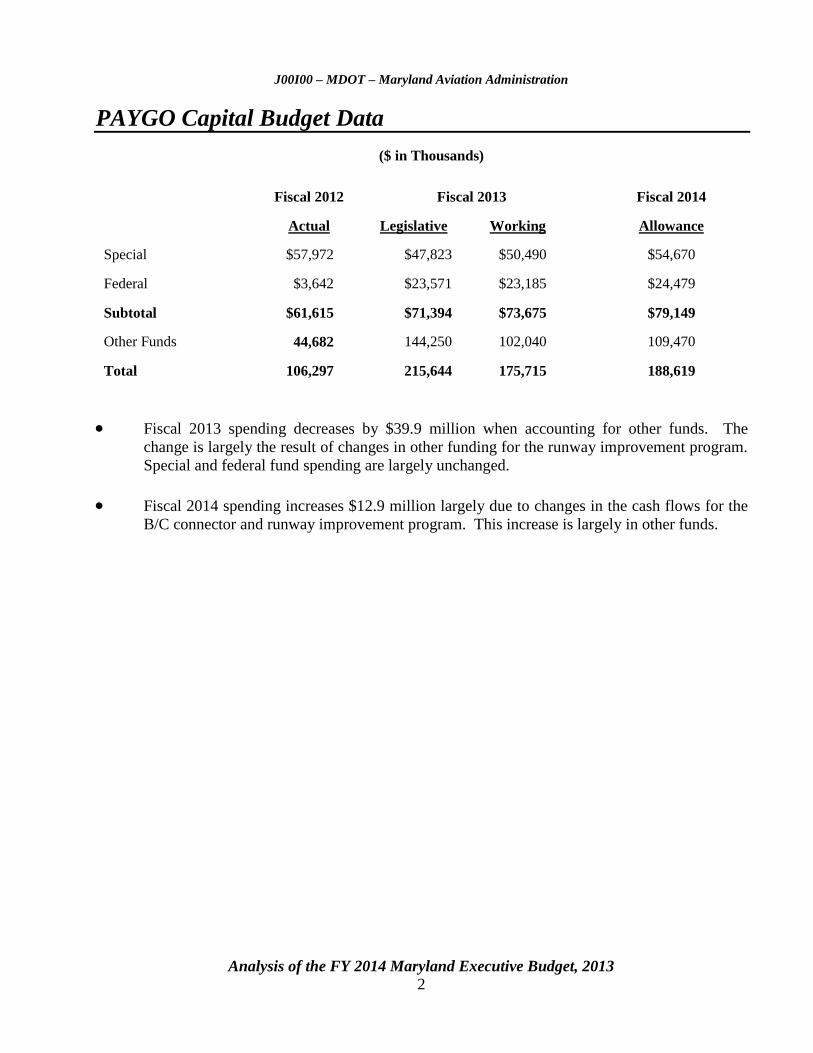
PAYGO Capital Budget Data
($ in Thousands)
Fiscal 2012 Fiscal 2013 Fiscal 2014
Actual Legislative Working Allowance
Special $57,972 $47,823 $50,490 $54,670
Federal $3,642 $23,571 $23,185 $24,479
Subtotal $61,615 $71,394 $73,675 $79,149
Other Funds 44,682 144,250 102,040 109,470
Total 106,297 215,644 175,715 188,619
Fiscal 2013 spending decreases by $39.9 million when accounting for other funds. The
change is largely the result of changes in other funding for the runway improvement program.
Special and federal fund spending are largely unchanged.
Fiscal 2014 spending increases $12.9 million largely due to changes in the cash flows for the
B/C connector and runway improvement program. This increase is largely in other funds.
J00I00 – MDOT – Maryland Aviation Administration
Analysis of the FY 2014 Maryland Executive Budget, 2013 3
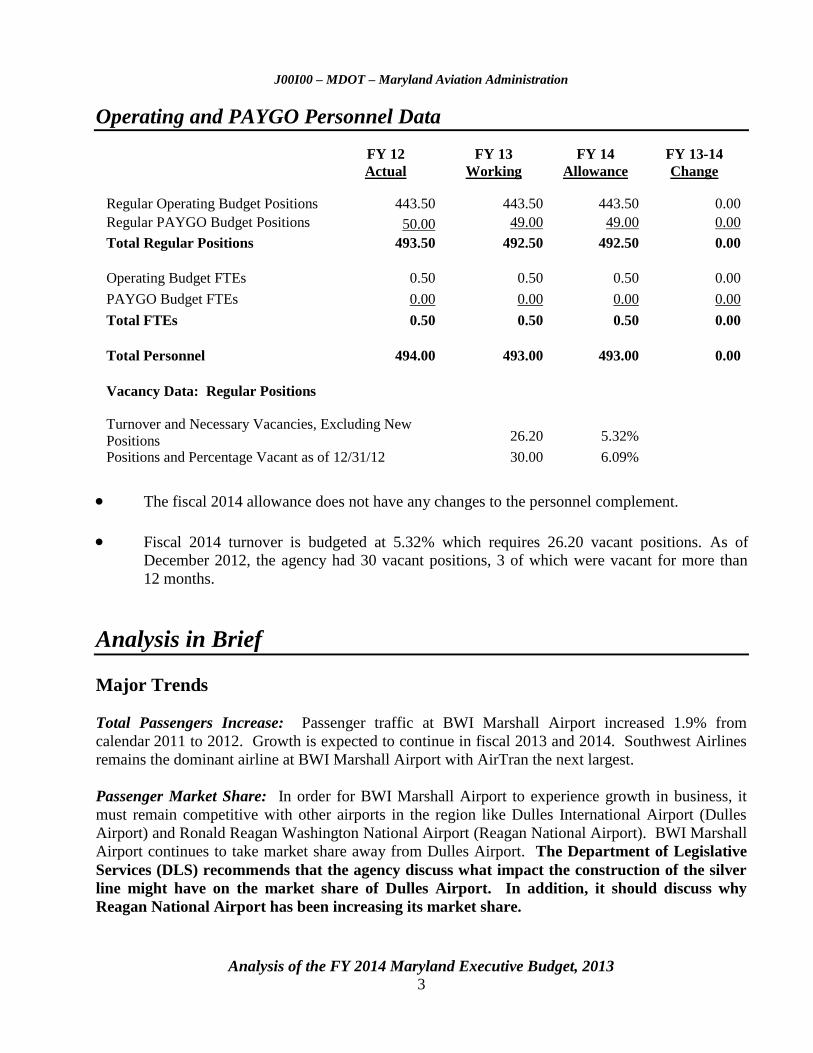
Operating and PAYGO Personnel Data
FY 12 FY 13 FY 14 FY 13-14
Actual Working Allowance Change
Regular Operating Budget Positions
443.50
443.50
443.50
0.00
Regular PAYGO Budget Positions
50.00 49.00 49.00 0.00
Total Regular Positions 493.50 492.50 492.50 0.00
Operating Budget FTEs 0.50 0.50 0.50 0.00
PAYGO Budget FTEs 0.00 0.00 0.00 0.00
Total FTEs 0.50 0.50 0.50 0.00
Total Personnel 494.00 493.00 493.00 0.00
Vacancy Data: Regular Positions
Turnover and Necessary Vacancies, Excluding New
Positions 26.20 5.32%
Positions and Percentage Vacant as of 12/31/12 30.00 6.09%
The fiscal 2014 allowance does not have any changes to the personnel complement.
Fiscal 2014 turnover is budgeted at 5.32% which requires 26.20 vacant positions. As of
December 2012, the agency had 30 vacant positions, 3 of which were vacant for more than
12 months.
Analysis in Brief
Major Trends
Total Passengers Increase: Passenger traffic at BWI Marshall Airport increased 1.9% from
calendar 2011 to 2012. Growth is expected to continue in fiscal 2013 and 2014. Southwest Airlines
remains the dominant airline at BWI Marshall Airport with AirTran the next largest.
Passenger Market Share: In order for BWI Marshall Airport to experience growth in business, it
must remain competitive with other airports in the region like Dulles International Airport (Dulles
Airport) and Ronald Reagan Washington National Airport (Reagan National Airport). BWI Marshall
Airport continues to take market share away from Dulles Airport. The Department of Legislative
Services (DLS) recommends that the agency discuss what impact the construction of the silver
line might have on the market share of Dulles Airport. In addition, it should discuss why
Reagan National Airport has been increasing its market share.
J00I00 – MDOT – Maryland Aviation Administration
Analysis of the FY 2014 Maryland Executive Budget, 2013 4
Cost and Revenue Per Enplaned Passenger: The cost per enplaned passenger (CPE) grew in
fiscal 2012 consistent with the regional airport average. While the cost increased, it is still less than
the regional airport average. Costs increased at a rate greater than passenger growth. Conversely,
revenue per enplaned passenger decreased as revenue growth did not keep pace with passenger
growth. DLS recommends that the Maryland Aviation Administration (MAA) discuss how it
has been able to keep the CPE so low compared to other regional airports.
Financial Results: In fiscal 2012, MAA’s operating revenues were sufficient to cover its operating
expenses, generating a positive net income of $41.4 million.
Issues
Update on Financing for Major Capital Projects: MAA currently has two major capital projects
underway – the B/C connector and runway safety/pavement management program. The financing
plan and cost for these two projects has changed considerably since last session. DLS recommends
that MAA discuss the status of the two major projects and any potential changes to the
financing plan.
Operating Budget Recommended Actions
1. Concur with Governor’s allowance.
PAYGO Budget Recommended Actions
1. Concur with Governor’s allowance.
Updates
Ambulance Transport Fee Update: Chapter 1 of the First Special Session of 2012 included a
provision requiring the BWI Marshall Fire and Rescue Department to charge an ambulance transport
fee, similar to other fire departments, to any individual transported to a hospital from property owned
by MAA or property subject to a mutual aid agreement. MAA has drafted a proposed regulation that
would set a $500 ambulance fee, and any uncollected fee would be referred to the Central Collection
Unit.
J00I00
Maryland Aviation Administration Maryland Department of Transportation
Analysis of the FY 2014 Maryland Executive Budget, 2013 5
Budget Analysis
Program Description
The Maryland Aviation Administration (MAA) has responsibility for fostering, developing,
and regulating aviation activity throughout the State. MAA is responsible for operating, maintaining,
and developing the State-owned Baltimore/Washington International Thurgood Marshall Airport
(BWI Marshall Airport) as a major center of commercial air carrier service in the State and Martin
State Airport (MTN) as a general aviation reliever facility and as a support facility for the Maryland
Air National Guard and the Maryland State Police. MAA strives to make the Maryland aviation
system the “Easy Come, Easy Go” gateway to the world, and to achieve this it has identified the
following key goals:
keeping BWI Marshall Airport passengers, tenants, and facilities safe;
operating BWI Marshall Airport efficiently and effectively;
attracting, maintaining, and expanding air service; and
providing exceptional service.
Performance Analysis: Managing for Results
1. Total Passengers Increase
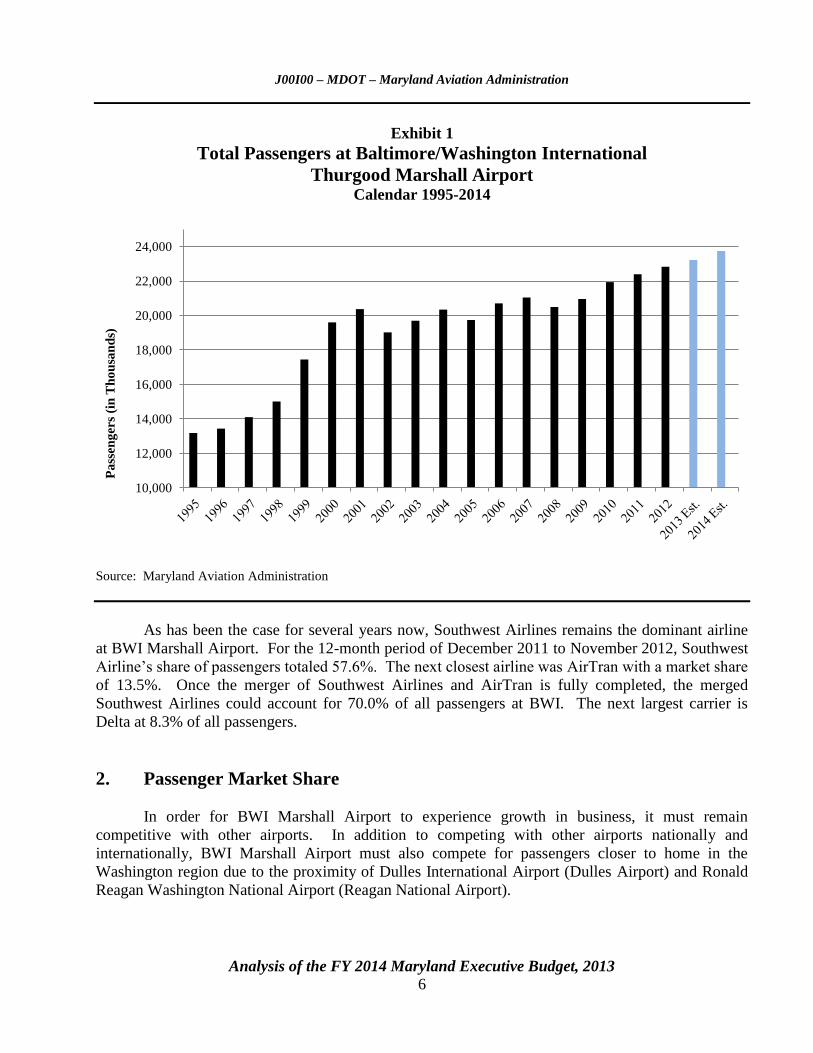
Passenger traffic at BWI Marshall Airport increased 1.9% from calendar 2011 to 2012, up
from 22.4 million passengers in calendar 2011 to 22.8 million in calendar 2012. As shown in
Exhibit 1, over the last two decades, passengers have increased from 13.2 million in calendar 1995 to
22.8 million in calendar 2012. BWI Marshall Airport saw a steady growth period from calendar 1995
through 2001. In the period from calendar 2002 through 2008, passenger totals leveled off and
hovered near 20.0 million. Since calendar 2008, steady growth in passengers has again taken place,
despite the economic downturn.
J00I00 – MDOT – Maryland Aviation Administration
Analysis of the FY 2014 Maryland Executive Budget, 2013 6
Exhibit 1
Total Passengers at Baltimore/Washington International
Thurgood Marshall Airport Calendar 1995-2014
Source: Maryland Aviation Administration
As has been the case for several years now, Southwest Airlines remains the dominant airline
at BWI Marshall Airport. For the 12-month period of December 2011 to November 2012, Southwest
Airline’s share of passengers totaled 57.6%. The next closest airline was AirTran with a market share
of 13.5%. Once the merger of Southwest Airlines and AirTran is fully completed, the merged
Southwest Airlines could account for 70.0% of all passengers at BWI. The next largest carrier is
Delta at 8.3% of all passengers.
2. Passenger Market Share
In order for BWI Marshall Airport to experience growth in business, it must remain
competitive with other airports. In addition to competing with other airports nationally and
internationally, BWI Marshall Airport must also compete for passengers closer to home in the
Washington region due to the proximity of Dulles International Airport (Dulles Airport) and Ronald
Reagan Washington National Airport (Reagan National Airport).
10,000
12,000
14,000
16,000
18,000
20,000
22,000
24,000
Pa
ssen
ger
s (i
n T
ho
usa
nd
s)
J00I00 – MDOT – Maryland Aviation Administration
Analysis of the FY 2014 Maryland Executive Budget, 2013 7
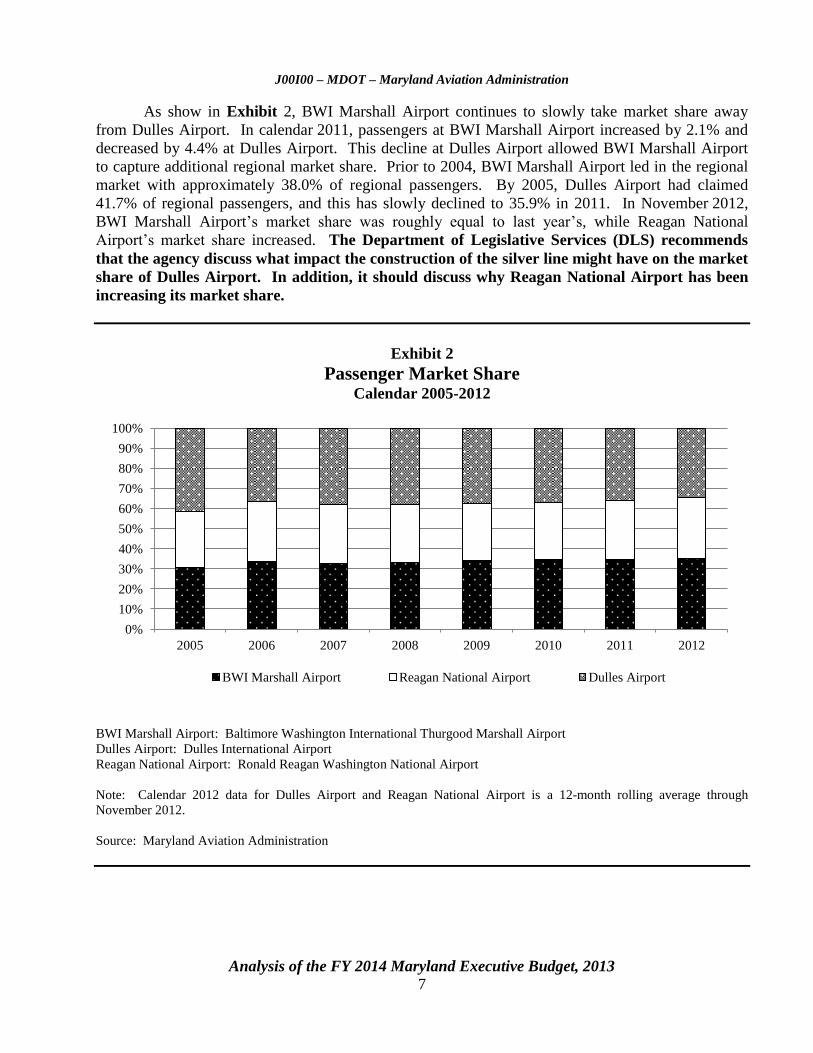
As show in Exhibit 2, BWI Marshall Airport continues to slowly take market share away
from Dulles Airport. In calendar 2011, passengers at BWI Marshall Airport increased by 2.1% and
decreased by 4.4% at Dulles Airport. This decline at Dulles Airport allowed BWI Marshall Airport
to capture additional regional market share. Prior to 2004, BWI Marshall Airport led in the regional
market with approximately 38.0% of regional passengers. By 2005, Dulles Airport had claimed
41.7% of regional passengers, and this has slowly declined to 35.9% in 2011. In November 2012,
BWI Marshall Airport’s market share was roughly equal to last year’s, while Reagan National
Airport’s market share increased. The Department of Legislative Services (DLS) recommends
that the agency discuss what impact the construction of the silver line might have on the market
share of Dulles Airport. In addition, it should discuss why Reagan National Airport has been
increasing its market share.
Exhibit 2
Passenger Market Share Calendar 2005-2012
BWI Marshall Airport: Baltimore Washington International Thurgood Marshall Airport
Dulles Airport: Dulles International Airport
Reagan National Airport: Ronald Reagan Washington National Airport
Note: Calendar 2012 data for Dulles Airport and Reagan National Airport is a 12-month rolling average through
November 2012.
Source: Maryland Aviation Administration
0%
10%
20%
30%
40%
50%
60%
70%
80%
90%
100%
2005 2006 2007 2008 2009 2010 2011 2012
BWI Marshall Airport Reagan National Airport Dulles Airport
J00I00 – MDOT – Maryland Aviation Administration
Analysis of the FY 2014 Maryland Executive Budget, 2013 8
3. Cost and Revenue Per Enplaned Passenger
Two of the important financial calculations, considered in regard to airports, are the cost per
enplaned passenger (CPE) and the non-airline revenue per enplaned passenger (RPE). Non-airline
revenue includes parking, concessions, rental cars, and other revenue sources. In regard to CPE, part
of BWI Marshall Airport’s success has been its ability to maintain low CPE rates, which attracts and
retains low-cost carriers such as Southwest Airlines. At BWI Marshall Airport, like all airports,
operating costs are passed on to airlines through building rent, landing fees, and other user charges.
Therefore, both MAA and the airlines have an interest in keeping operating costs as low as possible.
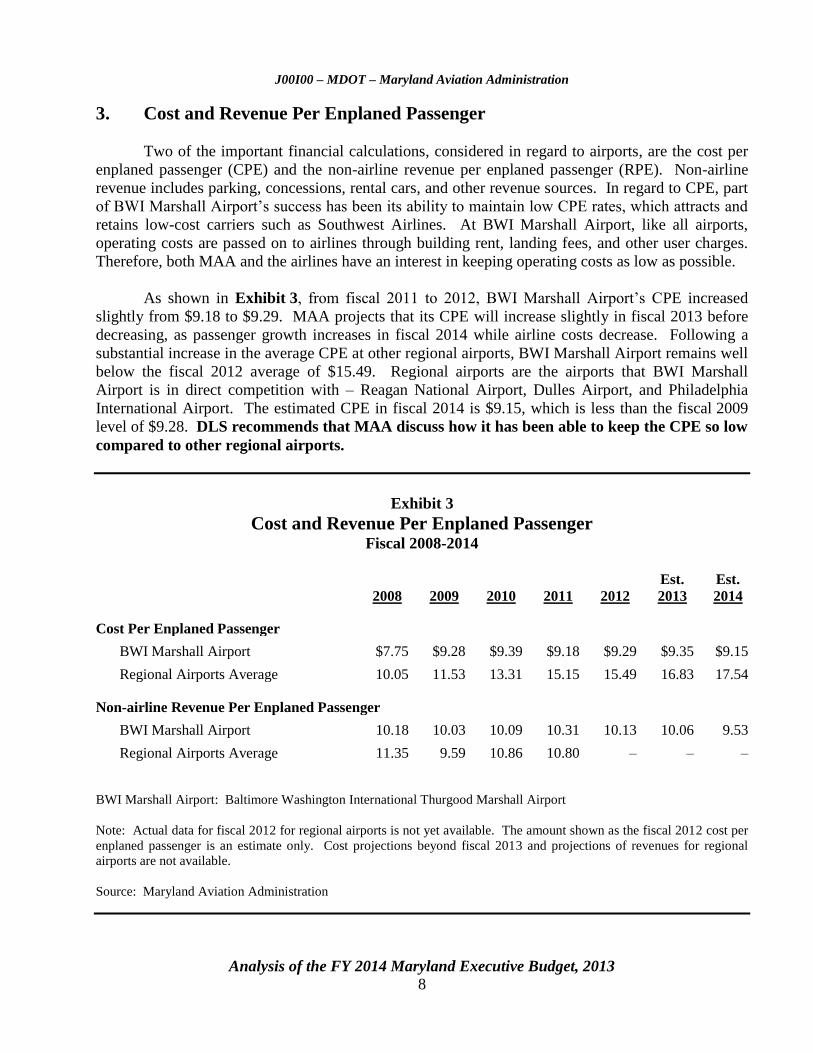
As shown in Exhibit 3, from fiscal 2011 to 2012, BWI Marshall Airport’s CPE increased
slightly from $9.18 to $9.29. MAA projects that its CPE will increase slightly in fiscal 2013 before
decreasing, as passenger growth increases in fiscal 2014 while airline costs decrease. Following a
substantial increase in the average CPE at other regional airports, BWI Marshall Airport remains well
below the fiscal 2012 average of $15.49. Regional airports are the airports that BWI Marshall
Airport is in direct competition with – Reagan National Airport, Dulles Airport, and Philadelphia
International Airport. The estimated CPE in fiscal 2014 is $9.15, which is less than the fiscal 2009
level of $9.28. DLS recommends that MAA discuss how it has been able to keep the CPE so low
compared to other regional airports.
Exhibit 3
Cost and Revenue Per Enplaned Passenger Fiscal 2008-2014
2008 2009 2010
2011
2012
Est.
2013
Est.
2014
Cost Per Enplaned Passenger
BWI Marshall Airport $7.75 $9.28 $9.39 $9.18 $9.29 $9.35 $9.15
Regional Airports Average 10.05 11.53 13.31 15.15 15.49 16.83 17.54
Non-airline Revenue Per Enplaned Passenger
BWI Marshall Airport 10.18 10.03 10.09 10.31 10.13 10.06 9.53
Regional Airports Average 11.35 9.59 10.86 10.80 – – –
BWI Marshall Airport: Baltimore Washington International Thurgood Marshall Airport
Note: Actual data for fiscal 2012 for regional airports is not yet available. The amount shown as the fiscal 2012 cost per
enplaned passenger is an estimate only. Cost projections beyond fiscal 2013 and projections of revenues for regional
airports are not available.
Source: Maryland Aviation Administration
J00I00 – MDOT – Maryland Aviation Administration
Analysis of the FY 2014 Maryland Executive Budget, 2013 9
Also shown in Exhibit 3, BWI Marshall Airport’s non-airline RPE declined slightly in
fiscal 2012 to $10.13. Slight declines are expected in fiscal 2013 and 2014 due to the increase in
passengers.
4. Financial Results
Unlike most other State agencies that rely solely on the State for all support, MAA receives
operating revenues that help offset its expenditures. Its profitability determines how much the
Transportation Trust Fund (TTF) must provide as a subsidy. Although MAA’s revenues have
typically covered its operating expenses, MAA relies on the TTF or other non-MAA financing
mechanisms to fund its capital program.
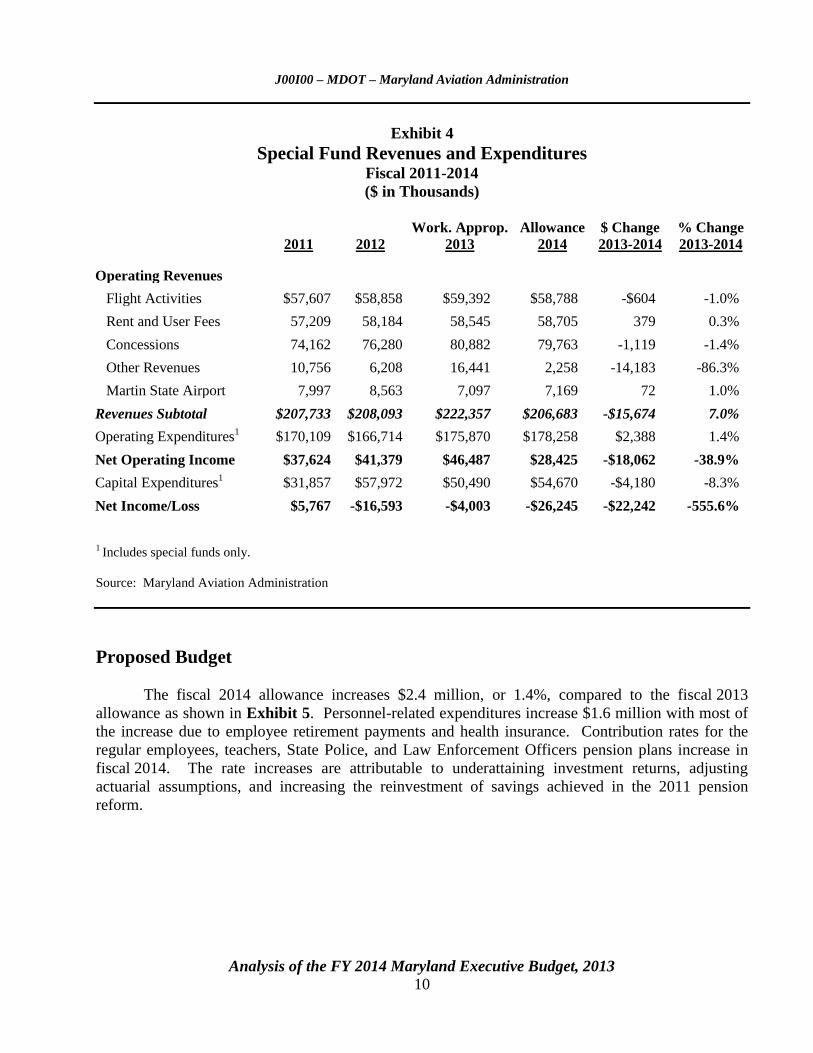
Exhibit 4 shows MAA’s special fund revenues and expenditures. In fiscal 2011, MAA
generated enough revenue to cover both its operating and capital costs. This is not a common
occurrence and is largely due to MAA limiting its operating budget growth. It should be noted that in
fiscal 2013, there is a large increase in other revenue related to a repayment to the TTF for funding
that was used to move the runway safety projects forward, which results in revenues covering
expenditures. This one-time revenue helps to reduce the overall funding deficit in fiscal 2013. As
shown, revenue is reduced in fiscal 2014, and an increased shortfall is projected. MAA continues to
cover operating budget costs through the revenues it collects, but net income is projected to decline in
fiscal 2014.
It is important to note that in looking at MAA capital expenditures in a business manner,
consideration should be given to the fact that capital expenditures are often paid for in a single year,
or over multiple years, but depreciation over the life of the asset does not take place. Reimbursement
from the airlines (through the Basic Use and Lease Agreement) actually takes place over 5 to
30 years, meaning that revenues and capital expenditures may not match in a year-to-year
comparison.
J00I00 – MDOT – Maryland Aviation Administration
Analysis of the FY 2014 Maryland Executive Budget, 2013 10
Exhibit 4
Special Fund Revenues and Expenditures Fiscal 2011-2014
($ in Thousands)
2011 2012
Work. Approp.
2013
Allowance
2014
$ Change
2013-2014
% Change
2013-2014
Operating Revenues
Flight Activities $57,607 $58,858 $59,392 $58,788 -$604 -1.0%
Rent and User Fees 57,209 58,184 58,545 58,705 379 0.3%
Concessions 74,162 76,280 80,882 79,763 -1,119 -1.4%
Other Revenues 10,756 6,208 16,441 2,258 -14,183 -86.3%
Martin State Airport 7,997 8,563 7,097 7,169 72 1.0%
Revenues Subtotal $207,733 $208,093 $222,357 $206,683 -$15,674 7.0%
Operating Expenditures1
$170,109 $166,714 $175,870 $178,258 $2,388 1.4%
Net Operating Income $37,624 $41,379 $46,487 $28,425 -$18,062 -38.9%
Capital Expenditures1
$31,857 $57,972 $50,490 $54,670 -$4,180 -8.3%
Net Income/Loss $5,767 -$16,593 -$4,003 -$26,245 -$22,242 -555.6%
1 Includes special funds only.
Source: Maryland Aviation Administration
Proposed Budget
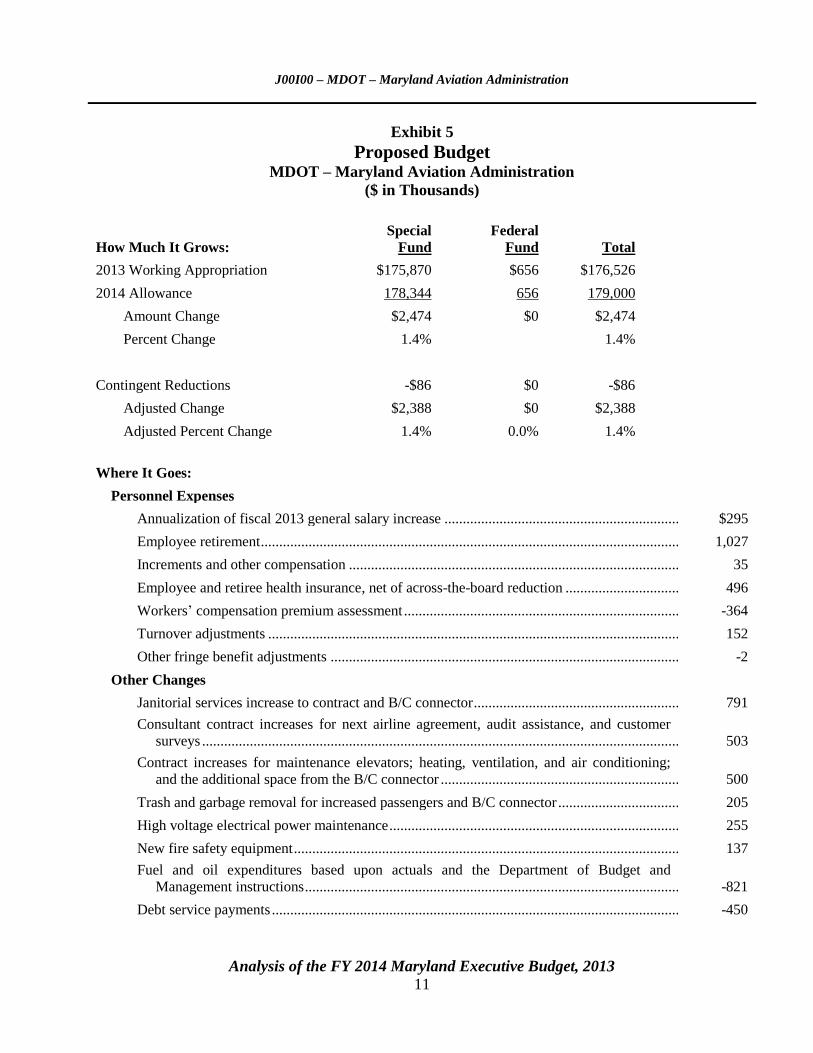
The fiscal 2014 allowance increases $2.4 million, or 1.4%, compared to the fiscal 2013
allowance as shown in Exhibit 5. Personnel-related expenditures increase $1.6 million with most of
the increase due to employee retirement payments and health insurance. Contribution rates for the
regular employees, teachers, State Police, and Law Enforcement Officers pension plans increase in
fiscal 2014. The rate increases are attributable to underattaining investment returns, adjusting
actuarial assumptions, and increasing the reinvestment of savings achieved in the 2011 pension
reform.
J00I00 – MDOT – Maryland Aviation Administration
Analysis of the FY 2014 Maryland Executive Budget, 2013 11
Exhibit 5
Proposed Budget MDOT – Maryland Aviation Administration
($ in Thousands)
How Much It Grows:
Special
Fund
Federal
Fund
Total
2013 Working Appropriation $175,870 $656 $176,526
2014 Allowance 178,344 656 179,000
Amount Change $2,474 $0 $2,474
Percent Change 1.4% 1.4%
Contingent Reductions -$86 $0 -$86
Adjusted Change $2,388 $0 $2,388
Adjusted Percent Change 1.4% 0.0% 1.4%
Where It Goes:
Personnel Expenses
Annualization of fiscal 2013 general salary increase ................................................................... $295
Employee retirement ..................................................................................................................... 1,027
Increments and other compensation ............................................................................................. 35
Employee and retiree health insurance, net of across-the-board reduction .................................. 496
Workers’ compensation premium assessment .............................................................................. -364
Turnover adjustments ................................................................................................................... 152
Other fringe benefit adjustments .................................................................................................. -2
Other Changes
Janitorial services increase to contract and B/C connector ........................................................... 791
Consultant contract increases for next airline agreement, audit assistance, and customer
surveys ..................................................................................................................................... 503
Contract increases for maintenance elevators; heating, ventilation, and air conditioning;
and the additional space from the B/C connector .................................................................... 500
Trash and garbage removal for increased passengers and B/C connector .................................... 205
High voltage electrical power maintenance .................................................................................. 255
New fire safety equipment ............................................................................................................ 137
Fuel and oil expenditures based upon actuals and the Department of Budget and
Management instructions ......................................................................................................... -821
Debt service payments .................................................................................................................. -450
J00I00 – MDOT – Maryland Aviation Administration
Analysis of the FY 2014 Maryland Executive Budget, 2013 12
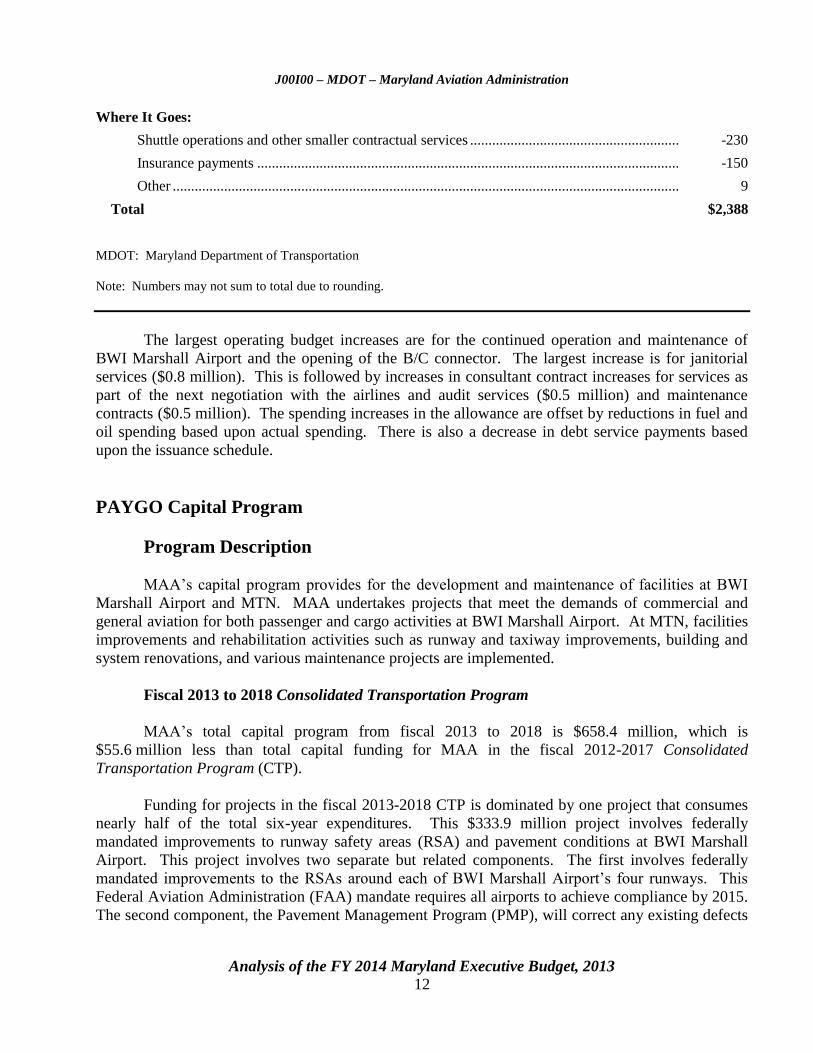
Where It Goes:
Shuttle operations and other smaller contractual services ............................................................ -230
Insurance payments ...................................................................................................................... -150
Other ............................................................................................................................................. 9
Total $2,388
MDOT: Maryland Department of Transportation
Note: Numbers may not sum to total due to rounding.
The largest operating budget increases are for the continued operation and maintenance of
BWI Marshall Airport and the opening of the B/C connector. The largest increase is for janitorial
services ($0.8 million). This is followed by increases in consultant contract increases for services as
part of the next negotiation with the airlines and audit services ($0.5 million) and maintenance
contracts ($0.5 million). The spending increases in the allowance are offset by reductions in fuel and
oil spending based upon actual spending. There is also a decrease in debt service payments based
upon the issuance schedule.
PAYGO Capital Program
Program Description
MAA’s capital program provides for the development and maintenance of facilities at BWI
Marshall Airport and MTN. MAA undertakes projects that meet the demands of commercial and
general aviation for both passenger and cargo activities at BWI Marshall Airport. At MTN, facilities
improvements and rehabilitation activities such as runway and taxiway improvements, building and
system renovations, and various maintenance projects are implemented.
Fiscal 2013 to 2018 Consolidated Transportation Program
MAA’s total capital program from fiscal 2013 to 2018 is $658.4 million, which is
$55.6 million less than total capital funding for MAA in the fiscal 2012-2017 Consolidated
Transportation Program (CTP).
Funding for projects in the fiscal 2013-2018 CTP is dominated by one project that consumes
nearly half of the total six-year expenditures. This $333.9 million project involves federally
mandated improvements to runway safety areas (RSA) and pavement conditions at BWI Marshall
Airport. This project involves two separate but related components. The first involves federally
mandated improvements to the RSAs around each of BWI Marshall Airport’s four runways. This
Federal Aviation Administration (FAA) mandate requires all airports to achieve compliance by 2015.
The second component, the Pavement Management Program (PMP), will correct any existing defects
J00I00 – MDOT – Maryland Aviation Administration
Analysis of the FY 2014 Maryland Executive Budget, 2013 13
in the surface of the runways, taxiways, and deicing pads at BWI Marshall Airport. Federal
regulations require that airfield pavements are kept free of cracks and surface variations that could
impair the directional control of airplanes.
Fiscal 2013 and 2014 Cash Flow Analysis
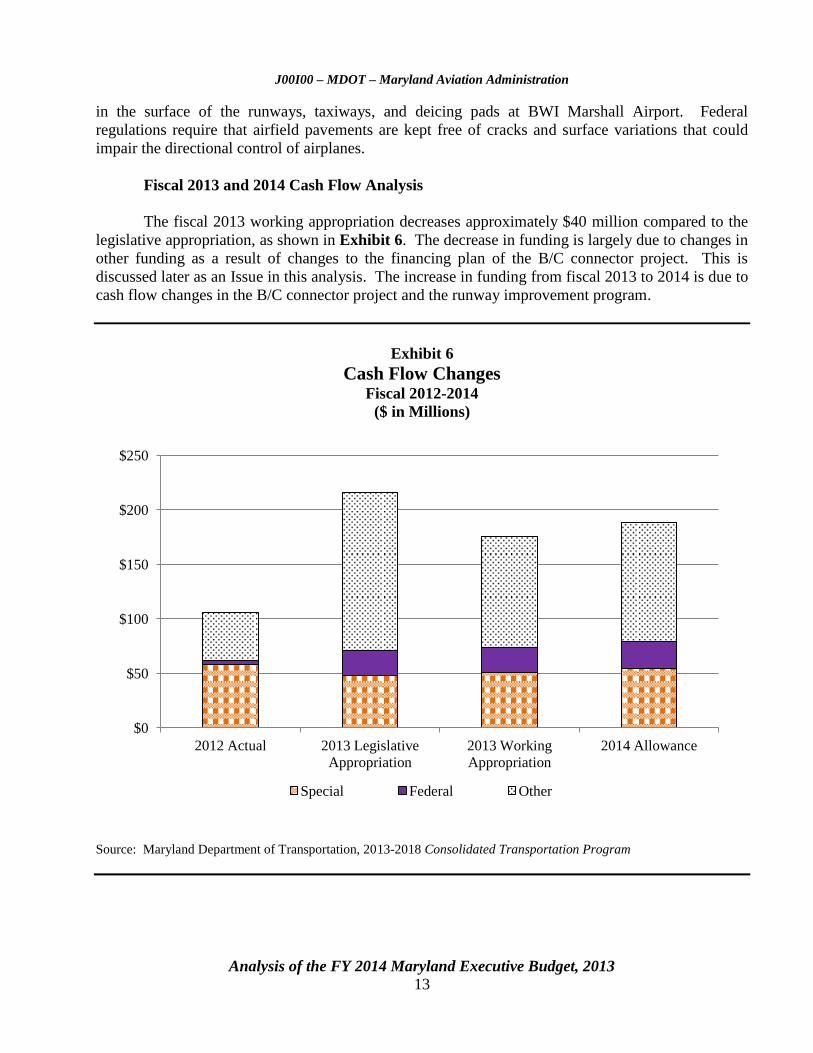
The fiscal 2013 working appropriation decreases approximately $40 million compared to the
legislative appropriation, as shown in Exhibit 6. The decrease in funding is largely due to changes in
other funding as a result of changes to the financing plan of the B/C connector project. This is
discussed later as an Issue in this analysis. The increase in funding from fiscal 2013 to 2014 is due to
cash flow changes in the B/C connector project and the runway improvement program.
Exhibit 6
Cash Flow Changes Fiscal 2012-2014
($ in Millions)
Source: Maryland Department of Transportation, 2013-2018 Consolidated Transportation Program
$0
$50
$100
$150
$200
$250
2012 Actual 2013 Legislative
Appropriation
2013 Working
Appropriation
2014 Allowance
Special Federal Other
J00I00 – MDOT – Maryland Aviation Administration
Analysis of the FY 2014 Maryland Executive Budget, 2013 14
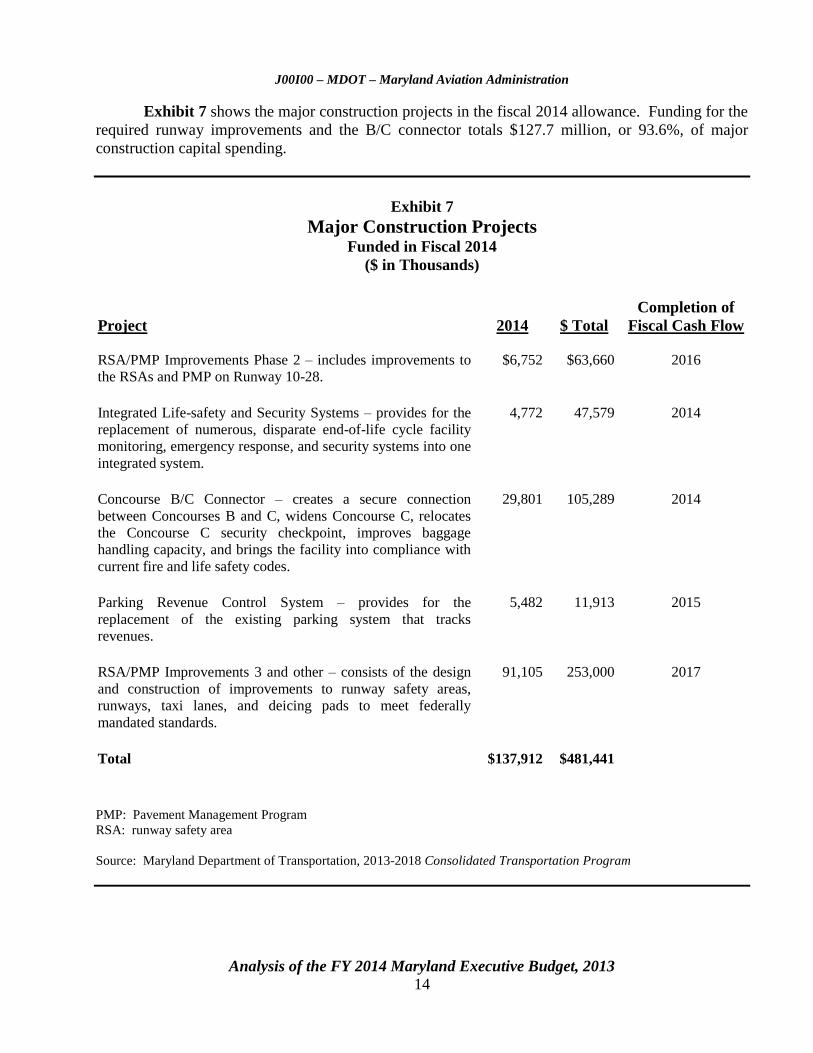
Exhibit 7 shows the major construction projects in the fiscal 2014 allowance. Funding for the
required runway improvements and the B/C connector totals $127.7 million, or 93.6%, of major
construction capital spending.
Exhibit 7
Major Construction Projects Funded in Fiscal 2014
($ in Thousands)
Project 2014 $ Total
Completion of
Fiscal Cash Flow
RSA/PMP Improvements Phase 2 – includes improvements to
the RSAs and PMP on Runway 10-28.
$6,752 $63,660 2016
Integrated Life-safety and Security Systems – provides for the
replacement of numerous, disparate end-of-life cycle facility
monitoring, emergency response, and security systems into one
integrated system.
4,772 47,579 2014
Concourse B/C Connector – creates a secure connection
between Concourses B and C, widens Concourse C, relocates
the Concourse C security checkpoint, improves baggage
handling capacity, and brings the facility into compliance with
current fire and life safety codes.
29,801 105,289 2014
Parking Revenue Control System – provides for the
replacement of the existing parking system that tracks
revenues.
5,482 11,913 2015
RSA/PMP Improvements 3 and other – consists of the design
and construction of improvements to runway safety areas,
runways, taxi lanes, and deicing pads to meet federally
mandated standards.
91,105 253,000 2017
Total $137,912 $481,441
PMP: Pavement Management Program
RSA: runway safety area
Source: Maryland Department of Transportation, 2013-2018 Consolidated Transportation Program
J00I00 – MDOT – Maryland Aviation Administration
Analysis of the FY 2014 Maryland Executive Budget, 2013 15
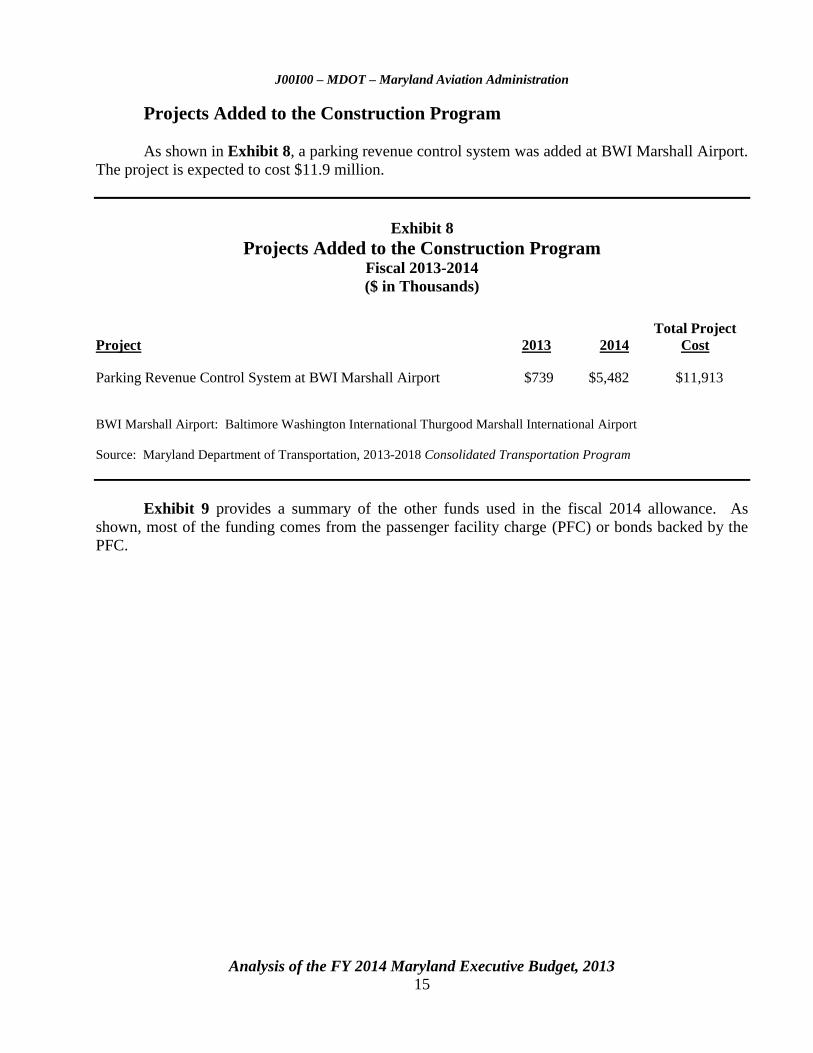
Projects Added to the Construction Program
As shown in Exhibit 8, a parking revenue control system was added at BWI Marshall Airport.
The project is expected to cost $11.9 million.
Exhibit 8
Projects Added to the Construction Program Fiscal 2013-2014
($ in Thousands)
Project 2013 2014
Total Project
Cost
Parking Revenue Control System at BWI Marshall Airport $739 $5,482 $11,913
BWI Marshall Airport: Baltimore Washington International Thurgood Marshall International Airport
Source: Maryland Department of Transportation, 2013-2018 Consolidated Transportation Program
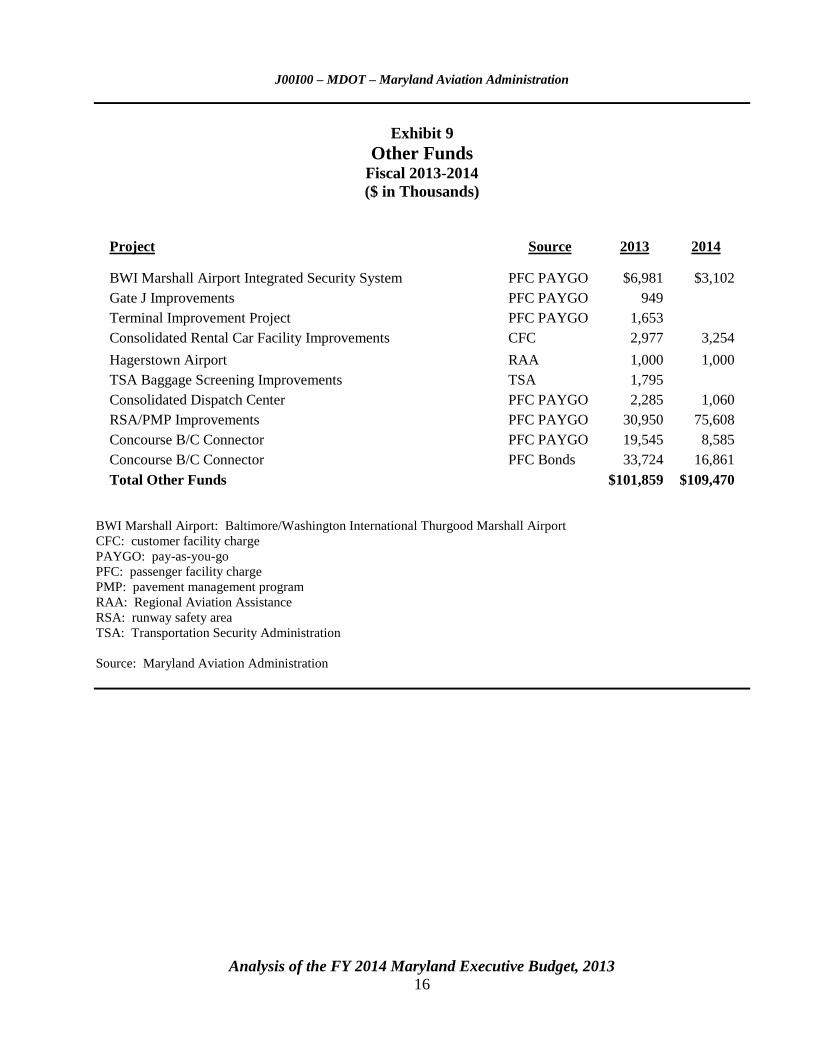
Exhibit 9 provides a summary of the other funds used in the fiscal 2014 allowance. As
shown, most of the funding comes from the passenger facility charge (PFC) or bonds backed by the
PFC.
J00I00 – MDOT – Maryland Aviation Administration
Analysis of the FY 2014 Maryland Executive Budget, 2013 16
Exhibit 9
Other Funds Fiscal 2013-2014
($ in Thousands)
Project Source 2013 2014
BWI Marshall Airport Integrated Security System PFC PAYGO $6,981 $3,102
Gate J Improvements PFC PAYGO 949
Terminal Improvement Project PFC PAYGO 1,653
Consolidated Rental Car Facility Improvements CFC 2,977 3,254
Hagerstown Airport RAA 1,000 1,000
TSA Baggage Screening Improvements TSA 1,795
Consolidated Dispatch Center PFC PAYGO 2,285 1,060
RSA/PMP Improvements PFC PAYGO 30,950 75,608
Concourse B/C Connector PFC PAYGO 19,545 8,585
Concourse B/C Connector PFC Bonds 33,724 16,861
Total Other Funds
$101,859 $109,470
BWI Marshall Airport: Baltimore/Washington International Thurgood Marshall Airport
CFC: customer facility charge
PAYGO: pay-as-you-go
PFC: passenger facility charge
PMP: pavement management program
RAA: Regional Aviation Assistance
RSA: runway safety area
TSA: Transportation Security Administration
Source: Maryland Aviation Administration
J00I00 – MDOT – Maryland Aviation Administration
Analysis of the FY 2014 Maryland Executive Budget, 2013 17
Issues
1. Update on Financing for Major Capital Projects
As noted previously, MAA has two major capital projects underway, which include the
B/C connector and RSA/PMP improvements. Both projects must be completed quickly. The
B/C connector project is necessary to improve the flow of passengers and respond to business
demand, and the RSA/PMP project is federally mandated to be completed by 2015.
Both projects are eligible for PFC funding, but sufficient pay-as-you-go revenues were not
available to fund these projects in the required timeframe. PFCs are a federally authorized fee of up
to $4.50 per enplaned passenger imposed by commercial airports. PFC revenues are retained by the
airport that imposed them and are used to fund airport improvement projects approved by FAA.
MAA explored various options to issue PFC-backed bonds for the projects.
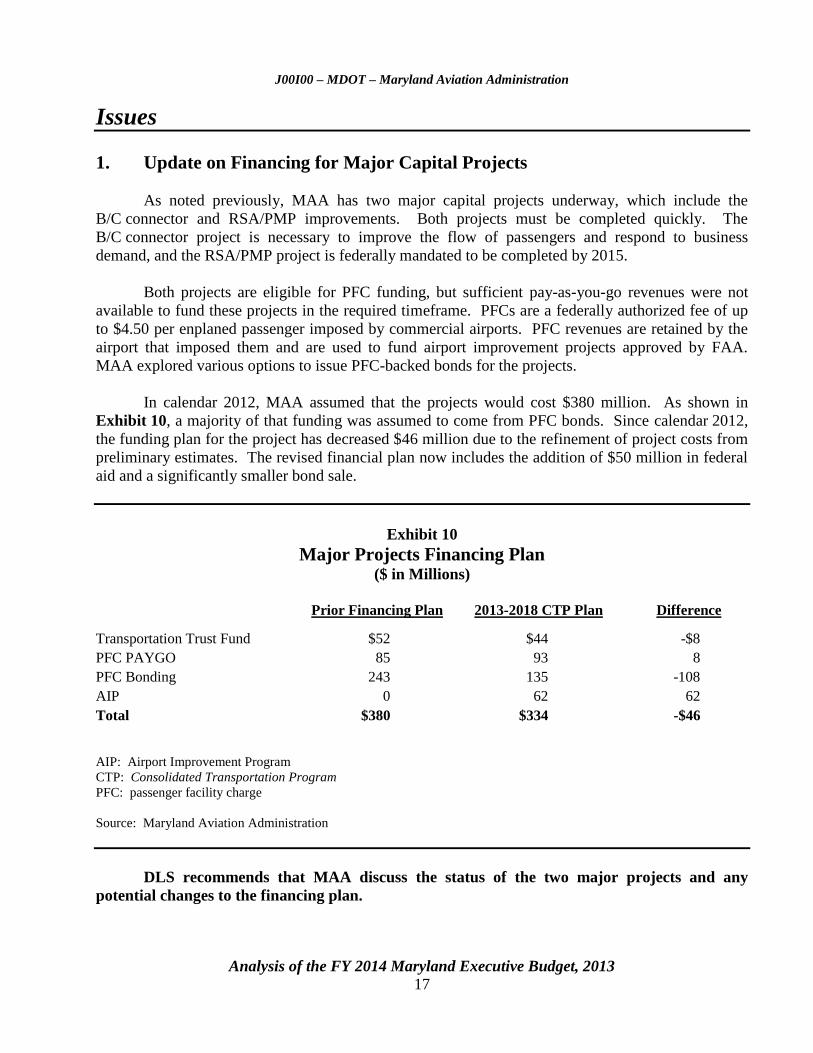
In calendar 2012, MAA assumed that the projects would cost $380 million. As shown in
Exhibit 10, a majority of that funding was assumed to come from PFC bonds. Since calendar 2012,
the funding plan for the project has decreased $46 million due to the refinement of project costs from
preliminary estimates. The revised financial plan now includes the addition of $50 million in federal
aid and a significantly smaller bond sale.
Exhibit 10
Major Projects Financing Plan ($ in Millions)
Prior Financing Plan 2013-2018 CTP Plan Difference
Transportation Trust Fund $52 $44 -$8
PFC PAYGO 85 93 8
PFC Bonding 243 135 -108
AIP 0 62 62
Total $380 $334 -$46
AIP: Airport Improvement Program
CTP: Consolidated Transportation Program
PFC: passenger facility charge
Source: Maryland Aviation Administration
DLS recommends that MAA discuss the status of the two major projects and any
potential changes to the financing plan.
J00I00 – MDOT – Maryland Aviation Administration
Analysis of the FY 2014 Maryland Executive Budget, 2013 18
Operating Budget Recommended Actions
1. Concur with Governor’s allowance.
J00I00 – MDOT – Maryland Aviation Administration
Analysis of the FY 2014 Maryland Executive Budget, 2013 19
PAYGO Budget Recommended Actions
1. Concur with Governor’s allowance.
J00I00 – MDOT – Maryland Aviation Administration
Analysis of the FY 2014 Maryland Executive Budget, 2013 20
Updates
1. Ambulance Transport Fee Update
A previous DLS analysis found that many jurisdictions in Maryland charge an ambulance
transport fee; however, the BWI Fire and Rescue Department (BWI FRD) did not. In calendar 2011,
roughly 30% of all BWI FRD service calls occurred in counties where it had a mutual aid agreement.
In response to a request in the 2011 Joint Chairmen’s Report, MAA conducted a survey of other fire
departments and concluded that establishing an ambulance transport fee is feasible; however,
consideration should be given to whether or not the amount of additional revenue raised outweighs
the potential negative public perception of such a fee and the complexity of the procurement process.
Chapter 1 of the First Special Session of 2012 included a provision that required the
BWI FRD to charge an ambulance transport fee, similar to other fire departments, to any individual
transported to a hospital from property owned by MAA or property subject to a mutual aid
agreement. Furthermore, MAA is to adopt regulations to establish the ambulance transport fee
amount and to administer the collection of the fee. This would also include regulations on the waiver
of the fee due to financial hardship and acceptance of reduced payments by commercial insurers
amongst other things.
MAA has drafted a proposed regulation relating to the ambulance fee which will be presented
to the Maryland Aviation Commission for approval in January 2013 and will then be submitted to the
MAA Executive Director and then to the Joint Committee on Administrative, Executive, and
Legislative Review. The regulations propose a $500 ambulance fee, and any fee uncollected would
be referred to the Central Collection Unit.
J00I00 – MDOT – Maryland Aviation Administration
Analysis of the FY 2014 Maryland Executive Budget, 2013 21
Appendix 1
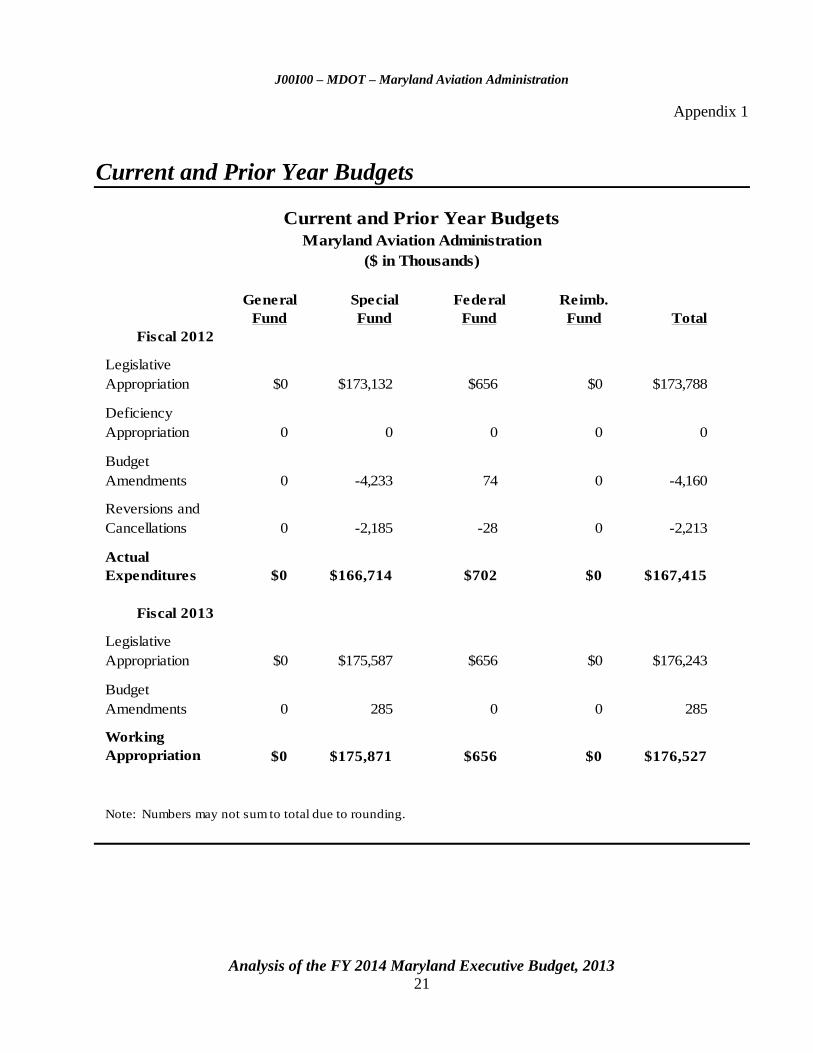
Current and Prior Year Budgets
Fiscal 2012
Legislative
Appropriation $0 $173,132 $656 $0 $173,788
Deficiency
Appropriation 0 0 0 0 0
Budget
Amendments 0 -4,233 74 0 -4,160
Reversions and
Cancellations 0 -2,185 -28 0 -2,213
Actual
Expenditures $0 $166,714 $702 $0 $167,415
Fiscal 2013
Legislative
Appropriation $0 $175,587 $656 $0 $176,243
Budget
Amendments 0 285 0 0 285
Working
Appropriation $0 $175,871 $656 $0 $176,527
Current and Prior Year Budgets
Fund FundFund
Reimb.
Fund Total
($ in Thousands)
Maryland Aviation Administration
General Special Federal
Note: Numbers may not sum to total due to rounding.
J00I00 – MDOT – Maryland Aviation Administration
Analysis of the FY 2014 Maryland Executive Budget, 2013 22
Fiscal 2012
Fiscal 2012 actual expenditures totaled $167.4 million and were $6.4 million less than the
legislative appropriation. Special fund budget amendments reduced the appropriation by a net of
$4.2 million. There was a $0.3 million increase to fund the one-time $750 bonus to State employees.
Reductions included $4.4 million transferred from the operating budget to the capital budget due to
the mild winter and $0.1 million due to the availability of federal funds for the K9 detection team.
Special fund cancellations totaled approximately $2.2 million due to savings in health
insurance, contractual services, and utilities.
Federal fund spending increased $0.1 million due to additional federal funds for the K9
detection unit, but federal fund cancellations totaled less than $0.1 million due to federal fund grants
not being spent as planned.
Fiscal 2013
The fiscal 2013 working appropriation increases $283,582 to fund the cost-of-living
adjustment for State employees.
J00I00 – MDOT – Maryland Aviation Administration
Analysis of the FY 2014 Maryland Executive Budget, 2013 23
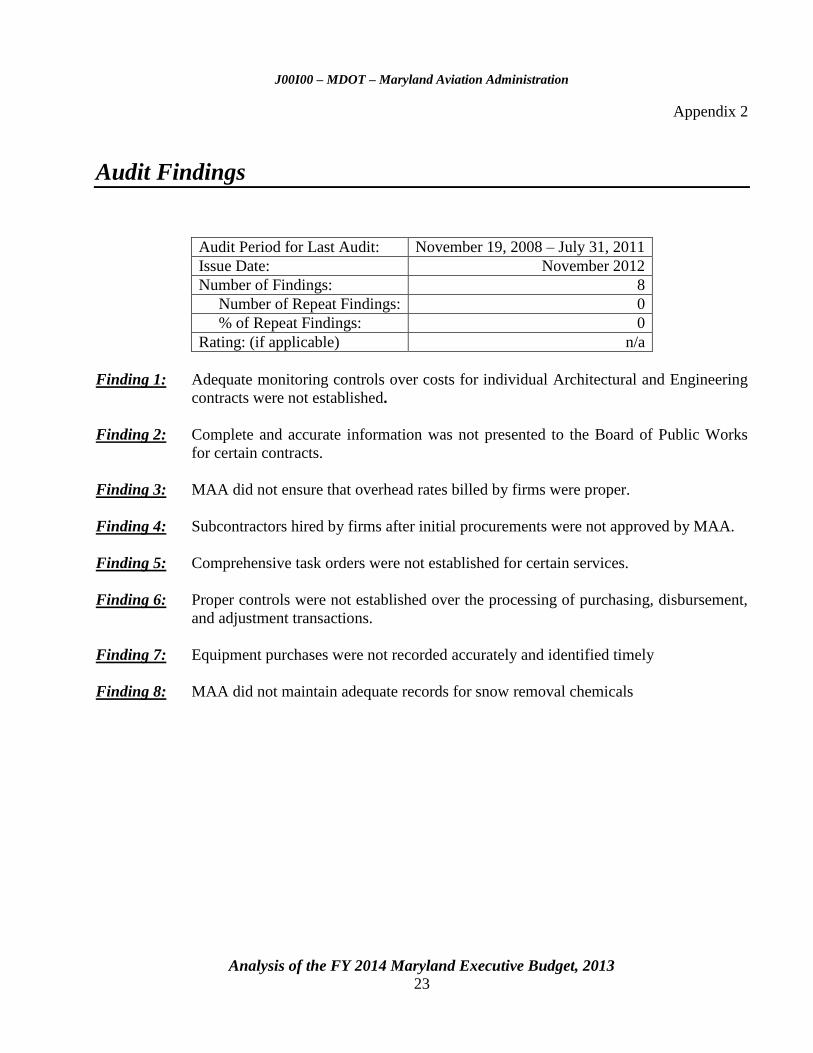
Appendix 2
Audit Findings
Audit Period for Last Audit: November 19, 2008 – July 31, 2011
Issue Date: November 2012
Number of Findings: 8
Number of Repeat Findings: 0
% of Repeat Findings: 0
Rating: (if applicable) n/a
Finding 1: Adequate monitoring controls over costs for individual Architectural and Engineering
contracts were not established.
Finding 2: Complete and accurate information was not presented to the Board of Public Works
for certain contracts.
Finding 3: MAA did not ensure that overhead rates billed by firms were proper.
Finding 4: Subcontractors hired by firms after initial procurements were not approved by MAA.
Finding 5: Comprehensive task orders were not established for certain services.
Finding 6: Proper controls were not established over the processing of purchasing, disbursement,
and adjustment transactions.
Finding 7: Equipment purchases were not recorded accurately and identified timely
Finding 8: MAA did not maintain adequate records for snow removal chemicals
An
alysis o
f the F
Y 2
014 M
aryla
nd E
xecu
tive Bu
dget, 2
013
24
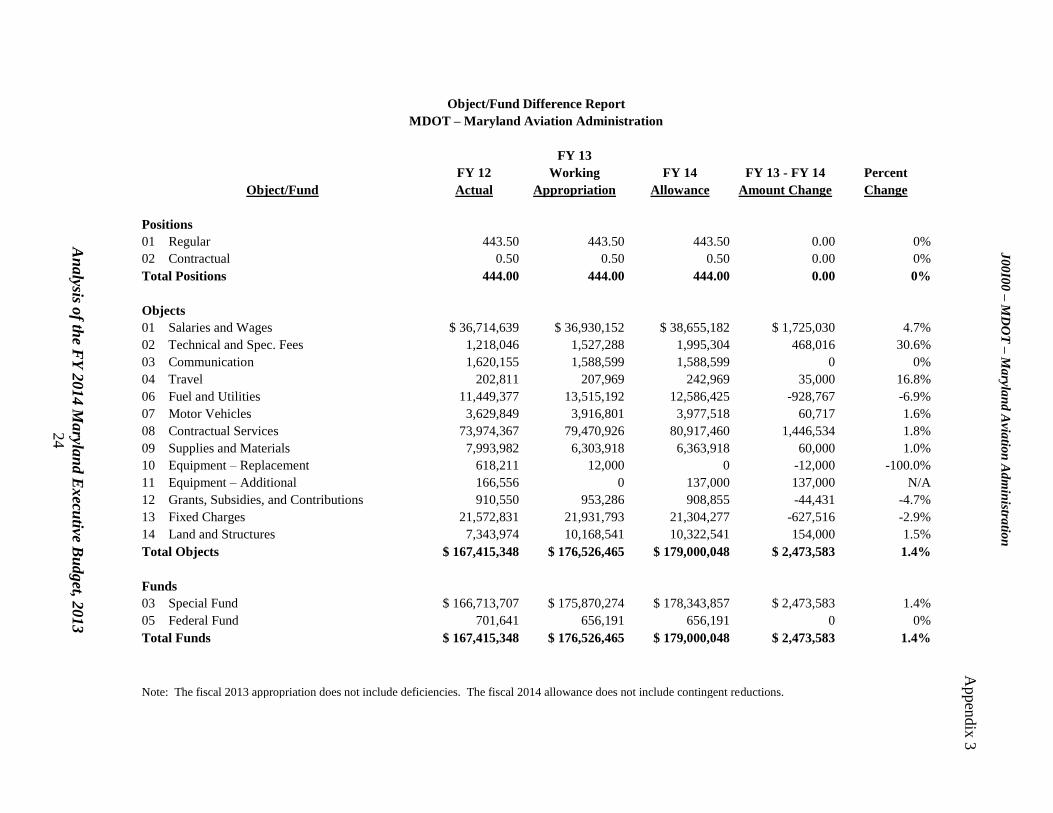
Object/Fund Difference Report
MDOT – Maryland Aviation Administration
FY 13
FY 12 Working FY 14 FY 13 - FY 14 Percent
Object/Fund Actual Appropriation Allowance Amount Change Change
Positions
01 Regular 443.50 443.50 443.50 0.00 0%
02 Contractual 0.50 0.50 0.50 0.00 0%
Total Positions 444.00 444.00 444.00 0.00 0%
Objects
01 Salaries and Wages $ 36,714,639 $ 36,930,152 $ 38,655,182 $ 1,725,030 4.7%
02 Technical and Spec. Fees 1,218,046 1,527,288 1,995,304 468,016 30.6%
03 Communication 1,620,155 1,588,599 1,588,599 0 0%
04 Travel 202,811 207,969 242,969 35,000 16.8%
06 Fuel and Utilities 11,449,377 13,515,192 12,586,425 -928,767 -6.9%
07 Motor Vehicles 3,629,849 3,916,801 3,977,518 60,717 1.6%
08 Contractual Services 73,974,367 79,470,926 80,917,460 1,446,534 1.8%
09 Supplies and Materials 7,993,982 6,303,918 6,363,918 60,000 1.0%
10 Equipment – Replacement 618,211 12,000 0 -12,000 -100.0%
11 Equipment – Additional 166,556 0 137,000 137,000 N/A
12 Grants, Subsidies, and Contributions 910,550 953,286 908,855 -44,431 -4.7%
13 Fixed Charges 21,572,831 21,931,793 21,304,277 -627,516 -2.9%
14 Land and Structures 7,343,974 10,168,541 10,322,541 154,000 1.5%
Total Objects $ 167,415,348 $ 176,526,465 $ 179,000,048 $ 2,473,583 1.4%
Funds
03 Special Fund $ 166,713,707 $ 175,870,274 $ 178,343,857 $ 2,473,583 1.4%
05 Federal Fund 701,641 656,191 656,191 0 0%
Total Funds $ 167,415,348 $ 176,526,465 $ 179,000,048 $ 2,473,583 1.4%
Note: The fiscal 2013 appropriation does not include deficiencies. The fiscal 2014 allowance does not include contingent reductions.
J0
0I0
0 –
MD
OT
– M
aryla
nd
Avia
tion
Ad
min
istratio
n
Appen
dix
3
An
alysis o
f the F
Y 2
014 M
aryla
nd E
xecu
tive Bu
dget, 2
013
25
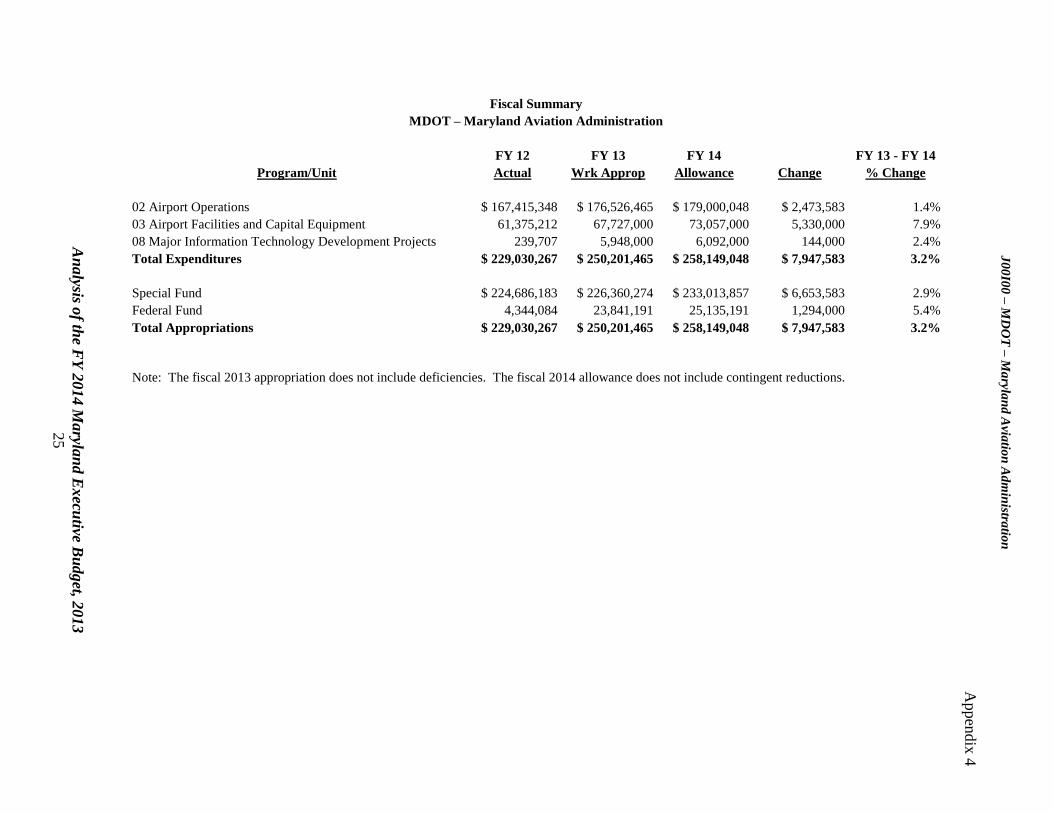
Fiscal Summary
MDOT – Maryland Aviation Administration
FY 12 FY 13 FY 14 FY 13 - FY 14
Program/Unit Actual Wrk Approp Allowance Change % Change
02 Airport Operations $ 167,415,348 $ 176,526,465 $ 179,000,048 $ 2,473,583 1.4%
03 Airport Facilities and Capital Equipment 61,375,212 67,727,000 73,057,000 5,330,000 7.9%
08 Major Information Technology Development Projects 239,707 5,948,000 6,092,000 144,000 2.4%
Total Expenditures $ 229,030,267 $ 250,201,465 $ 258,149,048 $ 7,947,583 3.2%
Special Fund $ 224,686,183 $ 226,360,274 $ 233,013,857 $ 6,653,583 2.9%
Federal Fund 4,344,084 23,841,191 25,135,191 1,294,000 5.4%
Total Appropriations $ 229,030,267 $ 250,201,465 $ 258,149,048 $ 7,947,583 3.2%
Note: The fiscal 2013 appropriation does not include deficiencies. The fiscal 2014 allowance does not include contingent reductions.
J0
0I0
0 –
MD
OT
– M
aryla
nd
Avia
tion
Ad
min
istratio
n
Appen
dix
4
J00I00 – MDOT – Maryland Aviation Administration
Analysis of the FY 2014 Maryland Executive Budget, 2013 26
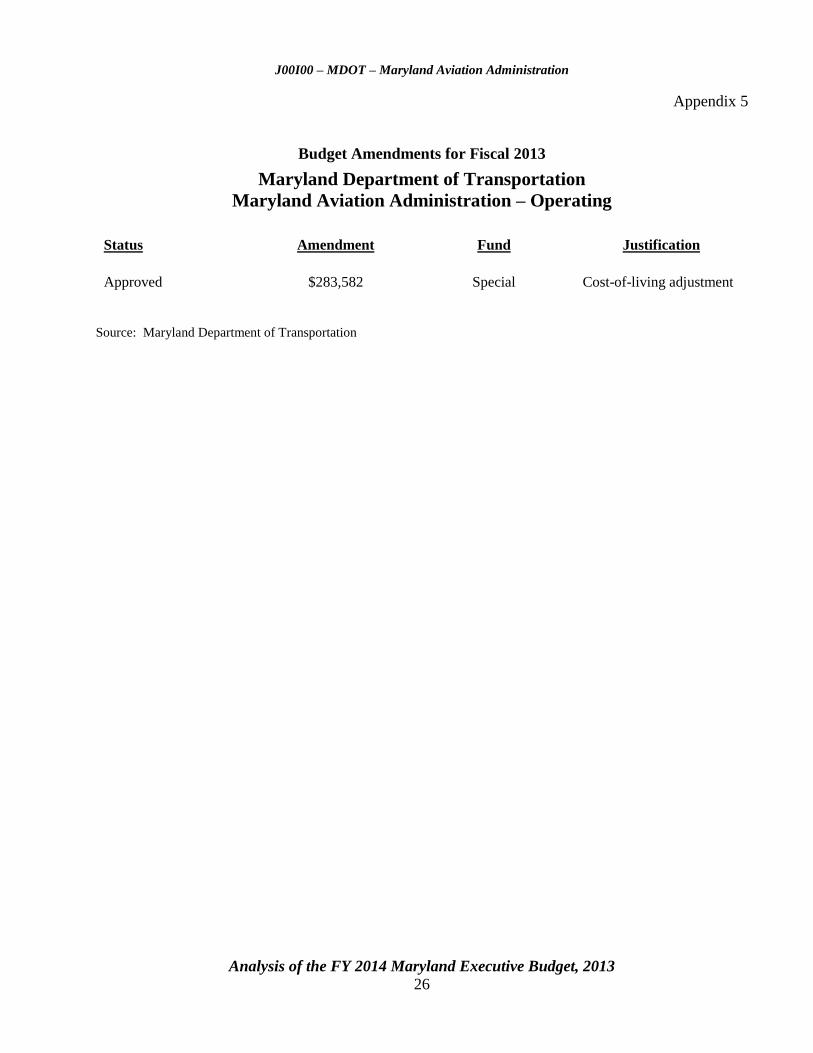
Appendix 5
Budget Amendments for Fiscal 2013
Maryland Department of Transportation
Maryland Aviation Administration – Operating
Status Amendment Fund Justification
Approved $283,582 Special Cost-of-living adjustment
Source: Maryland Department of Transportation
J00I00 – MDOT – Maryland Aviation Administration
Analysis of the FY 2014 Maryland Executive Budget, 2013 27
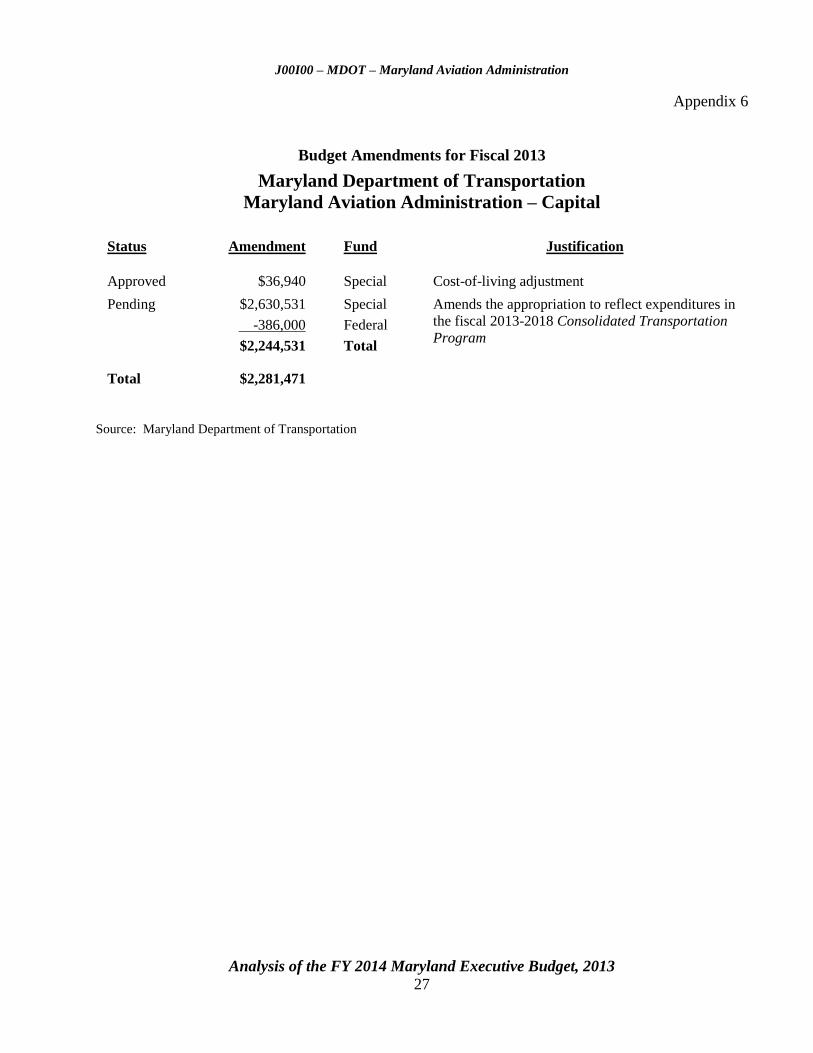
Appendix 6
Budget Amendments for Fiscal 2013
Maryland Department of Transportation
Maryland Aviation Administration – Capital
Status Amendment Fund Justification
Approved $36,940 Special Cost-of-living adjustment
Pending $2,630,531
-386,000
$2,244,531
Special
Federal
Total
Amends the appropriation to reflect expenditures in
the fiscal 2013-2018 Consolidated Transportation
Program
Total $2,281,471
Source: Maryland Department of Transportation