Embed Size (px)
Citation preview

Advanced Engineering Informatics 25 (2011) 162–176
Contents lists available at ScienceDirect
Advanced Engineering Informatics
journal homepage: www.elsevier .com/ locate /ae i
Ontology-based customer preference modeling for concept generation
Dongxing Cao a,c,*, Zhanjun Li b, Karthik Ramani c
a Department of Mechanical Engineering, Hebei University of Technology, Tianjin, Chinab EaglePicher Medical Power, Plano, TX, USAc School of Mechanical Engineering, Purdue University, West Lafayette, IN, USA
a r t i c l e i n f o
Article history:Received 2 November 2009Received in revised form 16 May 2010Accepted 19 July 2010Available online 19 August 2010
Keywords:OntologyDesign semanticsDesign informationCustomer preferenceConcepts
1474-0346/$ - see front matter � 2010 Elsevier Ltd. Adoi:10.1016/j.aei.2010.07.007
* Corresponding author. Tel.: +86 22 60204935/2716480.
E-mail address: [email protected] (D. Cao).
a b s t r a c t
Customers often present certain preferences relative to the same product, such as function, shape, color,and cost. The ideas in the mind of the customer can be represented by higher level concepts. However,the actual shape, color, and cost embodied in the product can only be viewed as lower-level features.In this paper, a model of preference elicitation from customers is proposed to bridge the gap betweenlow-level features and high-level concepts. First, the attributes of customer preferences are classifiedusing preference taxonomies that we develop. These taxonomies are represented using unstructured doc-uments that are directly collected from customer descriptions. Second, the documents or catalogs ofdesign requirements, containing some textual descriptions and survey reports, are then normalized byusing an ontology-based semantic representation. Some semantic rules are developed to describe thelow-level features of customer preferences to build an ontological knowledge base. Third, customer pref-erences are mapped to domain ontologies for driving high-level concept generation. A customer prefer-ence modeling framework is developed to construct a vector space model to measure the similaritybetween two preference concept ontologies. Finally, an empirical study is implemented, and five differentcustomer groups are surveyed about the cell phone preferences. The query results are analyzed to deeplyunderstand the validity of concept generation from the customer preferences.
� 2010 Elsevier Ltd. All rights reserved.
1. Introduction
In today’s rapidly changing market, demand for a product whichdetermines an enterprise strategy is often influenced by customerpreferences [10]. Customers definitely exhibit heterogeneity intheir preferences and buying behavior relative to the same product[21]. However, the ideas in the minds of customers are always flex-ible, and they do not know what exactly they want until they see it[43]. As there is no fixed benchmark in their mind, they are not al-ways satisfied with the existing products. Furthermore, the ambi-guities of some terms or phrases cannot exactly describe thepreferences corresponding to their minds, which make productdevelopment very challenging. In these cases, a virtual preferencemodel is imagined by the product designers to elicit feedback fromthe customers. Although the intention of a customer is a very sub-jective issue based on high-level concepts, many people often havesimilar preferences for the same type of products. Therefore, it isnecessary to build a framework that captures customer prefer-ences and guides the engineers in working towards successfulproduct development. However, the existing approaches, such as
ll rights reserved.
42; fax: +86 10 950507 to
West et al. [40], Ji et al. [17], Orsborn et al. [32], and Erin et al.[14], mainly depend on some statistical measures which are oftenbased on low-level features.
A customer’s preferences for a product can be viewed as areflection of his or her inner world. They depend on customers’behavior and intention. Ha [16] developed a customer manage-ment analysis model which tracks customer behavior and predictscustomer behavior patterns. The accuracy of a predictive model isevaluated by using real-world data. Chen et al. [7] concluded thatmulticultural factors are the most important issues for elicitingand managing customer requirements to achieve success in newproduct development. They maintained that product developmentfor an enterprise should focus on ‘‘how customers do it” ratherthan ‘‘what customers do.” In the past decades, the voice of cus-tomers has been widely accepted as a crucial source of input forobtaining design metrics and specifications for product conceptgeneration [8,22]. Traditional methods for concept generation,such as quality function deployment (QFD) and the house of qual-ity, mainly focused on special groups, product surveys, and envi-ronmentally-friendly studies to assess customer needs [15]. Alsothe psychographic activities still affect customers’ interest in spe-cific product preferences. Erin et al. [14] modeled a frameworkfor understanding preference inconstancies by studying behaviorpsychology and gave three examples of preference inconsistencies.
D. Cao et al. / Advanced Engineering Informatics 25 (2011) 162–176 163
For example, some customers may only like the communicationfunction of the cell phone, while others may like it to have a cam-era function or receive part of its performances and attributes. Dueto the varieties of the preferences of different customers, it is diffi-cult to exactly put a product on the market. Our development of aflexible representation of high-level customer preferences allowsfor rapid feedback from the customers towards product develop-ment and enables a more dynamic product development strategy.
Ontology-based information retrieval has been successfully ap-plied to semantic indexing [6,22]. A large amount of product infor-mation is described through using the design documents, such asusers’ requirements, customer dialogs, survey reports, etc. At thesame time, the concepts of customer preferences hide within thesedocuments. How to extract customer preference information isessential to achieve success in new product development. How-ever, few studies exist that focus on customer preference modelingthrough ontology information retrieval. Thus, a theoretical proto-type that concentrates on customer preference modeling is neededat the earliest stages of product design. We will attempt to build anew model that addresses this issue by including ontology-basedinformation retrieval. The rest of this paper is organized as follows.In Section 2, we review related work. In Section 3, we introduce theresearched approach and ontology modeling for customer prefer-ences in this context. In Section 4, the elicitation techniques of cus-tomer preferences are obtained. The process of preferencesemantic extraction is described in Section 5. In Section 6, we givea detailed description of the prototype and show how our ontol-ogy-based model compares with the traditional keyword-basedsearch techniques. An empirical study is presented in Section 7. Fi-nally, in Section 8, we present the conclusions and discussions.
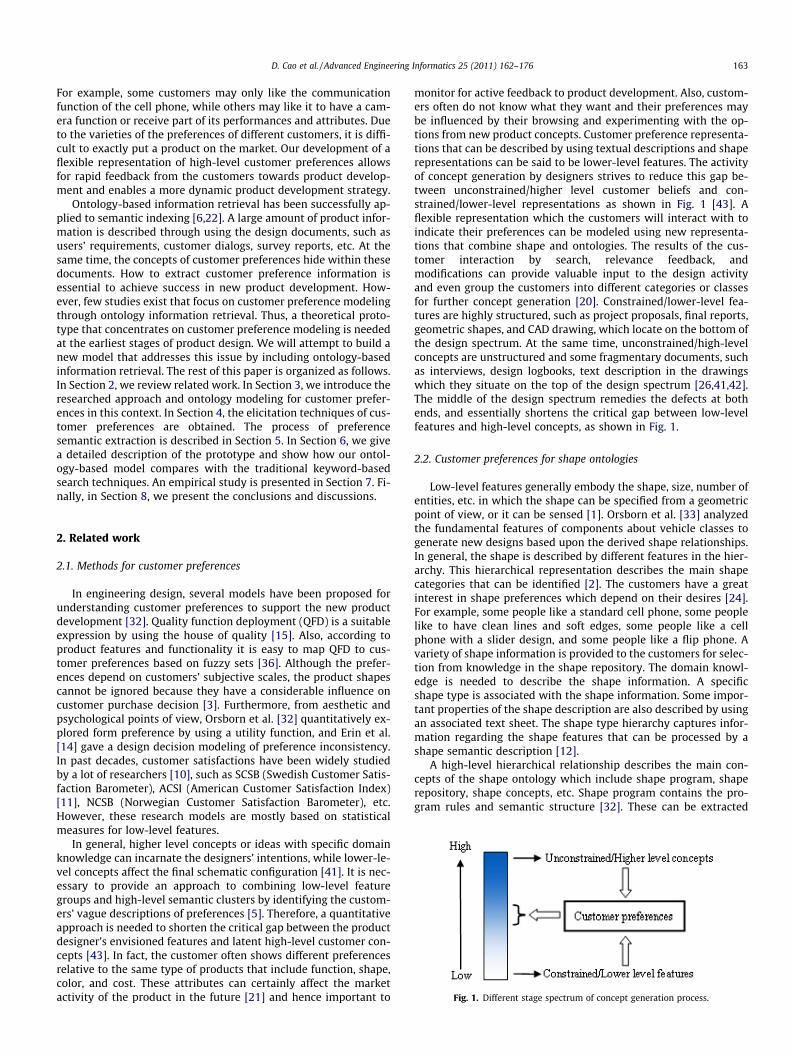
Fig. 1. Different stage spectrum of concept generation process.
2. Related work
2.1. Methods for customer preferences
In engineering design, several models have been proposed forunderstanding customer preferences to support the new productdevelopment [32]. Quality function deployment (QFD) is a suitableexpression by using the house of quality [15]. Also, according toproduct features and functionality it is easy to map QFD to cus-tomer preferences based on fuzzy sets [36]. Although the prefer-ences depend on customers’ subjective scales, the product shapescannot be ignored because they have a considerable influence oncustomer purchase decision [3]. Furthermore, from aesthetic andpsychological points of view, Orsborn et al. [32] quantitatively ex-plored form preference by using a utility function, and Erin et al.[14] gave a design decision modeling of preference inconsistency.In past decades, customer satisfactions have been widely studiedby a lot of researchers [10], such as SCSB (Swedish Customer Satis-faction Barometer), ACSI (American Customer Satisfaction Index)[11], NCSB (Norwegian Customer Satisfaction Barometer), etc.However, these research models are mostly based on statisticalmeasures for low-level features.
In general, higher level concepts or ideas with specific domainknowledge can incarnate the designers’ intentions, while lower-le-vel concepts affect the final schematic configuration [41]. It is nec-essary to provide an approach to combining low-level featuregroups and high-level semantic clusters by identifying the custom-ers’ vague descriptions of preferences [5]. Therefore, a quantitativeapproach is needed to shorten the critical gap between the productdesigner’s envisioned features and latent high-level customer con-cepts [43]. In fact, the customer often shows different preferencesrelative to the same type of products that include function, shape,color, and cost. These attributes can certainly affect the marketactivity of the product in the future [21] and hence important to
monitor for active feedback to product development. Also, custom-ers often do not know what they want and their preferences maybe influenced by their browsing and experimenting with the op-tions from new product concepts. Customer preference representa-tions that can be described by using textual descriptions and shaperepresentations can be said to be lower-level features. The activityof concept generation by designers strives to reduce this gap be-tween unconstrained/higher level customer beliefs and con-strained/lower-level representations as shown in Fig. 1 [43]. Aflexible representation which the customers will interact with toindicate their preferences can be modeled using new representa-tions that combine shape and ontologies. The results of the cus-tomer interaction by search, relevance feedback, andmodifications can provide valuable input to the design activityand even group the customers into different categories or classesfor further concept generation [20]. Constrained/lower-level fea-tures are highly structured, such as project proposals, final reports,geometric shapes, and CAD drawing, which locate on the bottom ofthe design spectrum. At the same time, unconstrained/high-levelconcepts are unstructured and some fragmentary documents, suchas interviews, design logbooks, text description in the drawingswhich they situate on the top of the design spectrum [26,41,42].The middle of the design spectrum remedies the defects at bothends, and essentially shortens the critical gap between low-levelfeatures and high-level concepts, as shown in Fig. 1.
2.2. Customer preferences for shape ontologies
Low-level features generally embody the shape, size, number ofentities, etc. in which the shape can be specified from a geometricpoint of view, or it can be sensed [1]. Orsborn et al. [33] analyzedthe fundamental features of components about vehicle classes togenerate new designs based upon the derived shape relationships.In general, the shape is described by different features in the hier-archy. This hierarchical representation describes the main shapecategories that can be identified [2]. The customers have a greatinterest in shape preferences which depend on their desires [24].For example, some people like a standard cell phone, some peoplelike to have clean lines and soft edges, some people like a cellphone with a slider design, and some people like a flip phone. Avariety of shape information is provided to the customers for selec-tion from knowledge in the shape repository. The domain knowl-edge is needed to describe the shape information. A specificshape type is associated with the shape information. Some impor-tant properties of the shape description are also described by usingan associated text sheet. The shape type hierarchy captures infor-mation regarding the shape features that can be processed by ashape semantic description [12].
A high-level hierarchical relationship describes the main con-cepts of the shape ontology which include shape program, shaperepository, shape concepts, etc. Shape program contains the pro-gram rules and semantic structure [32]. These can be extracted

164 D. Cao et al. / Advanced Engineering Informatics 25 (2011) 162–176
from the text information. Shape repository stores the shapesemantic information and structural information. File informationis used to describe the shape concepts which capture some infor-mation regarding a product or shape associated with the variousshape models stored in the repository. The concept of shape canhelp us obtain the group of shapes that share some common fea-tures. We can map the structure information to the shape features.It is also possible to decompose the shapes into hierarchical chunksor features which can be annotated with text [28]. Shape textsstore information related to a shape, such as its size, material, col-or, etc. The shape description is the main part of shape concept inthe ontology and encapsulates information that is inherent in theshape model. It also constitutes the basic concept of customer pref-erences, which can be extended and defined in the domain ontol-ogies further.
2.3. Customer preferences for semantic ontologies
Concept indexing, rather than character strings, has been themotivation of a large body research in information retrieval[6,29]. An important task is how to extract preference terms fromall kinds of information and how to manage them efficiently [5,26].It is a challenging issue to discover, extract, and manage prefer-ences effectively in the preliminary design stage. A fundamentaldeficiency of current information retrieval methods is precisionproblems in which the meaning of the indexed words is not exactlywhat the customer is seeking [22]. Sometimes, customers can ex-press and describe the same preferences while using differentterms and phrases because of different contexts, different needsor linguistic habits. In fact, individual words provide unreliable evi-dence about the conceptual topic or meaning of a document. Thereare usually many ways to express a given preference concept, sothe literal terms in a customer query may not match those of a rel-evant document. In addition, most words have multiple meanings.Therefore, terms in a customer query will literally match terms indocuments that are not of interest to the customer. To extract pref-erences, we may consider any documents to consist of the scat-tered information that might come from customers’ commentsfor a product. Many semantic concept similarities and statisticalword measurements have been researched [13], and one well-known application tool is WordNet [31], which is an online lexicalreference system used in semantic analysis and text informationextraction across many domains.
3. The proposed approach
3.1. Overview
Product designers always like to extract some useful informa-tion from documents in order to carry out design tasks. As the in-put content from customers are unstructured documents, most ofthem are qualitatively described, such as user requirements, sur-vey reports, transaction data, and customer dialogs. We need anal-ysis to transform them into formal documents. The transformationoperation is to combine qualitative with quantitative aspects.Qualitative transformation is used to characterize design informa-tion of the unstructured arrangement with an abstract manner intoformal documents. This allows product designers to make a trans-formation to improve the concept description according to custom-ers’ requirements. On the other hand, quantitative transformationcan be used to provide a canonical document description, which al-lows designers to easily understand, evaluate, and reuse previousdesign information.
In general, most of the existing information is unstructured doc-uments. These documents need product designers’ analysis in or-
der to extract useful information. At the beginning of design, theoriginal content of preferences from customers, such as from sur-vey reports, transaction data, and customer dialogs, should be fil-tered. A normal design information text or document is used toextract preference information after transformation. Automaticallyextracting semantics from the normalized document requires rec-ognizing the syntactic structure as well as the semantic meaning ofthe text. Linguistic knowledge and domain knowledge are neededto fulfill preference semantic extraction.
To accurately represent the preference semantics in designinformation texts and documents, we need to extract as much rel-evant information as possible. A preference knowledge base is con-structed by analyzing and collecting the varied product preferenceterms. It can be used to evaluate customer preferences for differentproducts. The knowledge base includes the preference lexicon, do-main ontology, semantic rules, and so on. Fig. 2 depicts the sche-matic of the infrastructure of a prototype for design preferenceinformation extraction. Four aspects contents (A, B, C, and D) aredescribed as follows.
First of all, the original material documents from customers,such as user requirements, survey reports, transaction data, etc.are acquired and then transformed into design information textsor documents. We then adopt methods to deal with this unstruc-tured information. Second, some terms and concepts are extractedfrom these documents based on preference semantic structures,such as noun phrases, verb phrases, adverb phrases, and adjectivephrases. They can be effectively represented by using an ontology-based design semantic analysis and information extraction. Theconcepts of customer preferences are classified into different taxo-nomies to acquire the relationships between two concepts further.The specific thesauruses or lexicons are built to capture preferenceconcepts from the preference knowledge base. The ontologyexpression and preference semantic extraction process are de-scribed, and the process of semantic extraction is based on a shal-low natural language process algorithm for the domain ontology.Next, the preference ontology concepts are established after carry-ing out the extraction operation. A concept-document matrix isbuilt for customer preference information retrieval. The extractedalgorithm and the preference concept measures are describedand used for preference ontology modeling. Finally, an empiricalstudy for design preference extraction is introduced and five groupqueries are processed. A prototype system interface is provided toaid the process of preference information retrieval in order to cap-ture and generate the concepts of customer preferences.
3.2. Ontology modeling for customer preferences
Ontology is a formal, explicit specification of a shared conceptu-alization [39], where conceptualization refers to an intended mod-el of the world’s phenomena identified by its concepts and relation.Explicit means that the concepts and relations are explicitly de-fined, while formal means that it can be communicated across peo-ple and computers. Therefore, ontology defines a set ofrepresentational terms we call concepts. They can be describedby adopting the hierarchical correlations or tree structures [19].On the other hand, the taxonomies are only reviewed as conceptclassifications in the hierarchy. It simply links concepts by usingontology relationships.
Most ontology concepts have multiple parents and form thecomplex relations of inheritances. Some concepts share a commongenetic attribute with each other. At present, considering ontologymodeling for customer preferences, there are two main problems:one is the extraction of the semantic concepts by using the prefer-ence words and the other is the document indexing from custom-ers’ requirements. As for the first problem, the key issue is toidentify appropriate preference concepts and build preference

Fig. 2. System architecture of customer preference modeling.
D. Cao et al. / Advanced Engineering Informatics 25 (2011) 162–176 165
lexicon based on customer documents. At the same time, the pre-cision problem of extraction is about the semantic expression em-ployed in customer requests as far as preference term indexingfrom customer documents is concerned. A hierarchical analysisprocess has been used to aggregate preferences in a group usinga pair-wise approach [9]. However, a significant assumption ofthe proposed method is that the decision maker in the group is as-sumed to be equally important. That is, the information is handledequally without any preferences to one of the group membersbeing considered superior to another.
Ontology modeling provides an effective approach to indexingterms/concepts which can be used to match with customer re-quests. However, the taxonomy acquisition of customer prefer-ences of different products is of a certain subjective nature. Theirgeneration is either by brainstorming or by interviewing or dialog-ing with customers. In similar circumstances, we can acquire pref-erence ontologies [26]. Fig. 3 presents the taxonomy of customerpreference ontology, which comes from cell phone handbooks orknowledge resources. For example, cell phone handbooks oftenclassify engineering components which can be clustered into anontology model as concepts and taxonomy in the hierarchy. Eachcomponent is described in detail, including its attributes such as
material, physical, geometric, and functional properties, whichcan easily be identified and mapped to ontologies as well as theircorresponding relationships.
Customer preference ontology includes concepts, taxonomies,and relationships. Each taxonomical concept is acquired from vari-ous engineering knowledge resources. We can adopt terms orphrases to describe the concepts of the taxonomy as well as theirrelationships with other concepts. For example, multimedia belongsto the Function taxonomy of a cell phone. We can represent it asF-MULTIMEDIA, where the prefix of each concept represents the tax-onomy which the concept belongs to. Therefore, the relationshipsare structured between concepts across taxonomies. For example,has_feature (COL-SIVER, SH-KITTY-PHONE), in which COL-SIVERstands for a color concept in the color taxonomy, SH-KITTY-PHONErepresents a shape concept in the shape taxonomy [18,26]. Table 1lists customer preference ontological concepts and acquisition re-sources of a cell phone, in which they include the number of con-cepts corresponding to different taxonomies. The classification oftheir relationships is represented in Table 2.
At present, we have collected 10 taxonomies, 450 documents,312 preference concepts, and 7 types of relationships in customerpreference ontology. The standard worksheets have been devel-

Fig. 3. The taxonomy of preference ontologies.
Table 1Preference ontological concepts and acquisition resources.
Taxonomy No. ofconcepts
Example of concepts Acquisition resources
Function 116 Voice, text, multimedia, memory, chat apps, MP3, internet, digitalcamera, bluetooth, etc.
Collecting function concepts from http://www.ssrnarena.com andthe other websites
Environment 6 Radiation protection, man–machine friendly, recycle, health risk,etc.
Environmental concepts based on eco-friendly and greenmanufacturing technology, etc.
Shape 22 Flip phone, kitty phone, hand-writing and PDA, lighter-shaped,moustache phone, etc.
http://www.halfbakery.com
Performance 91 Good performance, signal strength, coverage area, large speaker,long talk time, etc.
Investigating different cell phone performances based oncustomers
Cost 6 Top grade phone, middle price phone, low end phone, etc. Separating them according to price difference in customerpreferences
Color 13 Black, white, green, red, yellow, silver, oyster color, etc. According to the existing colors of cell phone on the marketMaterial 13 Metal, polycarbonate, plastic, stainless, synthesis materials, etc. Manufacturing materials used as main parts of cell phonesStandard 8 Communication protocols, power, voltage, Wi-Fi, port, AMjFM, etc. Cell phones use standards in different areas and countriesModel 30 Blackberry Bold 9000, Motorola Hint QA30, Nokia N97, Curve 3520,
etc.Different brand models for customer uses on the market
Attachment 7 Headset, lanyard, leather portfolio, clip, etc. http://www.amazon.com
Table 2Classification of the relationships.
Relationship Concept Definitions of the relationship Examples
is_a F-VOICE/F-ME3 Relationships between parent and son or special and general Is_a(F-VOICE, F-MP3)has_part E-HEALTH-RISK/E-CYCLE Relationships between part and whole Has_part(E-HEALTH-RISK, E-CYCLE)has_function F-VOICE/ P-LONG-TALK Refer to the connection bet ween two concepts Has function(F-VOICE, P-LONG-TALK)use_material COS-LOW-END-PHONE/ M-METAL The type of materials Use material(COS-LOW-END-PHONE, M-METAL)has_property SH-FLIP-PHOHE/ M-STEELLESS Physical attribute/geometric attribute Has_property(SH-FLIP-PHONE, M-STEELLESS)has_feature COL-SIVEER/SH-KTTTY-PHONE Geometric shape Has feature(COL-SIVER, SH-KITY-PHONE)has_standard F-3G/ ST-NETWORK Domain specific standards Has_standard(F-3Q, ST-NETWORK)
166 D. Cao et al. / Advanced Engineering Informatics 25 (2011) 162–176
oped to easily acquire the preference ontology and lexicon. At thesame time, these worksheets can automatically upload the re-quired data into the Protégé editor (http://protégé.stanford.edu).Therefore, the proposed customer preference ontological conceptscan also be presented by using Protégé 3.1, which is one of themost widely used ontology editors. Protégé provides a visual toolfor preference ontology editing, including concept, taxonomy,and relationship building as well as preference ontology visualiza-tion [23].
4. Elicitation techniques of customer preferences
4.1. Hierarchical attribute of preferences
The enterprises aim to build up a good image of their product oncustomers’ minds [10]. They often inquire of customers in order tofind out the needs that are not met by existing products. Then theydevelop a product towards a set of market demands, define theproduct in terms of attributes of preferences, and assess demanddegrees for new products where no product currently exists. Afterfinishing the analysis of needs-preferences, product designers canwork towards concept generation in order to customize productconfigurations. However, preference cannot be viewed as equiva-lent to demand [30]. Preference has subjectivity and is related to
customer behavior with personal feelings, whereas demand ismore objective and mainly depends on other factors, such as avail-ability, familiarity, public praise, and advertising, and backed bywillingness to purchase.
A best-selling product is definitely based on a favorable cus-tomer preference [11]. First, the main factors from customer per-spectives should be identified and the domain knowledge of theproduct should be collected in a professional survey before theproduct is launched. Second, a survey activity is conducted todetermine the customers’ needs and desires before putting thenew product on the market. This survey can be analyzed by usinga software tool to determine the specific customer preferences.Based on this consideration, a measure about the acceptance of po-tential customers can be taken and market simulations can becomefeasible. Therefore, customer preferences can support demandanalysis, conceptual design, and embodiment design, and at thesame time, they are related to experimental results, public praise,and market surveys as shown in Fig. 4.
4.1.1. ExperimentationIn the past two decades, enterprises always employed some tra-
ditional approaches to generate different concepts of a design andto conduct experiments with customers to capture preferences[15]. By using a software tool as the customer service platform, itis much easier to run experiments online. And most of them always

Fig. 4. The attribute of preferences.
D. Cao et al. / Advanced Engineering Informatics 25 (2011) 162–176 167
ran such experiments and showed a raise in the browsing ratethrough clicking and determining whether a new design increasedsales in a few days. If a product advertisement is allowed on web-site, we can discover in a few hours whether experiment results orad click rates increase, and the transaction data can reveal com-mercial activities of customer purchasing products. Some popularwebsites certainly have a high ad click rate. When customers shop-ping, transaction data can reveal their preferences for a particularproduct and enable results targeted to specific buyer groups orbuyer categories (see Section 7). How easy it is to identify cus-tomer preferences depends on the context online and on the cus-tomer’s willingness to buy a product. However, these textdescriptions are disorganized, but do have a great deal of informa-tion. It is necessary to extract customer preferences by adoptingsome effective methods, such as AHP (Analytic Hierarchy Process)[9], statistical method [40], decision algorithm [37]. In addition,customer preferences can be viewed as a multidimensional func-tion, such as price, features, quality, performance, brand, distribu-tion channel, safety, usability, etc. Therefore, they are ofmultidimensional properties.
4.1.2. Public praiseIt is a magic weapon for a product to receive a good evaluation
in public, i.e., public praise [4]. Some products can obtain a deep-rooted impression on customers’ minds. They most likely win agood market on sales [10]. Here, public praise can be divided intosubjective impression and firsthand experience, in which subjectiveimpression includes exterior shape and brand consciousness. Theydirectly describe which exterior shape the customers like the mostand which brand they are deeply in love at the first sight. At thesame time, firsthand experience contains performance traits andconfiguration. They often indicate and report that the customershave an approval level for some products, such as their function,performance, configuration, cost, shape, etc.
4.1.3. SurveyEnterprises often ask their customers preference questions of a
product in order that they can provide better service for their cus-tomers and improve customers’ satisfaction degree [4]. Surveys aresometimes described as informal conversations between productdesigners and customers. A number of measures can be taken toconduct the survey [4]. A common method to survey is interview.Product designer or enterprise first put forward some questionsthat relate to preferences for a particular product function, feature,shape, cost, or even service quality. Then the customers answerthese questions. For example, designers often ask the question:
How often do you use a cell phone? Four potential answers are gi-ven as follows:
(1) Never,(2) once in a while,(3) 1–5 times a day,(4) more than 5 times a day.
These multiple choice questions can be immediately selectedfrom customers. Sometimes, they give direct answers on a scale,which can improve the survey data quality. This method can basi-cally eliminate customer subjective bias. It yields metric data thatcan be analyzed with far more statistical rigor than justified fromtraditional surveys.
The other survey method concentrates on questionnaire. At thesame time, these questionnaires can be distributed to some specialgroups who have a general characteristic that holds a certain com-mon preference [37]. We can analyze their preferences to deter-mine the relative weights of the preference for each separateattributes. Respondents with similar preferences can be identified,and their characteristics or profiles can propose a label for eachcustomer segment. These respondents can further urge the compa-nies to customize a special product feature for the different groups.Generally speaking, the scale is commonly used in survey ques-tions to elicit preferences or evaluations. In this paper, we use fivelevel scales to describe the customer preference degree, such as ‘‘5”strongly preference, ‘‘1” weakly preference. The value of the scalesperhaps has a prejudice against the selected results which dependon customers’ personal desire [34]. A questionnaire has been dis-tributed, and the results from 56 questionnaires of different cellphone customers have been obtained. A lot of concepts exist with-in each brand. A normalized scale is calculated as follows:
Scale ¼ Q5� ðQ c max � QÞ Q 5 � Q 1
Qc max � Q c minð1Þ
where, Q5 stands for the highest scale value while Q1 means thelowest scale value. Qc max stands for the number of the maximumconcepts while Qc min means the number of the minimum concepts.Q means the number of the actual concepts. Different model con-cepts are normalized into 1–5 interval scale values. Their scales offive models are processed and normalized into 1–5 scales corre-sponding to function, shape, color, and cost shown in Table 3.
4.2. Transmutability of customer preferences
Customer preference is somewhat relative and is not absolute[38]. It is changeable with time span, scene, and attribute. The time

Table 3Different scales corresponding to preferences for cell phones.
Taxonomies Models
Bold™ Pearl 8110 Hint QA30 Nokia E75 Tundra
Function 5 2.3 4.2 1 3.9Shape 5 1.8 4.2 1 4.2Color 1 3 5 1 1Cost 3.4 5 1 3.4 1.8
168 D. Cao et al. / Advanced Engineering Informatics 25 (2011) 162–176
span, which depends on the category of a product, is uncertain.Sometimes it is long and sometimes short. The scene, whichdepends on customer behavior, is associated with different cul-tures and geographies [7]. In addition, customer preference maychanges, when the value of some attributes is changed, such asfunction, shape, cost, etc.
It is much easier to ask attribute questions from the customersthat are sensitive buyers. Therefore, the enterprise should be con-cerned with ‘‘How does the attribute affect a customer’s willing-ness to buy a cell phone?” However, the existing approaches canonly evaluate the diversity of preference or conveniently generatealternatives, even though each customer has a different interest inor preference for the same product.
We can view attribute as the concept of preferences, i.e., whatwe can learn about customer preferences and which targets aretechnically infeasible or unrealistic. As a result, the preference con-cept is simply the result of what customers want. Therefore, prod-uct designers can employ lower-level variables to achieve goals forpreference characteristics or attributes. For example, sturdy ordurable is perceptual attributes, and they can be translated intothe set of technical specifications for physical characteristics, suchas loading conditions, allowable deflections, yield strength. Thesespecifications will be satisfied through manipulation of designvariables, such as metal thickness, spring tension, etc. subject toinviolable physical and geometric constraints [30].
5. Preference semantic extraction
5.1. Preference semantic representation
Semantic ambiguity often occurs in design queries when cus-tomers do not know the exact expressions or the related conceptsthey want to pursue though they may have some contextual clues,such as the functional preference of the design and other interact-ing parts of the product in question. A preference lexicon is a betterway to evaluate customer preferences. Lexical terms are the natu-
Fig. 5. The lexicon of cu
ral language words or phrases of the corresponding concepts. Theyare used to map the concepts with words of texts and to explicitlyrepresent the vocabularies of different ontology concepts. There-fore, word morphs, abbreviations, acronyms, and synonyms ofthe word/phrase are lexical terms and share the same concept withthe original lexical terms [25]. Also, some noun phrases, verbphrases, adverb phrases, and prepositional phrases can be ex-tracted as preference terms. The morphs of original lexical termscan easily and automatically be obtained by WordNet (http://wordnet.princeton.edu/) [31], whereas other terms can be acquiredmanually because WordNet is a general lexical resource but not aspecific preference lexicon. We aim to extract implicit customerpreferences from product domain knowledge. As the existing casestudies are almost special products, the extracted texts have a cer-tain limitation. If a preference lexicon is built, it can be used forconcept indexing and extended to improve the preference evalua-tion possibilities.
However, it is not easy to model and extract the semantic infor-mation of implicit customer preference from design texts whichare embedded into natural language. In order to identify linguisticforms of customer preferences, we build a preference lexicon tosupport automatic indexing. Logically speaking, such preferenceinformation is implicit within engineering design texts, but it couldbe difficult to extract from unstructured documents. In order toovercome this difficulty, we build the preference semantic modeland its mapping into the ontology concepts. We identify linguisticforms of preferences, produce a specific preference lexicon, devel-op customer preference ontology concepts, and generate designalternatives. A preference lexicon can show what the customerswant. Fig. 5 represents a common preference lexicon for the cellphone, which describes the preference terms of cell phone func-tions, performance, shape, cost, color, and so on. Each can bedecomposed further in the hierarchy.
Semantic rules are used to link preference terms and conceptstogether to build the customer preference concepts to aid insearching for design information. In general, there are two typesof semantic rules. One is from the combination of preference termsand concepts, in which each term includes a noun, verb, adj, adv,pron, etc. and each concept is composed of several words. Forexample, the combination of ‘‘RED” and ‘‘SH-FLIP-PHONE” formsa new preference concept ‘‘SH-RED-FLIP-PHONE.” The other isthe combination of two concepts. For example, ‘‘F-WORD” and‘‘F-TEXT” constitute a new concept ‘‘F-WORD-TEXT.” The conceptfrom semantic synthesis is called Instance Concept (IC) whichhas a certain entity meaning. Generally speaking, some instanceconcepts exist in specific relationships, such as is_a, has_function,has_part, has_material, etc. These relationships are on the basis
stomer preferences.

D. Cao et al. / Advanced Engineering Informatics 25 (2011) 162–176 169
of forming concept ontology relationships. They are the main partof building semantic rules. The process of building a semantic rulebase is shown in Fig. 6. First of all, semantic rules are input by thedesigners, and some rules can be formalized or edited, and a valid-ity check is carried out. If there is any conflict among these rules,they will be returned and edited again. Then, the redundant checkis implemented. The redundant rules will be eliminated or united.Finally, all satisfied rules will be put into the rule base, otherwisethey are rejected.
We use instance concept to structure design semantics througha set of slots and relations. For example, each concept instance hasseveral slots which describe its functions, properties, materials,and relationships. In the process of system work, the documentsare scanned to search for instance concept and its specific value.Each concept corresponds to a relative slot value. For example, de-sign object of cell phone has a specific slot ‘‘has_part” which corre-
Fig. 6. Process of semantic r
Fig. 7. Ontology-based desig
sponds to the instance concept, ‘‘SHOW SCREEN.” It will bescanned and tagged in the process of indexing sentences. Mean-while concept ‘‘SHOW SCREEN” has a function slot ‘‘SLIDEMOTION” and it exists in a material slot ‘‘has_material” that is,‘‘SHOW SCREEN” is made of material ‘‘RDP.” In the same way, wecan find the cell phone function slot ‘‘has_function,” and it has afunction ‘‘COMMUNICATION” and three properties: ‘‘TEXT, AUDIO,and VIDEO,” as shown in Fig. 7.
Customer preference ontologies exist in two kinds of relation-ships, that is, internal and external relations, where an internalrelation exists in the same taxonomy. For example, ‘‘F-TEXT-ENGLISH” and ‘‘F-WORD” belong to ‘‘Function taxonomy” and theyare called the internal relationships. In contrast, ‘‘SH-FLIP-PHONE”and ‘‘M-STEELLESS” belong to different taxonomies, and they existin external relationships. Fig. 8 presents preference ontology inter-nal relationships of the cell phone, in which different line types
ule base establishment.
n semantic expressions.

Fig. 8. Preference ontology internal relationships of a cell phone.
170 D. Cao et al. / Advanced Engineering Informatics 25 (2011) 162–176
mean different ontology relationships. Each ontology concept cor-responds to a node in the ontology tree. In this taxonomy, the hier-archical decomposition can be treated as a set of psychologicalsemantics of customer perception about a special cell phone,which is an interaction of customer involvement [8]. It comprisesa tree architecture topping down from the highest level to the low-est level for ontology concepts of customer preferences. [29].
5.2. Text information extraction
We assume that input design information is expressed in plainEnglish. If the input is transaction data, it needs to be quantita-tively changed into identified texts. They all need to transform intostructured text information. Tokenization is carried out from thetext of the customer request after stemming and removing the stopwords. According to a preference lexicon, customer preferencewords are tagged to mark their position. Preference terms andphrases are recognized on the basis of indexing preference domainknowledge base. Using a list of synonyms, these tokens are associ-ated with concepts in the ontology through Depth First Search(DPF) or Breadth First Search (BFS) [27,22]. Therefore, after prefer-ence semantic extraction embedded in the customer queries, theconcepts are generated by matching to terms and phrases in theontology. The algorithm operations as shown in Fig. 9 are describedas follows.
Fig. 9. The process of customer preference extraction.
5.2.1. Stemming stop words and tokenizingSome auxiliary words are removed from the phrases, such as
pronouns, common verbs, common nouns, adjectives, and frillywords. The tokens/words and punctuation symbols are markedby analyzing input texts.
5.2.2. POS taggingEach word is first inquired in the preference lexicon and marked
with its most likely POS tags as defined in the preference lexicon.The combination operation of automatic POS assignment and man-ual correction is carried out to improve the speed and accuracy ofthe mapping process. If the word does not have a match in the lex-icon, then the word is assigned an unknown tag. After manual cor-rection, any incorrect tags will be removed ([27]).
5.2.3. Recognizing terms and phrasesThe purpose of recognizing a concept is to select the most
appropriate terms or phrases in the domain ontology. This stagecan be divided into two steps.
(1) Concept matching: Assigning the tagged terms/phrases to theconcepts it refers to. Words that match with a preferencelexicon term will be assigned the pertinent ontology con-cept. Note that multiple concepts may be assigned to a singleword or a series of words/phrases because different conceptsmay have the same lexicon term.
(2) Concept disambiguation: A word or term which matches withmultiple concepts causes ambiguities. This ambiguity existsin polysemantic and ellipsis semantic structure [26]. It canbe disambiguated by referring to the context of the term/phrase meaning. The context of a term refers to the conceptsto which its adjacent words/phrases are tagged.
5.2.4. Joining relationshipsThe relationship between two concepts is joined together by a
certain semantic relation. The joining phase scans the sentencesiteratively to generate relationships of the two concept instancesaccording to the semantic rules [25]. Both concepts maybe exist

D. Cao et al. / Advanced Engineering Informatics 25 (2011) 162–176 171
in meronymy, holonymy, hyponymy, hypernymy, causality, etc.These lexicon relationships are used to include: has_part, is_a,has_property, etc. The similarity degree of different conceptsshould also be considered. In the next section, the lexical relation-ships among the keywords will be built and the semantic analysiswill be employed to extract the information.
Fig. 10. Vector space model of corpus matrix.
5.3. Preference concept disambiguation
In the process of customer querying and ontological indexing,semantic ambiguities often result in a lower retrieval precision,or even in retrieval of errors. Theoretically speaking, three ambigu-ities may appear in text indexing, as follows:
(1) Polysemy: a term or phrase perhaps matches several conceptresulting in semantic ambiguities. For example, pictureappears in function taxonomy concepts ‘‘STATIC-PICTURE”and ‘‘DYNAMIC-PICTURE” because both concepts have thesame lexical term picture.
(2) Accuracy of term description: some concepts can be expressedby using different terms, phrases, or synonyms, but they areof little difference in semantics. For example, ‘‘VOICE-COM-MUNICATION” and ‘‘INTERNET-COMMUNICATION” are twoclose to concepts, but there is a subtle difference in meaning,and they respectively are stored in the knowledge base.
(3) Ellipsis and acronym: part structures of a sentence or demon-strative pronoun are omitted because they may lead tosemantic error or misunderstanding, while some specialterm acronyms still result in mistake. For example, both spe-cial terms ‘‘INFORMATION-RETRIVAL” and ‘‘IMAGE-RECOG-NITION” have the same acronyms ‘‘IR,” they will beambiguous if there is no additional explanation.
These ambiguities are direct reasons for in the lower concept re-trieval precision. For example, if customers like the price of about$80 with volume 80 � 40 � 10 cm3 for a cell phone. The two num-bers ‘‘80” often appear ambiguous. In preference ontology con-cepts, we have divided customer preferences into differentclassifications (see Section 4.1). By marking different taxonomicalsigns during tagging terms, such as, COS-MIDDLE PRICE EIGHTYand SH-SIZE EIGHTY, we can distinguish them. A detailed algo-rithm of concept disambiguation is described in Section 6.2.
6. Customer preference evaluations
6.1. Vector space representation
In the traditional vector space model, a vector is used to repre-sent each item or document [35]. Each element of the vector in-cludes certain keywords associated with the given document.The value assigned to that element reflects the importance of theterm in representing the semantics of the document. A databasecontaining a total of documents described by terms is representedas a term-by-document matrix [6]. The rows of the matrix arecalled the document vectors, and the columns of the matrix arethe term vectors. Thus, the matrix element is the weighted fre-quency in which the term occurs in the document. In this paper,a corpus matrix of document-concepts is built on the basis ofterm-by-document matrix, in which the rows mean documentdescriptions from different cell phone brands, as shown inFig. 10. The columns stand for the concepts that appear in the doc-uments, while the concept consists of several terms or words. Thematrix values aij are weights that represent the importance of con-cepts in documents. Suppose that each concept is composed of aset of lexical terms (t1, t2, t3, . . . , ti, . . . , tn). Each term may consist
of multiple words, where they are assigned the weight values gk
and for each gk 2 [0, 1]. To calculate the concept score Cscore foreach Ci, we can first calculate the term score Tscore of all its lexicalterms as follows:
TscoreðijÞ ¼# Of words in the document di matches with �
PHk¼1gk
# Of words in documentð2Þ
Let us assume a document dj includes H words and k is theindexing position of the words in the document from left to right,that is, it means the order of tagging words. gk is the weights ofeach word and the sum of them is 1 (
Pg = 1). g equates to 1 if
the matched term contains only a word. When there is no matchedword g is to 0. We can normalize the value of Tscore between 0 and 1according to Eq. (2). At the same time, the Cscore is viewed as themaximum of all its Tscore as shown below [18]
CscoreðiÞ ¼ MaxðTscoreðijÞÞ ð3Þ
According to traditional indexing approach, we combine the do-main ontology knowledge into keyword-based indices [6]. The pro-cedure of document annotation and weighing items is the same asthe keyword-based extraction and indexing process. An effectiveranking algorithm is developed on the basis. In doing so, we canobtain concept-frequency (cf) and inverse document frequency(idf) [22]. Therefore, we calculate the weight value wij of a charac-teristic item as follows:
wij ¼ cfij � idfj ¼ cfij � ðlog2ðN=njÞ þ 1Þ ð4Þ
where cfij is the frequency of concept Cj in document di, and N is thenumber of documents, and nj is the number of documents that in-volve the concept Cj. From the formula (4), we can find that the va-lue of wij increases with cfij and decreases with nj.
The distance between two document vectors is represented bysimilarity. The similarity between document di and dj is definedas the cosine of the angle between two vectors below
Simðdi;djÞ ¼Pm
k¼1wik �wjkffiffiffiffiffiffiffiffiffiffiffiffiffiffiffiffiffiffiffiffiffiffiffiffiffiffiffiffiffiffiffiffiffiffiffiffiffiffiffiffiffiffiffiffiffiffiPmk¼1w2
ik
� � Pmk¼1w2
jk
� �r ð5Þ
When carrying out a query operation, the above model di couldbe viewed as the queries from customers. By measuring customers’queries of preference ontology concepts and different brand namecell phone document similarities, we can achieve documentranking.

172 D. Cao et al. / Advanced Engineering Informatics 25 (2011) 162–176
6.2. Ontology concept measures
Lexical ambiguity can be distinguished from concept similar-ity measure. We measure the distance between two concepts ofthe phrase/keyword clusters corresponding to special productattributes. In our model the customer preference ontology willconveniently execute indexing: that is, the preference ontologyeasily provides index terms/concepts which can be used tomatch with customer queries. For example, given a customerquery ‘‘want a camera and multimedia cell phone with a red flipphone,” after stemming auxiliary words ‘‘want”, ‘‘a”, ‘‘and”,‘‘with”, the keywords ‘‘camera” and ‘‘multimedia” are a functiontaxonomy and stand for ‘‘F-CAMERA” and ‘‘F-MULTIMEDIA”; thekeywords ‘‘red” and ‘‘flip” belong to color and shape taxonomyand stand for ‘‘COL-RED” and ‘‘S-FLIP.” By putting a taxonomicallabel in front of the keywords, we can easily index thepreference terms from the lexicon. When concepts are corre-lated, the associated concepts will be assigned greater weightbased on their minimal distance from each other in the ontologyand their own matching scores based on the number of wordsthey match. In general, an ambiguous concept related to otherconcepts will have a higher score and will retain a greaterprobability than uncorrelated ambiguous concepts [18].
In order to calculate the similarity between two concepts, weneed to build interrelationships of ontology concepts. Here, werepresent our ontology as a directed acyclic graph (DAG). Eachnode in the DAG expresses a concept which includes a label nameand a synonym list. The synonym list of a concept contains a set ofkeywords through which the concept can be matched with cus-tomer queries. Fig. 11 represents a small portion of preferenceontological relationships of the cell phone. Each line type repre-sents different ontology concept interrelationships [18]. Supposematched concepts of query keywords: C1, C2, . . . , Ci, . . . , Cn; andeach selected concept (Ci) contains a score based on the numberof lexical terms (t1, t2, . . . , ti, . . . , tm) from the list of synonyms thathave been matched with the customer queries. The keywords incustomer queries are sought based on DFS or BFS which matcheach keyword with the lexical terms of a concept. The calculationof the score is obtained on the basis of Tij and Ci matched keywordsfrom Eqs. (2) and (3).
The shortest distance or least number of arcs between twomatched concepts in preference ontology is defined as ConceptDistance (CD), as follows:
CDði;jÞ ¼1þMinðNumber of arcsðCi;CjÞ If they have a common parent nodeInfinite If they have no a common parent node
�
ð6Þ
Fig. 11. Customer preference ontological ex
Note that if the concepts are at the same level and no path exists,their distance is infinite (see Fig. 11). For example, the concept dis-tance between ‘‘FUNCTION” and ‘‘SHAPE” is infinite, and ‘‘F-COM-MUNICATION” and ‘‘F-VOICE” are linked by ‘‘Part_of” relation:their distance is 1. Similarly, the concept distance between ‘‘F-COM-MUNICATION” and ‘‘F-MESAGE” is 2. And the concept distance be-tween ‘‘F-VOICE” and ‘‘P-CLEAR” is 1.
Also, we can calculate the weighted concept scores which relateto the Cscore of all its correlated concepts but inversely relates to theCDs with them as follows:
xCðiÞ ¼ CscoreðiÞ þXn
k¼j
CscoreðkÞCDði;kÞ
ð7Þ
where x stands for the weight of a concept, and it is related to notonly the frequency of a keyword, but also the description of corre-sponding concept involved in the documents. The items in differentposition of a document will be set with different weights. For exam-ple, the concept appearing function taxonomy ‘‘F-COMMUNICA-TION” will be heavier than the ones appearing in the othertaxonomies, which depends on customers’ preferences and desiresfor a specific concept.
According to above similarity measure of both concepts, we canestimate whether a concept is highly correlated with others if it isless far away from them in the directed acyclic graph (DAG), i.e.,semantically closer, or if it has more words matching with a partic-ular query keyword, i.e., lexically closer. By clustering these con-cepts of similarity measures in a document, such as functionpreference, performance preference, shape preference, cost prefer-ence, etc. we can rank the result of preferences which documentthe customers like the most.
6.3. Evaluation analysis
Evaluation analysis uses the collected preference catalogs as thebenchmark and compares the retrieval performance of the ontol-ogy-based search and keyword-based search. The case study wasexecuted by five different groups. Each group has the differentviewpoints about cell phone preferences based on their back-ground knowledge and partial shopping experiences. The objectiveis to briefly describe what kind of cell phones they like the most.Each of them needs to provide at least 8–10 queries: what kindof function, performance, and shape they favor the most. Also theyare required to attach a short description as the context of eachquery. For example, why the function is needed and how it is used.These constitute design specifications for new cell phones. The
ternal relationships of the cell phone.

D. Cao et al. / Advanced Engineering Informatics 25 (2011) 162–176 173
effectiveness of retrieval is usually measured by two quantitiesshown as follows [18]:
Recall ¼ # Of relevant concepts that are retrieved# Of relevant concepts
ð8Þ
Precision ¼ # Of relevant concepts that are retrieved# Of relevant concepts
ð9Þ
Two metrics are usually used to describe the quality of prefer-ence retrieval. Recall is the proportion of relevant concepts re-trieved by the system and precision is the proportion of retrievedconcepts that are relevant. Precision is an accuracy measure, whilerecall is a measure of how much good information is retrieved.Generally speaking, it is necessary for customer preferences toevaluate recall versus precision to determine which overall strate-gies are most important.
7. Empirical study
We design a virtual experiment platform to obtain customerpreference ontology towards concept generation. Three brand cellphones have been selected to implement this empirical study, suchas Blackberry, Motorola, and Nokia. Each brand includes 10 seriesof cell phones as follows:
� Blackberry: Bold9000, Curve 8320, Curve8520, Pearl 8110,Tour9630, Strom 9500, 7130g, Pearl Flip 8220, 8830, 6230;� Motorola: Hint QA30, Tundra, MOTO W233, Aura, V80, XT800
ZHISHANG, MT701, QUENCH, Karma QA1, Motocubo A45;� Nokia: Nokia N97, Nokia E75, Nokia 6010, 5800 XpressMusic,
7900 Prism, Nokia 5330, Nokia X6, 2220 Slide, 8600 Luna 5,Nokia C5.
We assume that customer queries focus on some terms or key-words about the cell phone. Different customers may query aboutdifferent problems, such as function, shape, color, and cost, whichdepend on customer professions, domain knowledge, culture back-ground, and so on. In order to implement this empirical study, wedistributed questionnaires to aim at five different groups and col-
Fig. 12. Interface of p
lected above 56 survey forms. Also we collected three brands andeach includes 10 series of cell phones. In total, we obtained 450description documents from the websites. On average, the lengthof each document is about 4.42 sentences and 61.43 words.
Five different groups of customers are investigated, and exper-imental data and texts are processed. Here, the five groups are rep-resented as follows:
� G1 a group of industry engineers;� G2 a group of university faculties;� G3 a group of company executives;� G4 a group of graduate students;� G5 a group of freshmen.
The objective of concept generation involves identifying cus-tomer needs and then mapping those needs into a set of cell phoneattributes or specifications. Considering this case study where thedesigner would like to generate a new cell phone from conceptclusters, it is necessary to satisfy the following basic requirements.
� A hybrid cell phone with a touch screen and a hardwarekeyboard.� Push button to realize Talk, Bluetooth, MP3, Video-fairly easy to
master.� Long battery life (over 3 weeks), some functions and extras.� Digital camera/digital player-fairly easy to operate.� Security features that are environmentally friendly.
Fig. 12 presents an interface of a prototype system, in which thenearside of the interface is to realize customer queries about pref-erence concepts from different groups. They inquire about sometaxonomical concepts, such as functional concepts, shape concepts,or cost concepts, etc. Users can select these concepts what they likethe most from the left tree structure. The right-top can realize pref-erence concept indexing. On the one side, the users can directly in-put the cell phone model name to search and output itsinformation in the document on the right underside. On the otherside, the system can automatically select and rank the closest doc-ument from customer queries in the knowledge base.
rototype system.

Fig. 14. Distribution of different interrelationships.
Table 4Recall/precision based on ontology and keywords.
Types andnumber ofqueries
Recall Precision
Ontology (%) Keyword (%) Ontology (%) Keyword (%)
General 10 92 16 82 65Specific 27 S3 19 87 84Context 5 26 12 73 61
174 D. Cao et al. / Advanced Engineering Informatics 25 (2011) 162–176
Based on this prototype system, we can first of all formulate thequeries from customers in order to extract preference terms andconcepts. In the process of customer querying, some terms/phrasesare recognized through using DFS or BFS. For example, industryengineers like practical and easy operational cell phones for tech-nical communication or business negotiation. College facultymembers like performance reliable cell phones with good voice ef-fects for educational activities. Company executives like high-grade and luxurious cell phones with wide screens to show theirsocial status. Graduate students like delicate and motional exter-nality with multimedia functions. University freshmen like smalland exquisite cell phones with flip or kitty shapes in bright colors.They will inquire about function, externality, price, performance,use environment, color, etc. Quantitative distribution of the key-words/ontology concepts corresponding to different taxonomieswithin the collected customers’ documents is shown in Fig. 13.
We collected a total of 45 queries from the five different groups,and among them three queries were eliminated because they werenot related to customer preferences, such as some unpractical andimaginative cell phone functions in the future. The 42 queries leftare classified as general queries, specific queries, and context que-ries [18]. The general queries are associated with the upper-levelconcepts of the ontology, such as customer preferences of differentcell phone brands or their series, while the specific queries areassociated with lower-level concepts of taxonomies, e.g., cellphone performance, shape features, and material attributes. Thethird category is context queries that cannot easily be describedexcept for context expression, in which the customers specify acertain context in order to make the query unambiguous, such ascell phone performance parameters or quantitative indexes. Proté-gé 3.1 (http://protege.stanford.edu/) can be used to generate do-main ontology, in which preference taxonomies were generatedas the basis of concept hierarchies. The lexical terms of the conceptwere modeled as the slot attribute of each concept class. This alsosupports the domain ontology model in several formats, such asXML, OWL, and RDF. The domain ontology model was translatedinto XML scripts and input into the system [23]. Ontology conceptsare built on the basis of customer preferences. Their interrelation-ships and the number of types are statistically calculated andshown in Fig. 14. Table 4 gives the comparison of the empirical re-sults of the queries. Different types of queries can obtain corre-sponding recall and precision. These results show that ontologyretrieval is superior to traditional keyword retrieval.
As the members of each group have different cultural back-grounds, genders, and ages, they are, respectively, interested in dif-
Fig. 13. Distribution of keywords/concepts in different taxonomies.
ferent concepts [37]. We can index the concepts of customerqueries and obtain which taxonomies the customers will preferas shown in Fig. 15. We present Y-axis as the percentage of conceptnumber while X-axis shows different concept taxonomies. Amonggroups customer preferences present an evident difference corre-sponding to different taxonomies. As for the G1 group queries, theyare mainly concerned about easy to use, word clarity, much bettersound, and so on. After carrying out document retrieval, we ob-tained the ‘‘Nokia E75” which was close to the G1 group require-ments. However, some concepts still need to be added in orderto satisfy customer preferences, such as touch phone, mute sound
Fig. 15. The customer preferences of the five different groups corresponding totaxonomies.

Table 5Different G preference models and concepts.
GroupNo.
Returned No. ofquestionnaires
Models ofcell phone
Num. ofcustomerconcepts
Num. ofconceptsupplement
G1 8 Nokia E75 22 3G2 12 Tour 9630 17 3G3 9 Nokia N97 24 2G4 15 Hint QA30 19 4G5 12 Pearl 8110 22 2
D. Cao et al. / Advanced Engineering Informatics 25 (2011) 162–176 175
in camera, etc. Also, on the basis of the G2 group queries we ob-tained the ‘‘Tour 9630” model, which was close to customerrequirements, but there was still a small difference. We neededto add some new concepts to fit customer preferences, such as callwaiting, WIFI, edit text, etc. Although the results of the retrievalprovided the most suitable model to customers, they still can notsatisfy customer preferences completely, so some additional con-cepts need to be attached as a supplement. Different taxonomicalconcepts versus customers’ personal preferences still exist in a lit-tle difference. The objective of information retrieval is to find theclosest documents and detect the difference between the existingconcepts and new concepts. Table 5 presents different groups cor-responding to customer preference models and the number of con-cept supplements. These appended concepts, that is, emergencycall, voice help, accident discernment, less radiation, etc. will be-come the trend of the existing model metamorphosed design inthe future. In fact, all brand cell phones always confine their func-tions within a certain range, and perfection cannot be obtainedwith the given cost limits. Sometimes performance is good, buttheir functions are not remarkable. Some designs are pretty good,but performance and customer service are unlikely to entirely sat-isfy customers’ desires. Companies attempt to make a bargain withcustomers for a supply of the cell phones in order to cater to thecustomer preferences.
8. Conclusions and discussions
In this research, the customer preference ontology is developedand preference design information is extracted to build a prefer-ence knowledge base which includes a preference lexicon, domainontology, and semantic rules. An ontology-based model is given forinformation retrieval. The concept generation and selection ofinformation are based on customer preference ontology. We haveshown how the ontology can be used to generate and measure de-sign concepts in customer queries. We have used the preferencedomain knowledge of the cell phone for describing the proposedapproach, while the results can be applied to other similar prod-ucts. By extracting the customer preference concepts of 450 docu-ments and analyzing five group empirical study, our ontology-based retrieval demonstrates its superiority to keyword-basedsearch techniques. However, further research needs to considerfour aspects as follows:
� In the development of new technology, the large amount ofunstructured and informal design information is steadilyincreasing, such as engineers’ log, image, nonstandard languagedescriptions from customers, etc. These texts are less likely tocomply with the formal documental format [6]. At the sametime, they are still a part of customer preference documentextraction. However, it is difficult to extract the ontology con-cept semantics from these documents. Further investigation isworth in the future.� Information extraction of customer preferences is currently
based on indexing the sentence semantic rules, in which thepreference lexicon and domain knowledge are crucial to achieve
information retrieval. However, we do not consider documentsyntactic structures and syntactic rules. If we develop an auto-matic document indexing system for customer preferences inorder to minimize human intervention, the sentence structureshave to be analyzed on the basis of syntactic rules [25]. Furtherwork is needed towards this next step.� Customer preferences are of certain relativity and are not abso-
lute [38]. At a particular time, customers show a strong likingfor certain cell phones. But later their preferences perhapschange and they show a liking for another cell phone. Therefore,we would like to build an ontology that is easy to update andcan dynamically adapt to customer preference changes. In addi-tion, as time goes on, customer perceptions and product con-cepts are constantly changing around customer preferences[24]. An automatic analysis approach to keeping abreast of thechanges with a fast and simple response to customer prefer-ences and changes in the market is needed. This approachmay take a combination of ontological and statistical methods.� The preference lexicon, in this paper, only collects the most
positive context terms and phrases. However, some negativecontext terms [41], such as the negative adverbs, ‘‘no, not,hardly, rarely” or the negative adjectives, ‘‘bad, ridiculous,impracticable, troublesome.” Actually, double-negation equatesto affirmation. We often use this in writing and speaking. Suchword frequencies may be useful for some customers, but not forall. A more accurate language model for the elicitation of cus-tomer preferences will be developed to take this aspect intoaccount.
Acknowledgments
This research is partially sponsored by the National Nature Sci-ence Foundation of China (Grant No. 507,75,065), Nature ScienceFoundation of Hebei Province (Grant No. E2008000102) in China.The authors acknowledge partial support of Product Lifecycle Man-agement (PLM) center at Purdue University and the Center for Ad-vanced Manufacturing (CAM). The authors thank anonymousreviewers for their helpful suggestions in this study.
References
[1] I. Biederman, Recognition-by-components: a theory of human imageunderstanding, Psychological Review 94 (1987) 115–147.
[2] M. Berkowitz, Product shapes as a design innovation strategy, Journal ofProduct Innovation Management 4 (4) (1987) 274–283.
[3] P.H. Bloch, Seeking the ideal form: product design and consumer response,Journal of Marketing 59 (3) (1995) 16–29.
[4] N. Bolton Ruth, A dynamic model of the duration of the customer’s relationshipwith a continuous service provider: the role of satisfaction, Marketing Science17 (1) (1998) 45–65.
[5] Dongxing Cao, Karthik Ramani, Zhanjun Li, Guiding concept generation basedon ontology for customer preference modeling, in: International Symposiumseries on Tools and Methods of Competitive Engineering (TMEC), Ancona, Italy,April 12–16, 2010.
[6] P. Castells, M. Fernandez, D. Vallet, An adaptation of the vector space model forontology based information retrieval, IEEE Transaction on Knowledge and DataEngineering 19 (2) (2007) 261–272.
[7] C.H. Chen, L.P. Khoo, Y. Yan, Evaluation of multicultural factors from elicitedcustomer requirements for new product development, Research in EngineeringDesign: Theory, Applications and Concurrent Engineering 14 (3) (2003) 119–130.
[8] C.H. Chen, L.P. Khoo, W. Yan, A strategy for acquiring customer requirementpatterns using laddering technique and ART2 neural network, AdvancedEngineering Informatics 16 (2002) 229–240.
[9] A. Chwolka, M.G. Raith, Group preference aggregation with the AHP-implications for multiple-issue agendas, European Journal of OperationalResearch 132 (2001) 176–186.
[10] Fornell Claes, A national customer satisfaction barometer: the Swedishexperience, Journal of Marketing 56 (1992) 6–21.
[11] F. Claes, D. Michael, E.W.A. Johnson, C. Jaesung, E.B. Barbara, The AmericanCustomer Satisfaction Index: nature, purpose, and findings, Journal ofMarketing 16 (4) (1996) 7–18.

176 D. Cao et al. / Advanced Engineering Informatics 25 (2011) 162–176
[12] N. Crilly, J. Moultrie, P.J. Clarkson, Shaping things: intended consumerresponse and the other determinants of product form, Design Studies 30(2009) 224–254.
[13] S. Deerwester, S.T. Dumais, G.W. Furnas, T.K. Landauer, R. Harshman, Indexingby latent semantic analysis, Journal of the American Society for InformationScience 41 (6) (1990) 391–407.
[14] Erin F. MacDonald, Richard Gonzalez, Panos Y. Papalambros, Preferenceinconsistency in multidisciplinary design decision making, Journal ofMechanical Design 131 (2009) 031009-1–031009-13.
[15] A. Griffin, J.R. Hauser, The voice of the customer, Marketing Science 12 (1)(1993) 1–27.
[16] S.H. Ha, Applying knowledge engineering techniques to customer analysis inthe service industry, Advanced Engineering Informatics 21 (2007) 293–301.
[17] H. Ji, M.C. Yang, T. Honda, A probabilistic approach for extraction designpreferences from design team discussion, in: Proceedings of the ASMEInternational Design Engineering Technical Conference & Computer andInformation in Engineering Conference, Las Vegas, September 27, 2007.
[18] L. Khan, D. McLeod, E. Hovy, Retrieval effectiveness of an ontology-basedmodel for information retrieval, International Journal of Very Large Data Base(VLDB) 13 (2004) 71–85.
[19] Y. Kitamura, R. Mizoguchi, Ontology-based systemization of functionalknowledge, Journal of Engineering Design 15 (4) (2004) 327–351.
[20] T.Y. Lee, Adaptive text extraction for new product development, in:Proceedings of the ASME International Design Engineering TechnicalConference & Computer and Information in Engineering Conference, SanDiego, August 30, 2009.
[21] G.S. Linoff, M.J.A. Berry, Mining the web: Transforming Customer Data intoCustomer Value, John Wiley & Sons, New York, 2001.
[22] S. Li, A semantic vector retrieval model for desktop documents, Journal ofSoftware Engineering and Application 2 (2009) 55–59.
[23] S.C.J. Lim, Y. Liu, W.B. Lee, Product analysis and variants derivation based on asemantically annotated product family ontology, in: Proceedings of the ASMEInternational Design Engineering Technical Conference & Computer andInformation in Engineering Conference, San Diego, August 30, 2009.
[24] Y.C. Lin, H.H. Lai, C.H. Yeh, Consumer-oriented product form design based onfuzzy logic: a case study of mobile phones, International Journal of IndustrialErgonomics 37 (2007) 531–543.
[25] Z. Li, C. Yang, K. Ramani, A methodology for engineering ontology acquistionand validation, Artificial Intelligence for Engineering Design, Analysis andManufacturing 23 (2009) 37–51.
[26] Z. Li, V. Raskin, K. Ramani, Developing engineering ontology for informationretrieval, Journal of Computing and Information Science in Engineering 8(2008) 011003-1–011003-13.
[27] M. Marcus, B. Santorini, M.A. Marcinkiewicz, Building a large annotated corpusof English: the penn treebank, Computational Linguistics 19 (2) (1994) 313–330.
[28] J. McCormack, J. Cagan, Supporting designer’s hierarchies through parametricshape recognition, Environment and Planning B – Planning and Design 29(2002) 913–931.
[29] C. McMahon, A. Lowe, S. Culley, Waypoint: An integrated search and retrievalsystem for engineering documents, Journal of Computing and InformationScience in Engineering 4 (4) (2004) 329–338.
[30] J.J. Michalek, Preference Coordination in Engineering Design Decision-Making,Ph.D. thesis, University of Michigan, Ann Arbor, 2005.
[31] G.A. Miller, A lexical database for English, Communications of the ACM 38 (11)(1995) 39–41.
[32] S. Orsborn, J. Cagan, P. Boatwright, Quantifying aesthetic form preference in autility function, Journal of Mechanical Design 131 (2009) 061001-1–061001-10.
[33] S. Orsborn, P. Boatwright, J. Cagan, Identifying product shape relationshipsusing principal component analysis, Research in Engineering Design, 2007.doi:10.1007/s00163-007-0036-8.
[34] M. Ruth, P.C.M. Govers, P.L.S. Jan, The development and testing of a productpersonality scale, Design Studies 30 (2009) 287–302.
[35] G. Salton, Automatic Text Process, Addison-Wesley, Wokingham, MA, 1998.[36] M. Scott, E.K. Antonsson, Aggregation functions for engineering design trade-
offs, Fuzzy Sets and Systems 99 (3) (1998) b253–b264.[37] T.K. See, K. Lewis, A decision support formulation for design teams: a study in
preference aggregation and handing unequal group members, in: ASME 2005International Design Engineering Technical Conferences & Computers andInformation in Engineering Conference, Long Beach, California, USA,September 24–28, 2005.
[38] P. Slovic, The construction of preference, American Psychologist 50 (5) (1995)364–371.
[39] R. Studer, V.R. Benjamins, D. Fensel, Knowledge engineering: principles andmethods, Data and Knowledge Engineering (DKE) 25 (1–2) (1998) 161–197.
[40] P.M. West, P.L. Brockett, L.L. Golden, A comparative analysis of neuralnetworks and statistical methods for predicting consumer choice, MarketingScience 16 (1997) 370–391.
[41] M.C. Yang, W.H. Wood III, M.R. Cutkosky, Design information retrieval: athesauri-based approach for reuse of informal design information, Engineeringwith Computers 21 (2005) 177–192.
[42] M.C. Yang, H. Ji, A text-based analysis approach to representing the designselection process, in: International Conference on Engineering Design, ICED’07,Cite Des, Paris, France, August 28–31, 2007.
[43] R. Zhao, W.I. Grosky, Narrowing the semantic gap – improved text-based webdocument retrieval using visual features, IEEE Transaction on Multimedia 4 (2)(2002) 189–200.