Embed Size (px)
Citation preview

BioOne sees sustainable scholarly publishing as an inherently collaborative enterprise connecting authors, nonprofit publishers, academic institutions, researchlibraries, and research funders in the common goal of maximizing access to critical research.
Ontogenetic Variations in Cuticle Morphology in the Blue Crab Callinectes sapidusAuthor(s): David A. Waugh , Rodney M. Feldmann , Jennifer L. Burrell , Angela L. Hull , Kristie Hein ,and Carrie E. SchweitzerSource: Journal of Crustacean Biology, 29(2):141-156. 2009.Published By: The Crustacean SocietyDOI: http://dx.doi.org/10.1651/08-3105.1URL: http://www.bioone.org/doi/full/10.1651/08-3105.1
BioOne (www.bioone.org) is a nonprofit, online aggregation of core research in the biological, ecological, andenvironmental sciences. BioOne provides a sustainable online platform for over 170 journals and books publishedby nonprofit societies, associations, museums, institutions, and presses.
Your use of this PDF, the BioOne Web site, and all posted and associated content indicates your acceptance ofBioOne’s Terms of Use, available at www.bioone.org/page/terms_of_use.
Usage of BioOne content is strictly limited to personal, educational, and non-commercial use. Commercial inquiriesor rights and permissions requests should be directed to the individual publisher as copyright holder.

JOURNAL OF CRUSTACEAN BIOLOGY, 29(2): 141–156, 2009
ONTOGENETIC VARIATIONS IN CUTICLE MORPHOLOGY IN THE BLUE CRAB
CALLINECTES SAPIDUS RATHBUN, 1896
David A. Waugh, Rodney M. Feldmann, Jennifer L. Burrell, Angela L. Hull, Kristie Hein,and Carrie E. Schweitzer
(DAW, RMF, JLB, ALH, KH) Department of Geology, Kent State University, Kent, Ohio 44242, U.S.A.
(Corresponding Author (DAW): ([email protected])
(CES) Department of Geology, Kent State University Stark Campus, 6000 Frank Ave. NW,
North Canton, Ohio 44720, U.S.A.
A B S T R A C T
In an effort to use aspects of the cuticle as taxonomic characters in phylogenies of fossil and extant decapods, variation due to gender,
growth, sample location on the carapace, and molt cycle must be understood so that taxonomically important characters can be identified.
In this study, effects of sample location on the carapace and carapace size were examined. A series of male Callinectes sapidus Rathbun,
1896, specimens from 2-6 cm in length were collected on the Rhode River of the Chesapeake Bay, MD, USA. To study the effects of
sample location and carapace size on parameters of the cuticle, the cuticle was examined in thin section and on the surface of the dorsal
carapace. The distributional density of setal pits and nodes and node size were measured on the surface. In thin section, thickness of the
cuticle and construction of the nodes and setal pits was examined. Thickness of the cuticle, node size, and setal pit density increased during
growth of the crab. Node density decreased with growth. Construction of nodes and setal pits remained constant in all specimens and
sample locations. Morphometric parameters of the cuticle were consistent with previously reported growth rates of the carapace in
C. sapidus. Differences in the rate of change for the cuticle metrics studied occurred at carapace sizes that are attained upon reaching
sexual maturity. Growth rates of cuticular features provide context for comparison with similar data in other species. In addition, the
change in growth rates of these features, if recognized in fossil crab populations, may allow the determination of population age structures
and size at maturity.
KEY WORDS: Callinectes sapidus, cuticle structure, Decapoda, ontogeny, Portunidae
DOI: 10.1651/08-3105.1
INTRODUCTION
In an effort to use aspects of the cuticle as taxonomic char-acters in fossil and extant decapods, variation in the cuticle dueto gender, growth, sample location on the carapace, and moltcycle must be understood so that taxonomically importantcharacters can be identified (Waugh and Feldmann, 2003). Inaddition to its relevance to taxonomic work, an understandingof cuticular changes that are a result of the molt cycle, gender,and ontogeny may eventually be applied to fossilized cuticlein an effort to understand population age structures as well asother non-taxonomic factors in fossilized crabs. However,significant characters must first be recognized in the cuticleof extant taxa and correlated to the molt cycle, gender, andontogeny before either taxonomic or ecologic conclusions canbe drawn from fossil cuticle. The purpose of this paper is toexamine variations within the cuticle of male Callinectessapidus Rathbun, 1896, as a function of growth and samplelocation (Fig. 1). Effects of the molt cycle on cuticle withinthe ecdysial sutures is also examined within a few specimens;effects of gender will be addressed in future works.
Microstructure is preserved in fossil cuticle and hasbeen studied primarily in a descriptive, functional, or tapho-nomic context (Neville and Berg, 1971; Feldmann andTshudy, 1987; Vega et al., 1994, 1998, 2005; Feldmannand Gazdzicki, 1998; Briggs et al., 1998; Haj and Feldmann,2002; Guinot and Breton, 2006; Waugh et al., 2004, 2006).A better understanding of cuticular architecture in extantdecapods is needed to further exploit this growing data set
of fossilized cuticle. Therefore, this study focuses on aspectsof modern cuticle, with emphasis on factors that may bepreserved within fossil cuticle.
We use the terminology of Drach (1939) to divide layersof the cuticle into an epicuticle, exocuticle, endocuticle, andmembranous layer (Fig. 2A-D). These subdivisions of thecuticle are recognized on the basis of timing of develop-ment, appearance, and staining characteristics. The epicu-ticle and exocuticle are secreted prior to molting, and theendocuticle and membranous layer form just after the moltoccurs (Drach, 1939; Skinner, 1962; Green and Neff, 1972).
Due to the abundance and economic importance ofCallinectes sapidus, the cuticle of this species has receivedmore attention than other decapods. Vigh and Dendinger(1982) examined calcium, magnesium, chitin, and proteinswithin the cuticle. Marlowe et al. (1994) examined changes inproteins in the cuticle during the molt cycle. Elliott andDillaman (1999) observed the construction of the branchios-tegal cuticle. Williams et al. (2003) focused on the arthrodialmembrane. Priester et al. (2005) studied the cuticle of theecdysial sutures. Dillaman et al. (2005) detailed the initialstages of calcification and its progression within the exocuti-cle. Thus, we used this well-researched species to examine theeffects of growth and sample location on cuticle morphology.
MATERIALS AND METHODS
Specimens of Callinectes sapidus were collected at the SmithsonianEnvironmental Research Center in Edgewater, Maryland, located on the
141

Rhode River of the Chesapeake Bay, during August of 2006. A total of 41specimens, including 13 immature females and 28 mature and immaturemales, were collected in shallow water using seine nets. The crabs wereanesthetized by slow cooling and subsequently stored in 70 percent ethylalcohol. Maximum carapace width was measured between the tips of thelast anterolateral spines, and the carapace length was measured from themaximum projection of the frontal spines to the junction of the carapacewith the first abdominal somite along the midline. With assistance from theSERC staff, molt stage was assessed in the field by examining tissue of thepaddle-shaped propodus and dactylus of the fifth pereiopod. Examination ofthe thin cuticle on these elements allows viewing of the epidermis and itsrelation with the cuticle, thus allowing identification of the molt stage(Drach, 1939). Insufficient numbers of mature females were collected tofully examine their growth, and for this study, we selected only theintermolt males. A few premolt males were also studied to examine thecuticle of the ecdysial suture in preparation for the molt.
Five sample locations on the dorsal carapace were selected forexamination of the cuticle surface and cross section (Fig. 1A). Sectionsof cuticle were excised from the dorsal carapace using either dissectingscissors or a small rotary diamond saw, depending on the thickness of thecuticle. One centimeter wide sections were cut from the carapace so that thedesired line of section was in the center of the excised sample. Sampleswere removed from the merus (Fig. 1B) in a similar manner. Sections werethen rinsed in fresh alcohol and dried at 408C in a cabinet to removemoisture before they were mounted in epoxy blocks. The epoxy blockswere then ground and polished to the desired plane of section and glued toglass slides using a UV light curing resin. Remaining material was cut fromthe slide with a diamond saw, and the sections were ground and polished tothe desired thickness of about 40 microns. The final surface was polishedwith 1200 grit abrasive paper and a coverslip attached with emersion oil. Toretain cuticle that had newly formed underneath the existing cuticle insections cut across the merus (Fig. 1B), samples were freeze dried tostabilize soft tissues before they were embedded in epoxy.
Thin sections were examined with a polarizing microscope using bothplain polarized light (PPL) and cross polarized light (XPL). Surface viewsof the carapace were studied with a reflected light microscope at the same
locations that were thin sectioned, but on opposite sides of the bilaterallysymmetrical carapace. To obtain sufficient contrast on the surface views,the dried surface was coated with vaporized ammonium chloride to createa uniform white surface. The surfaces were then illuminated at low anglesand photographed.
Measurements of the cuticle in thin section and on surface views weretaken on calibrated photomicrographs using NIH Image for the Macintosh.Nodes, or elevated projections of the cuticle surface, were measured byoutlining the node with the freehand selection tool in NIH Image; theprogram then fit an ellipse to the selected area, and from this, the programgenerated minimum and maximum lengths for the nodes. Maximum lengthof the nodes was used in the final analysis, although tests with the minimumlengths showed little difference in the results other than slight changes inmagnitude.
Node and setal pit distribution density was measured by drawinga square of known area over the surface and counting the number offeatures contained within it. Measurements of cuticle thickness were takenby measuring the length of lines drawn perpendicular to the cuticle surface.Measurements were taken of the total thickness (not including themembranous layer), thickness of the endocuticle, and the thickness of themembranous layer only. Exocuticle thickness was calculated by subtractingthe endocuticle thickness from the total thickness.
Changes in density of cuticle features and cuticle thickness wereindividually compared to carapace dimensions using the allometry equation(Raup and Stanley, 1978) which allows quantification of the rate of growthof one part of the organism with that of another:
Y ¼ bXa
Y, the independent variable, is one of the attributes of the cuticle; X, thedependent variable, is carapace size. Values for the constants a and b werefound by fitting power curves to the dimensions using the PC programSPSS (ver. 14) which also calculated R2 and significance levels for thegrowth curve (see Table 1 for values and explanations of the variables). Theconstant b is known as the initial value, and a is the allometric growthcoefficient (Raup and Stanley, 1978).
RESULTS
Cuticle Layers
The uppermost layer of the cuticle, or epicuticle, is onlydistinguishable from the exocuticle at high magnifications(Fig. 2C); consequently, throughout the remainder of thepaper epicuticle is not explicitly differentiated from theexocuticle. The exocuticle is differentiated from the endo-cuticle based on the finer spacing of the exocuticular lami-nations compared to the endocuticle and the presence ofinterprismatic septa (Fig. 2C) in the exocuticle (Travis,1963; Green and Neff, 1972; Dillaman et al., 2005). Inaddition, the upper exocuticle has a light amber color in PPL(Fig. 2C). The appearance of the exocuticle did not varysignificantly between sample locations on the carapace orbetween specimens of different sizes. Thickness of the con-stituent layers and the extent of calcification is variable andis discussed in sections to follow. The membranous layer(Fig. 2A, D) is discussed more thoroughly because of itsabsence in some sections, the implications it has for recog-nition of stages in the decapod molt cycle, and its variationin appearance between decapod taxa (Skinner et al., 1992).
The membranous layer is the last to be deposited, and itspresence within the cuticle is considered indicative of the crabentering the intermolt or C4 stage of the molt cycle (Drach,1939; Travis, 1955, 1960; Drach and Tchernigovtzeff, 1967;Skinner et al., 1992; Promwikorn et al., 2005). Timing ofmembranous layer formation (postmolt) and resorption(premolt) appears to vary between taxa and with samplelocation (Skinner et al., 1992). Our results support thisobservation in Callinectes sapidus.
Fig. 1. A, sample locations on the carapace of Callinectes sapidus.Dashed lines indicate location of thin sections. Letters indicate specific sitesof the observations on the thin section or of the surface. Observations of thecuticle surface were taken from the right side of the carapace at the samelocations indicated by letters on the left. Location B was only observed onthe surface and was not thin sectioned; B, location of thin section takenacross the merus to examine the ecdysial sutures (S).
142 JOURNAL OF CRUSTACEAN BIOLOGY, VOL. 29, NO. 2, 2009
The membranous layer in Callinectes sapidus is similarin appearance to that illustrated in Compere et al. (1998,fig. 21), but differs from the membranous layer in tigershrimp illustrated by Promwikorn et al. (2005, 2007) whosemembranous layer is thicker and maintains a diffuseboundary with the overlying endocuticle (see Skinneret al., 1992, for a discussion of the interspecific variationand possible homologies of the membranous layer amongarthropods). This interspecific variation in appearancemay explain the different terminology used for themembranous layer, for example, the ‘‘uncalcified zone’’ ofDennell (1947).
The membranous layer was distinguished based on itslocation at the base of the endocuticle (Fig. 2D). InCallinectes sapidus, the membranous layer is thin andmaintains a distinct margin with the overlying endocuticle(Fig. 2D). The membranous layer is constructed of finelaminations (Travis, 1960, 1963), although at the magnifi-cations used we were unable to consistently resolve them(Fig. 2D). Some sections did exhibit delamination within themembranous layer, which supports a laminar construction.Recognition of the membranous layer is also aided by itspattern of birefringence under XPL (Figs. 2D, 3E, 3I).Rotation of cuticle thin sections under XPL caused
Fig. 2. Cuticle of Callinectes sapidus in thin section; epi, epicuticle; exo, exocuticle; endo, endocuticle; ml, membranous layer; pc, pore canal; sp, setal pit;tc, tegumental canal; ips, interprismatic septa; cal, calcified region; PPL, plain polarized light; XPL, cross polarized light. A, node construction, PPL, insetshows endocuticle in grey, exocuticle in white; B, setal pit and hair, PPL; C, epicuticle and exocuticle, note darker color (amber) of the epicuticle and upperhalf of the exocuticle, PPL; D, lower endocuticle and membranous layer, XPL, photographed with cuticle sample oriented 45 degrees to planes ofpolarization.
143WAUGH ET AL.: ONTOGENETIC VARIATIONS IN CUTICLE MORPHOLOGY

simultaneous extinction of the entire membranous layer forevery 90 degrees of sample rotation. The birefringence ofthe membranous layer is differentiated from that of thecalcified regions of the cuticle, which exhibits patchyextinction and higher order birefringence colors. Birefrin-gence within calcified regions of the cuticle is lost whensections are treated with acid. Birefringence observed inboth the membranous layer and laminations of endocuticleare acid stable.
In general, morphological indicators used to determinemolt stage in decapods do not necessarily occur simulta-neously throughout the cuticle and integument (Skinneret al., 1992; Cheng and Chang, 1991; Waddy et al., 1995;Elliott and Dillaman, 1999; Williams et al., 2003). Themembranous layer, which defines the beginning of theintermolt, appears to be no exception. In the lateral portionof the dorsal carapace of the fiddler crab, the membranouslayer was recognized one day post-molt after all other layersof the cuticle had been deposited, while at the same time theother layers were still thickening (Green and Neff, 1972),suggesting that the membranous layer may appear before theother cuticle layers have finished developing. The membra-nous layer is not present in the cuticle of the branchiostegalcuticle of C. sapidus (Elliot and Dillaman, 1999).
The membranous layer observed in the prepared samplesof Callinectes sapidus was not consistent in either itspresence or appearance. Thicker and continuous sections ofthe membranous layer were observed in sections containingthe largest percentages of calcified cuticle. In sections thatdisplayed minimal calcification, the membranous layertended to be absent or ragged and discontinuous. Samplesthat lacked the membranous layer were generally less
calcified, suggesting that they were not fully within theintermolt stage, during which the membranous layer shouldbe present (Drach, 1939), or were actively resorbing cuti-cular components. The samples from the three crabs thatwere in the process of forming a new cuticle, indicating theyhad entered the premolt phase, did not possess a membra-nous layer. This is consistent with published accounts ofresorption at this stage. Cuticle sampled on the merus ofpremolt crabs, in which new cuticle secretion had begun, didretain the membranous layer, indicating that the relationshipof the membranous layer to molt stage is somewhat com-plex. Some samples with fully calcified cuticles also lackedthe membranous layer. In these cases it is unclear if it wasmechanically lost during preparation of the thin section or ifthe layer was resorbed in preparation for formation of a newcuticle (Drach, 1939; Travis, 1960; Skinner, 1962; Skinneret al., 1992; Promwikorn et al., 2005). The correlation ofpresence of membranous layer with more completely calci-fied cuticle suggests that the crabs were in the intermoltcondition. Its presence in crabs that were actively forminga new cuticle seems to indicate the membranous layer doesnot necessarily get resorbed.
Lack of calcite within the membranous layer (Travis,1963; Green and Neff, 1972) makes preservation and sub-sequent identification of this layer in fossil material unlikely.Vega et al. (1994), in a study of Costacopluma mexicanaVega and Perrilliat, 1989, described and illustrated a homo-genous layer at the base of the cuticle that may representthe membranous layer, suggesting that its preservation ispossible under some conditions. Regardless of preservationpotential, presence or absence of the membranous layerappears to be of limited value in determining molt stage orthe differentiation of exuvia from corpses in fossil materialbecause of the apparent variation in timing of formation andpossible sensitivity to sample location.
Ecdysial Sutures
At ecdysis, the cuticle ruptures along the ecdysial suturesallowing the organism to withdraw from the old exo-skeleton. These sutures have been examined previously onthe carapace of Callinectes sapidus (Priester et al., 2005).We examined the ecdysial sutures present on the merus(Fig. 1B) to observe their morphology and the extent thatcuticle may be resorbed during ecdysis.
Ecdysial sutures on the merus of three intermolt crabsand nine premolt crabs were thin sectioned; three of thenine premolt crabs sectioned were in the process of forminga new cuticle beneath the existing one in preparation forthe next molt (Fig. 4A). Sutures in all samples, regardlessof molt stage, were visible on the exterior surface of thecuticle before preparation of the thin section. In thin section,a slight depression in the upper margin of the cuticle wasvisible in all cross-sections marking the suture locationvisible on the surface (Fig. 4A-C). Basal margins of thesuture were variable to the extent that cuticle was deflectedupward toward the exocuticle. Localized thinning of thecuticle at the suture zone should not be confused witha broader change of cuticle thickness that extends wellbeyond the suture zone such that cuticle on one side ofthe suture is thinner than the other (Fig. 4A-C); the thinnest
Table 1. Regression results based on the allometry equation Y¼ bXa. Y isthe independent variable; X is the dependant variable; b is initial value, anda is the allometric growth coefficient; Ndensity, node density; Nsize, nodesize; Tendo, thickness of endocuticle; Ttotal, total cuticle thickness; L,carapace length; W, carapace width. Data and units from Appendix 1,which includes male Callinectes sapidus specimens between 2 and 6 cm inlength. Loc, sample location of Y measurements based on Fig. 1. n, numberof data points used to fit curve. * data from Newcombe et al. (1949) formale Callinectes 1.79 to 7.7 cm in length.
Y Loc X n a b R2 Sig.
Ndensity A L 5 �1.633 21.517 0.893 0.015Ndensity B L 5 �2.124 357.427 0.946 0.005Ndensity D L 4 �1.583 59.022 0.981 0.010Ndensity E L 4 �1.317 10.695 0.987 0.007Nsize A L 5 0.587 0.132 0.961 0.003Nsize D L 4 0.447 0.132 0.887 0.058Nsize E L 4 0.386 0.144 0.977 0.012Tendo A L 7 1.089 0.059 0.962 0.000Texo A L 7 0.789 0.024 0.981 0.000Ttotal A L 7 1.023 0.082 0.971 0.000Ttotal C L 7 0.925 0.109 0.926 0.001Ttotal D L 9 0.690 0.142 0.794 0.001Ttotal E L 9 0.899 0.102 0.937 0.000W — L 7 1.163 1.847 0.994 0.000W * L 8 1.087 1.900 0.999 0.000Molt# * L 8 .279 11.26 0.997 0.000E-S * L 8 1.163 0.670 0.999 0.000L * W 8 0.919 0.555 0.999 0.018Molt # * W 8 0.257 9.553 0.993 0.013E-S * W 8 1.070 0.337 1 0.000
144 JOURNAL OF CRUSTACEAN BIOLOGY, VOL. 29, NO. 2, 2009

part of the cuticle both marks this transition and thesuture location.
Endocuticle within the suture zone was generally notcalcified (Fig. 4A, C). At the lateral limits of the suture zoneis a calcified region that extended throughout the entirethickness of the endocuticle, thus differentiating the suturemargin from the remaining endocuticle (Fig. 4A, C). Onlythe upper portions of the exocuticle within the suture werecalcified. The lower exocuticle and interprismatic septaremained uncalcified in contrast to adjacent exocuticle thatwas more completely calcified (Fig. 4C). Lower levels ofcalcification within the exocuticle of the suture zone mayhave allowed some deformation of the exocuticle during the
drying and embedding process accentuating the concavityobserved on the upper margin.
Premolt crabs that were actively secreting a new cuticleexhibited increased levels of cuticular thinning at the suturelocations. This thinning of cuticle within the suture zoneappears to correspond to the progression of new cuticledevelopment. Crabs nearing ecdysis were not successfullysectioned; the sutures fractured during the drying andembedding process. Although these very weak sutures couldnot be examined in thin section, cuticle in the suture zonewas clearly subject to further degradation.
In each thin section cut perpendicular to the long axis ofthe merus, two sutures were intersected. These sections
Fig. 3. Photomicrographs showing the distribution of calcite within the cuticle of Callinectes sapidus, all photomicrographs in XPL except for 3E,membranous layer present in 3.C, E, F, H, I. A, KSU D40, calcification pattern ‘‘0’’; B, KSU D36, calcification pattern ‘‘1’’, upper exocuticle calcified, notecalcite pillows at the base of the canals; C, KSU D30, calcification pattern ‘‘2’’, partial calcification of lower endocuticle, node at upper left, tegumental canalat right (tc); D, KSU D32, calcification pattern ‘‘3’’, calcification of lower endocuticle with uneven upper margin; E, KSU D39, PPL, same view as 3.6, notecalcite in lower endocuticle is darker; F, KSU D39, calcification pattern ‘‘4’’, calcified lower endocuticle with horizontal upper margin; G, KSU D30,calcified lower endocuticle, distinct calcified region surrounding base of tegumental canal; H, KSU D32, node on upper surface with calcified core and lowerendocuticle, composite photomicrograph from multiple planes of focus; I, KSU D40, note chitin birefringence in laminations and membranous layer andisolated calcified region of upper exocuticle.
145WAUGH ET AL.: ONTOGENETIC VARIATIONS IN CUTICLE MORPHOLOGY
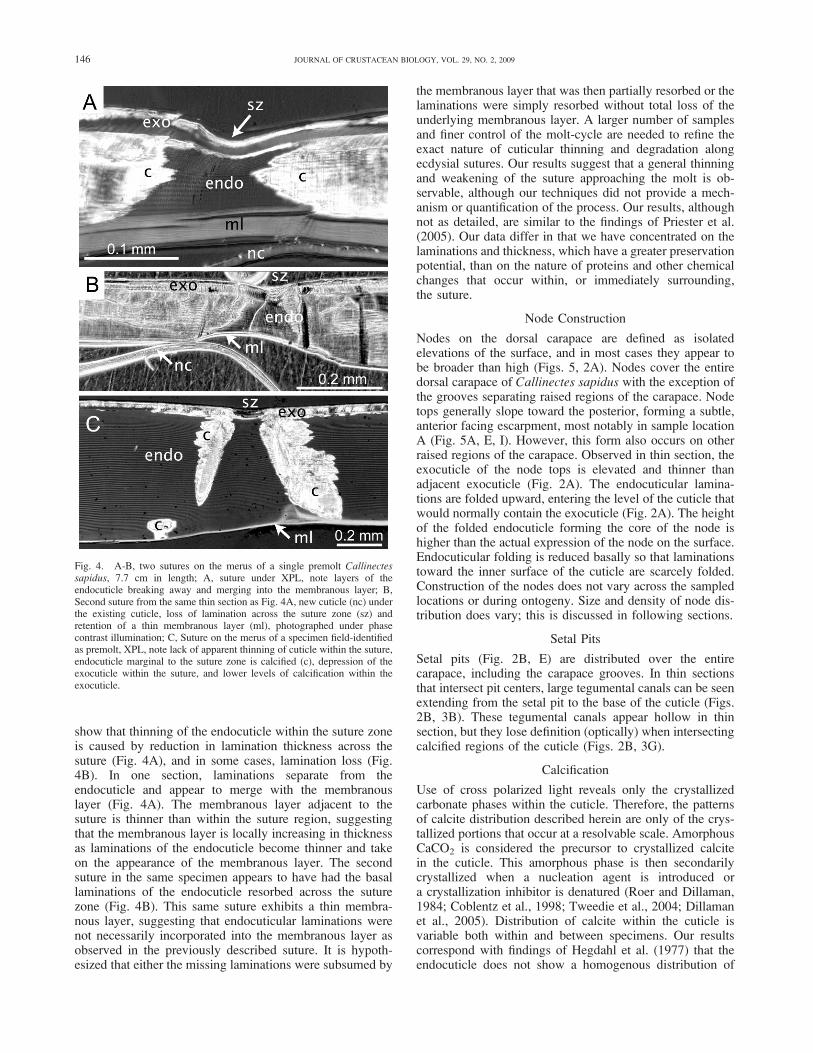
show that thinning of the endocuticle within the suture zoneis caused by reduction in lamination thickness across thesuture (Fig. 4A), and in some cases, lamination loss (Fig.4B). In one section, laminations separate from theendocuticle and appear to merge with the membranouslayer (Fig. 4A). The membranous layer adjacent to thesuture is thinner than within the suture region, suggestingthat the membranous layer is locally increasing in thicknessas laminations of the endocuticle become thinner and takeon the appearance of the membranous layer. The secondsuture in the same specimen appears to have had the basallaminations of the endocuticle resorbed across the suturezone (Fig. 4B). This same suture exhibits a thin membra-nous layer, suggesting that endocuticular laminations werenot necessarily incorporated into the membranous layer asobserved in the previously described suture. It is hypoth-esized that either the missing laminations were subsumed by
the membranous layer that was then partially resorbed or thelaminations were simply resorbed without total loss of theunderlying membranous layer. A larger number of samplesand finer control of the molt-cycle are needed to refine theexact nature of cuticular thinning and degradation alongecdysial sutures. Our results suggest that a general thinningand weakening of the suture approaching the molt is ob-servable, although our techniques did not provide a mech-anism or quantification of the process. Our results, althoughnot as detailed, are similar to the findings of Priester et al.(2005). Our data differ in that we have concentrated on thelaminations and thickness, which have a greater preservationpotential, than on the nature of proteins and other chemicalchanges that occur within, or immediately surrounding,the suture.
Node Construction
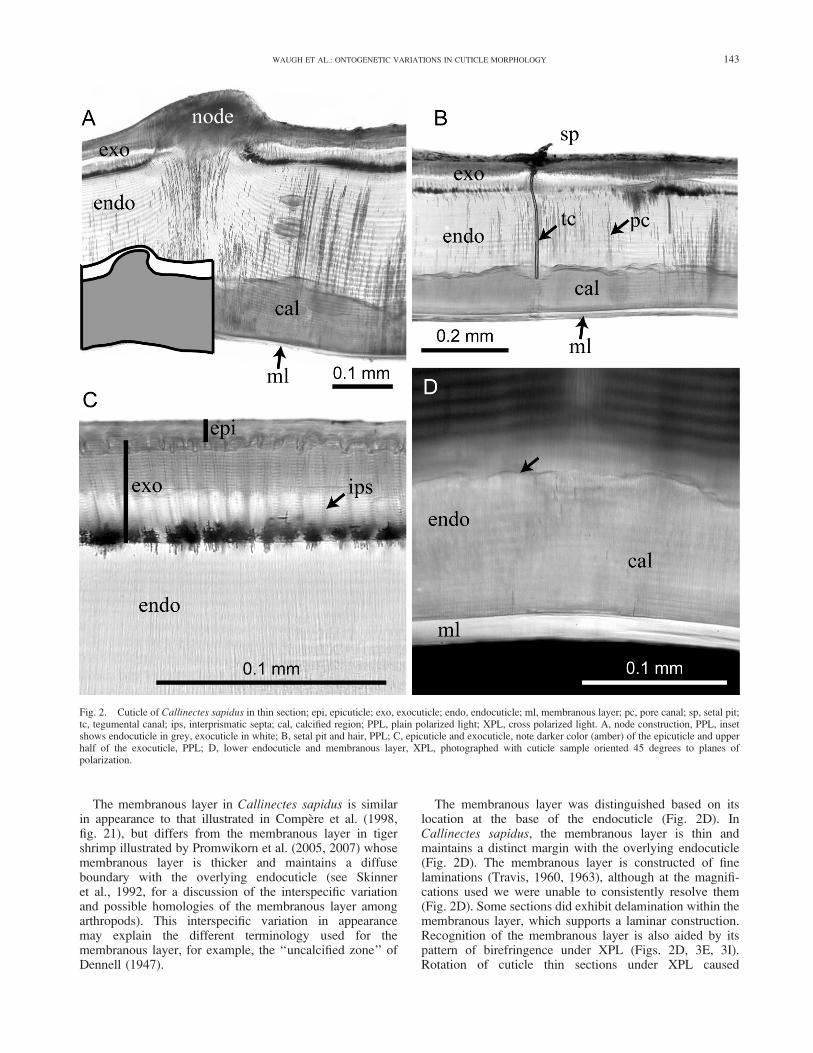
Nodes on the dorsal carapace are defined as isolatedelevations of the surface, and in most cases they appear tobe broader than high (Figs. 5, 2A). Nodes cover the entiredorsal carapace of Callinectes sapidus with the exception ofthe grooves separating raised regions of the carapace. Nodetops generally slope toward the posterior, forming a subtle,anterior facing escarpment, most notably in sample locationA (Fig. 5A, E, I). However, this form also occurs on otherraised regions of the carapace. Observed in thin section, theexocuticle of the node tops is elevated and thinner thanadjacent exocuticle (Fig. 2A). The endocuticular lamina-tions are folded upward, entering the level of the cuticle thatwould normally contain the exocuticle (Fig. 2A). The heightof the folded endocuticle forming the core of the node ishigher than the actual expression of the node on the surface.Endocuticular folding is reduced basally so that laminationstoward the inner surface of the cuticle are scarcely folded.Construction of the nodes does not vary across the sampledlocations or during ontogeny. Size and density of node dis-tribution does vary; this is discussed in following sections.
Setal Pits
Setal pits (Fig. 2B, E) are distributed over the entirecarapace, including the carapace grooves. In thin sectionsthat intersect pit centers, large tegumental canals can be seenextending from the setal pit to the base of the cuticle (Figs.2B, 3B). These tegumental canals appear hollow in thinsection, but they lose definition (optically) when intersectingcalcified regions of the cuticle (Figs. 2B, 3G).
Calcification
Use of cross polarized light reveals only the crystallizedcarbonate phases within the cuticle. Therefore, the patternsof calcite distribution described herein are only of the crys-tallized portions that occur at a resolvable scale. AmorphousCaCO2 is considered the precursor to crystallized calcitein the cuticle. This amorphous phase is then secondarilycrystallized when a nucleation agent is introduced ora crystallization inhibitor is denatured (Roer and Dillaman,1984; Coblentz et al., 1998; Tweedie et al., 2004; Dillamanet al., 2005). Distribution of calcite within the cuticle isvariable both within and between specimens. Our resultscorrespond with findings of Hegdahl et al. (1977) that theendocuticle does not show a homogenous distribution of
Fig. 4. A-B, two sutures on the merus of a single premolt Callinectessapidus, 7.7 cm in length; A, suture under XPL, note layers of theendocuticle breaking away and merging into the membranous layer; B,Second suture from the same thin section as Fig. 4A, new cuticle (nc) underthe existing cuticle, loss of lamination across the suture zone (sz) andretention of a thin membranous layer (ml), photographed under phasecontrast illumination; C, Suture on the merus of a specimen field-identifiedas premolt, XPL, note lack of apparent thinning of cuticle within the suture,endocuticle marginal to the suture zone is calcified (c), depression of theexocuticle within the suture, and lower levels of calcification within theexocuticle.
146 JOURNAL OF CRUSTACEAN BIOLOGY, VOL. 29, NO. 2, 2009

calcite. The extent and pattern of calcification at the samplelocations was qualitatively scored by creating models of thedistribution pattern constructed with observed variations inall the sections. These patterns of calcification are identifiedwith numbers in Appendix 1 and are illustrated in Figure 3.Individual samples could then be matched to the modelmost closely characterizing the pattern observed in a singlespecimen. One pattern of calcification was found withinthe exocuticle, and five patterns were discernable within theendocuticle. In the exocuticle, calcification consisted ofa continuous layer in the upper exocuticle (Fig. 3A-D).This layer in the exocuticle ranged from one-quarter tothree-quarters of the upper exocuticle thickness. No samplescontained a completely uncalcified exocuticle.
The endocuticle displays more diversity than theexocuticle in calcification patterns, ranging from completecalcification to near absence. The most typical form isa calcified layer that appears within the lower portion ofthe endocuticle, extending from the top of the membranouslayer or base of the endocuticle in cases where the mem-branous layer is absent (Fig. 3F). The upper boundaryof the calcified band is typically parallel to the surface of
the cuticle and follows internal laminations. An additionalpattern of calcification involves the same band of calcitewithin the lower endocuticle, but with isolated projectionsand irregularities of the upper limit (Fig. 3D). Calcite mayalso appear as isolated ‘‘pillows’’ at the base of the endo-cuticle (Fig. 3B). These pillows, when present, are typicallyobserved with the same tegumental canals associated withthe setal pits (Fig. 3B, D).
Calcified cuticle was also found in laminations that arefolded to form the nodes (Fig. 3H). Recognition of calcite inthe core of the node is dependent on the thin section bi-secting the node axially. Since the orientation of the thinsection relative to the node axis cannot be controlled finelyenough to transect each node, spatial trends were notdiscernable.
Although the cuticle and structures of the dorsal carapacewere the main focus of this study, some of the preparedsections also contained subdorsal portions of the carapace.Calcification in these regions differed from patterns ob-served in the dorsal carapace. These subdorsal portions ofthe carapace were the only regions that contained a fullycalcified endocuticle. However, the distribution of calcite
Fig. 5. Photomicrographic matrix of Callinectes sapidus surface features and thin sections. Rows represent individual sampled crab with length indicated atleft. Columns represent sample locations (Fig. 1), with locations indicated at the top of each column. First row (A-D), KSU D23, 2.3 cm in length; secondrow (E-H), KSU D30, 3.7 cm in length, arrow indicates small node; third row (I-L), KSU D39, 5.7 cm in length. Thin section photomicrographs (D, H, L)taken under PPL. Scale for all surfaces shown in Fig. 5K; scale for all thin sections shown in Fig. 5L.
147WAUGH ET AL.: ONTOGENETIC VARIATIONS IN CUTICLE MORPHOLOGY

was generally irregular. Limited sections retained thesubdorsal portions of the carapace so the variation in theseregions cannot be fully documented.
It appears that complete calcification of the upperexocuticle and lower endocuticle represent the maximumdegree of calcification of the dorsal carapace in maleCallinectes sapidus up to 6 cm in length. The exocuticle andthe epicuticle are the first layers of the cuticle to calcify(Dillaman et al., 2005), and that condition apparentlyremains stable throughout ontogeny. Based on sections thatcontain less calcified regions (Fig. 3A-C, I), judging thatthey represent intermediate stages of calcification, a fewhypotheses regarding the progression of mineralizationwithin the endocuticle can be made. In one model,crystallization would originate in the endocuticle radiatingfrom the base of the tegumental canals. As the calcificationfront spreads, nucleation points (Fig. 3B) would coalescehorizontally to form a discontinuous layer (Fig. 3C) andthen finally a continuous layer of calcite within theendocuticle (Fig. 3F). Another possibility is that twodifferent sources account for the calcification; one thatoriginates from the tegumental canals and another originat-ing from the pore canals. Fluids originating from the porecanals that appear at a much higher density than thetegumental canals, would account for the broad horizontalsheets that follow laminations of the endocuticle. A two-source model is supported by the seemingly differentmorphology of calcite surrounding the tegumental canals.
Calcification of the exocuticle in Callinectes sapidusproceeds simultaneously from both the top and bottom ofthe layer containing the inter-prismatic septa (Dillamanet al., 2005), making the presence of two sources in theendocuticle plausible. Both pore (Travis, 1957, 1963; Greenand Neff, 1972) and tegumental canals would allow fluidexchange between the epidermis and the cuticle. Calcifiedcuticle within the lower endocuticle often maintainsa horizontal transition with the upper non-calcified cuticle(Fig. 3F). The calcite surrounding tegumental canals canstill be differentiated from the surrounding calcified cuticlewhen present, based on crystal orientations observed undercross-polarized light (Fig. 3G). The distinction between thesmooth and jagged upper boundary of the calcite withinthe endocuticle may be somewhat artificial and may onlyrepresent an intermediate stage of calcification or intrinsicproperties of the cuticle as it was formed. The largest crabstudied that had a significant amount of calcite exhibited themost planar transition between calcified and uncalcifiedendocuticle. Larger crabs also have longer intermolt periods(Churchill, 1919; Vega-Villasante et al., 2007), allowingmore time for mineralization and increasing the likelihoodthat they would be collected during the intermolt phasewhen the cuticle is fully formed and calcified. At this timeit has not been possible to determine if the calcite surround-ing nucleation points simply coalesces to form the planarlayer of calcified cuticle in the lower endocuticle, or iftwo vectors exist for the distribution of CaCO3 or fluidsthat initiate crystallization that result in two calcificationpatterns. Radiation from both point and linear sources fitsthe observed pattern seen at the base of the tegumentalcanals and suggests that, regardless of when the calcite is
incorporated into the cuticle, the crystallization is secondaryto the secretion of the bulk of the endocuticle. Secondarymineralization in the endocuticle of Callinectes sapidus hasbeen observed by Roer and Dillaman (1993). This processmust therefore take place after formation of the cuticle and isnot compatible with the idea that the endocuticle is calcifiedat the same time that it is being formed (Drach, 1939;Travis, 1957, 1963). It is important to note that the crys-tallization does not necessarily take place at the same timethat the calcium is incorporated into the cuticle, so theresults from studies that use methods that detect calciummay differ from those using methods that only detectcrystalline phases.
Morphometrics
Overview.—Morphometric analysis of decapod dimensionshas been used extensively to study taxonomic, ontogenetic,and ecologic questions (Finney and Abele, 1981; Olmi andBishop, 1983; Restrepo, 1989; Josileen and Menon, 2005;Guimaraes and Negreiros-Fransozo, 2005; Rufino et al.,2006). Species of commercial value such as Callinectessapidus have been studied more intensively in an effort toestablish age and growth models used in assessing fisheryconditions (Miller and Smith, 2003). Morphometric studiesconcerning parameters of the cuticle have been less com-mon, although thickness of the cuticle in comparison tobody volume has been studied in terms of its effect on thespecific gravity of crustaceans (Putz and Buchholz, 1991;Amato et al., 2008). Cuticle thickness is often a componentin studies of the molt cycle used to monitor secretion of thenew cuticle and resorption of the old cuticle; in thesestudies, effects of ontogeny are typically not incorporated(Pratoomchat et al., 2002). Our data cover many aspects ofthe cuticle including total thickness, exocuticle thickness,endocuticle thickness, node size, and the distribution densityof nodes and pits on the carapace surface. When comparedto carapace dimensions such as width and length, it is clearthat these metrics are correlated with growth, although theabsolute values and rates of change may vary with samplelocation on the carapace.
Pits and Nodes.—The node distribution density varies withboth sample location and carapace size (Figs. 5, 6A). Fornodes from a given sample location, density decreases withcarapace size (Fig. 6A). Densities were highest in samplelocation B and lowest in E. The change in density showspositive allometry compared to carapace length for allsample locations. Although the growth constant is a negativevalue, its absolute value is greater than one (Table 1).Smaller nodes are apparently introduced between the largernodes during growth (Fig. 5E). The effect on density isunclear, but introduction of smaller nodes must occur ata slower rate than the internodal space increases as shownby the continued decline in density. In carapaces approx-imately 4 cm in length there appears to be a subtle changein the rate of decline of the node density (Fig. 6A). Thischange may be a result of fluctuation in growth ratesassociated with reaching maturity.
Average node diameter is positively correlated withcarapace dimension (Fig. 6B). The largest sizes appear insample location A and smallest in location B. Average node
148 JOURNAL OF CRUSTACEAN BIOLOGY, VOL. 29, NO. 2, 2009

sizes from all sample locations have an allometric growthconstant less than one and therefore have a negativeallometry compared to carapace length (Table 1). Histo-grams of individual measurements made on the samplelocations D show that the node size distribution ismultimodal (Fig. 6C), suggesting continued growth of eachnode population introduced during successive molts. Astasis in node size expansion occurs around carapace lengthsof 4 cm and may be caused by an increased rate in theintroduction of smaller nodes, or, as will be discussed infollowing sections, may correspond to reaching sexualmaturity. Histograms of node sizes indicate that there isa continual increase in the largest node size fraction (Fig.6C). This increase is partially masked when comparingaverage values of the node sizes (Fig. 6B). The incrementalnature of arthropod growth appears to be imprinted on thenode size distribution and indicates that simple metrics suchas average node size may mask some complexities.
An increase in node size and a decrease in node densitywith growth suggest that the epidermis does not secretecuticle with nodes of a fixed density and size at each molt;rather, features are preserved and enlarged through succes-sive instars. This can be seen in the continued increase of thelargest node size fraction, but with retention of size classesin the histograms (Fig. 6C). The model of pure expansion ofexisting features described above is only one component ofcuticle growth. The apparent insertion of new smaller nodesindicates that the epidermis does add new features at eachinstar.
The density distribution of setal pits, although variablebetween sample locations, shows an increase in densitycorresponding to carapace size, with an abrupt densitydecline in the largest specimens in all but location A andlocation E in one specimen (Fig. 7). The initial increase inpit density, in contrast to the continual decline of nodedensity, indicates that setal pits are introduced at a rate fast
enough to prevent the predicted decline that would occur onan expanding surface with a fixed number of pits. The smallsize of the pits in relation to the nodes resulted in difficultycounting pits at the scales used in the photomicrographs,especially when the surface was abraded. This problemreduces our confidence in this data, although the generaltrend of increasing density, followed by decline or stasis,does seem apparent.
The trend in pit density appears to correspond to changesin the percent increase in carapace dimensions that occurwith each successive molt (Fig. 8). Although carapace sizealways increases at each molt, the magnitude and thepercentage of that increase do not (Newcombe et al., 1949).
Fig. 6. Density and size of nodes distributed on the carapace of Callinectes sapidus; sample locations correspond to those shown in Fig. 1A, nodedistribution density plotted against maximum carapace length; B, average node size plotted against maximum carapace length; graph shares legend with Fig.6A; C, histograms of node size distributions from the D sample location, carapace length indicated in upper right of each histogram; axes for all histogramson bottom histogram; # ¼ Indicates number of values for a given size on the horizontal axis.
Fig. 7. Pit distribution density plotted against carapace length.
149WAUGH ET AL.: ONTOGENETIC VARIATIONS IN CUTICLE MORPHOLOGY

Without more data it would be premature to directlyattribute changes in pit densities to the percent increase ofcarapace dimensions at each molt, but it is apparent that thesetal pit density is influenced by factors differing from thoseaffecting node density and that the percentage that a cuticlemust expand at each molt should influence the density ofany cuticular surface feature.
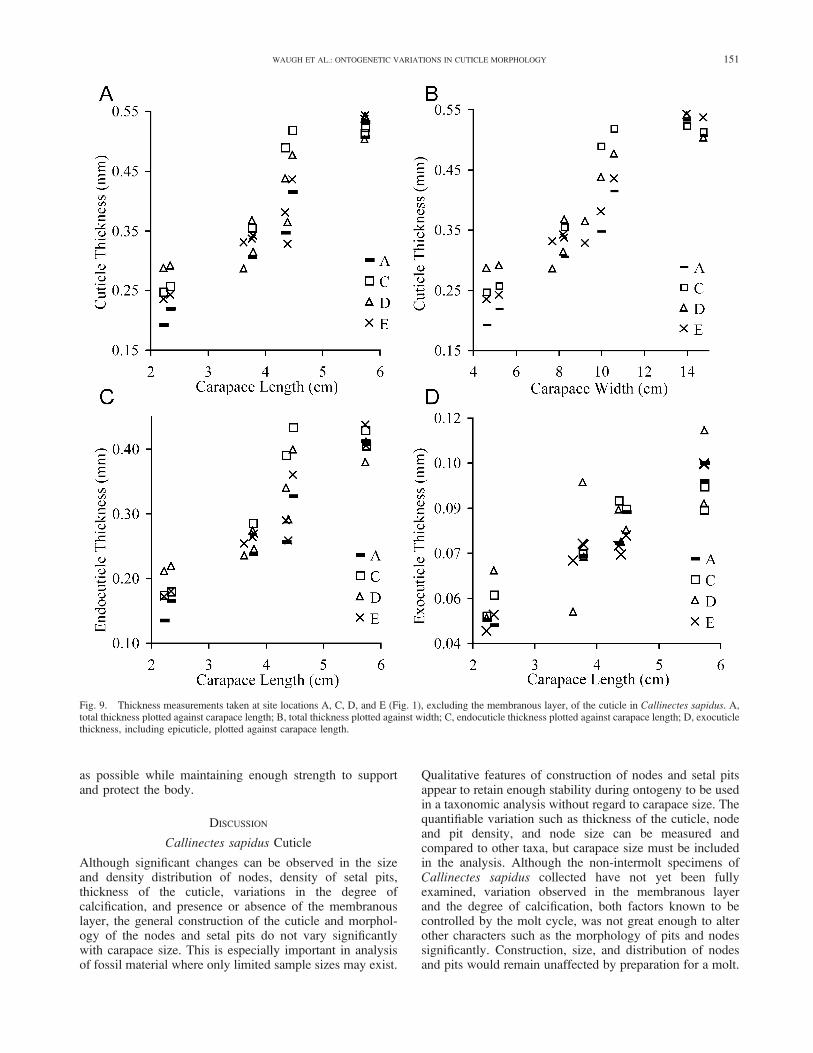
Cuticle Thickness.—The total thickness of the cuticlesampled on the dorsal carapace is positively correlated(R ¼ 0.946) with carapace size (Fig. 9A, B). Additionally,the cuticle thickness varies with sample location, even onthe dorsal carapace of a single specimen (Fig. 9A, B). Totalthickness of the cuticle, excluding the membranous layer,shows near isometric growth in sample locations A and Cand negative allometry in the D and E sample locations(Table 1). The exocuticle and epicuticle, taken together,increase in thickness at a slower rate than the rate of increaseof the endocuticle, resulting in a decrease in the percentageof the exocuticle contribution to the total thickness (Fig. 10),although the endocuticle and exocuticle both continue tothicken (Fig. 9C, D). The allometric equation for growth of
the exocuticle in region D does not support the general trendof decreasing exocuticle growth rate seen in the othersample locations. Two of the specimens included in the Dand E thickness measurements were in the process offorming a new cuticle and their inclusion may have bothaltered the allometry constants and accounted for the poor fitof the allometry curve (R2¼ 0.794) compared to the higherR2 values for other regions.
The rate of increasing total thickness is fairly consistentbetween the sampled regions except for the largest samples,where the increase in thickness slows and the variability ofthickness between sample locations is reduced (Fig. 9A, B).In the two smallest specimens, sample location D is thethickest; sample location C becomes the thickest in the mid-size carapaces. The variability in growth rates could be anartifact caused by differential inflation of carapace regions,mechanics of sampling a curved surface, or slight deviationin the selection of sample locations from specimen tospecimen. Measurements of total cuticle thickness taken onan entire transect of one cuticle section show the highvariability of thickness across the carapace and show thevariation between sampled locations and possible errorsinduced by slight deviations from the intended samplelocations (Fig. 11A). Variability along this transect showsthat carapace cuticle thickness cannot be reduced to a singlemeasurement and that cuticle thickness should be reportedalong with sample location.
Supporting the observation of increasing endocuticlethickness on the dorsal carapace, measurements taken of theendocuticle thickness on sections of the merus displaya similar trend of increasing thickness (Fig. 11B). Theendocuticle of the merus is initially thinner than theendocuticle of the dorsal carapace in crabs of smaller size.For carapaces around 5 cm in length the trend of endocuticlethickness in the merus appears to cross and become greaterthan the cuticle thickness of the carapace (Fig. 11B). Thetwo points that deviate from this trend were two samplesthat came from the left merus, which is the appendagecontaining the smaller claw. This thinner endocuticleassociated with the smaller of the two crabs suggests thatthe cuticle of the merus is also a function of claw asymmetryin addition to ontogeny.
Putz and Buchholz (1991) studied cuticle thickness inan array of taxa and found that when compared to bodyvolume, pelagic species did not continue to significantlythicken their cuticle during growth, while benthic and nekto-benthic species displayed continued increase in cuticlethickness. They attributed these different growth rates toselection pressure for increasing buoyancy by the reductionof heavy skeletal components such as the cuticle. It isdifficult to compare data on cuticle thickness in relation tobody volume because of the effect that body shape has onthe rate volume increases with growth. Use of volumemakes sense when density is concerned, as studied by Putzand Buchholz (1991), but our data concerning the rate ofsize increase to cuticle thickness cannot be compareddirectly to their data. The well known swimming abilities ofCallinectes sapidus should be aided by a decrease indensity; therefore, there should be some selection pressureon maintaining a cuticle that is as thin and weakly calcified
Fig. 8. Stacked graphs comparing previously collected data on increase inlength from the last instar, and new data on the cuticle, all plotted againstcarapace length. A, all data from Newcombe et al. (1949), percent increasein carapace length from last instar for male Callinectes sapidus and theabsolute increase in carapace length from the last molt, solid stars indicateaverage size at each instar, instar numbers indicated next to star; B, pitdensity and node density against carapace length; C, cuticle thickness.
150 JOURNAL OF CRUSTACEAN BIOLOGY, VOL. 29, NO. 2, 2009
as possible while maintaining enough strength to supportand protect the body.
DISCUSSION
Callinectes sapidus Cuticle
Although significant changes can be observed in the sizeand density distribution of nodes, density of setal pits,thickness of the cuticle, variations in the degree ofcalcification, and presence or absence of the membranouslayer, the general construction of the cuticle and morphol-ogy of the nodes and setal pits do not vary significantlywith carapace size. This is especially important in analysisof fossil material where only limited sample sizes may exist.
Qualitative features of construction of nodes and setal pitsappear to retain enough stability during ontogeny to be usedin a taxonomic analysis without regard to carapace size. Thequantifiable variation such as thickness of the cuticle, nodeand pit density, and node size can be measured andcompared to other taxa, but carapace size must be includedin the analysis. Although the non-intermolt specimens ofCallinectes sapidus collected have not yet been fullyexamined, variation observed in the membranous layerand the degree of calcification, both factors known to becontrolled by the molt cycle, was not great enough to alterother characters such as the morphology of pits and nodessignificantly. Construction, size, and distribution of nodesand pits would remain unaffected by preparation for a molt.
Fig. 9. Thickness measurements taken at site locations A, C, D, and E (Fig. 1), excluding the membranous layer, of the cuticle in Callinectes sapidus. A,total thickness plotted against carapace length; B, total thickness plotted against width; C, endocuticle thickness plotted against carapace length; D, exocuticlethickness, including epicuticle, plotted against carapace length.
151WAUGH ET AL.: ONTOGENETIC VARIATIONS IN CUTICLE MORPHOLOGY

The changes in calcification are significant even in samplesof extant crabs judged to be in the intermolt stage,suggesting that distribution of calcite within the cuticleshould be used with caution in taxonomic work involvingfossils unless enough individuals of a population can bestudied to ascertain the full range of variation and rule outdiagenetic alteration in fossil specimens. The inconsistencyin the presence or absence of the membranous layer,compounded by issues of preservation, make paleontologic
use of the membranous layer problematic. In addition to thetaxonomic implications, the thicknesses of the cuticle andthe amount of calcite have adaptive implications such asprotection and buoyancy regulation (Putz and Buchholz,1991; Amato et al., 2008).
Ontogenetic Implications
Decapods do not grow continuously, but rather growincrementally at each molt. This incremental growth mayvary in both the magnitude of expansion of a particularmorphometric parameter and in the time interval betweensuccessive molts. Change of instar duration and rate ofgrowth may correspond to events in the life cycle such asreaching the juvenile stage or attainment of sexual maturity(Haefner and Van Engel, 1975; Somerton, 1980; Hartnoll,1978; Donaldson, 1981; Restrepo, 1989; Josileen andMenon, 2005; Guimaraes and Negreiros-Fransozo, 2005).These growth parameters can be determined by observinglaboratory-raised populations, or by carefully tagging andrecollecting natural populations. The growth rate, ora change in growth rate, is determined by the comparisonof two morphometric measurements in cases where age isunknown. Percent increase in growth at each molt andmolt number are known in a few extant species, includingCallinectes sapidus. In C. sapidus, shifts in intermoltduration and magnitude of growth can be seen in theseventh and sixteenth instars, corresponding to the end ofprepuberty and sexual maturity respectively (Newcombeet al., 1949). Our data on the cuticle span the fourteenthand eighteenth instars in which sexual maturity is reached(Newcombe et al., 1949). These growth rate changes areapparent even in the limited data collected on the node andsetal pit density, node size, and cuticle thickness in C.sapidus plotted with data from Newcombe et al. (1949) (Fig.8). Populations of fossil decapods should exhibit similargrowth rate changes, and the possibility exists that such
Fig. 10. Percent contribution of the endocuticle, axis y1, upper dashedline, and exocuticle, lower dashed line, to the total cuticle thickness plottedagainst carapace length. Upper black line is the growth curve forendocuticle thickness, axis y2, and lower black line is the curve forexocuticle thickness. Actual data points for thickness are also plotted andappear next to their respective growth curves.
Fig. 11. A, Thickness measurements across the entire length of a thin section that contained sample locations E and D for a crab with a carapace length of5.75 cm plotted against distance of the measurement from the anterior of the carapace, length on graph exceeds carapace length due to curvature of the dorsalcarapace; B, Graph of endocuticle thickness of the merus (M) and sample location D on the dorsal carapace (Fig. 1A) plotted against carapace length.
152 JOURNAL OF CRUSTACEAN BIOLOGY, VOL. 29, NO. 2, 2009
metrics could be applied to fossil populations to infer theirage structures and distinguish juveniles from adults if thespecies under examination shows a significant change ingrowth rate. Inclusion of a large number of measurementsincreases the likelihood of finding these rate changesbecause a change need not be apparent in all growthparameters. Identification of a change in the rate of growth ismore likely to be recognized than is the distance betweenclusters representing the incremental growth at each instar,especially within small sample populations. Surface featuredensity is an attractive metric because the measurement isnondestructive and even cuticle which is damaged mayretain remnants of surface sculpture. Further work will testthe hypothesis that these rate changes can be recognized infossil populations.
Comparison with Other Species
Working with a growth series of Callinectes sapidus allowsmorphometric data from cuticle to be examined in thecontext of ontogeny. If morphometric data of the cuticle areto be used in a phylogenetic context, the data must bedemonstrated to be unique within a taxon and recognizablydifferent between taxa.
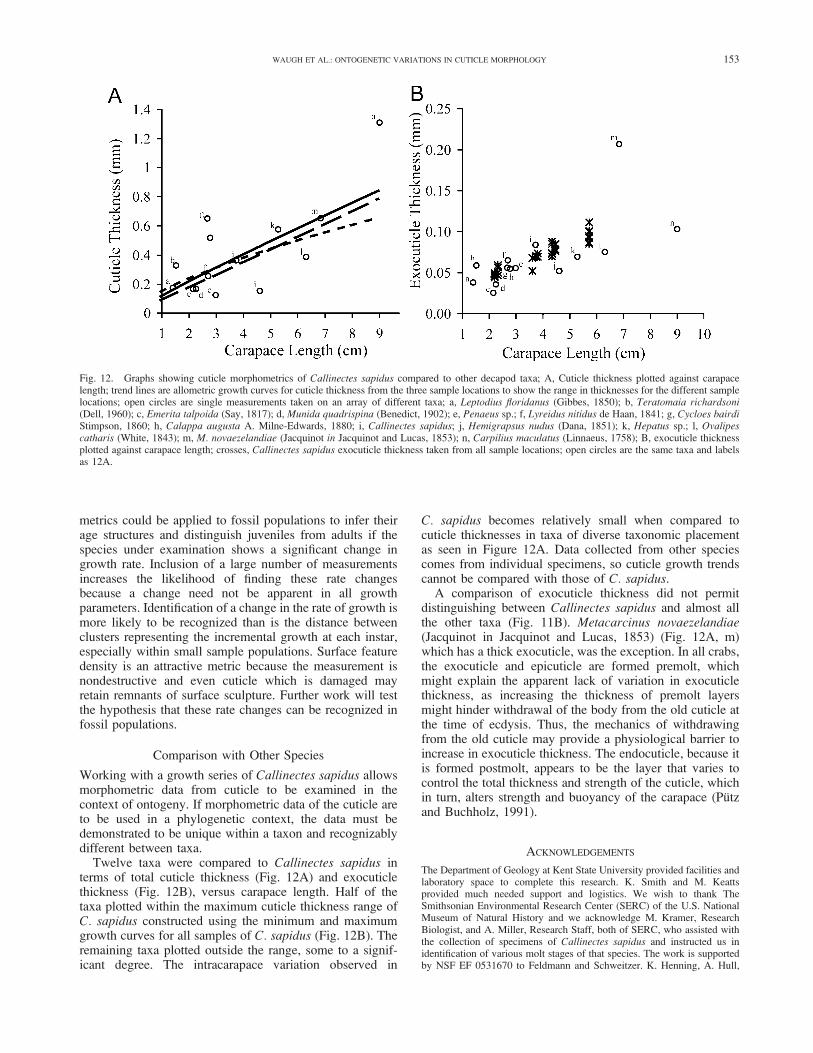
Twelve taxa were compared to Callinectes sapidus interms of total cuticle thickness (Fig. 12A) and exocuticlethickness (Fig. 12B), versus carapace length. Half of thetaxa plotted within the maximum cuticle thickness range ofC. sapidus constructed using the minimum and maximumgrowth curves for all samples of C. sapidus (Fig. 12B). Theremaining taxa plotted outside the range, some to a signif-icant degree. The intracarapace variation observed in
C. sapidus becomes relatively small when compared tocuticle thicknesses in taxa of diverse taxonomic placementas seen in Figure 12A. Data collected from other speciescomes from individual specimens, so cuticle growth trendscannot be compared with those of C. sapidus.
A comparison of exocuticle thickness did not permitdistinguishing between Callinectes sapidus and almost allthe other taxa (Fig. 11B). Metacarcinus novaezelandiae(Jacquinot in Jacquinot and Lucas, 1853) (Fig. 12A, m)which has a thick exocuticle, was the exception. In all crabs,the exocuticle and epicuticle are formed premolt, whichmight explain the apparent lack of variation in exocuticlethickness, as increasing the thickness of premolt layersmight hinder withdrawal of the body from the old cuticle atthe time of ecdysis. Thus, the mechanics of withdrawingfrom the old cuticle may provide a physiological barrier toincrease in exocuticle thickness. The endocuticle, because itis formed postmolt, appears to be the layer that varies tocontrol the total thickness and strength of the cuticle, whichin turn, alters strength and buoyancy of the carapace (Putzand Buchholz, 1991).
ACKNOWLEDGEMENTS
The Department of Geology at Kent State University provided facilities andlaboratory space to complete this research. K. Smith and M. Keattsprovided much needed support and logistics. We wish to thank TheSmithsonian Environmental Research Center (SERC) of the U.S. NationalMuseum of Natural History and we acknowledge M. Kramer, ResearchBiologist, and A. Miller, Research Staff, both of SERC, who assisted withthe collection of specimens of Callinectes sapidus and instructed us inidentification of various molt stages of that species. The work is supportedby NSF EF 0531670 to Feldmann and Schweitzer. K. Henning, A. Hull,
Fig. 12. Graphs showing cuticle morphometrics of Callinectes sapidus compared to other decapod taxa; A, Cuticle thickness plotted against carapacelength; trend lines are allometric growth curves for cuticle thickness from the three sample locations to show the range in thicknesses for the different samplelocations; open circles are single measurements taken on an array of different taxa; a, Leptodius floridanus (Gibbes, 1850); b, Teratomaia richardsoni(Dell, 1960); c, Emerita talpoida (Say, 1817); d, Munida quadrispina (Benedict, 1902); e, Penaeus sp.; f, Lyreidus nitidus de Haan, 1841; g, Cycloes bairdiStimpson, 1860; h, Calappa augusta A. Milne-Edwards, 1880; i, Callinectes sapidus; j, Hemigrapsus nudus (Dana, 1851); k, Hepatus sp.; l, Ovalipescatharis (White, 1843); m, M. novaezelandiae (Jacquinot in Jacquinot and Lucas, 1853); n, Carpilius maculatus (Linnaeus, 1758); B, exocuticle thicknessplotted against carapace length; crosses, Callinectes sapidus exocuticle thickness taken from all sample locations; open circles are the same taxa and labelsas 12A.
153WAUGH ET AL.: ONTOGENETIC VARIATIONS IN CUTICLE MORPHOLOGY

and K. Hein were supported under the auspices of a Research Experiencefor Undergraduates (REU) supplement to the above-mentioned grant.
REFERENCES
Amato, C., D. A. Waugh, R. M. Feldmann, and C. E. Schweitzer. 2008.Effect of calcification patterns on cuticle density in decapods: a key tolifestyle. Journal of Custacean Biology 28: 587-595.
Benedict, J. E. 1902. Description of a new genus and forty-six newspecies of crustaceans of the family Galatheidae, with a list of the knownmarine species. Proceedings of the United States National Museum 26:243-334.
Briggs, D. E. G., B. A. Stankiewicz, D. Meischner, A. Bierstedt, and R. P.Evershed. 1998. Taphonomy of arthropod cuticles from Pliocene lakesediments, Willershausen, Germany. Palaios 13: 386-394.
Cheng, J. H., and E. S. Chang. 1991. Ecdysteroid treatment delays ecdysisin the lobster, Homarus americanus. Biological Bulletin 181: 169-174.
Churchill, E. P., Jr. 1919. Life history of the blue crab. Bulletin of theBureau of Fisheries 36: 95-128.
Coblentz, F. E., T. H. Shafer, and R. D. Roer. 1998. Cuticular proteins fromthe blue crab alter in vitro calcium carbonate mineralization. Compar-ative Biochemistry and Physiology - Part B: Biochemistry and MolecularBiology 121: 349-360.
Compere, P., A. Thorez, and G. Goffinet. 1998. Fine structural survey ofold cuticle degradation during pre-ecdysis in two European Atlanticcrabs. Tissue and Cell 30: 41-56.
Dana, J. D. 1851. Conspectus Crustaceorum quae in Orbis Terrarumcircumnavigatione, Carolo Wilkes e Classe Republicae Faederatae Duce,lexit et descripsit. Proceedings of the Academy of Natural Sciences ofPhiladelphia 5: 247-254.
de Haan, W. (1833-1849). Crustacea. In, P. F. Von Siebold (ed.), FaunaJaponica 4, XVII, XXXI, J. Muller, Amsterdam.
Dell, R. K. 1960. Crabs (Decapoda, Brachyura) of the Chatham Islands1954 Expedition. New Zealand Department of Science and IndustryResearch Bulletin 139 (1) (New Zealand Oceanographic InstitutionMemoir No. 4): 1-8, 2 pls.
Dennell, R. 1947. A study of an insect cuticle: the formation of thepuparium of Sarcophaga falculata Pand. (Dipt.). Proceeding of theRoyal Society of London Part B 134: 79-110.
Dillaman, R. M., S. Hequembourg, and M. Gay. 2005. Early pattern ofcalcification in the dorsal carapace of the blue crab, Callinectessapidus. Journal of Morphology 263: 356-374.
Donaldson, W. F. 1981. Growth, age and size at maturity of tanner crabChionoecetes bairdi M. J. Rathbun in the northern gulf of Alaska(Decapoda, Brachyura). Crustaceana 40: 286-302.
Drach, P. 1939. Mue et cycle d’intermue chez les crustacesdecapodes. Annales de l’Institut Oceanographique, Paris 19: 103-391.
———, and C. Tchernigovtzeff. 1967. Sur la methode de determination desstades d’intermue et son application generale aux crustaces. Vie Milieu18: 595-610.
Elliott, E. A., and R. M. Dillaman. 1999. Formation of the branchiostegalcuticle of the blue crab, Callinectes sapidus. Journal of Morphology240: 267-281.
Feldmann, R. M., and D. Tshudy. 1987. Ultrastructure in cuticle fromHoploparia stokesi (Decapoda: Nephropidae) from the Lopez deBertodano Formation (Late Cretaceous-Paleocene) of Seymour Island,Antarctica. Journal of Paleontology 61 (6): 1194-1203.
———, and A. Gazdzicki. 1998. Cuticular ultrastructure of fossil andliving homolodromiid crabs (Decapoda: Brachyura). Acta Palaeonto-logica Polonica 43: 1-19.
Finney, W. C., and L. G. Abele. 1981. Allometric variation and sexualmaturity in the obligate coral commensal Trapezia ferruginea Latreille(Decapoda, Xanthidae). Crustaceana 41: 113-130.
Gibbes, L. R. 1850. On the carcinological collections of the cabinets ofnatural history in the United States with an enumeration of the speciescontained therein, and descriptions of new species. Proceedings of theThird Meeting of the American Association for Advancement of Science3: 167-201.
Green, J. P., and M. R. Neff. 1972. A survey of the fine structure of theintegument of the fiddler crab. Tissue and Cell 4: 137-171.
Guimaraes, F. J., and M. L. Negreiros-Fransozo. 2005. Juvenile develop-ment and growth patterns in the mud crab Eurytium limosum (Say, 1818)(Decapoda, Brachyura, Xanthidae) under laboratory conditions. Journalof Natural History 39: 2145-2161.
Guinot, D., and G. Breton. 2006. Lithophylax trigeri A. Milne-Edwards &Brocchi, 1879 from the French Cretaceous (Cenomanian) and placementof the family Lithophylacidae Van Straelen, 1936 (Crustacea, Decapoda,Brachyura). Geodiversitas 28: 591-633.
Haefner, P. A., Jr., and W. A. Van Engel. 1975. Aspects of molting, growthand survival of male rock crabs, Cancer irroratus, in ChesapeakeBay. Chesapeake Science 16: 253-265.
Haj, A. E., and R. M. Feldmann. 2002. Functional morphology andtaxonomic significance of a novel cuticular structure in CretaceousRaninid crabs (Decapoda: Brachyura: Raninidae). Journal of Paleontol-ogy 76: 472-485.
Hartnoll, R. G. 1978. The determination of relative growth in crustacea.Crustaceana 34: 281-292.
Hegdahl, T., J. Silness, and E. Gustavsen. 1977. The structure andmineralization of the carapace of the crab (Cancer pagurus L.). 1. theendocuticle. Zoologica Scripts 6: 89-99.
Jacquinot, H., and H. Lucas. 1853. Voyage au Pole Sud et dans l’Oceaniesur les Corvettes L’Astrolabe et La Zelee. Zoologie 3, Crustaces. Gide etBaudry: Paris.
Josileen, J., and N. G. Menon. 2005. Growth of the blue swimmer crab,Portunus pelagicus (Linnaeus, 1758) (Decapoda, Brachyura) incaptivity. Crustaceana 78: 1-18.
Linnaeus, C. von. 1758. Systema naturae per regna tria naturae, secundumclasses, ordines, genera, species, cum characteribus, differentiis,synonymis, locis: edition 10, volume 1, Laurentii Salvii Homiae(¼Stockholm), 824 p.
Marlowe, R. L., R. M. Dillaman, and R. D. Roer. 1994. Lectin binding bycrustacean cuticle: the cuticle of Callinectes sapidus throughout the moltcycle, and the intermolt cuticle of Procambarus clarkii and Ocypodequadrata. Journal of Crustacean Biology 14: 231-246.
Miller, T. J., and S. G. Smith. 2003. Modeling crab growth and populationdynamics: insights from the Blue Crab Conference. Bulletin of MarineScience 72: 537-541.
Neville, A. C., and C. W. Berg. 1971. Cuticle ultrastructure of a Jurassiccrustacean (Eryma stricklandi). Palaeontology 14: 201-205.
Newcombe, C. L., F. Campbell, and A. M. Eckstine. 1949. A study of theform and growth of the blue crab Callinectes sapidus. Growth 13: 71-96.
Olmni, E. J., III, and J. M. Bishop. 1983. Variations in total width-weightrelationships of blue crabs, Callinectes sapidus, in relation to sex,maturity, molt stage, and carapace form. Journal of Crustacean Biology3: 575-581.
Pratoomchat, B., P. Sawangwong, R. Guedes, M. De Lurdes Reis, andJ. Machado. 2002. Cuticle ultrastructure changes in the crab Scylla serrataover the molt cycle. Journal of Experimental Zoology 293: 414-426.
Priester, C., R. M. Dillaman, and D. M. Gay. 2005. Ultrastructure,histochemistry, and mineralization patterns in the ecdysial suture ofthe blue crab, Callinectes sapidus. Microscopy and Microanalysis 11:479-499.
Promwikorn, W., P. Boonyoung, and P. Kirirat. 2005. Histologicalcharacterization of cuticular depositions throughout the molting cycleof the black tiger shrimp (Penaeus monodon). Songklanakarin Journal ofScience and Technology 27: 499-509.
———, P. Kirirat, P. Intasaro, and B. Withyachumnarnkul. 2007. Changesin integument histology and protein expression related to the moltingcycle of the black tiger shrimp, Penaeus monodon. ComparativeBiochemistry and Physiology, Part B 148 (1): 20-31.
Putz, K., and F. Buchholz. 1991. Comparative ultrastructure of the cuticleof some pelagic, nektobenthic and benthic malacostracan crustaceans.Marine Biology 110: 49-58.
Rathbun, M. J. 1896. The genus Callinectes. Proceedings of the UnitedStates National Museum 18 (for 1895): 349-375, pls. 12-28.
Raup, D. M., and S. M. Stanley. 1978. Principles of Paleontology. FreemanPress, New York. 481 pp.
Restrepo, V. 1989. Growth estimates for male stone crabs along theSouthwest coast of Florida: A synthesis of available data andmethods. Transactions of the American Fisheries Society 118: 20-29.
Roer, R., and R. Dillaman. 1984. The structure and calcification of thecrustacean cuticle. American Zoologist 24: 893-909.
———, and R. M. Dillaman. 1993. Molt-related change in integumentalstructure and function, pp. 1-37. In, M. Horst and J. A. Freeman (eds.),The Crustacean Integument-Morphology and Biochemistry, CRC Press,Boca Raton, FL.
Rufino, M. M., P. Abello, and A. B. Yule. 2006. Geographic and gendershape differences in the carapace of Liocarcinus depurator (Brachyura:
154 JOURNAL OF CRUSTACEAN BIOLOGY, VOL. 29, NO. 2, 2009

Portunidae) using geometric morphometrics and the influence ofa digitizing method. Journal of Zoology 269 (4): 458-465.
Say, T. 1817-1818. An account of the Crustacea of the United States.Journal of the Academy of Natural Sciences of Philadelphia 1(1)(1817):57-63, 65-80, 97-101, 155-169; (2)(1818): 235-253, 313-319, 374-401,423-444, 445-458, plate 4.
Skinner, D. M. 1962. The structure and metabolism of a crustaceanintegumentary tissue during a molt cycle. Biological Bulletin 123:635-647.
———, S. S. Kumari, and J. J. O’Brien. 1992. Proteins of the crustaceanexoskeleton. American Zoology 32: 470-484.
Somerton, D. A. 1980. Fitting straight lines to Hiatt growth diagrams: are-evaluation. ICES Journal of Marine Science 39: 15-19.
Stimpson, W. 1860. Notes on North American Crustacea, in the Museum ofthe Smithsonian Institution, No. II. Annals of the Lyceum of NaturalHistory of New York 7: 177-246 , pls. 2, 5 (April 1860). [Pages 49-118,pls. 2, 3 on separate].
Travis, D. F. 1955. The molting cycle of the spiny lobster, Panulirus argusLatreille. III. physiological changes which occur in the blood and urineduring the normal molting cycle. Biological Bulletin 109: 484-503.
———. 1957. The molting cycle of the spiny lobster, Panulirus argusLatreille. IV. post-ecdysial histological and histochemical changes inthe hepatopancreas and integumental tissues. Biological Bulletin 113:451-479.
———. 1960. Matrix and mineral deposition in skeletal structures of thedecapod crustacea. pp. 57-116. In, R. F. Sognnaes (ed.), Calcification inBiological Systems. Washington: AAAS.
———. 1963. Structural features of mineralization from tissue tomacromolecular levels of organization in the decapod Crustacea. AnnalsNew York Academy of Sciences 109: 177-245.
Tweedie, E. P., F. E. Coblentz, and T. H. Shafer. 2004. Purification ofa soluble glycoprotein from the uncalcified ecdysial cuticle of the bluecrab Callinectes sapidus and its possible role in initial mineralization.Journal of Experimental Biology 207: 2589-2598.
Vega, F. J., and M. C. Perrilliat. 1989. Una especie nueva del generoCostacopluma (Arthropoda: Decapoda) del Maastrichtiano de NuevoLeon. Mexico, Universidad Nacional Autonoma, Instituto de Geologıa,Revista 8: 84-87.
———, R. M. Feldmann, and V. M. Davila-Alcocer. 1994. Cuticularstructure in Costacopluma mexicana Vega and Perrilliat, from theDifunta Group (Maastrichtian) of northeastern Mexico, and its
paleoenvironmental implications. Journal of Paleontology 68: 1074-1081.
———, V. Davila, and T. Lehman. 1998. Cuticle structure and taphonomyof Dakoticancer australis Rathbun; paleoecological implications fora Late Cretaceous shore in Northeast Mexico. Abstracts with Programs -Geological Society of America 30 (3): 34.
———, V. M. Davila-Alcocer, and H. F. Filkorn. 2005. Characterization ofcuticle structure in Late Cretaceous and Early Tertiary decapod Crustaceafrom Mexico. Bulletin of the Mizunami Fossil Museum 32: 37-43.
Vega-Villasante, F., E. Cortes-Jacinto, and M. Garcıa-Guerrero. 2007.Contribution to the knowledge of moulting and growth of Callinectesarcuatus Ordway, 1863 (Brachyura, Portunidae) in Baja California Sur,Mexico. Crustaceana 80 (7): 769-778.
Vigh, D. A., and J. E. Dendinger. 1982. Temporal relationships of postmoltdeposition of calcium, magnesium, chitin and protein in the cuticle of theAtlantic blue crab, Callinecties sapidus. Rathbun. Comparative Bio-chemistry and Physiology 2: 365-369.
Waddy, S. L., D. E. Aiken, and D. P. V. De Kleijn. 1995. Control of growthand reproduction pp. 217-266. In, Biology of the lobster Homarusamericanus, J. R. Factor (ed.), Academic Press, New York.
Waugh, D. A., and R. M. Feldmann. 2003. Cuticle microstructure as a newtool in systematic paleontology. Contributions to Zoology 72: 191-193.
———, ———, and C. E. Schweitzer. Accepted. Systematic evaluation ofraninid cuticle microstructure. Bulletin of the Mizunami Fossil Museum.
———, ———, A. M. Schroeder, and M. H. E. Mutel. 2006. Differentialcuticle architecture and its preservation in fossil and extant Callinectesand Scylla claws. Journal of Crustacean Biology 26: 271-282.
———, ———, K. B. Thomas, R. S. Crawford, and S. L. Jakobsen. 2004.Epibiont preservational and observational bias in fossil marinedecapods. Journal of Paleontology 78: 961-972.
White, A. 1843. List of the annulose animals hitherto recorded as found inNew Zealand, with descriptions of some new species, pp. 265-296. In,E. Dieffenbach (ed.), Travels in New Zealand; with Contributions to theGeography, Geology, Botany and Natural History of that Country,Volume 2, The Fauna of New Zealand. Murray: London.
Williams, C. L., R. M. Dillaman, E. A. Elliott, and D. M. Gay. 2003.Formation of the arthrodial membrane in the blue crab, Callinectessapidus. Journal of Morphology 256: 260-269.
RECEIVED: 23 August 2008.ACCEPTED: 3 October 2008.
155WAUGH ET AL.: ONTOGENETIC VARIATIONS IN CUTICLE MORPHOLOGY
APPENDIX 1
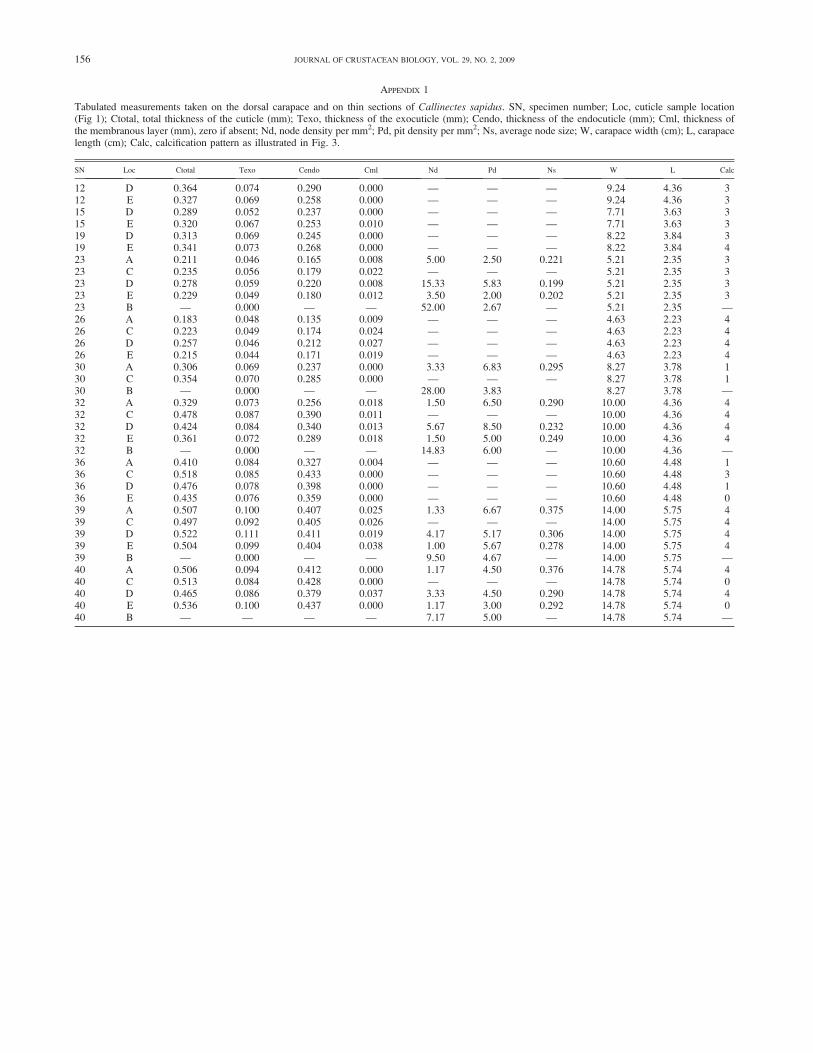
Tabulated measurements taken on the dorsal carapace and on thin sections of Callinectes sapidus. SN, specimen number; Loc, cuticle sample location(Fig 1); Ctotal, total thickness of the cuticle (mm); Texo, thickness of the exocuticle (mm); Cendo, thickness of the endocuticle (mm); Cml, thickness ofthe membranous layer (mm), zero if absent; Nd, node density per mm2; Pd, pit density per mm2; Ns, average node size; W, carapace width (cm); L, carapacelength (cm); Calc, calcification pattern as illustrated in Fig. 3.
SN Loc Ctotal Texo Cendo Cml Nd Pd Ns W L Calc
12 D 0.364 0.074 0.290 0.000 — — — 9.24 4.36 312 E 0.327 0.069 0.258 0.000 — — — 9.24 4.36 315 D 0.289 0.052 0.237 0.000 — — — 7.71 3.63 315 E 0.320 0.067 0.253 0.010 — — — 7.71 3.63 319 D 0.313 0.069 0.245 0.000 — — — 8.22 3.84 319 E 0.341 0.073 0.268 0.000 — — — 8.22 3.84 423 A 0.211 0.046 0.165 0.008 5.00 2.50 0.221 5.21 2.35 323 C 0.235 0.056 0.179 0.022 — — — 5.21 2.35 323 D 0.278 0.059 0.220 0.008 15.33 5.83 0.199 5.21 2.35 323 E 0.229 0.049 0.180 0.012 3.50 2.00 0.202 5.21 2.35 323 B — 0.000 — — 52.00 2.67 — 5.21 2.35 —26 A 0.183 0.048 0.135 0.009 — — — 4.63 2.23 426 C 0.223 0.049 0.174 0.024 — — — 4.63 2.23 426 D 0.257 0.046 0.212 0.027 — — — 4.63 2.23 426 E 0.215 0.044 0.171 0.019 — — — 4.63 2.23 430 A 0.306 0.069 0.237 0.000 3.33 6.83 0.295 8.27 3.78 130 C 0.354 0.070 0.285 0.000 — — — 8.27 3.78 130 B — 0.000 — — 28.00 3.83 8.27 3.78 —32 A 0.329 0.073 0.256 0.018 1.50 6.50 0.290 10.00 4.36 432 C 0.478 0.087 0.390 0.011 — — — 10.00 4.36 432 D 0.424 0.084 0.340 0.013 5.67 8.50 0.232 10.00 4.36 432 E 0.361 0.072 0.289 0.018 1.50 5.00 0.249 10.00 4.36 432 B — 0.000 — — 14.83 6.00 — 10.00 4.36 —36 A 0.410 0.084 0.327 0.004 — — — 10.60 4.48 136 C 0.518 0.085 0.433 0.000 — — — 10.60 4.48 336 D 0.476 0.078 0.398 0.000 — — — 10.60 4.48 136 E 0.435 0.076 0.359 0.000 — — — 10.60 4.48 039 A 0.507 0.100 0.407 0.025 1.33 6.67 0.375 14.00 5.75 439 C 0.497 0.092 0.405 0.026 — — — 14.00 5.75 439 D 0.522 0.111 0.411 0.019 4.17 5.17 0.306 14.00 5.75 439 E 0.504 0.099 0.404 0.038 1.00 5.67 0.278 14.00 5.75 439 B — 0.000 — — 9.50 4.67 — 14.00 5.75 —40 A 0.506 0.094 0.412 0.000 1.17 4.50 0.376 14.78 5.74 440 C 0.513 0.084 0.428 0.000 — — — 14.78 5.74 040 D 0.465 0.086 0.379 0.037 3.33 4.50 0.290 14.78 5.74 440 E 0.536 0.100 0.437 0.000 1.17 3.00 0.292 14.78 5.74 040 B — — — — 7.17 5.00 — 14.78 5.74 —
156 JOURNAL OF CRUSTACEAN BIOLOGY, VOL. 29, NO. 2, 2009