Embed Size (px)
Citation preview

Russian River Monitoring Report - North Coast Regional Water Quality Control Board 1
California Regional Water Quality Control Board North Coast Region
Russian River Pathogen TMDL
Onsite Wastewater Treatment System Impact Study Report
July 2013

Russian River Monitoring Report - North Coast Regional Water Quality Control Board 2
1.0 INTRODUCTION The North Coast Regional Water Board staff are developing the Russian River Total Maximum Daily Loads (TMDLs) for pathogen indicators to identify and control contamination. Potential pathogen contamination has been identified in three areas of the lower and middle Russian River watershed (Hydrologic Units 114.10 and 114.20). Identification of the contamination led to the placement of waters within these areas on the federal Clean Water Act Section 303(d) list of impaired waters. The contamination identified has been linked to impairment of the contact recreation (REC-1) and non-contact recreation (REC-2) designated beneficial uses. Health advisories have been published and/or posted by Sonoma County and City of Santa Rosa authorities. North Coast Regional Water Board staff conducted a source analysis study for the development of the Russian River TMDL. The study was organized into individual tasks to collect information to help address the identified TMDL management questions (NCRWQCB 2012). Based on results of the study, Regional Water Board staff made the following findings:
1. Pathogenic indicator bacteria concentrations were higher during wet periods compared to dry periods
2. Human-source Bacteroides bacteria were detected in all sample locations and land use categories throughout the watershed.
3. Stable isotope analysis results showed that the dominant sources of source water for bacteria samples were manure and septic wastes.
4. During wet periods, pathogenic indicator bacteria concentrations were higher in urban sewered areas and areas with septic systems compared to less developed areas.
5. Human-source Bacteroides was higher in onsite septic areas compared to urban sewered areas.
The study appeared to indicate that septic systems were a contributing source of pathogenic indicator bacteria. We wanted to confirm this hypothesis by more focused monitoring. We did this by comparing water samples collected downstream of hydrologic catchments that drain areas with densely situated Onsite Wastewater Treatment System (OWTS) and catchments that drain areas with a relatively low density of OWTS. Additionally, provisions of the recently adopted statewide OWTS Policy require Regional Water Board staff to identify impaired water bodies where septic systems are believed to be source of the impairment and establish additional protections, including supplemental treatment systems, in these areas. These new requirements highlight the need to explicitly identify sources of pathogens from onsite systems.
Russian River Monitoring Report - North Coast Regional Water Quality Control Board 3
To address questions arising from the study findings, Regional Water Board staff collected wet-weather water samples from various locations in the lower Russian River watershed during 2012-2013 to identify possible pathogen impacts from catchments that drain areas with a high density of OWTS. A Quality Assurance Project Plan (Butkus 2012a) was developed that detailed the water sample collection and analysis of the E. coli, Enterococcus, and Bacteroides bacteria concentrations. Additional water samples were also collected and analyzed for stable isotopes of nitrate to assess the relative water source differences in oxygen (δ18O) and nitrogen (δ15N). 2.0 MONITORING QUESTION Pathogenic indicator bacteria can be transported to surface waters from malfunctioning or poorly sited OWTS. An OWTS doesn't have to be malfunctioning to contribute pathogenic indicator bacteria to surface waters. An OWTS can also be poorly sited so that there is insufficient and/or ineffective soil treatment upon effluent dispersal. During dry weather periods, OWTS effluent can travel in shallow groundwater to perennial streams, entering through shallow groundwater. through springs or the stream hyphoreic zone. During storm events, runoff from the landscape surface can flood OSWT systems resulting in the direct transport of untreated human waste to surface waters. This mode of transport can also occur in ephemeral streams that exist only for a short period following a storm event. This study focused sampling efforts during storm events when transport of bacteria to surface waters is most likely to occur. The OWTS Impact Study was designed to answer the following management question:
• Do catchments with high density of OWTS contribute pathogenic indicator bacteria from human sources?
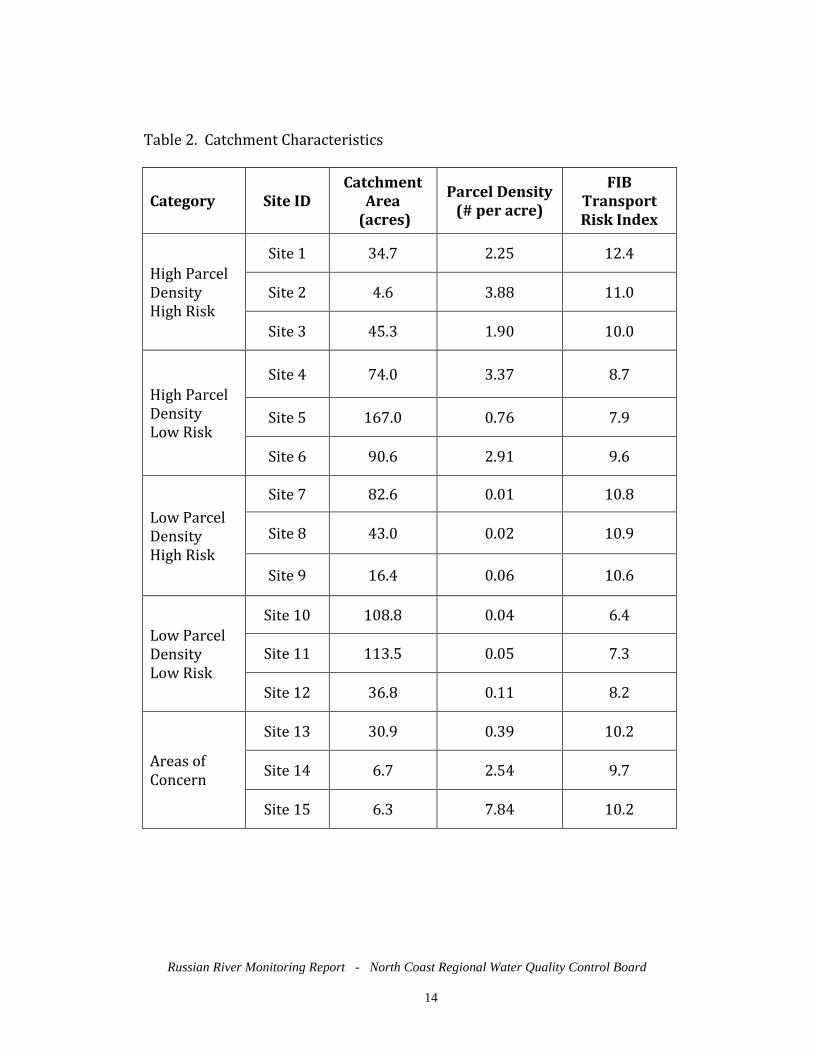
3.0 WATER SAMPLING LOCATIONS Regional Water Boards staff selected catchments and sampling locations for the study based on parcel density and the perceived risk of bacterial transport from OWTS in the study area. Parcel data was obtained from the Sonoma County Assessor. The risk of bacterial transport from OWTS systems was assessed using a spatial data model developed by Regional Water Board staff (Fortescue 2012) using factors selected from the Basin Plan’s Policy on the Control of Water Quality with Respect to On-Site Waste Treatment and Disposal Practices (NCRWQCB 2011). Landscape analysis of spatial data was conducted to select sampling locations that best represent the identified parcel density and fecal indicator bacteria (FIB) transport risk categories (Tables 1 & 2). Catchments were selected based on the risk of FIB transport to surface waters and the parcel density (Butkus 2012b).

Russian River Monitoring Report - North Coast Regional Water Quality Control Board 4
Three sample locations were selected to represent catchments draining each of the following four categories, for a total of twelve sites:
• High parcel-density with a high risk of FIB transport from OWTS • High parcel-density with a low risk of FIB transport from OWTS • Low parcel-density with a high risk of FIB transport from OWTS • Low parcel-density with a low risk of FIB transport from OWTS
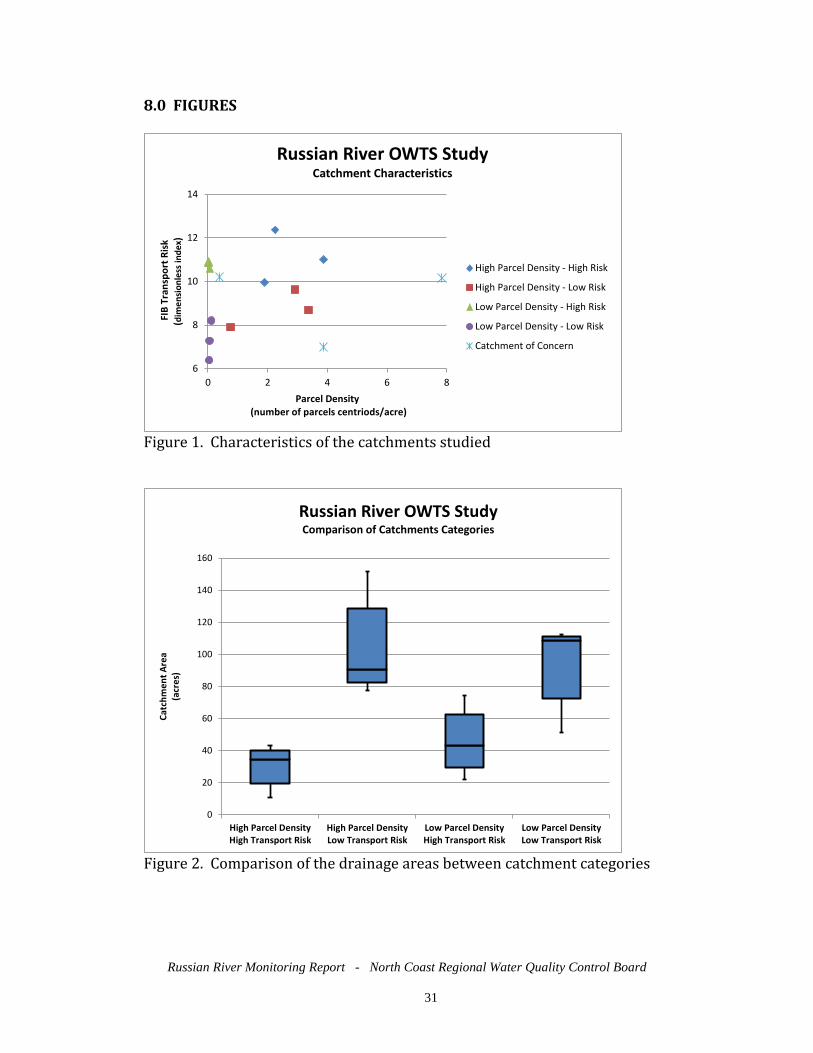
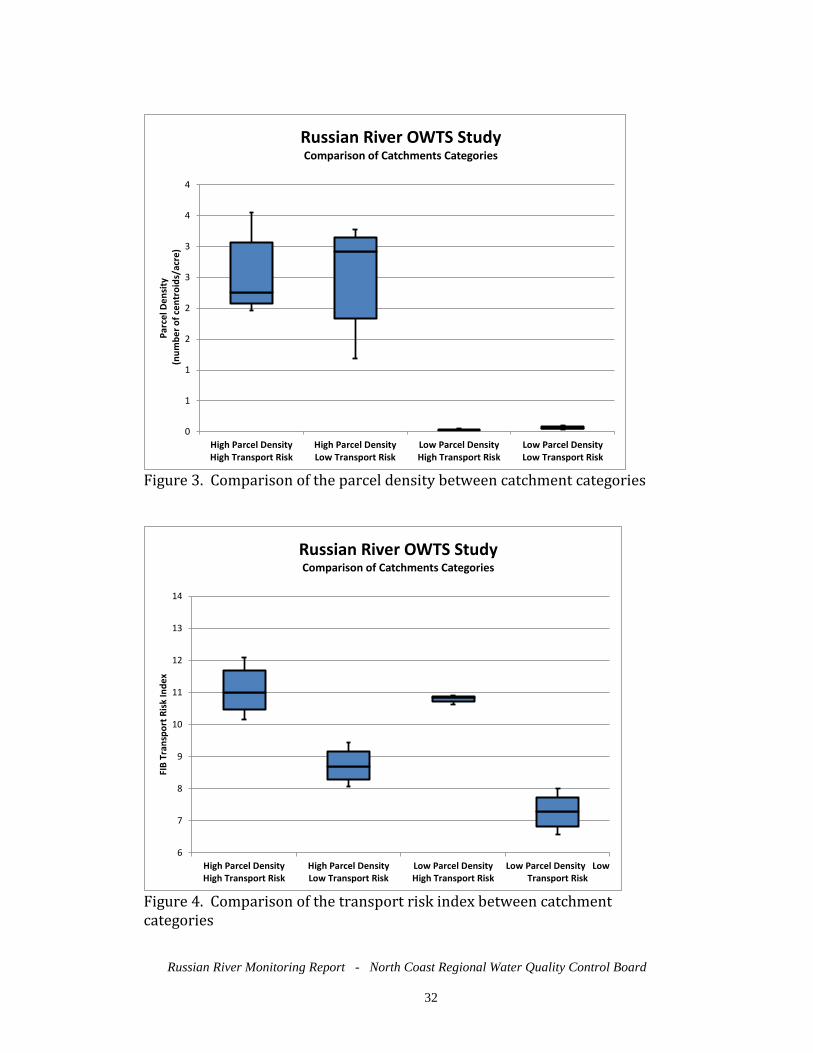
In addition, three additional sample locations were selected by Regional Water Board staff to represent catchments that drain areas served by OWTS that have high parcel density and are near a stream. It is hypothesized by Regional Water Board staff that catchments with these characteristics present a high potential to contribute pathogens to the Russian River. Based on these catchment characteristics, additional sampling locations were selected from the Fitch Mountain area near Healdsburg, downtown Monte Rio and Camp Meeker. Figure 1 presents the parcel density and FIB transport risk for each of the catchments sampled. This figure shows the relative relationship between the categories and the additional catchments of concern between these variables. Figure 2 through Figure 28 show comparisons of the distribution of sample data between various groups using Box and whisker plots. The horizontal line in each box shows the median value of the data set. The boxes represent the interquartile range and the error bars (i.e. whiskers) represent the 10th and 90th percentiles of the data set. Figure 2 presents the range of catchment areas for each of the four categories. The figure shows that the catchment areas for low transport risk catchments are larger than those selected to represent a high transport risk. Figure 3 presents the range of parcel densities for selected catchments. The figure confirms the large difference in parcel densities between the high parcel density categories and the low parcel density categories. Figure 4 shows the distribution of FIB transport risk for each category. The figure confirms the large difference in FIB transport risk between the high transport risk categories and the low transport risk categories. Wet weather water samples were collected from fifteen (15) catchments in the lower Russian River watershed (Table 1). Site number 14 (Monte Rio) was relocated to another location than identified in the Quality Assurance Project Plan. The originally selected location simply did not have runoff to sample that drained from the catchment after a storm event. The sample was collected at a nearby location in Monte Rio that had runoff available to collect.

Russian River Monitoring Report - North Coast Regional Water Quality Control Board 5
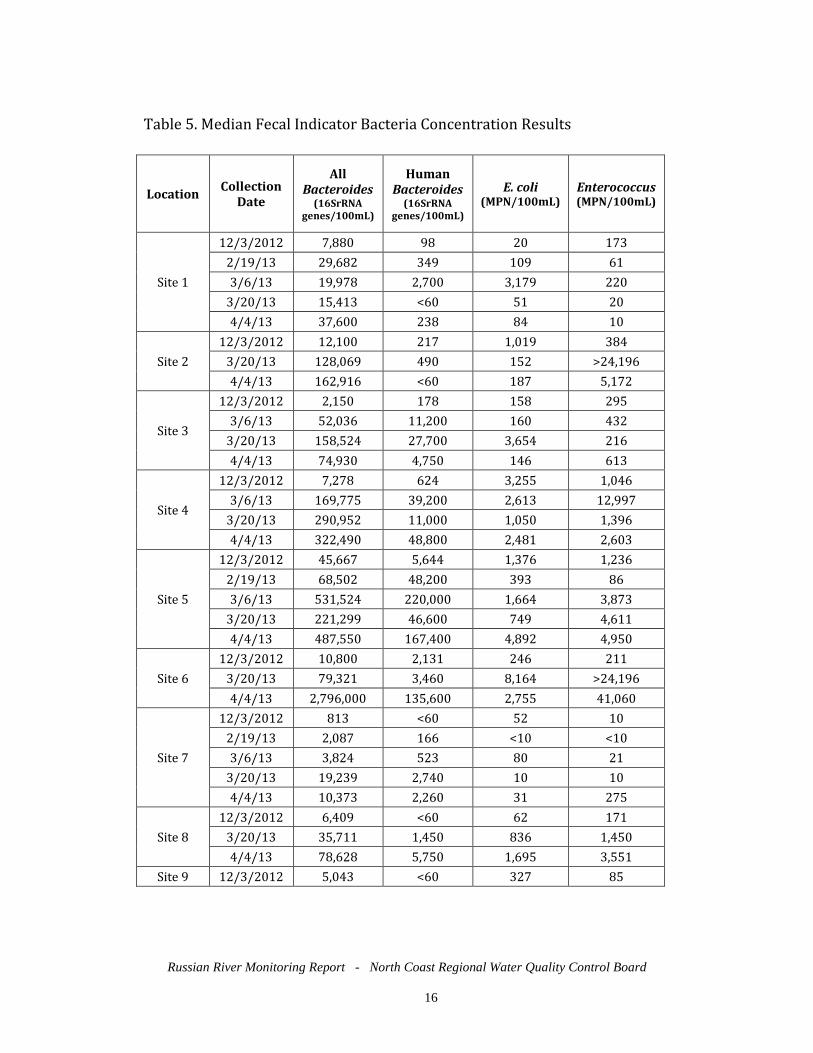
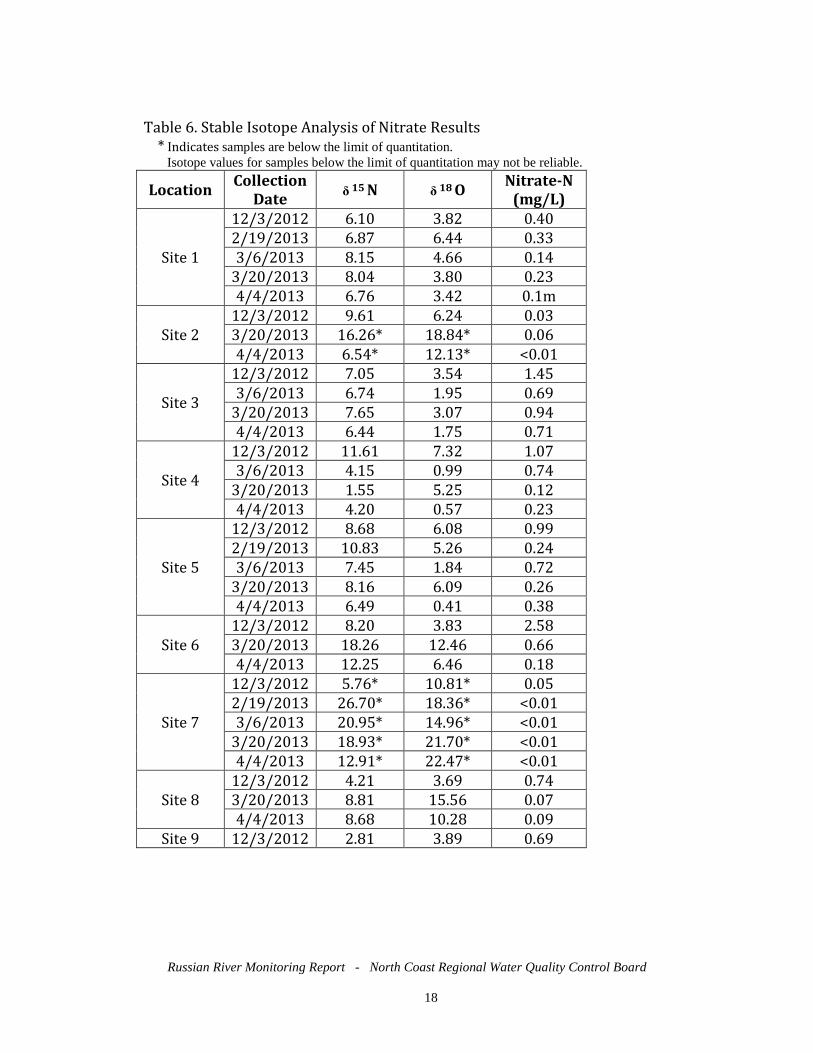
4.0 MONITORING RESULTS As described in the Quality Assurance Project Plan (Butkus 2012a), samples for analysis were collected from each location five (5) times during the study period. Despite the occurrence of early storm events in November 2012, the first storm event sampled was not until December 2, 2012, due to logistical reasons. The December 2, 2012 sample represented the largest of all the storm events sampled (Table 3). Water samples were collected at every site during this storm event. However, because subsequent storm events sampled were smaller and did not generate runoff at all locations, not all locations were sampled during every storm event. The locations and the dates sampled are shown in Table 4. The results of FIB sample analysis are shown in Table 5. The result shown in the table is the median concentration value derived from replicate samples of fecal indicator bacteria at each location. Table 6 presents the ratio of stable isotopes of nitrogen (δ 15 N) and oxygen (δ 18 O) in dissolved nitrate. Several of the reported nitrate concentrations were below the level of quantitation. These data were not used in the assessment since isotope values for samples below the limit of quantitation may not be reliable. Triplicate samples were collected once from each sampling location during the study to assess sampling variability, except at Sites 9 and 14, where samples were not collected due to the lack of runoff. Only one storm event on December 3, 2012 was large enough to generate runoff at these two locations. Table 7 – 10 shows the variability of the triplicate samples of FIB concentrations. The mean coefficient of variation ranges from 18% to 32%. The precision of the sampling was similar to the measurements made from replicate sampling in the Russian River during 2011-2012 which found coefficient of variations of 34% for E. coli bacteria and 37% for Enterococcus bacteria (NCRWQCB 2012; Butkus 2013). 5.0 ASSESSMENT RESULTS Assessment Methods Each of the sampling locations was selected to represent a particular catchment category of parcel density and FIB transport risk (i.e., high parcel density and high transport risk). The measured FIB concentrations were used to assess whether any particular sampling location is significantly different that the other locations selected to represent that category. Visual comparisons and statistical hypothesis tests were made between different groupings of the measured FIB concentrations and other metrics. Distributions of the measured FIB concentrations are compared visually

Russian River Monitoring Report - North Coast Regional Water Quality Control Board 6
using box and whisker plots. The boxes represent the interquartile range of the distribution around the median and the whiskers represent the 10th and 90th percentiles. Hypothesis tests were considered statistically significantly different if the resulting probability of rejecting the null hypothesis (Ho)was equal or lower than α = 0.05. Nonparametric (i.e., distribution-free) inferential statistical methods were used to assess differences between groups. These hypothesis tests make no assumption about the frequency distributions of the measured data. Nonparametric methods are the most appropriate approach for assessing water quality data, which can have widely varying frequency distributions (Helsel and Hirsch 2002). The Kruskal-Wallis statistical test was used to assess if any particular sampling location showed a statistical difference in FIB concentrations from the other locations sampled for that catchment category (Ho). The Kruskal-Wallis test is a hypothesis test conducted using ranked data (Helsel and Hirsch 2002). This non-parametric test was used for testing if samples originate from the same distribution by assessing the equality of population medians among the groups. The parametric equivalent of the Kruskal-Wallis test is the one-way analysis of variance. When the Kruskal-Wallis test indicates significant results (Ho < α), then at least one of the samples is different from the other samples in the group. The relationships between FIB concentrations and catchment characteristics were investigated. In addition, the relationship of stable isotope of nitrate and catchment characteristics was also evaluated. Catchment characteristics included the area, parcel density and FIB transport risk.
Water Sample Measurements: E. coli bacteria concentration Enterococcus bacteria concentration All Bacteroides bacteria concentration Human-host Bacteroides bacteria concentration Stable isotopes of oxygen (δ18O) Stable isotopes of nitrogen (δ15N)
Catchment Characteristics: Catchment size (acres) Parcel Density (number of parcel centroids/catchment size) FIB Transport Risk (index number)
The relationships between these variables were investigated using the Spearman’s rank correlation coefficient (ρ) (Helsel and Hirsch 2002). Spearman's rank correlation coefficient is a nonparametric statistical measure of the dependence between two variables. Spearman correlation coefficients approach either plus one (ρ~+1.0) or minus one (ρ~−1.0), as the relationship become stronger. A small correlation coefficient (between -0.5

Russian River Monitoring Report - North Coast Regional Water Quality Control Board 7
and 0.5) indicates a weak relationship between the variables. For example, a strong relationship means that when E. coli bacteria concentration is high in a sample, there is a large likelihood that Enterococcus bacteria concentrations will also be high. Statistical tests were used to evaluate whether there was a significant difference between different catchment categories. The Mann-Whitney U statistical test was applied to assess the difference between the distributions of measured FIB concentrations and stable isotopes of nitrate based on parcel density and FIB transport risk. For example, the test was used to determine if there was a significant difference in E. coli concentrations from catchments with a high parcel density as opposed to catchment with a low parcel density. The Mann-Whitney U test is a non-parametric hypothesis test for assessing whether two samples of observations come from the same distribution (Helsel and Hirsch 2002). The test null hypothesis is that the two samples are drawn from a single population. The test is similar to performing an ordinary parametric two-sample t test, but is based on ranking the data set. This statistical test is a nonparametric inferential statistical method that makes no assumption about the frequency distributions. Assessment of Sampling Location influence on FIB Concentrations Tables 11 – 14 show the results of the Kruskal-Wallis statistical tests between sampling locations for each catchment category. Only three of the tests showed a statistically significant difference between locations. Enterococcus bacteria concentrations were different in the high parcel density & high FIB transport risk category (Table 11). Visual observation of the distribution of Enterococcus bacteria concentrations show that Site 2 is much higher than the other locations sampled. In addition, the distribution of both E.coli and All Bacteriodes bacteria concentrations show that Site 10 is much higher than the other locations sampled. These data (i.e., Enterococcus bacteria concentrations from Site 2 and both E.coli and All Bacteriodes bacteria concentrations from Site 10) were excluded from further assessment since they may not be representative of the high parcel density & high FIB transport risk category based on both visual observation and the hypothesis tests. Relationship between FIB Concentrations and Other Variables Table 15 presents the matrix of Spearman’s rank correlation coefficients between the FIB concentrations and the other variables. Three of the relationships are relatively strong. All Bacteroides bacteria concentrations

Russian River Monitoring Report - North Coast Regional Water Quality Control Board 8
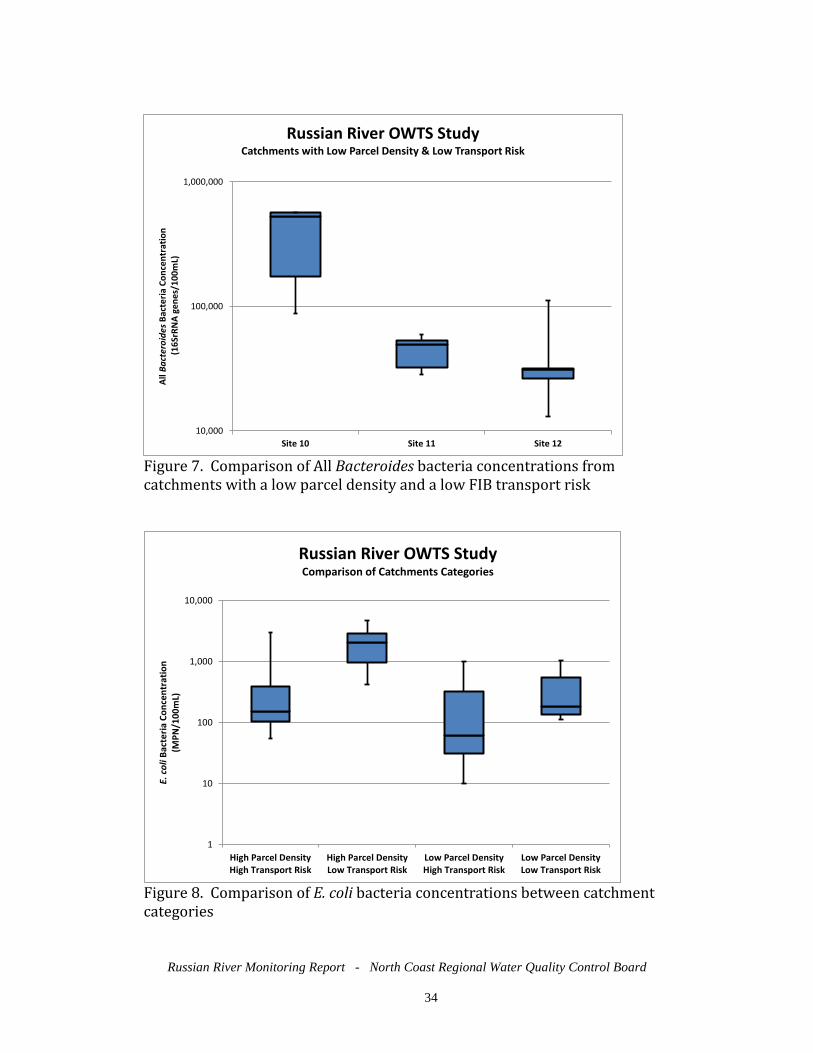
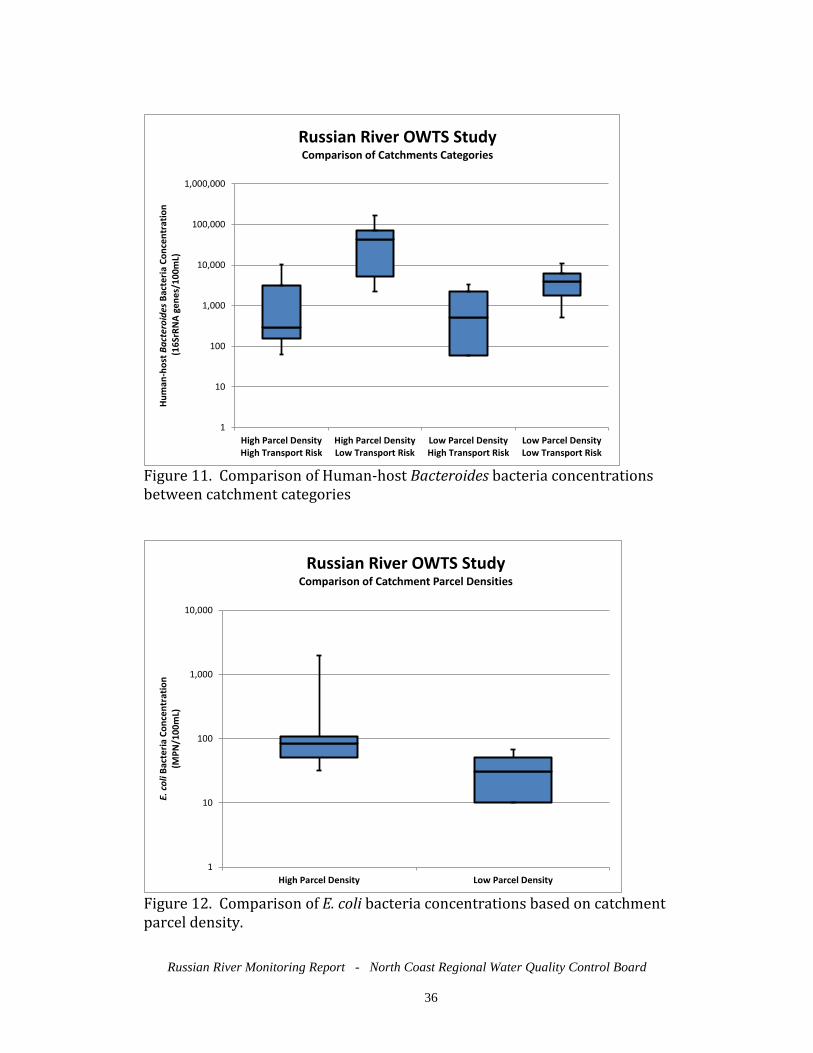
are positively correlated with both human-host Bacteroides and Enterococcus bacteria concentrations. Enterococcus bacteria concentrations are also positively correlated with E. coli bacteria concentrations. Neither of the stable isotopes of nitrate was correlated with any of the FIB concentrations. FIB transport showed a weak, negative correlation to all of the FIB concentrations. Assessment of Catchment Category influence on FIB Concentrations The Kruskal-Wallis statistical test was also used to assess if there was statistical difference in FIB concentrations and stable isotopes of nitrate between catchment categories. Table 16 presents the results of the hypothesis test that the equality of population medians among the groups is the same. Figures 8 – 11 show the distributions of the FIB concentrations for each catchment category. The results indicate that each of the FIB groups were significantly different between the catchment categories. There was no significant different found between these categories for the stable isotopes of nitrate. Assessment of Catchment Characteristics Influence on FIB Concentrations Table 17 presents the results of the Mann-Whitney U test comparing FIB concentrations and stable isotopes of nitrate between catchments with a high parcel density (>0.75 parcels/acre) and those with a low parcel density (<0.12 parcels/acre). A statistically significant difference was observed in both All Bacteroides and E. coli bacteria concentrations based on parcel density. Visual comparison of the distributions of these concentrations show that higher parcel density is associated with higher concentrations of both All Bacteroides and E. coli bacteria (Figures 12 & 13). Table 18 presents the results of the Mann-Whitney U test comparing FIB concentrations and stable isotopes of nitrate between catchments with a high FIB transport risk (index >10) and those with a low parcel density. (index <10). A statistically significant difference was observed in all FIB concentrations based on transport risk. Visual comparison of the distributions of these concentrations show that lower transport risk is associated with higher FIB concentrations (Figures 14-17). These results and observations support the previous finding that FIB transport is negatively correlated to FIB concentrations.
Russian River Monitoring Report - North Coast Regional Water Quality Control Board 9
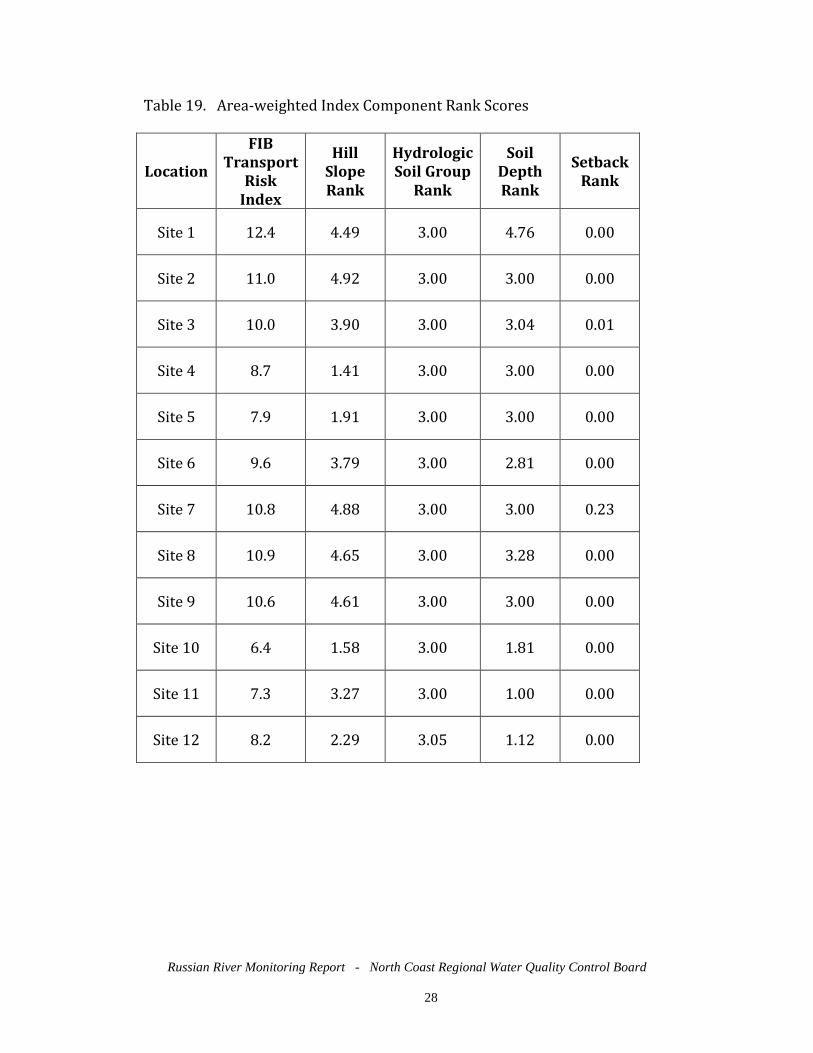
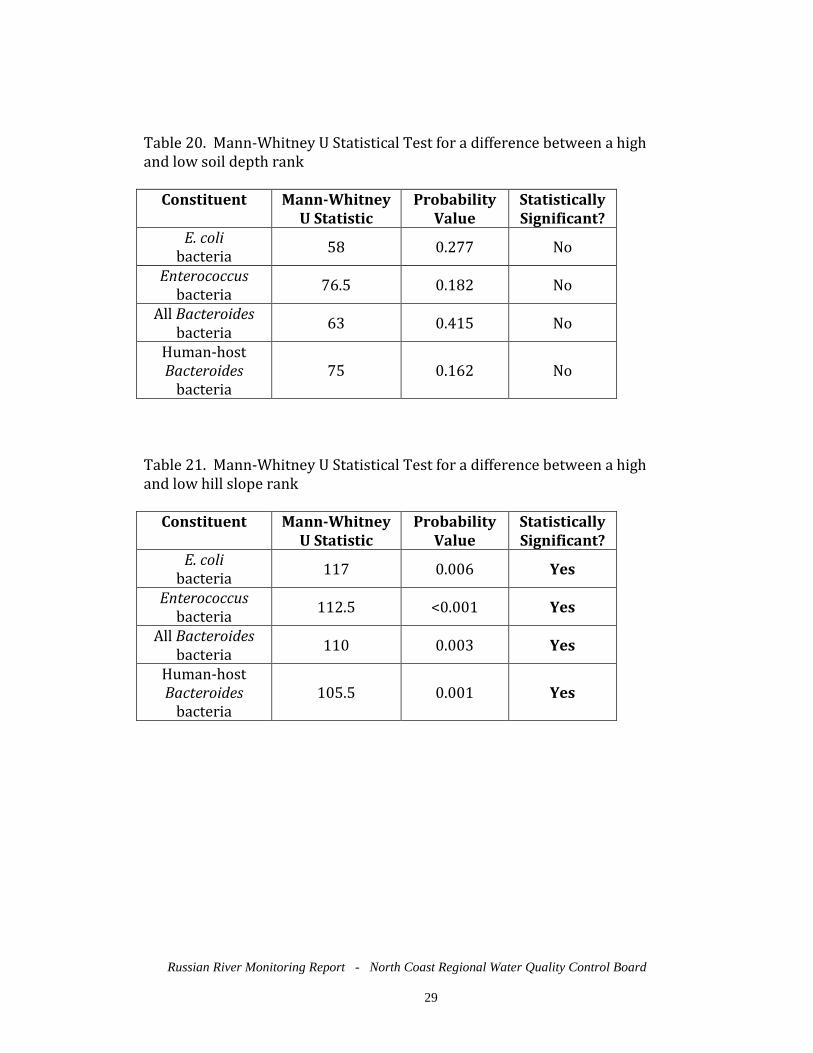
Assessment of Catchment Transport Risk influence on FIB Concentrations The FIB transport risk index was evaluated further to determine why there appears to be a negative relationship between the index value and measured FIB concentrations. Each of the four (4) elements of the index was assumed to have a positive relationship to FIB transport. This assumption appears to be invalid for the set of catchments selected for this study. The index was separated into each of the elements for the study catchments. The spatial data used as input to the index were area-weighted for each study catchment (Table 19). Both the setback rank and the hydrologic group rank very little variability between the study sites. These two elements have relatively little influence on the ability of the index to discern differences between the groups and were excluded from the assessment. Therefore, the assessment was focused only on the effect of the remaining two elements, hill slope rank and soil depth rank, on the index values. The Mann-Whitney U statistical test was applied to assess the difference between the distributions of measured FIB concentrations based on soil depth rank and hill slope rank. Table 20 shows that no significant differences were observed in all FIB concentrations between catchments with a high soil depth rank (>3.0) and those with a low soil depth rank (<3.0). Table 21 shows that highly significant differences were observed in all FIB concentrations between catchments with a high hill slope rank (>3.5) and those with a low hill slope rank (<3.5). Visual comparison of the distributions of these concentrations shows that lower hill slope is associated with higher FIB concentrations (Figures 18-21). These results and observations support the finding that hill slope index is not positively correlated with FIB concentrations for the set of catchments selected for this study. The assumption that there was a positive correlation between hill slope and FIB concentrations is invalid. Assessment of Catchment Transport Risk influence on the Stable Isotopes of Nitrate Measurements of the stable isotopes of oxygen (δ18O) and nitrogen (δ15N) were assessed to help identify the source of the water associated with the bacteria samples. The results were compared to typical values of δ18O and δ15N of nitrate (Figure 22).
• Samples with δ15N values between 2‰ and 8‰ and δ18O values below 15‰ are derived from soil sources, likely from stormwater erosion.
• Samples with δ18O values above 15‰ are largely runoff processes. • Samples with δ15N values below 5‰ are typically ammonium from in
situ processes such as wastewater treatment. • Samples with δ15N values above 5‰ are manure and septic waste.

Russian River Monitoring Report - North Coast Regional Water Quality Control Board 10
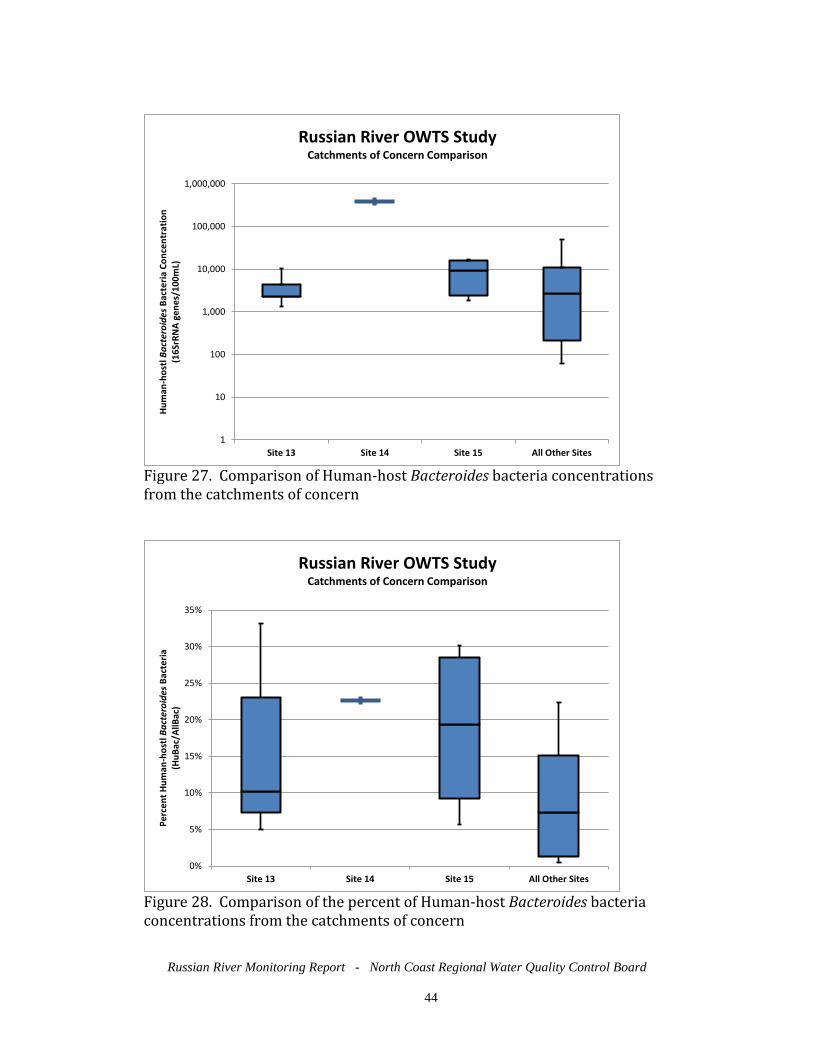
Most of the samples fell within the range of a soil source of nitrate derived from ammonia through nitrification (Table 22 and Figure 23). These sources of nitrate were likely derived from erosion caused by storm events. Relatively few of the samples had δ15N values above 10‰ or below 5‰. There were no significant differences found in stable isotope values based on parcel density (Table 17) or FIB transport risk (Table 18). These results were similar to the values found in other wet period water samples collected in the Russian River watershed (NCRWQCB 2012). Assessment of FIB Concentrations in the Study Areas of Concern Three sample locations were sampled that represent catchments draining areas of concern for OWTS impacts. The sampling locations were selected from catchments from the Fitch Mountain area near Healdsburg (Site 13), downtown Monte Rio (Site 14) and Camp Meeker (Site 15). These areas generally have a high parcel density on OWTS. The distribution of FIB concentrations from these catchments of concern were compared to the other catchments sampled (Figures 24- 28). Only a single storm event was sampled at Site 14 due to a lack of runoff so the results may not be representative of the catchment. However, this storm event showed much higher FIB concentration the other catchment samples. The other two catchments of concern (Sites 13 & 15) showed similar range of FIB concentrations as the other catchments sampled. 6.0 FINDINGS Based on the assessments of FIB concentrations presented in this report, Regional Water Board staff can make the following findings:
• Triplicate samples were collected to assess sampling variability. The mean coefficient of variation ranges from 18% to 32%.
• Enterococcus bacteria concentrations from Site 2 (River Road culvert, Monte Rio) were much higher than the other locations sampled. In addition, both E.coli and All Bacteriodes bacteria concentrations from Site 10 (Fredson Road, Healdsburg) were also much higher than the other locations sampled. These data were excluded from further assessment since they may not be representative of the catchment category they were placed.
• All Bacteroides bacteria concentrations were positively correlated with both human-host Bacteroides and Enterococcus bacteria concentrations. Enterococcus bacteria concentrations were also positively correlated with E. coli bacteria concentrations. This means that as bacteria concentrations increase the other indicators also

Russian River Monitoring Report - North Coast Regional Water Quality Control Board 11
likely increase. For example, one is likely to measure high E. coli bacteria concentrations in a water sample with high Enterococcus bacteria concentrations
• Neither of the stable isotopes of nitrate was correlated with any of the FIB concentrations.
• FIB transport risk showed a weak, negative correlation to all of the FIB concentrations. This means that the higher the assumed risk, the lower the FIB concentrations were likely to be measured in a water sample.
• Each of the FIB groups was significantly different between the catchment categories.
• There was no significant difference found between the catchment categories for the stable isotopes of nitrate. Most of the samples fell within the range of a soil source of nitrate derived from ammonia through nitrification. These sources of nitrate were likely derived from erosion caused by storm events. These results were similar to the values found in other wet period water samples collected in the Russian River watershed.
• A higher parcel density is associated with higher concentrations of both All Bacteroides and E. coli bacteria.
• No significant differences were observed in FIB concentrations between catchments with different soil depths.
• The FIB transport risk index is invalid for the set of catchments selected for this study. Lower transport risk is associated with higher FIB concentrations. This anomaly was caused by the incorrect assumption that hill slope index is positively correlated with FIB concentrations
• There were no significant differences found in stable isotope values based on parcel density or FIB transport risk. The results indicate the source of nitrate is soil likely derived from the storm event causing erosion. The stable isotope values were similar to the values found in other wet period water samples collected in the Russian River watershed.
• The catchments of concern showed similar range of FIB concentrations as the other catchments sampled.

Russian River Monitoring Report - North Coast Regional Water Quality Control Board 12
7.0 CITATIONS Butkus, S. 2012a. Russian River Human Impact Study Quality Assurance Project Plan. North Coast Regional Water Quality Control Board, Santa Rosa, CA. Butkus, S. 2012b. Selection of Sampling Locations for the Onsite Wastewater Treatment Systems Impact Study. Memorandum to File: Russian River; TMDL and Planning, North Coast Water Quality Control Board, Santa Rosa, CA. Butkus, S. 2013. Variability Assessment of fecal Indicator Bacteria Sampling. Memorandum to File: Russian River; TMDL and Planning, North Coast Water Quality Control Board, Santa Rosa, CA. Fortescue, F. 2012. GIS Model Development for Assessing Risks from Septic Systems. Memorandum to File: Russian River; TMDL and Planning, North Coast Water Quality Control Board, Santa Rosa, CA. Helsel, D.R. and R.M. Hirsch. 2002. Statistical Methods in Water Resources, Techniques of Water Resources Investigations, Book 4, Chapter A3, 510 p. U.S. Geological Survey, Washington DC. Available at http://water.usgs.gov/pubs/twri/twri4a3/ Michener, R. and K. Lajtha. 2007. Stable Isotopes in Ecology and Environmental Science. Chpater 12, pp. 375-435. NCRWQCB 2011. Water Quality Control Plan for the North Coast Region. North Coast Regional Water Quality Control Board, Santa Rosa, CA. NCRWQCB 2012. Russian River Pathogen TMDL 2011-2012 Monitoring Report. North Coast Regional Water Quality Control Board. Santa Rosa, CA.

Russian River Monitoring Report - North Coast Regional Water Quality Control Board 13
7.0 TABLES Table 1. Study Sampling Locations
Category Site ID SWAMP ID Latitude Longitude Location Description
High Parcel Density High Risk
Site 1 114DFMR68 38.6131 -122.8410 1740 Fitch Mtn Road - west of Villa Anna (Healdsburg)
Site 2 114C01EDR 38.4776 -122.9762 River Road - culvert 100' east of Duncan Road (Monte Rio)
Site 3 114C02SPR 38.5063 -121.0735 River Drive at Summerhome Park Road (Forestville)
High Parcel Density Low Risk
Site 4 114C03OMR 38.4781 -121.0018 19375 Old Monte Rio Road (across street from Northwood golf course)
Site 5 114CO4TRF 38.4903 -121.1022 8612 Trenton Road (Forestville)
Site 6 114DDRC59 38.4978 -121.0979 Along west shoulder of Del Rio Court (Forestville)
Low Parcel Density High Risk
Site 7 114C05MNS 38.4581 -122.9891 9632 Main Street (Monte Rio)
Site 8 114C06VRG 38.5059 -121.0423 12656 River Road at Von Renner Grading (near Rio Nido)
Site 9 114C07MRC 38.4575 -122.9531
Moscow Road box culvert - 100' west of 'Right Curve' sign (near Cassini Campgound)
Low Parcel Density Low Risk
Site 10 114CO8FRS 38.6561 -121.1264 Fredson Road south of Salvation Army driveway (Healdsburg)
Site 11 114C09WDC 38.6467 -121.0805 3654 West Dry Creek Road (Healdsburg)
Site 12 114C10AVR 38.6509 -121.1316 148 Alexander Valley Road (Healdsburg)
Areas of Concern
Site 13 114C11RDH 38.6238 -122.8452 West end of Redwood Drive (Healdsburg)
Site 14 114C12FSM 38.4697 -123.0124 Foothill Drive at B Street (Monte Rio)
Site 15 114C13LSA 38.4252 -121.0399 Lakeside Ave at Market Street (Camp Meeker)
Russian River Monitoring Report - North Coast Regional Water Quality Control Board 14
Table 2. Catchment Characteristics
Category Site ID Catchment
Area (acres)
Parcel Density (# per acre)
FIB Transport Risk Index
High Parcel Density High Risk
Site 1 34.7 2.25 12.4
Site 2 4.6 3.88 11.0
Site 3 45.3 1.90 10.0
High Parcel Density Low Risk
Site 4 74.0 3.37 8.7
Site 5 167.0 0.76 7.9
Site 6 90.6 2.91 9.6
Low Parcel Density High Risk
Site 7 82.6 0.01 10.8
Site 8 43.0 0.02 10.9
Site 9 16.4 0.06 10.6
Low Parcel Density Low Risk
Site 10 108.8 0.04 6.4
Site 11 113.5 0.05 7.3
Site 12 36.8 0.11 8.2
Areas of Concern
Site 13 30.9 0.39 10.2
Site 14 6.7 2.54 9.7
Site 15 6.3 7.84 10.2

Russian River Monitoring Report - North Coast Regional Water Quality Control Board 15
Table 3. Precipitation during samples storm events as measured in Santa Rosa (CDEC Station STA at latitude 38.479, longitude -122.712)
Storm Event Dates
Two-day Antecedent Total
Precipitation (inches)
12/3/2012 1.39 2/19/2013 0.16 3/6/2013 0.38
3/20/2013 0.54 4/4/2013 1.00
Table 4. Storm event dates sampled by location
* No sample collected due to a lack of runoff flow
Location Date Sampled
Storm Event 1
Storm Event 2
Storm Event 3
Storm Event 4
Storm Event 5
Site 1 12/3/2012 2/19/2013 3/6/2013 3/20/2013 4/4/2013 Site 2 12/3/2012 3/20/2013 4/4/2013 * *
Site 3 12/3/2012 3/6/2013 3/20/2013 4/4/2013 *
Site 4 12/3/2012 3/6/2013 3/20/2013 4/4/2013 *
Site 5 12/3/2012 2/19/2013 3/6/2013 3/20/2013 4/4/2013 Site 6 12/3/2012 3/20/2013 4/4/2013 * *
Site 7 12/3/2012 2/19/2013 3/6/2013 3/20/2013 4/4/2013 Site 8 12/3/2012 3/20/2013 4/4/2013 * *
Site 9 12/3/2012 * * * *
Site 10 12/3/2012 2/19/2013 3/6/2013 3/20/2013 4/4/2013 Site 11 12/3/2012 2/19/2013 3/6/2013 3/20/2013 4/4/2013 Site 12 12/3/2012 2/19/2013 3/6/2013 3/20/2013 4/4/2013 Site 13 12/3/2012 2/19/2013 3/6/2013 3/20/2013 4/4/2013 Site 14 12/3/2012 * * * *
Site 15 12/3/2012 3/6/2013 4/4/2013 * *
Russian River Monitoring Report - North Coast Regional Water Quality Control Board 16
Table 5. Median Fecal Indicator Bacteria Concentration Results
Location Collection Date
All Bacteroides
(16SrRNA genes/100mL)
Human Bacteroides
(16SrRNA genes/100mL)
E. coli (MPN/100mL)
Enterococcus (MPN/100mL)
Site 1
12/3/2012 7,880 98 20 173 2/19/13 29,682 349 109 61 3/6/13 19,978 2,700 3,179 220
3/20/13 15,413 <60 51 20 4/4/13 37,600 238 84 10
Site 2 12/3/2012 12,100 217 1,019 384
3/20/13 128,069 490 152 >24,196 4/4/13 162,916 <60 187 5,172
Site 3
12/3/2012 2,150 178 158 295 3/6/13 52,036 11,200 160 432
3/20/13 158,524 27,700 3,654 216 4/4/13 74,930 4,750 146 613
Site 4
12/3/2012 7,278 624 3,255 1,046 3/6/13 169,775 39,200 2,613 12,997
3/20/13 290,952 11,000 1,050 1,396 4/4/13 322,490 48,800 2,481 2,603
Site 5
12/3/2012 45,667 5,644 1,376 1,236 2/19/13 68,502 48,200 393 86 3/6/13 531,524 220,000 1,664 3,873
3/20/13 221,299 46,600 749 4,611 4/4/13 487,550 167,400 4,892 4,950
Site 6 12/3/2012 10,800 2,131 246 211
3/20/13 79,321 3,460 8,164 >24,196 4/4/13 2,796,000 135,600 2,755 41,060
Site 7
12/3/2012 813 <60 52 10 2/19/13 2,087 166 <10 <10 3/6/13 3,824 523 80 21
3/20/13 19,239 2,740 10 10 4/4/13 10,373 2,260 31 275
Site 8 12/3/2012 6,409 <60 62 171
3/20/13 35,711 1,450 836 1,450 4/4/13 78,628 5,750 1,695 3,551
Site 9 12/3/2012 5,043 <60 327 85

Russian River Monitoring Report - North Coast Regional Water Quality Control Board 17
Table 5. Median Fecal Indicator Bacteria Concentration Results continued
Location Collection Date
All Bacteroides
(16SrRNA genes/100mL)
Human Bacteroides
(16SrRNA genes/100mL)
E. coli (MPN/100mL)
Enterococcus (MPN/100mL)
Site 10
12/3/2012 32,700 81 323 410 2/19/13 570,924 6,730 5,827 20 3/6/13 574,218 12,950 10,099 8,686
3/20/13 172,543 8,580 1,137 2,098 4/4/13 528,882 17,500 11,199 7,701
Site 11
12/3/2012 49,667 1,156 154 205 2/19/13 32,558 4,280 598 128 3/6/13 63,479 4,040 857 2,247
3/20/13 53,642 5,070 373 1,565 4/4/13 25,925 2,720 2,755 7,701
Site 12
12/3/2012 4,143 <60 171 139 2/19/13 31,979 1,920 31 15 3/6/13 31,298 2,143 132 288
3/20/13 26,291 1,610 201 52 4/4/13 164,674 5,560 121 2,310
Site 13
12/3/2012 9,450 698 327 384 2/19/13 19,045 4,380 377 10 3/6/13 22,678 2,310 789 233
3/20/13 35,295 14,100 122 98 4/4/13 66,357 2,280 3,076 12,997
Site 14 12/3/2012 1,640,000 371,000 2,489 2,481
Site 15
12/3/2012 24,000 2,680 96 563 3/6/13 56,827 17,700 31 41
3/20/13 47,050 1,530 238 605 4/4/13 56,045 15,500 31 83
Russian River Monitoring Report - North Coast Regional Water Quality Control Board 18
Table 6. Stable Isotope Analysis of Nitrate Results * Indicates samples are below the limit of quantitation. Isotope values for samples below the limit of quantitation may not be reliable.
Location Collection Date δ 15 N δ 18 O Nitrate-N
(mg/L)
Site 1
12/3/2012 6.10 3.82 0.40 2/19/2013 6.87 6.44 0.33 3/6/2013 8.15 4.66 0.14
3/20/2013 8.04 3.80 0.23 4/4/2013 6.76 3.42 0.1m
Site 2 12/3/2012 9.61 6.24 0.03 3/20/2013 16.26* 18.84* 0.06 4/4/2013 6.54* 12.13* <0.01
Site 3
12/3/2012 7.05 3.54 1.45 3/6/2013 6.74 1.95 0.69
3/20/2013 7.65 3.07 0.94 4/4/2013 6.44 1.75 0.71
Site 4
12/3/2012 11.61 7.32 1.07 3/6/2013 4.15 0.99 0.74
3/20/2013 1.55 5.25 0.12 4/4/2013 4.20 0.57 0.23
Site 5
12/3/2012 8.68 6.08 0.99 2/19/2013 10.83 5.26 0.24 3/6/2013 7.45 1.84 0.72
3/20/2013 8.16 6.09 0.26 4/4/2013 6.49 0.41 0.38
Site 6 12/3/2012 8.20 3.83 2.58 3/20/2013 18.26 12.46 0.66 4/4/2013 12.25 6.46 0.18
Site 7
12/3/2012 5.76* 10.81* 0.05 2/19/2013 26.70* 18.36* <0.01 3/6/2013 20.95* 14.96* <0.01
3/20/2013 18.93* 21.70* <0.01 4/4/2013 12.91* 22.47* <0.01
Site 8 12/3/2012 4.21 3.69 0.74 3/20/2013 8.81 15.56 0.07 4/4/2013 8.68 10.28 0.09
Site 9 12/3/2012 2.81 3.89 0.69

Russian River Monitoring Report - North Coast Regional Water Quality Control Board 19
Table 6. Stable Isotope Analysis of Nitrate Results continued * Indicates samples are below the limit of quantitation. Isotope values for samples below the limit of quantitation may not be reliable.
Location Collection Date δ 15 N δ 18 O Nitrate-N
(mg/L)
Site 10
12/3/2012 10.78 9.65 0.58 2/19/2013 12.13* 13.18* <0.01 3/6/2013 7.65 3.17 0.10
3/20/2013 8.86* 22.84* <0.01 4/4/2013 4.01* 6.02* <0.01
Site 11
12/3/2012 3.66 4.84 0.80 2/19/2013 6.48 7.61 0.11 3/6/2013 7.83 -0.75 0.88
3/20/2013 7.60 5.69 0.11 4/4/2013 9.83 2.34 0.69
Site 12
12/3/2012 7.26 1.98 1.07 2/19/2013 8.59 2.93 1.24 3/6/2013 10.70 2.17 0.64
3/20/2013 8.98 6.33 1.25 4/4/2013 10.85 6.84 0.22
Site 13
12/3/2012 7.42 3.91 1.10 2/19/2013 8.54 6.34 0.20 3/6/2013 4.80 2.09 0.25
3/20/2013 8.81 4.15 0.13 Site 14 12/3/2012 9.70 5.04 4.27
Site 15
12/3/2012 8.05 4.98 4.25 3/6/2013 7.23 0.38 7.20
3/20/2013 9.60 2.62 0.97 4/4/2013 6.06 -0.29 4.38

Russian River Monitoring Report - North Coast Regional Water Quality Control Board 20
Table 7 – Replicate Sample Variability for E. coli Bacteria Concentrations
Location Collection Date
E. coli Bacteria Concentration (MPN/100mL) Coefficient
of Variation (%) Replicate 1 Replicate 2 Replicate 3
Site 1 12/3/2012 20 50 20 58% Site 2 12/3/2012 1019 1017 1274 13% Site 3 12/3/2012 156 158 160 1% Site 4 3/6/2013 3076 2613 2481 11% Site 5 3/6/2013 1723 1624 1664 3% Site 6 3/20/2013 8664 7701 8164 6% Site 7 3/6/2013 86 97 31 50% Site 8 3/20/2013 836 581 984 25%
Site 10 3/20/2013 882 1137 1374 22% Site 11 3/20/2013 292 495 373 26% Site 12 3/20/2013 231 201 132 27% Site 13 3/20/2013 84 171 122 35% Site 15 3/6/2013 31 52 20 47%
Mean Variability 25%

Russian River Monitoring Report - North Coast Regional Water Quality Control Board 21
Table 8 – Replicate Sample Variability for Enterococcus Bacteria Concentrations
Location Collection Date
Enterococcus Bacteria Concentration (MPN/100mL) Coefficient
of Variation (%) Replicate 1 Replicate 2 Replicate 3
Site 1 12/3/2012 185 135 173 16% Site 2 12/3/2012 295 384 432 19% Site 3 12/3/2012 243 295 359 19% Site 4 3/6/2013 12997 10462 14136 15% Site 5 3/6/2013 3076 3873 4106 15% Site 6 3/20/2013 >24196 >24196 >24196 - Site 7 3/6/2013 10 97 31 99% Site 8 3/20/2013 1450 1354 2987 47%
Site 10 3/20/2013 2098 2098 2143 1% Site 11 3/20/2013 1565 1935 1201 23% Site 12 3/20/2013 63 10 52 67% Site 13 3/20/2013 98 109 85 12% Site 15 3/6/2013 31 75 41 47%
Mean Variability 32%

Russian River Monitoring Report - North Coast Regional Water Quality Control Board 22
Table 9 – Replicate Sample Variability for All Bacteriodes Bacteria Concentrations
Location Collection Date
All Bacteroides Bacteria Concentration
(16SrRNA genes/100mL) Coefficient
of Variation (%) Replicate 1 Replicate 2 Replicate 3
Site 1 12/3/2012 7,880 11,100 7,570 22% Site 2 12/3/2012 12,100 12,526 10,313 10% Site 3 12/3/2012 2,537 2,060 2,150 11% Site 4 3/6/2013 165,210 169,775 234,262 20% Site 5 3/6/2013 68,502 56,317 68,802 11% Site 6 3/20/2013 72,940 80,789 79,321 5% Site 7 3/6/2013 5,373 3,824 3,291 26% Site 8 3/20/2013 29,927 35,722 35,711 10%
Site 10 3/20/2013 141,008 172,543 260,919 32% Site 11 3/20/2013 53,642 54,365 43,647 12% Site 12 3/20/2013 24,063 31,466 26,291 14% Site 13 3/20/2013 31,932 41,662 35,295 14% Site 15 3/6/2013 56,827 83,452 29,923 47%
Mean Variability 18%

Russian River Monitoring Report - North Coast Regional Water Quality Control Board 23
Table 10 – Replicate Sample Variability for Human-host Bacteroides Bacteria Concentrations
Location Collection Date
Human-host Bacteroides Bacteria Concentration
(16SrRNA genes/100mL) Coefficient
of Variation (%) Replicate 1 Replicate 2 Replicate 3
Site 1 12/3/2012 98 69 156 41% Site 2 12/3/2012 217 381 128 53% Site 3 12/3/2012 178 178 127 18% Site 4 3/6/2013 39,200 36,400 50,750 18% Site 5 3/6/2013 50,600 42,500 48,200 9% Site 6 3/20/2013 2,080 4,080 3,460 32% Site 7 3/6/2013 557 293 523 31% Site 8 3/20/2013 1,600 1,450 1,250 12%
Site 10 3/20/2013 4,680 8,580 8,620 31% Site 11 3/20/2013 6,310 5,070 4,390 19% Site 12 3/20/2013 1,610 1,140 2,020 28% Site 13 3/20/2013 16,300 14,100 11,100 19% Site 15 3/6/2013 17,300 23,800 17,700 19%
Mean Variability 32% Table 11. Kruskal-Wallis Statistical Test for a difference in FIB concentrations between sampling locations in the high parcel density - high FIB transport risk category (i.e., Sites 1, 2 & 3).
Constituent Kruskal-Wallis Statistic
Probability Value
Statistically Significant?
E. coli bacteria 3.503 0.174 No
Enterococcus bacteria 8.060 0.018 Yes
All Bacteroides bacteria 2.060 0.357 No
Human-host Bacteroides
bacteria 3.534 0.171 No
δ 15 N 2.651 0.266 No
δ 18 O 5.864 0.053 No

Russian River Monitoring Report - North Coast Regional Water Quality Control Board 24
Table 12. Kruskal-Wallis Statistical Test for a difference in FIB concentrations between sampling locations in the high parcel density -low FIB transport risk category (i.e., Sites 4, 5 & 6).
Constituent Kruskal-Wallis Statistic
Probability Value
Statistically Significant?
E. coli bacteria 0.799 0.671 No
Enterococcus bacteria 1.041 0.594 No
All Bacteroides bacteria 0.179 0.914 No
Human-host Bacteroides
bacteria 2.388 0.303 No
δ 15 N 4.754 0.093 No
δ 18 O 1.938 0.379 No
Table 13. Kruskal-Wallis Statistical Test for a difference in FIB concentrations between sampling locations in the low parcel density - high FIB transport risk category (i.e., Sites 7, 8 & 9).
Constituent Kruskal-Wallis Statistic
Probability Value
Statistically Significant?
E. coli bacteria 4.912 0.086 No
Enterococcus bacteria 4.708 0.095 No
All Bacteroides bacteria 3.271 0.195 No
Human-host Bacteroides
bacteria 1.453 0.484 No
δ 15 N 3.000 0.180 No
δ 18 O 2.000 0.655 No

Russian River Monitoring Report - North Coast Regional Water Quality Control Board 25
Table 14. Kruskal-Wallis Statistical Test for a difference in FIB concentrations between sampling locations in the low parcel density - low FIB transport risk category (i.e., Sites 10, 11 & 12).
Constituent Kruskal-Wallis Statistic
Probability Value
Statistically Significant?
E. coli bacteria 9.380 0.009 Yes
Enterococcus bacteria 2.289 0.318 No
All Bacteroides bacteria 7.220 0.027 Yes
Human-host Bacteroides
bacteria 4.340 0.114 No
δ 15 N 2.908 0.234 No
δ 18 O 1.185 0.553 No
Table 15. Spearman’s Rank Correlation Matrix
ρ All Bacteroides bacteria
Human-host Bacteroides
bacteria
E. coli bacteria
Enterococcus bacteria
All Bacteroides bacteria 1.00
Human-host Bacteroides bacteria 0.77 1.00
E. coli bacteria 0.48 0.46 1.00 Enterococcus bacteria 0.64 0.50 0.73 1.00
δ 15 N 0.06 0.06 0.25 0.21
δ 18 O -0.08 -0.18 0.20 0.05
Parcel Density 0.38 0.16 0.20 0.17
FIB Transport Risk -0.38 -0.49 -0.39 -0.43
Catchment Size 0.26 0.58 0.33 0.40

Russian River Monitoring Report - North Coast Regional Water Quality Control Board 26
Table 16. Kruskal-Wallis Statistical Test for a difference between the four categories.
Constituent Kruskal-Wallis Statistic
Probability Value
Statistically Significant?
E. coli bacteria 15.974 0.001 Yes
Enterococcus bacteria 13.195 0.004 Yes
All Bacteroides bacteria 14.912 0.002 Yes
Human-host Bacteroides
bacteria 17.576 0.001 Yes
δ 15 N 2.629 0.452 No
δ 18 O 2.725 0.436 No
Table 17. Mann-Whitney U Statistical Test for a difference between a high and low parcel density
Constituent Mann-Whitney U Statistic
Probability Value
Statistically Significant?
E. coli bacteria 327.5 0.015 Yes
Enterococcus bacteria 312 0.172 No
All Bacteroides bacteria 335 0.009 Yes
Human-host Bacteroides
bacteria 357 0.154 No
δ 15 N 158 0.595 No
δ 18 O 149 0.425 No

Russian River Monitoring Report - North Coast Regional Water Quality Control Board 27
Table 18. Mann-Whitney U Statistical Test for a difference between a high and low FIB transport risk
Constituent Mann-Whitney U Statistic
Probability Value
Statistically Significant?
E. coli bacteria 110 0.003 Yes
Enterococcus bacteria 105.5 0.001 Yes
All Bacteroides bacteria 117 0.006 Yes
Human-host Bacteroides
bacteria 112.5 <0.001 Yes
δ 15 N 115 0.109 No
δ 18 O 172 0.904 No
Russian River Monitoring Report - North Coast Regional Water Quality Control Board 28
Table 19. Area-weighted Index Component Rank Scores
Location
FIB Transport
Risk Index
Hill Slope Rank
Hydrologic Soil Group
Rank
Soil Depth Rank
Setback Rank
Site 1 12.4 4.49 3.00 4.76 0.00
Site 2 11.0 4.92 3.00 3.00 0.00
Site 3 10.0 3.90 3.00 3.04 0.01
Site 4 8.7 1.41 3.00 3.00 0.00
Site 5 7.9 1.91 3.00 3.00 0.00
Site 6 9.6 3.79 3.00 2.81 0.00
Site 7 10.8 4.88 3.00 3.00 0.23
Site 8 10.9 4.65 3.00 3.28 0.00
Site 9 10.6 4.61 3.00 3.00 0.00
Site 10 6.4 1.58 3.00 1.81 0.00
Site 11 7.3 3.27 3.00 1.00 0.00
Site 12 8.2 2.29 3.05 1.12 0.00
Russian River Monitoring Report - North Coast Regional Water Quality Control Board 29
Table 20. Mann-Whitney U Statistical Test for a difference between a high and low soil depth rank
Constituent Mann-Whitney U Statistic
Probability Value
Statistically Significant?
E. coli bacteria 58 0.277 No
Enterococcus bacteria 76.5 0.182 No
All Bacteroides bacteria 63 0.415 No
Human-host Bacteroides
bacteria 75 0.162 No
Table 21. Mann-Whitney U Statistical Test for a difference between a high and low hill slope rank
Constituent Mann-Whitney U Statistic
Probability Value
Statistically Significant?
E. coli bacteria 117 0.006 Yes
Enterococcus bacteria 112.5 <0.001 Yes
All Bacteroides bacteria 110 0.003 Yes
Human-host Bacteroides
bacteria 105.5 0.001 Yes
Russian River Monitoring Report - North Coast Regional Water Quality Control Board 30
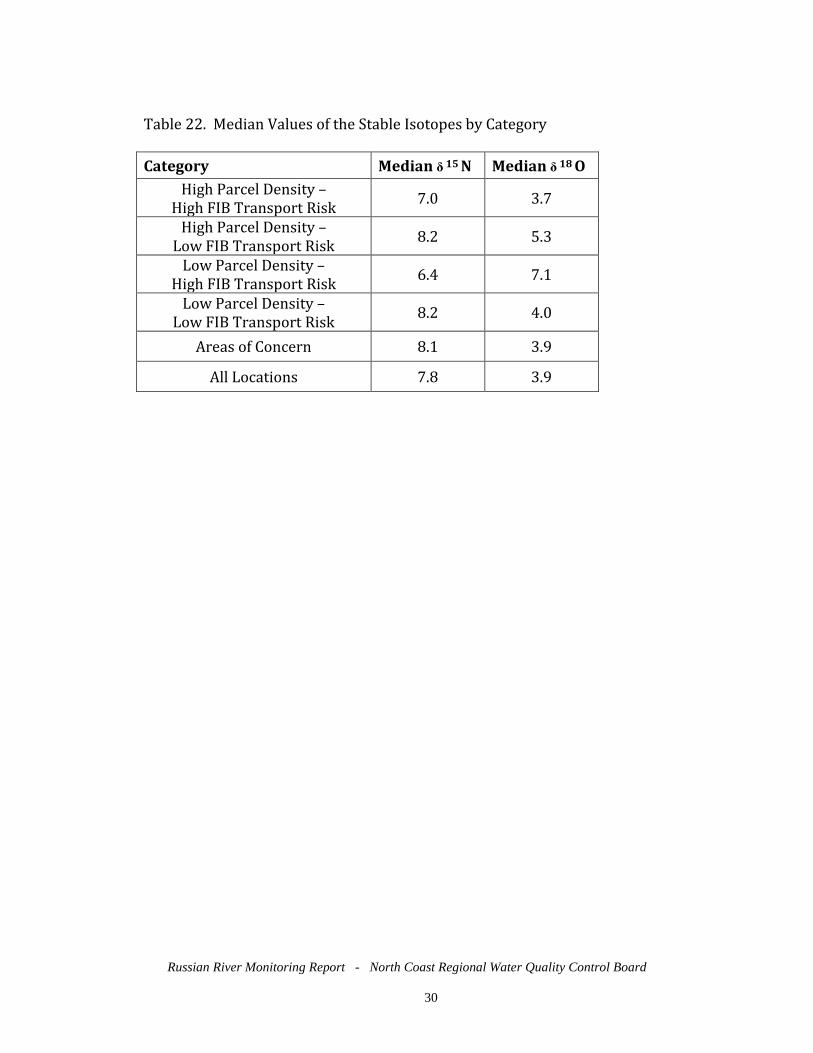
Table 22. Median Values of the Stable Isotopes by Category Category Median δ 15 N Median δ 18 O
High Parcel Density – High FIB Transport Risk 7.0 3.7
High Parcel Density – Low FIB Transport Risk 8.2 5.3
Low Parcel Density – High FIB Transport Risk 6.4 7.1
Low Parcel Density – Low FIB Transport Risk 8.2 4.0
Areas of Concern 8.1 3.9
All Locations 7.8 3.9
Russian River Monitoring Report - North Coast Regional Water Quality Control Board 31
8.0 FIGURES
Figure 1. Characteristics of the catchments studied
Figure 2. Comparison of the drainage areas between catchment categories
6
8
10
12
14
0 2 4 6 8
FIB
Tran
spor
t Ris
k(d
imen
sion
less
inde
x)
Parcel Density(number of parcels centriods/acre)
Russian River OWTS StudyCatchment Characteristics
High Parcel Density - High Risk
High Parcel Density - Low Risk
Low Parcel Density - High Risk
Low Parcel Density - Low Risk
Catchment of Concern
0
20
40
60
80
100
120
140
160
High Parcel DensityHigh Transport Risk
High Parcel DensityLow Transport Risk
Low Parcel DensityHigh Transport Risk
Low Parcel DensityLow Transport Risk
Catc
hmen
t Are
a(a
cres
)
Russian River OWTS StudyComparison of Catchments Categories
Russian River Monitoring Report - North Coast Regional Water Quality Control Board 32
Figure 3. Comparison of the parcel density between catchment categories
Figure 4. Comparison of the transport risk index between catchment categories
0
1
1
2
2
3
3
4
4
High Parcel DensityHigh Transport Risk
High Parcel DensityLow Transport Risk
Low Parcel DensityHigh Transport Risk
Low Parcel DensityLow Transport Risk
Parc
el D
ensi
ty(n
umbe
r of c
entr
oids
/acr
e)
Russian River OWTS StudyComparison of Catchments Categories
6
7
8
9
10
11
12
13
14
High Parcel DensityHigh Transport Risk
High Parcel DensityLow Transport Risk
Low Parcel DensityHigh Transport Risk
Low Parcel Density LowTransport Risk
FIB
Tran
spor
t Ris
k In
dex
Russian River OWTS StudyComparison of Catchments Categories

Russian River Monitoring Report - North Coast Regional Water Quality Control Board 33
Figure 5. Comparison of Enterococcus bacteria concentrations from catchments with a high parcel density and a high FIB transport risk
Figure 6. Comparison of E. coli bacteria concentrations from catchments with a low parcel density and a low FIB transport risk
1
10
100
1,000
10,000
100,000
Site 1 Site 2 Site 3
Ente
roco
ccus
Bact
eria
Con
cent
ratio
n (M
PN/1
00m
L)
Russian River OWTS StudyCatchments with High Parcel Density & High Transport Risk
1
10
100
1,000
10,000
100,000
Site 10 Site 11 Site 12
E. c
oliB
acte
ria C
once
ntra
tion
(MPN
/100
mL)
Russian River OWTS StudyCatchments with Low Parcel Density & Low Transport Risk
Russian River Monitoring Report - North Coast Regional Water Quality Control Board 34
Figure 7. Comparison of All Bacteroides bacteria concentrations from catchments with a low parcel density and a low FIB transport risk
Figure 8. Comparison of E. coli bacteria concentrations between catchment categories
10,000
100,000
1,000,000
Site 10 Site 11 Site 12
All B
acte
roid
es B
acte
ria C
once
ntra
tion
(16S
rRN
A ge
nes/
100m
L)
Russian River OWTS StudyCatchments with Low Parcel Density & Low Transport Risk
1
10
100
1,000
10,000
High Parcel DensityHigh Transport Risk
High Parcel DensityLow Transport Risk
Low Parcel DensityHigh Transport Risk
Low Parcel DensityLow Transport Risk
E. c
oliB
acte
ria C
once
ntra
tion
(MPN
/100
mL)
Russian River OWTS StudyComparison of Catchments Categories

Russian River Monitoring Report - North Coast Regional Water Quality Control Board 35
Figure 9. Comparison of Enterococcus bacteria concentrations between catchment categories
Figure 10. Comparison of All Bacteroides bacteria concentrations between catchment categories
1
10
100
1,000
10,000
100,000
High Parcel DensityHigh Transport Risk
High Parcel DensityLow Transport Risk
Low Parcel DensityHigh Transport Risk
Low Parcel DensityLow Transport Risk
Ente
roco
ccus
Bact
eria
Con
cent
ratio
n (M
PN/1
00m
L)
Russian River OWTS StudyComparison of Catchments Categories
1,000
10,000
100,000
1,000,000
High Parcel DensityHigh Transport Risk
High Parcel DensityLow Transport Risk
Low Parcel DensityHigh Transport Risk
Low Parcel DensityLow Transport Risk
AllB
acte
roid
esBa
cter
ia C
once
ntra
tion
(16S
rRN
A ge
nes/
100m
L)
Russian River OWTS StudyComparison of Catchments Categories
Russian River Monitoring Report - North Coast Regional Water Quality Control Board 36
Figure 11. Comparison of Human-host Bacteroides bacteria concentrations between catchment categories
Figure 12. Comparison of E. coli bacteria concentrations based on catchment parcel density.
1
10
100
1,000
10,000
100,000
1,000,000
High Parcel DensityHigh Transport Risk
High Parcel DensityLow Transport Risk
Low Parcel DensityHigh Transport Risk
Low Parcel DensityLow Transport Risk
Hum
an-h
ostB
acte
roid
esBa
cter
ia C
once
ntra
tion
(16S
rRN
A ge
nes/
100m
L)
Russian River OWTS StudyComparison of Catchments Categories
1
10
100
1,000
10,000
High Parcel Density Low Parcel Density
E. c
oliB
acte
ria C
once
ntra
tion
(MPN
/100
mL)
Russian River OWTS StudyComparison of Catchment Parcel Densities

Russian River Monitoring Report - North Coast Regional Water Quality Control Board 37
Figure 13. Comparison of All Bacteroides bacteria concentrations based on catchment parcel density.
Figure 14. Comparison of E. coli bacteria concentrations based on catchment FIB transport risk.
1,000
10,000
100,000
High Parcel Density Low Parcel Density
AllB
acte
roid
esBa
cter
ia C
once
ntra
tion
(MPN
/100
mL)
Russian River OWTS StudyComparison of Catchment Parcel Densities
1
10
100
1,000
10,000
High Transport Risk Low Transport Risk
E. c
oliB
acte
ria C
once
ntra
tion
(MPN
/100
mL)
Russian River OWTS StudyComparison of Catchment Transport Risk

Russian River Monitoring Report - North Coast Regional Water Quality Control Board 38
Figure 15. Comparison of Enterococcus bacteria concentrations based on catchment FIB transport risk.
Figure 16. Comparison of All Bacteroides bacteria concentrations based on catchment FIB transport risk.
1
10
100
1,000
10,000
High Transport Risk Low Transport Risk
Ente
roco
ccus
Bact
eria
Con
cent
ratio
n(M
PN/1
00m
L)
Russian River OWTS StudyComparison of Catchment Transport Risk
10,000
100,000
1,000,000
High Transport Risk Low Transport Risk
All B
acte
roid
esBa
cter
ia C
once
ntra
tion
(16S
rRN
A ge
nes/
100m
L)
Russian River OWTS StudyComparison of Catchment Transport Risk

Russian River Monitoring Report - North Coast Regional Water Quality Control Board 39
Figure 17. Comparison of Human-host Bacteroides bacteria concentrations based on catchment FIB transport risk.
Figure 18. Comparison of E. coli bacteria concentrations based on catchment hill slope index rank.
1
10
100
1,000
10,000
100,000
High Transport Risk Low Transport Risk
Hum
an-h
ost B
acte
roid
esBa
cter
ia C
once
ntra
tion
(16S
rRN
A ge
nes/
100m
L)
Russian River OWTS StudyComparison of Catchment Transport Risk
1
10
100
1,000
10,000
High Hill Slope Low Hill Slope
E. c
oliB
acte
ria C
once
ntra
tion
(MPN
/100
mL)
Russian River OWTS StudyComparison of Hill Slope Index Rank

Russian River Monitoring Report - North Coast Regional Water Quality Control Board 40
Figure 19. Comparison of Enterococcus bacteria concentrations based on catchment hill slope index rank.
Figure 20. Comparison of All Bacteroides bacteria concentrations based on catchment hill slope index rank.
100
1,000
10,000
High Hill Slope Low Hill Slope
Ente
roco
ccus
Bac
teria
Con
cent
ratio
n (M
PN/1
00m
L)
Russian River OWTS StudyComparison of Hill Slope Index Rank
1,000
10,000
100,000
1,000,000
High Hill Slope Low Hill Slope
AllB
acte
roid
es B
acte
ria C
once
ntra
tion
(16S
rRN
A ge
nes/
100m
L)
Russian River OWTS StudyComparison of Hill Slope Index Rank

Russian River Monitoring Report - North Coast Regional Water Quality Control Board 41
Figure 21. Comparison of Human-host Bacteroides bacteria concentrations based on catchment hill slope index rank
Figure 22. Typical values of the Stable Isotopes of oxygen (δ18O) and nitrogen (δ15N) of nitrate derived from various sources (diagram from Michener and Lajtha, 2007).
1
10
100
1,000
10,000
100,000
High Hill Slope Low Hill Slope
Hum
an-h
ostB
acte
roid
es B
acte
ria C
once
ntra
tion
(16S
rRN
A ge
nes/
100m
L)
Russian River OWTS StudyComparison of Hill Slope Index Rank

Russian River Monitoring Report - North Coast Regional Water Quality Control Board 42
Figure 23. Comparison of the stable isotopes of nitrogen based on catchment category
Figure 24. Comparison of E. coli bacteria concentrations from the catchments of concern
-30
-20
-10
0
10
20
30
0 2 4 6 8 10 12 14
δ18 O
(o /
oo)
δ15N (o/oo)
Stable Isoptope AnalysesRussian River Watershed
High Parcel Density - High Risk
High Parcel Density - Low Risk
Low Parcel Density - High Risk
Low Parcel Density - Low Risk
Areas of Concern
1
10
100
1,000
10,000
Site 13 Site 14 Site 15 All Other Sites
E. c
oliB
acte
ria C
once
ntra
tion
(MPN
/100
mL)
Russian River OWTS StudyCatchments of Concern Comparison

Russian River Monitoring Report - North Coast Regional Water Quality Control Board 43
Figure 25. Comparison of Enterococcus bacteria concentrations from the catchments of concern
Figure 26. Comparison of All Bacteroides bacteria concentrations from the catchments of concern
1
10
100
1,000
10,000
100,000
Site 13 Site 14 Site 15 All Other Sites
Ente
roco
ccus
Bac
teria
Con
cent
ratio
n (M
PN/1
00m
L)
Russian River OWTS StudyCatchments of Concern Comparison
1
10
100
1,000
10,000
100,000
1,000,000
10,000,000
Site 13 Site 14 Site 15 All Other Sites
AllB
acte
roid
es B
acte
ria C
once
ntra
tion
(16S
rRN
A ge
nes/
100m
L)
Russian River OWTS StudyCatchments of Concern Comparison
Russian River Monitoring Report - North Coast Regional Water Quality Control Board 44
Figure 27. Comparison of Human-host Bacteroides bacteria concentrations from the catchments of concern
Figure 28. Comparison of the percent of Human-host Bacteroides bacteria concentrations from the catchments of concern
1
10
100
1,000
10,000
100,000
1,000,000
Site 13 Site 14 Site 15 All Other Sites
Hum
an-h
ostl
Bact
eroi
des B
acte
ria C
once
ntra
tion
(16S
rRN
A ge
nes/
100m
L)
Russian River OWTS StudyCatchments of Concern Comparison
0%
5%
10%
15%
20%
25%
30%
35%
Site 13 Site 14 Site 15 All Other Sites
Perc
ent H
uman
-hos
tlBa
cter
oide
s Ba
cter
ia
(HuB
ac/A
llBac
)
Russian River OWTS StudyCatchments of Concern Comparison