Embed Size (px)
Citation preview
‘ O n l i n e S h o p p i n g ’ , C u s t o m e r S a t i s f a c t i o n a n d L o y a l t y i n N o r w a y
Master thesis 2010 Page 1
‘Online Shopping’ Customer Satisfaction and Loyalty in Norway
Master’s Thesis in Business Administration, MBA programme
Authors
Pervaiz Ali [email protected]
Sudha Sankaran [email protected]
University Supervisor
Peter Stevrin [email protected]
Date of Submission 23-06-2010

‘ O n l i n e S h o p p i n g ’ , C u s t o m e r S a t i s f a c t i o n a n d L o y a l t y i n N o r w a y
Master thesis 2010 Page 2
ABSTRACT The primary goal of this research is to analyze the customer satisfaction and loyalty of the
online customers in Norway. The theoretical framework discusses in brief about the effects of
customer loyalty and retention on customer satisfaction. The study on customer satisfaction
and loyalty has been done from the perspective of a firm performing online business. To
understand the customer satisfaction and loyalty level of online Norwegian shoppers, we
pursued with the collection of quantitative data with the help of online survey. For survey
purposes, a questionnaire was prepared and made available in www.nisaa.dk/survey. This
study has no limits regarding different product categories. From marketing and strategic point
of view we will point out those factors that might affect the customers, while purchasing
goods online. To measure the customer satisfaction and loyalty of online shoppers in Norway,
the survey results are calculated with the help of Simple Random Sampling method and Net
Promoter Score (NPS) model.
The results of the survey reveal that while a good percentage of Norwegians are
satisfied with online shopping only less than half of them stay loyal to their online sellers.
However, on the long run, these customers will be loyal and can be retained only when online
businesses constantly satisfy them by providing detailed product information on websites,
superior customer service, quality and timely delivery of goods and importantly effective
website designs.
Thesis key words: Online shopping, Customer satisfaction, Loyalty, E-commerce, Norway.
‘ O n l i n e S h o p p i n g ’ , C u s t o m e r S a t i s f a c t i o n a n d L o y a l t y i n N o r w a y
Master thesis 2010 Page 3
ACKNOWLEDGEMENT
First and foremost, we would like to thank our family and friends for extending their support
and encouragement during the entire phase of our research work.
We would like to thank our MBA fellow students Carina Alm and Behrouz Tizro who helped
us with their peer review on our thesis work. We are thankful to Carina Alm and our
Supervisor Peter Stevrin for visiting the website www.nisaa.dk/survey in order to test its flow
and rule out technical errors.
We are very thankful to our Supervisor Peter Stevrin for guiding us towards the successful
completion of this Master Thesis.
Pervaiz Ali
&
Sudha Sankaran.
‘ O n l i n e S h o p p i n g ’ , C u s t o m e r S a t i s f a c t i o n a n d L o y a l t y i n N o r w a y
Master thesis 2010 Page 4
TABLE OF CONTENTS
TABLE OF CONTENTS ....................................................................................................................... 4
LIST OF TABLES ................................................................................................................................. 7
LIST OF FIGURES ............................................................................................................................... 8
CHAPTER 1 - INTRODUCTION ........................................................................................................... 9
1.1 Defining the Problem ................................................................................................................ 10
1.2 Research questions ................................................................................................................. 10
1.3 Advantages of online shopping ............................................................................................. 11
1.4 Disadvantages of online shopping ............................................................................................ 12
1.5 Objectives ................................................................................................................................ 12
1.6 Extent of study ......................................................................................................................... 12
1.7 Overview .................................................................................................................................... 14
CHAPTER 2 - THEORETICAL FRAMEWORK .................................................................................. 15
2.1 Business performance measurement ....................................................................................... 15
2.2 The evolution of Customer Satisfaction Index ......................................................................... 17
2.3 The EPSI rating framework ........................................................................................................ 17
2.4 Customer Satisfaction .............................................................................................................. 19
2.5 Satisfaction Profit chain ......................................................................................................... 20
2.6 Customer Retention ................................................................................................................ 22
2.7 Customer loyalty ..................................................................................................................... 23
2.8 Relationship between customer satisfaction and loyalty .................................................... 29
‘ O n l i n e S h o p p i n g ’ , C u s t o m e r S a t i s f a c t i o n a n d L o y a l t y i n N o r w a y
Master thesis 2010 Page 5
2.8.1 Customer satisfaction is sufficient as antecedent of firm performance or if customer
loyalty is required …………………………………………………………………………………………….25
2.8.2 loyalty as an attitude or behavior………………………………………………………………….26
2.9 Direct marketing .................................................................................................................... 297
2.10 Online marketing ................................................................................................................. 297
2.11 E-commerce in Europe .......................................................................................................... 30
2.12 E-commerce in Norway ......................................................................................................... 31
2.13 Online marketing domains .................................................................................................... 32
2.14 B2C online marketing ............................................................................................................ 33
2.15 C2B online marketing ............................................................................................................ 34
2.16 Summary ................................................................................................................................ 34
CHAPTER 3 - METHODOLOGY ........................................................................................................ 35
3.1 Data Collection ........................................................................................................................ 35
3.1.2 Qualitative Research ........................................................................................................... 35
3.1.3 Questionnaire Design ........................................................................................................... 35
3.1.4 Questionnaire format ........................................................................................................... 35
3.1.5 Web survey ........................................................................................................................... 36
3.1.6 Internet/Intranet (Web Page) Survey method ..................................................................... 36
3.1.7 Survey Sample size ............................................................................................................. 37
3.1.8 Number of Respondents .................................................................................................... 38
3.2 Summary ..................................................................................................................................... 40
CHAPTER 4 - ANALYSIS & RESULTS ............................................................................................. 41
4.1 Data Analysis .......................................................................................................................... 41
4.2 Measuring customer loyalty .................................................................................................... 48
4.3 Rating of questionnaire response ......................................................................................... 49
4.4 Evaluation of questionnaire Data (Mean and Standard Deviation) .................................... 51
‘ O n l i n e S h o p p i n g ’ , C u s t o m e r S a t i s f a c t i o n a n d L o y a l t y i n N o r w a y
Master thesis 2010 Page 6
4.5 Summary ..................................................................................................................................... 52
CHAPTER 5 - CONCLUSION ............................................................................................................ 54
CHAPTER 6 - RECOMMENDATIONS ............................................................................................... 56
REFERENCES ................................................................................................................................... 58
APPENDIX(A) .................................................................................................................................... 62
APPENDIX(B) .................................................................................................................................... 68
APPENDIX(C)...….……………………………..………………………………………………………………70
‘ O n l i n e S h o p p i n g ’ , C u s t o m e r S a t i s f a c t i o n a n d L o y a l t y i n N o r w a y
Master thesis 2010 Page 7
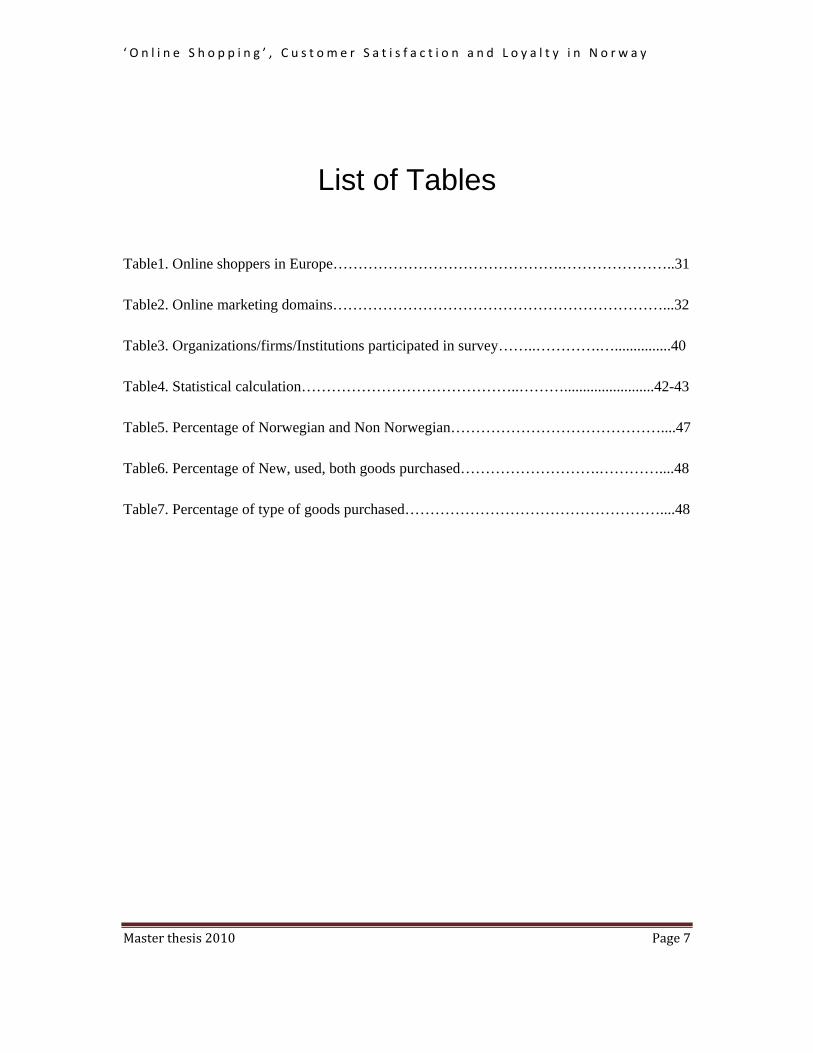
List of Tables
Table1. Online shoppers in Europe……………………………………….…………………..31
Table2. Online marketing domains…………………………………………………………...32
Table3. Organizations/firms/Institutions participated in survey……..………….…...............40
Table4. Statistical calculation……………………………………..………........................42-43
Table5. Percentage of Norwegian and Non Norwegian……………………………………....47
Table6. Percentage of New, used, both goods purchased……………………….…………....48
Table7. Percentage of type of goods purchased……………………………………………....48
‘ O n l i n e S h o p p i n g ’ , C u s t o m e r S a t i s f a c t i o n a n d L o y a l t y i n N o r w a y
Master thesis 2010 Page 8
List of Figures
Figure1. Thesis Overview.……………………………………………………………………13
Figure2. European Excellence modal.……….………….……………………………............15
Figure3. EPSI Framework…………………………………………………………………….17
Figure4.Customer Satisfaction modal………… ……………………………………………..18
Figure5.Business Reputation…………………… ……………………….……......................20
Figure6.Customer Loyalty……………………… ……………….……………………..........23
Figure7.loyalty business Model………..……….…..………………….…………………….26
Figure8.Customer Attitude and Behavior……….…..………………….…………………….30
Figure9.Flow between Seller and Buyers.................................................................................34
Figure10.Likert Method……………..………………...……………………………..….........36
Figure11. Graphical representation for questionnaire…...…………………………..........43-44
Figure12. Graphical representation for Means of Questionnaire…………………………....45
Figure13.Graphical representation of Normal Distribution………………………………46-47
‘ O n l i n e S h o p p i n g ’ , C u s t o m e r S a t i s f a c t i o n a n d L o y a l t y i n N o r w a y
Master thesis 2010 Page 9
Chapter 1 - Introduction In the past decade, there has been a dramatic change in the way consumers have altered
their way of shopping. Although consumers continue to purchase from a physical store,
consumers feel very convenient to shop online since it frees the customer from personally
visiting the store. Internet shopping has its own advantages and it reduces the effort of
travelling to a physical store. Decisions can be made from home at ease looking at various
choices and prices can be easily compared with the competitor’s products to arrive at a
decision.
Online shopping offers the customer a wide range of products and services wherein he is able
to compare the price quoted by different suppliers and choose the best deal from it. Internet
marketing is conceptually different from other marketing channels and internet promotes a
one to one communication between the seller and the end user with round the clock customer
service. Today, business internet marketing is the fastest growing segment of online
commerce. The major difference between traditional and online selling is the extent of
interaction between the consumer and the seller. There is much more electronic interactivity
with the consumer in the form of emails and FAQs. Through FAQs, the consumer’s questions
on shipment, payment, product, policies and other customer concerns can be addressed
effectively.
It is very important for businesses to understand the customer satisfaction and loyalty because
some the customer satisfaction and loyalty are two required things for the well being, prophet
and long term growth of the firms. In other words we could say that to measure how
successful the businesses are it is considered in terms of how satisfied and loyal their
customers are. (Source: www.esurveyspro.com)
With respect to Norway, e-commerce has grown tremendously in the recent years. This is one
of the reasons that motivated us to specifically choose Norway for our research. According to
OECD Science, technology and industry scoreboard, 2007, Norway has recorded 47% of
adults using internet for online shopping. According to the survey results conducted in our
thesis study, effective website design, detailed product information and quality and timely
‘ O n l i n e S h o p p i n g ’ , C u s t o m e r S a t i s f a c t i o n a n d L o y a l t y i n N o r w a y
Master thesis 2010 Page 10
delivery of goods play a significant role in satisfying customers and retaining them with
loyalty in the long run.
1.1 Defining the Problem
One can find numerous statistical and economic studies on customer satisfaction and
loyalty with regards to physical store shopping. But this research on measuring the customer
satisfaction and loyalty of online shoppers in Norway is rare of its kind. This increases the
importance of our research work and the need to study the online shopping in Norway. This
study has enabled us to gather the views of online customers in Norway with respect to what
they expect and what has made them remain loyal or satisfied to the product or service.
The objective of this research work is to measure customer satisfaction and loyalty with
online shopping in Norway. Moreover it explains the relationship between customer
satisfaction and customer loyalty and how it relates to retention. Here it is very important to
describe, what the difference between the customer satisfaction and loyalty is in order to get
better understanding of how customer satisfaction changes into customer loyalty.
We will add many other supporting materials specifically for the literature review a
model will be used with which we try to link adjustment to its antecedents and consequences.
For qualitative data collection, we have used the web survey method as this is the most quick
and inexpensive method compared to other survey methods.
1.2 Research questions
In this research, through our literature study and survey method, we will try to get answers for
the following questions:
- Which factors have good or bad influences and impacts on online shopping?
- What impacts do these factors have on online shopping in Norway?
- How much satisfied and loyal are customers in Norway towards online shopping?
‘ O n l i n e S h o p p i n g ’ , C u s t o m e r S a t i s f a c t i o n a n d L o y a l t y i n N o r w a y
Master thesis 2010 Page 11
The results of this thesis will help the online sellers to not only identify the key
improvement areas in their online business but also focus on them in order to enhance the
customer satisfaction and loyalty towards online shopping in Norway.
The findings of this research will help the online sellers of Norway in the following way:
1. Identify the key areas for improving their online business in Norway.
2. Address the downsides and customer expectations towards online shopping in
Norway.
3. Recognize their strength and further focus on increasing customer satisfaction and
loyalty of online Norwegian shoppers.
The following section discusses the advantages and disadvantages of online shopping in
general.
1.3 Advantages of online shopping
While the conventional shopping method has its own advantages, online shopping can be
attributed to handy, hassle free, all time convenience. The various advantages of online
shopping are:
Reduces travel necessity, time and energy consumption
Internet marketers comparatively offer products / services at a cheaper price and soft
service as well.
Customers can window shop a variety of products with utmost comfort from home
The price and benefits offered by various product / service providers can be easily
compared.
The product quality can be analyzed in detail with the help of customer
recommendation, ratings etc.
Product information can be easily obtained from online catalogues, product
description etc.
Accessible any time of year or day.
‘ O n l i n e S h o p p i n g ’ , C u s t o m e r S a t i s f a c t i o n a n d L o y a l t y i n N o r w a y
Master thesis 2010 Page 12
1.4 Disadvantages of online shopping
Waiting time involved in receiving the product as compared to purchasing it
immediately from a physical store.
Customer will have to bear the delivery charges with some of the sellers but
not all.
Customers are not satisfied with the product received. For example, the product
received is in bad condition, broken or some of the parts are missing.
Security measures regarding online payments.
1.5 Objectives
This study regarding "Online shopping customer satisfaction and loyalty" will be
accomplished by the following objectives
To study and analyze academic and empirical research in the area of online customer
satisfaction in Norway.
To develop a questionnaire and conduct qualitative online survey in order to
understand the expectations of Norwegian customers from online shopping.
Utilization of Likert scaling, simple random sampling tools and NPS (Net Promoter
Score) model to analyze the obtained data from questionnaire
Finally we will come up with some conclusions and recommendations for the online
sellers on the basis of the quantitative and qualitative data analysis and results of our
thesis work.
1.6 Extent of study
This study does not check the percentage across product categories but is about overall
online shopping experience. This study is not specifically limited to particular product
categories and therefore focuses on the overall online shopping domain. Further, online
services like online banking are not included as part of this research. This study also does not
bring into account the differences of tangible and intangible products for analysis
Furthermore, in the study all people living in Norway are considered homogeneous segment

‘ O n l i n e S h o p p i n g ’ , C u s t o m e r S a t i s f a c t i o n a n d L o y a l t y i n N o r w a y
Master thesis 2010 Page 13
of online marketing so it does not matter if they originally belong to any other nationality. The
study covers the different aspects of online shopping (for example selling goods online to
final consumers) and does not include other type of online marketing. It is assumed that one
model would govern all the cities and other demographic variables. Also the study of
customer satisfaction in Norway has been made from a firm’s perspective. The analysis of
results has also been restricted only to Norway and no comparison of it has been made with
other countries.
To conclude, the results will be analyzed and presented in a detailed way for better
understanding of the research. The analysis of validity and reliability of the research will be
limited to the measures that are relevant to the model, e.g. Likert format, statistical simple
random sampling and Net Promoter Score (NPS) model.
The results from this research work will help the firms and organizations in Norway to
perform better by measuring the customer satisfaction and loyalty of their online shoppers. It
will also help them identify the customer’s expectations towards online business in Norway
and take corrective measures on the areas of improvement. Also the perception of the
customer towards online product/service can be analyzed with the help of the survey results.
The results of this survey will also serve as a reference for new firms that are looking forward
to enter into online business in Norway.
‘ O n l i n e S h o p p i n g ’ , C u s t o m e r S a t i s f a c t i o n a n d L o y a l t y i n N o r w a y
Master thesis 2010 Page 14
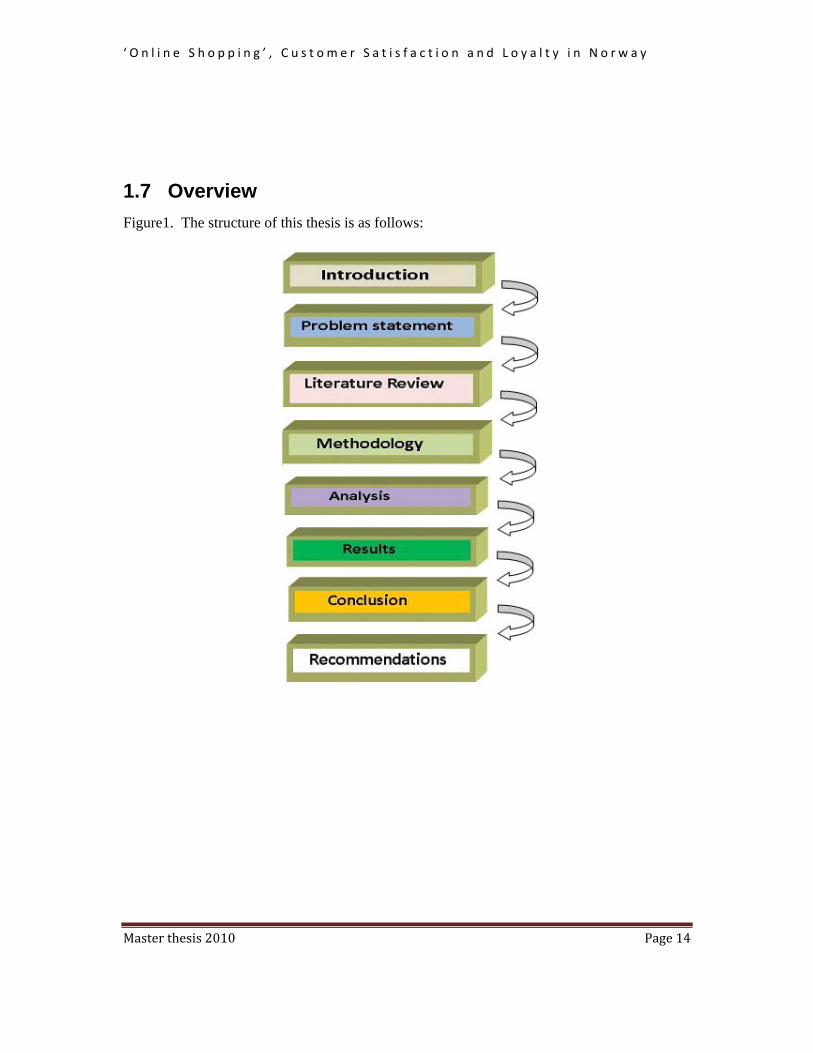
1.7 Overview
Figure1. The structure of this thesis is as follows:
‘ O n l i n e S h o p p i n g ’ , C u s t o m e r S a t i s f a c t i o n a n d L o y a l t y i n N o r w a y
Master thesis 2010 Page 15
Chapter 2 - Theoretical Framework
2.1 Business performance measurement
One of the primary goals of every business organization in general is to earn profit and to
enhance their business financial profile. Also, improving its non-financial performance like
creating stakeholders value i.e. customers, employees and society is also equally important for
a business organization. A business has to improve their performance by constantly doing a
self-assessment. The combination of financial and non-financial indicator is called BE
(business excellence) or (OE) organizational excellence. The commonly used business
excellence (BE) model in Europe is the EFQM (The European Foundation for Quality
management) excellence model, while the Malcolm Baldrige model is mostly used in the
United States. The principal and methodologies are similar in both these models. The Baldrige
model is normally used for internal performance measurement and for the management of
stakeholder assets. According to Kristensen & Westlund 2009, accountable business
performance measurement for sustainable business excellence needs reliability and relevance
of information.
With the support of the European commission, in the year 1988, EFQM was set up by 14
large European companies. EFQM model promotes TQM (Total Quality Management) and
helps in determining the maturity of a business. The model focuses at excelling customer
satisfaction and performance results (Van Haren Publishing 2007). The organizations are
evaluated on the basis of nine criteria that are grouped under 2 categories. The first five are
called “enablers” which explain what an organization does, and remaining four called
“results” measures the achievements of an organization. The model below shows the
relationship between “enablers” and “results”.

‘ O n l i n e S h o p p i n g ’ , C u s t o m e r S a t i s f a c t i o n a n d L o y a l t y i n N o r w a y
Master thesis 2010 Page 16
The European Excellence model
Figure2. Source:www.efqm.org
In brief this excellence model describes the following:
a. Among the enablers, the element ‘Leadership’ is an important criterion for self-
assessment. It should demonstrate how a leader develops the mission and personally involves
in the development, implementation and constant improvement of the organization’s
management system.
b. Also the criterion ‘Processes” in enablers evaluates how an organization designs,
manages and improves its processes. It is mandatory that Processes in the organization are
designed in such manner that they support organization's vision, strategy and goals. The
processes should generate an increasing value to the organization’s customers and
stakeholders.
c. In the second group of results, ‘customer results’ assesses the performance and
relationship of an organization to its external customers. This measures the customer’s
satisfaction with the organization’s product/services and also whether their needs and
expectations are satisfied.
‘ O n l i n e S h o p p i n g ’ , C u s t o m e r S a t i s f a c t i o n a n d L o y a l t y i n N o r w a y
Master thesis 2010 Page 17
To summarize, based on the EFQM Excellence Model, customer satisfaction is the most
important factor that drives the organization towards performance excellence and increasing
financial results (Williams, Bertsch, Wiele, Iwaarden & Dale 2006).
However, it still remains a question whether scoring high points on these models will
actually result in excellent performance in the stakeholder marketplace. Hence, these models
might serve as a useful guide to improvement for businesses with poor conformance quality.
Businesses that are advanced should rather use their own business models and strategies.
2.2 The evolution of Customer Satisfaction Index
Cumulative customer satisfaction helps to predict the subsequent behavior and the future
economic performance of the business. While making a repurchase, customers evaluate and
arrive at a decision not only based on one particular transaction but based on the past
experience of the previous purchase and consumption (Johnson, Gustafson, Andreasson,
Lervik & Cha 2001).
The evolution of CSI (Customer Satisfaction Index) can be tracked down since 1989 by
the Swedish Customer Satisfaction Barometer (SCB). This was the first national CSI
established for domestic products and services and initially begun with 32 largest industries in
Sweden. ACSI (American Customer Satisfaction Index) was introduced in the year 1994 that
included 200 companies from 34 different industries. The year 1996 noted the evolution of
Norwegian Customer Satisfaction Barometer and as a recent development, the European
Customer Satisfaction Index (ECSI) was introduced which is a pilot test that includes 11
European countries from 4 different industries (Johnson, Gustafsson, Andreasson, Lervik &
Cha 2001).
2.3 The EPSI rating framework
EPSI (European Performance Satisfaction Index) developed in 1999 is an integrated
system that collects, analyzes and disseminates information about what customers expect in
terms of quality, value etc from the product/services they buy. EPSI rating provides unique
information about a business’s customers and its competitors. Based on the information

‘ O n l i n e S h o p p i n g ’ , C u s t o m e r S a t i s f a c t i o n a n d L o y a l t y i n N o r w a y
Master thesis 2010 Page 18
provided by EPSI rating, one can understand the causes of customer satisfaction and its
effects on loyalty and customer retention. By partnering with EFQM (European Foundation
for Quality Management), EOQ (European Organization for Quality) and academic network
IFCF (International Foundation for Customer Focus), EPSI developed a common standard
across Europe for measuring customer satisfaction and loyalty (Jonker & Eskildsen 2009).
EPSI rating is a structural equation model to stipulate the seven latent variables –
customer expectation, customer satisfaction, perceived value, perceived quality, customer
loyalty, Image, product/service quality (Eskildsen & Kristensen 2007).
Figure3. The seven latent variables of EPSI rating framework
Source: Cassel &Eklöf (2001)
EPSI was developed based on the model specification of ACSI (American Customer
Satisfaction Index). Although, the first five latent variables mentioned above have been
modeled exactly as per ACSI, the product and service quality unlike that of ACSI is standard
in EPSI .There are some subtle differences between ACSI and EPSI. Corporate image is one
of the latent variables in ECSI and is considered to drive customer loyalty, customer
satisfaction and expectation. Also while comparing EPSI with ACSI, there is difference in the
‘ O n l i n e S h o p p i n g ’ , C u s t o m e r S a t i s f a c t i o n a n d L o y a l t y i n N o r w a y
Master thesis 2010 Page 19
way the customer loyalty is being measured. Loyalty is measured as a probability of retention
and customer recommendation of the brand and increase in customer repurchase. Also, EPSI
does not take consider customer complaints as a consequence of customer dissatisfaction
(Johnson, Gustafsson, Andreasson, Lervik & Cha 2001).
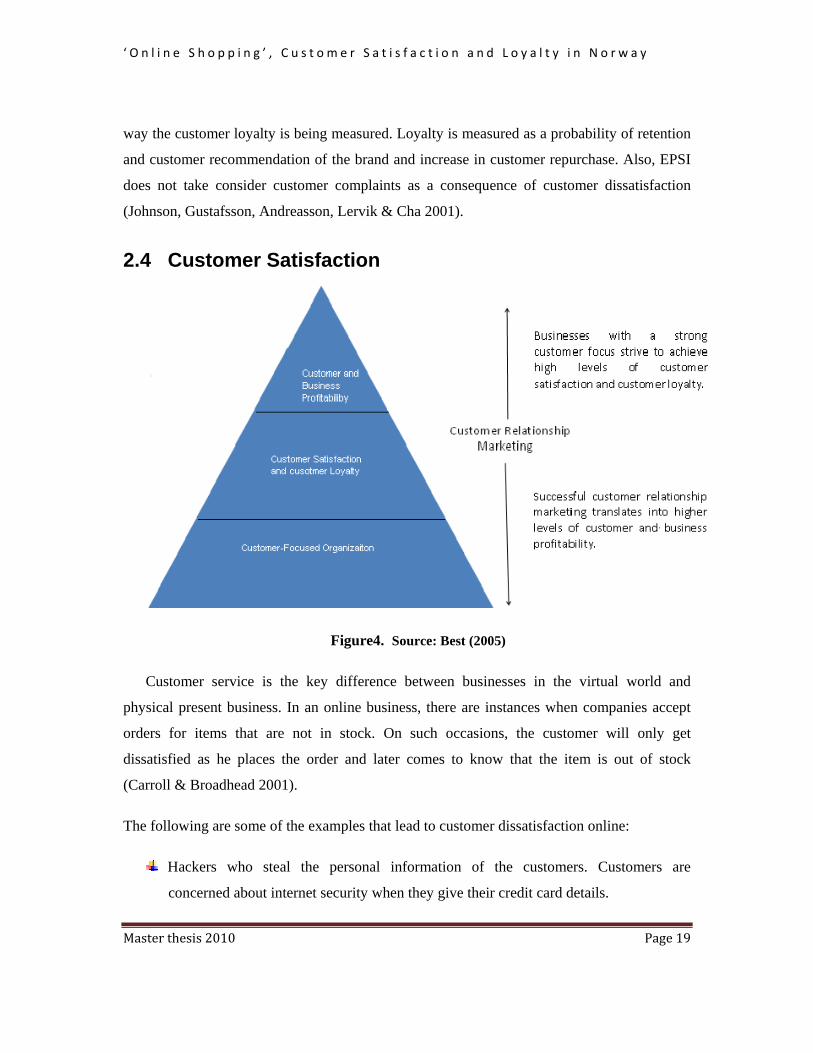
2.4 Customer Satisfaction
Figure4. Source: Best (2005)
Customer service is the key difference between businesses in the virtual world and
physical present business. In an online business, there are instances when companies accept
orders for items that are not in stock. On such occasions, the customer will only get
dissatisfied as he places the order and later comes to know that the item is out of stock
(Carroll & Broadhead 2001).
The following are some of the examples that lead to customer dissatisfaction online:
Hackers who steal the personal information of the customers. Customers are
concerned about internet security when they give their credit card details.
‘ O n l i n e S h o p p i n g ’ , C u s t o m e r S a t i s f a c t i o n a n d L o y a l t y i n N o r w a y
Master thesis 2010 Page 20
Design: when the website is designed badly in such a way that the customer faces
difficulty in finding the product that he is interested in.
When the company sends emails, newsletters to the customers without their
permission can irritate the customers.
Speed - The poor performance of the website where the customer is trying to purchase.
When the customer queries are not answered or does not reach the right person.
When the customer does not get the item shopped on time or does not have the quality
or performance as expected.
2.5 Satisfaction Profit chain
Customer satisfaction and customer retention are directly linked with the profitability of a
business (Best 2005).Exceptional customer service results in customer retention which in turn
leads to increased profitability. When the customer stays committed to the product/brand
longer, they are less likely to switch to the competitor’s brand as he is convinced with the
benefits of the product (Hill & Alexander 2003).
As emphasized by Best (2005), it is important for a growing business to measure the
customer satisfaction as it is the forward looking indicator of success. Only measuring the
financial results will not indicate the success of the business as dissatisfied customers do not
exit from the purchase immediately. It takes a while for the dissatisfied customer to switch
over and hence tracking customer satisfaction is of utmost importance to the business.
Dissatisfied customers are dangerous to the business as they vent their dissatisfaction by
spreading their views to others (Best 2005). This is all the more dangerous in online shopping
as many customers purchase a product only based on the reviews of the product / service.
Customers prefer to purchase ‘high rated’ products as many customers have already been
satisfied with the overall quality and performance of the product.
Both ACSI (American Customer Satisfaction Index) and ESCI (European Customer
Satisfaction Index) have tracked strong linkage between customer satisfaction and profit
performance. This holds true to businesses in different industries such as airline, telecom,
banking etc (Buttle 2000).
‘ O n l i n e S h o p p i n g ’ , C u s t o m e r S a t i s f a c t i o n a n d L o y a l t y i n N o r w a y
Master thesis 2010 Page 21
In case of new customer acquisition, business’s profit will be negative initially due to up
front acquisition expenditure. As the business focuses on increased customer service, existing
customers are more likely to buy more frequently and also try the other products offered by
the firm. Retained customers are an asset and produce revenue over the long time. Firms
concentrating only on new customer acquisition neglecting customer retention will not only
lose the sales from repeated purchases but will also have to spend hugely on acquiring more
customers who may or may not stay committed to the firm’s products (Anderson & Mittal
2004).
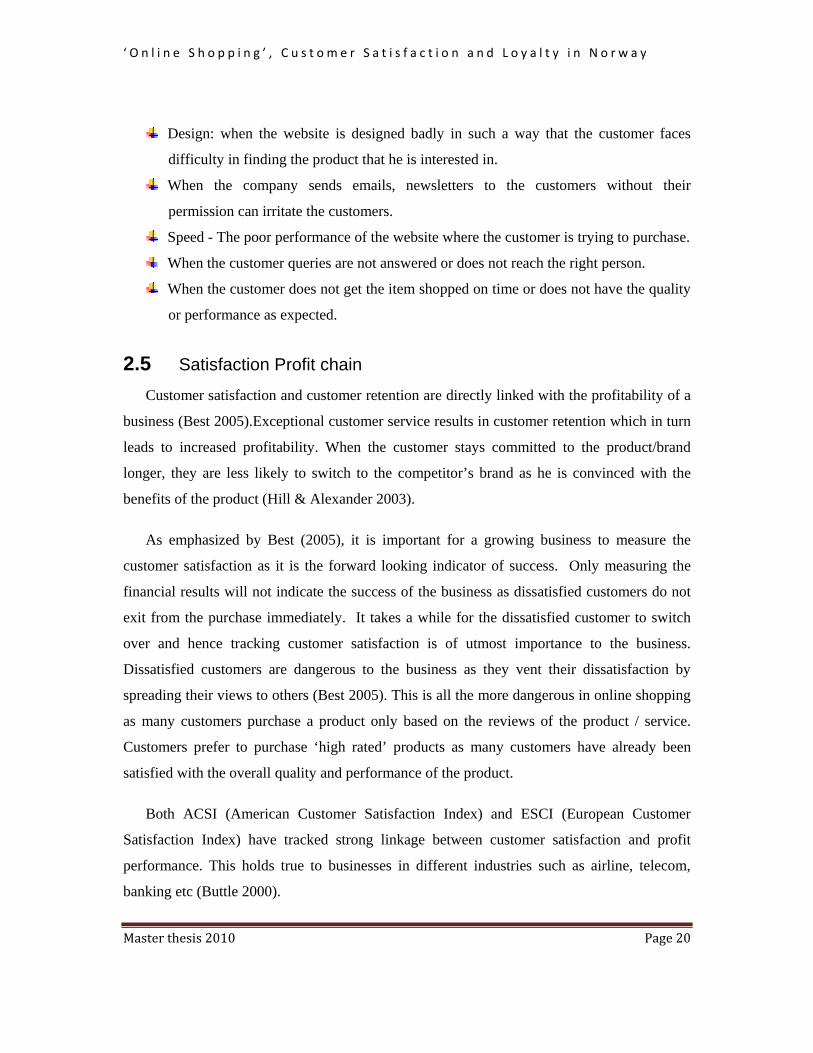
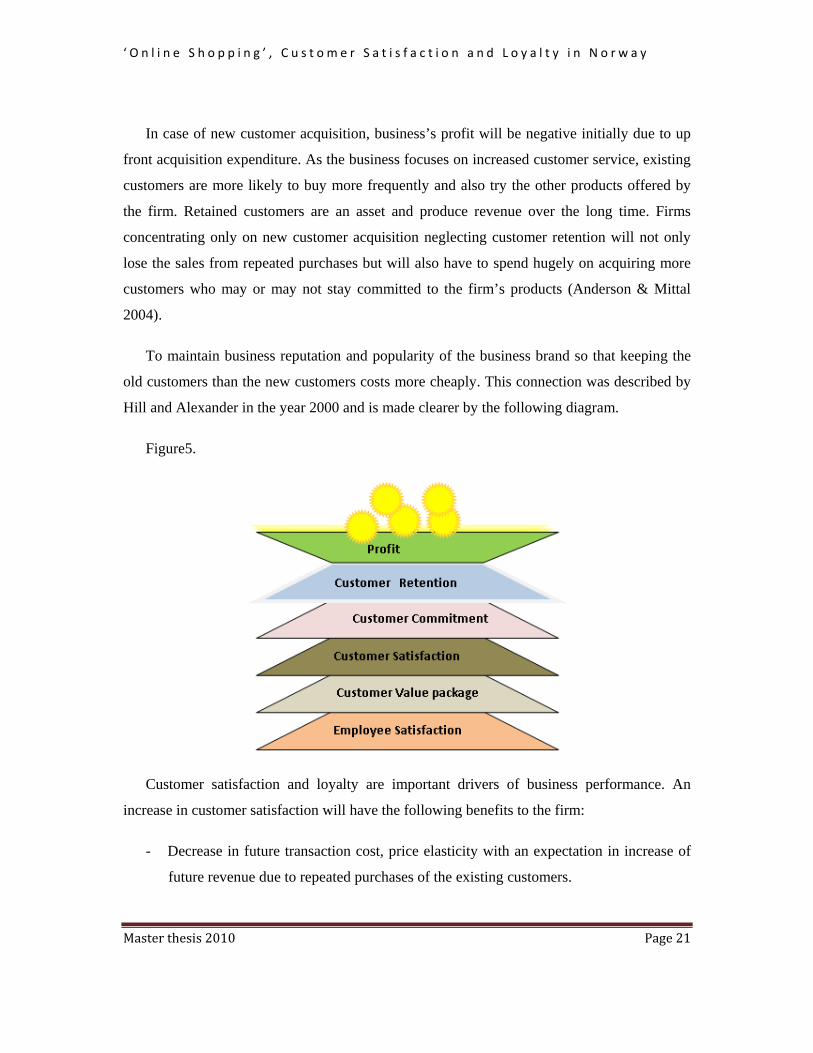
To maintain business reputation and popularity of the business brand so that keeping the
old customers than the new customers costs more cheaply. This connection was described by
Hill and Alexander in the year 2000 and is made clearer by the following diagram.
Figure5.
Customer satisfaction and loyalty are important drivers of business performance. An
increase in customer satisfaction will have the following benefits to the firm:
- Decrease in future transaction cost, price elasticity with an expectation in increase of
future revenue due to repeated purchases of the existing customers.
‘ O n l i n e S h o p p i n g ’ , C u s t o m e r S a t i s f a c t i o n a n d L o y a l t y i n N o r w a y
Master thesis 2010 Page 22
- Satisfied customers are powerful motivators and indirectly help in lowering the cost
associated with new customer acquisition (Anderson & Mittal 2000).
2.6 Customer Retention
In less competitive markets, it is quite easy to retain customers. Customers are easily
retained even in markets where there are few substitutes or when the switching costs are high
(Best 2005). But this is not the case in online shopping. In an online business, choices are
wide with no switching costs. Here, customers quickly switch to competitors in case of
dissatisfaction. Hence, customer retention is a challenge in online business and requires
higher levels of customer satisfaction.
Customer retention is as important as new customer acquisition. Online customer
relationship is difficult and that makes customer retention scary. An analysis of e customers is
vital since customer satisfaction results in loyalty and customer loyalty is the basis of
successful customer relationship (Hill & Alexander 2006).
The company has to take efforts to retain customers who are of greatest value to them.
The company has to assess the costs linked with retaining customers. The company need not
spend on customers who are highly committed and believes that no other competitor can
replace the brand he is committed to. The company will have to invest only on customers who
are significant to the business and are not committed. A long term relationship can be built
with the customer only when the needs and expectation of the customer are well understood
and met. When the fundamental expectations of the customer are well understood then
accordingly the company can strategize to delight the customer and exceed his expectations.
A customer recommending a product or service shows his commitment and loyalty to the
brand or company. This is due to the confidence in the value created and delivered by the
company or brand (Best 2005).
‘ O n l i n e S h o p p i n g ’ , C u s t o m e r S a t i s f a c t i o n a n d L o y a l t y i n N o r w a y
Master thesis 2010 Page 23
2.7 Customer loyalty
According to Best (2005), customer loyalty is a psychological commitment that a
customer has towards a specific brand or company. Customer loyalty can be measured
through customer Loyalty Index (CLI) which is explained by Best (2005) as follows:
As mentioned earlier, a customer recommends a brand only when he is completely
satisfied and trusts the quality and value of the product or service. In fact, customer
satisfaction, customer recommendation and customer retention are seen as components of
customer loyalty (Best 2005).
Customer loyalty is a psychological predisposition that influences the customer to make
repeat purchases from a specific product or service provider. Decreased customer complaints
and increased customer loyalty are the important drivers of increased customer satisfaction
(Johnson, Gustafsson, Andreasson, Lervik & Cha 2001).
A customer has many choices and the fact is that a customer of one company is likely to
be the customer of its competitor as well. Loyalty exists based on the service or support
provided by the company rather than the product it.
Building credibility is of utmost importance in an online business. The customer is
hesitant in sharing his personal information or credit card details especially for startup
companies (Carroll & Broadhead 2001).
Customer loyalty can be built when the online business focuses on providing exceptional
customer service and exceeding the expectations of the customer. Such an excellent customer
service will help in retaining customers. For example, online businesses offer special
discounts, promotional offer and exclusive service for customers who have a personal
shopping account with them. This is one of kind of marketing for site registration wherein the
customer gets the feeling that he receives extra benefits when he registers as a preferred
customer (Carroll & Broadhead 2001).
‘ O n l i n e S h o p p i n g ’ , C u s t o m e r S a t i s f a c t i o n a n d L o y a l t y i n N o r w a y
Master thesis 2010 Page 24
By enhancing customer service, the online business can increase their customer’s loyalty.
Some websites offer gift reminder service to their registered customers wherein the customer
is reminded of important events and occasions that has been stored by him in his account
along with promotional offers. This is one way for the business to promote their brand, market
their products and at the same time offer exclusive service to its customers (Carroll &
Broadhead 2001).
Figure6. Source: Windows clip organizer graphic files. Self added only arrows and texts
at bottom.
To improve customer loyalty, some websites offer discussion groups in their websites and
promote common interest to pull targeted customers. When the website contains valuable
information about the product then the customer would be motivated to visit the website
again. Just like any other medium of business, internet business should also focus on making
their customers feel ‘special’. Grahame R. Dowling Australian Graduate School of
Management University of New South Wales Sydney, Australia says, ‘In any business,
customer loyalty is a result of exceptional personal services and exceeding customer
expectations. The same thing holds good for an online business as well. Customers are ‘brand

‘ O n l i n e S h o p p i n g ’ , C u s t o m e r S a t i s f a c t i o n a n d L o y a l t y i n N o r w a y
Master thesis 2010 Page 25
loyal’ if they are offered convenience, ease of use and choice coupled with high quality, good
price and service.’
More than mere promotional offers, email marketing will have a positive impact on the
customer brand loyalty. Also, permission based marketing is also important as email
marketing without the permission of the customer will only irritate and dissatisfy the
customer.
At the same time it has to be understood that in a commercial market, if there is lack of
loyalty then the seller has to take the constant initiative of convincing the customer to stay
committed to his brand. Also a customer’s loyalty is dependent on his self-interest. With the
high levels of satisfaction a customer intends to be loyal to the brand.
2.8 Relationship between customer satisfaction and loyalty
2.8.1 Effect of customer satisfaction on loyalty and business performance.
According to Barnes (2006), customer satisfaction and loyalty are closely linked with each
other and both have an effect on a firm’s performance. Though customer satisfaction and
loyalty are related with each other in many ways, it has to be borne in mind that customer
satisfaction does not always result in loyalty. A satisfied customer need not necessarily be
loyal. Customer satisfaction by itself will not result in developing solid customer
relationships. When there is an absence of emotional bond, the customer will leave in spite of
increased satisfaction. But on the other hand, loyalty is the end result of customer satisfaction.
It is therefore necessary to not only merely meet the expectation of the customer but also
exceed in the areas not expected by him. A surprised customer is impressed and this will
begin to create an emotional bondage (Barnes 2006).
Szwarc (2005) states that there is a strong link between loyal customers and a firm’s
financial performance. According to the author, customer satisfaction plus loyalty equals
increased profits of an organization.
Interestingly, according to Hill, Roche & Allen (2007), satisfaction is an attitude and loyalty
is behaviour. The authors describe how satisfaction translates to profit as follows:

‘ O n l i n e S h o p p i n g ’ , C u s t o m e r S a t i s f a c t i o n a n d L o y a l t y i n N o r w a y
Master thesis 2010 Page 26
Source: Hill, Roche & Allen, 2007.
Kevin stirtz (2010), the meaning of loyalty consists of different components. Firms want
to construct and increase their customer loyalty, need to develop consistence that means
reliability and quality. The more firms show consistency the more customers will feel they
can trust a firm and show loyalty. Therefore, as antecedent of firm performance both customer
satisfaction and customer loyalty is required.
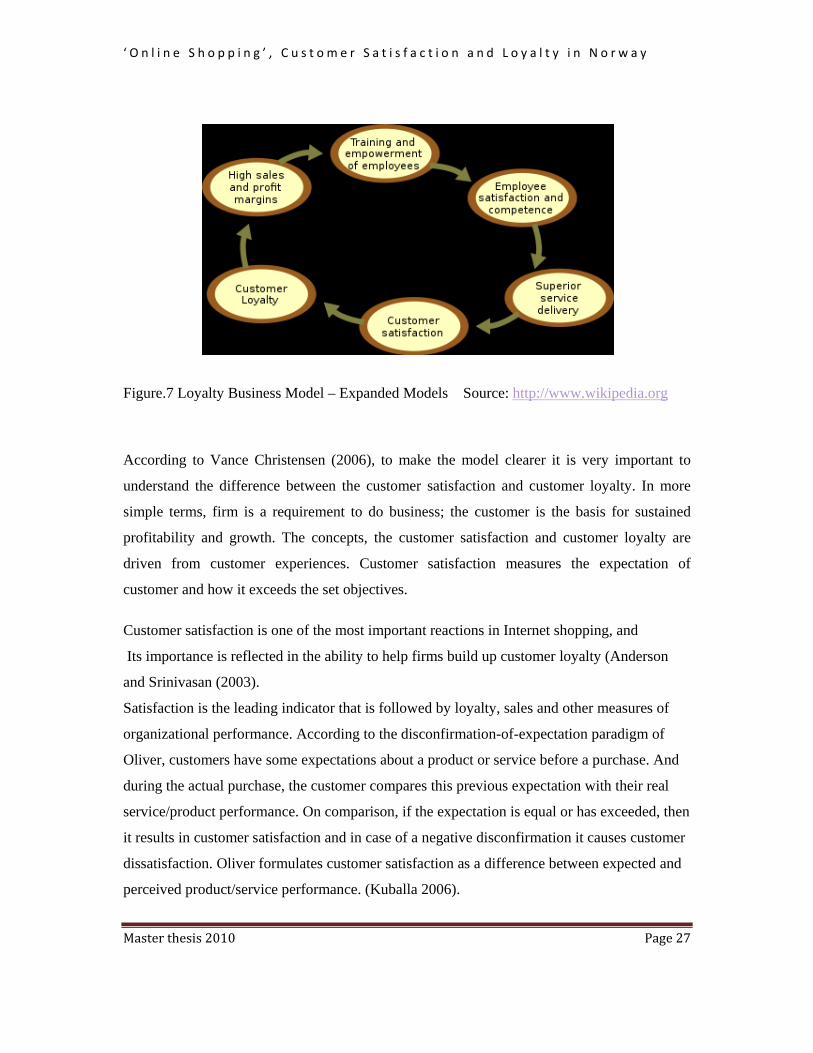
Schlesinger and Heskett (1991) the loyalty business model is a business model that is mostly
used in strategic management. The main objective of this model is to define how the company
could employ its resources in order to increase the loyalty of customers. Good quality of
products and services creates customer satisfaction that would results in customer loyalty,
which leads to profitability. They developed the concept of business cycle both in terms of
success and failure. In the cycle of success the main emphasis was on employees’ ability to
provide better service to customers. The motivating factor was weighted high because when
the businesses would do effort in their employees’ selection and training then it would be
creating a corporate culture in which employees would be empowered. Thus the employees’
empowerment leads to employee satisfaction and employee competence. The result would be
a superior service delivery and customer satisfaction. This in turn will create more loyal
customers and higher profit margins for the businesses.
‘ O n l i n e S h o p p i n g ’ , C u s t o m e r S a t i s f a c t i o n a n d L o y a l t y i n N o r w a y
Master thesis 2010 Page 27
Figure.7 Loyalty Business Model – Expanded Models Source: http://www.wikipedia.org
According to Vance Christensen (2006), to make the model clearer it is very important to
understand the difference between the customer satisfaction and customer loyalty. In more
simple terms, firm is a requirement to do business; the customer is the basis for sustained
profitability and growth. The concepts, the customer satisfaction and customer loyalty are
driven from customer experiences. Customer satisfaction measures the expectation of
customer and how it exceeds the set objectives.
Customer satisfaction is one of the most important reactions in Internet shopping, and
Its importance is reflected in the ability to help firms build up customer loyalty (Anderson
and Srinivasan (2003).
Satisfaction is the leading indicator that is followed by loyalty, sales and other measures of
organizational performance. According to the disconfirmation-of-expectation paradigm of
Oliver, customers have some expectations about a product or service before a purchase. And
during the actual purchase, the customer compares this previous expectation with their real
service/product performance. On comparison, if the expectation is equal or has exceeded, then
it results in customer satisfaction and in case of a negative disconfirmation it causes customer
dissatisfaction. Oliver formulates customer satisfaction as a difference between expected and
perceived product/service performance. (Kuballa 2006).
‘ O n l i n e S h o p p i n g ’ , C u s t o m e r S a t i s f a c t i o n a n d L o y a l t y i n N o r w a y
Master thesis 2010 Page 28
Customer satisfaction does not obviously result in loyalty but it definitely encourages
customer loyalty. However, there is a strong relationship between customer loyalty and sales
growth as loyal customers buy a wider range and value added products of a company.
Moreover, they also refer other prospective customers to the company. Consequently, there is
a positive relationship between loyalty and company performance. Ofcourse, loyalty does not
guarantee profits implicitly. Maintaining loyalty requires huge efforts and costs. The company
should continue to adopt customer loyalty measures only when profits exceed costs. (Kuballa
2006).
2.8.2 loyalty: attitude or behavior
The term ‘loyalty’ is sometimes defined as ‘behaviour’ and sometimes as an ‘attitude’.
The ‘behavioural’ definition of loyalty is about description of the actual conduct of the
customer while the ‘attitudinal’ definition of loyalty is all about liking and preference. The
value of a customer is generally described according to whether the enterprise will make a
profit on him in the future. Compared to attitudinal loyalty, it is necessary for an organization
to study the behavioural loyalty as it helps to understand the techniques and mechanics of
managing customer relationships. The management of customer relationships influences the
future actions of the customer which in turn has an impact on the firm’s performance.
(Peppers & Rogers, 2004).
Barnes (2006) classifies loyalty into two categories: “functionally loyal” and
“emotionally loyal”. Functionally loyal customers are those who are attached to the firm or
brand for the reason that they are functionally attractive. For example, convenient location of
the store, open 24 hours a day etc can be the drivers for this kind of loyalty. On the other
hand, emotionally loyal customers are those who are not only attracted to these kind of
convenience factors but also feel comfortable with the store because of reasons like ‘greeted
personally by name’ or ‘liked the experience of shopping’. Consequently, these customers
develop an emotional attachment to the brand or firm. ‘Functionally loyal’ customers are
likely to switch over to the competitor’s brand when offered a more functionally attractive
‘ O n l i n e S h o p p i n g ’ , C u s t o m e r S a t i s f a c t i o n a n d L o y a l t y i n N o r w a y
Master thesis 2010 Page 29
option but ‘emotionally loyal’ customers unlike the ‘functionally loyal’ customers are likely
to last in spite of a more functionally attractive alternative.
Derek et (2000), customer loyalty may involve an attitudinal state and it is not exclusively a
behaviour. Dick and Basu (1994), defines customer loyalty as the combination of both
behaviours and attitudes. In other words a loyal customer is one who purchases repeatedly and
has a favourable attitude for the brand.
2.9 Direct marketing
Direct marketing found its way since late 1800s in national magazines of United States.
Direct marketing includes direct mail, money back guarantee, cut out coupons etc. toll free
number is one type of marketing that has attracted the prospective buyer to contact the
company for enquiry. Mail order success with the toll free number is a great business success
that has reached mass acceptance (Jones 2009).
Direct marketing has its own advantages and the online marketers can deploy it to the full
extent. The product reaches the consumer fully since direct marketing targets the consumer of
specific interest, age group or income level. Though internet marketing is an effective and
popular way of reaching the mass, it has not replaced direct marketing. Than the traditional
direct marketing, internet direct marketing is more cost effective especially since there is
nothing to physically produce.
2.10 Online marketing
Online marketing provides the marketer the ability to effectively interact with a massive
numbers of customers and potential customers. At the same time, the online marketer has to
well understand the perception of the consumer because the profile of an online shopper is
very different from that of a traditional retail consumer (Ranganathan & Ganapathy 2002).
The global reach of the internet and its different interactive capabilities have made online
marketing a very effective way to reach the customers. The prime advantage of online
marketing is that it truly independent of time and space. Online marketing is not only a form
‘ O n l i n e S h o p p i n g ’ , C u s t o m e r S a t i s f a c t i o n a n d L o y a l t y i n N o r w a y
Master thesis 2010 Page 30
of direct marketing channel but also a new way of communicating. The impact of internet
marketing to the product is instant, cheap and effective.
In online marketing, first and foremost the business has to understand the tendency of the
online shopper. An online shopper is more information oriented and not only looks for best
prices but also for value. The quality of the product can be best conveyed through the content
and design of the website. ‘Content is King’ which means a relevant rich, detailed and
informative website attracts the customer to visit the website again and again. The online
shopper should be able to easily read the information that he is looking for in the website. The
web site design should be in par with the customer needs (Carroll & Broadhead 2001).
The success of online marketing lies in offering an extensive variety of products for the
online shopper and also on the inventory position. The online store should manage ‘out of
stock’ or ‘out of season’ customer requests efficiently. The individual needs of the consumer
can be addressed if the website is designed with personalization and mass customization
content, Personalization and mass customization is done based on the preferences of the
customer, the location, particular events and the date or time. Personalization will enable the
customer to view a good content based on his interest and the information he is looking for.
At the same time, privacy is the key factor for the consumer to make the decision of
purchasing online. Websites focusing on personalization will have to be more cautious to
protect the personal information of the visitor (Hoskins 2002). A well designed home page is
essential for an effective online marketing. The key content must be highlighted for the
visitors to search for the information they need quickly and easily.
Identifying potential customers is not an easy job in an online business as it is not only time
consuming but also an expensive process. It is good to spend on advertising for a segment of
prospective customers and further on the customers who are willing to purchase repeatedly
(Carroll & Broadhead 2001).
E-marketing requires new marketing approaches. Traditional marketing focuses on passive
audience while online marketing targets active audience who choose the websites they should
visit and decide the marketing information of the products that they want to receive.
‘ O n l i n e S h o p p i n g ’ , C u s t o m e r S a t i s f a c t i o n a n d L o y a l t y i n N o r w a y
Master thesis 2010 Page 31
Gray, Charlesworth & Esen (1997) discuss the various advantages of online marketing as
follows:
1. Cost of marketing through the internet is low.
2. It is a fast and flexible channel for marketing
3. No opening, closing hours for business
4. It is a two way channel wherein the views of the customer can be easily gathered.
This two way communication helps in acquiring new customers as well as customer
retention.
Sometimes, online marketing will have to be done similar to direct marketing. Even online
customers might respond to limited offers and special discounts just like any other customer.
Also, displaying such attractive offers and discounts on the homepage appropriately so that
the online customer does not miss to read is also important in online marketing.
One important thing here is that the way a website packages its service will not only
differentiate it from its competitors but will also bring about a big change in customer
perception (Carroll & Broadhead 2001). Marketing through the internet has to be fast,
accustoming to the rapid changes, new tools and new users. Also, considering the fact that
some products sell better than others in the internet, online marketing has to be done having
this point in mind. Online marketing will take considerable time and effort for a customer to
get attracted.
The design and content of the website also motivates the customer to visit the website
again. The design has to be in such a way that the customer understands the content of the
website easily and quickly. In online marketing, differentiating the product or service from the
competitors is extremely important. It is easy for the customer to compare the product or
service with its competitors and the information is readily available online.
Online marketing is not only promising but also challenging for the future. Internet is
sought after as an important supplement to other marketing efforts of the business. Online
marketers have become skillful in gathering and analyzing the detailed information of the
internet shopper.
‘ O n l i n e S h o p p i n g ’ , C u s t o m e r S a t i s f a c t i o n a n d L o y a l t y i n N o r w a y
Master thesis 2010 Page 32
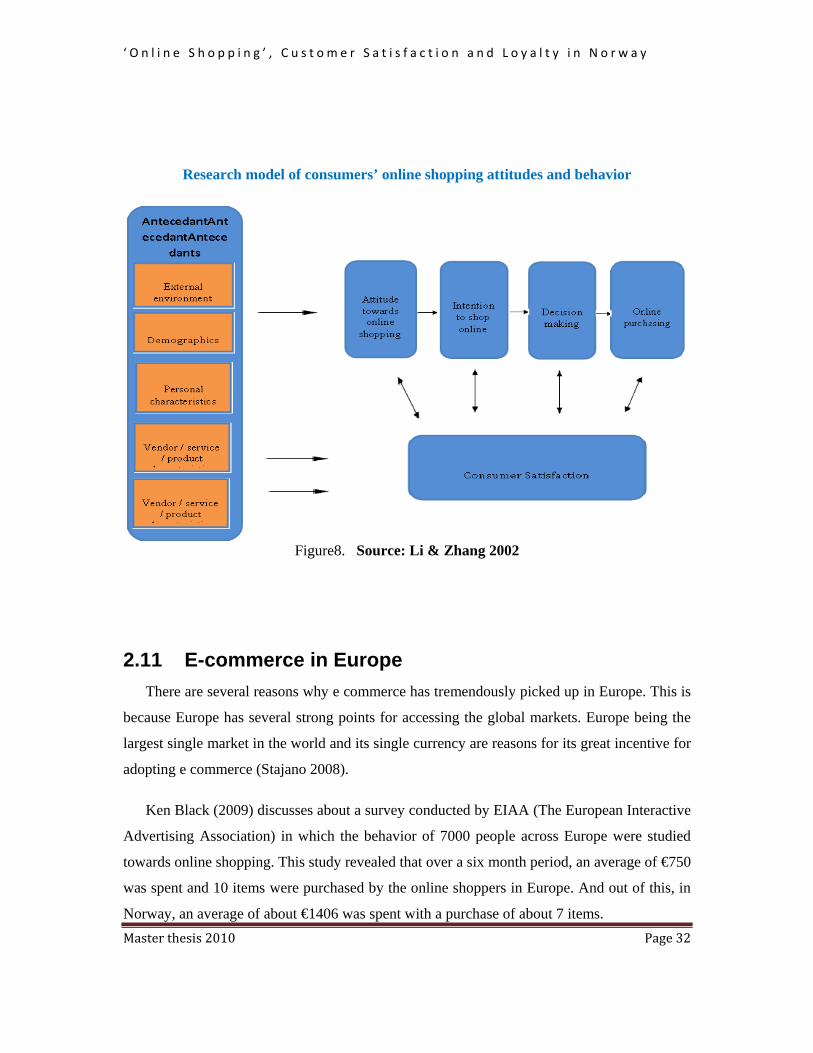
Research model of consumers’ online shopping attitudes and behavior
Figure8. Source: Li & Zhang 2002
2.11 E-commerce in Europe
There are several reasons why e commerce has tremendously picked up in Europe. This is
because Europe has several strong points for accessing the global markets. Europe being the
largest single market in the world and its single currency are reasons for its great incentive for
adopting e commerce (Stajano 2008).
Ken Black (2009) discusses about a survey conducted by EIAA (The European Interactive
Advertising Association) in which the behavior of 7000 people across Europe were studied
towards online shopping. This study revealed that over a six month period, an average of €750
was spent and 10 items were purchased by the online shoppers in Europe. And out of this, in
Norway, an average of about €1406 was spent with a purchase of about 7 items.
‘ O n l i n e S h o p p i n g ’ , C u s t o m e r S a t i s f a c t i o n a n d L o y a l t y i n N o r w a y
Master thesis 2010 Page 33
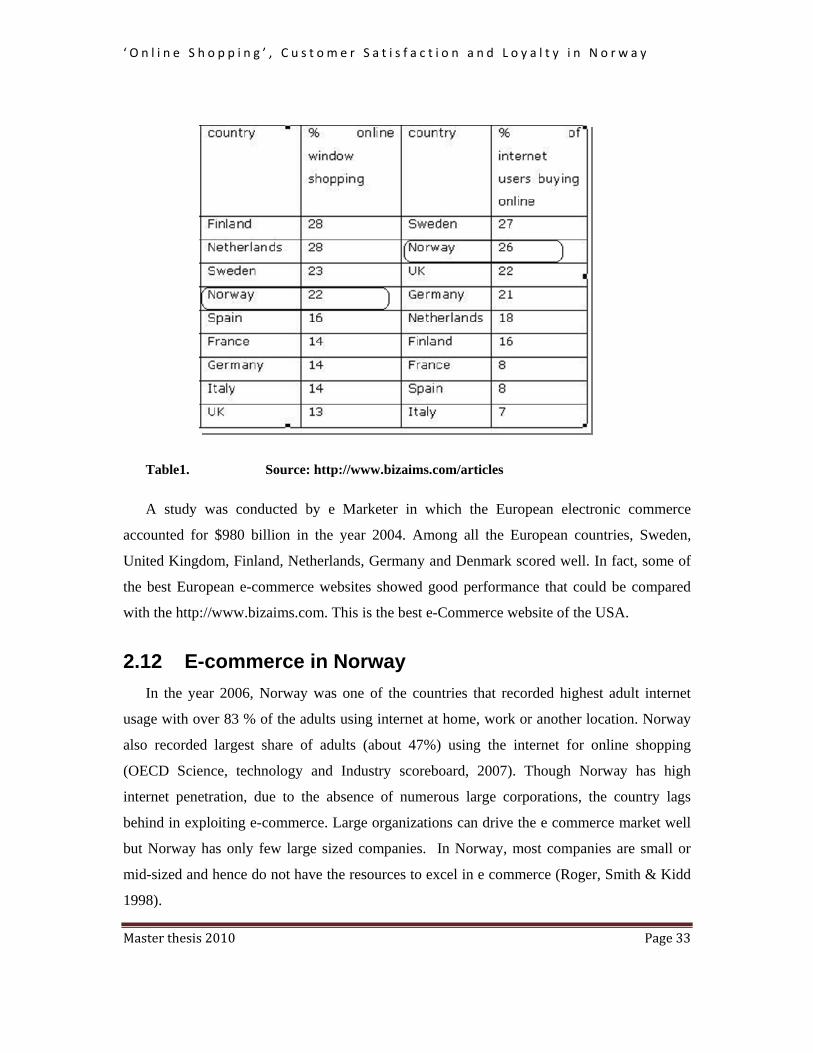
Table1. Source: http://www.bizaims.com/articles
A study was conducted by e Marketer in which the European electronic commerce
accounted for $980 billion in the year 2004. Among all the European countries, Sweden,
United Kingdom, Finland, Netherlands, Germany and Denmark scored well. In fact, some of
the best European e-commerce websites showed good performance that could be compared
with the http://www.bizaims.com. This is the best e-Commerce website of the USA.
2.12 E-commerce in Norway
In the year 2006, Norway was one of the countries that recorded highest adult internet
usage with over 83 % of the adults using internet at home, work or another location. Norway
also recorded largest share of adults (about 47%) using the internet for online shopping
(OECD Science, technology and Industry scoreboard, 2007). Though Norway has high
internet penetration, due to the absence of numerous large corporations, the country lags
behind in exploiting e-commerce. Large organizations can drive the e commerce market well
but Norway has only few large sized companies. In Norway, most companies are small or
mid-sized and hence do not have the resources to excel in e commerce (Roger, Smith & Kidd
1998).
‘ O n l i n e S h o p p i n g ’ , C u s t o m e r S a t i s f a c t i o n a n d L o y a l t y i n N o r w a y
Master thesis 2010 Page 34
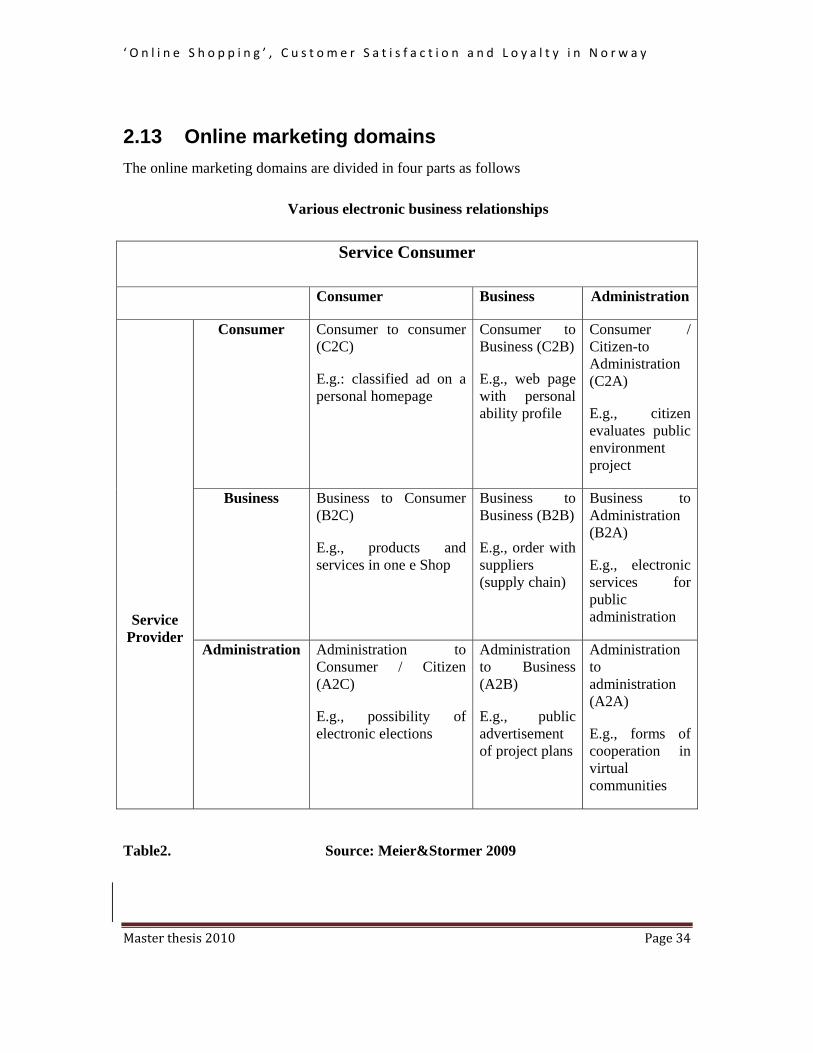
2.13 Online marketing domains
The online marketing domains are divided in four parts as follows
Various electronic business relationships
Service Consumer
Consumer Business Administration
Service Provider
Consumer Consumer to consumer (C2C)
E.g.: classified ad on a personal homepage
Consumer to Business (C2B)
E.g., web page with personal ability profile
Consumer / Citizen-to Administration (C2A)
E.g., citizen evaluates public environment project
Business Business to Consumer (B2C)
E.g., products and services in one e Shop
Business to Business (B2B)
E.g., order with suppliers (supply chain)
Business to Administration (B2A)
E.g., electronic services for public administration
Administration Administration to Consumer / Citizen (A2C)
E.g., possibility of electronic elections
Administration to Business (A2B)
E.g., public advertisement of project plans
Administration to administration (A2A)
E.g., forms of cooperation in virtual communities
Table2. Source: Meier&Stormer 2009
‘ O n l i n e S h o p p i n g ’ , C u s t o m e r S a t i s f a c t i o n a n d L o y a l t y i n N o r w a y
Master thesis 2010 Page 35
2.14 B2C online marketing
In a B2C market, customers place more emphasis on the comparison of price. Customers
browse for the best price by comparing the price of the product offered by various online
marketers.
A B2C website should be designed in such a way that there is not much of an information
overload and the information should just be sufficient for the shopper to make a decision.
Information search and information evaluation are important in a consumer buying process.
The website containing high value information on the product highlighting about its benefits
and details will help the visitor make a decision about purchasing the product. Also, the
website should be offer navigational tools and search engines that ease the search of the
consumer (Ranganathan & Ganapathy 2002). The B2C website should serve as a major
source of information and provide the following.
Complete information about the product or service
Appropriate privacy and security measures
Allow quick access to information through search engines
Help in evaluating the alternatives
Easy navigation and design should appeal consumers
In a B2C market, when the customer knows what he is going to buy, he would put the
product or service in the search engine to seek more information on it. Email marketing is
commonly used in a B2C market. However, in this form of marketing unsolicited emails may
sometimes alienate potential customers. (Barker & Angelopulo 2006)
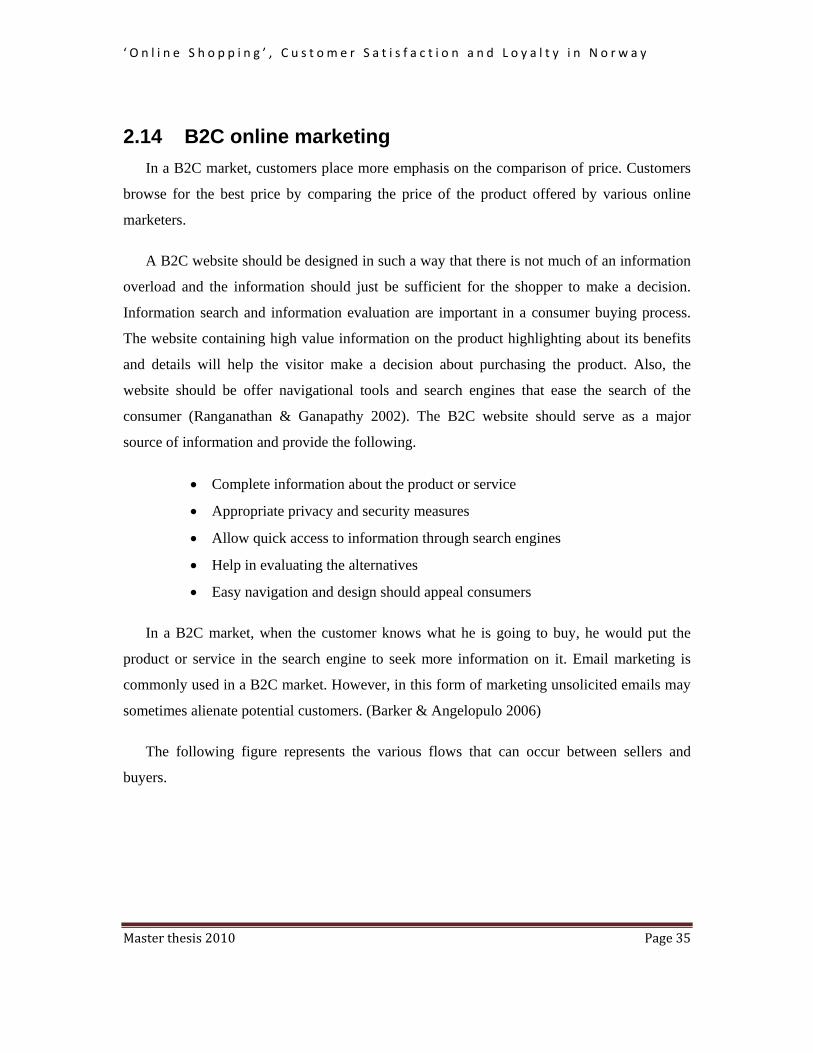
The following figure represents the various flows that can occur between sellers and
buyers.
‘ O n l i n e S h o p p i n g ’ , C u s t o m e r S a t i s f a c t i o n a n d L o y a l t y i n N o r w a y
Master thesis 2010 Page 36
Figure9. Source: Parasuraman and Grewal 2000
2.15 C2B online marketing
In C2B market, the customer handles and decides the market dynamics. To cater to his needs,
the customer welcomes proposals from the online marketers. The consumers are asked by the
sellers to convey their messages and views about the business products and the pattern of
business. It is a new strategy form marketing point of view where the business does not wait
for some suggestion to come from customers. Instead the customers send their views via some
questionnaire requested by the business. This type of invitation is called C2B (consumer to
business) online marketing. There are many websites where the purchaser accept or reject the
offers by placing their bids. Examples are house rent prices, airline tickets, vacation trips, rent
a car etc.
2.16 Summary
This chapter briefly discusses about the theoretical framework on the subject of study.
Various theories on customer satisfaction, customer retention and loyalty and relationship
between customer satisfaction and loyalty have been discussed in this chapter. The discussion
above shows that as and antecedent of firm performance both customer satisfaction and
customer loyalty is required. Also, different methods of marketing and electronic business
relationships that are relevant to this study have been discussed briefly.
‘ O n l i n e S h o p p i n g ’ , C u s t o m e r S a t i s f a c t i o n a n d L o y a l t y i n N o r w a y
Master thesis 2010 Page 37
Chapter 3 - Methodology
3.1 Data Collection
This section describes the overall procedure used to collect data for the thesis work. From
the Marketing point of view normally we use the combination of qualitative and quantitative
research.
3.1.2 Qualitative Research
Qualitative research consists of some technical procedures. These procedures are essential
for the survey response. There are many factors involved in the qualitative research.
Following is the description for qualitative data collection.
3.1.3 Questionnaire Design
From firms perspective customer satisfaction dimensions such as availability,
responsiveness, timeliness, completeness, and convenience need to be measured by
questionnaire. Availability should be the degree for which customer could contact the
supplier. There where the supplier could react promptly according to the requirement of the
customer fulfils the responsiveness dimension of customer satisfaction for example constantly
response to the customer feedback receive via website. The time frame for the delivery of
goods or services is another dimension of customer satisfaction. Firms have to make sure that
the job is finished and customer is satisfied of the completion of his demand or requirement.
Firms also need to enhance their professional behavior and manners to keep their customer
satisfied and retained, for example offering customized solutions thus making virtual purchase
a convenient method of shopping (Hayes 2008).
Derek et al. (2000), Berry and Zeithmal in 1998 published their multi-item SERVQUAL
scale considered to be one of the first attempts to measure customer satisfaction. The items
used in this scale are still used today as a foundation for ‘customer satisfaction dimensions’.
The items in this scale are Tangible Scale, Reliability scale, responsiveness scale, assurance
scale and empathy scale.

‘ O n l i n e S h o p p i n g ’ , C u s t o m e r S a t i s f a c t i o n a n d L o y a l t y i n N o r w a y
Master thesis 2010 Page 38
The survey questions are designed and based on above mentioned customer satisfaction
dimensions. This could help firms to measure customer satisfaction in a better way.
Hays (2008) insist that designing the questionnaire is of great importance in a survey.
According to him, the survey questions should be concise and unambiguous. Taking all this
into consideration, the survey questions have been designed in a simple and easy language.
We chose to keep the language very simple as the survey is being performed virtually and
there are chances for misinterpretation as there is no face to face interaction. Customers were
asked to provide their rating in order to understand their expectations from the online
businesses and examine what causes customer satisfaction and loyalty in online shopping.
3.1.4 Questionnaire format
The questions have been formatted based on the following steps. Bob E. Hayes ET (2008),
to select the format for questions in the questionnaire is also significant step for the survey.
There are several response formats or scaling methods. R.A Likert (1932) developed a scaling
format. In this format the low end represents a negative/ dissatisfaction answer while the high
end represents a positive or highly satisfied response. In this format the customers are allowed
to express the degree of their views or opinions about the specific service or product, the
survey is conduct for. This format has no restriction to choose between ‘yes’ and ‘no’. The
easy and simple way is to start with an introduction or welcome message. In the case of Web
survey questionnaires, the introduction message should be in a first page of the questionnaire
form itself defining the purpose of the survey. Assurance of data security and a good
introduction or welcome message will encourage people to complete your questionnaire. For
the same reason, include the numbers if related to the question type for example 1year, 2year
or 10 year.
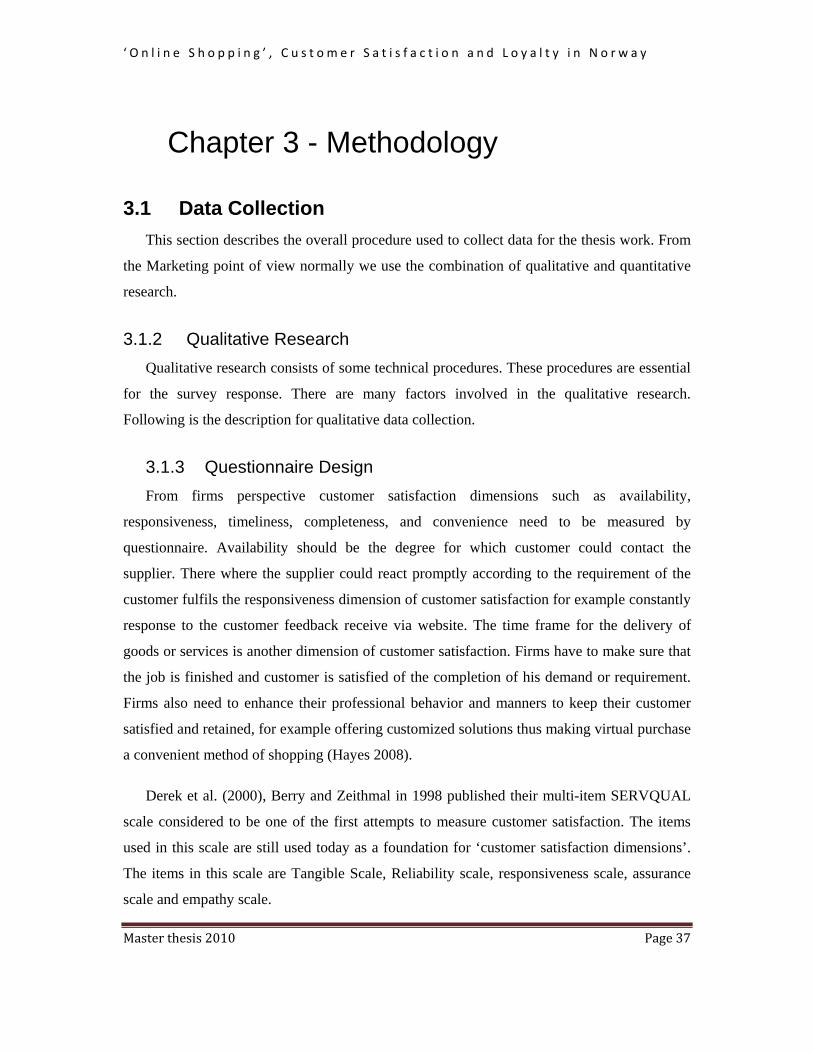
The survey results are coded for numerical analysis. In the Likert method of coding higher
scores represents higher level of customer satisfaction and lower value indicates the
dissatisfaction from the respondents about the particular item or service. In the following
figure of Likert method the codes used are:
Strongly Agree = 9-10, Agree = 7-8, Neutral= 5-6, Disagree =3-4, strongly Disagree =1-2.
‘ O n l i n e S h o p p i n g ’ , C u s t o m e r S a t i s f a c t i o n a n d L o y a l t y i n N o r w a y
Master thesis 2010 Page 39
figure.10 Likert Method
3.1.5 Web survey
Steps involved for launching Web survey for the data collection are discussed in the following
section.
3.1.6 Internet/Intranet (Web Page) Survey method
Bob E. Hayes ET (2008), 68% of customer feedback, the professionals indicated that their
firms/companies conduct via web based survey for the purpose of data collection. The other
type of survey is less popular like telephone (66%), paper pencil (47%), and interviews
(47%). Such kind of survey helps the company to use the existing data and reduce the number
of questions in the questionnaire. Benefits of web survey data collection and customer
feedback is as under:
1. Relatively fast to conduct.
2. No cost of paper pencil, envelop, printing, postage or data entry.
3. Response rates are typically high.
4. Ease of sending reminders to participants.
5. Easy of data processing like spread sheet, database compare to manual entry.
3.1.7 Survey Sample size
Bob E. Hayes et (2008) sometimes for organizations/firms that have tens of thousands of
customers, it is not possible to get survey data from all their customers. In fact, for getting the
reliable picture of customer’s level of satisfaction and loyalty, it may not be necessary to
survey each and every client. The best approach to analyze views of a particular land,
‘ O n l i n e S h o p p i n g ’ , C u s t o m e r S a t i s f a c t i o n a n d L o y a l t y i n N o r w a y
Master thesis 2010 Page 40
community or large number of people about a specific product or service is to develop a
sample. This sample represents the entire population. Results from these samples are used to
calculate the customer satisfaction and loyalty for particular product or service.
Bob E. Hayes et (2008), Cluster sampling method is an approach in which selection is
conducted at group level. The group of customers may represent different locations like
offices, universities etc. That is, the individual cases within the population are grouped
(clustered) into larger groups. Then these groups in turn, are the level at which random
selection is conducted. This random selection process helps to get a small subset of offices,
institutions or group of friends and relatives.
For example a firm might have 200,000 customers throughout 100 different locations.
These 100 locations would constitute cluster. In cluster sampling, we would think of this100
would be as a population and then randomly select say, 20 clusters to be included in our
sample. We would use the customer satisfaction and loyalty survey from these 12 clusters in
our statistical analysis.
The process involved in this research to identify participants for the web survey and
measure customer satisfaction and loyalty of people of Norway, has been performed based on
the cluster sampling method. In case of Norway the individual cases within the population are
grouped or clustered into lager groups/clusters that consist of offices, firms, institutions and
group of general public (friends and relatives) who agreed to respond to survey questionnaire.
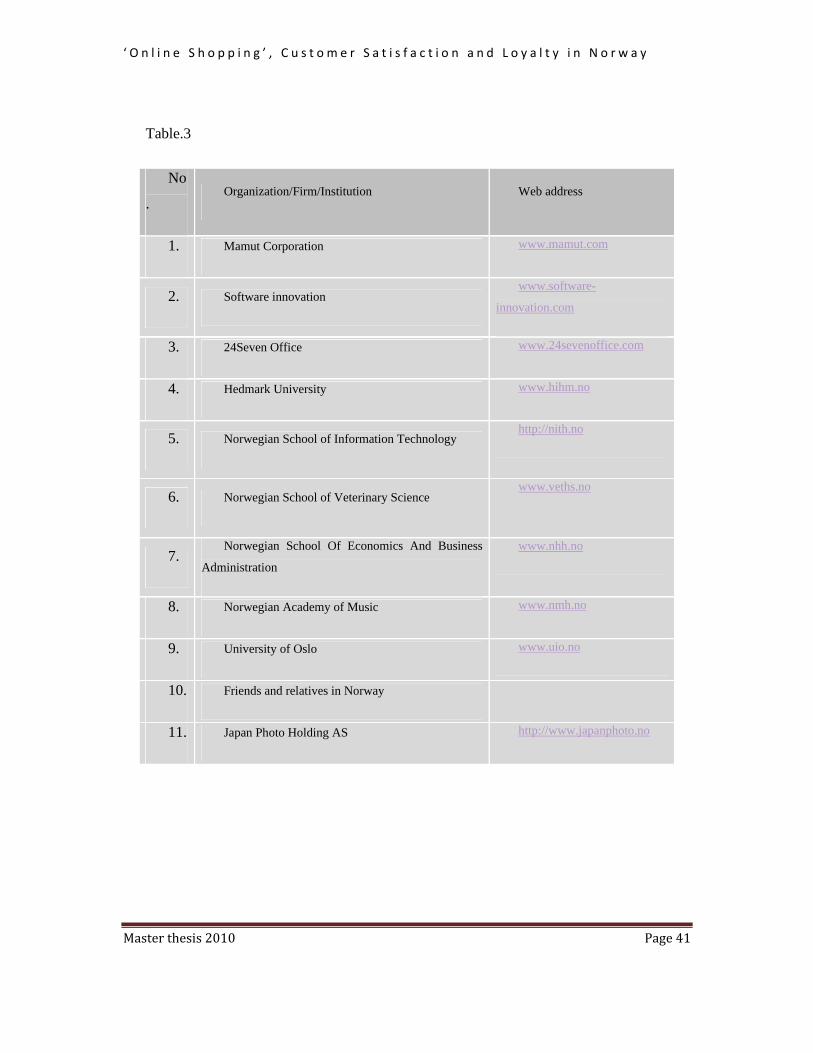
3.1.8 Number of Respondents
The randomly selected firms/organizations/institutions of Norway for survey are divided
in 10 groups (clusters). One cluster out of eleven consists of friends and relatives living in
Norway agreed to respond to web survey. A link of online study survey was sent to
respondents. Out of these 11 clusters 104 respondents responded to the questionnaire.
Following table shows the name of organizations, firms and institutions, the questionnaire
link was e-mailed to them.
‘ O n l i n e S h o p p i n g ’ , C u s t o m e r S a t i s f a c t i o n a n d L o y a l t y i n N o r w a y
Master thesis 2010 Page 41
Table.3
No
. Organization/Firm/Institution Web address
1. Mamut Corporation www.mamut.com
2. Software innovation www.software-
innovation.com
3. 24Seven Office www.24sevenoffice.com
4. Hedmark University www.hihm.no
5. Norwegian School of Information Technology http://nith.no
6. Norwegian School of Veterinary Science www.veths.no
7. Norwegian School Of Economics And Business
Administration
www.nhh.no
8. Norwegian Academy of Music www.nmh.no
9. University of Oslo www.uio.no
10. Friends and relatives in Norway
11. Japan Photo Holding AS http://www.japanphoto.no
‘ O n l i n e S h o p p i n g ’ , C u s t o m e r S a t i s f a c t i o n a n d L o y a l t y i n N o r w a y
Master thesis 2010 Page 42
3.2 Summary
To summarize the processes involved in the methodology have been discussed in this
chapter. To start with, we developed our plan to collect data via website survey. For this
purpose we framed a questionnaire based on reliable and valid international literature. We
chose the R.A Likert scaling method for recording the questionnaire responses. Post the
launching of web survey, we requested some institutes, business firms and organizations in
Norway to take part in this web survey by answering the questionnaire. In response to our
request, 104 respondents took part in the web survey.
‘ O n l i n e S h o p p i n g ’ , C u s t o m e r S a t i s f a c t i o n a n d L o y a l t y i n N o r w a y
Master thesis 2010 Page 43
Chapter 4 - Analysis & Results
4.1 Data Analysis
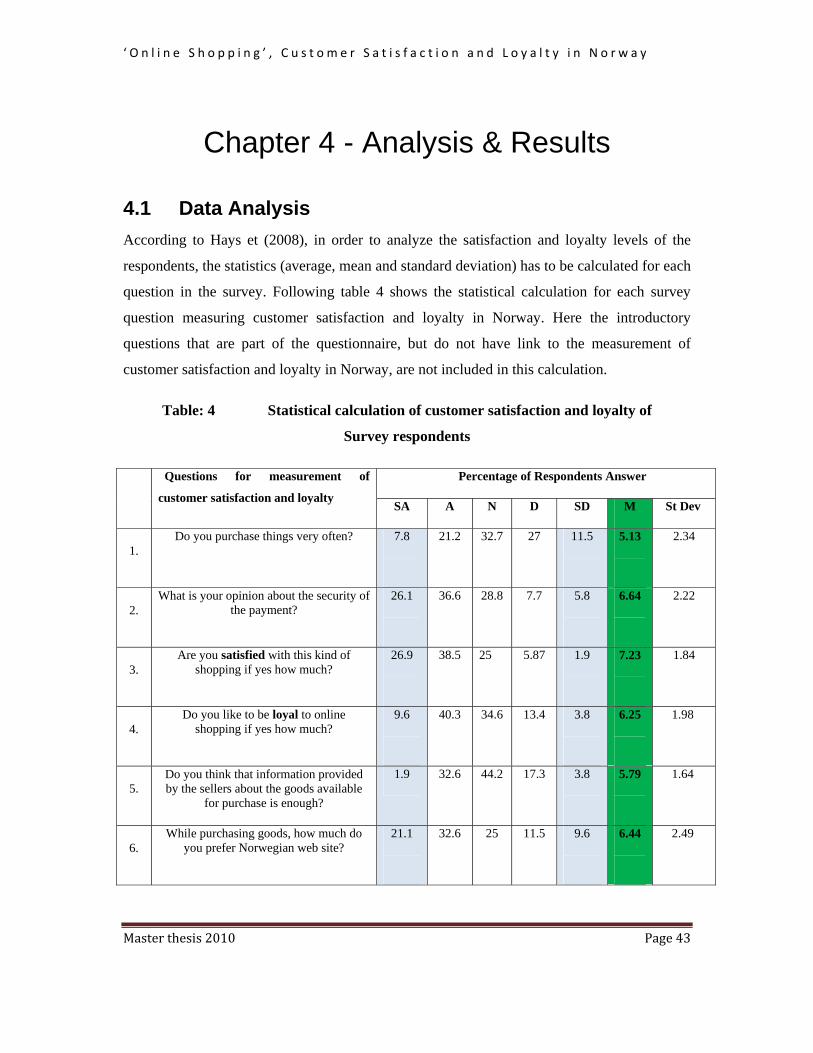
According to Hays et (2008), in order to analyze the satisfaction and loyalty levels of the
respondents, the statistics (average, mean and standard deviation) has to be calculated for each
question in the survey. Following table 4 shows the statistical calculation for each survey
question measuring customer satisfaction and loyalty in Norway. Here the introductory
questions that are part of the questionnaire, but do not have link to the measurement of
customer satisfaction and loyalty in Norway, are not included in this calculation.
Table: 4 Statistical calculation of customer satisfaction and loyalty of
Survey respondents
Questions for measurement of
customer satisfaction and loyalty
Percentage of Respondents Answer
SA A N D SD M St Dev
1. Do you purchase things very often?
7.8
21.2
32.7
27
11.5
5.13
2.34
2. What is your opinion about the security of
the payment? 26.1
36.6 28.8
7.7
5.8
6.64
2.22
3. Are you satisfied with this kind of
shopping if yes how much? 26.9
38.5
25 5.87
1.9
7.23
1.84
4. Do you like to be loyal to online
shopping if yes how much? 9.6
40.3
34.6
13.4
3.8
6.25
1.98
5. Do you think that information provided by the sellers about the goods available
for purchase is enough?
1.9 32.6
44.2
17.3
3.8
5.79
1.64
6. While purchasing goods, how much do
you prefer Norwegian web site? 21.1
32.6
25
11.5 9.6
6.44
2.49
‘ O n l i n e S h o p p i n g ’ , C u s t o m e r S a t i s f a c t i o n a n d L o y a l t y i n N o r w a y
Master thesis 2010 Page 44
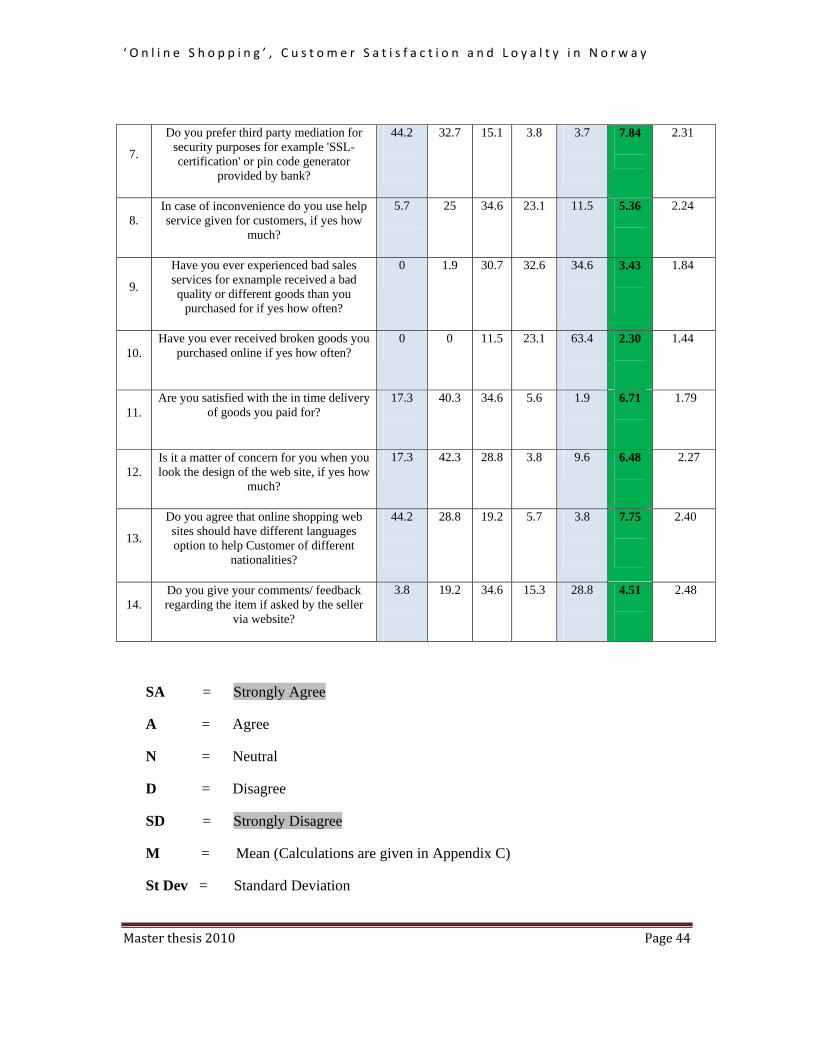
7.
Do you prefer third party mediation for security purposes for example 'SSL-certification' or pin code generator
provided by bank?
44.2
32.7 15.1
3.8
3.7
7.84
2.31
8. In case of inconvenience do you use help service given for customers, if yes how
much?
5.7
25
34.6 23.1 11.5 5.36
2.24
9.
Have you ever experienced bad sales services for exnample received a bad quality or different goods than you
purchased for if yes how often?
0 1.9
30.7
32.6
34.6
3.43
1.84
10. Have you ever received broken goods you
purchased online if yes how often? 0 0 11.5
23.1
63.4
2.30
1.44
11. Are you satisfied with the in time delivery
of goods you paid for? 17.3
40.3 34.6
5.6
1.9
6.71
1.79
12. Is it a matter of concern for you when you look the design of the web site, if yes how
much?
17.3 42.3 28.8 3.8 9.6 6.48
2.27
13.
Do you agree that online shopping web sites should have different languages option to help Customer of different
nationalities?
44.2
28.8
19.2
5.7
3.8
7.75
2.40
14. Do you give your comments/ feedback regarding the item if asked by the seller
via website?
3.8
19.2
34.6
15.3
28.8
4.51
2.48
SA = Strongly Agree
A = Agree
N = Neutral
D = Disagree
SD = Strongly Disagree
M = Mean (Calculations are given in Appendix C)
St Dev = Standard Deviation
‘ O n l i n e S h o p p i n g ’ , C u s t o m e r S a t i s f a c t i o n a n d L o y a l t y i n N o r w a y
Master thesis 2010 Page 45
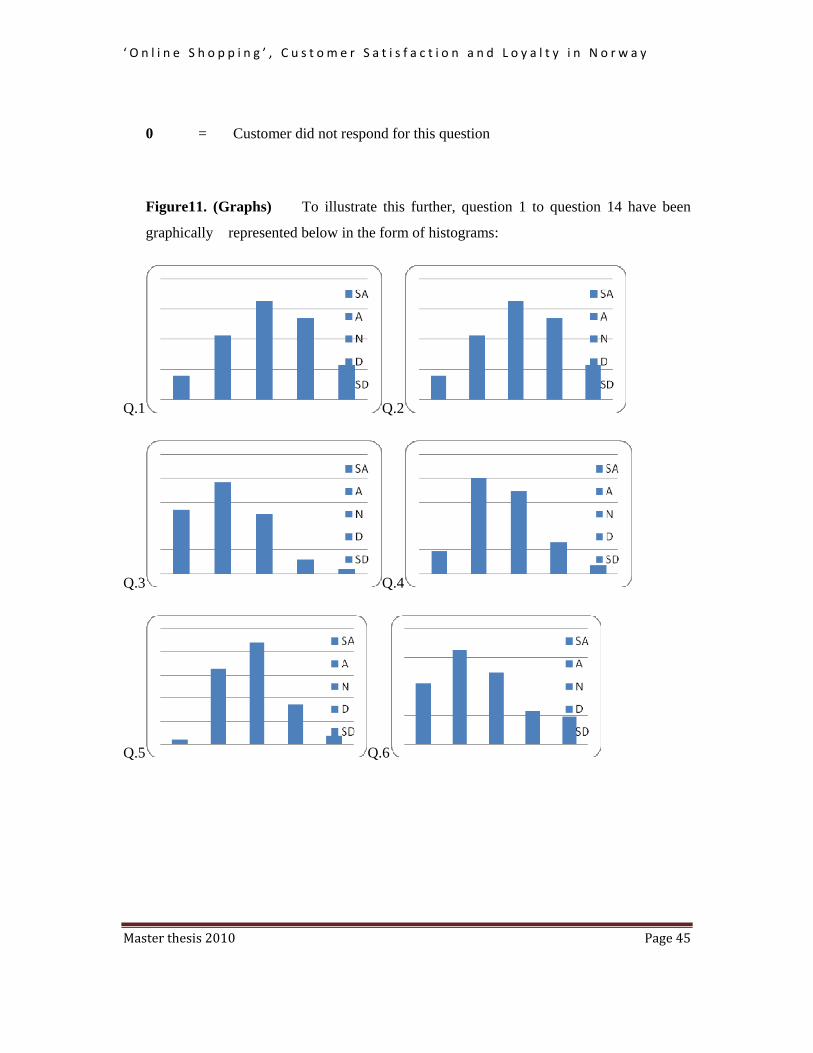
0 = Customer did not respond for this question
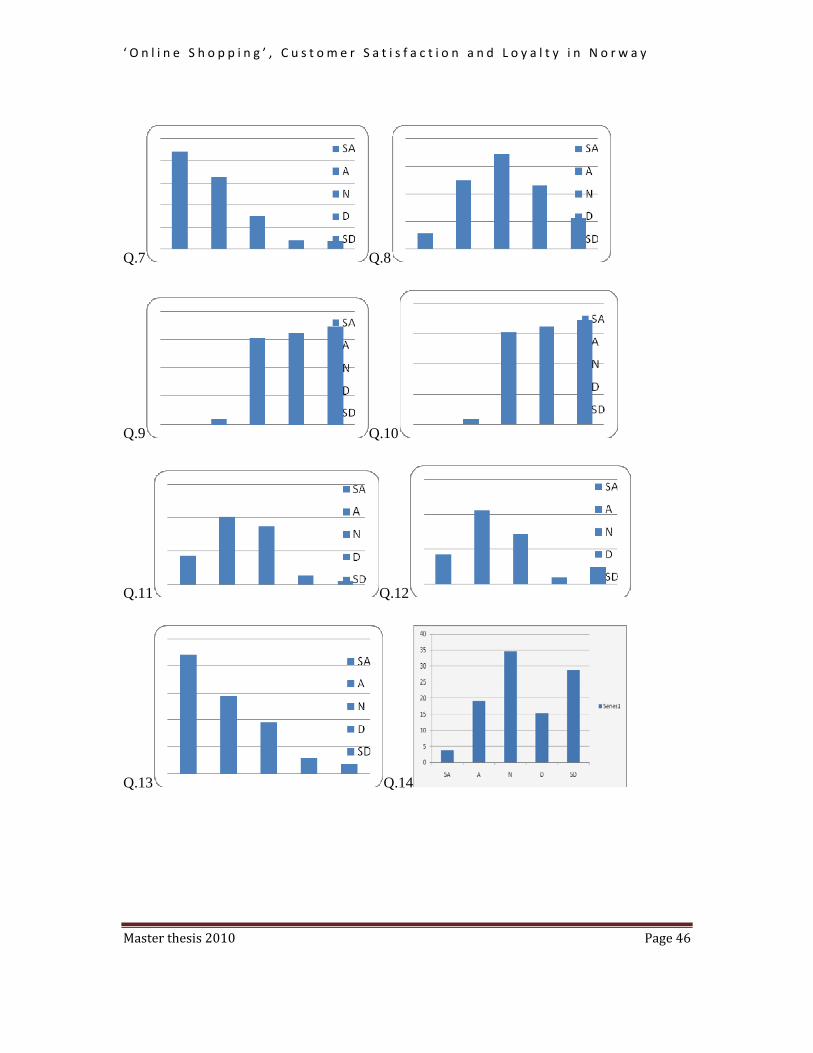
Figure11. (Graphs) To illustrate this further, question 1 to question 14 have been
graphically represented below in the form of histograms:
Q.1 Q.2
Q.3 Q.4
Q.5 Q.6
‘ O n l i n e S h o p p i n g ’ , C u s t o m e r S a t i s f a c t i o n a n d L o y a l t y i n N o r w a y
Master thesis 2010 Page 46
Q.7 Q.8
Q.9 Q.10
Q.11 Q.12
Q.13 Q.14

‘ O n l i n e S h o p p i n g ’ , C u s t o m e r S a t i s f a c t i o n a n d L o y a l t y i n N o r w a y
Master thesis 2010 Page 47
Figure.12 Given below is the graph of Means with respect to each question in table 4.
Figure13, below (Graphs). Following graphs are representing the normal distribution for
each question in table 4 (Series 1 in each graph represents the data from the given
question). Although the response, as mentioned previously, gives discrete options between
1-10, the response is assumed to be a continuous random variable. It can be seen that only
Q1, Q5 and Q8 has distribution very close to be symmetric. Q2,Q3,Q4,Q6,Q7,Q11,Q12
and Q13 has negatively skewed distribution and Q8,Q9 and Q10 has positively skewed
distribution. In general, most of the questions have asymmetric distribution.
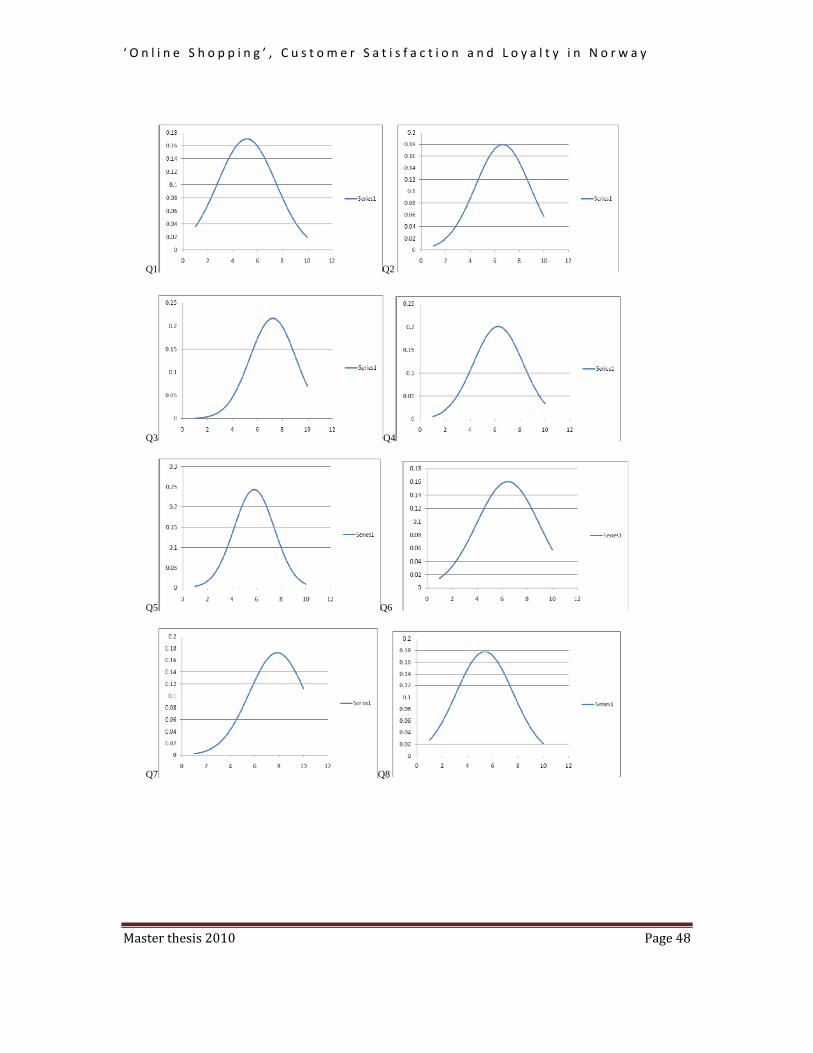
‘ O n l i n e S h o p p i n g ’ , C u s t o m e r S a t i s f a c t i o n a n d L o y a l t y i n N o r w a y
Master thesis 2010 Page 48
Q1 Q2
Q3 Q4
Q5 Q6
Q7 Q8

‘ O n l i n e S h o p p i n g ’ , C u s t o m e r S a t i s f a c t i o n a n d L o y a l t y i n N o r w a y
Master thesis 2010 Page 49
Q9 Q10
Q11 Q12
Q13 Q.14
At the beginning of the survey, the customers have been asked for some introductory
questions in order to understand their background and knowledge towards online shopping in
Norway. Following tables show the percentage rating for such questions. Table 5 shows
percentage of Norwegian and Non Norwegian respondents purchasing products or services
online.
Question ‘Yes’ ‘No’
Are you a Norwegian Citizen? 78.84 % 23.07 %
Table.5
The following table describes the percentage rating of goods purchased by online customers based on the condition of goods whether new or used.
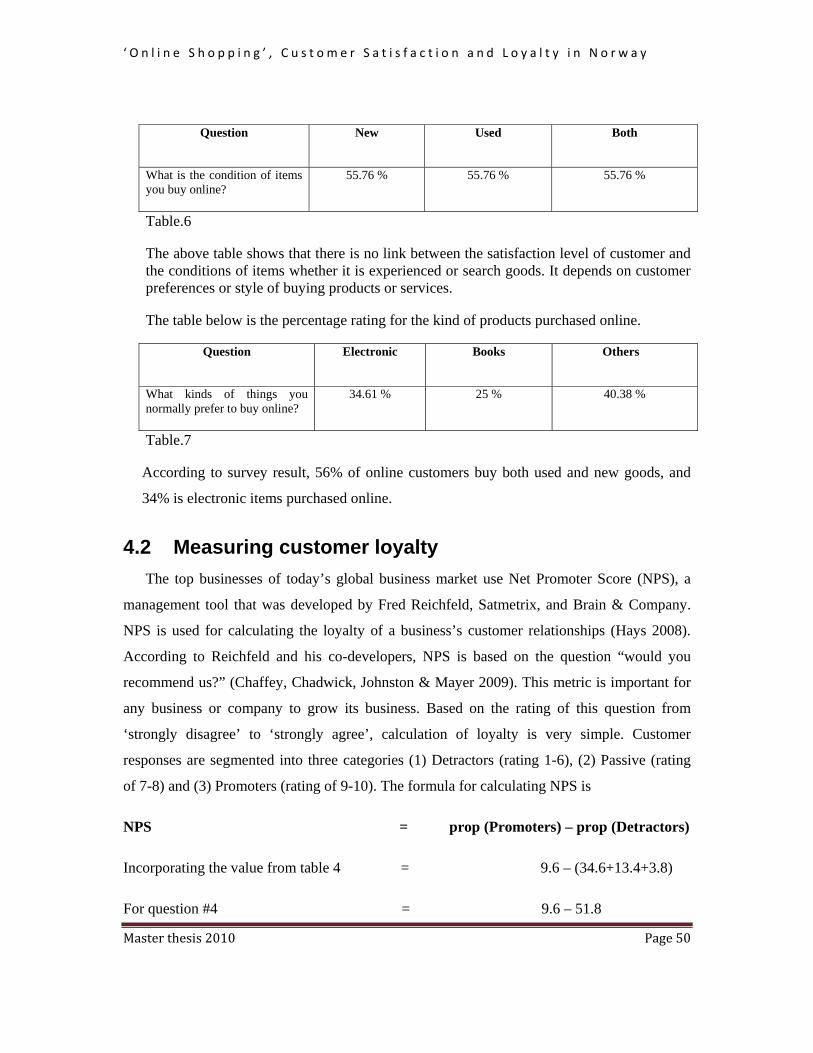
‘ O n l i n e S h o p p i n g ’ , C u s t o m e r S a t i s f a c t i o n a n d L o y a l t y i n N o r w a y
Master thesis 2010 Page 50
Question New Used Both
What is the condition of items you buy online?
55.76 % 55.76 % 55.76 %
Table.6
The above table shows that there is no link between the satisfaction level of customer and the conditions of items whether it is experienced or search goods. It depends on customer preferences or style of buying products or services.
The table below is the percentage rating for the kind of products purchased online.
Question Electronic Books Others
What kinds of things you normally prefer to buy online?
34.61 % 25 % 40.38 %
Table.7
According to survey result, 56% of online customers buy both used and new goods, and
34% is electronic items purchased online.
4.2 Measuring customer loyalty
The top businesses of today’s global business market use Net Promoter Score (NPS), a
management tool that was developed by Fred Reichfeld, Satmetrix, and Brain & Company.
NPS is used for calculating the loyalty of a business’s customer relationships (Hays 2008).
According to Reichfeld and his co-developers, NPS is based on the question “would you
recommend us?” (Chaffey, Chadwick, Johnston & Mayer 2009). This metric is important for
any business or company to grow its business. Based on the rating of this question from
‘strongly disagree’ to ‘strongly agree’, calculation of loyalty is very simple. Customer
responses are segmented into three categories (1) Detractors (rating 1-6), (2) Passive (rating
of 7-8) and (3) Promoters (rating of 9-10). The formula for calculating NPS is
NPS = prop (Promoters) – prop (Detractors)
Incorporating the value from table 4 = 9.6 – (34.6+13.4+3.8)
For question #4 = 9.6 – 51.8
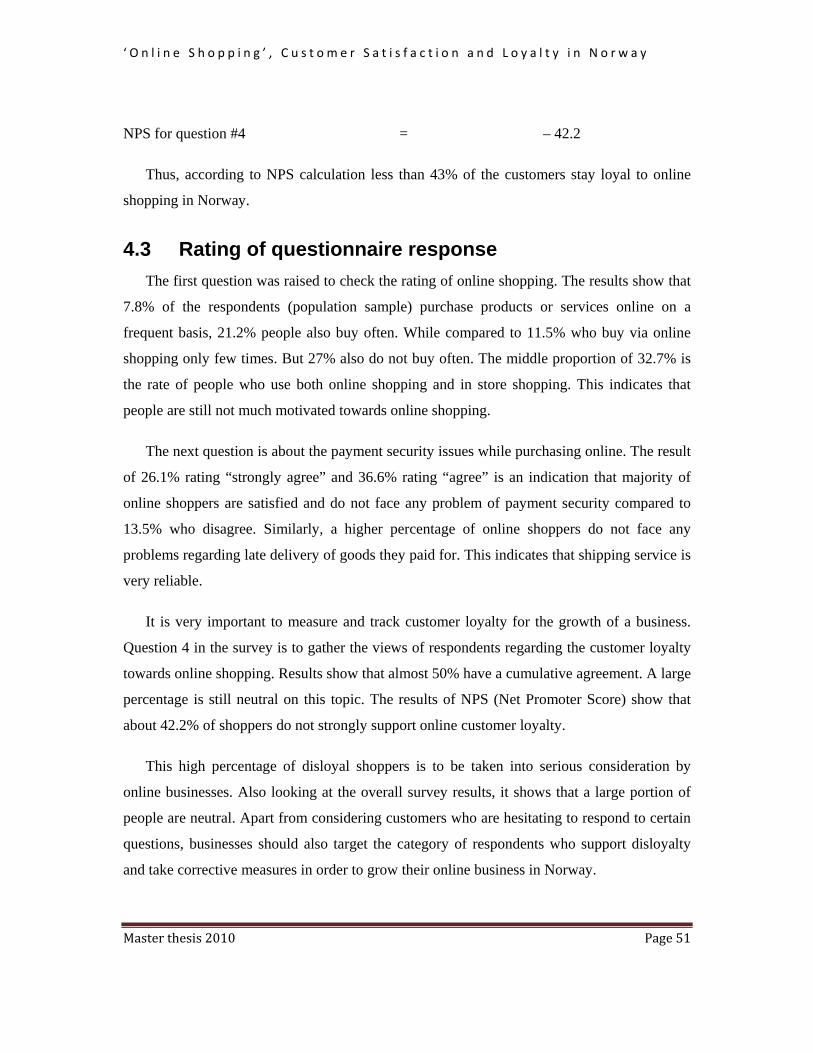
‘ O n l i n e S h o p p i n g ’ , C u s t o m e r S a t i s f a c t i o n a n d L o y a l t y i n N o r w a y
Master thesis 2010 Page 51
NPS for question #4 = – 42.2
Thus, according to NPS calculation less than 43% of the customers stay loyal to online
shopping in Norway.
4.3 Rating of questionnaire response
The first question was raised to check the rating of online shopping. The results show that
7.8% of the respondents (population sample) purchase products or services online on a
frequent basis, 21.2% people also buy often. While compared to 11.5% who buy via online
shopping only few times. But 27% also do not buy often. The middle proportion of 32.7% is
the rate of people who use both online shopping and in store shopping. This indicates that
people are still not much motivated towards online shopping.
The next question is about the payment security issues while purchasing online. The result
of 26.1% rating “strongly agree” and 36.6% rating “agree” is an indication that majority of
online shoppers are satisfied and do not face any problem of payment security compared to
13.5% who disagree. Similarly, a higher percentage of online shoppers do not face any
problems regarding late delivery of goods they paid for. This indicates that shipping service is
very reliable.
It is very important to measure and track customer loyalty for the growth of a business.
Question 4 in the survey is to gather the views of respondents regarding the customer loyalty
towards online shopping. Results show that almost 50% have a cumulative agreement. A large
percentage is still neutral on this topic. The results of NPS (Net Promoter Score) show that
about 42.2% of shoppers do not strongly support online customer loyalty.
This high percentage of disloyal shoppers is to be taken into serious consideration by
online businesses. Also looking at the overall survey results, it shows that a large portion of
people are neutral. Apart from considering customers who are hesitating to respond to certain
questions, businesses should also target the category of respondents who support disloyalty
and take corrective measures in order to grow their online business in Norway.
‘ O n l i n e S h o p p i n g ’ , C u s t o m e r S a t i s f a c t i o n a n d L o y a l t y i n N o r w a y
Master thesis 2010 Page 52
The 1.9 % of respondents expects more detailed information from the online shopping
web sites. When the website provides complete product or service information along with the
information that the customer is specifically looking for, then the customer will be more
inclined to shop online.
While calculating the percentage rating for customer’s preference towards online
Norwegian companies, the results shows that 32.6% (Strongly agree) and 21.1% (Agree) of
the population are satisfied with the local online shopping web sites in Norway. This can also
be due to the fact that the customer has a complete understanding of the product or service
that is available in an online Norwegian company. Also compared to a foreign company, an
online shopper might feel convenient to purchase from a Norwegian company for various
reasons like language (information is available to him in his local language) and credibility.
Regarding the third party mediation for payment security purposes, despite the large
percentage being satisfied with the security measures of online payment (question 2); people
still want more secure methods for payment systems. Online payment security has a direct
impact on customer satisfaction and loyalty.
As far as the timely delivery of items is concerned, it is good to learn that only 1.9% of
population strongly disagree to timely delivery of goods. 17.3 % and 40.3% of the people
strongly agree and agree respectively that goods are delivered in time. Similarly, it is
surprising to note a percentage of 0 on delivery of broken goods which shows that customers
are quite satisfied with the condition of items received through an online purchase. At the
same time, the 34 % of neutral population also needs to be addressed.
Similar results have been derived for question on website design and this shows that
customers are concerned about the design of the website while making a purchase online. It is
necessary for online Norwegian companies to focus on its website design and take
constructive measure to improve their website in par with the successful international online
websites like Amazon or eBay.
A high demand is observed for providing different language selection facility on the web
sites. A rating of 44.2% and 28.8% for question#13 of questionnaire indicate that there are
‘ O n l i n e S h o p p i n g ’ , C u s t o m e r S a t i s f a c t i o n a n d L o y a l t y i n N o r w a y
Master thesis 2010 Page 53
many international customers in Norway who shop online. Sellers have to fulfill the demands
of these customers by providing different language options.
The rating for question 14 shows that less people want to give feedback or comments via
web site. Therefore businesses or firms have to find out easiest and attractive ways to get
customer feedback via their web sites.
The 23% rating for question#14 shows that less people want to give feedback or
comments via web site. Therefore businesses or firms have to find out the easiest and
attractive methods to get feedback via their web sites from their customers. It will help them
to assess their performance and identify the problems to be addressed in order to improve
their business.
4.4 Evaluation of questionnaire Data (Mean and Standard
Deviation)
We calculated the mean or average of responses for each question and their standard
deviation so as to better scrutinize the overall response for the given question. In addition the
plots of normal distribution are also given. The evaluation table.4 shows that average response
for Q1 is 5.13. It is therefore clear that trend of purchasing goods or services online is not at
high level among Norwegian people. We can say that it is of medium level. Even with
addition of positive standard deviation of 2.34 the trend of online shopping is not very high.
For Q2 the average response is a bit above the neutral opinion i.e. 6.64 that people have in
Norway. A better average level of 7.23 is obtained about the Q3. Comparatively smaller
standard deviation indicates that people’s views deviate less about this average conclusion
and is very positive for online shopping businesses in Norway. For Q4, regarding checking
the loyalty, on average people are not much inclined towards online shopping (mean=6.25).
Another medium trend is there for Q5 and Q6 of 5.79 and 6.44 respectively. However, for
Q6 the response varies much if compare to Q5.

‘ O n l i n e S h o p p i n g ’ , C u s t o m e r S a t i s f a c t i o n a n d L o y a l t y i n N o r w a y
Master thesis 2010 Page 54
In case of Q7, average agreement demonstrates people demanding and being much
concerned about the tighter security for online shopping. An average number of population
sample use help services while doing online shopping (Q8).
In Norway the customers are happy with the on-time delivery of goods by sellers, so an
average response of 3.43 and 2.3 for Q9 and Q10 is of high level. The people are happy about
the conditions of the goods they receive after payment via online but the in time delivery is
still matter of concern. May be it is because of the long distances from the firms, they live.
The mean is 6.7 for Q11. The mean for Q12 is a little above average level in Norway for
online shopping. The average response to Q13 is high (7.75), showing concern of the
population in Norway about option of different the languages in web sites. For question 14 the
average response is not satisfactory and requires actions to urge customers give their feedback
for improvement of a business’s performance and evaluation.
‘ O n l i n e S h o p p i n g ’ , C u s t o m e r S a t i s f a c t i o n a n d L o y a l t y i n N o r w a y
Master thesis 2010 Page 55
4.5 Summary In order to sum up, the results are expressed in terms of percentages in
table 4 for easy reference and they are as follows: Around 65 % of Norwegians are satisfied with the internet method of shopping.
(Adding values from column SA and A)
Around 43 % people are loyal to the websites where they do their purchases
frequently. (According to NPS calculation)
Around 76% of Norwegians prefer to use third party mediation for online payments.
((Adding values from column SA and A)
Only 30 % of the Norwegians make use of customer service facility in case of
inconvenience. (Adding values from column SA and A)
Only 23 % of Norwegians provide feedback regarding their purchases on seller
websites. (Adding values from column SA and A).
Only around 53% of the people prefer to use Norwegian websites for their online
purchase. (Adding values from column SA and A).
As much as native Norwegians, immigrants living in Norway also use online shopping
frequently. According to the results, around 70% of the people recommend websites to
support multiple languages. (Adding values from column SA and A).
About 65% of the people are happy with the quality of the delivered goods. (Adding
values from column D and SD).
It is surprising to note that only 2% of people have experienced receipt of bad quality
goods via online shopping. (Adding values from column SA and A).
60 % of online shoppers think that website designs will have to be improved. (Adding
values from column SA and A).
Around 34% of the people opine that product information given on websites is not
sufficient. (Adding values from column SA and A).

‘ O n l i n e S h o p p i n g ’ , C u s t o m e r S a t i s f a c t i o n a n d L o y a l t y i n N o r w a y
Master thesis 2010 Page 56
Chapter 5 - Conclusion The thesis was aimed to study the level of customer satisfaction and loyalty of online
shoppers in Norway. The study was done with an overview of current and past research
works done on related topics and with the help of qualitative and quantitative data collection.
Through the online survey, the factors that assess and affect the customer satisfaction and
loyalty were evaluated. Keeping this in mind, we have come up with the following
conclusions:
1. According to NPS calculation, less than 43% of customers are loyal to online shopping
in Norway. An analysis of the survey results according to table 4 show that around
65% of the customers are satisfied with the online method of shopping. It is alarming
to note that despite a good percentage of customer satisfaction there are about 57% of
disloyal customers.
2. The online customers of Norway are satisfied with their local websites, security in
online payment and the quality and timely delivery of goods. Also, for security
purposes, most of the Norwegians prefer third party mediation for their online
payments.
3. Norwegians do not effectively make use of the online customer service/support
facilities in case of inconvenience. This shows that they are not encouraged by the
online sellers to make effective use of service and support provided on online
shopping websites.
4. Norwegian online shoppers hesitate to provide feedback about a product or service
purchased online. This is very important for both online sellers and buyers. By giving
positive feedback, the customer is indirectly recommending the product to prospective
buyers. On the other hand, negative feedback helps the online sellers to improve the
quality of products/services thus attracting more people towards online shopping.
Therefore, online sellers should encourage customers to provide feedback for their
entire online purchases.

‘ O n l i n e S h o p p i n g ’ , C u s t o m e r S a t i s f a c t i o n a n d L o y a l t y i n N o r w a y
Master thesis 2010 Page 57
5. Only half of the Norwegian shoppers prefer to use the local websites of Norway. This
is because customers of different nationalities living in Norway also frequently use the
internet for shopping. Eventually, this category of shoppers expects the local websites
in Norway to support multiple languages.
6. Online shopping websites of Norway lack in providing comprehensive and thorough
information on their products/services. Majority of the Norwegians have voted
through the survey that online sellers should provide detailed information on the
products or services offered. This point of conclusion divulges very interesting
element about the nature of the Norwegian online shoppers. This shows that the
customer’s expectations have not been addressed competently by online sellers.
7. Norwegian online shoppers are concerned with the look and design of the website.
From the survey, it is clear that majority of the customers demand a good design for
the online shopping websites.
All the factors that are discussed above directly or indirectly lead to improved customer
satisfaction and loyalty of online Norwegian shoppers.
The authors believe that the outcome of this analysis will greatly influence the way online
businesses currently function in Norway. Through this research, we infer that the online
business in Norway still requires to be improved to a great extent. So there are opportunities
for Norwegian and international business firms to further invest in this market and use the
expertise and lesson-learns from different successful international experiences in order to
improve and increase the volume and performance of online shopping.

‘ O n l i n e S h o p p i n g ’ , C u s t o m e r S a t i s f a c t i o n a n d L o y a l t y i n N o r w a y
Master thesis 2010 Page 58
Chapter 6 - Recommendations Based on the detailed analysis of the survey results, we intend to recommend few
improvements to online businesses in Norway.
Firstly, as per the survey results, quite a number of people either prefer only in-store
shopping or correspondingly prefer both online and in-store shopping. Measures will have to
be taken by online businesses in Norway to attract this category of shoppers. New customer
acquisition is very important in any kind of business. For this, the firms have to improve
customer satisfaction dimensions such as availability, responsiveness, timeliness,
completeness, and convenience. Firms have to focus on all dimension of satisfaction without
preferring one to other.
So, online Norwegian companies will have to focus on improving their marketing and
sales strategies to pull more customers into online shopping. Businesses will have to explore
more ways to increase their customers and enhance their branding. This can be done
effectively through email, web marketing and search engine marketing.
So, online Norwegian companies will have to focus on improving their marketing and
sales strategies to pull more customers into online shopping. Because it is the most effective
way to fulfill customer satisfaction dimensions. The firms need to place a clearly defined
service policy for the customer on the website that could help save time and effort in the long
time. Moreover a complete and approachable way of delivering knowledge to customers will
help to make your customer more confident about the given product and service. A proper
channel and easy way of services and products could increase customer trust and keeping the
existing customer loyal but also create a good thought process that will grab the attention of
new customers in long run.
For the customer convenience, it is recommended that online Norwegian businesses offer
information in different languages. Moreover, detailed product information should be made
available through better methods such as video / audio presentation and elaborated product
‘ O n l i n e S h o p p i n g ’ , C u s t o m e r S a t i s f a c t i o n a n d L o y a l t y i n N o r w a y
Master thesis 2010 Page 59
catalogues. When all the information that a customer requires is made available to him as
expected, then the customer is inclined to purchase a product or service online.
Customer satisfaction has a direct impact on loyalty and hence businesses should focus on
satisfying their customers. Customers should be encouraged to make use of the online
customer support services in case of any inconvenience. Also, in internet shopping, customers
decide to purchase a product or service based on its review. By providing reviews, a customer
indirectly recommends the brand or product to others. Since product or service review is
increasingly important for its growth, online Norwegian companies should encourage their
customers to provide constructive feedback in their websites.
To summarize, online businesses in Norway will have to focus on acquiring new
customers through advertisement, publicity and discount packages. These customers will have
to be retained and satisfied as both lead to higher levels of customer loyalty. However, it is a
big challenge to retain customers and urge them to be loyal in a volatile environment like
internet shopping.
‘ O n l i n e S h o p p i n g ’ , C u s t o m e r S a t i s f a c t i o n a n d L o y a l t y i n N o r w a y
Master thesis 2010 Page 60
References 2007, OECD Science, Technology and Industry scoreboard: Innovation and performance in
the global economy, p. 112 – 114.
Armstrong, G &Kotler, P 2009, Marketing An Introduction (9th ed.), Pearson Prentice Hall,
New Jersey.
Barker, R &Angelopulo, G 2006, Integrated organizational communication, Juta& Co. (Pvt)
Ltd, Cape Town.
Barnes, JG (2006), Building your customer strategy: a guide to creating profitable customer
relationships, John Wiley & Sons, New Jersey, P 17-28.
Best,RJ (2005), Market-based management: Strategies for Growing customer value and
profitability, Pearson Prentice Hall, New Jersey, P 7-20.
Black, K 2009, Business statistics: for Contemporary Decision Making (6 ed), John Wiley &
Sons, USA, p. 343.
Buttle, F 2004, Customer relationship management: concepts and tools, Elsevier
Butterworth-Heinemann, MA.
Carroll, J &Broadhead, R 2001, Selling online: how to become a successful e-commerce
merchant, Dearborn Trade, Canada.
Chaffey, D 2002, E-business and e-commerce management: strategy, implementation, and
practice, Pearson Education, England, p.6.
Chaffey, D, Chadwick, FE, Johnston, K & Mayer, R 2009, Internet marketing: Strategy,
implementation and practice (4 ed), Pearson Education, England.
Charlesworth, A 2009, Internet Marketing: A practical approach, Butterworth-Heinemann,
MA
‘ O n l i n e S h o p p i n g ’ , C u s t o m e r S a t i s f a c t i o n a n d L o y a l t y i n N o r w a y
Master thesis 2010 Page 61
Czaja, R & Blair, J 2005, Designing Surveys: A guide to decisions and procedures (2nd ed),
Pine Forge Press, California.
Devaraj, S, Fan, M &Kohli, R 2006, Examination of online channel preference: using the
structure-conduct-outcome framework. Decision Support Systems, 42, 1089-1103.
Derek R. Allen, Tanniru R. Rao, 2000, Analysis of customer satisfaction Data: the historical
roots of customer satisfaction research, customer loyalty versus customer satisfaction 7, 8.
Elliot, S &Fowell, S (2000), Expectations versus reality: A snapshot of consumer experiences
with internet retailing, International Journal of Information Management, 20 (10), 323-336.
Ellsworth, JH & Ellsworth, MV 1997, Marketing on the internet (2nd ed), John Wiley &
Sons, New York.
Eskildsen, JK &Kristensen, K 2007, Customer satisfaction – The role of transparency, Total
Quality Management, Vol. 18.
Gray, R, Charlesworth, A &Esen, and R 2007, online marketing: a customer led approach,
Oxford University, New York.
Hayes, BE 2008, Measuring customer satisfaction and Loyalty: Survey Design, use, and
Statistical analysis methods, William A. Tony, USA, 4 (62-67), 5 (84-88), 6 (103-107), 8
(175-177).
Hill, N & Alexander, J 2006, Handbook of customer satisfaction and loyalty measurement,
Gower Publishing, England.
Hill, N, Roche, G & Allen, R 2007, Customer satisfaction: The customer experience through
the customer’s eyes, Cogent Publishing Ltd., London, P. 31-39.
IT Service management forum 2007, IT Service Management: an introduction, Van Haren
Publishing, Zaltbommel, P. 41.
‘ O n l i n e S h o p p i n g ’ , C u s t o m e r S a t i s f a c t i o n a n d L o y a l t y i n N o r w a y
Master thesis 2010 Page 62
Johnson, MD, Gustafsson, A, Andreasson, TW, Lervik, L & Cha, J 2001, The evolution and
future of national customer satisfaction index models, Journal of Economic Psychology, 22,
p.217-245.
Jones, SK 2009, Business-to-Business Internet marketing: Seven proven strategies for
increasing profits through Internet Marketing (5 ed), Jim Hoskins, United States.
Jonker & Eskildsen, J (2009), Management models for the future, Springer-Verlag,
Heidelberg, P. 112-113.
Kim, HR (2010), Developing an index of online customer satisfaction, Journal of financial
services marketing, 10 (1), 49-64.
Kim, S &Stoel, L (2004), Apparel retailers: Website quality dimensions and satisfaction,
Journal of retailing consumer services, 11 (2), 109-117
Komenar, M 1997, Electronic marketing, Wiley Computer, New York.
Kotler, P, Armstrong, G, Wong, V & Saunders, J 2008, Principles of marketing: 5th
European edition, Pearson Education, England.
Kuballa, J 2006, Employee satisfaction: A precondition for economical success of service
companies?, Grin Verlag, Germany, P. 10-12.
Kumar, R 2005, Research methodology: a step-by-step guide for beginners, Sage, California.
Li, N & Zhang, P 2002, Consumer online shopping attitudes and behavior: An assessment of
research, Paper presented at the Eighth Americas Conference on Information Systems,
Meier, A, Stormer, H (2009), eBusiness&eCommerce, Managing the digital value chain,
Springer-verlag, Berlin, P. 3
Mittal, V & Anderson, EW 2000, Strengthening the Satisfaction-Profit Chain,Journal of
Service Research 2000;3;107, University of Maryland.
‘ O n l i n e S h o p p i n g ’ , C u s t o m e r S a t i s f a c t i o n a n d L o y a l t y i n N o r w a y
Master thesis 2010 Page 63
Parasuraman, A &Zinkhan, GM 2002, Marketing to and serving customers through the
internet: Conceptual frameworks, practical insights and research directions, Journal of the
Academy of Marketing Science, 30 (4), p. 286-534,
Paul, J &Kapoor, R 2008, International marketing: Text and Cases, Tata McGraw-Hill, New
Delhi.
Peppers, D & Rogers, M 2004, Managing customer relationships, John wiley & Sons, New
Jersey, P. 301-302.
Ranganathan, C & Ganapathy, S 2002, Key dimensions of business-to-consumer
websites,Information and Management, 39(6), pp.457-465.
Roger, JR, Smith, BS, Kidd, PT 1998, Technologies for the Information Society:
Developments and Opportunities, IOS Press, Netherlands, P. 198
Schneider, G 2009, Electronic Commerce (8E),Cengage Learning, USA.
Silverstein, B 2002, Business to business internet marketing, Jim Hoskins, United States.
Stajano, A (2008), Research, Quality, Competitiveness: European Union Technology policy
for the knowledge (2nd ed), Springer Science s+ Business Media, New York, P. 221.
Szwarc, P (2005), Researching customer satisfaction & loyalty, Kogan Page publishers, P. 12.
Williams, ART, Bertsch, B, Wiele, AV, Iwaarden, JDV & Dale, BG (2006), Self-Assessment
against Business Excellence Models: A Critique and Perspective, Total Quality Management
and Business Excellence, Vol 17 No 10, pp. 1287-1300.
Internet reference:
http://www.itif.org/files/2010-25-years.pdf visited on 23-03-2010.
‘ O n l i n e S h o p p i n g ’ , C u s t o m e r S a t i s f a c t i o n a n d L o y a l t y i n N o r w a y
Master thesis 2010 Page 64
http://www.efqm.org visited on 29-03-2010.
http://www.bizaims.com/articles/ecommerce/electronic+commerce+worldwide visited on 04-04-2010
www.allbusiness.com/company-activities-mangement/operations-customers visited on 30-08-
2010
http://www.tmcnet.com/channels/customer-experience-management/articles/936-customer-experience-customer-satisfaction-vs-customer-loyalty.htm visited 31-08-2010
http://www.esurveyspro.com/article-measuring-customer-loyalty.aspx visited 31-08-2010
http://sirspeedypb.com/2010/08/customer-loyalty-attitude-or-a-behavior visited on 5-09-2010
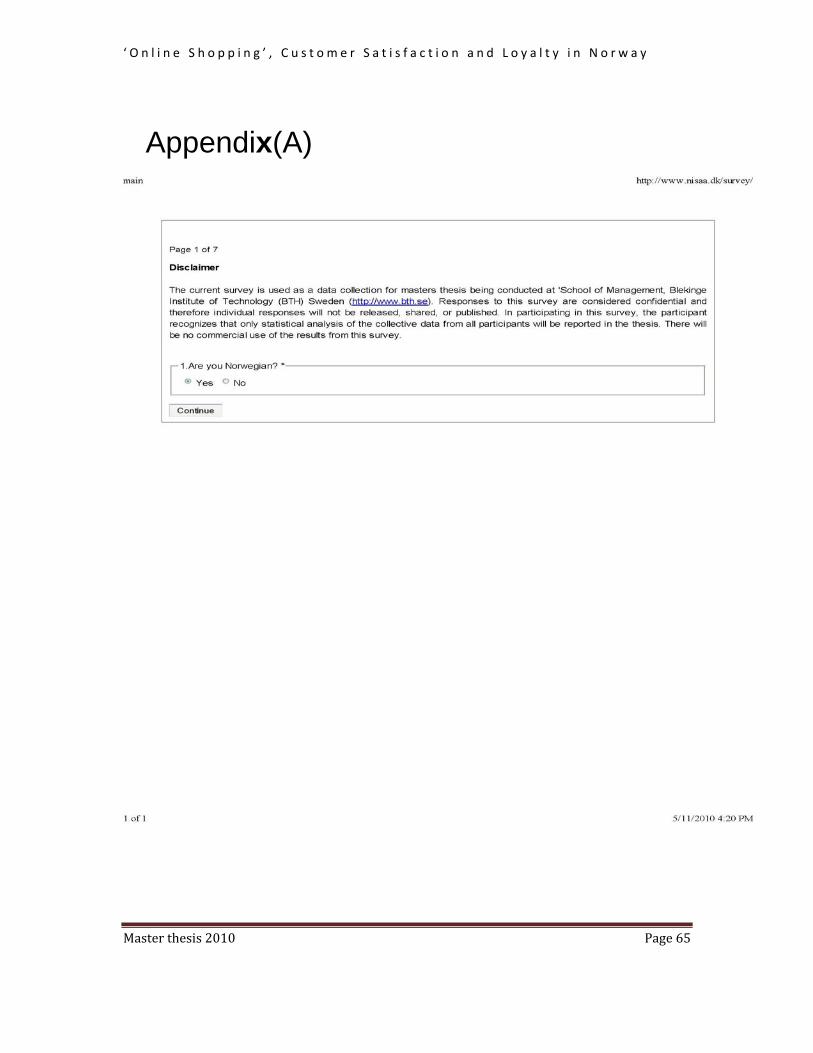
‘ O n l i n e S h o p p i n g ’ , C u s t o m e r S a t i s f a c t i o n a n d L o y a l t y i n N o r w a y
Master thesis 2010 Page 65
Appendix(A)

‘ O n l i n e S h o p p i n g ’ , C u s t o m e r S a t i s f a c t i o n a n d L o y a l t y i n N o r w a y
Master thesis 2010 Page 66
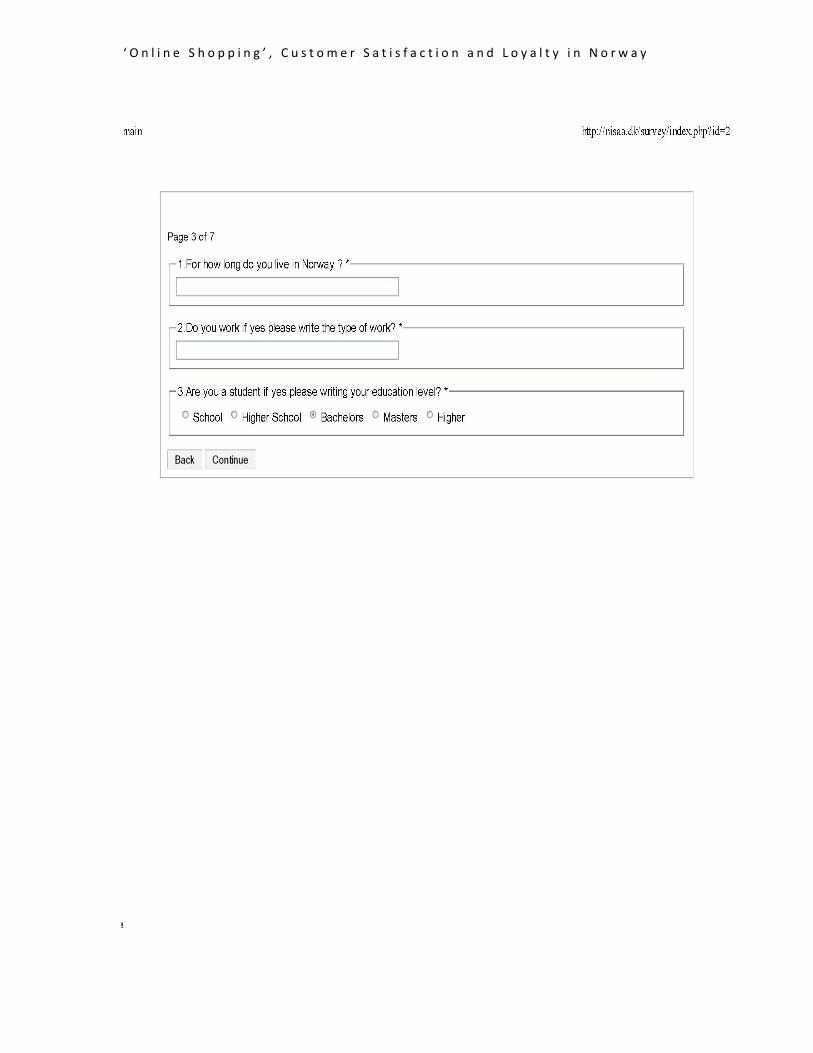
‘ O n l i n e S h o p p i n g ’ , C u s t o m e r S a t i s f a c t i o n a n d L o y a l t y i n N o r w a y
Master thesis 2010 Page 67
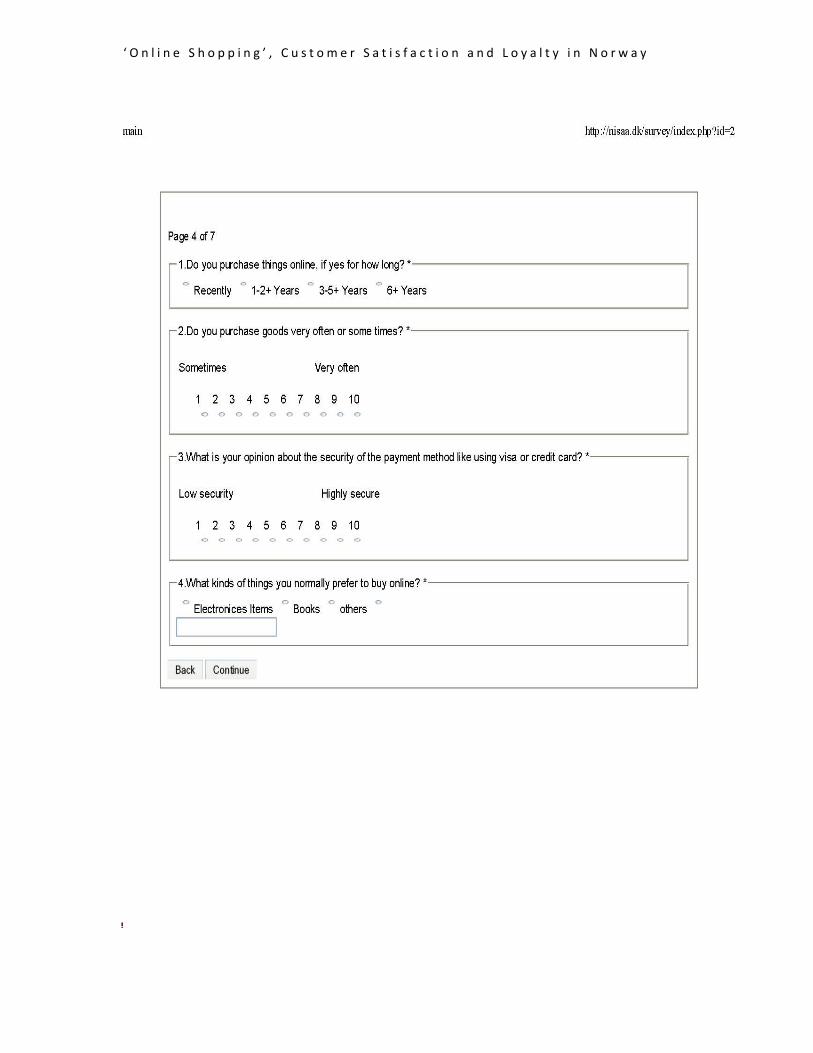
‘ O n l i n e S h o p p i n g ’ , C u s t o m e r S a t i s f a c t i o n a n d L o y a l t y i n N o r w a y
Master thesis 2010 Page 68
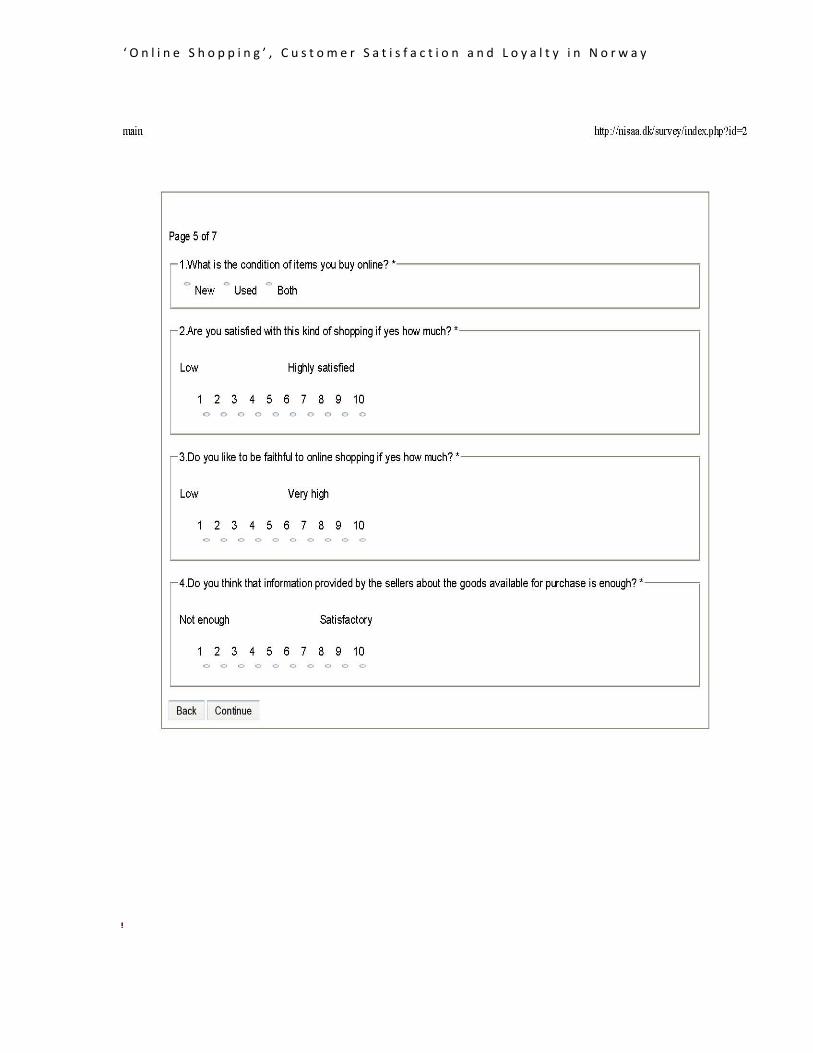
‘ O n l i n e S h o p p i n g ’ , C u s t o m e r S a t i s f a c t i o n a n d L o y a l t y i n N o r w a y
Master thesis 2010 Page 69
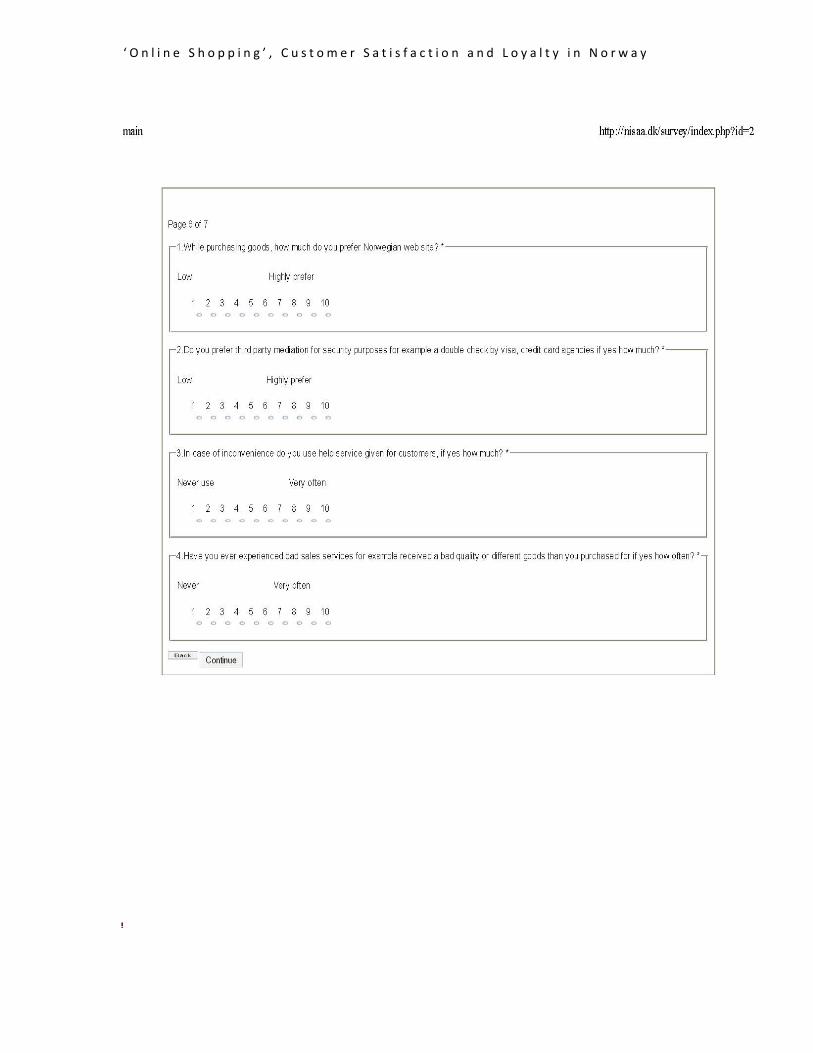
‘ O n l i n e S h o p p i n g ’ , C u s t o m e r S a t i s f a c t i o n a n d L o y a l t y i n N o r w a y
Master thesis 2010 Page 70
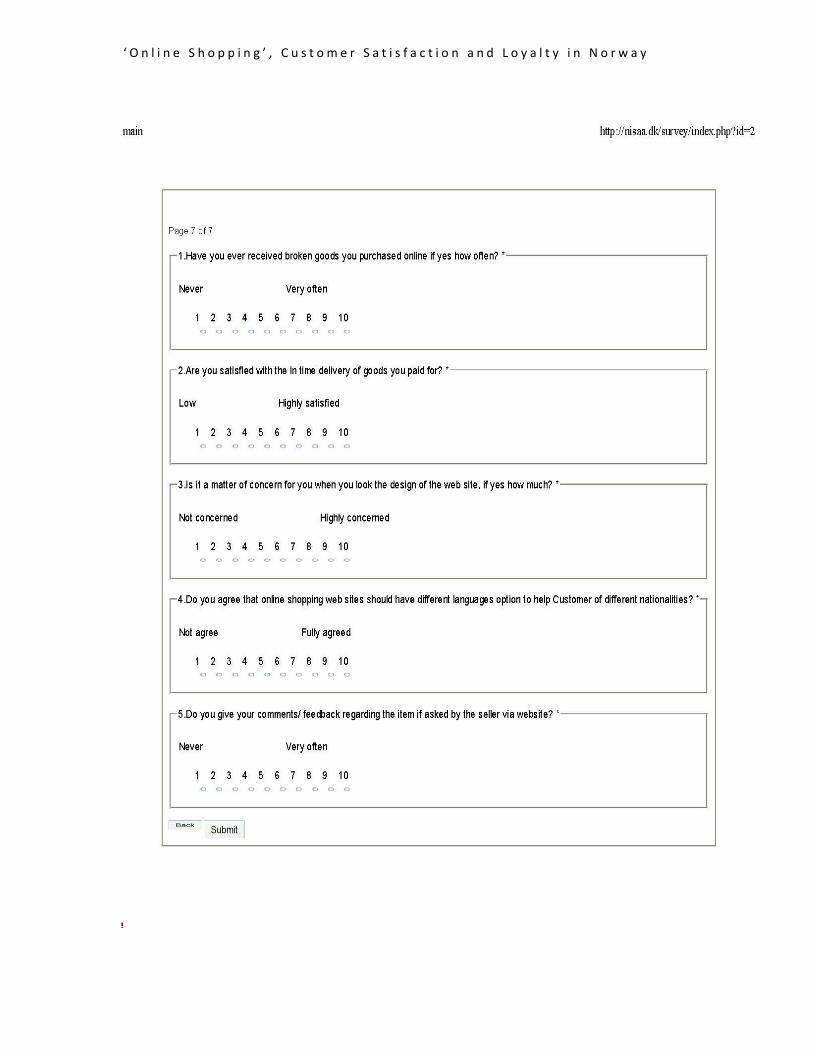
‘ O n l i n e S h o p p i n g ’ , C u s t o m e r S a t i s f a c t i o n a n d L o y a l t y i n N o r w a y
Master thesis 2010 Page 71

‘ O n l i n e S h o p p i n g ’ , C u s t o m e r S a t i s f a c t i o n a n d L o y a l t y i n N o r w a y
Master thesis 2010 Page 72
Appendix(B) Following is the questionnaire uploaded on website. The questions with bold text belong to
thesis analysis part.
1. Are you Norwegian, if not what nationality?
2. Where do you belong from?
3. For how long do you live in Norway?
4. Do you work if yes please write the type of work?
5. If you are student write the level of education?
6. Do you purchase things online if yes for how long?
7. What is your opinion about the security of the payment like visa card?
8. What kind of things do you prefer to buy online?
9. What is the condition of items do you buy online?
10. Are you satisfied with this kind of shopping if yes how much?
11. Do you like to be loyal to online shopping if yes how much?
12. Do you think that information given by seller is enough about the thing you
purchase?
13. While purchasing how much do you prefer Norwegian websites?
14. Do you prefer third party mediation for example double check by visa card
agencies?
15. In case of inconvenience do you use help services?
16. Have you ever experienced bad sales services for example bad quality or different
things than you paid for?
17. Have ever experienced broken goods you purchased online?
18. Are you satisfied with the in time delivery of the goods you paid for?
19. Is it a matter of concern when you look at the design of the website?
20. Do you agree that online shopping websites should have different language
options?
21. Do you give your feedback regarding the item the seller asked via website?
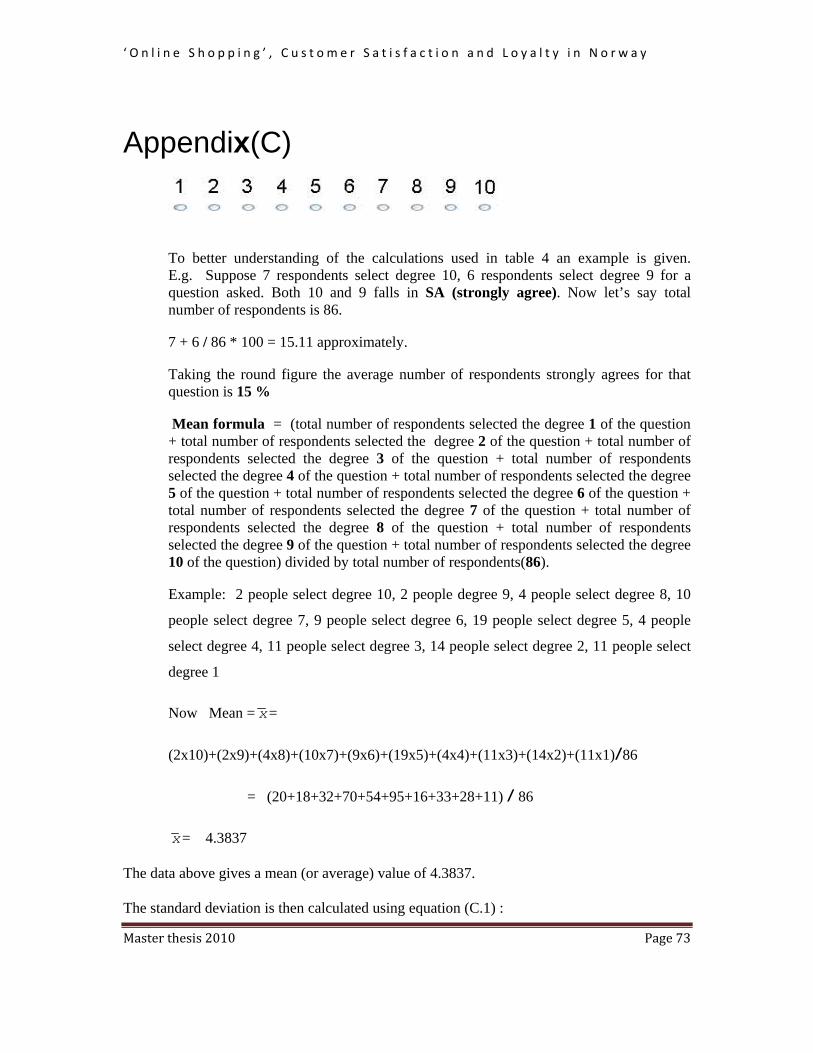
‘ O n l i n e S h o p p i n g ’ , C u s t o m e r S a t i s f a c t i o n a n d L o y a l t y i n N o r w a y
Master thesis 2010 Page 73
Appendix(C)
To better understanding of the calculations used in table 4 an example is given. E.g. Suppose 7 respondents select degree 10, 6 respondents select degree 9 for a question asked. Both 10 and 9 falls in SA (strongly agree). Now let’s say total number of respondents is 86.
7 + 6 / 86 * 100 = 15.11 approximately.
Taking the round figure the average number of respondents strongly agrees for that question is 15 %
Mean formula = (total number of respondents selected the degree 1 of the question + total number of respondents selected the degree 2 of the question + total number of respondents selected the degree 3 of the question + total number of respondents selected the degree 4 of the question + total number of respondents selected the degree 5 of the question + total number of respondents selected the degree 6 of the question + total number of respondents selected the degree 7 of the question + total number of respondents selected the degree 8 of the question + total number of respondents selected the degree 9 of the question + total number of respondents selected the degree 10 of the question) divided by total number of respondents(86).
Example: 2 people select degree 10, 2 people degree 9, 4 people select degree 8, 10
people select degree 7, 9 people select degree 6, 19 people select degree 5, 4 people
select degree 4, 11 people select degree 3, 14 people select degree 2, 11 people select
degree 1
Now Mean = x=
(2x10)+(2x9)+(4x8)+(10x7)+(9x6)+(19x5)+(4x4)+(11x3)+(14x2)+(11x1)/86
= (20+18+32+70+54+95+16+33+28+11) / 86
x= 4.3837
The data above gives a mean (or average) value of 4.3837.
The standard deviation is then calculated using equation (C.1) :
‘ O n l i n e S h o p p i n g ’ , C u s t o m e r S a t i s f a c t i o n a n d L o y a l t y i n N o r w a y
Master thesis 2010 Page 74
2
1
x x
n
= 2.3871 (C.1)
Where x is the sample mean, xeach individual degree of response, n is the total number of
values and represents that we make summation across the values of 2x x .