Embed Size (px)
Citation preview

June 2013
Working Reports contain information on work in progress
or pending completion.
Matti Hakala
KMS Hakala Oy
Jouni Val l i
Pöyry Finland Oy
Working Report 2012-58
ONKALO POSE Experiment –Phase 3: 3DEC Prediction


ABSTRACT The objectives of the third phase of the POSE experiment are to determine the in situ state of stress at Olkiluoto and the spalling strength of Olkiluoto rock. The experiment involves internally heating the third experimental hole (ONK-EH3) of the POSE niche, which is filled with aluminium oxide, using 8 vertically installed heaters. This will cause a symmetrical thermal stress increase around the hole due to the thermal expansion of rock. The focus of this work was to define the power outputs and time required to exceed the spalling strength of the rock as well as predict the behaviour of the rock mass during the experiment. Predictions were accomplished as 3-dimensional coupled thermo-mechanical simulations using 3DEC (Itasca 2012). The simulations used an elastic and isotropic constitutive model for the rock mass. The power outputs and time required to cause a sufficiently large stress increase whilst remaining within instrumentation temperature thresholds were determined from the simulation results. Both temperature and strain monitoring predictions were also produced based on the results. The optimal heating cycle was found to be 3 weeks of heating with individual power outputs of 400 W and the following 9 weeks with 800 W power outputs. This caused a stress state around the hole after three weeks which corresponds to the estimated spalling strength of pegmatite of 0.57 UCS with the maximum principal stress exceeding 105 MPa after 12 weeks. 105 MPa corresponds to the UCS of pegmatite. Temperatures were still below 130 °C, which is the functional limit of the strain gauge glue. Further simulations will make use of a strain-softening/hardening constitutive model in order to accurately simulate plastic failure and will be conducted in the back-analysis phase of the third phase of the POSE experiment. Keywords: in situ stress, thermal, simulations, spalling, POSE.

ONKALO POSE-koe - Vaihe 3: 3DEC-ennuste TIIVISTELMÄ POSE-kokeen kolmannen vaiheen tavoitteena on määritellä tutkimuskuprikka 3:n (ns. POSE-kuprikka) alueella vallitseva in situ -jännitystila ja kiven hilseilylujuus. Kokeessa alumiinioksidilla täytettyä kolmatta tutkimusreikää (ONK-EH3) lämmitetään sym-metrisesti reiän keskelle asennetuilla kahdeksalla pystysuuntaisella sauvalämmittimellä. Lämmitys aiheuttaa kiven lämpölaajenemisen kautta jännitystilan kasvun reiän ympärillä. Tämän työn tavoitteena oli määrittää kiven hilseilylujuuden ylittämiseen tarvittava lämmitysteho ja aika sekä ennustaa kallion käyttäytymistä kokeen aikana. Laskennat toteutettiin kytkettynä kolmedimensionaalisena lämpömekaanisena simu-laationa 3DEC-ohjelmistolla (Itasca 2012). Laskennoissa kivi oletettiin kimmoiseksi ja isotrooppiseksi. Tulosten perusteella määriteltiin kiven hilseilylujuuden ylittämiseksi tarvittavat lämmitystehot ja lämmitysajat huomioiden instrumentoinnin asettamat lämpötilarajoitukset. Laskentojen perusteella laadittiin myös ennusteet kaikille lämpö-tila- ja venymäseurantamittauksille Soveltuvimmaksi lämmitys-sykliksi osoittautui 3 viikkoa lämmitystä 400 W teholla per lämmitin ja seuraavat 9 viikkoa 800 W teholla. Edellä mainitulla kolmen viikon lämmityksen jälkeen jännitystila reiän pinnalla vastaa oletettua kiven vauriolujuutta 0.57 UCS ja 12 viikon lämmityksellä suurimman pääjännityksen ennustetaan nousevan reiän pinnalla yli 105 MPa, jonka vastaa pegmatiitin laboratoriolujuutta (UCS). Tällöin lämpötilat pysyvät reiän pinnalla vielä alle 130 °C, mikä on venymäliuskaliiman toimintaraja. Myöhemmin toteutettavissa simuloinneissa käytetään hauraan materian mallia, jotta potentiaaliset vauriot ja niiden seuraukset tulee kuvattua realistisemmin. Mallinnukset tullaan toteuttamaan kokeen jälkeen takaisinlaskentavaiheessa. Avainsanat: in situ jännitystila, termomekaaninen, ennuste, laskenta, hilseily, POSE, koe.

1
TABLE OF CONTENTS
ABSTRACT TIIVISTELMÄ
1 INTRODUCTION ................................................................................................... 3 1.1 Background .................................................................................................. 3 1.2 Experiment layout of the third phase ............................................................ 4 1.3 Objectives .................................................................................................... 6
2 MATERIAL PROPERTIES, IN SITU CONDITIONS AND HEATERS ................... 7 2.1 Rock mass properties .................................................................................. 7 2.2 Filling material .............................................................................................. 7 2.3 In situ stress and temperature ...................................................................... 8 2.4 Heaters ....................................................................................................... 10
3 SIMULATION APPROACH ................................................................................. 11 3.1 Goals .......................................................................................................... 11 3.2 Approach methodology .............................................................................. 11
4 PRELIMINARY SIMULATIONS ........................................................................... 13 4.1 Model geometry ......................................................................................... 13 4.2 Cases ......................................................................................................... 15 4.3 Results ....................................................................................................... 15
4.3.1 Case 1: 3 weeks 3200 W, 9 weeks 6400 W ................................... 17 4.3.2 Case 2: 3 weeks 3600 W and 9 weeks 6800 W ............................. 18 4.3.3 Cases 3, 4 and 5: stresses +32 MPa, +38 MPa, +44 MPa ............. 18 4.3.4 Cases 6 – 9 .................................................................................... 19
4.4 Preliminary simulation conclusions ............................................................ 19
5 FULL SCALE MODEL ......................................................................................... 21 5.1 Purpose ...................................................................................................... 21 5.2 Model geometry ......................................................................................... 21 5.3 Monitoring instruments (type and location) ................................................ 23 5.4 Strain calculation ........................................................................................ 27 5.5 Results ....................................................................................................... 27
5.5.1 Temperatures ................................................................................. 27 5.5.2 In situ stress: EDZ and access tunnel stress state interpretation ... 29 5.5.3 In situ stress: POSE ONK-EH3 stress state interpretation ............. 32 5.5.4 Damage extents ............................................................................. 34
6 DISCUSSION ...................................................................................................... 37
REFERENCES ............................................................................................................. 39
APPENDICES ............................................................................................................... 41

2
3
1 INTRODUCTION
1.1 Background
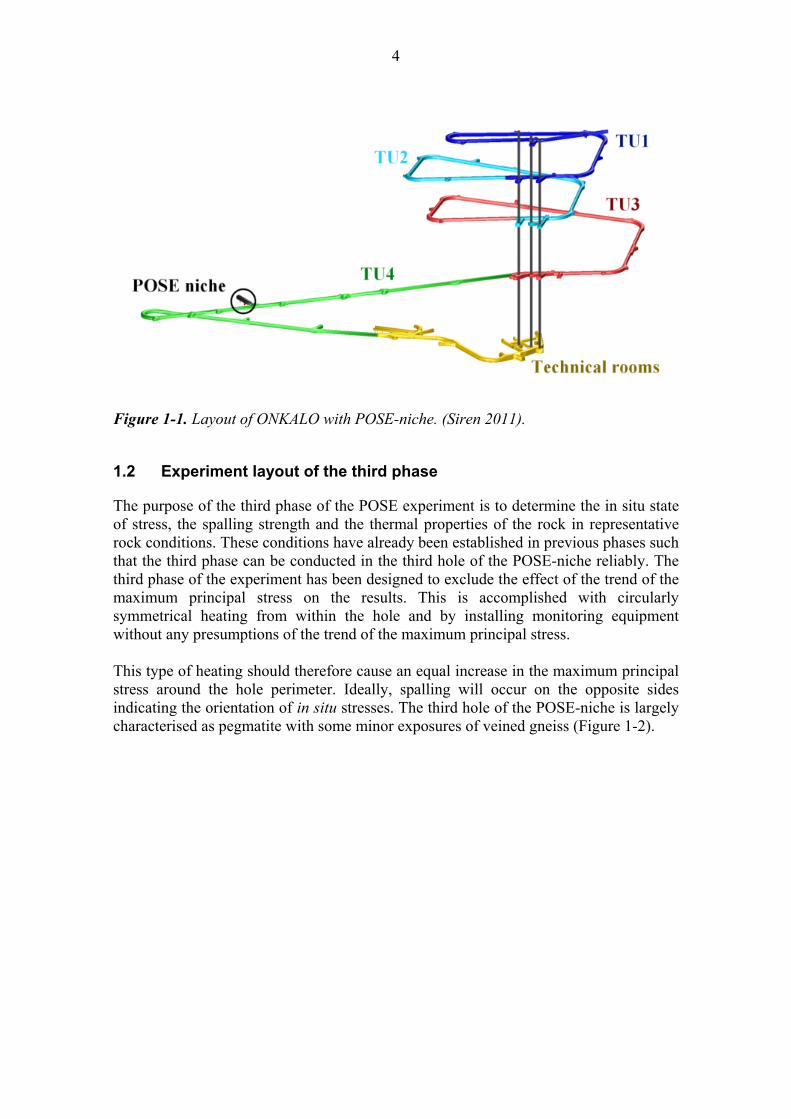
The spalling strength of Olkiluoto rock types is required to accurately estimate the probability and severity of potential rock stress-induced damage in the future nuclear waste disposal facility. Based on current information, systemic spalling can be avoided during construction if there is an appropriate design of the underground facilities but, after canister emplacement, the additional thermal stresses may cause spalling. The in situ rock spalling strength cannot be established accurately from drillhole scale core samples due to an insufficiently large sample size in relation to the heterogeneity of the rock and the different loading conditions and geometry; instead, a larger scale in situ experiment is required. So far, the in situ rock spalling strength at Olkiluoto has been estimated by using the URL (Canada) and Äspö HRL (Sweden) in situ experimental results which provided a 57 % ratio between the in situ experimental values and the laboratory experimental mean values. Based on existing tests results the mean laboratory scale uniaxial compressive strength (UCS) of ONKALO area rock types is approximately 115 MPa, and the estimated spalling strength when using a ratio of 0.57 UCS, is thus 66 MPa. It should however be noted that the Olkiluoto migmatite is different to the more homogeneous igneous rock types at the Canadian and Swedish Underground Reseach Laboratories (URL), so that adopting the 57 % spalling strength ratio is at least questionable. In the Canadian URL the stress-strength ratio was so high that continuous spalling was observed when a tunnel was excavated perpendicular to the maximum principal stress. In the Äspö APSE experiment stresses were concentrated in a rock pillar and further increased by external heating in order to promote spalling. The first POSE pillar experiment, similar to the APSE experiment, demonstrated that this test layout requires fairly detailed knowledge of the orientations of the principal stresses. Although damage was initiated, the location and response to heating (Phase 2) was not what was expected. The Posiva's Olkiluoto Spalling Experiment (POSE) in situ spalling experiment was carried out in investigation niche 3 (POSE-niche) at a depth level of approximately -345 m, chainage 3620 m (Figure 1-1). Phases 1 and 2 of the POSE experiment were conducted between years 2010 and 2011 and are documented in the upcoming Posiva Working Report number 2012-60. The third POSE spalling experiment will be conducted in the same investigation niche. It is a single hole experiment designed so that is not susceptible to the orientation of in situ stress.
4
Figure 1-1. Layout of ONKALO with POSE-niche. (Siren 2011).
1.2 Experiment layout of the third phase
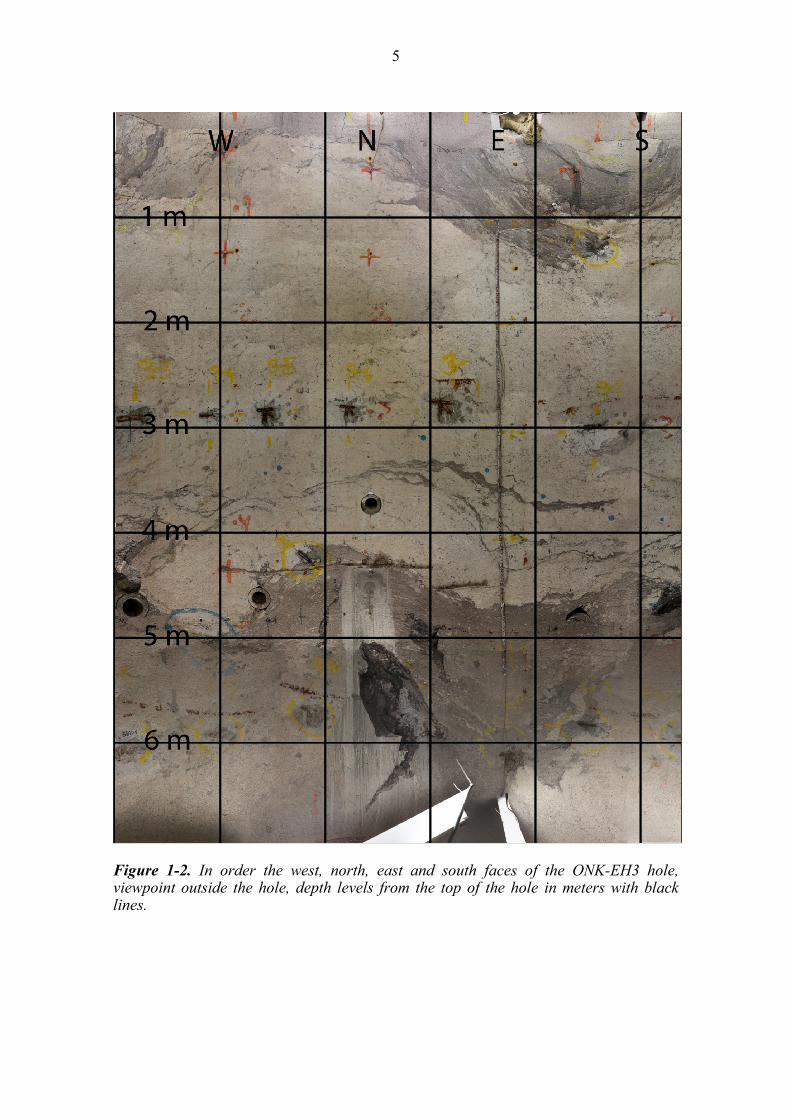
The purpose of the third phase of the POSE experiment is to determine the in situ state of stress, the spalling strength and the thermal properties of the rock in representative rock conditions. These conditions have already been established in previous phases such that the third phase can be conducted in the third hole of the POSE-niche reliably. The third phase of the experiment has been designed to exclude the effect of the trend of the maximum principal stress on the results. This is accomplished with circularly symmetrical heating from within the hole and by installing monitoring equipment without any presumptions of the trend of the maximum principal stress. This type of heating should therefore cause an equal increase in the maximum principal stress around the hole perimeter. Ideally, spalling will occur on the opposite sides indicating the orientation of in situ stresses. The third hole of the POSE-niche is largely characterised as pegmatite with some minor exposures of veined gneiss (Figure 1-2).
5
Figure 1-2. In order the west, north, east and south faces of the ONK-EH3 hole, viewpoint outside the hole, depth levels from the top of the hole in meters with black lines.
6
1.3 Objectives
The focus of this work was to provide a prediction of the stress state around the ONK-EH3 hole both prior to and during a heating experiment as well as providing a prediction of the time of expected spalling. Secondly, power output determination was also required as the maximum temperature at the hole wall was to be kept within reasonable limits whilst achieving the targeted stress increase. Strain gauge behaviour predictions were also an important component of this work. Finally, the results from the test can at a later stage be compared to the predictions. A large number of previous simulations are not documented in this report as their primary purpose was to determine the necessary number of heaters to maintain symmetrical heating as well as to clarify the accuracy of two different formulations of the thermal logic available in the 3DEC code. The main conclusions of these simulations were the following:
the accuracy of the analytical formulation is acceptable but the numerical formulation is preferable.
the ideal number of heaters to maintain symmetrical heating is 8 although it can be decreased to 4 at a minimum.
if heater failure occurred the situation could be rectified by switching off 3 other heaters leaving 4 active heaters in a symmetrical arrangement.
the optimal location of the heaters was determined to be 37.5 cm from the hole wall.
This report made use of a three-dimensional computer code (3DEC) developed by Itasca Consulting Group (Itasca 2012). 3DEC was chosen as an appropriate resource for modelling due to its capabilities in both mechanical and thermal calculations as well as its abilities to cope with numerous discontinuities.

7
2 MATERIAL PROPERTIES, IN SITU CONDITIONS AND HEATERS
2.1 Rock mass properties
The rock mass was assumed to be homogeneous, isotropic and linearly elastic with the equivalent properties: density 2635 kg/m3, Young’s modulus 53 GPa and Poisson’s ratio 0.25 (Posiva 2012).
The thermal properties of the rock mass were based on laboratory measurement results specifically for pegmatitic granite (Kukkonen et al. 2011) (table 2-1). The initial in situ temperature of the rock was 13 °C. 2.2 Filling material
The filling material chosen to be best suited to heat conduction was tabular alumina as it was able to restrict the temperature increase in the filling material while causing the targeted thermal stress increase. The thermal properties of the filling material were determined partly by laboratory testing and partly by properties reported by the manufacturer (Almatis 2012) (table 2-2). As the thermal properties of tabular alumina change with temperature the simulation had to exhibit this thermal property evolution as accurately as possible. This was achieved by interpolating the thermal properties at different temperatures and applying the correct properties to the filling according to the local temperature as heating progressed. Table 2-1. Rock thermal properties.
Table 2-2. Filling thermal properties, solid/bulk density and porosity.
Property Pegmatitic granite Units
Thermal Conductivity 3.33 W/(m*K)
Specific heat capacity 716 J/(kg*K)
Diffusivity 1.77 10‐6 m
2 s‐1
Thermal expansion coefficien 9.76 10‐6/°C
Property Filling material: tabular alumina (20°C) Units
Thermal Conductivity 1.586 W/(m*K)
Specific heat capacity 930.7 J/(kg*K)
Diffusivity 0.765 10‐6 m
2 s‐1
Thermal expansion coefficient 5.4 10‐6/°C
Property Filling material: tabular alumina (600°C Units
Thermal Conductivity 0.72 W/(m*K)
Specific heat capacity 1116 J/(kg*K)
Diffusivity 0.293 10‐6 m
2 s‐1
Thermal expansion coefficient 5.4 10‐6/°C
Solid density 3535 kg/m3
Bulk density 1744 kg/m3
Porosity 50.7 % percent
8
2.3 In situ stress and temperature
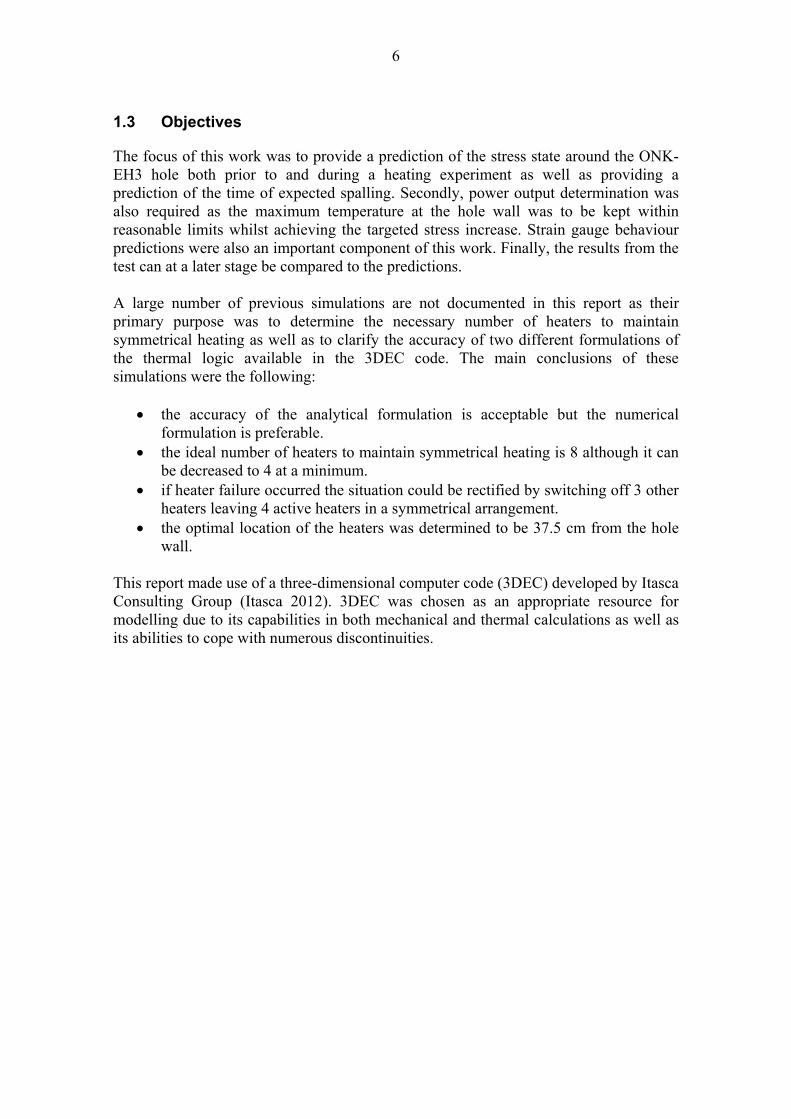
At the time of the predictions the in situ stress state in the vicinity of the POSE niche involved two separate interpretations due to differing stress measurement results from different locations (Figure 2-1). Stress measurements from the access tunnel at chainage 3620 and from the EDZ niche (prior to the expansion of the former EDZ niche into the POSE niche) point to a trend of 166° and a magnitude of 25.1 MPa for the maximum principal stress (appendix 4). Measurement results from the third hole H3 in the POSE niche suggest a trend of 120° and a magnitude of 18.2 MPa (appendix 4). Due to the two differing sets of results, predictions were accomplished using both interpretations. Predictions of the state of stress around the ONK-EH3 hole following excavations point to a magnitude of 46 – 55 MPa for the maximum principal stress (Figure 2-2 and Figure 2-3). As the hole is located largely in pegmatitic granite and its UCS is 102 MPa the estimated spalling strength is thus 58 MPa using a ratio of 57 %. Hence in order to cause spalling an increase of 12 – 20 MPa in the maximum principal stress around the hole is necessary. As the crack damage threshold for pegmatitic granite is approximately 85 ±17 MPa (Posiva 2012) an increase of 56 MPa is required to definitely cause spalling. Thus the goal of heating is to cause an initial increase of 20 MPa with a final target of +40 – 55 MPa. The in situ temperature used in the predictions was set at 13 °C, obtained as an average from measured temperatures acquired from the POSE niche.
Figure 2-1. The trend of the maximum principal stress according to two interpretations: the EDZ/access tunnel trend in red and the ONK-EH3 trend in blue.

9
Figure 2-2. Maximum principal stress on POSE tunnel and H3, the in situ state of stress as according to the results obtained from the EDZ tunnel and the access tunnel LVDT measurements.
Figure 2-3. Maximum principal stress on POSE tunnel and H3, the in situ state of stress as according to the results obtained from H3 LVDT measurements.
10
2.4 Heaters
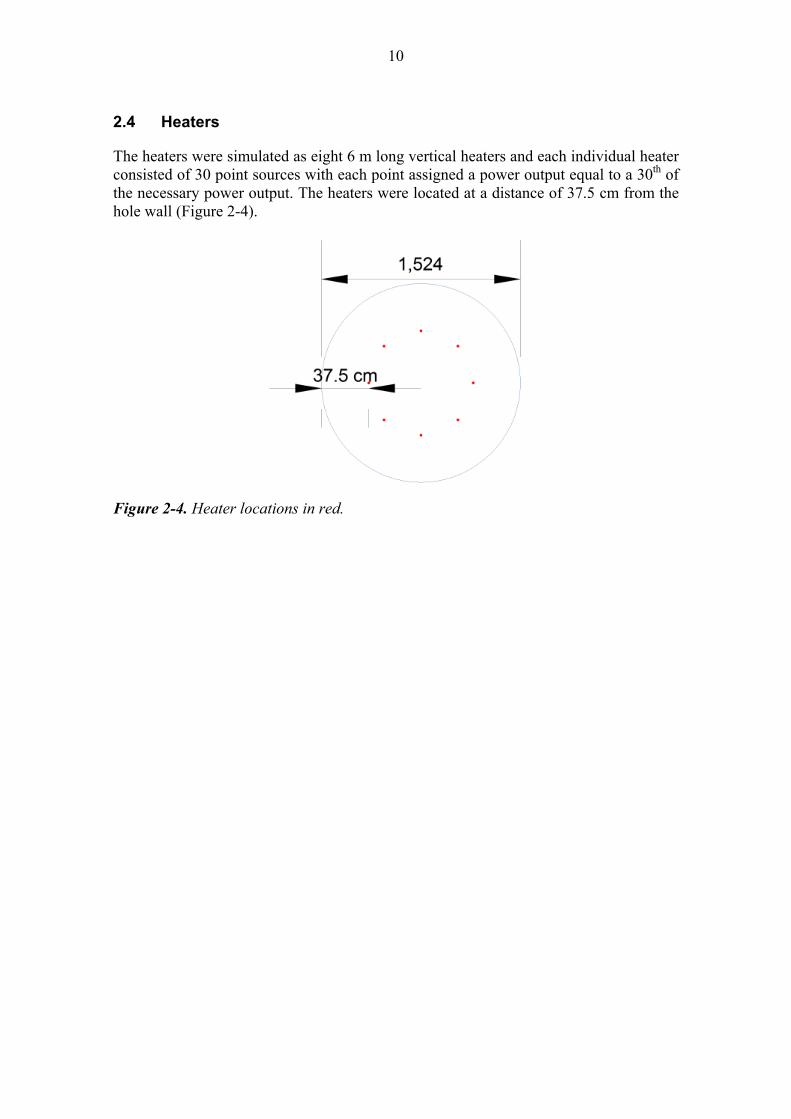
The heaters were simulated as eight 6 m long vertical heaters and each individual heater consisted of 30 point sources with each point assigned a power output equal to a 30th of the necessary power output. The heaters were located at a distance of 37.5 cm from the hole wall (Figure 2-4).
Figure 2-4. Heater locations in red.

11
3 SIMULATION APPROACH
The modeling was done in two stages with the preliminary model described in this chapter which solely accounts for the vicinity of the experiment hole. The third chapter details a full scale model which includes the actual tunnel geometry. 3.1 Goals
The preliminary simulations were to clarify the necessary total power output in order to ensure a thermal stress increase sufficient to induce spalling, as well as providing strain gauge predictions and a prediction of the maximum temperature at the hole wall. Symmetrical heating would ideally cause an increase in the in situ state of stress without affecting the trend of the maximum principal stress. Additionally, the maximum temperature at the center of the hole was not allowed to exceed 100 °C including the in situ temperature (13 °C) during the first three weeks of heating. This was due to concerns over monitoring equipment temperature thresholds during the actual POSE phase 3 experiment as well reaching the estimated spalling strength limit at a sufficiently gradual rate. An additional reason was to ensure that any possible water or moisture had evaporated prior to increasing the power output of the heaters in order to avoid boiling water. The absolute temperature limit at the surface of the hole wall was also limited to 130 °C due to monitoring equipment temperature thresholds at later stages in the experiment. Secondly, the preliminary simulations were to provide estimates of the necessary power outputs necessary to maintain stress increases equal to +20, +30, +40 and +50 MPa as well as demonstrating stress behaviour during cooling. Finally, for simplicity the preliminary simulations excluded the in situ state of stress as the full model geometry would naturally include both in situ stress interpretations. The full scale model improved the accuracy of the predictions by including the POSE niche geometry as well as the two stress state interpretations. 3.2 Approach methodology
As previous simulations had already determined that the numerical formulation was more suited for these simulations a coupled approach was possible hence eliminating the need to separate the mechanical and thermal phases of the simulation. Heating in the models was continued up to 3 months/ 12 weeks. Mechanical boundary conditions were fixed for all model edges whilst temperatures at the boundaries of the model were fixed at 13 °C, excluding the top surface. Previous simulations had already indicated that individual power outputs of 500 W with 8 heaters for 2 weeks and then increasing power to 1000 W was a suitable configuration and hence the preliminary simulations had an accurate initial setup to develop. Unfortunately this situation changed dramatically after the experimental hole had been filled as the porosity of the filling material used in the experiment was determined to be 51 % (section 2.2). This led to a change of approximately 57 % in the original thermal
12
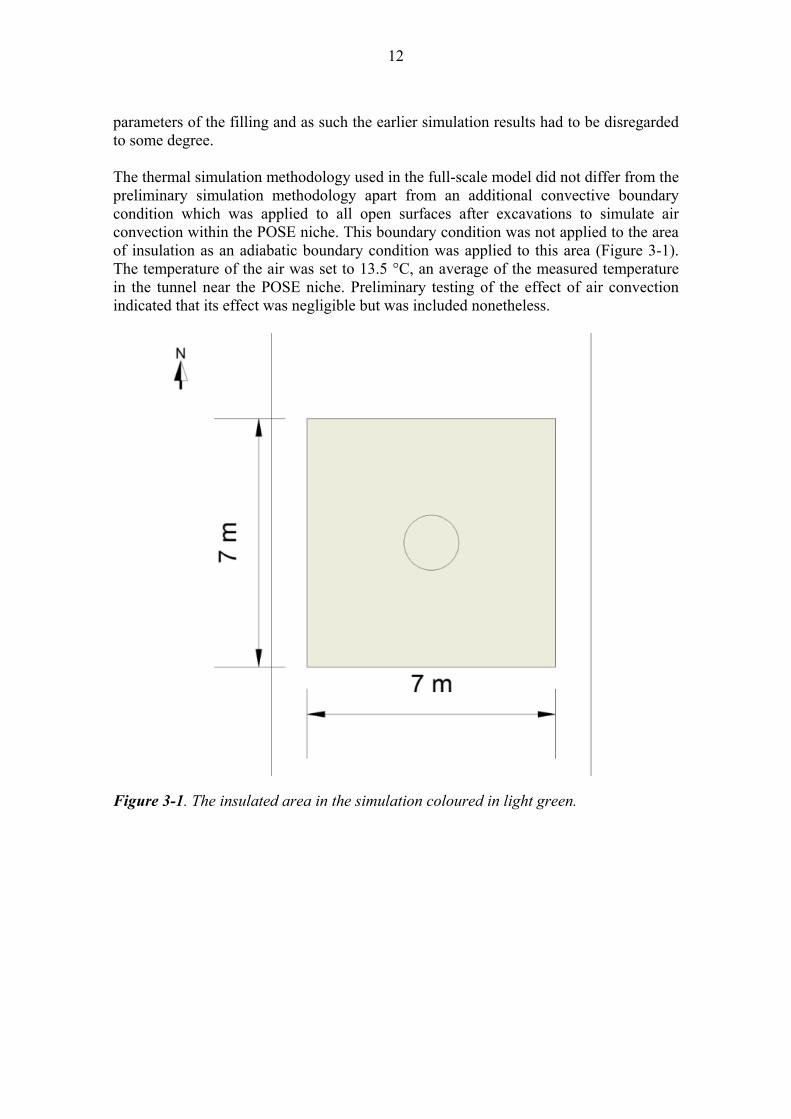
parameters of the filling and as such the earlier simulation results had to be disregarded to some degree. The thermal simulation methodology used in the full-scale model did not differ from the preliminary simulation methodology apart from an additional convective boundary condition which was applied to all open surfaces after excavations to simulate air convection within the POSE niche. This boundary condition was not applied to the area of insulation as an adiabatic boundary condition was applied to this area (Figure 3-1). The temperature of the air was set to 13.5 °C, an average of the measured temperature in the tunnel near the POSE niche. Preliminary testing of the effect of air convection indicated that its effect was negligible but was included nonetheless.
Figure 3-1. The insulated area in the simulation coloured in light green.
13
4 PRELIMINARY SIMULATIONS
4.1 Model geometry
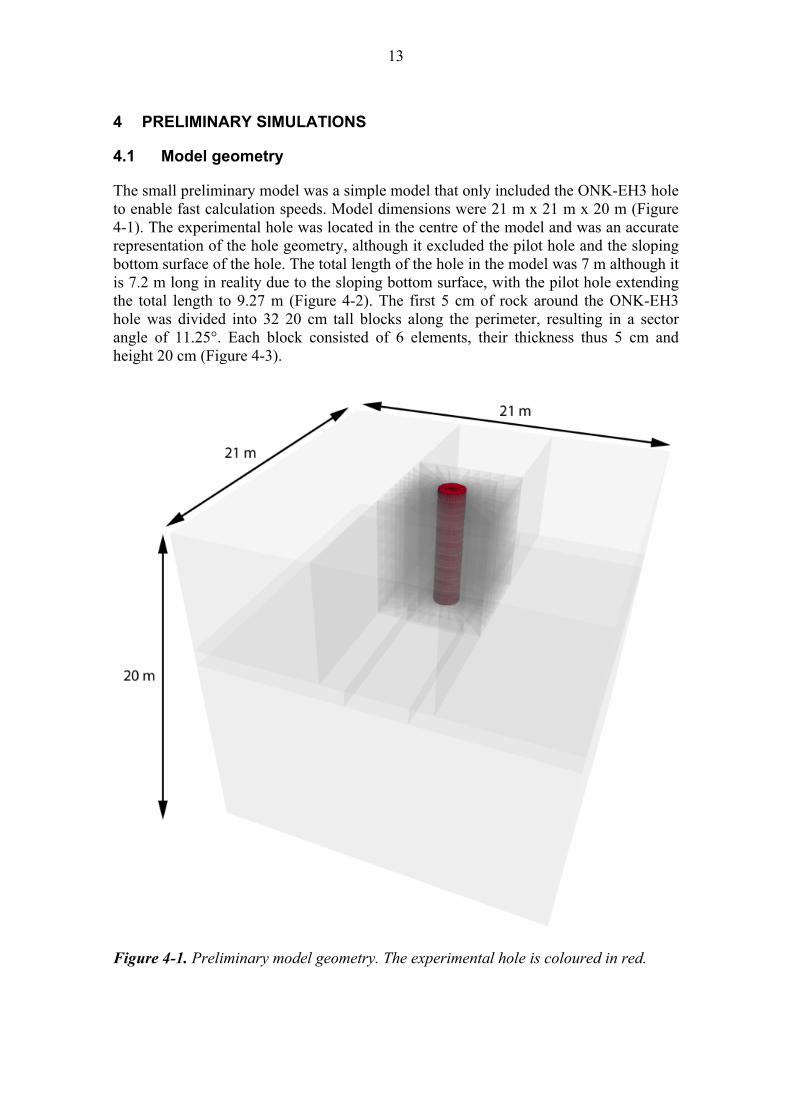
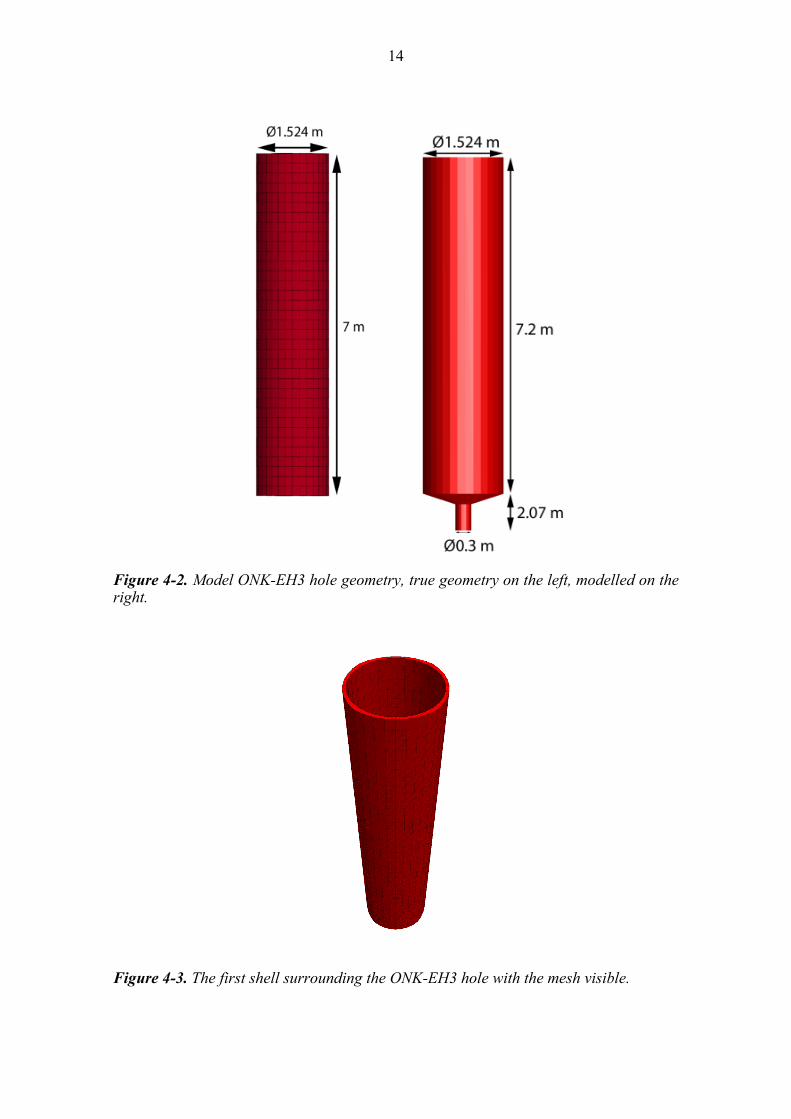
The small preliminary model was a simple model that only included the ONK-EH3 hole to enable fast calculation speeds. Model dimensions were 21 m x 21 m x 20 m (Figure 4-1). The experimental hole was located in the centre of the model and was an accurate representation of the hole geometry, although it excluded the pilot hole and the sloping bottom surface of the hole. The total length of the hole in the model was 7 m although it is 7.2 m long in reality due to the sloping bottom surface, with the pilot hole extending the total length to 9.27 m (Figure 4-2). The first 5 cm of rock around the ONK-EH3 hole was divided into 32 20 cm tall blocks along the perimeter, resulting in a sector angle of 11.25°. Each block consisted of 6 elements, their thickness thus 5 cm and height 20 cm (Figure 4-3).
Figure 4-1. Preliminary model geometry. The experimental hole is coloured in red.
14
Figure 4-2. Model ONK-EH3 hole geometry, true geometry on the left, modelled on the right.
Figure 4-3. The first shell surrounding the ONK-EH3 hole with the mesh visible.
15
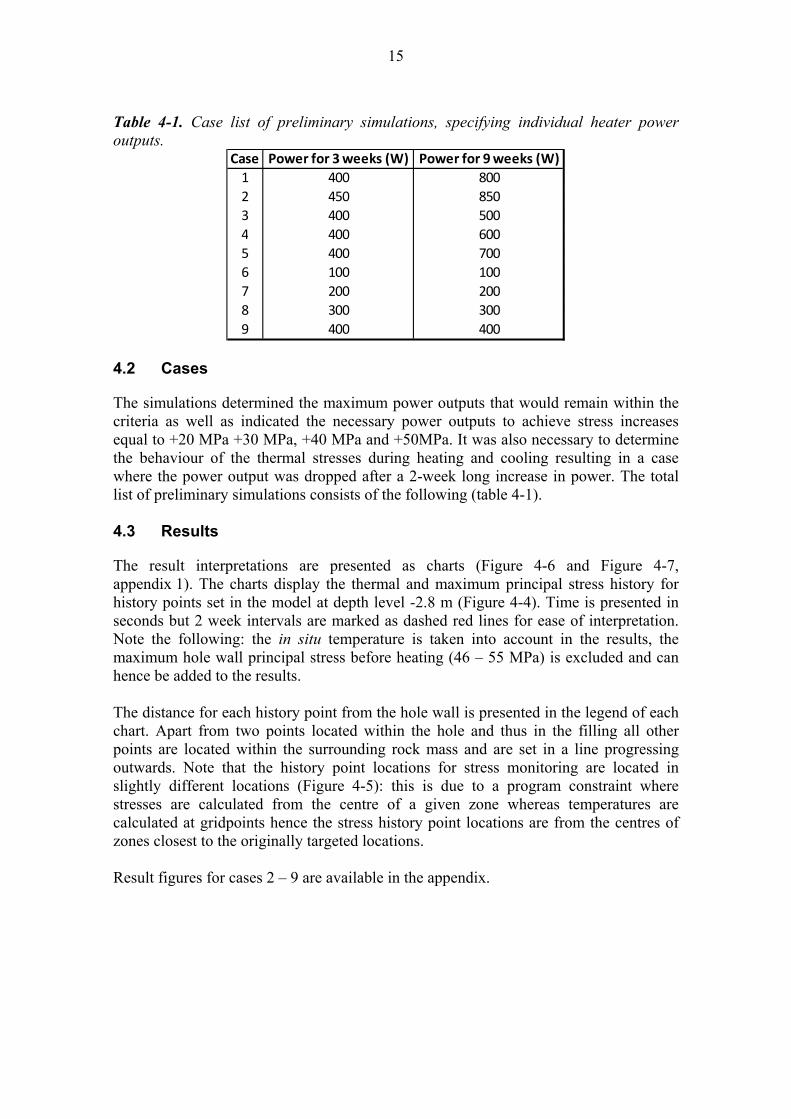
Table 4-1. Case list of preliminary simulations, specifying individual heater power outputs.
4.2 Cases
The simulations determined the maximum power outputs that would remain within the criteria as well as indicated the necessary power outputs to achieve stress increases equal to +20 MPa +30 MPa, +40 MPa and +50MPa. It was also necessary to determine the behaviour of the thermal stresses during heating and cooling resulting in a case where the power output was dropped after a 2-week long increase in power. The total list of preliminary simulations consists of the following (table 4-1). 4.3 Results
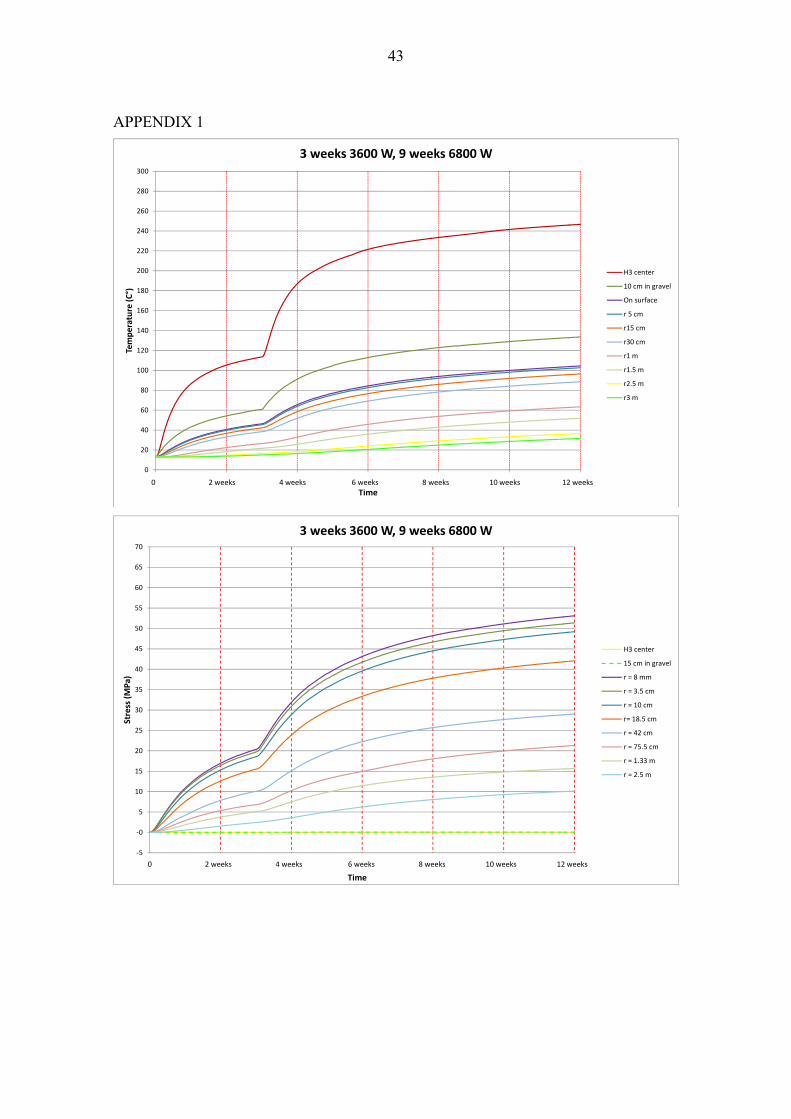
The result interpretations are presented as charts (Figure 4-6 and Figure 4-7, appendix 1). The charts display the thermal and maximum principal stress history for history points set in the model at depth level -2.8 m (Figure 4-4). Time is presented in seconds but 2 week intervals are marked as dashed red lines for ease of interpretation. Note the following: the in situ temperature is taken into account in the results, the maximum hole wall principal stress before heating (46 – 55 MPa) is excluded and can hence be added to the results. The distance for each history point from the hole wall is presented in the legend of each chart. Apart from two points located within the hole and thus in the filling all other points are located within the surrounding rock mass and are set in a line progressing outwards. Note that the history point locations for stress monitoring are located in slightly different locations (Figure 4-5): this is due to a program constraint where stresses are calculated from the centre of a given zone whereas temperatures are calculated at gridpoints hence the stress history point locations are from the centres of zones closest to the originally targeted locations. Result figures for cases 2 – 9 are available in the appendix.
Case Power for 3 weeks (W) Power for 9 weeks (W)
1 400 800
2 450 850
3 400 500
4 400 600
5 400 700
6 100 100
7 200 200
8 300 300
9 400 400

16
Figure 4-4. Temperature history point locations in the model (black points). Corresponding chart ID indicated in the legend.
Figure 4-5. Stress history point locations in the model (black points). Corresponding chart ID indicated in the legend.
17
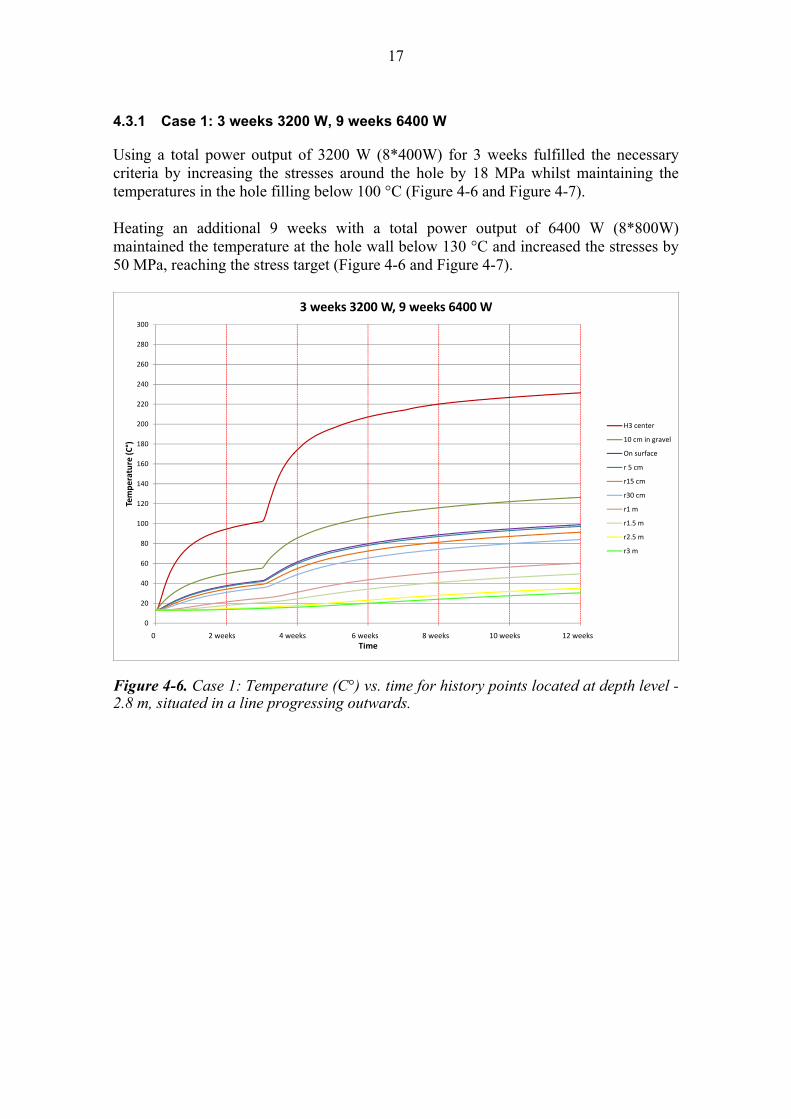
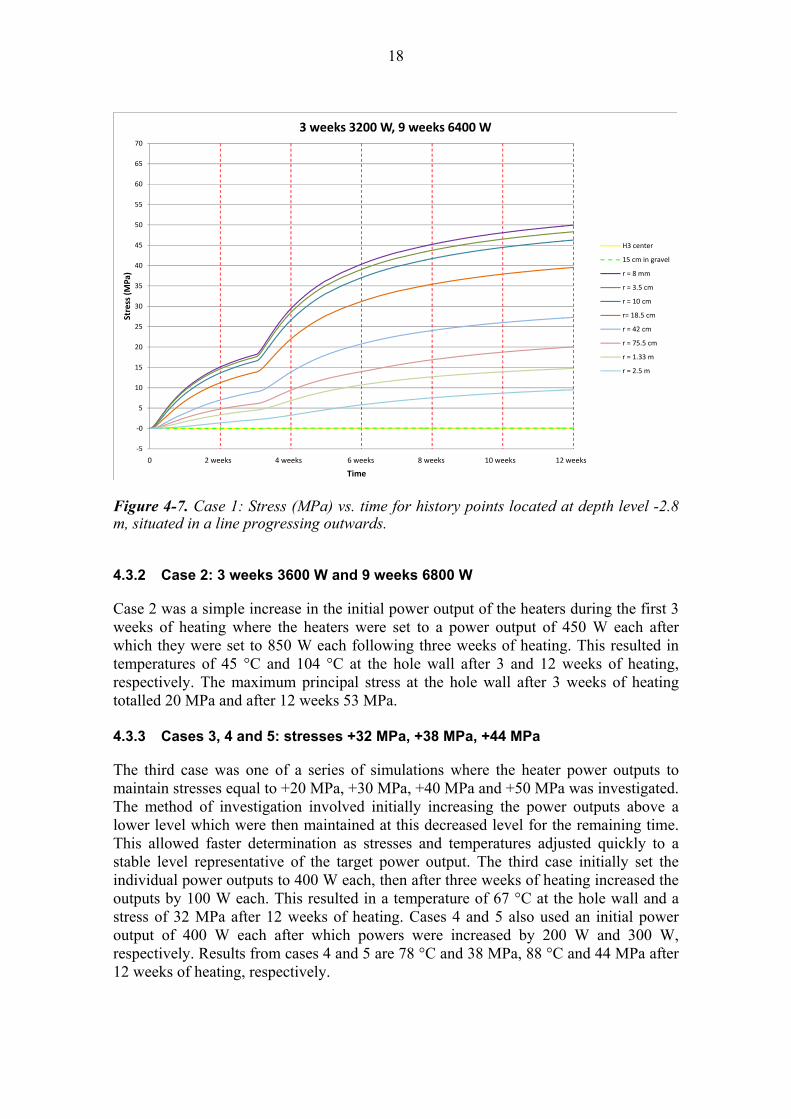
4.3.1 Case 1: 3 weeks 3200 W, 9 weeks 6400 W
Using a total power output of 3200 W (8*400W) for 3 weeks fulfilled the necessary criteria by increasing the stresses around the hole by 18 MPa whilst maintaining the temperatures in the hole filling below 100 °C (Figure 4-6 and Figure 4-7). Heating an additional 9 weeks with a total power output of 6400 W (8*800W) maintained the temperature at the hole wall below 130 °C and increased the stresses by 50 MPa, reaching the stress target (Figure 4-6 and Figure 4-7).
Figure 4-6. Case 1: Temperature (C°) vs. time for history points located at depth level -2.8 m, situated in a line progressing outwards.
0
20
40
60
80
100
120
140
160
180
200
220
240
260
280
300
0.00E+00 1.21E+06 2.42E+06 3.63E+06 4.84E+06 6.05E+06 7.26E+06
Temperature (C°)
Time
3 weeks 3200 W, 9 weeks 6400 W
H3 center
10 cm in gravel
On surface
r 5 cm
r15 cm
r30 cm
r1 m
r1.5 m
r2.5 m
r3 m
0 2 weeks 4 weeks 6 weeks 8 weeks 10 weeks 12 weeks
18
Figure 4-7. Case 1: Stress (MPa) vs. time for history points located at depth level -2.8 m, situated in a line progressing outwards.
4.3.2 Case 2: 3 weeks 3600 W and 9 weeks 6800 W
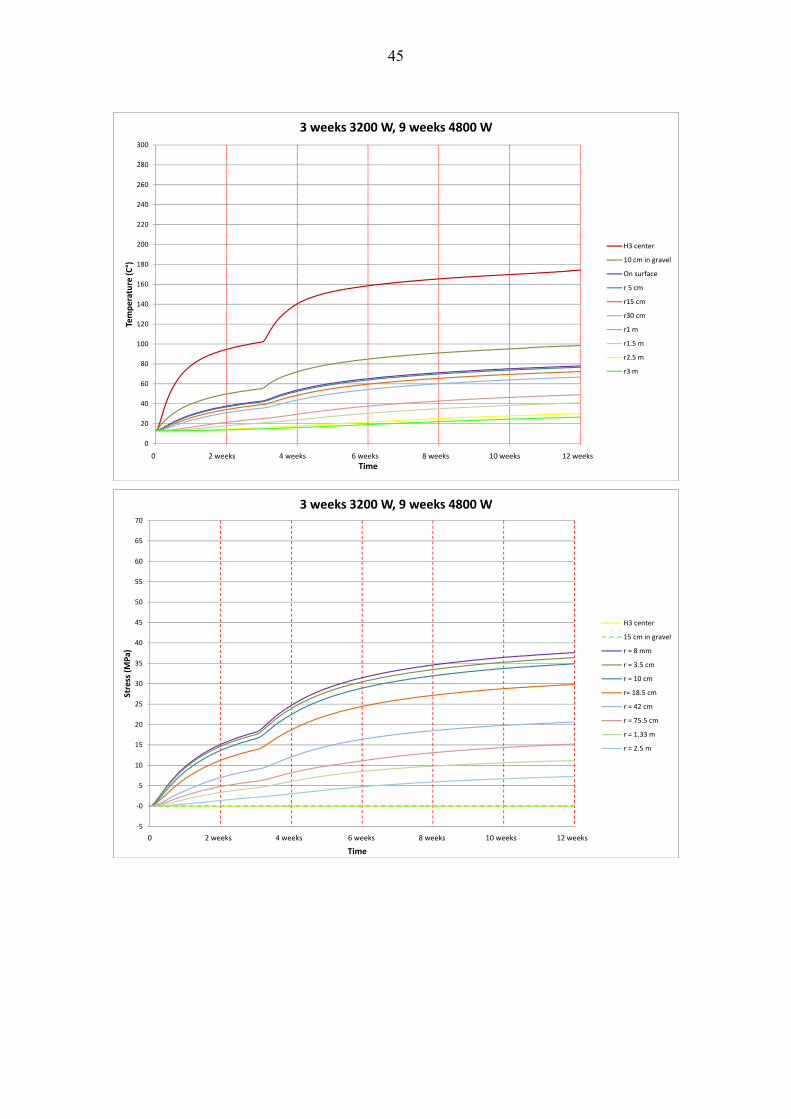
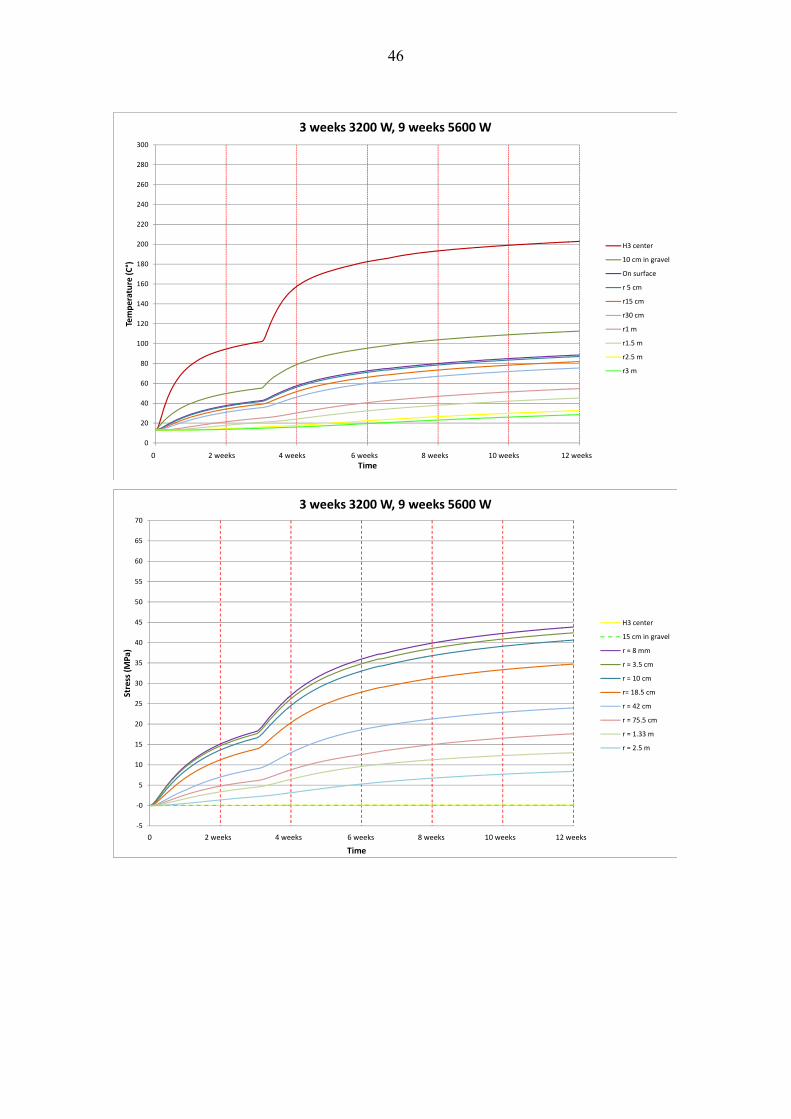
Case 2 was a simple increase in the initial power output of the heaters during the first 3 weeks of heating where the heaters were set to a power output of 450 W each after which they were set to 850 W each following three weeks of heating. This resulted in temperatures of 45 °C and 104 °C at the hole wall after 3 and 12 weeks of heating, respectively. The maximum principal stress at the hole wall after 3 weeks of heating totalled 20 MPa and after 12 weeks 53 MPa. 4.3.3 Cases 3, 4 and 5: stresses +32 MPa, +38 MPa, +44 MPa
The third case was one of a series of simulations where the heater power outputs to maintain stresses equal to +20 MPa, +30 MPa, +40 MPa and +50 MPa was investigated. The method of investigation involved initially increasing the power outputs above a lower level which were then maintained at this decreased level for the remaining time. This allowed faster determination as stresses and temperatures adjusted quickly to a stable level representative of the target power output. The third case initially set the individual power outputs to 400 W each, then after three weeks of heating increased the outputs by 100 W each. This resulted in a temperature of 67 °C at the hole wall and a stress of 32 MPa after 12 weeks of heating. Cases 4 and 5 also used an initial power output of 400 W each after which powers were increased by 200 W and 300 W, respectively. Results from cases 4 and 5 are 78 °C and 38 MPa, 88 °C and 44 MPa after 12 weeks of heating, respectively.
70
65
60
55
50
45
40
35
30
25
20
15
10
5
‐0
‐5
0.00E+00 1.21E+06 2.42E+06 3.63E+06 4.84E+06 6.05E+06 7.26E+06
Stress (MPa)
Time
3 weeks 3200 W, 9 weeks 6400 W
H3 center
15 cm in gravel
r = 8 mm
r = 3.5 cm
r = 10 cm
r= 18.5 cm
r = 42 cm
r = 75.5 cm
r = 1.33 m
r = 2.5 m
0 2 weeks 4 weeks 6 weeks 8 weeks 10 weeks 12 weeks 0 2 weeks 4 weeks 6 weeks 8 weeks 10 weeks 12 weeks
19
4.3.4 Cases 6 – 9
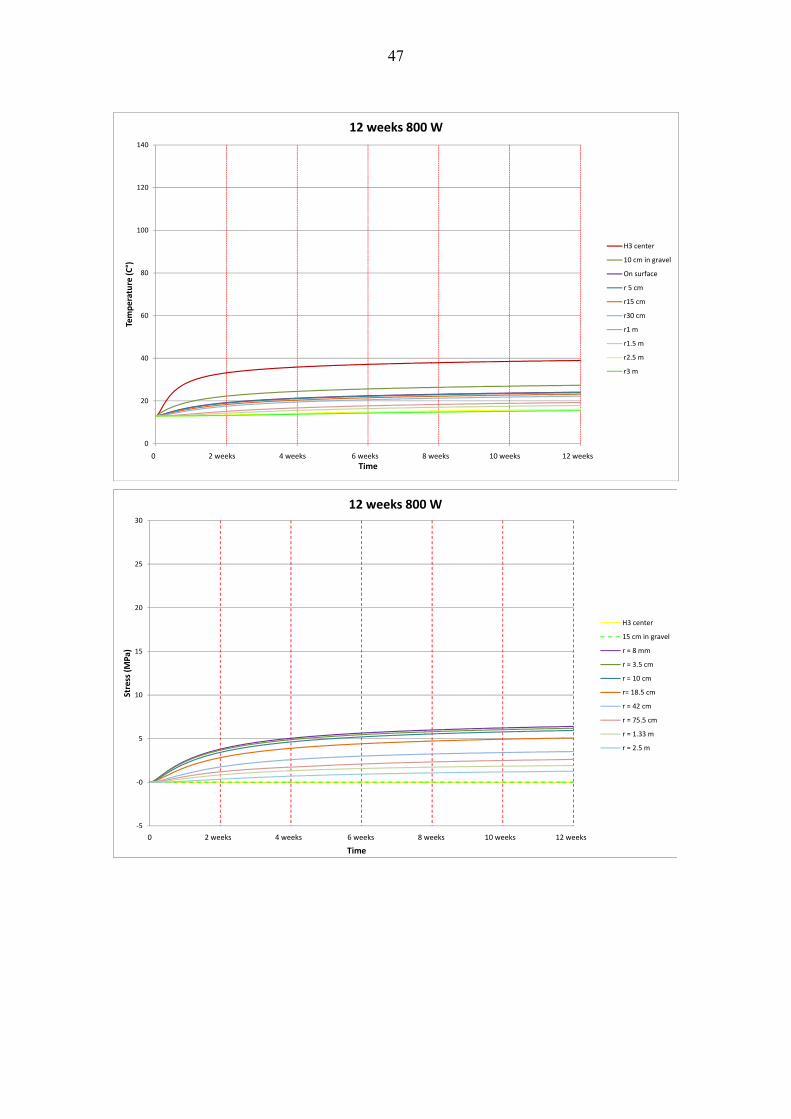
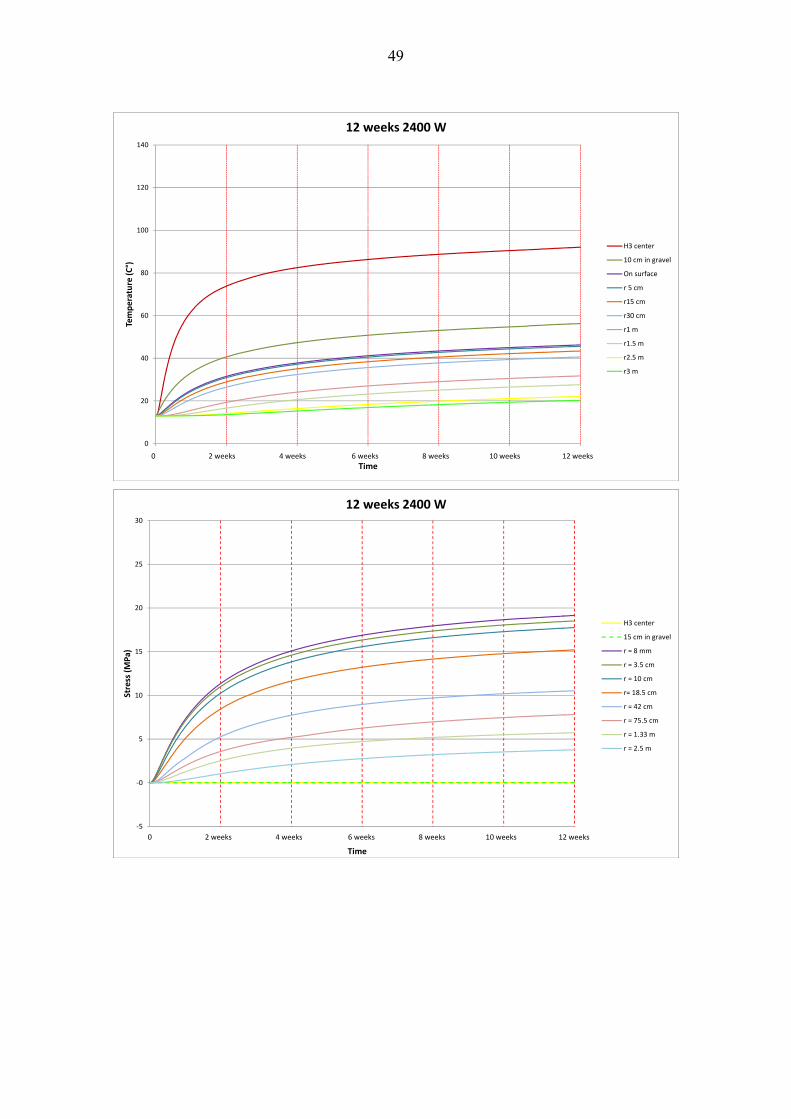
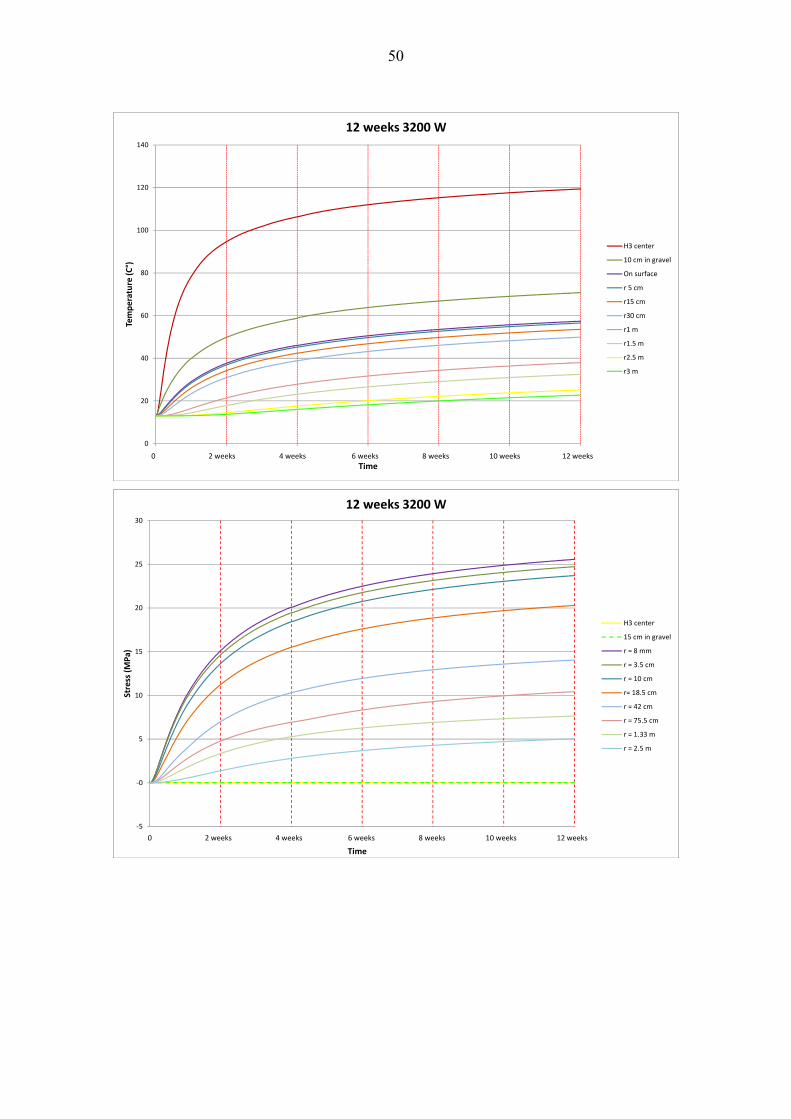
Case 6 – 9 maintained constant power outputs per heater for all 12 weeks. These cases were designed to provide additional accuracy in the prediction of the stress and temperature increases when using different power outputs maintained at constant levels. Their additional use was to provide estimates of the power required to maintain stable stresses if heating had to be decreased at a given time due to excessive acoustic emission events. Note that charts for these cases use temperature and stress scales slightly different to those seen prior to this. The results at the hole wall after 12 weeks are as follows:
Case 6: power 100 W, temperature 24 °C, stress 6 MPa Case 7: power 200 W, temperature 35 °C, stress 13 MPa Case 8: power 300 W, temperature 46 °C, stress 19 MPa Case 9: power 400 W, temperature 57 °C, stress 26 MPa
4.4 Preliminary simulation conclusions
The preliminary study was able to verify the following points:
the power output of the heaters should be set to 400 W each when using 8 heaters as the maximum temperature in the filling at a depth level of -2.8 can then be kept at approximately 100 °C during the first three weeks of heating. The later increase in power to 800 W is also sufficient as it causes a satisfactory stress increase of approximately 55 MPa at maximum at the hole wall (Figure 4-8).
the distance of the heaters from the hole wall should be 37.5 cm in order to create a symmetrical thermal stress field using 4 or 8 heaters whilst maintaining the temperature of the filling below a maximum of 130 °C.
the temperature at the hole wall will remain below the limit of 130 °C imposed by the strain gauge temperature thresholds even after 12 weeks of heating (Figure 4-8).
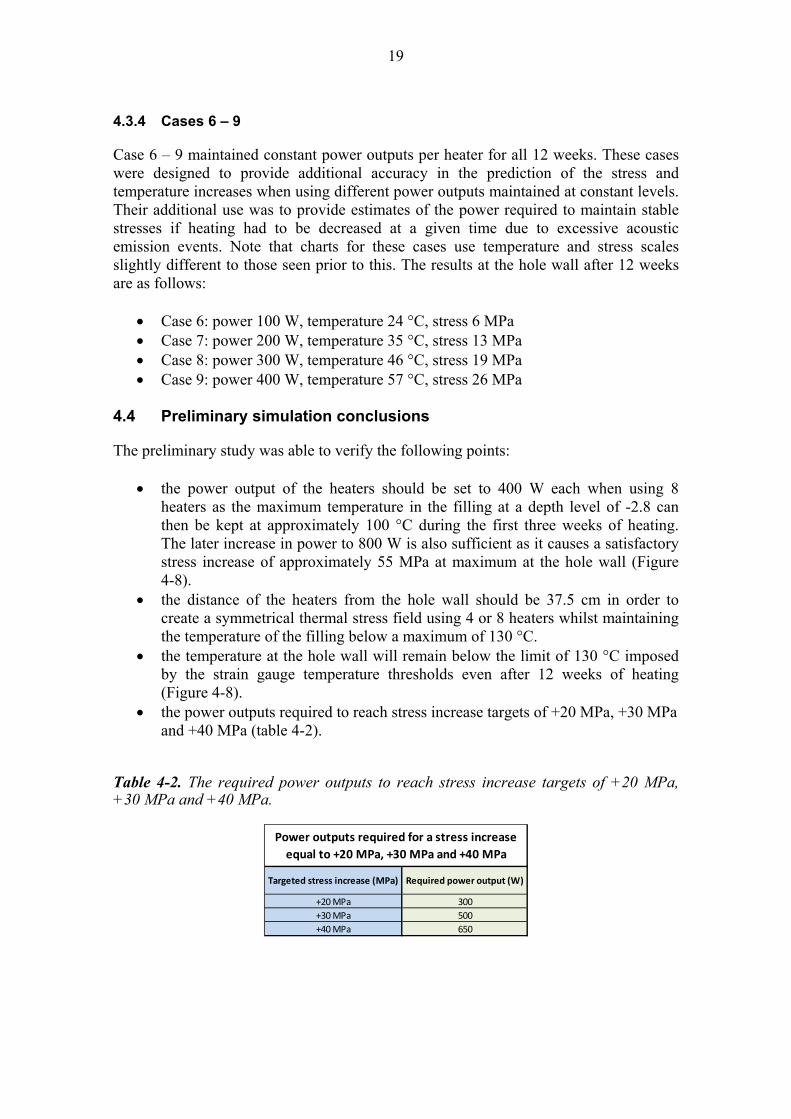
the power outputs required to reach stress increase targets of +20 MPa, +30 MPa and +40 MPa (table 4-2).
Table 4-2. The required power outputs to reach stress increase targets of +20 MPa, +30 MPa and +40 MPa.
+20 MPa 300
+30 MPa 500
+40 MPa 650
Targeted stress increase (MPa) Required power output (W)
Power outputs required for a stress increase
equal to +20 MPa, +30 MPa and +40 MPa
20
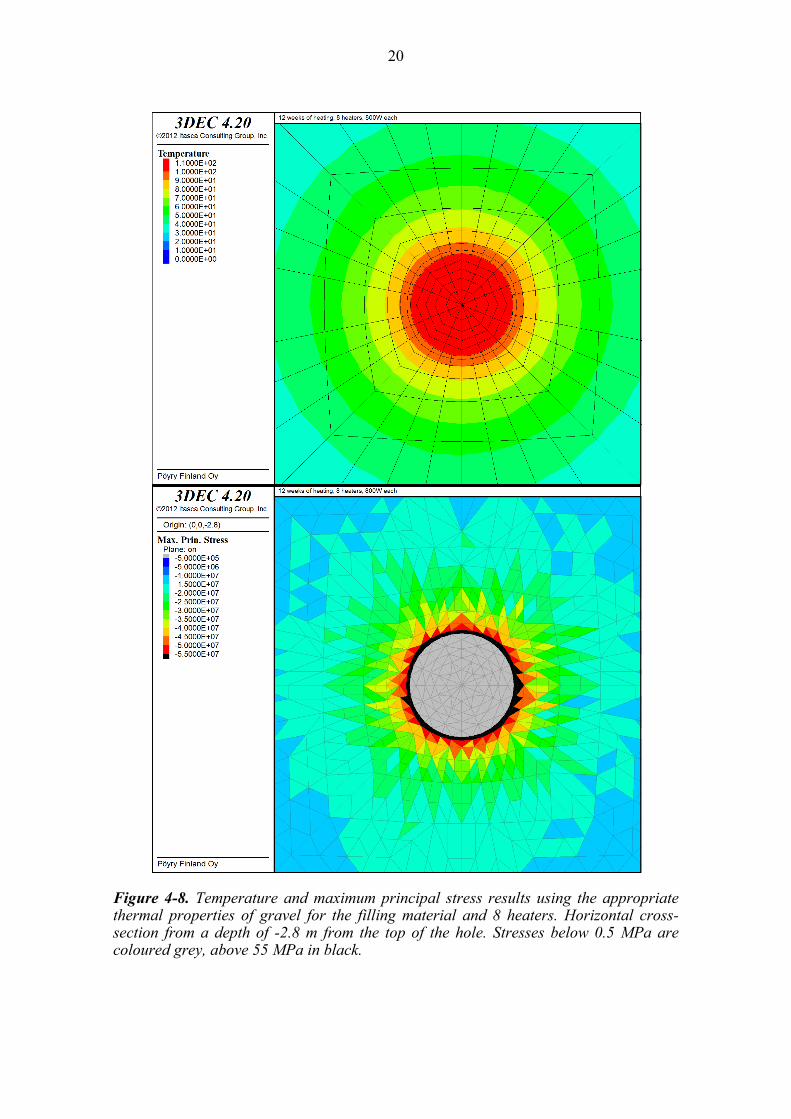
Figure 4-8. Temperature and maximum principal stress results using the appropriate thermal properties of gravel for the filling material and 8 heaters. Horizontal cross-section from a depth of -2.8 m from the top of the hole. Stresses below 0.5 MPa are coloured grey, above 55 MPa in black.
21
5 FULL SCALE MODEL
5.1 Purpose
The full scale model includes included the actual tunnel geometry and in situ stresses. Hence the full scale model provides results that are more realistic / site specific than the preliminary model. As the in situ stress state in the full scale model was to be based on the latest stress measurements from the ONKALO, two model variants were created (section 5.5.2 and 5.5.3). 5.2 Model geometry
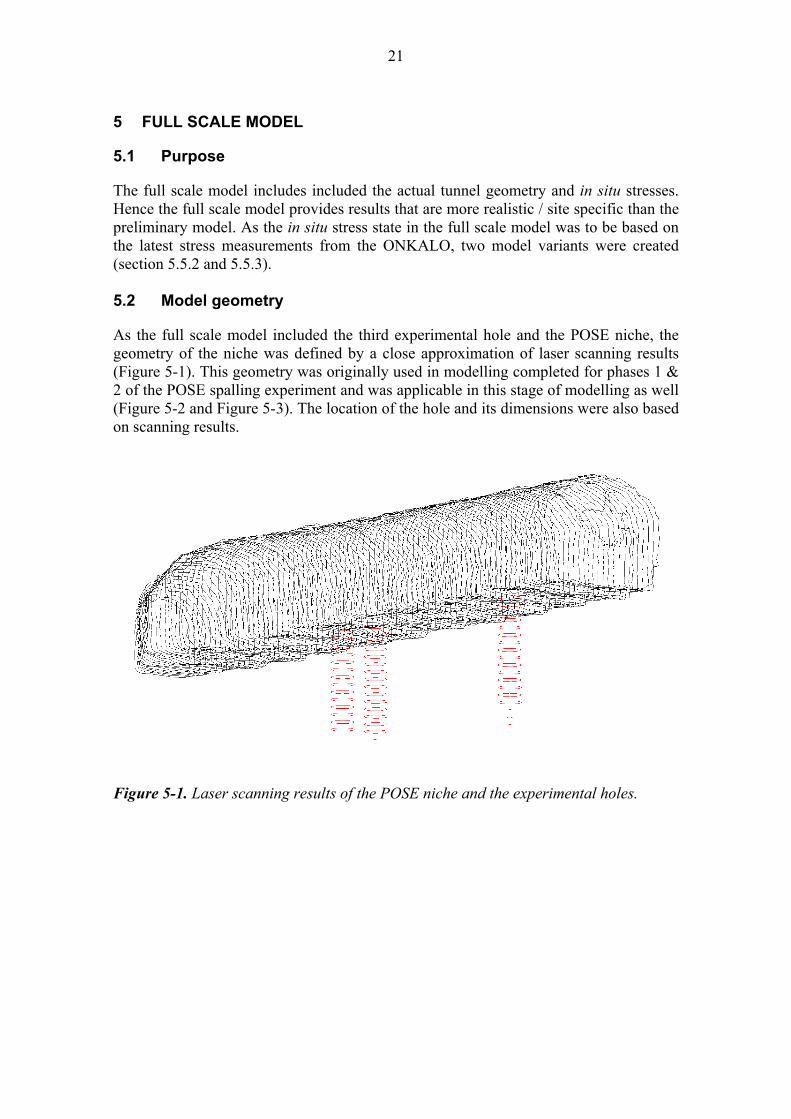
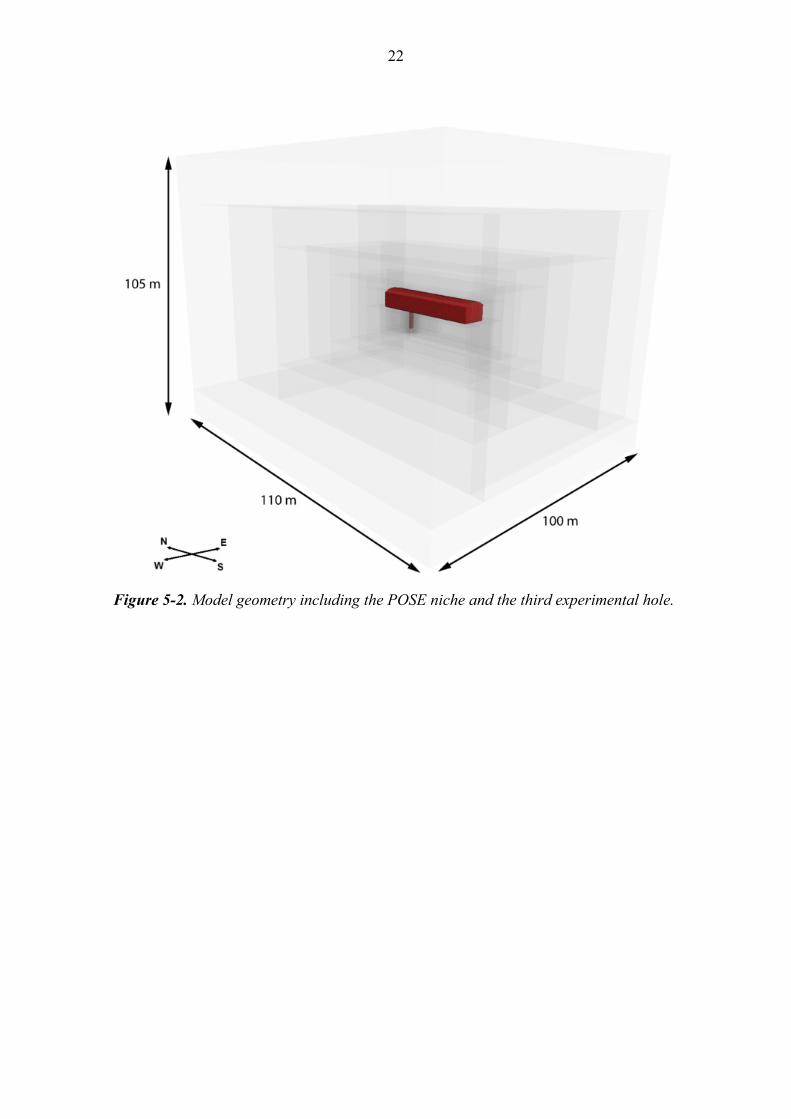
As the full scale model included the third experimental hole and the POSE niche, the geometry of the niche was defined by a close approximation of laser scanning results (Figure 5-1). This geometry was originally used in modelling completed for phases 1 & 2 of the POSE spalling experiment and was applicable in this stage of modelling as well (Figure 5-2 and Figure 5-3). The location of the hole and its dimensions were also based on scanning results.
Figure 5-1. Laser scanning results of the POSE niche and the experimental holes.
22
Figure 5-2. Model geometry including the POSE niche and the third experimental hole.
23
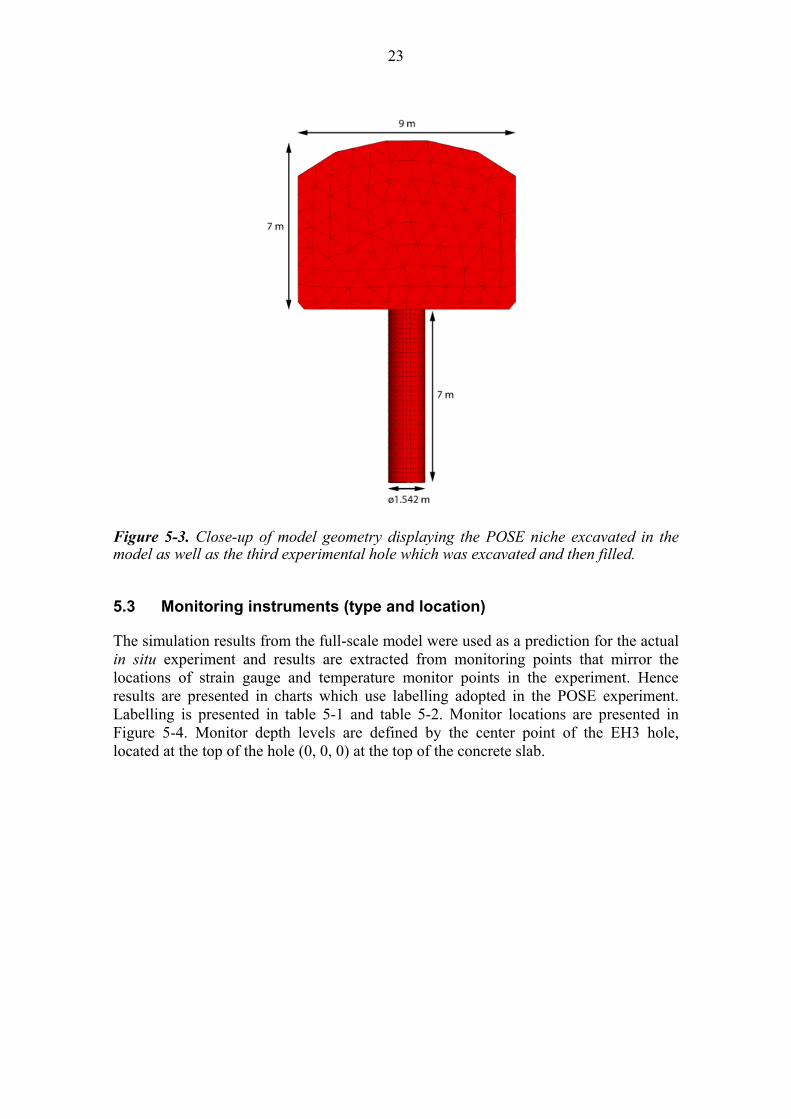
Figure 5-3. Close-up of model geometry displaying the POSE niche excavated in the model as well as the third experimental hole which was excavated and then filled.
5.3 Monitoring instruments (type and location)
The simulation results from the full-scale model were used as a prediction for the actual in situ experiment and results are extracted from monitoring points that mirror the locations of strain gauge and temperature monitor points in the experiment. Hence results are presented in charts which use labelling adopted in the POSE experiment. Labelling is presented in table 5-1 and table 5-2. Monitor locations are presented in Figure 5-4. Monitor depth levels are defined by the center point of the EH3 hole, located at the top of the hole (0, 0, 0) at the top of the concrete slab.

24
Table 5-1. Temperature monitor labelling used in the 3rd phase of the POSE experiment. TP and PT are temperature monitors whilst SG indicates strain gauges. The red background indicates monitors situated in the experimental hole, the green background monitors located in monitoring holes, the blue background strain gauge monitors. If the orientation is not specified then the monitor is located at the center of the hole.
Hole ID Monitor type Monitor depth Orientation Monitor ID
EH3 TP 0 ‐ EH3‐TP+0
EH3 TP ‐0.3 ‐ EH3‐TP‐0.3
EH3 TP ‐0.5 0 EH3‐TP‐0.5‐0°
EH3 TP ‐0.5 270 EH3‐TP‐0.5‐270°
EH3 TP ‐0.5 135 EH3‐TP‐0.5‐135°
EH3 TP ‐1.5 0 EH3‐TP‐1.5‐0°
EH3 TP ‐1.5 270 EH3‐TP‐1.5‐270°
EH3 TP ‐3 0 EH3‐TP‐3‐0°
EH3 TP ‐3 45 EH3‐TP‐3‐45°
EH3 TP ‐3 90 EH3‐TP‐3‐90°
EH3 TP ‐3 90 EH3‐TP‐3‐90°‐EXTRA
EH3 TP ‐3 135 EH3‐TP‐3‐135°
EH3 TP ‐3 180 EH3‐TP‐3‐180°
EH3 TP ‐3 225 EH3‐TP‐3‐225°
EH3 TP ‐3 270 EH3‐TP‐3‐270°
EH3 TP ‐3 315 EH3‐TP‐3‐315°
EH3 TP ‐4.5 0 EH3‐TP‐4.5‐0°
EH3 TP ‐4.5 270 EH3‐TP‐4.5‐270°
EH3 TP ‐9 143 EH3‐TP‐9‐143°
EH3 TP ‐9 323 EH3‐TP‐9‐323°
PP261 PT ‐3 ‐ PP261‐PT‐3
PP261 PT ‐6 ‐ PP261‐PT‐6
PP340 PT 0.3 ‐ PP340‐PT+0.3
PP340 PT 0 ‐ PP340‐PT+0
PP340 PT ‐3 ‐ PP340‐PT‐3
PP340 PT ‐6 ‐ PP340‐PT‐6
PP340 PT ‐10 ‐ PP340‐PT‐10
PP345 PT 0.3 ‐ PP345‐PT+0.3
PP345 PT 0 ‐ PP345‐PT+0
PP345 PT ‐1.5 ‐ PP345‐PT‐1.5
PP345 PT ‐3 ‐ PP345‐PT‐3
PP345 PT ‐4.5 ‐ PP345‐PT‐4.5
PP345 PT ‐6 ‐ PP345‐PT‐6
PP345 PT ‐10 ‐ PP345‐PT‐10
PP346 PT 0.3 ‐ PP346‐PT+0.3
PP346 PT 0 ‐ PP346‐PT+0
PP346 PT ‐3 ‐ PP346‐PT‐3
PP346 PT ‐6 ‐ PP346‐PT‐6
PP346 PT ‐10 ‐ PP346‐PT‐10
PP341 PT 0.3 ‐ PP341‐PT+0.3
PP341 PT 0 ‐ PP341‐PT+0
PP341 PT ‐1.5 ‐ PP341‐PT‐1.5
PP341 PT ‐3 ‐ PP341‐PT‐3
PP341 PT ‐4.5 ‐ PP341‐PT‐4.5
PP341 PT ‐6 ‐ PP341‐PT‐6
PP341 PT ‐10 ‐ PP341‐PT‐10

25
Table 5-2. Strain monitor labelling used in the 3rd phase of the POSE experiment.
Hole IDMonitor type Monitor depth Orientation Monitor ID
EH3 SG‐R ‐3 53 EH3‐SG‐R‐3‐53°‐T
EH3 SG‐R ‐3 53 EH3‐SG‐R‐3‐53°‐V
EH3 SG‐R ‐3 53 EH3‐SG‐R‐3‐53°‐I
EH3 SG‐R ‐3 53 EH3‐SG‐R‐3‐53°‐tem‐pre
EH3 SG ‐3 143 EH3‐SG‐3‐143°
EH3 SG ‐3 143 EH3‐SG‐3‐143°‐tem
EH3 SG ‐3 203 EH3‐SG‐3‐203°
EH3 SG ‐3 203 EH3‐SG‐3‐203°‐tem
EH3 SG ‐3 263 EH3‐SG‐3‐263°
EH3 SG ‐3 263 EH3‐SG‐3‐263°‐tem
EH3 SG‐R ‐3 300 EH3‐SG‐R‐3‐300°‐T
EH3 SG‐R ‐3 300 EH3‐SG‐R‐3‐300°‐V
EH3 SG‐R ‐3 300 EH3‐SG‐R‐3‐300°‐I
EH3 SG‐R ‐3 300 EH3‐SG‐R‐3‐300°‐tem
EH3 SG‐R ‐3 346 EH3‐SG‐R‐3‐346°‐T
EH3 SG‐R ‐3 346 EH3‐SG‐R‐3‐346°‐V
EH3 SG‐R ‐3 346 EH3‐SG‐R‐3‐346°‐I
EH3 SG‐R ‐3 346 EH3‐SG‐R‐3‐346°‐tem
EH3 SG ‐6 23 EH3‐SG‐6‐23°
EH3 SG ‐6 23 EH3‐SG‐6‐23°‐tem‐pre
EH3 SG‐R ‐6 83 EH3‐SG‐R‐6‐83°‐T
EH3 SG‐R ‐6 83 EH3‐SG‐R‐6‐83°‐V
EH3 SG‐R ‐6 83 EH3‐SG‐R‐6‐83°‐I
EH3 SG‐R ‐6 83 EH3‐SG‐R‐6‐83°‐tem
EH3 SG ‐6 143 EH3‐SG‐6‐143°
EH3 SG ‐6 143 EH3‐SG‐6‐143°‐tem
EH3 SG‐R ‐6 203 EH3‐SG‐R‐6‐203°‐T
EH3 SG‐R ‐6 203 EH3‐SG‐R‐6‐203°‐V
EH3 SG‐R ‐6 203 EH3‐SG‐R‐6‐203°‐I
EH3 SG‐R ‐6 203 EH3‐SG‐R‐6‐203°‐tem
EH3 SG ‐6 263 EH3‐SG‐6‐263°
EH3 SG ‐6 263 EH3‐SG‐6‐263°‐tem
EH3 SG‐R ‐6 323 EH3‐SG‐R‐6‐323°‐T
EH3 SG‐R ‐6 323 EH3‐SG‐R‐6‐323°‐V
EH3 SG‐R ‐6 323 EH3‐SG‐R‐6‐323°‐I
EH3 SG‐R ‐6 323 EH3‐SG‐R‐6‐323°‐tem
EH3 SG ‐DUMMY1‐1 ‐ EH3‐SG‐DUMMY1‐1
EH3 SG ‐DUMMY1‐2 ‐ EH3‐SG‐DUMMY1‐2
EH3 SG ‐DUMMY1‐3 ‐ EH3‐SG‐DUMMY1‐3
EH3 SG ‐DUMMY1‐tem ‐ EH3‐SG‐DUMMY1‐tem
EH3 SG ‐1.4 135 EH3‐SG‐1.4‐135°
EH3 SG ‐4.5 317 EH3‐SG‐4.5‐317°
EH3 SG ‐5.4 354 EH3‐SG‐5.4‐354°
26
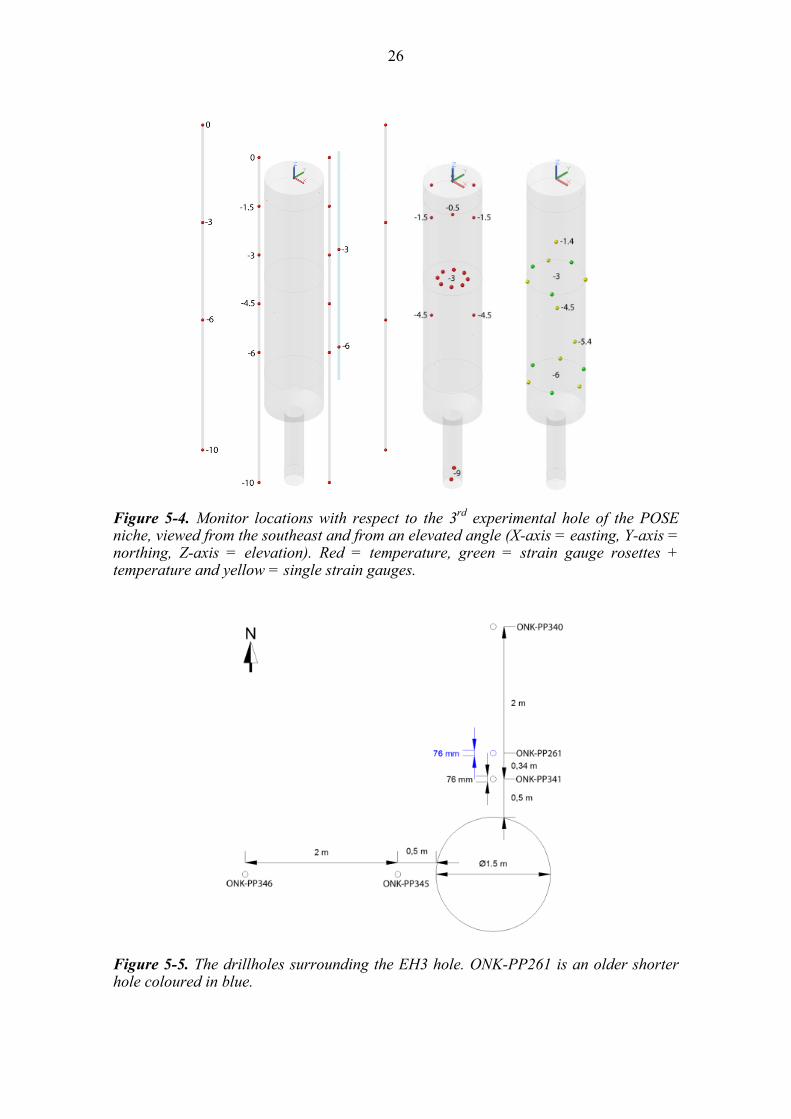
Figure 5-4. Monitor locations with respect to the 3rd experimental hole of the POSE niche, viewed from the southeast and from an elevated angle (X-axis = easting, Y-axis = northing, Z-axis = elevation). Red = temperature, green = strain gauge rosettes + temperature and yellow = single strain gauges.
Figure 5-5. The drillholes surrounding the EH3 hole. ONK-PP261 is an older shorter hole coloured in blue.
27
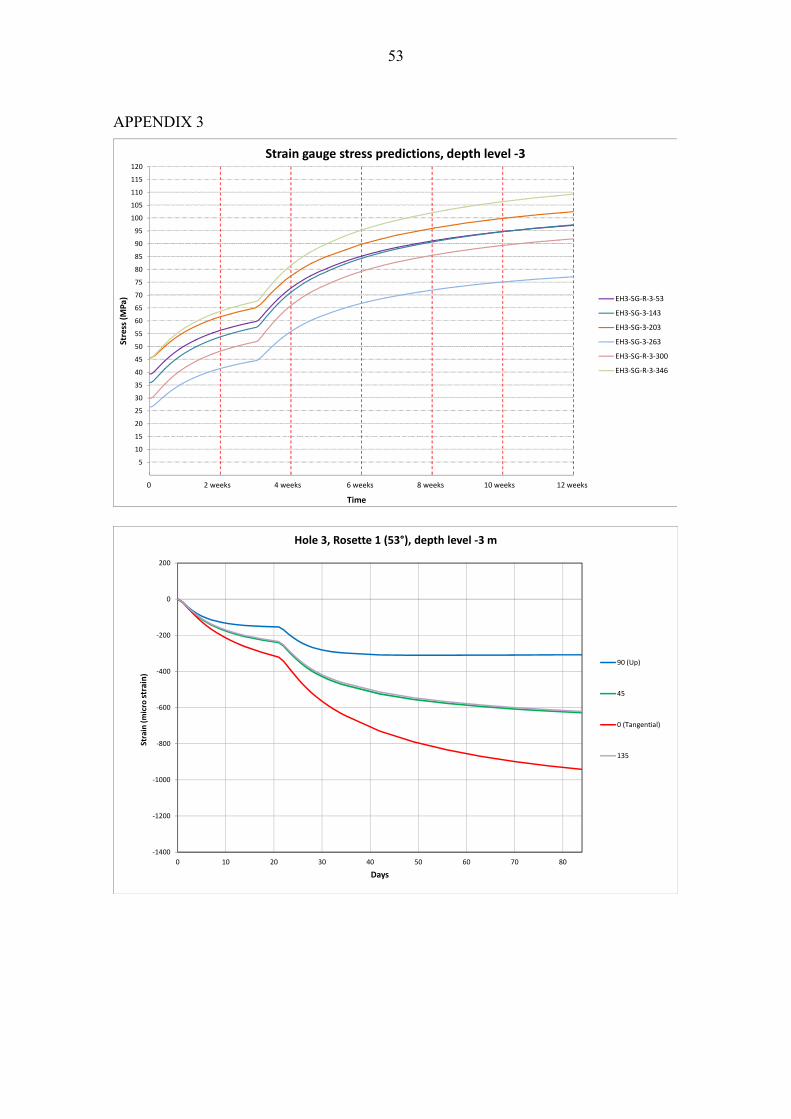
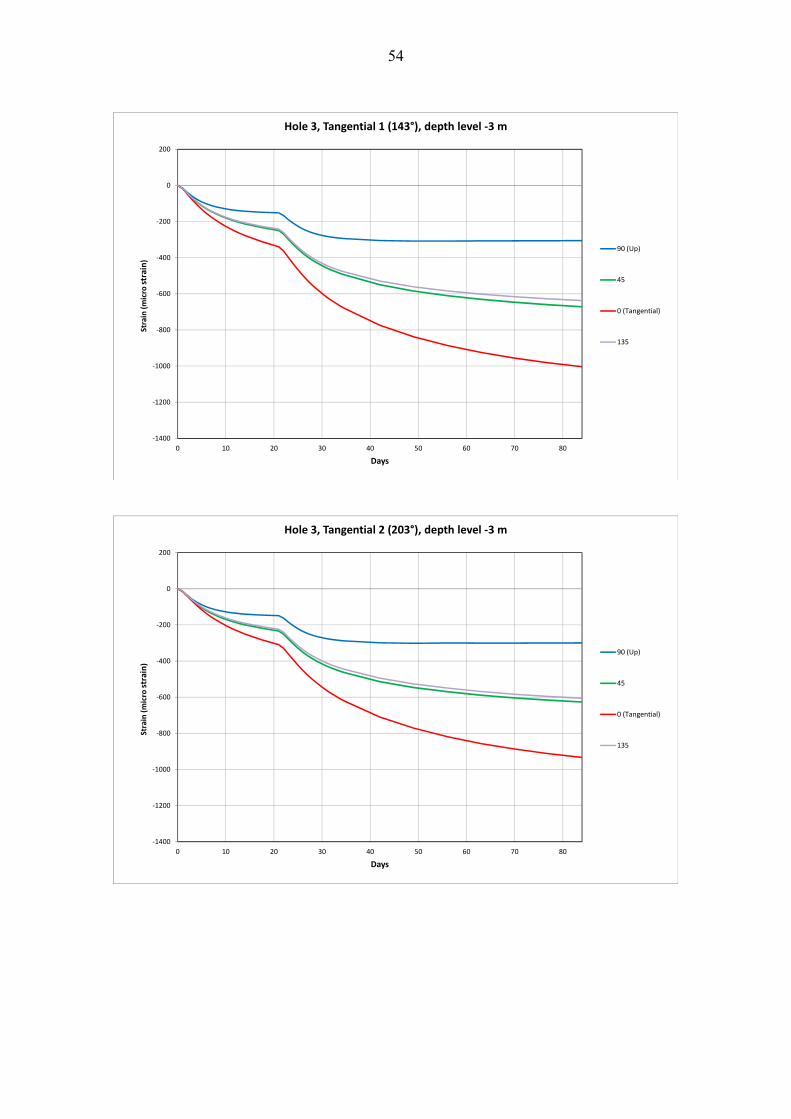
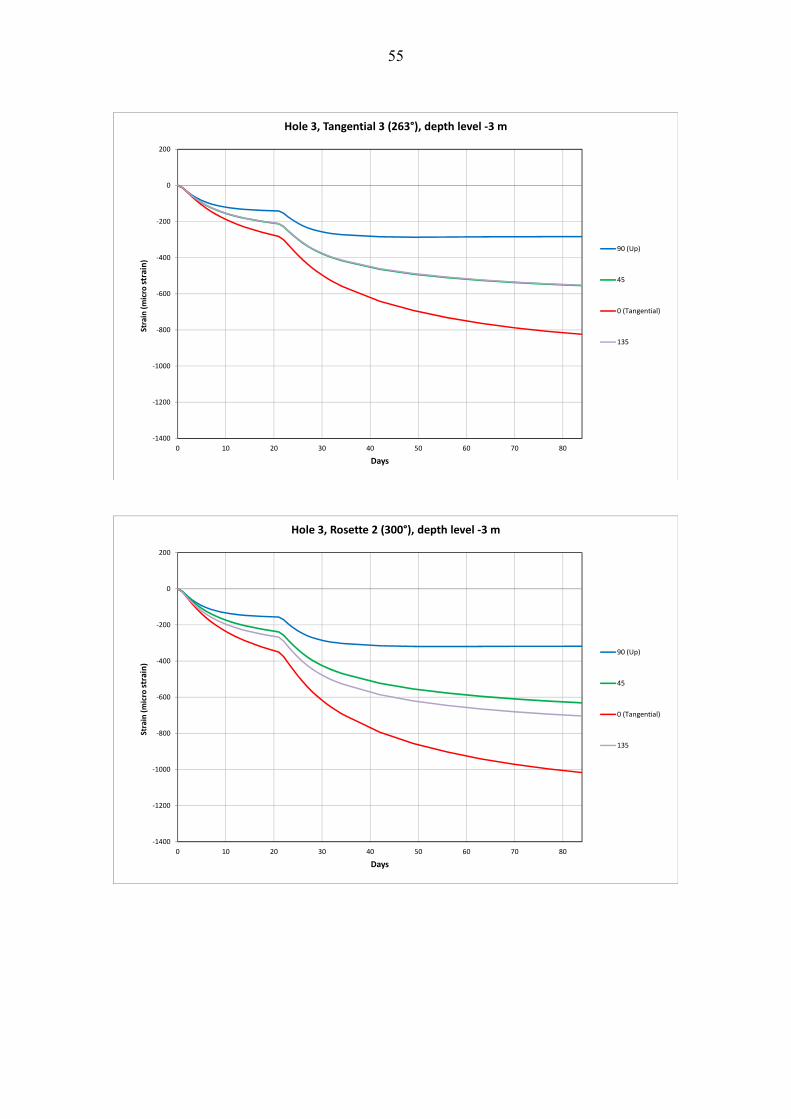
5.4 Strain calculation
The strain predictions are calculated from the elastic stress evolutions on the surface of the hole caused by heating. The strains are calculated in the cylinder coordinate system of the hole and in the direction of each strain gauge. 5.5 Results
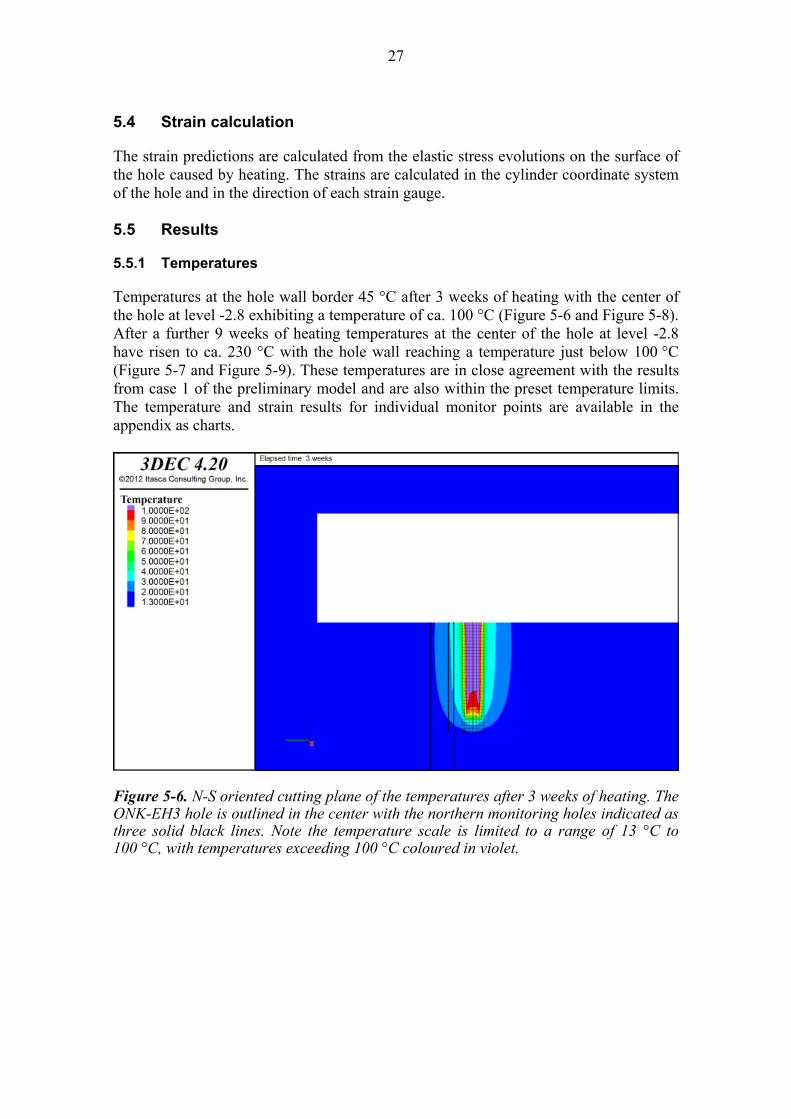
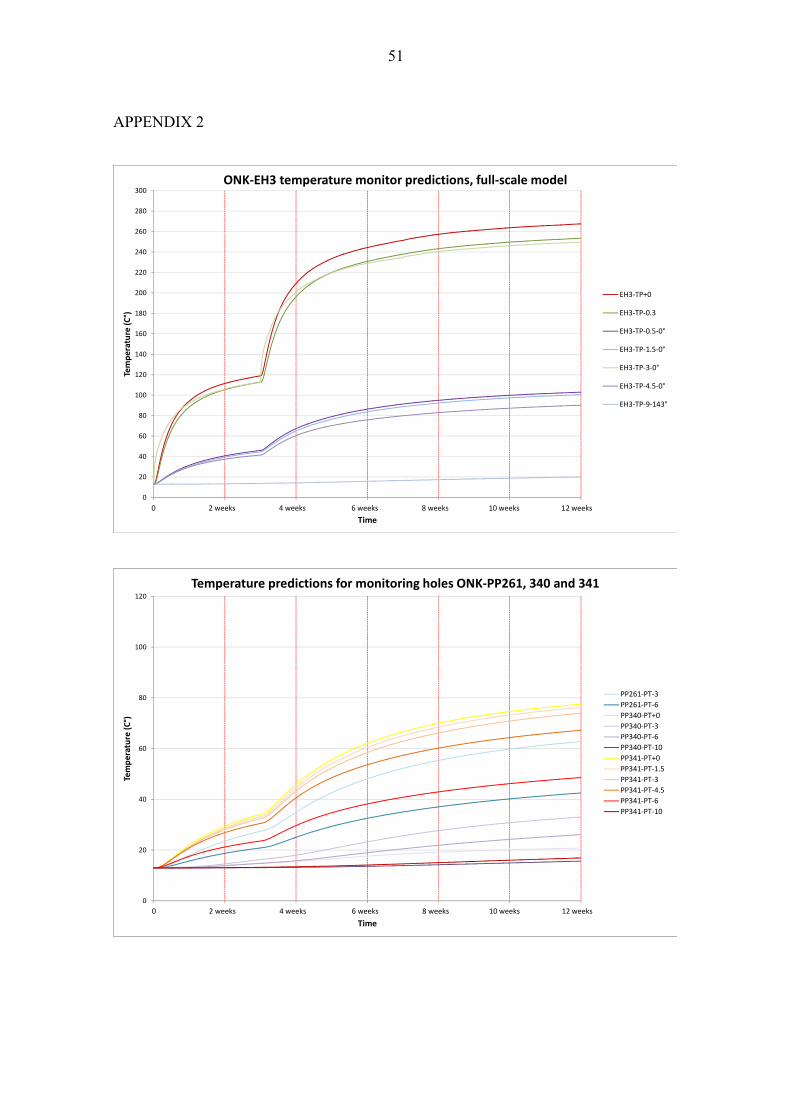
5.5.1 Temperatures
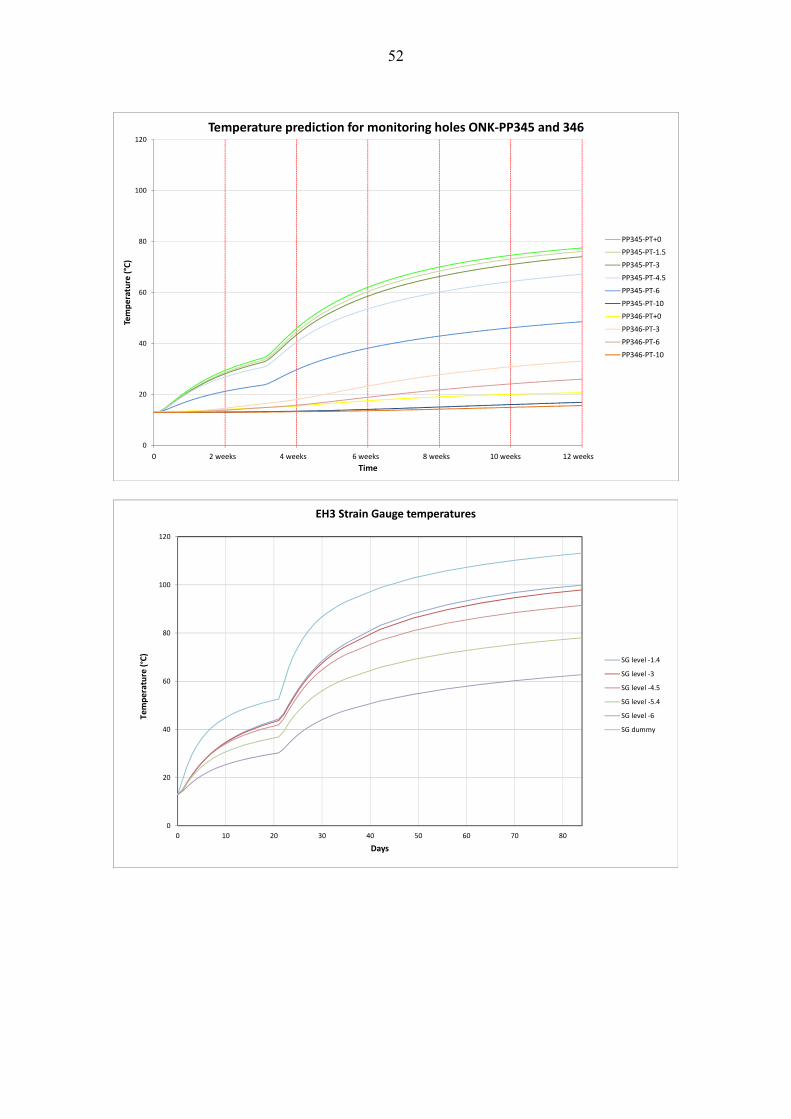
Temperatures at the hole wall border 45 °C after 3 weeks of heating with the center of the hole at level -2.8 exhibiting a temperature of ca. 100 °C (Figure 5-6 and Figure 5-8). After a further 9 weeks of heating temperatures at the center of the hole at level -2.8 have risen to ca. 230 °C with the hole wall reaching a temperature just below 100 °C (Figure 5-7 and Figure 5-9). These temperatures are in close agreement with the results from case 1 of the preliminary model and are also within the preset temperature limits. The temperature and strain results for individual monitor points are available in the appendix as charts.
Figure 5-6. N-S oriented cutting plane of the temperatures after 3 weeks of heating. The ONK-EH3 hole is outlined in the center with the northern monitoring holes indicated as three solid black lines. Note the temperature scale is limited to a range of 13 °C to 100 °C, with temperatures exceeding 100 °C coloured in violet.
28
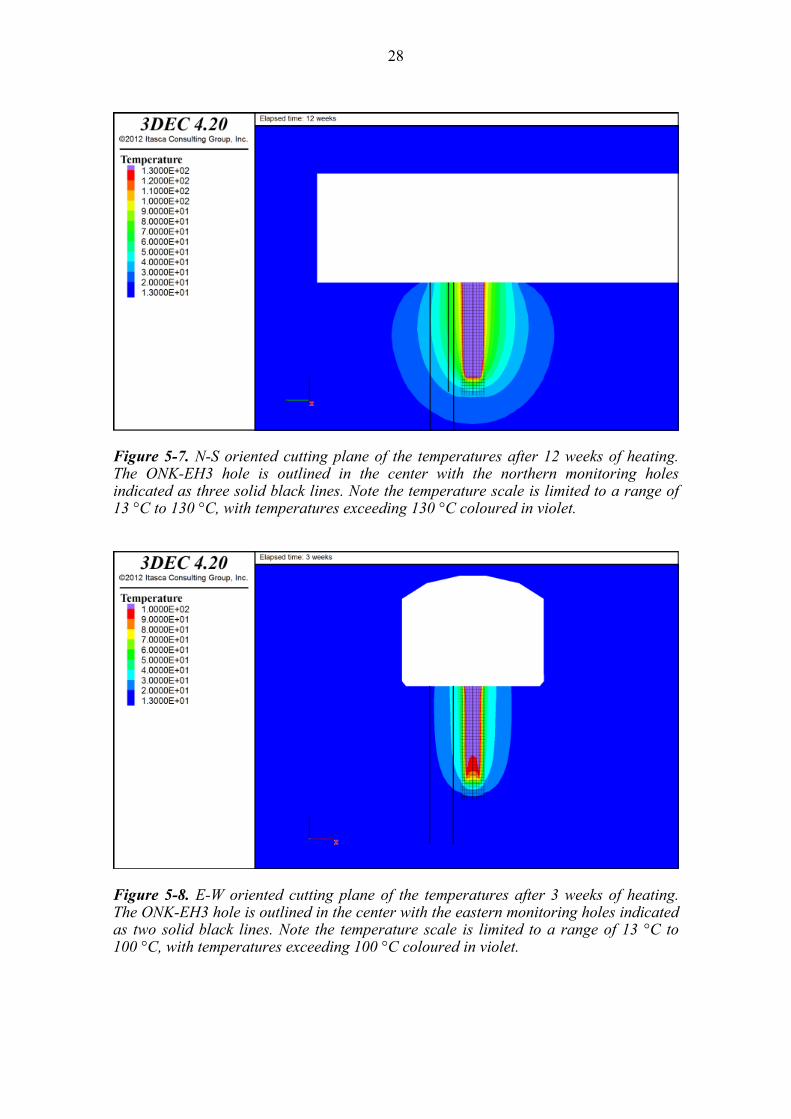
Figure 5-7. N-S oriented cutting plane of the temperatures after 12 weeks of heating. The ONK-EH3 hole is outlined in the center with the northern monitoring holes indicated as three solid black lines. Note the temperature scale is limited to a range of 13 °C to 130 °C, with temperatures exceeding 130 °C coloured in violet.
Figure 5-8. E-W oriented cutting plane of the temperatures after 3 weeks of heating. The ONK-EH3 hole is outlined in the center with the eastern monitoring holes indicated as two solid black lines. Note the temperature scale is limited to a range of 13 °C to 100 °C, with temperatures exceeding 100 °C coloured in violet.
29
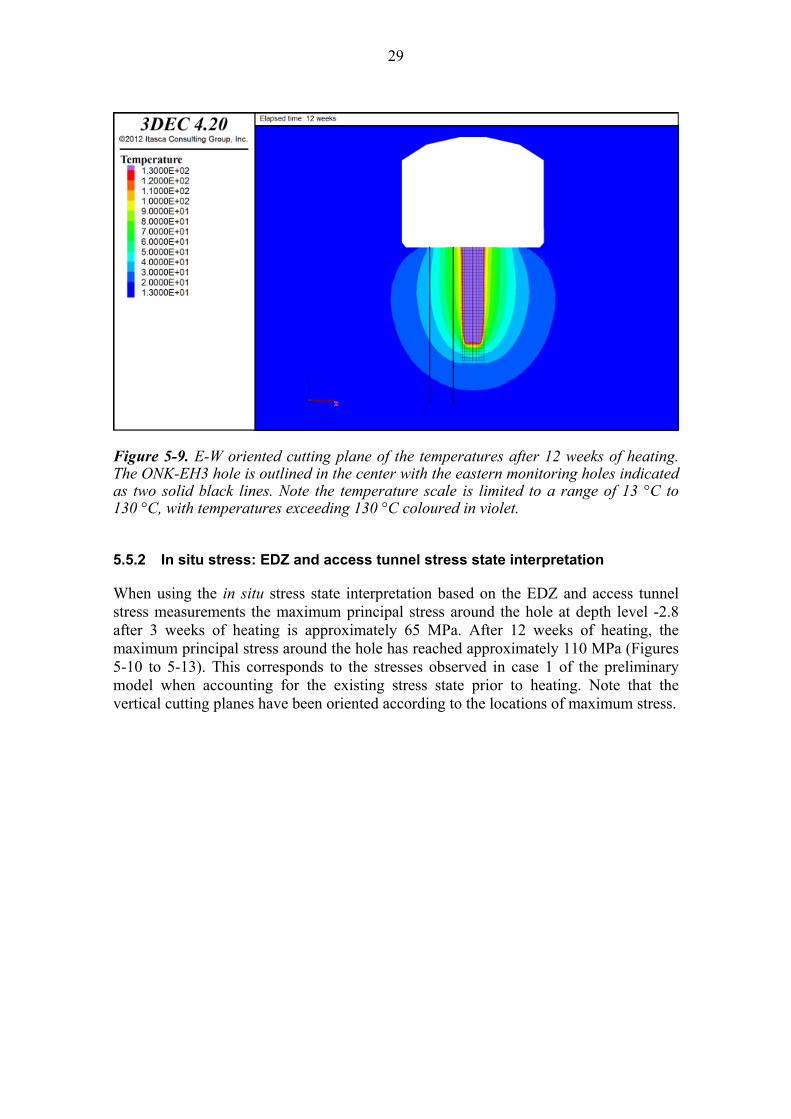
Figure 5-9. E-W oriented cutting plane of the temperatures after 12 weeks of heating. The ONK-EH3 hole is outlined in the center with the eastern monitoring holes indicated as two solid black lines. Note the temperature scale is limited to a range of 13 °C to 130 °C, with temperatures exceeding 130 °C coloured in violet.
5.5.2 In situ stress: EDZ and access tunnel stress state interpretation
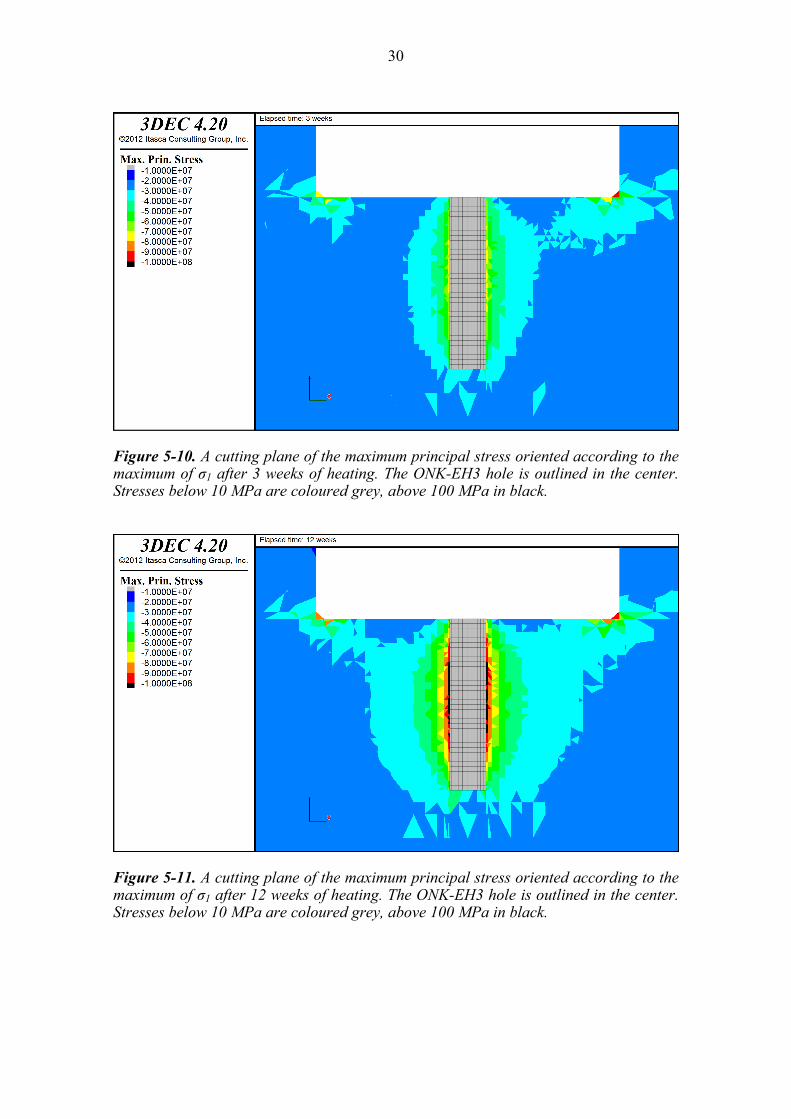
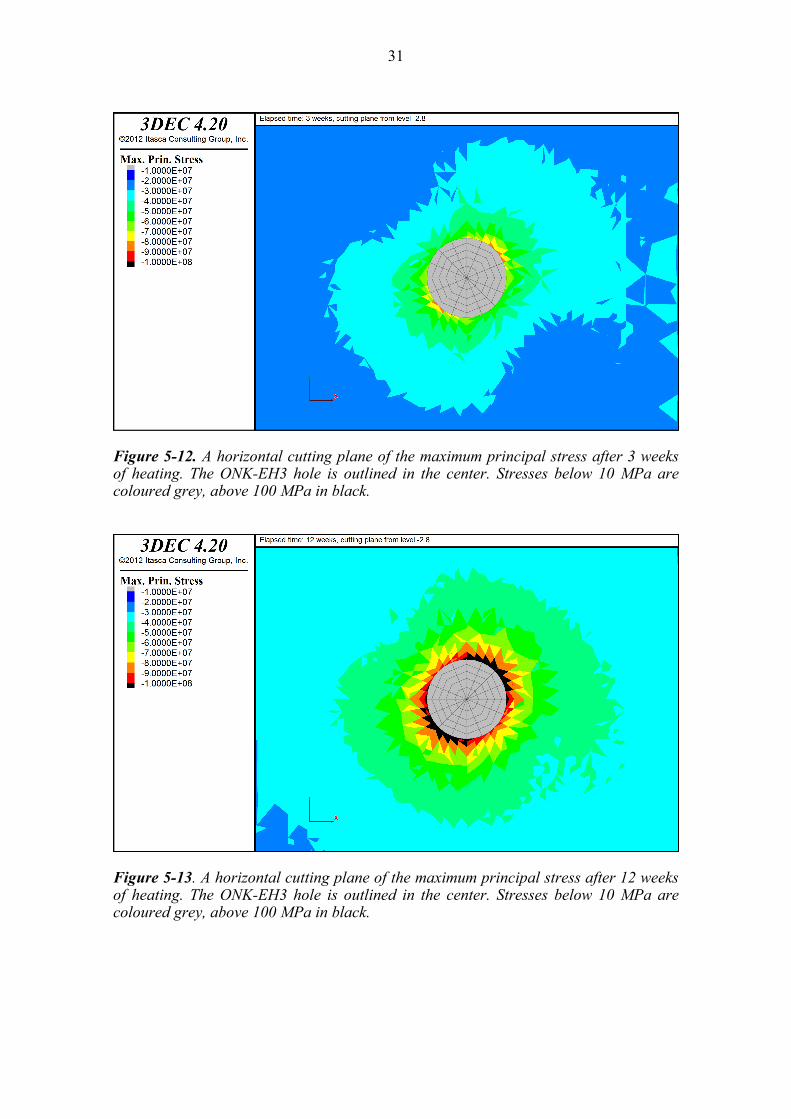
When using the in situ stress state interpretation based on the EDZ and access tunnel stress measurements the maximum principal stress around the hole at depth level -2.8 after 3 weeks of heating is approximately 65 MPa. After 12 weeks of heating, the maximum principal stress around the hole has reached approximately 110 MPa (Figures 5-10 to 5-13). This corresponds to the stresses observed in case 1 of the preliminary model when accounting for the existing stress state prior to heating. Note that the vertical cutting planes have been oriented according to the locations of maximum stress.
30
Figure 5-10. A cutting plane of the maximum principal stress oriented according to the maximum of σ1 after 3 weeks of heating. The ONK-EH3 hole is outlined in the center. Stresses below 10 MPa are coloured grey, above 100 MPa in black.
Figure 5-11. A cutting plane of the maximum principal stress oriented according to the maximum of σ1 after 12 weeks of heating. The ONK-EH3 hole is outlined in the center. Stresses below 10 MPa are coloured grey, above 100 MPa in black.
31
Figure 5-12. A horizontal cutting plane of the maximum principal stress after 3 weeks of heating. The ONK-EH3 hole is outlined in the center. Stresses below 10 MPa are coloured grey, above 100 MPa in black.
Figure 5-13. A horizontal cutting plane of the maximum principal stress after 12 weeks of heating. The ONK-EH3 hole is outlined in the center. Stresses below 10 MPa are coloured grey, above 100 MPa in black.
32
5.5.3 In situ stress: POSE ONK-EH3 stress state interpretation
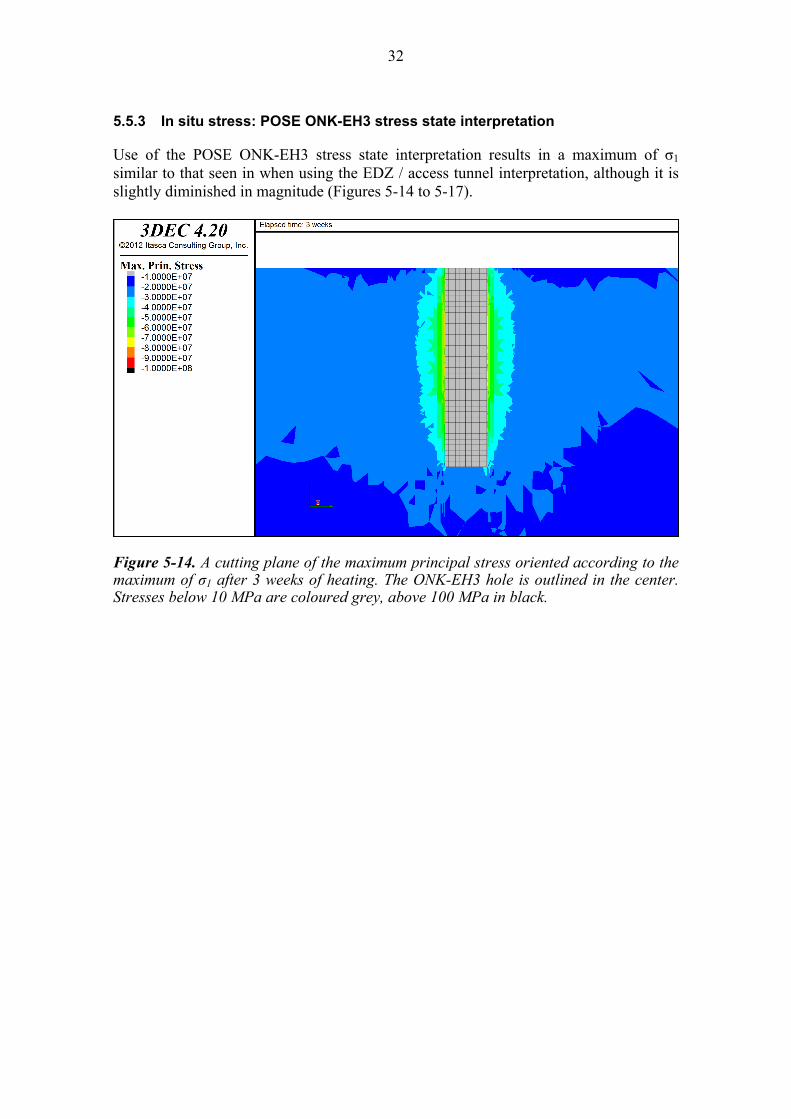
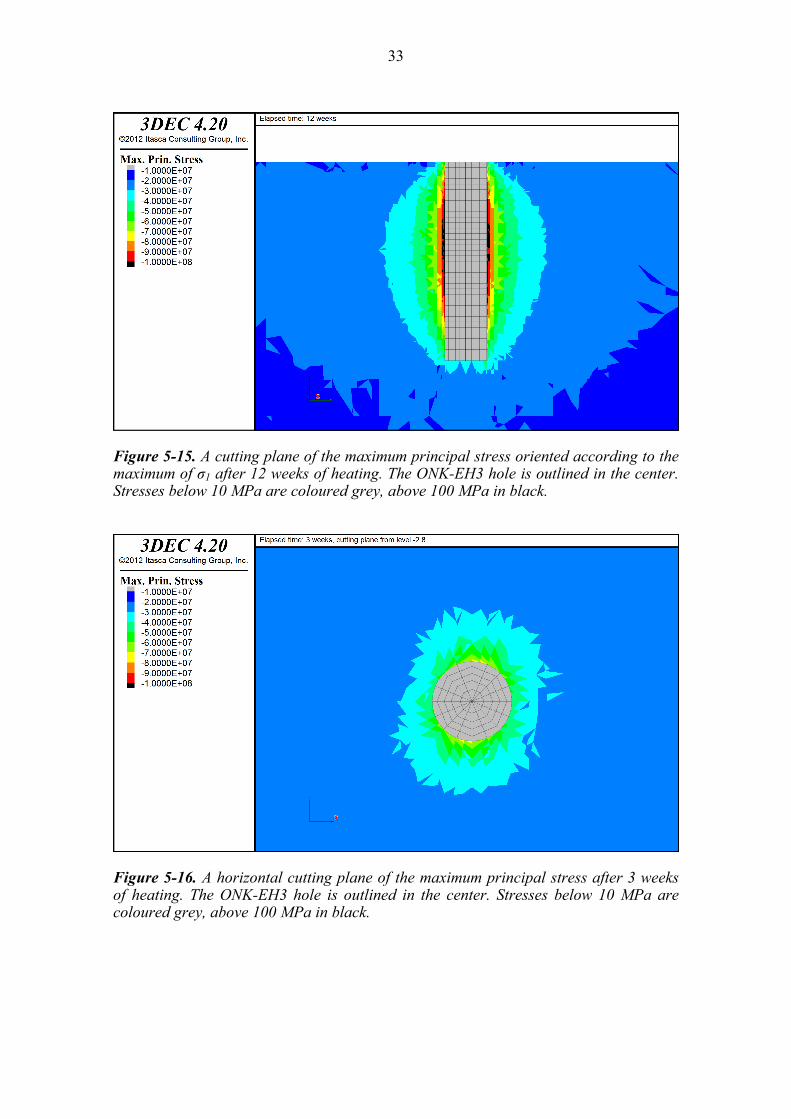
Use of the POSE ONK-EH3 stress state interpretation results in a maximum of σ1 similar to that seen in when using the EDZ / access tunnel interpretation, although it is slightly diminished in magnitude (Figures 5-14 to 5-17).
Figure 5-14. A cutting plane of the maximum principal stress oriented according to the maximum of σ1 after 3 weeks of heating. The ONK-EH3 hole is outlined in the center. Stresses below 10 MPa are coloured grey, above 100 MPa in black.
33
Figure 5-15. A cutting plane of the maximum principal stress oriented according to the maximum of σ1 after 12 weeks of heating. The ONK-EH3 hole is outlined in the center. Stresses below 10 MPa are coloured grey, above 100 MPa in black.
Figure 5-16. A horizontal cutting plane of the maximum principal stress after 3 weeks of heating. The ONK-EH3 hole is outlined in the center. Stresses below 10 MPa are coloured grey, above 100 MPa in black.
34
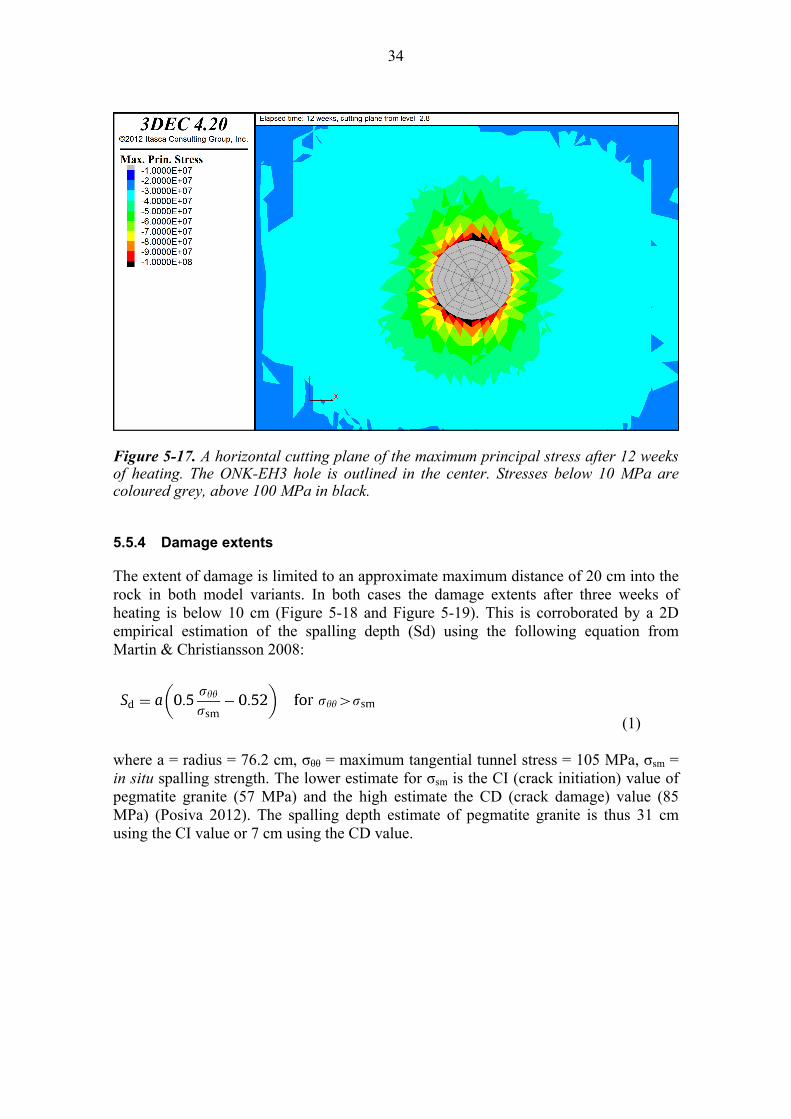
Figure 5-17. A horizontal cutting plane of the maximum principal stress after 12 weeks of heating. The ONK-EH3 hole is outlined in the center. Stresses below 10 MPa are coloured grey, above 100 MPa in black.
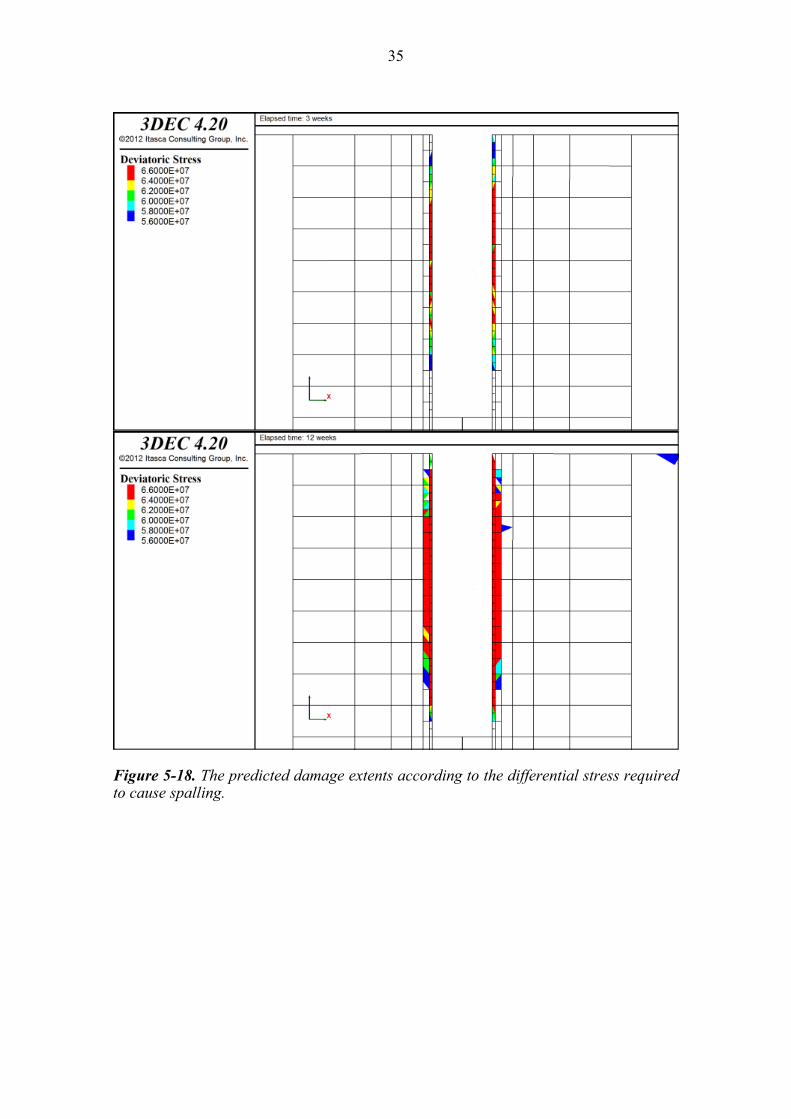
5.5.4 Damage extents
The extent of damage is limited to an approximate maximum distance of 20 cm into the rock in both model variants. In both cases the damage extents after three weeks of heating is below 10 cm (Figure 5-18 and Figure 5-19). This is corroborated by a 2D empirical estimation of the spalling depth (Sd) using the following equation from Martin & Christiansson 2008:
(1) where a = radius = 76.2 cm, σθθ = maximum tangential tunnel stress = 105 MPa, σsm = in situ spalling strength. The lower estimate for σsm is the CI (crack initiation) value of pegmatite granite (57 MPa) and the high estimate the CD (crack damage) value (85 MPa) (Posiva 2012). The spalling depth estimate of pegmatite granite is thus 31 cm using the CI value or 7 cm using the CD value.
35
Figure 5-18. The predicted damage extents according to the differential stress required to cause spalling.
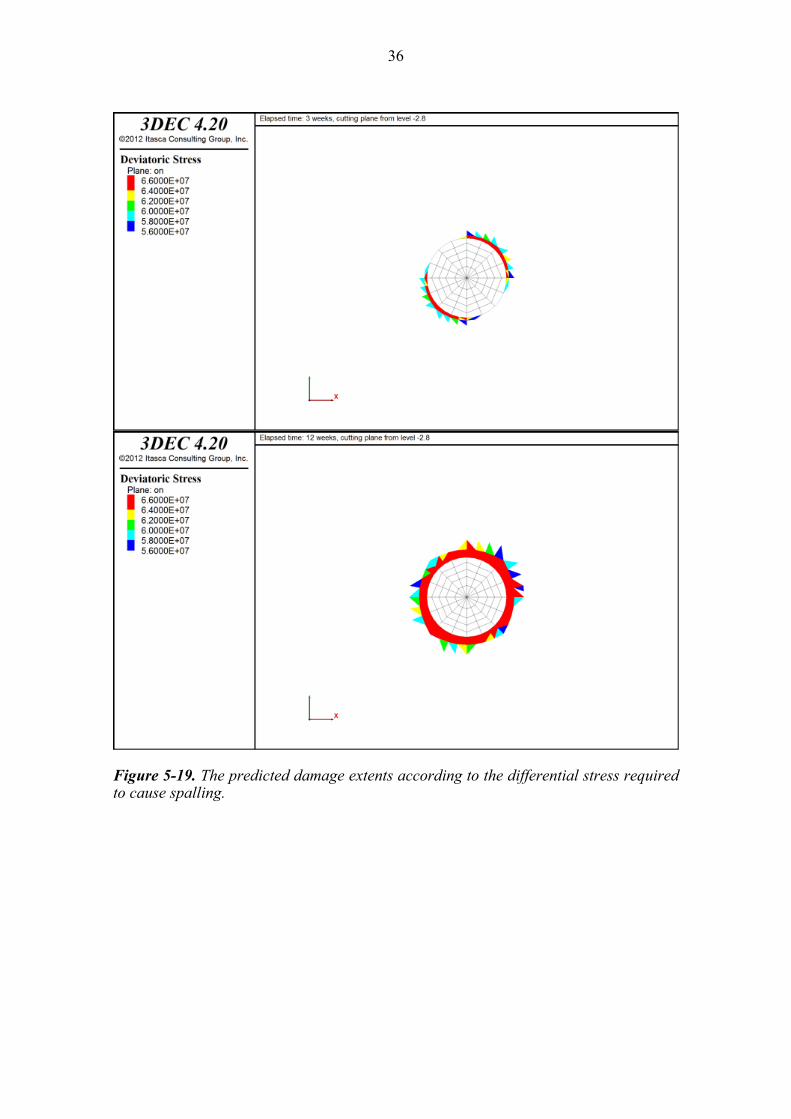
36
Figure 5-19. The predicted damage extents according to the differential stress required to cause spalling.
37
6 DISCUSSION
As the primary goal of these simulations was to determine the necessary power outputs to cause a thermal stress increase sufficiently large to unquestionably exceed the estimated spalling strength of the rock surrounding the ONK-EH3 hole, these simulations could be determined to be successful. It is worth noting that the simulations were accomplished using the most accurate material parameters available and an elastic and isotropic rock mass, hence where the stress exceeds the strength of the rock mass the strain predictions are no longer valid. The predictions are also largely dependent on the thermal parameters used in the model both for the rock and more importantly for the filling as the rate at which heat is transferred to the rock mass is a function of the filling parameters. Additionally, the simulations documented in this report cannot predict irregularities in the rock mass lithologies or in the porosity of the filling as the model assumes materials to be homogeneous throughout; heterogeneity can lead to locally sensitive areas of thermal transfer either in the filling or in the rock. Finally these simulations did not include any fracture interpretations which can affect heat and stress transfer although fractures are at a minimum in the POSE niche.

38
39
REFERENCES
Almatis GmbH. 2012. Tabular Alumina T60/T64. Accessed 04 October 2012. http://www.almatis.com/download/data-sheets/GP-RCP_001_R07_0608.pdf.
Martin, D., Christiansson, R. 2008. Estimating the potential for spalling around a deep nuclear waste repository in crystalline rock. International Journal of Rock Mechanics and Mining Sciences.
Itasca 2012. Software: 3DEC overview. Accessed 04 October 2012. http://www.itascacg.com/3dec/overview.php.
Kukkonen I., Kivekäs, L., Vuoriainen, S., Kääriä, M. 2011. Thermal properties of Rocks in Olkiluoto: Results of Laboratory Measurements 1994-2010. Olkiluoto: Posiva Oy.
Posiva 2012. Olkiluoto site description 2011. Report POSIVA 2011-02. Posiva Oy, Eurajoki, Finland.
Siren T. 2011. Fracture Mechanics Prediction for Posiva’s Olkiluoto Spalling Experiment (POSE). Working Report 2011-23. Posiva Oy.

40

41
APPENDICES
Appendix 1: Preliminary simulation stress / temperature predictions for cases 2 – 9.
Appendix 2: Temperature predictions for the third phase of the POSE experiment.
Appendix 3: Stress / Strain predictions for the third phase of the POSE experiment.
Appendix 4: In situ stress measurements with a LVDT-cell close to the POSE-niche.

42
43
APPENDIX 1
0
20
40
60
80
100
120
140
160
180
200
220
240
260
280
300
0.00E+00 1.21E+06 2.42E+06 3.63E+06 4.84E+06 6.05E+06 7.26E+06
Temperature (C°)
Time
3 weeks 3600 W, 9 weeks 6800 W
H3 center
10 cm in gravel
On surface
r 5 cm
r15 cm
r30 cm
r1 m
r1.5 m
r2.5 m
r3 m
0 2 weeks 4 weeks 6 weeks 8 weeks 10 weeks 12 weeks
70
65
60
55
50
45
40
35
30
25
20
15
10
5
‐0
‐5
0.00E+00 1.21E+06 2.42E+06 3.63E+06 4.84E+06 6.05E+06 7.26E+06
Stress (MPa)
Time
3 weeks 3600 W, 9 weeks 6800 W
H3 center
15 cm in gravel
r = 8 mm
r = 3.5 cm
r = 10 cm
r= 18.5 cm
r = 42 cm
r = 75.5 cm
r = 1.33 m
r = 2.5 m
0 2 weeks 4 weeks 6 weeks 8 weeks 10 weeks 12 weeks 0 2 weeks 4 weeks 6 weeks 8 weeks 10 weeks 12 weeks

44
0
20
40
60
80
100
120
140
160
180
200
220
240
260
280
300
0.00E+00 1.21E+06 2.42E+06 3.63E+06 4.84E+06 6.05E+06 7.26E+06
Temperature (C°)
Time
3 weeks 3200 W, 9 weeks 4000 W
H3 center
10 cm in gravel
On surface
r 5 cm
r15 cm
r30 cm
r1 m
r1.5 m
r2.5 m
r3 m
0 2 weeks 4 weeks 6 weeks 8 weeks 10 weeks 12 weeks
70
65
60
55
50
45
40
35
30
25
20
15
10
5
‐0
‐5
0.00E+00 1.21E+06 2.42E+06 3.63E+06 4.84E+06 6.05E+06 7.26E+06
Stress (MPa)
Time
3 weeks 3200 W, 9 weeks 4000 W
H3 center
15 cm in gravel
r = 8 mm
r = 3.5 cm
r = 10 cm
r= 18.5 cm
r = 42 cm
r = 75.5 cm
r = 1.33 m
r = 2.5 m
0 2 weeks 4 weeks 6 weeks 8 weeks 10 weeks 12 weeks 0 2 weeks 4 weeks 6 weeks 8 weeks 10 weeks 12 weeks
45
0
20
40
60
80
100
120
140
160
180
200
220
240
260
280
300
0.00E+00 1.21E+06 2.42E+06 3.63E+06 4.84E+06 6.05E+06 7.26E+06
Temperature (C°)
Time
3 weeks 3200 W, 9 weeks 4800 W
H3 center
10 cm in gravel
On surface
r 5 cm
r15 cm
r30 cm
r1 m
r1.5 m
r2.5 m
r3 m
0 2 weeks 4 weeks 6 weeks 8 weeks 10 weeks 12 weeks
70
65
60
55
50
45
40
35
30
25
20
15
10
5
‐0
‐5
0.00E+00 1.21E+06 2.42E+06 3.63E+06 4.84E+06 6.05E+06 7.26E+06
Stress (MPa)
Time
3 weeks 3200 W, 9 weeks 4800 W
H3 center
15 cm in gravel
r = 8 mm
r = 3.5 cm
r = 10 cm
r= 18.5 cm
r = 42 cm
r = 75.5 cm
r = 1.33 m
r = 2.5 m
0 2 weeks 4 weeks 6 weeks 8 weeks 10 weeks 12 weeks 0 2 weeks 4 weeks 6 weeks 8 weeks 10 weeks 12 weeks
46
0
20
40
60
80
100
120
140
160
180
200
220
240
260
280
300
0.00E+00 1.21E+06 2.42E+06 3.63E+06 4.84E+06 6.05E+06 7.26E+06
Temperature (C°)
Time
3 weeks 3200 W, 9 weeks 5600 W
H3 center
10 cm in gravel
On surface
r 5 cm
r15 cm
r30 cm
r1 m
r1.5 m
r2.5 m
r3 m
0 2 weeks 4 weeks 6 weeks 8 weeks 10 weeks 12 weeks
70
65
60
55
50
45
40
35
30
25
20
15
10
5
‐0
‐5
0.00E+00 1.21E+06 2.42E+06 3.63E+06 4.84E+06 6.05E+06 7.26E+06
Stress (MPa)
Time
3 weeks 3200 W, 9 weeks 5600 W
H3 center
15 cm in gravel
r = 8 mm
r = 3.5 cm
r = 10 cm
r= 18.5 cm
r = 42 cm
r = 75.5 cm
r = 1.33 m
r = 2.5 m
0 2 weeks 4 weeks 6 weeks 8 weeks 10 weeks 12 weeks 0 2 weeks 4 weeks 6 weeks 8 weeks 10 weeks 12 weeks
47
0
20
40
60
80
100
120
140
0.00E+00 1.21E+06 2.42E+06 3.63E+06 4.84E+06 6.05E+06 7.26E+06
Temperature (C°)
Time
12 weeks 800 W
H3 center
10 cm in gravel
On surface
r 5 cm
r15 cm
r30 cm
r1 m
r1.5 m
r2.5 m
r3 m
0 2 weeks 4 weeks 6 weeks 8 weeks 10 weeks 12 weeks 0 2 weeks 4 weeks 6 weeks 8 weeks 10 weeks 12 weeks
30
25
20
15
10
5
‐0
‐5
0.00E+00 1.21E+06 2.42E+06 3.63E+06 4.84E+06 6.05E+06 7.26E+06
Stress (MPa)
Time
12 weeks 800 W
H3 center
15 cm in gravel
r = 8 mm
r = 3.5 cm
r = 10 cm
r= 18.5 cm
r = 42 cm
r = 75.5 cm
r = 1.33 m
r = 2.5 m
0 2 weeks 4 weeks 6 weeks 8 weeks 10 weeks 12 weeks 0 2 weeks 4 weeks 6 weeks 8 weeks 10 weeks 12 weeks 0 2 weeks 4 weeks 6 weeks 8 weeks 10 weeks 12 weeks 0 2 weeks 4 weeks 6 weeks 8 weeks 10 weeks 12 weeks

48
0
20
40
60
80
100
120
140
0.00E+00 1.21E+06 2.42E+06 3.63E+06 4.84E+06 6.05E+06 7.26E+06
Temperature (C°)
Time
12 weeks 1600 W
H3 center
10 cm in gravel
On surface
r 5 cm
r15 cm
r30 cm
r1 m
r1.5 m
r2.5 m
r3 m
0 2 weeks 4 weeks 6 weeks 8 weeks 10 weeks 12 weeks 0 2 weeks 4 weeks 6 weeks 8 weeks 10 weeks 12 weeks
30
25
20
15
10
5
‐0
‐5
0.00E+00 1.21E+06 2.42E+06 3.63E+06 4.84E+06 6.05E+06 7.26E+06
Stress (MPa)
Time
12 weeks 1600 W
H3 center
15 cm in gravel
r = 8 mm
r = 3.5 cm
r = 10 cm
r= 18.5 cm
r = 42 cm
r = 75.5 cm
r = 1.33 m
r = 2.5 m
0 2 weeks 4 weeks 6 weeks 8 weeks 10 weeks 12 weeks 0 2 weeks 4 weeks 6 weeks 8 weeks 10 weeks 12 weeks 0 2 weeks 4 weeks 6 weeks 8 weeks 10 weeks 12 weeks 0 2 weeks 4 weeks 6 weeks 8 weeks 10 weeks 12 weeks
49
0
20
40
60
80
100
120
140
0.00E+00 1.21E+06 2.42E+06 3.63E+06 4.84E+06 6.05E+06 7.26E+06
Temperature (C°)
Time
12 weeks 2400 W
H3 center
10 cm in gravel
On surface
r 5 cm
r15 cm
r30 cm
r1 m
r1.5 m
r2.5 m
r3 m
0 2 weeks 4 weeks 6 weeks 8 weeks 10 weeks 12 weeks
30
25
20
15
10
5
‐0
‐5
0.00E+00 1.21E+06 2.42E+06 3.63E+06 4.84E+06 6.05E+06 7.26E+06
Stress (MPa)
Time
12 weeks 2400 W
H3 center
15 cm in gravel
r = 8 mm
r = 3.5 cm
r = 10 cm
r= 18.5 cm
r = 42 cm
r = 75.5 cm
r = 1.33 m
r = 2.5 m
0 2 weeks 4 weeks 6 weeks 8 weeks 10 weeks 12 weeks
50
0
20
40
60
80
100
120
140
0.00E+00 1.21E+06 2.42E+06 3.63E+06 4.84E+06 6.05E+06 7.26E+06
Temperature (C°)
Time
12 weeks 3200 W
H3 center
10 cm in gravel
On surface
r 5 cm
r15 cm
r30 cm
r1 m
r1.5 m
r2.5 m
r3 m
0 2 weeks 4 weeks 6 weeks 8 weeks 10 weeks 12 weeks 0 2 weeks 4 weeks 6 weeks 8 weeks 10 weeks 12 weeks
30
25
20
15
10
5
‐0
‐5
0.00E+00 1.21E+06 2.42E+06 3.63E+06 4.84E+06 6.05E+06 7.26E+06
Stress (MPa)
Time
12 weeks 3200 W
H3 center
15 cm in gravel
r = 8 mm
r = 3.5 cm
r = 10 cm
r= 18.5 cm
r = 42 cm
r = 75.5 cm
r = 1.33 m
r = 2.5 m
0 2 weeks 4 weeks 6 weeks 8 weeks 10 weeks 12 weeks 0 2 weeks 4 weeks 6 weeks 8 weeks 10 weeks 12 weeks 0 2 weeks 4 weeks 6 weeks 8 weeks 10 weeks 12 weeks 0 2 weeks 4 weeks 6 weeks 8 weeks 10 weeks 12 weeks
51
APPENDIX 2
0
20
40
60
80
100
120
140
160
180
200
220
240
260
280
300
0.00E+00 1.21E+06 2.42E+06 3.63E+06 4.84E+06 6.05E+06 7.26E+06
Temperature (C°)
Time
ONK‐EH3 temperature monitor predictions, full‐scale model
EH3‐TP+0
EH3‐TP‐0.3
EH3‐TP‐0.5‐0°
EH3‐TP‐1.5‐0°
EH3‐TP‐3‐0°
EH3‐TP‐4.5‐0°
EH3‐TP‐9‐143°
0 2 weeks 4 weeks 6 weeks 8 weeks 10 weeks 12 weeks
0
20
40
60
80
100
120
0.00E+00 1.21E+06 2.42E+06 3.63E+06 4.84E+06 6.05E+06 7.26E+06
Temperature (C°)
Time
Temperature predictions for monitoring holes ONK‐PP261, 340 and 341
PP261‐PT‐3
PP261‐PT‐6
PP340‐PT+0
PP340‐PT‐3
PP340‐PT‐6
PP340‐PT‐10
PP341‐PT+0
PP341‐PT‐1.5
PP341‐PT‐3
PP341‐PT‐4.5
PP341‐PT‐6
PP341‐PT‐10
0 2 weeks 4 weeks 6 weeks 8 weeks 10 weeks 12 weeks
52
0
20
40
60
80
100
120
0.00E+00 1.21E+06 2.42E+06 3.63E+06 4.84E+06 6.05E+06 7.26E+06
Temperature (°C)
Time
Temperature prediction for monitoring holes ONK‐PP345 and 346
PP345‐PT+0
PP345‐PT‐1.5
PP345‐PT‐3
PP345‐PT‐4.5
PP345‐PT‐6
PP345‐PT‐10
PP346‐PT+0
PP346‐PT‐3
PP346‐PT‐6
PP346‐PT‐10
0 2 weeks 4 weeks 6 weeks 8 weeks 10 weeks 12 weeks
0
20
40
60
80
100
120
0 10 20 30 40 50 60 70 80
Days
EH3 Strain Gauge temperatures
SG level ‐1.4
SG level ‐3
SG level ‐4.5
SG level ‐5.4
SG level ‐6
SG dummy
Tem
perature
(°C)
53
APPENDIX 3
120
115
110
105
100
95
90
85
80
75
70
65
60
55
50
45
40
35
30
25
20
15
10
5
0.00E+00 1.21E+06 2.42E+06 3.63E+06 4.84E+06 6.05E+06 7.26E+06
Stress (MPa)
Time
Strain gauge stress predictions, depth level ‐3
EH3‐SG‐R‐3‐53
EH3‐SG‐3‐143
EH3‐SG‐3‐203
EH3‐SG‐3‐263
EH3‐SG‐R‐3‐300
EH3‐SG‐R‐3‐346
0 2 weeks 4 weeks 6 weeks 8 weeks 10 weeks 12 weeks
‐1400
‐1200
‐1000
‐800
‐600
‐400
‐200
0
200
0 10 20 30 40 50 60 70 80
Days
Hole 3, Rosette 1 (53°), depth level ‐3 m
90 (Up)
45
0 (Tangential)
135
Strain (micro strain)
54
‐1400
‐1200
‐1000
‐800
‐600
‐400
‐200
0
200
0 10 20 30 40 50 60 70 80
Days
Hole 3, Tangential 1 (143°), depth level ‐3 m
90 (Up)
45
0 (Tangential)
135
Strain (micro strain)
‐1400
‐1200
‐1000
‐800
‐600
‐400
‐200
0
200
0 10 20 30 40 50 60 70 80
Days
Hole 3, Tangential 2 (203°), depth level ‐3 m
90 (Up)
45
0 (Tangential)
135
Strain (micro strain)
55
‐1400
‐1200
‐1000
‐800
‐600
‐400
‐200
0
200
0 10 20 30 40 50 60 70 80
Days
Hole 3, Tangential 3 (263°), depth level ‐3 m
90 (Up)
45
0 (Tangential)
135
Strain (micro strain)
‐1400
‐1200
‐1000
‐800
‐600
‐400
‐200
0
200
0 10 20 30 40 50 60 70 80
Days
Hole 3, Rosette 2 (300°), depth level ‐3 m
90 (Up)
45
0 (Tangential)
135
Strain (micro strain)
56
‐1400
‐1200
‐1000
‐800
‐600
‐400
‐200
0
200
0 10 20 30 40 50 60 70 80
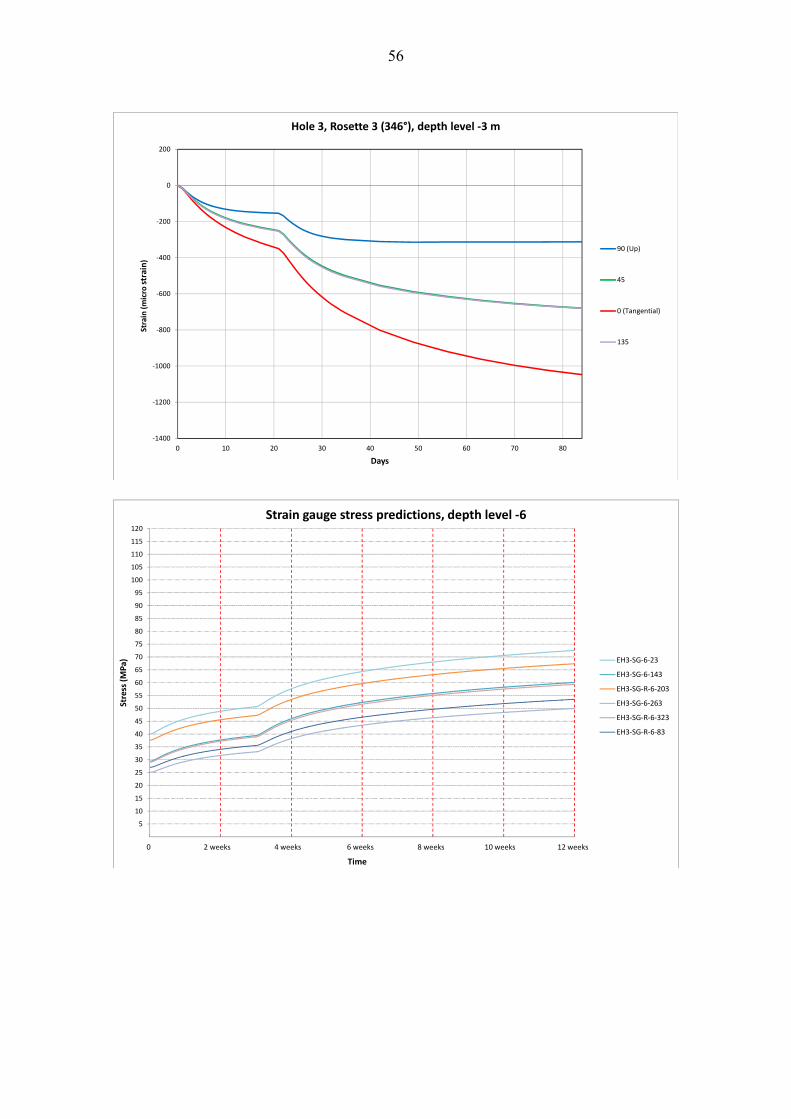
Days
Hole 3, Rosette 3 (346°), depth level ‐3 m
90 (Up)
45
0 (Tangential)
135
Strain (micro strain)
120
115
110
105
100
95
90
85
80
75
70
65
60
55
50
45
40
35
30
25
20
15
10
5
0.00E+00 1.21E+06 2.42E+06 3.63E+06 4.84E+06 6.05E+06 7.26E+06
Stress (MPa)
Time
Strain gauge stress predictions, depth level ‐6
EH3‐SG‐6‐23
EH3‐SG‐6‐143
EH3‐SG‐R‐6‐203
EH3‐SG‐6‐263
EH3‐SG‐R‐6‐323
EH3‐SG‐R‐6‐83
0 2 weeks 4 weeks 6 weeks 8 weeks 10 weeks 12 weeks

57
‐1400
‐1200
‐1000
‐800
‐600
‐400
‐200
0
200
0 10 20 30 40 50 60 70 80
Days
Hole 3, Tangential 4 (23°), depth level ‐6 m
90 (Up)
45
0 (Tangential)
135
Strain (micro strain)
‐1400
‐1200
‐1000
‐800
‐600
‐400
‐200
0
200
0 10 20 30 40 50 60 70 80
Days
Hole 3, Rosette 4 (83°), depth level ‐6 m
90 (Up)
45
0 (Tangential)
135
Strain (micro strain)
58
‐1400
‐1200
‐1000
‐800
‐600
‐400
‐200
0
200
0 10 20 30 40 50 60 70 80
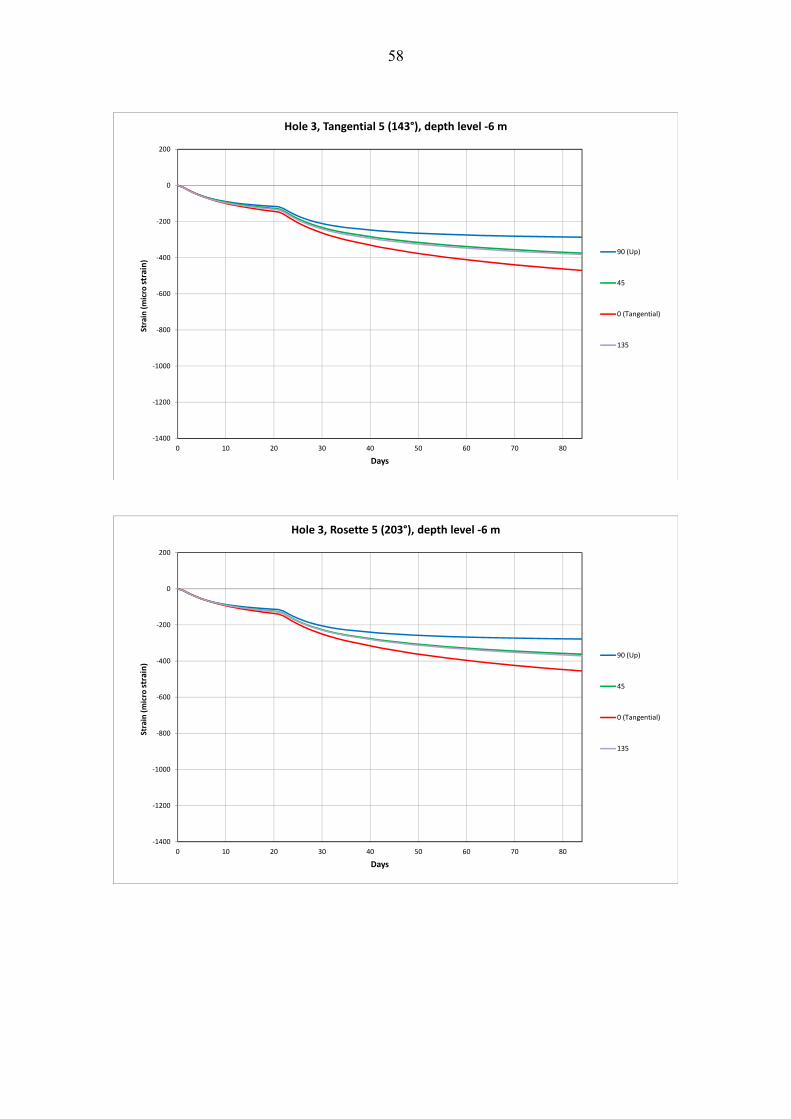
Days
Hole 3, Tangential 5 (143°), depth level ‐6 m
90 (Up)
45
0 (Tangential)
135
Strain (micro strain)
‐1400
‐1200
‐1000
‐800
‐600
‐400
‐200
0
200
0 10 20 30 40 50 60 70 80
Days
Hole 3, Rosette 5 (203°), depth level ‐6 m
90 (Up)
45
0 (Tangential)
135
Strain (micro strain)

59
‐1400
‐1200
‐1000
‐800
‐600
‐400
‐200
0
200
0 10 20 30 40 50 60 70 80
Days
Hole 3, Tangential 6 (263°), depth level ‐6 m
90 (Up)
45
0 (Tangential)
135
Strain (micro strain)
‐1400
‐1200
‐1000
‐800
‐600
‐400
‐200
0
200
0 10 20 30 40 50 60 70 80
Days
Hole 3, Rosette 6 (323°), depth level ‐6 m
90 (Up)
45
0 (Tangential)
135
Strain (micro strain)
60
120
115
110
105
100
95
90
85
80
75
70
65
60
55
50
45
40
35
30
25
20
15
10
5
0.00E+00 1.21E+06 2.42E+06 3.63E+06 4.84E+06 6.05E+06 7.26E+06
Stress (MPa)
Time
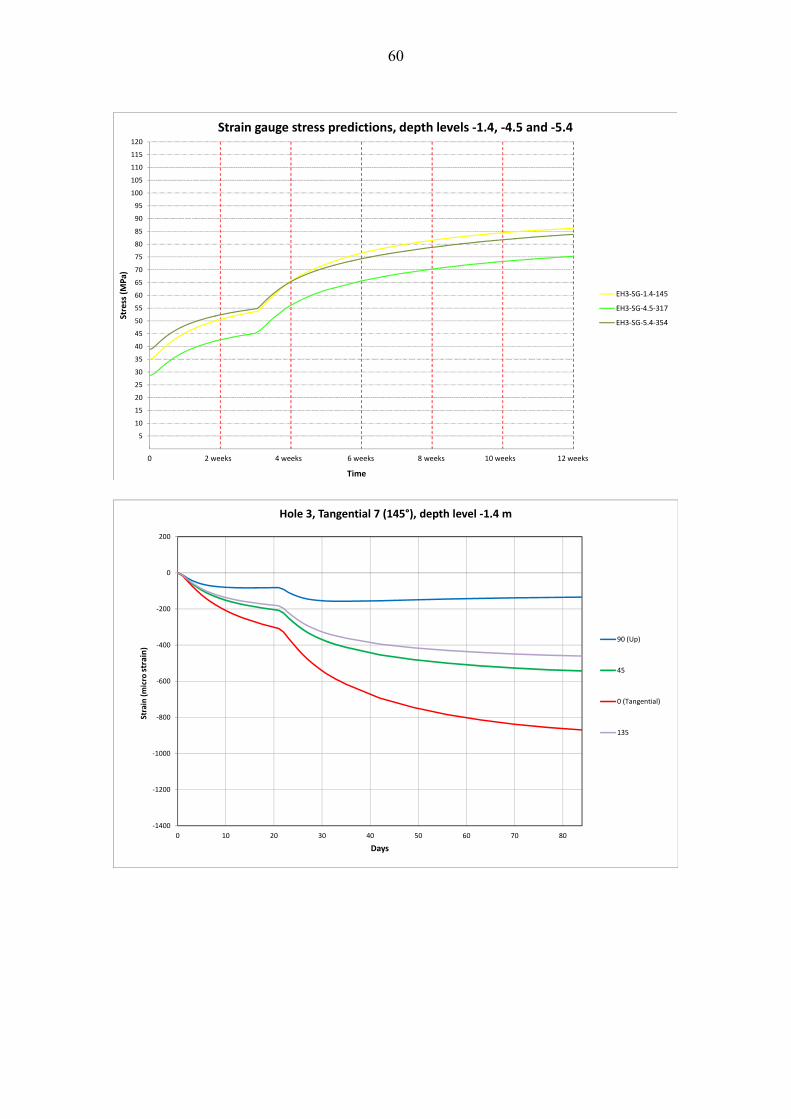
Strain gauge stress predictions, depth levels ‐1.4, ‐4.5 and ‐5.4
EH3‐SG‐1.4‐145
EH3‐SG‐4.5‐317
EH3‐SG‐5.4‐354
0 2 weeks 4 weeks 6 weeks 8 weeks 10 weeks 12 weeks
‐1400
‐1200
‐1000
‐800
‐600
‐400
‐200
0
200
0 10 20 30 40 50 60 70 80
Days
Hole 3, Tangential 7 (145°), depth level ‐1.4 m
90 (Up)
45
0 (Tangential)
135
Strain (micro strain)
61
‐1400
‐1200
‐1000
‐800
‐600
‐400
‐200
0
200
0 10 20 30 40 50 60 70 80
Days
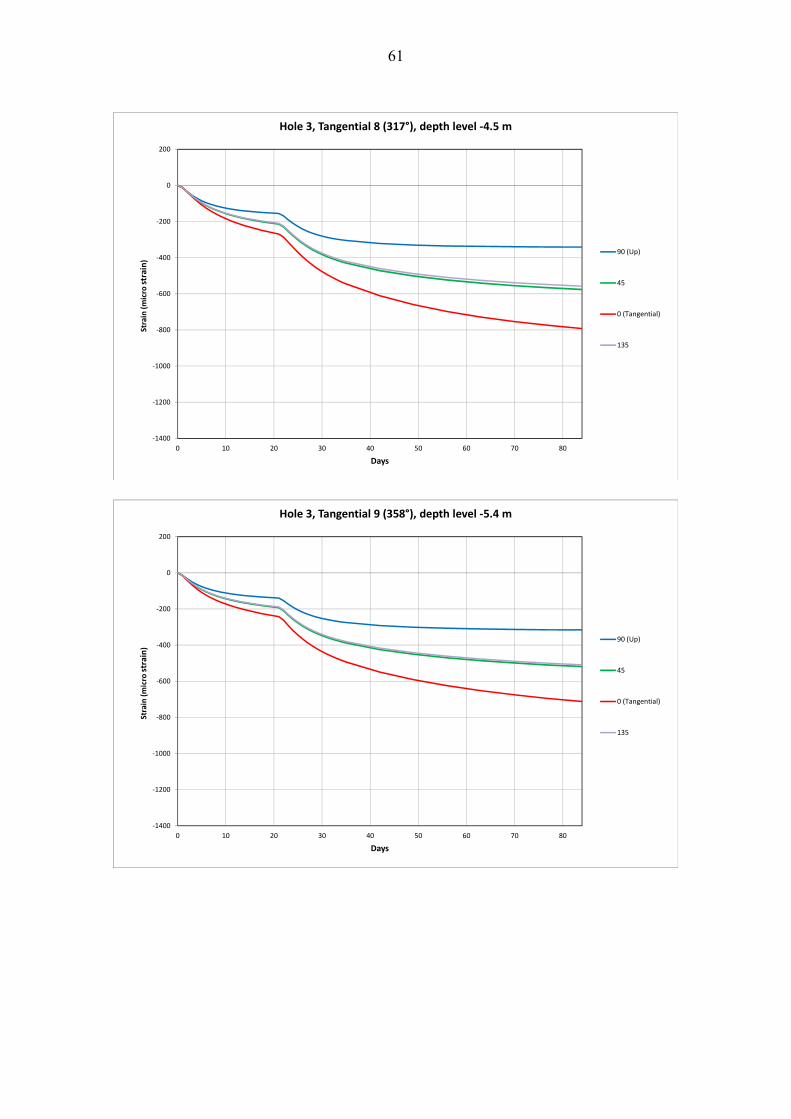
Hole 3, Tangential 8 (317°), depth level ‐4.5 m
90 (Up)
45
0 (Tangential)
135
Strain (micro strain)
‐1400
‐1200
‐1000
‐800
‐600
‐400
‐200
0
200
0 10 20 30 40 50 60 70 80
Days
Hole 3, Tangential 9 (358°), depth level ‐5.4 m
90 (Up)
45
0 (Tangential)
135
Strain (micro strain)

62
63
APPENDIX 4
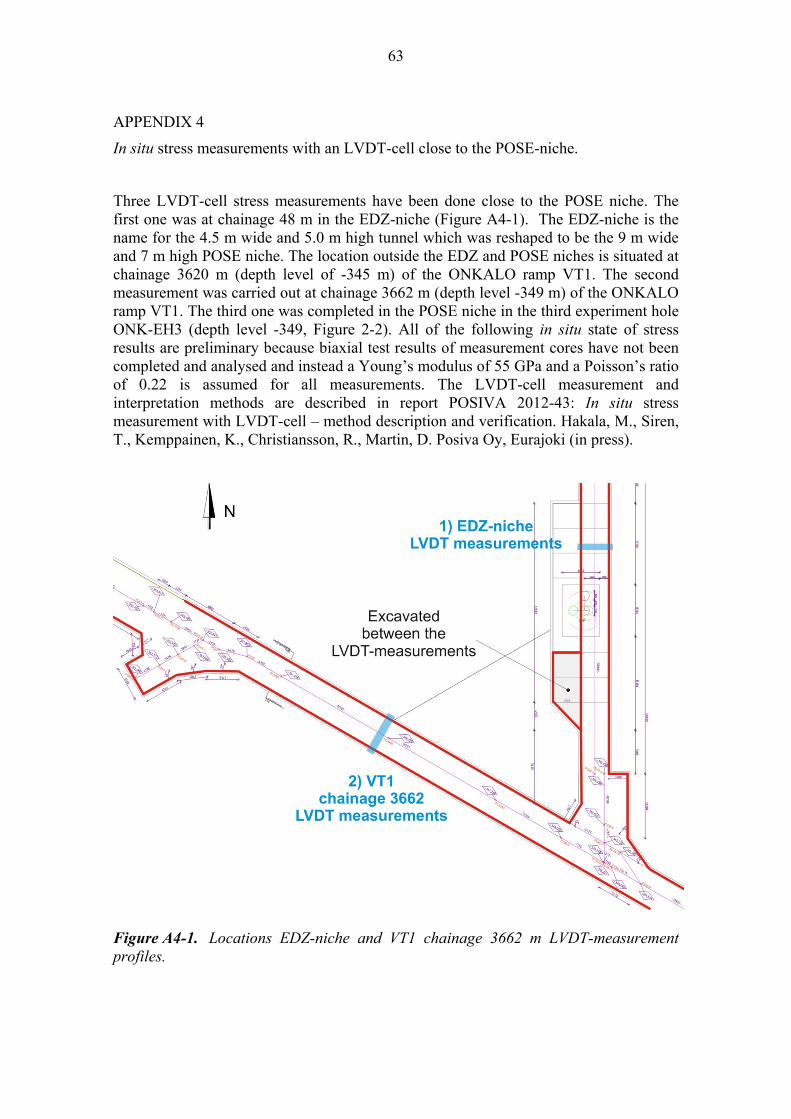
In situ stress measurements with an LVDT-cell close to the POSE-niche.
Three LVDT-cell stress measurements have been done close to the POSE niche. The first one was at chainage 48 m in the EDZ-niche (Figure A4-1). The EDZ-niche is the name for the 4.5 m wide and 5.0 m high tunnel which was reshaped to be the 9 m wide and 7 m high POSE niche. The location outside the EDZ and POSE niches is situated at chainage 3620 m (depth level of -345 m) of the ONKALO ramp VT1. The second measurement was carried out at chainage 3662 m (depth level -349 m) of the ONKALO ramp VT1. The third one was completed in the POSE niche in the third experiment hole ONK-EH3 (depth level -349, Figure 2-2). All of the following in situ state of stress results are preliminary because biaxial test results of measurement cores have not been completed and analysed and instead a Young’s modulus of 55 GPa and a Poisson’s ratio of 0.22 is assumed for all measurements. The LVDT-cell measurement and interpretation methods are described in report POSIVA 2012-43: In situ stress measurement with LVDT-cell – method description and verification. Hakala, M., Siren, T., Kemppainen, K., Christiansson, R., Martin, D. Posiva Oy, Eurajoki (in press).
Figure A4-1. Locations EDZ-niche and VT1 chainage 3662 m LVDT-measurement profiles.
64
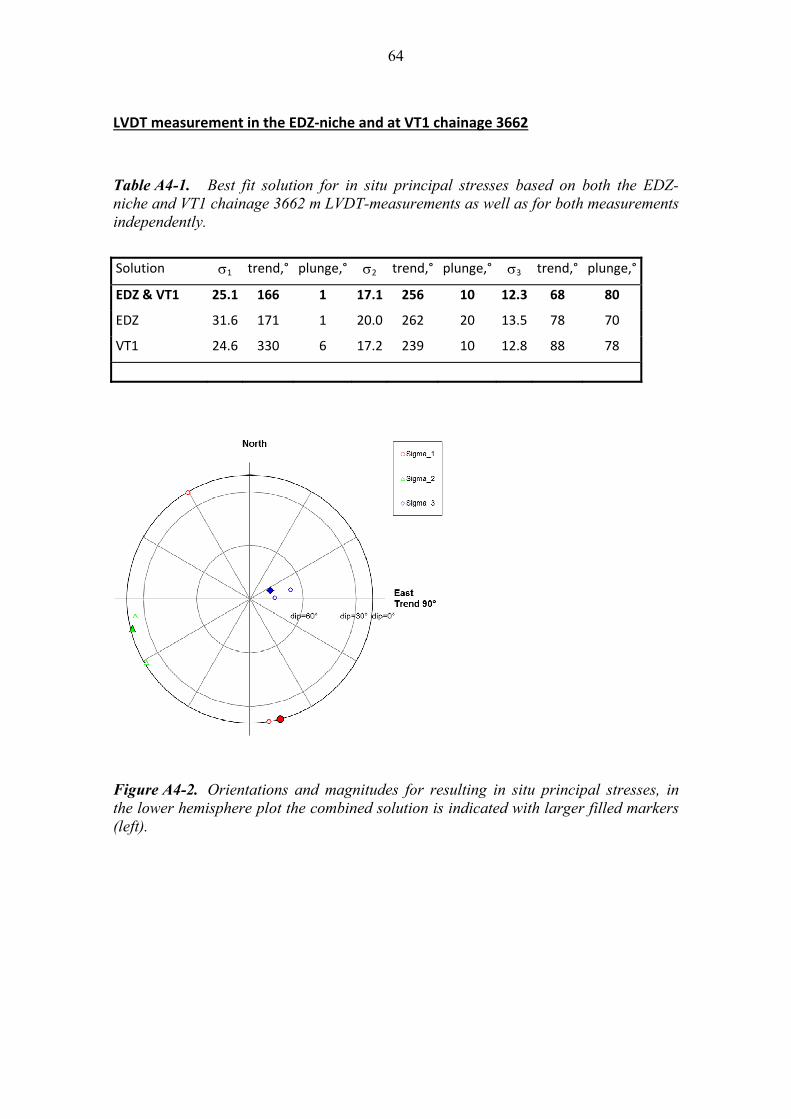
LVDT measurement in the EDZ‐niche and at VT1 chainage 3662
Table A4-1. Best fit solution for in situ principal stresses based on both the EDZ-niche and VT1 chainage 3662 m LVDT-measurements as well as for both measurements independently.
Solution 1 trend,° plunge,° 2 trend,° plunge,° 3 trend,° plunge,°
EDZ & VT1 25.1 166 1 17.1 256 10 12.3 68 80
EDZ 31.6 171 1 20.0 262 20 13.5 78 70
VT1 24.6 330 6 17.2 239 10 12.8 88 78
Figure A4-2. Orientations and magnitudes for resulting in situ principal stresses, in the lower hemisphere plot the combined solution is indicated with larger filled markers (left).
65
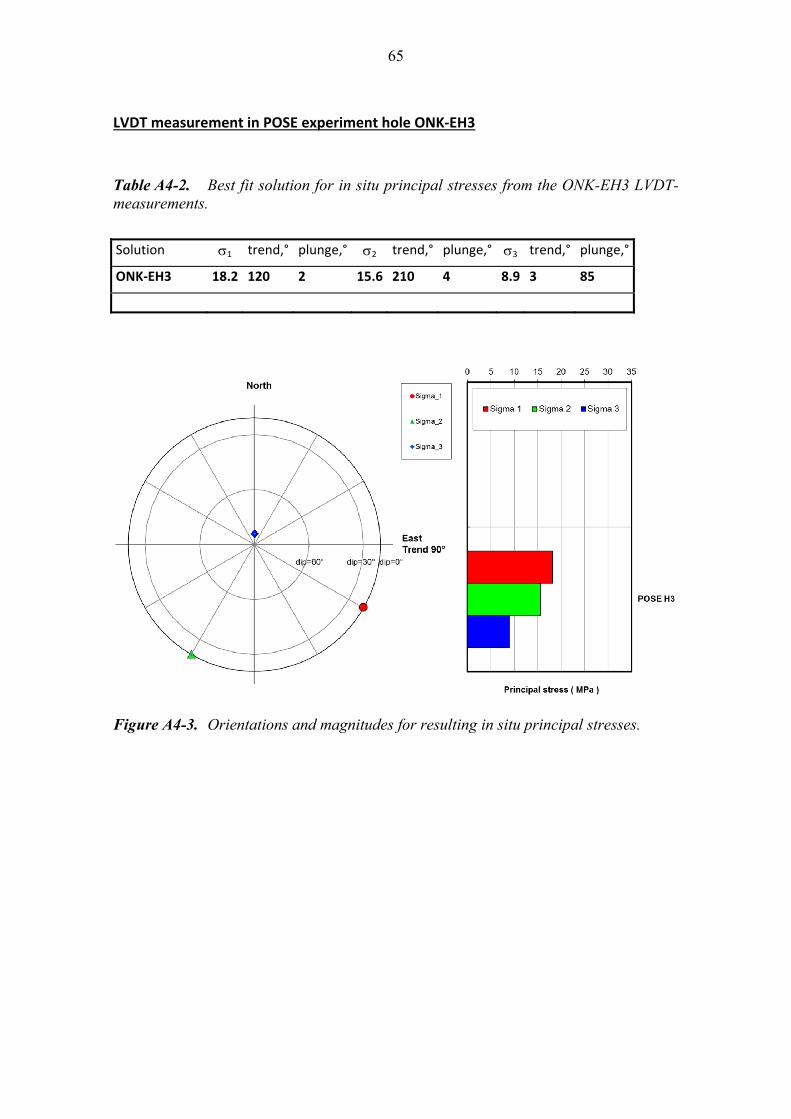
LVDT measurement in POSE experiment hole ONK‐EH3
Table A4-2. Best fit solution for in situ principal stresses from the ONK-EH3 LVDT-measurements.
Solution 1 trend,° plunge,° 2 trend,° plunge,° 3 trend,° plunge,°
ONK‐EH3 18.2 120 2 15.6 210 4 8.9 3 85
Figure A4-3. Orientations and magnitudes for resulting in situ principal stresses.

66