Embed Size (px)
Citation preview

Oneida Tribe of Indians of Wisconsin
ENERGY OPTIMIZATION MODEL
December, 2014
FOA Title: First Steps Toward Developing Renewable Energy on Tribal Lands
FOA #: DE-FOA-0000422
Award #: DOE-EE0005055
Topic Area: Energy Options Analysis
Report #: DOE-OTIW-0005055
Technical Contact: Michael Troge, Project Manager
Little Bear Development Center
7332 Water Circle Place, PO Box 365
Oneida, WI 54155
Office: 920-869-4572
Business Contact: Patrick Pelky, Environmental Division Director
Little Bear Development Center
7332 Water Circle Place, PO Box 365, Oneida, WI 54155
Office: 920-869-4572
Oneida Tribe of Indians of Wisconsin
Energy Optimization Model
DOE-EE0005055
Page 2 of 28
Table of Contents List of Tables .................................................................................................................................. 3
List of Figures ................................................................................................................................. 3
Acknowledgements ......................................................................................................................... 3
Executive Summary ........................................................................................................................ 4
Project Overview ............................................................................................................................ 5
Model Findings and Preliminary Results ........................................................................................ 9
Solar .......................................................................................................................................... 10
Wind .......................................................................................................................................... 11
Biomass ..................................................................................................................................... 12
Ground-Source Thermal ............................................................................................................ 13
Financial and Legal Realities .................................................................................................... 13
Energy Crop Component .............................................................................................................. 18
Conclusions and Recommendations ............................................................................................. 21
Lessons Learned............................................................................................................................ 22
Appendix ....................................................................................................................................... 23
Oneida Tribe of Indians of Wisconsin
Energy Optimization Model
DOE-EE0005055
Page 3 of 28
List of Tables Table 1, Oneida RPS process .......................................................................................................... 9
Table 2, Solar opportunities at top 15 facilities ............................................................................ 10
Table 3, Oneida large wind pre-feasibility assumptions ............................................................... 11
Table 4, Oneida large wind project results ................................................................................... 11
Table 5, Biomass energy system proposals based on pre-feasibility analysis for select Oneida
Tribal facilities .............................................................................................................................. 12
Table 6, Preliminary comparison of financial metrics .................................................................. 14
Table 7, Oneida met-tower results ................................................................................................ 15
Table 8, Oneida Reservation land use ........................................................................................... 20
Table 9, Oneida Reservation soil drainage classes and area ......................................................... 20
List of Figures Figure 1, 2008 Total Energy Production, fossil & renewable sources (Wisconsin ranks #37) ...... 5
Figure 2, Oneida electricity consumption distribution ................................................................... 6
Figure 3, Electrical generation sources supplying Oneida .............................................................. 7
Figure 4, Renewable Portfolio at maximum solar and wind build-out ......................................... 10
Figure 5, Oneida large wind cash flow ......................................................................................... 11
Figure 6, Partnership flip model ................................................................................................... 13
Figure 7, Oneida Reservation potential wind turbine sites .......................................................... 15
Figure 8, Financial analysis #1 for wind proposal ........................................................................ 16
Figure 9, Financial analysis #2 for wind proposal ........................................................................ 17
Figure 10, Oneida energy crop project ......................................................................................... 19
Figure 11, Energy optimization model; preliminary results fact sheet ......................................... 24
Figure 12, Energy crop fact sheet ................................................................................................. 26
Figure 13, Initial solar deployment proposal on Tribal facilities .................................................. 28
Acknowledgements We would like to thank the Department of Energy, Office of Energy Efficiency and Renewable
Energy, and Tribal Energy Program for their continued support and assistance with this project. Special
thanks goes to our project officer Lizana K. Pierce and project monitors Kris Venema and Cass Gillham.
Thanks to the staff from H&H Energy Management Systems, Godfrey & Kahn S.C., and the
University of Wisconsin Green Bay.
Thanks to the Oneida Business Committee, Oneida Energy Team, and many staff for their
assistance and support for this project.

Oneida Tribe of Indians of Wisconsin
Energy Optimization Model
DOE-EE0005055
Page 4 of 28
Executive Summary
Oneida Nation is located in Northeast Wisconsin. The reservation is approximately 96
square miles (8 miles x 12 miles), or 65,000 acres. The greater Green Bay area is east and
adjacent to the reservation. A county line roughly splits the reservation in half; the west half is in
Outagamie County and the east half is in Brown County. Land use is predominantly agriculture
on the west 2/3 and suburban on the east 1/3 of the reservation. Nearly 5,000 tribally enrolled
members live in the reservation with a total population of about 21,000. Tribal ownership is
scattered across the reservation and is about 23,000 acres.
Currently, the Oneida Tribe of Indians of Wisconsin (OTIW) community members and
facilities receive the vast majority of electrical and natural gas services from two of the largest
investor-owned utilities in the state, WE Energies and Wisconsin Public Service. All urban and
suburban buildings have access to natural gas. About 15% of the population and five Tribal
facilities are in rural locations and therefore use propane as a primary heating fuel. Wood and oil
are also used as primary or supplemental heat sources for a small percent of the population. Very
few renewable energy systems, used to generate electricity and heat, have been installed on the
Oneida Reservation. This project was an effort to develop a reasonable renewable energy
portfolio that will help Oneida to provide a leadership role in developing a clean energy
economy. The Energy Optimization Model (EOM) is an exploration of energy opportunities
available to the Tribe and it is intended to provide a decision framework to allow the Tribe to
make the wisest choices in energy investment with an organizational desire to establish a
renewable portfolio standard (RPS).

Oneida Tribe of Indians of Wisconsin
Energy Optimization Model
DOE-EE0005055
Page 5 of 28
Project Overview
Renewable energy resources available to Oneida can be estimated using U.S. Energy
Information Administration (EIA) data. The Oneida Nation reservation is located entirely within
Wisconsin, therefore most fossil resources available to Oneida will be based on imports brought
into the state. Likewise, renewable resources found within the state will also be available to
Oneida. Wisconsin is not a state known for its energy reserves. According to EIA in 2009,
Wisconsin has no oil rigs, wells, or mines to gain access to fossil fuel resources like oil, natural
gas, or coal. That means all fossil fuel energy resources must be imported. Figure 1, 2008 Total
Energy Production, fossil & renewable sources (Wisconsin ranks #37), shows that Wisconsin is
ranked very low compared to states such as Texas where abundant fossil and renewable energy
resources are available.
Wisconsin, and Oneida, will have to be creative with their energy development as well as
maintain a commitment to sustainable, clean energy for the coming decades. Ignoring upfront
costs, energy efficiency and renewable energy at this point in time have shown to be the most
prudent ways to meet these challenges. Bioenergy, wind, solar, and ground-source heating &
cooling are renewable sources providing the best opportunity for Wisconsin and Oneida to
attempt some level of energy independence away from imported fossil resources.
Figure 1, 2008 Total Energy Production, fossil & renewable sources (Wisconsin ranks #37)
Figure 11: 2008 Total Energy Production
fossil + renewable sources
0 2000 4000 6000 8000 10000 12000 14000
Texas
Pennsylvania
Alabama
Indiana
South Carolina
Iowa
Wisconsin
New Hampshire
Rhode Island
trillion Btus
Oneida Tribe of Indians of Wisconsin
Energy Optimization Model
DOE-EE0005055
Page 6 of 28
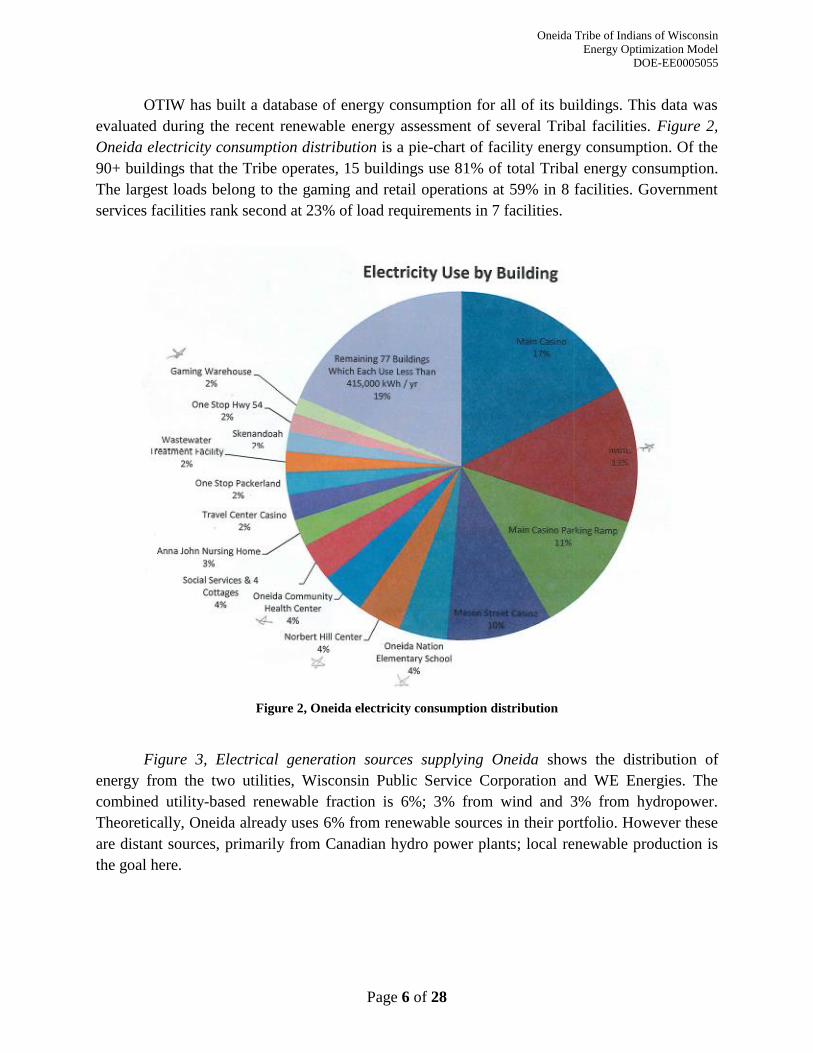
OTIW has built a database of energy consumption for all of its buildings. This data was
evaluated during the recent renewable energy assessment of several Tribal facilities. Figure 2,
Oneida electricity consumption distribution is a pie-chart of facility energy consumption. Of the
90+ buildings that the Tribe operates, 15 buildings use 81% of total Tribal energy consumption.
The largest loads belong to the gaming and retail operations at 59% in 8 facilities. Government
services facilities rank second at 23% of load requirements in 7 facilities.
Figure 2, Oneida electricity consumption distribution
Figure 3, Electrical generation sources supplying Oneida shows the distribution of
energy from the two utilities, Wisconsin Public Service Corporation and WE Energies. The
combined utility-based renewable fraction is 6%; 3% from wind and 3% from hydropower.
Theoretically, Oneida already uses 6% from renewable sources in their portfolio. However these
are distant sources, primarily from Canadian hydro power plants; local renewable production is
the goal here.

Oneida Tribe of Indians of Wisconsin
Energy Optimization Model
DOE-EE0005055
Page 7 of 28
Figure 3, Electrical generation sources supplying Oneida
Energy distribution by sector:
Current Tribal community energy usage as of 2011 = 412,000 MMBtu. Existing energy data for
individual buildings will be made available upon contract approval.
a. Institutional electricity: 31,000,000 kilowatt-hours = 105,000 MMBtu
b. Institutional natural gas: 540,000 therms = 54,000 MMBtu
c. Institutional transportation fuel: 145,000 gallons = 5,000 MMBtu
d. Housing electricity: 16,000,000 kilowatt-hours = 48,000 MMBtu
e. Housing natural gas: 2,000,000 therms = 200,000 MMBtu
Initial Renewable Portfolio Standards – for each standard, evaluate the appropriate Tribal buildings or
properties using Section II.C. The cumulative production from the combination of technologies should
add up to the RPS goal. Three different RPS goals include:
a. 5% RPS = 20,600 MMBtu
b. 10% RPS = 41,200 MMBtu
c. 20% RPS = 82,400 MMBtu
The initial objectives developed for this project were to:
1) Quantify each energy resource in their available forms in the region surrounding the
Oneida Reservation. This list will include wind, solar, biomass, ground-source, hydro,
bio-fuels, bio-power, coal (utility generated electricity), natural gas, propane, gasoline,

Oneida Tribe of Indians of Wisconsin
Energy Optimization Model
DOE-EE0005055
Page 8 of 28
and others that are available to the Oneida Tribe. Describe for each their geographical
distribution and availability, usage costs, existing transmission, and processing with
associated challenges.
2) Describe the latest energy conversion technologies for the appropriate energy resource.
3) Describe the planning, development, funding, and maintenance considerations of tribally
controlled renewable energy facilities.
4) With assistance from Tribal staff, develop a forecast of Tribal energy needs 5, 10, 25, and
50 years into the future.
5) Develop a prioritized list of energy portfolio options that recommend the ideal
combination of energy efficiency, renewable energy, and conventional energy
technologies based on availability, maturity of technology, $/Btu, internal rate of return,
net present value, and carbon emissions.
6) Provide discussion about municipalization, power purchase agreements, and 3rd
party
agreements.
The EOM was intended to:
evaluate renewable resources in the reservation,
investigate available technologies,
provide pre-feasibility work on Tribal facilities to determine their capability to
support these technologies, and
devise an investment strategy that can be used to support and recommend a
renewable portfolio standard to the governing body.

Oneida Tribe of Indians of Wisconsin
Energy Optimization Model
DOE-EE0005055
Page 9 of 28
Model Findings and Preliminary Results
Early in the development process, it was recognized that the initial renewable portfolio
standards would be very difficult to achieve given that the total energy picture that includes
electricity, heat, and fuel for residential and Tribal facilities was large. We adjusted RPS
calculations to be based on a percentage of institutional electricity consumption. Table 1, Oneida
RPS process, provides a look at one strategy for achieving a renewable portfolio standard (RPS)
using targets of 5%, 10%, and 20%. Complete solar and wind build-out for the potential projects
listed could give OTIW as much as a 40% RPS. Figure 4, Renewable Portfolio at maximum
solar and wind build-out, shows combined RPS of 45% solar, wind, and hydropower from utility
renewables. There were many assumptions used in this scenario. More information is in the
section Financial and Legal Realities. Information for each technology is described in the
following pages.
Table 1, Oneida RPS process

Oneida Tribe of Indians of Wisconsin
Energy Optimization Model
DOE-EE0005055
Page 10 of 28
Table 2, Solar opportunities at top 15 facilities
Solar Overall findings tend to favor solar as an immediate opportunity and as other
renewable resources develop. There are many reasons why solar has been identified as a
preferred technology, largely because of the direct impact is has with individual
buildings, the scalability of photovoltaics, significantly lower maintenance costs, and
the ability to take advantage of unused roof space. Table 2, Solar opportunities at top
15 facilities, shows a maximum solar buildout scenario for the large facilities. Figure 4,
Renewable Portfolio at maximum solar and wind build-out, shows the impact that solar
and wind can have on the RPS. Other benefits and a comparison between photovoltaics
and large-scale wind can be found in
Figure 11, Energy optimization model; preliminary results fact sheet.
Figure 4, Renewable Portfolio at maximum solar and wind build-out

Oneida Tribe of Indians of Wisconsin
Energy Optimization Model
DOE-EE0005055
Page 11 of 28
Wind Regarding wind energy, a met-tower study performed in 2009-11 did show some
opportunities for large wind Refer to Figure 7, Oneida Reservation potential wind turbine sites,
and Table 7, Oneida met-tower results. Based on this data and the assumptions in Table 3, a 1.5
megawatt wind turbine could pay for itself in about 12 years. Refer to Table 4, Oneida large
wind project results and Figure 5, Oneida large wind cash flow. Since the Tribe is a non-taxable
entity, these results also assume that the only incentive available will be a 50% grant. More
discussion is in the section Financial and Legal Realities. Siting concerns, local and regional
opposition, operations and maintenance costs, and poor utility power purchase rates are primary
reasons explaining why wind will not be an immediate opportunity in the near future. Although
these issues are significant, local development and off-site investment remain as options and the
Tribe will continue to investigate.
Table 3, Oneida large wind pre-feasibility
assumptions
Table 4, Oneida large wind project results
Figure 5, Oneida large wind cash flow

Oneida Tribe of Indians of Wisconsin
Energy Optimization Model
DOE-EE0005055
Page 12 of 28
Biomass Biomass as a heating source in facilities or homes is competitive with propane. Due to the
extreme variability of propane prices from season to season, building owners may benefit from
cordwood sources or from a regionally expanding wood pellet supply. Appliances, stoves and
furnaces, designed to use these kinds of fuels are generally available and affordable with
respectable efficiency ratings (80 to 90+%). Large-scale projects have greater limitations. These
are heavy on infrastructure costs and require a consistent source of fuel to maintain heat and
efficiency. The supply of feedstock options such as wood chips or waste materials from tree
harvesting activities are not significant in northeast Wisconsin, compared to northern Wisconsin.
Tree stand acres are limited primarily due to a strong commodity crop agriculture and dairy
industry in this part of the state, where more than 80% of the land is in corn, soybeans, or hay.
The nearest large-scale tree management program is Menominee Tribal Enterprises, owned and
operated by the Menominee Tribe, located about 40 miles away. Transportation costs
significantly limit the opportunities to use these feedstocks. Table 5, Biomass energy system
proposals based on pre-feasibility analysis for select Oneida Tribal facilities summarizes the
costs and payback for select buildings that may support biomass.
Table 5, Biomass energy system proposals based on pre-feasibility analysis for select Oneida Tribal facilities
Oneida Tribe of Indians of Wisconsin
Energy Optimization Model
DOE-EE0005055
Page 13 of 28
Ground-Source Thermal Ground-source energy technology is an expanding industry in northeast Wisconsin. Cost
effectiveness depends in part on buildings that require heating and cooling; building for one or
the other is not wise. The costs for balance of system infrastructure, such as heat pumps, are
relatively comparable to conventional appliances. The excavation work for these systems,
however, is significant whether it is for horizontal, vertical, or pond loops. The attention to detail
in the geotechnical reports cannot be overemphasized. So long as these systems are designed,
engineered, and constructed for newly constructed, large facilities or campus-style developments
by credible firms, this technology will provide some benefit to energy portfolio development.
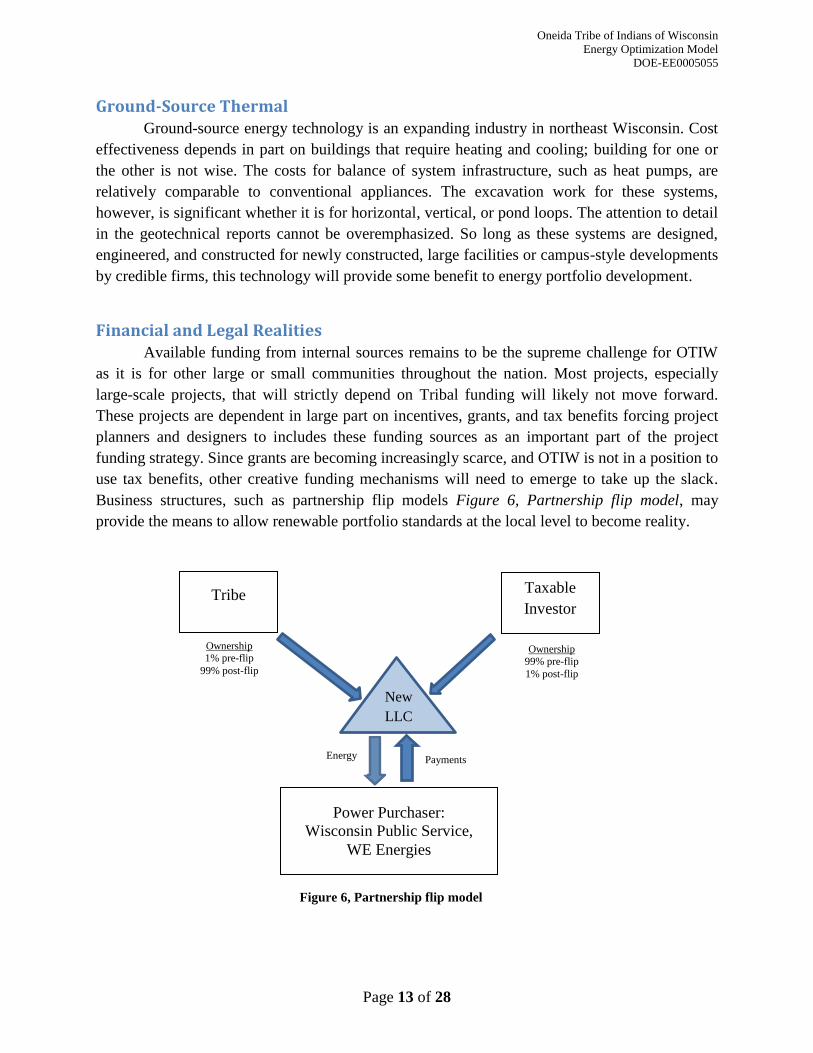
Financial and Legal Realities Available funding from internal sources remains to be the supreme challenge for OTIW
as it is for other large or small communities throughout the nation. Most projects, especially
large-scale projects, that will strictly depend on Tribal funding will likely not move forward.
These projects are dependent in large part on incentives, grants, and tax benefits forcing project
planners and designers to includes these funding sources as an important part of the project
funding strategy. Since grants are becoming increasingly scarce, and OTIW is not in a position to
use tax benefits, other creative funding mechanisms will need to emerge to take up the slack.
Business structures, such as partnership flip models Figure 6, Partnership flip model, may
provide the means to allow renewable portfolio standards at the local level to become reality.
Power Purchaser:
Wisconsin Public Service,
WE Energies
Tribe Taxable
Investor
Ownership 1% pre-flip
99% post-flip
Ownership
99% pre-flip
1% post-flip
New
LLC
Payments Energy
Figure 6, Partnership flip model

Oneida Tribe of Indians of Wisconsin
Energy Optimization Model
DOE-EE0005055
Page 14 of 28
As an example of funding challenges, recent financial calculations for a proposed large-
scale solar electric installation strongly suggest that without incentives, tax benefits, or investor
support, projects of significant magnitude remain to be elusive and rare. For this particular
project, the combination of a significant grant award and a partnership with an equity
investor can provide nearly 75% of the required capital in a $2 million project. The
National Renewable Energy Laboratory System Advisor Model was used to calculate the
financial metrics listed in Table 6, Preliminary comparison of financial metricsError!
Reference source not found.. Net present value and internal rate of return are
summarized. Four scenarios are outlined, a Grant + Power Purchase Agreement (PPA), a
Grant alone, a PPA alone, and no incentive. In this situation, the power purchase agreement
represents the equity investor’s contribution to the project. Clearly, the combination of
grants and other capital support to a long way in making energy projects reality.
Table 6, Preliminary comparison of financial metrics
of a large-scale solar proposal
Another example demonstrates the challenges with wind turbine construction. Figure 8,
Financial analysis #1 for wind proposal, shows that without financial incentives, a wind turbine
with a 25-year life has a payback of 23 years. On the other hand, Figure 9, Financial analysis #2
for wind proposal, demonstrates a 13 year payback for the same turbine, only with a 50% grant
to help with construction costs. In today’s economic climate, very few communities are in a
position to amass this kind of outside revenue with little or no obligation. This further does little
to encourage renewable portfolio development at the local level.

Oneida Tribe of Indians of Wisconsin
Energy Optimization Model
DOE-EE0005055
Page 15 of 28
Figure 7, Oneida Reservation potential wind turbine sites
Table 7, Oneida met-tower results

Oneida Tribe of Indians of Wisconsin
Energy Optimization Model
DOE-EE0005055
Page 16 of 28
Figure 8, Financial analysis #1 for wind proposal

Oneida Tribe of Indians of Wisconsin
Energy Optimization Model
DOE-EE0005055
Page 17 of 28
Figure 9, Financial analysis #2 for wind proposal

Oneida Tribe of Indians of Wisconsin
Energy Optimization Model
DOE-EE0005055
Page 18 of 28
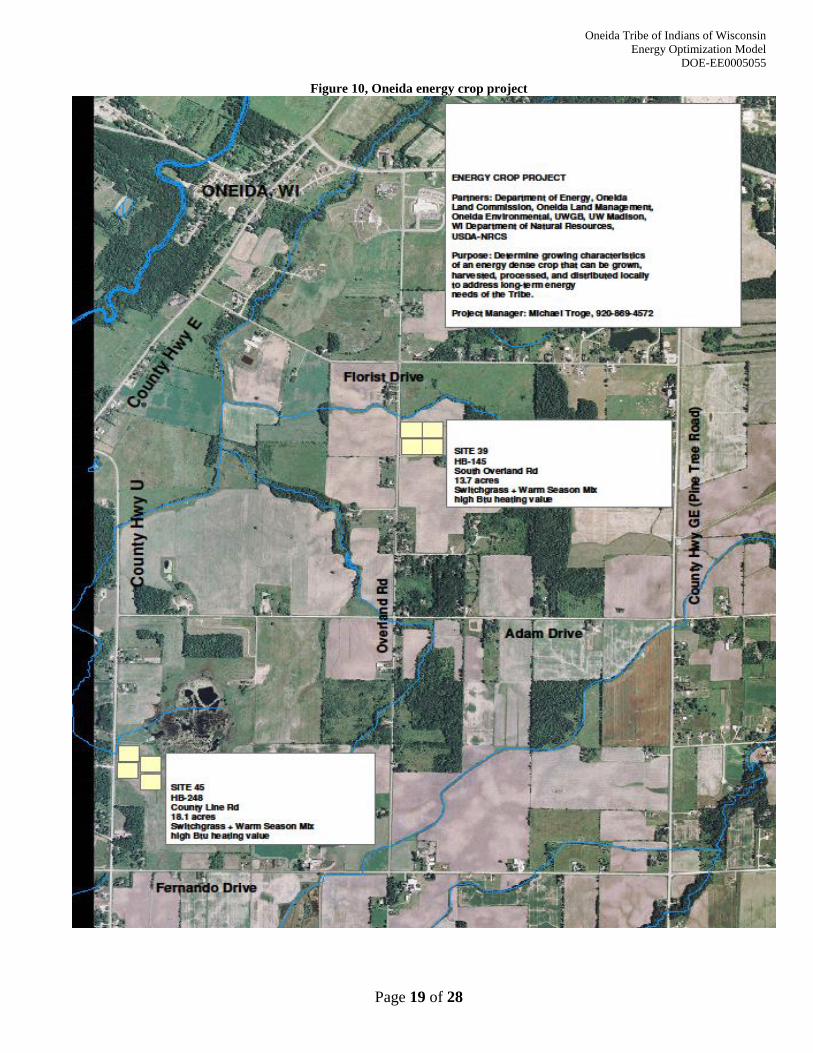
Energy Crop Component
OTIW is currently exploring local opportunities to grow and harvest its own energy crops
for heating purposes initially, but eventually expanding to include liquid fuel production. (There
are a few examples where a biomass energy crop has been used for electricity generation,
however this typically is supported where large-scale energy production facilities {e.g. coal-fired
power plants} will purchase a bioenergy crop material from local farming operations to
supplement their primary resource, coal; significant volumes are required to meet demand.) If
local supply and a robust technology can motivate and support a local demand for this energy
crop, then the local market for such a product may be able to support a self-sustaining energy
production operation.
We are working with the University of Wisconsin Green Bay on this energy crop test
plot. Refer to Figure 10, Oneida energy crop project. Oneida’s interest in the project has to do
with local production, processing, and use of a bioenergy crop. This can potentially be a local
and sustainable source of energy that minimizes fuel import and transport costs and it optimizes
local production and use. UWGB’s interest in the project has to do with feasibility of converting
marginal agricultural row-crop land (poorly drained soils) into perennial grasslands used for
biofuel production. Marginal land is the significant piece of this project; competition for land
between food and energy interests is being discouraged, in large part due to the impending
demand for prime farm land to support food production for a growing population. This also
suggests that carbon capture and carbon neutral bioenergy production systems will support
climate change mitigation policies and begin the transition away from carbon-rich fossil fuels
and associated emissions. Native grass species do serve a multi-functional purpose by providing
other local benefits beyond energy, including decreased water runoff, increased infiltration,
decreased contamination of local water ways from nonpoint waste, improved habitat, and
increased plant and animal diversity.
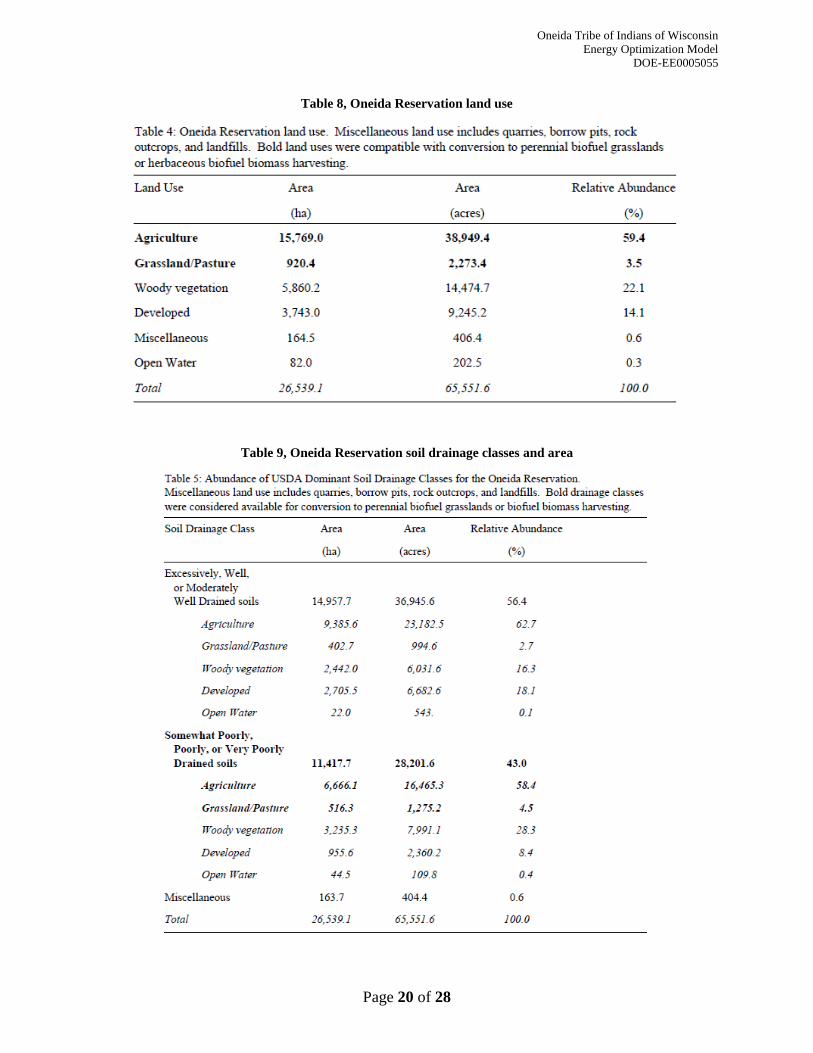
The Oneida Reservation does contain a significant amount of agricultural land. Refer to
Table 8, Oneida Reservation land use. The Energy Team has initiated this energy crop study,
that includes switchgrass, to investigate the Tribe’s ability to use their acres to grow a local
energy source for fuel or heat. See Figure 12, Energy crop fact sheet for additional information.
The literature shows that a typical yield is four to five harvested tons per acre per year. Based on
Tribal land use and acres of existing grasslands or a combination of marginal and prime
agricultural lands (Table 9, Oneida Reservation soil drainage classes and area), UWGB
forecasts 5,000 tons to 15,000 tons of available prairie grass material for harvest. It’s apparent,
however, that field results and market forces will be slow to develop. This activity requires a
level of patience and commitment until such benefits can show themselves. It’s up to decision
makers to commit to a vision.
Oneida Tribe of Indians of Wisconsin
Energy Optimization Model
DOE-EE0005055
Page 19 of 28
Figure 10, Oneida energy crop project
Oneida Tribe of Indians of Wisconsin
Energy Optimization Model
DOE-EE0005055
Page 20 of 28
Table 8, Oneida Reservation land use
Table 9, Oneida Reservation soil drainage classes and area
Oneida Tribe of Indians of Wisconsin
Energy Optimization Model
DOE-EE0005055
Page 21 of 28
Conclusions and Recommendations
The energy strategy for the Oneida Tribe of Indians of Wisconsin is a work in progress.
Our analysis has provided the initial starting point to integrate a broader clean energy strategy
into our current energy portfolio.
First and foremost, the strategy will emphasize the integration of energy efficiency into
buildings and infrastructure. This will require a working knowledge of technologies and
products as they become available.
1) The data supports a strategy with short term goals that pursue end-use opportunities
incorporating solar (electric and thermal) and bioenergy (wood pellets and cordwood)
into facilities and homes that have a need. Thermal ground-sources (i.e. geothermal) in
facilities and campus-style developments may also assist with energy portfolio goals.
2) Medium-term goals will analyze and identify large-scale community wind opportunities
as the social and economic climates evolve. Large-scale bioenergy opportunities may also
arise as markets become available.
3) Long-term goals will study bioenergy opportunities (for heat or fuel) that come from the
Tribe’s land management activities. Again, markets largely control if and when these
kinds of entrepreneurial ideas will be recognized. But from a sustainable energy
standpoint, the Tribe stands to gain from local production and consumption of a
bioenergy product in its own backyard.
In keeping with the presumption that an organization’s total energy use contributes to the
total national energy picture, all organizations will provide a collective good by
implementing their own clean energy portfolio. The challenge for any community will be
to keep energy usage at current levels with an ultimate goal to decrease energy usage
levels. In today’s belief that economic growth is essential, energy efficiency and
renewable energy are the most effective means to achieve reduction goals.
Clean energy is a complex issue. There are a broad range of variables that influence the
decision matrix that controls the smallest of projects to the largest of comprehensive strategies.
Any breakdown in the availability of resources, procurement of funding, advances in technology,
adaptability to infrastructure, acquiescence of recipients, or the migration of markets can render a
clean energy project lifeless at any stage. The economic system is undeniably the controlling
force by which most communities and nations solely base their decision points. Scientific
findings and sustainable principles have yet to infiltrate the board rooms where these decisions
are made. Political will remains to be the driving force that can overcome the restraints of project
or strategic execution. Policies at the local, state, and federal levels can provide incentive to
move in that direction. So far, however, those actions have not guaranteed any long-term shift
away from business-as-usual. Transitioning from a conventional energy to a clean energy
economy will take time, will require commitment, and it will not be easy.

Oneida Tribe of Indians of Wisconsin
Energy Optimization Model
DOE-EE0005055
Page 22 of 28
Lessons Learned
What follows are the lessons learned while working on this project. They are not listed in any
particular order:
Technologies and infrastructure have emerged into highly specialized industries.
Strategy development is highly influenced by markets and technology.
Strategy development requires careful thought and analysis.
Modeling energy investment scenarios in a dynamic economic and complex political
environment is challenging.
Buy-in and commitment are not automatic.
It takes a team of people to execute an opportunity.
A small number of large-scale energy projects are easier to manage and maintain
compared to a large number of small-scale projects.
The energy infrastructure is strictly driven by economic forces.
Energy considerations and strategies need consensus by a critical mass.
Energy portfolio development is plagued with immediate, single-project hesitations and
delays.
Payback does not account for a community’s long-term commitment to geographic roots.
Energy savings are not recognized as revenue in an organization’s accounting procedures.
The gradual erosion of policies, incentives, and tax benefits that support renewable
energy development will have a direct and profound impact on a successful clean energy
portfolio.
Oneida Tribe of Indians of Wisconsin
Energy Optimization Model
DOE-EE0005055
Page 23 of 28
Appendix
List of documents:
1. Figure 11, Energy optimization model; preliminary results fact sheet
2. Figure 12, Energy crop fact sheet
3. Figure 13, Initial solar deployment proposal on Tribal facilities information sheet

Oneida Tribe of Indians of Wisconsin
Energy Optimization Model
DOE-EE0005055
Page 24 of 28
Figure 11, Energy optimization model; preliminary results fact sheet

Oneida Tribe of Indians of Wisconsin
Energy Optimization Model
DOE-EE0005055
Page 25 of 28

Oneida Tribe of Indians of Wisconsin
Energy Optimization Model
DOE-EE0005055
Page 26 of 28
Figure 12, Energy crop fact sheet

Oneida Tribe of Indians of Wisconsin
Energy Optimization Model
DOE-EE0005055
Page 27 of 28

Oneida Tribe of Indians of Wisconsin
Energy Optimization Model
DOE-EE0005055
Page 28 of 28
Figure 13, Initial solar deployment proposal on Tribal facilities