Embed Size (px)
Citation preview

On Which Skills do Indian Universities EvaluateSoftware Engineering Students?
Hansaraj S. Wankhede, Sanil S. Gandhi, Arvind W KiwelekarDepartment of Computer Engineering
Dr. Babasaheb Ambedkar Technological UniversityLonere, Maharashtra, India
Email: {[email protected], [email protected], [email protected]}
Abstract—Universities conduct examinations to evaluate ac-quired skills and knowledge gained by students. An assessment ofskills and knowledge levels evaluated during Software Engineer-ing examinations is presented in this paper. The question itemsasked during examinations are analyzed from three dimensionsthat are cognitive levels, knowledge levels and knowledge areas.The Revised Bloom’s Taxonomy is used to classify questionitems along the dimensions of cognitive levels and knowledgelevels. Question items are also classified in various knowledgeareas specified in ACM/IEEE’s Computer Science Curricula.The analysis presented in this paper will be useful for softwareengineering educators to devise corrective interventions andemployers of fresh graduates to design pre-induction trainingprograms.
I. INTRODUCTION
An assessment of the skills acquired and knowledge gainedthrough a course on Software Engineering is equally useful toacademicians as well as industry professionals. Academicianscan use the results of the assessment to devise appropriateinterventions in case of the assessment results do not conformto the set learning objectives. Employers of fresh graduatesmay use the results of the assessment to design pre-inductiontraining programs.
One way to perform such an assessment is to analyzequestion papers used for conducting end-semester examina-tions because it includes the most relevant information requiredfor such an assessment. An end-semester question paper istypically designed to test students on diverse range of skillssuch as to recall a learned topic or to apply a learned methodto solve a particular problem. Further question papers includequestions from all the knowledge areas that are expected to becovered in a course on Software Engineering.
In this paper we classify questions asked in an examinationalong three dimensions, namely, cognitive levels, knowledgelevels and knowledge areas. The categories included in theRevised Bloom’s Taxonomy [7] are used to classify questionitems along the dimensions of knowledge and cognitive levels.Question items are also classified according to the topics in-cluded under various knowledge areas of Software Engineeringdefined in ACM/IEEE’s Computer Science Curricula 2013 [6],[1].
II. ANALYSIS FRAMEWORK
The classification framework used to analyze the questionitems is derived from two different sources. The main intention
Fig. 1: Three domains in the Analysis Framework
Fig. 2: Classification Categories in the Framework
of the classification framework is to analyze question itemsfrom three different dimensions as shown in Figure 1. The firsttwo dimensions are cognitive levels, knowledge levels as de-fined in Revised Bloom’s Taxonomy (RBT) [7]. Further, eachquestion item asked in Software Engineering examinationsbelongs to a particular topic or a course unit. Hence the topicsthat are covered under the Software Engineering knowledgeareas of ACM/IEEE Computer Science Curricula 2013 arealso included. The first two dimensions cover generic learningskills that educators intend to impart in students while the thirddimension covers domain specific skills that employers expectfrom a fresh-graduate.
arX
iv:1
601.
0179
6v1
[cs
.SE
] 8
Jan
201
6
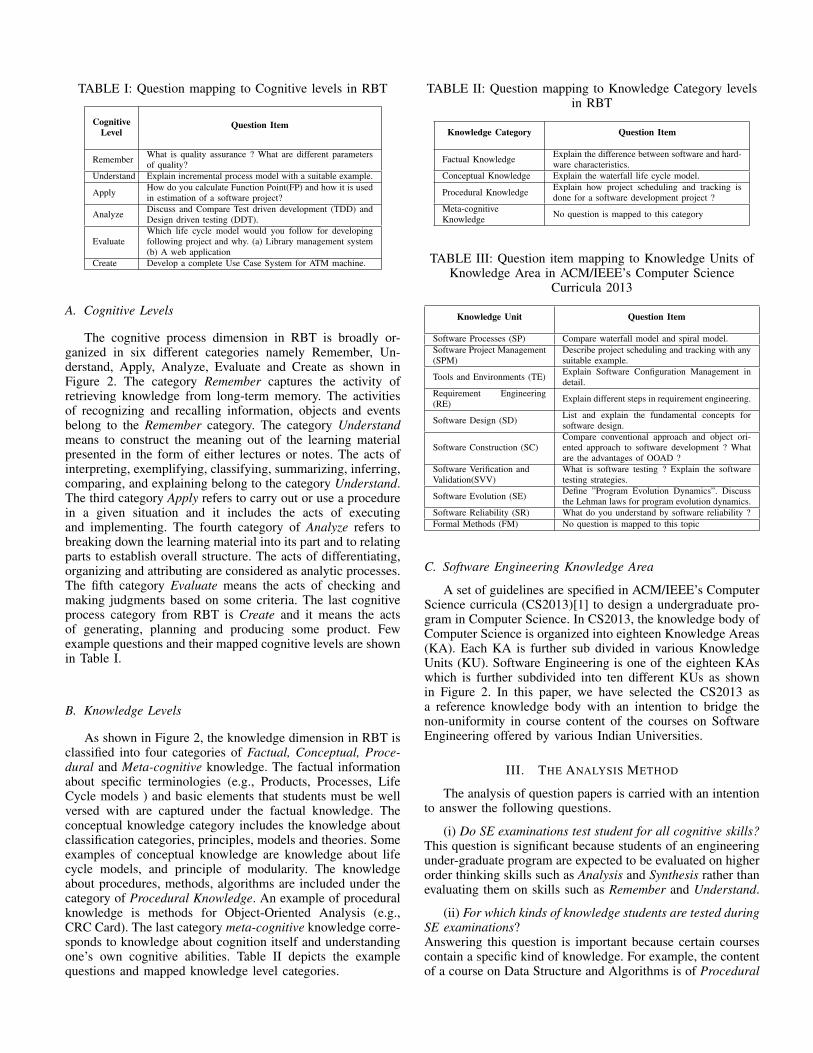
TABLE I: Question mapping to Cognitive levels in RBT
CognitiveLevel
Question Item
Remember What is quality assurance ? What are different parametersof quality?
Understand Explain incremental process model with a suitable example.
Apply How do you calculate Function Point(FP) and how it is usedin estimation of a software project?
Analyze Discuss and Compare Test driven development (TDD) andDesign driven testing (DDT).
EvaluateWhich life cycle model would you follow for developingfollowing project and why. (a) Library management system(b) A web application
Create Develop a complete Use Case System for ATM machine.
A. Cognitive Levels
The cognitive process dimension in RBT is broadly or-ganized in six different categories namely Remember, Un-derstand, Apply, Analyze, Evaluate and Create as shown inFigure 2. The category Remember captures the activity ofretrieving knowledge from long-term memory. The activitiesof recognizing and recalling information, objects and eventsbelong to the Remember category. The category Understandmeans to construct the meaning out of the learning materialpresented in the form of either lectures or notes. The acts ofinterpreting, exemplifying, classifying, summarizing, inferring,comparing, and explaining belong to the category Understand.The third category Apply refers to carry out or use a procedurein a given situation and it includes the acts of executingand implementing. The fourth category of Analyze refers tobreaking down the learning material into its part and to relatingparts to establish overall structure. The acts of differentiating,organizing and attributing are considered as analytic processes.The fifth category Evaluate means the acts of checking andmaking judgments based on some criteria. The last cognitiveprocess category from RBT is Create and it means the actsof generating, planning and producing some product. Fewexample questions and their mapped cognitive levels are shownin Table I.
B. Knowledge Levels
As shown in Figure 2, the knowledge dimension in RBT isclassified into four categories of Factual, Conceptual, Proce-dural and Meta-cognitive knowledge. The factual informationabout specific terminologies (e.g., Products, Processes, LifeCycle models ) and basic elements that students must be wellversed with are captured under the factual knowledge. Theconceptual knowledge category includes the knowledge aboutclassification categories, principles, models and theories. Someexamples of conceptual knowledge are knowledge about lifecycle models, and principle of modularity. The knowledgeabout procedures, methods, algorithms are included under thecategory of Procedural Knowledge. An example of proceduralknowledge is methods for Object-Oriented Analysis (e.g.,CRC Card). The last category meta-cognitive knowledge corre-sponds to knowledge about cognition itself and understandingone’s own cognitive abilities. Table II depicts the examplequestions and mapped knowledge level categories.
TABLE II: Question mapping to Knowledge Category levelsin RBT
Knowledge Category Question Item
Factual Knowledge Explain the difference between software and hard-ware characteristics.
Conceptual Knowledge Explain the waterfall life cycle model.
Procedural Knowledge Explain how project scheduling and tracking isdone for a software development project ?
Meta-cognitiveKnowledge No question is mapped to this category
TABLE III: Question item mapping to Knowledge Units ofKnowledge Area in ACM/IEEE’s Computer Science
Curricula 2013
Knowledge Unit Question Item
Software Processes (SP) Compare waterfall model and spiral model.Software Project Management(SPM)
Describe project scheduling and tracking with anysuitable example.
Tools and Environments (TE) Explain Software Configuration Management indetail.
Requirement Engineering(RE) Explain different steps in requirement engineering.
Software Design (SD) List and explain the fundamental concepts forsoftware design.
Software Construction (SC)Compare conventional approach and object ori-ented approach to software development ? Whatare the advantages of OOAD ?
Software Verification andValidation(SVV)
What is software testing ? Explain the softwaretesting strategies.
Software Evolution (SE) Define ”Program Evolution Dynamics”. Discussthe Lehman laws for program evolution dynamics.
Software Reliability (SR) What do you understand by software reliability ?Formal Methods (FM) No question is mapped to this topic
C. Software Engineering Knowledge Area
A set of guidelines are specified in ACM/IEEE’s ComputerScience curricula (CS2013)[1] to design a undergraduate pro-gram in Computer Science. In CS2013, the knowledge body ofComputer Science is organized into eighteen Knowledge Areas(KA). Each KA is further sub divided in various KnowledgeUnits (KU). Software Engineering is one of the eighteen KAswhich is further subdivided into ten different KUs as shownin Figure 2. In this paper, we have selected the CS2013 asa reference knowledge body with an intention to bridge thenon-uniformity in course content of the courses on SoftwareEngineering offered by various Indian Universities.
III. THE ANALYSIS METHOD
The analysis of question papers is carried with an intentionto answer the following questions.
(i) Do SE examinations test student for all cognitive skills?This question is significant because students of an engineeringunder-graduate program are expected to be evaluated on higherorder thinking skills such as Analysis and Synthesis rather thanevaluating them on skills such as Remember and Understand.
(ii) For which kinds of knowledge students are tested duringSE examinations?Answering this question is important because certain coursescontain a specific kind of knowledge. For example, the contentof a course on Data Structure and Algorithms is of Procedural
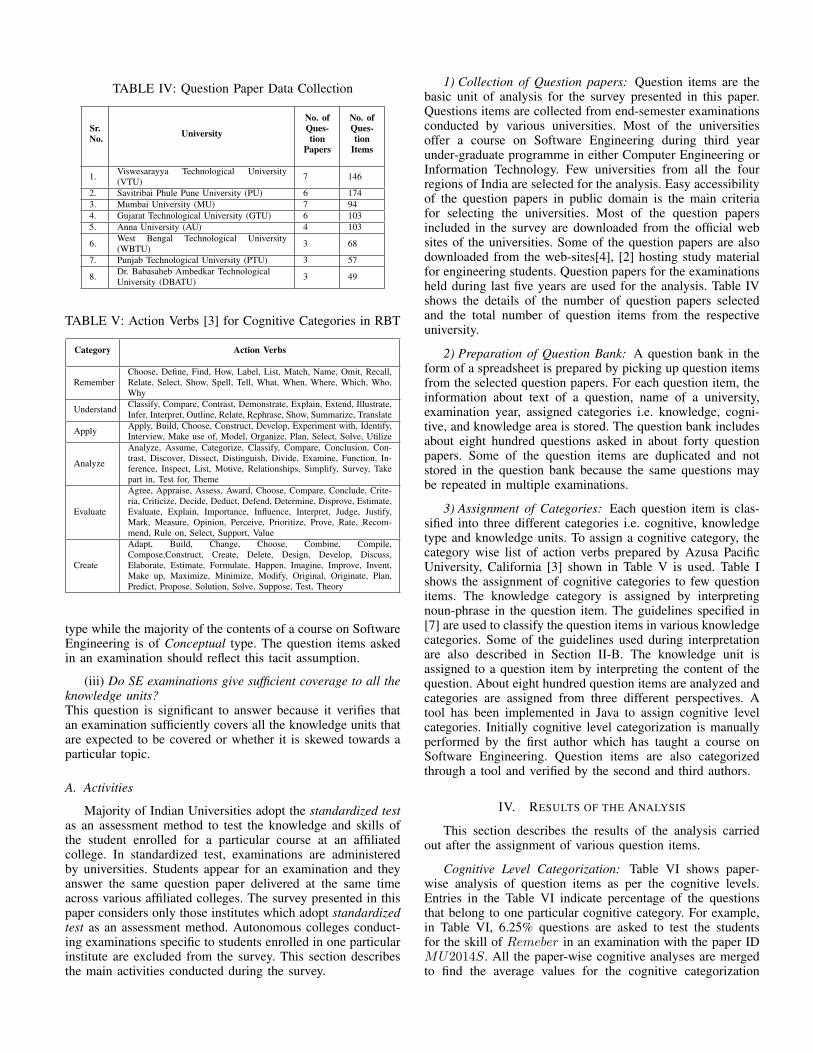
TABLE IV: Question Paper Data Collection
Sr.No. University
No. ofQues-tion
Papers
No. ofQues-tion
Items
1. Viswesarayya Technological University(VTU) 7 146
2. Savitribai Phule Pune University (PU) 6 1743. Mumbai University (MU) 7 944. Gujarat Technological University (GTU) 6 1035. Anna University (AU) 4 103
6. West Bengal Technological University(WBTU) 3 68
7. Punjab Technological University (PTU) 3 57
8. Dr. Babasaheb Ambedkar TechnologicalUniversity (DBATU) 3 49
TABLE V: Action Verbs [3] for Cognitive Categories in RBT
Category Action Verbs
RememberChoose, Define, Find, How, Label, List, Match, Name, Omit, Recall,Relate, Select, Show, Spell, Tell, What, When, Where, Which, Who,Why
Understand Classify, Compare, Contrast, Demonstrate, Explain, Extend, Illustrate,Infer, Interpret, Outline, Relate, Rephrase, Show, Summarize, Translate
Apply Apply, Build, Choose, Construct, Develop, Experiment with, Identify,Interview, Make use of, Model, Organize, Plan, Select, Solve, Utilize
Analyze
Analyze, Assume, Categorize, Classify, Compare, Conclusion, Con-trast, Discover, Dissect, Distinguish, Divide, Examine, Function, In-ference, Inspect, List, Motive, Relationships, Simplify, Survey, Takepart in, Test for, Theme
Evaluate
Agree, Appraise, Assess, Award, Choose, Compare, Conclude, Crite-ria, Criticize, Decide, Deduct, Defend, Determine, Disprove, Estimate,Evaluate, Explain, Importance, Influence, Interpret, Judge, Justify,Mark, Measure, Opinion, Perceive, Prioritize, Prove, Rate, Recom-mend, Rule on, Select, Support, Value
Create
Adapt, Build, Change, Choose, Combine, Compile,Compose,Construct, Create, Delete, Design, Develop, Discuss,Elaborate, Estimate, Formulate, Happen, Imagine, Improve, Invent,Make up, Maximize, Minimize, Modify, Original, Originate, Plan,Predict, Propose, Solution, Solve, Suppose, Test, Theory
type while the majority of the contents of a course on SoftwareEngineering is of Conceptual type. The question items askedin an examination should reflect this tacit assumption.
(iii) Do SE examinations give sufficient coverage to all theknowledge units?This question is significant to answer because it verifies thatan examination sufficiently covers all the knowledge units thatare expected to be covered or whether it is skewed towards aparticular topic.
A. Activities
Majority of Indian Universities adopt the standardized testas an assessment method to test the knowledge and skills ofthe student enrolled for a particular course at an affiliatedcollege. In standardized test, examinations are administeredby universities. Students appear for an examination and theyanswer the same question paper delivered at the same timeacross various affiliated colleges. The survey presented in thispaper considers only those institutes which adopt standardizedtest as an assessment method. Autonomous colleges conduct-ing examinations specific to students enrolled in one particularinstitute are excluded from the survey. This section describesthe main activities conducted during the survey.
1) Collection of Question papers: Question items are thebasic unit of analysis for the survey presented in this paper.Questions items are collected from end-semester examinationsconducted by various universities. Most of the universitiesoffer a course on Software Engineering during third yearunder-graduate programme in either Computer Engineering orInformation Technology. Few universities from all the fourregions of India are selected for the analysis. Easy accessibilityof the question papers in public domain is the main criteriafor selecting the universities. Most of the question papersincluded in the survey are downloaded from the official websites of the universities. Some of the question papers are alsodownloaded from the web-sites[4], [2] hosting study materialfor engineering students. Question papers for the examinationsheld during last five years are used for the analysis. Table IVshows the details of the number of question papers selectedand the total number of question items from the respectiveuniversity.
2) Preparation of Question Bank: A question bank in theform of a spreadsheet is prepared by picking up question itemsfrom the selected question papers. For each question item, theinformation about text of a question, name of a university,examination year, assigned categories i.e. knowledge, cogni-tive, and knowledge area is stored. The question bank includesabout eight hundred questions asked in about forty questionpapers. Some of the question items are duplicated and notstored in the question bank because the same questions maybe repeated in multiple examinations.
3) Assignment of Categories: Each question item is clas-sified into three different categories i.e. cognitive, knowledgetype and knowledge units. To assign a cognitive category, thecategory wise list of action verbs prepared by Azusa PacificUniversity, California [3] shown in Table V is used. Table Ishows the assignment of cognitive categories to few questionitems. The knowledge category is assigned by interpretingnoun-phrase in the question item. The guidelines specified in[7] are used to classify the question items in various knowledgecategories. Some of the guidelines used during interpretationare also described in Section II-B. The knowledge unit isassigned to a question item by interpreting the content of thequestion. About eight hundred question items are analyzed andcategories are assigned from three different perspectives. Atool has been implemented in Java to assign cognitive levelcategories. Initially cognitive level categorization is manuallyperformed by the first author which has taught a course onSoftware Engineering. Question items are also categorizedthrough a tool and verified by the second and third authors.
IV. RESULTS OF THE ANALYSIS
This section describes the results of the analysis carriedout after the assignment of various question items.
Cognitive Level Categorization: Table VI shows paper-wise analysis of question items as per the cognitive levels.Entries in the Table VI indicate percentage of the questionsthat belong to one particular cognitive category. For example,in Table VI, 6.25% questions are asked to test the studentsfor the skill of Remeber in an examination with the paper IDMU2014S. All the paper-wise cognitive analyses are mergedto find the average values for the cognitive categorization

TABLE VI: Paper wise Analysis Cognitive Categorization(% distribution)
PaperID Reme-mber
Under-stand Apply Analy-
zeEvalu-ate
Create
MU2014S 6.25 43.75 18.75 0.00 25.00 6.25
MU2013S 0.00 61.54 7.69 0.00 15.38 15.38
MU2012S 0.00 72.73 9.09 0.00 0.00 18.18
MU2014W 26.67 53.33 13.33 6.67 0.00 0.00
MU2013W 0.00 38.46 23.08 23.08 15.38 0.00
MU2012W 7.69 76.92 7.69 0.00 0.00 7.69
MU2011W 0.00 69.23 15.38 7.69 0.00 7.69
PU2014W 20.00 66.67 6.67 3.33 3.33 0.00
PU2013W 13.33 76.67 3.33 3.33 3.33 0.00
PU2012W 10.00 60.00 10.00 10.00 3.33 6.67
PU2014S 28.57 60.71 3.57 3.57 3.57 0.00
PU2013S 3.57 53.57 14.29 10.71 3.57 14.29
PU2011S 3.57 64.29 21.43 3.57 7.14 0.00
VU2014W 0.00 76.19 23.81 0.00 0.00 0.00
VU2013W 29.41 58.82 5.88 0.00 5.88 0.00
VU2012W 0.00 85.71 0.00 14.29 0.00 0.00
VU2011W 8.00 80.00 0.00 0.00 4.00 8.00
VU2012M 13.04 78.26 0.00 8.70 0.00 0.00
VU2013M 13.64 77.27 4.55 0.00 4.55 0.00
VU2014M 20.83 58.33 0.00 0.00 4.17 16.67
GU2014W 0.00 70.59 11.76 5.88 0.00 11.76
GU2013W 5.56 61.11 11.11 11.11 0.00 11.11
GU2014S 17.65 58.82 0.00 17.65 0.00 5.88
GU2013S 17.65 52.94 17.65 5.88 5.88 0.00
GU2012S 0.00 41.18 11.76 11.76 0.00 35.29
GU2011S 11.76 70.59 5.88 0.00 0.00 11.76
AU2014S 36.00 52.00 4.00 0.00 0.00 8.00
AU2013S 31.03 62.07 6.90 0.00 0.00 0.00
AU2013W 41.38 27.59 0.00 10.34 3.45 17.24
AU2012W 15.00 55.00 15.00 0.00 10.00 5.00
WBTU2013 33.33 33.33 11.11 5.56 11.11 5.56
WBTU2012 19.35 51.61 9.68 3.23 6.45 9.68
WBTU2011 36.84 36.84 5.26 10.53 0.00 10.53
PTU2010S 38.89 44.44 0.00 5.56 5.56 5.56
PTU2009W 76.19 23.81 0.00 0.00 0.00 0.00
PTU2009S 38.89 61.11 0.00 0.00 0.00 0.00
DBATU2015S 25.00 50.00 8.33 0.00 8.33 8.33
DBATU2014W 22.22 55.56 0.00 16.67 5.56 0.00
DBATU2014S 31.58 57.89 0.00 5.26 5.26 0.00
TABLE VII: Paper wise Analysis Knowledge Categorization(% distribution)
PaperID Factual Concep-tual
Proced-ural
Meta-Cognitive
MU2014S 18.75 50.00 31.25 0.00
MU2013S 0.00 61.54 38.46 0.00
MU2012S 0.00 63.64 36.36 0.00
MU2014W 26.67 53.33 20.00 0.00
MU2013W 7.69 53.85 38.46 0.00
MU2012W 15.38 69.23 15.38 0.00
MU2011W 0.00 53.85 46.15 0.00
PU2014W 6.67 66.67 26.67 0.00
PU2013W 6.67 60.00 33.33 0.00
PU2012W 3.33 43.33 53.33 0.00
PU2014S 39.29 25.00 35.71 0.00
PU2013S 10.71 39.29 50.00 0.00
PU2011S 7.14 53.57 39.29 0.00
VU2014W 4.76 28.57 66.67 0.00
VU2013W 17.65 47.06 35.29 0.00
VU2012W 14.29 35.71 50.00 0.00
VU2011W 24.00 20.00 56.00 0.00
VU2012M 26.09 43.48 30.43 0.00
VU2013M 40.91 22.73 36.36 0.00
VU2014M 25.00 33.33 41.67 0.00
GU2014W 5.88 47.06 47.06 0.00
GU2013W 11.11 50.00 38.89 0.00
GU2014S 41.18 17.65 41.18 0.00
GU2013S 17.65 58.82 23.53 0.00
GU2012S 11.76 35.29 52.94 0.00
GU2011S 35.29 41.18 23.53 0.00
AU2014S 40.00 36.00 24.00 0.00
AU2013S 34.48 27.59 37.93 0.00
AU2013W 34.48 20.69 44.83 0.00
AU2012W 20.00 55.00 25.00 0.00
WBTU2013 38.89 27.78 33.33 0.00
WBTU2012 29.03 41.94 29.03 0.00
WBTU2011 21.05 31.58 47.37 0.00
PTU2010S 50.00 16.67 33.33 0.00
PTU2009W 61.90 14.29 23.81 0.00
PTU2009S 16.67 27.78 55.56 0.00
DBATU2015S 33.33 33.33 33.33 0.00
DBATU2014W 33.33 44.44 22.22 0.00
DBATU2014S 21.05 63.16 15.79 0.00

TABLE VIII: Paper wise Analysis for Knowledge Areas (%distribution)
PaperID SP SPM TE RE SD SC SVV SE SR FM
MU2014S 25.00 31.25 12.50 6.25 25.00 0.00 0.00 0.00 0.00 0.00
MU2013S 0.00 25.00 25.00 16.67 16.67 0.00 16.67 0.00 0.00 0.00
MU2012S 0.00 33.33 11.11 22.22 33.33 0.00 0.00 0.00 0.00 0.00
MU2014W 14.29 28.57 7.14 14.29 14.29 7.14 7.14 7.14 0.00 0.00
MU2013W 8.33 33.33 16.67 8.33 8.33 16.67 8.33 0.00 0.00 0.00
MU2012W 8.33 25.00 8.33 25.00 25.00 0.00 8.33 0.00 0.00 0.00
MU2011W 0.00 33.33 8.33 16.67 16.67 8.33 8.33 0.00 8.33 0.00
PU2014W 20.00 30.00 0.00 0.00 30.00 0.00 20.00 0.00 0.00 0.00
PU2013W 23.33 23.33 3.33 3.33 26.67 0.00 20.00 0.00 0.00 0.00
PU2012W 23.33 23.33 3.33 3.33 26.67 0.00 20.00 0.00 0.00 0.00
PU2014S 25.00 21.43 7.14 10.71 14.29 0.00 14.29 3.57 3.57 0.00
PU2013S 14.29 28.57 3.57 10.71 17.86 3.57 21.43 0.00 0.00 0.00
PU2011S 17.86 32.14 3.57 3.57 28.57 0.00 14.29 0.00 0.00 0.00
VU2014W 25.00 5.00 0.00 20.00 25.00 0.00 15.00 5.00 5.00 0.00
VU2013W 23.53 17.65 0.00 17.65 17.65 5.88 5.88 5.88 5.88 0.00
VU2012W 28.57 14.29 0.00 14.29 7.14 0.00 14.29 7.14 14.29 0.00
VU2011W 20.00 16.00 8.00 16.00 24.00 4.00 0.00 4.00 8.00 0.00
VU2012M 26.09 17.39 0.00 17.39 13.04 0.00 13.04 0.00 13.04 0.00
VU2013M 22.73 22.73 0.00 13.64 18.18 0.00 9.09 4.55 9.09 0.00
VU2014M 25.00 12.50 0.00 12.50 25.00 4.17 8.33 0.00 12.50 0.00
GU2014W 35.29 17.65 5.88 11.76 17.65 0.00 11.76 0.00 0.00 0.00
GU2013W 22.22 27.78 11.11 0.00 22.22 0.00 16.67 0.00 0.00 0.00
GU2014S 17.65 23.53 5.88 29.41 11.76 0.00 11.76 0.00 0.00 0.00
GU2013S 18.75 31.25 6.25 6.25 18.75 0.00 12.50 0.00 6.25 0.00
GU2012S 29.41 11.76 0.00 5.88 35.29 0.00 17.65 0.00 0.00 0.00
GU2011S 29.41 17.65 5.88 5.88 11.76 5.88 17.65 5.88 0.00 0.00
AU2014S 24.00 12.00 8.00 12.00 20.00 4.00 20.00 0.00 0.00 0.00
AU2013S 6.90 17.24 6.90 13.79 24.14 6.90 20.69 0.00 3.45 0.00
AU2013W 13.79 17.24 3.45 24.14 17.24 3.45 20.69 0.00 0.00 0.00
AU2012W 21.05 15.79 0.00 21.05 21.05 0.00 21.05 0.00 0.00 0.00
WBTU2013 18.75 18.75 6.25 12.50 25.00 6.25 6.25 0.00 6.25 0.00
WBTU2012 3.33 16.67 0.00 13.33 23.33 3.33 30.00 3.33 6.67 0.00
WBTU2011 5.88 23.53 17.65 5.88 5.88 0.00 29.41 0.00 11.76 0.00
PTU2010S 11.11 22.22 0.00 22.22 5.56 0.00 33.33 0.00 5.56 0.00
PTU2009W 4.76 23.81 4.76 9.52 9.52 4.76 19.05 0.00 23.81 0.00
PTU2009S 16.67 22.22 11.11 5.56 27.78 5.56 5.56 0.00 5.56 0.00
DBATU2015S 18.18 27.27 0.00 9.09 27.27 0.00 9.09 0.00 9.09 0.00
DBATU2014W 12.50 25.00 0.00 6.25 43.75 6.25 6.25 0.00 0.00 0.00
DBATU2014S 11.76 11.76 0.00 23.53 35.29 5.88 11.76 0.00 0.00 0.00
Fig. 3: cognitive level wise contribution
Fig. 4: Knowledge category wise contribution
as shown in Figure 3. In summary, students are tested forcognitive categories in the order of Understand (58.44%),Remember(19.02%), Apply(7.56%), Create (6.05%), Analyze(5.04%), Evaluate (3.90%).
Knowledge Level Categorization: Table VII shows paper-wise analysis of question items according to knowledge types.Entries in the Table VII indicate percentage of the questionsthat belong to one particular type of knowledge. For example,in Table VII, 31.25% questions are asked to test the studentsfor the Procedure type of knowledge in an examination withthe paper ID MU2014S. All the paper-wise knowledge levelanalyses are merged to find the average values level distribu-tion as shown in Figure 4. In general, Indian universities teststudents for types of knowledge in the order of Conceptual(40.43%), Procedural(37.15%) and Factual(22.42%).
Distribution across the Knowledge Areas: Table VIIIshows paper-wise analysis of question items distributed acrossthe knowledge units. Entries in the Table VIII indicate percent-age of the questions that belong to one particular knowledgeunit. For example, in Table VIII, 25% questions are asked totest the students for the unit on Software Design(SD) in anexamination with the paper ID MU2014S. All the paper-wiseanalyses are merged to find the average values for distributionof question items across various knowledge units as shown inFigure 5. In general, Software Design (SD), Software ProjectManagement and Software Processes are three most favoredknowledge units to test software engineering specific skills.Surprisingly no university tests their students for knowledge ofFormalMethods(FM) in a course on Software Engineering.

Fig. 5: Knowledge Unit wise contribution
V. RELATED WORK
We have presented a survey on skill and knowledge levelsassessed through software engineering examinations conductedby Indian universities. Categories from the Revised Bloom’sTaxonomy are used to perform the analysis of question items.To the best of our knowledge, this might be the first attemptof conducting such a kind of survey in the context of IndianUniversities. However, the RBT has been extensively appliedby earlier researchers for various purposes. In this section,we present a brief review of applications of RBT in softwareengineering education and its applications in conducting ex-aminations.
In [5], authors propose a question paper preparation systembased on content-style separation principles. The purpose ofthe system was to generate questions belonging to differentcategories of the Bloom’s taxonomy. A generic visual modelfor an automated examination system has been proposedin [8] using UML as a modeling language. The system isgeneric in the sense that it can be configured according tothe requirements of an institution. Furthermore, the modelprovides performance analysis of students. The authors[10]present a report on a multi-institutional investigation into thereading and comprehension skills of novice programmers. TheBloom’s and SOLO taxonomies are used to analyze the resultsof a programming exercises carried out by students at a numberof universities. A rule-based classification scheme to analyzequestion items using Bloom’s taxonomy is presented in [9].The authors pointed out that effectiveness of such classifiersystems is one of the concerns while classifying question itemsaccording to Bloom’s Taxonomy.
Unlike these earlier applications of RBT, in this paper, wecombine RBT and software engineering specific knowledgeareas and use it as the framework to analyze question items.By adding SE knowledge areas in RBT, the analysis frameworkbecomes more relevant to assess software engineering specificskills.
VI. CONCLUSION
The paper presents a qualitative assessment of questionitems collected from end semester examinations for the courseon Software Engineering conducted by various Indian Uni-versities. While analyzing the question items, some of thechallenges relate with the use of tools and the action-verbs listused during cognitive categorization. Some action verbs appearin more than than one category. For example, the action verbChoose appears in categories: Remember, Apply, Evaluate,
and Create. So, it becomes difficult to categorize questionitems only on the basis of action verbs. In such situations,the context of a question needs to be taken into considerationfor the appropriate categorization of the question item.
Combining the RBT framework with domain specificknowledge areas is the main highlight of the analysis methodused in this paper. We found that the Revised Bloom’s Taxon-omy (RBT) is a useful framework to assess generic skills andknowledge levels tested. But it is inadequate to test domainspecific skills in general and Software Engineering specificskills in particular. To overcome this limitation of RBT frame-work, we extended it by adding Software Engineering specificknowledge areas. The second highlight of the paper is thecreation of a classified question bank of about eight hundredsquestions from the discipline of software engineering. Thisquestion bank in which each question item is classified asper cognitive and knowledge categories can also be used totest the performance and effectiveness of any automated toolimplemented for categorization of question items
The results of the analyses presented in this paper can beused to design an advanced course on Software Engineeringby universities or to design pre-induction training programs bysoftware development organizations.
REFERENCES
[1] https://www.acm.org/education/cs2013-final-report.pdf.[2] http://www.allsubjects4you.com/ptu-b.tech-cse-question-papers.htm.[3] http://www.apu.edu/live data/files/333/blooms taxonomy action verbs.pdf.[4] http://www.stupidsid.com/study-resources/documents/university-
papers.htm.[5] Kah Ming Boon and Lian Tze Lim. An examination question paper
preparation system with content-style separation and bloom’s taxonomycategorisation. In The Third International Conference on E-Learningand E-Technologies in Education (ICEEE2014), pages 39–47. TheSociety of Digital Information and Wireless Communication, 2014.
[6] Association for Computing Machinery (ACM) Joint Task Force onComputing Curricula and IEEE Computer Society. Computer ScienceCurricula 2013: Curriculum Guidelines for Undergraduate DegreePrograms in Computer Science. ACM, New York, NY, USA, 2013.999133.
[7] David R Krathwohl. A revision of bloom’s taxonomy: An overview.Theory into practice, 41(4):212–218, 2002.
[8] Muhammad Rashid Naeem, Weihua Zhu, Adeel Akbar Memon, andMuhammad Tahir. Improving automatic exams using generic uml modelfor better analysis and performance evaluation. American Journal ofSystems and Software, 2(2):50–55, 2014.
[9] Nazlia Omar, Syahidah Sufi Haris, Rosilah Hassan, Haslina Arshad,Masura Rahmat, Noor Faridatul Ainun Zainal, and Rozli Zulkifli.Automated analysis of exam questions according to bloom’s taxonomy.Procedia-Social and Behavioral Sciences, 59:297–303, 2012.
[10] Jacqueline L Whalley, Raymond Lister, Errol Thompson, Tony Clear,Phil Robbins, PK Kumar, and Christine Prasad. An australasianstudy of reading and comprehension skills in novice programmers,using the bloom and solo taxonomies. In Proceedings of the 8thAustralasian Conference on Computing Education-Volume 52, pages243–252. Australian Computer Society, Inc., 2006.


![INDEX []...Legislature as per section 2(f) of UGC Act 1956. JRU is also a member of Association of Indian Universities (AIU), JRU is also a member of Association of Indian Universities](https://img.dokumen.tips/doc/110x75/61090bd0ccee60315f03d8af/index-legislature-as-per-section-2f-of-ugc-act-1956-jru-is-also-a-member.jpg)