Embed Size (px)
Citation preview
Sadržaj / Content
Lista tabela List of tables ................................................................................................................................................................... 4 Lista grafikona List of graphs .................................................................................................................................................................. 6 Predgovor Preface ............................................................................................................................................................................ 9 Opći podaci o Bosni i Hercegovini General data about Bosnia and Herzegovina ............................................................................................................... 10
1. OTPADA / WASTE..................................................................................................................................................... 11 1.1 Otpad iz proizvodnih aktivnosti prema EWC-Stat Klasifikaciji Waste generated from production activities according to EWC – Stat Classification ..................................... 18 1.2 Otpad iz proizvodnih aktivnosti prema Listi otpada - LoW Waste generated from production activities according to European List of Waste - LoW ............................. 23 1.3 Komunalni otpad
Municipal waste .............................................................................................................................................. 27 1.4 Statistika vanjske trgovine – izvoz neopasnog otpada
Foreign trade statistics – export of non hazardous waste .............................................................................. 30 1.5 Statistika vanjske trgovine – uvoz neopasnog otpada Foreign trade statistics – import of non hazardous waste .............................................................................. 39 1.6 Prekogranični promet opasnog otpada Transboundary movement of hazardous waste ............................................................................................... 42
2. VODA / WATER ........................................................................................................................................................ 47 2.1 Skupljanje i distribucija vode
Collecting and distribution of water ................................................................................................................ 50 2.2 Javna odvodnja
Public sewerage ............................................................................................................................................... 52 2.3 Korištenje voda i zaštita voda od zagađivanja u industriji Utilization and protection of water against pollution in industry ................................................................... 56
3. VAZDUH / AIR .......................................................................................................................................................... 59 3.1 Supstance koje oštećuju ozonski omotač
Ozone depleting substances ............................................................................................................................ 61 3.2 Staklenički plinovi
Greenhouse gases ........................................................................................................................................... 64 4. ENERGIJA / ENERGY ................................................................................................................................................. 65
4.1 Godišnji energetski bilans Annual energy balance .................................................................................................................................... 70
4.2 Cijene električne energije i plina Prices of electric energy and natural gas ........................................................................................................ 76
5. SAOBRAĆAJ / TRANSPORT ....................................................................................................................................... 81 5.1 Infrastruktura
Infrastructure .................................................................................................................................................. 85 5.2 Prijevozna sredstva
Transportation vehicles ................................................................................................................................... 86 5.3 Željeznički saobraćaj
Railway transport ............................................................................................................................................ 87 5.4 Cestovni saobraćaj
Road transport ................................................................................................................................................ 88 5.5 Saobraćajne nezgode
Traffic accidents .............................................................................................................................................. 89 5.6 Vazdušni saobraćaj
Air transport .................................................................................................................................................... 91 Skraćenice, mjerne jedinice i simboli/Abbreviations, units of measure and symbols ................................................ 92 Izvori i literatura/Sources and literature ..................................................................................................................... 93
3
Lista tabela / List of tables
Tabela 1. Količina otpada iz proizvodnih aktivnosti, područje C, D i E Klasifikacije djelatnosti BiH, 2008-2009, tona Table 1. Quantity of waste generated from production activities, sectors C, D and E by NACE Rev. 1.1., 2008-2009, tones ................................................................................................................................................................................. 18 Tabela 2. Ukupna količina otpada iz proizvodnih aktivnosti prema statističkoj klasifikaciji EWC-Stat, 2008-2009, tona Table 2. Total quantity of waste from production activities by EWC-Stat Classification, 2008-2009, tones .................... 19 Tabela 3. Količina opasnog otpada iz proizvodnih aktivnosti, područje C, D i E Klasifikacije djelatnosti BiH, 2008-2009, tona Table 3. Quantity of hazardous waste generated from production activities, sectors C, D and E by NACE Rev. 1.1., 2008-2009, tones ....................................................................................................................................................................... 20 Tabela 4. Količina opasnog otpada iz proizvodnih aktivnosti prema statističkoj klasifikaciji EWC-Stat, 2008-2009, tona Table 4. Quantity of hazardous waste from production activities by EWC-Stat Classification, 2008-2009, tones ........... 20 Tabela 5. Ukupna količina otpada iz proizvodnih aktivnosti prema Listi otpada - LoW, 2008-2009, tona Table 5.Total waste quantity from production activities by European List of Waste - LoW, 2008-2009, tones ............... 23 Tabela 6. Količina opasnog otpada iz proizvodnih aktivnosti prema Listi otpada - LoW, 2008-2009, tona Table 6. Quantity of hazardous waste from production activities by European List of Waste - LoW, 2008-2009, tones . 25 Tabela 7. Količine otpada prikupljene javnim odvozom, 2008-2010, tona Table 7. Waste quantities collected by municipal enterprises, 2008-2010, tones ............................................................ 28 Tabela 8. Ukupna količina proizvedenog komunalnog otpada, 2008-2010 Table 8. Total amount of generated municipal waste, 2008-2010 ................................................................................... 28 Tabela 9. Ukupno proizvedeni komunalni otpad u EU i BiH, 2003-2010, kg/stan/god Table 9. Total municipal waste generation in EU and BiH, 2003-2010, kg/capita/year ................................................... 29 Tabela 10. Izvoz opasnog otpada, 2001-2009, tona Table 10. Export of hazardous waste, 2001-2009, tones .................................................................................................. 42 Tabela 11. Struktura izvezenog otpada, 2009, tona Table 11. Structure of hazardous waste, 2009, tones ....................................................................................................... 43 Tabela 12. Države uvoznice opasnog otpada, 2009, tona Table 12. States importing hazardous waste, 2009, tones ............................................................................................... 45 Tabela 13. Isporučene vode i gubici vode iz javnog vodovoda, 2008-2010, `000 m³ Table 13. Delivered water and water loss from public water system, 2008-2010, '000m3 ............................................... 50 Tabela 14. Isporučene vode iz javnog vodovoda, 2008-2010, `000 m³ Table 14. Volume of water delivered to users, 2008-2010, `000 m³ ................................................................................. 50 Tabela 15. Vodovodna mreža i uređaji, 2008-2010. Table 15. Water supply network and equipment, 2008-2010 .......................................................................................... 51 Tabela 16. Porijeklo otpadnih voda, 2008-2010 `000 m3 Table 16. Origin of waste waters, 2008-2010 `000 m3 ..................................................................................................... 52 Tabela 17. Kanalizaciona mreža, 2008-2010, km Table 17. Sewerage network, 2008-2010, km .................................................................................................................. 53 Tabela 18. Broj kanalizacionih priključaka, 2008-2010. Table 18. Number of connecting pipes, 2008-2010 .......................................................................................................... 54 Tabela 19. Ispuštene otpadne vode, (2008-2010) `000 m3 Table 19. Waste water discharge, (2008-2010) `000 m3 .................................................................................................. 54 Tabela 20. Snabdijevanje vodom, 2008-2010, '000m3 Table 20. Water supply,2008-2010, '000m3 ..................................................................................................................... 56 Tabela 21. Iskorištene količine vode, 2008-2010, '000m3 Table 21. Volume of water used, 2008-2010, '000m3 ....................................................................................................... 57 Tabela 22. Ispuštena otpadna voda, 2008-2010, `000 m³ Table 22. Discharged waste water, 2008-2010, `000 m³ .................................................................................................. 58 Tabela 23. Potrošnja SOOO, 1995-2010, tona Table 23. ODS Consumption, 1995-2010, tones ............................................................................................................... 62 Tabela 24. Emisija stakleničkih plinova iz sektora poljoprivrede, Bosna i Hercegovina, 2005-2009. Table 24. Greenhouse gas emissions from agriculture sector, Bosnia and Herzegovina, 2005-2009 ............................... 64 Tabela 25. Godišnji bilans električne energije, BiH, 2008-2010, GWh Table 25. Annual balance of electricity, BiH, 2008-2010, GWh ........................................................................................ 70 Tabela 26. Godišnji bilans snabdijevanja toplotom, BiH, 2008-2010, TJ Table 26. Annual balance of heat supply, BiH, 2008-2010, TJ .......................................................................................... 71
4
Tabela 27. Godišnji bilans prirodnog plina, BiH, 2009-2010, 1.000 Sm3 Table 27. Annual balance of natural gas, BiH, 2009-2010 1.000 Sm3 .............................................................................. 72 Tabela 28. Godišnji bilans lignita, BiH, 2009-2010, tona Table 28. Annual balance of Lignite, BiH, 2009-2010, tone .............................................................................................. 73 Tabela 29. Godišnji bilans mrkog uglja BiH, 2009-2010, tona Table 29. Annual balance of Brown Coal, BiH, 2009-2010, tone ...................................................................................... 74 Tabela 30. Godišnji bilans koksa, BiH, 2009-2010, tona Table 30. Annual balance of Coke-Oven Coke, BiH, 2009-2010, tone ............................................................................... 74 Tabela 31. Godišnji bilans kamenog uglja i antracita, BiH, 2009-2010, tona Table 31. Annual balance of Cooking Coal and Anthracite, BiH, 2009-2010, tone ........................................................... 75 Tabela 32. Utrošak energenata za proizvodnju energije, BiH, 2009-2010 Table 32. Fuel use for energy production, BiH, 2009-2010 ............................................................................................... 75 Tabela 33. Cijene električne energije i plina, prvo polugodište 2011, EUR/kWh Table 33. Prices of electric energy and natural gas, first semester 2011, EUR/kWh ........................................................ 77 Tabela 34. Infrastruktura, 2006-2010, km Table 34. Infrastructure, 2006-2010, km .......................................................................................................................... 85 Tabela 35. Registrovana cestovna motorna vozila, 2010. Table 35. Registered road motor vehicles, 2010 ............................................................................................................... 86 Tabela 36. Registrovana cestovna motorna vozila po tipu pogonske energije, 2010. Table 36. Registered road motor vehicles by type of motor energy, 2010 ....................................................................... 86 Tabela 37. Prvi put registrovana cestovna motorna vozila, 2010. Table 37. First time registered road motor vehicles, 2010 ............................................................................................... 87 Tabela 38. Prijevoz putnika u željezničkom saobraćaju, 2006-2010, ‘000 Table 38. Passenger railway transport, 2006-2010, ‘000 ................................................................................................. 87 Tabela 39. Prijevoz putnika u cestovnom saobraćaju, 2006-2010, ‘000 Table 39. Passenger road transport, 2006-2010,‘000 ...................................................................................................... 88 Tabela 40. Saobraćajne nezgode na cestama, 2006-2010 Table 40. Road traffic accidents, 2006-2010 .................................................................................................................... 89 Tabela 41. Poginule i povrijeđene osobe, 2006-2010 Table 41. Killed and injured persons, 2006-2010 .............................................................................................................. 90 Tabela 42. Prijevoz putnika u vazdušnom saobraćaju, 2006-2010. Table 42. Transport of passenger in air transport, 2006-2010 ......................................................................................... 91 Tabela 43. Prijevoz robe i pošte vazdušnim saobraćajem, 2008-2010. Table 43. Transport of goods and mail by air transport, 2008-2010 ................................................................................ 91
5
Lista grafikona / List of graphs
Grafikon 1. Količina otpada iz proizvodnih aktivnosti, područje C, D i E Klasifikacije djelatnosti BiH, 2008-2009, tona Graph 1. Quantity of waste generated from production activities, sectors C, D and E by NACE Rev. 1.1., 2008-2009, tones ................................................................................................................................................................................. 18 Grafikon 2. Ukupna količina otpada iz proizvodnih aktivnosti po EWC-Stat klasifikaciji, 2008-2009, tona Graph 2. Total quantity of waste from production activities by EWC-Stat Classification, 2008-2009, tones ................... 20 Grafikon 3. Količina opasnog otpada iz proizvodnih aktivnosti, područje C, D i E Klasifikacije djelatnosti BiH, 2008-2009, tona Graph 3. Quantity of hazardous waste generated from production activities, sectors C, D and E by NACE Rev. 1.1., 2008-2009, tones .............................................................................................................................................................. 20 Grafikon 4. Količina opasnog otpada iz proizvodnih aktivnosti prema statističkoj klasifikaciji EWC-Stat, 2008-2009, tona Graph 4. Quantity of hazardous waste from production activities by EWC-Stat Classification, 2008-2009, tones .......... 22 Grafikon 5. Količina otpada iz proizvodnih aktivnosti prema Listi otpada - LoW, 2008-2009, tona Graph 5. Waste quantity from production activities by European List of Waste - LoW, 2008-2009, tones ..................... 24 Grafikon 6. Količina opasnog otpada iz proizvodnih aktivnosti prema Listi otpada - LoW, 2008-2009, tona Graph 6. Quantity of hazardous waste from production activities by European List of Waste - LoW, 2008-2009, tones 26 Grafikon 7. Količina proizvedenog komunalnog otpada, 2008-2010, tona Graph 7. Amount of generated communal waste, 2008-2010, tone. .............................................................................. 28 Grafikon 8. Ukupno proizvedeni komunalni otpad u EU i BiH, 2003-2010, kg/stan./god Graph 8. Total municipal waste generation in EU and BiH, 2003-2010, kg/capita/year .................................................. 29 Grafikon 9. Izvoz metalnog otpada, 2006-2010, tona Graph. 9. Export of metal waste, 2006-2010, tone .......................................................................................................... 33 Grafikon 10. Struktura izvezenog metalnog otpada, 2010. Graph 10. Structure of exported metal waste, 2010 ........................................................................................................ 33 Grafikon 11. Države u koje se izvozio metalni otpad, 2010. Graph 11. Countries to which metal waste was exported, 2010 ...................................................................................... 34 Grafikon 12. Izvoz staklenog otpada, 2006-2010, tona Graph 12. Export of glass waste, 2006-2010, tone ........................................................................................................... 34 Grafikon 13. Izvoz tekstilnog otpada, 2006-2010, tona Graph 13. Export of textile waste, 2006-2010, tone ......................................................................................................... 35 Grafikon 14. Izvoz otpadnog papira i kartona, 2006-2010, tona Graph 14. Export of waste paper and cardboard, 2006-2010, tone ................................................................................. 36 Grafikon 15. Države u koje se izvozio otpadni papir i karton, 2010. Graph 15. Countries to which waste paper and cardboard was exported, 2010 .............................................................. 36 Grafikon 16. Izvoz plastičnog otpada, 2006-2010, tona Graph 16. Export of plastic waste, 2006-2010, tone ........................................................................................................ 37 Grafikon 17. Izvoz neopasne šljake i pepela, 2006-2010, tona Graph 17. Export of non - hazardous waste sludge and ash, 2006-2010, tone ................................................................ 37 Grafikon 18. Države u koje se izvozila neopasna šljaka i pepeo, 2010. Graph 18. Countries to which non - hazardous waste sludge and ash was exported, 2010 ............................................. 38 Grafikon 19. Uvoz metalnog otpada, 2006-2010, tona Graph. 19. Import of metal waste, 2006-2010, tone ........................................................................................................ 39 Grafikon 20. Države iz kojih se izvozio metalni otpad, 2010. Graph 20. Countries from which metal waste was imported, 2010 ................................................................................. 39 Grafikon 21. Uvoz tekstilnog otpada, 2006-2010, tona Graph 21. Import of textile waste, 2006-2010, tone ........................................................................................................ 40 Grafikon 22. Uvoz otpadnog papira i kartona, 2006-2010, tona Graph 22. Import of waste paper and cardboard, 2006-2010, tone ................................................................................ 40 Grafikon 23. Uvoz plastičnog otpada, 2006-2010, tona Graph 23. Import of plastic waste, 2006-2010, tone ........................................................................................................ 41 Grafikon 24. Izvoz opasnog otpada, 2001-2009, tona Graph 24. Export of hazardous waste, 2001-2009, tones ................................................................................................. 42 Grafikon 25. Struktura izvezenog otpada, 2009, procenat Graph 25. Structure of hazardous waste, 2009, percentage ............................................................................................ 44 Grafikon 26. Države uvoznice opasnog otpada, 2009, procenat Graph 26. Countries importers of hazardous waste in 2009, percentage ........................................................................ 45
6
Grafikon 27. Odnos isporučenih količina i gubitaka vode u javnom vodovodu, 2008-2010, `000 m³ Graph 27. Relation of total delivered water and water loss in public water system, 2008-2010, `000 m³ ...................... 50 Grafikon 28. Isporučene vode iz javnog vodovoda, 2008-2010, `000 m³ Graph 28. Volume of water delivered to users, 2008-2010, `000 m³ ................................................................................ 51 Grafikon 29. Vodovodna mreža i uređaji, 2008-2010. Graph 29. Water supply network and equipment, 2008-2010 ......................................................................................... 51 Grafikon 30. Porijeklo otpadnih voda, 2008-2010 `000 m3 Graph 30. Origin of waste waters, 2008-2010 `000 m3 .................................................................................................... 53 Grafikon 31. Kanalizaciona mreža, 2008-2010, km Graph 31. Sewerage network, 2008-2010, km ................................................................................................................. 53 Grafikon 32. Broj kanalizacionih priključaka, 2008-2010. Graph 32. Number of connecting pipes, 2008-2010 ......................................................................................................... 54 Grafikon 33. Prečišćene otpadne vode, 2008-2010, `000 m3 Graph 33. Purified waste waters, 2008-2010, `000 m3 ..................................................................................................... 55 Grafikon 34. Snabdijevanje vodom, 2008-2010, '000m3 Graph 34. Water supply, 2008-2010, '000m3 ................................................................................................................... 57 Grafikon 35. Potrošnja SOOO, 1995-2010, tona Graph 35. ODS Consumption, 1995-2010, tones .............................................................................................................. 63 Grafikon 36. Emisija stakleničkih plinova iz sektora poljoprivrede, 1990-2010, tona Graph 36. Greenhouse gas emissions from agriculture sector, 1990-2010, tone ............................................................. 64 Grafikon 37. Bruto proizvodnja električne energije, 2008-2010, GWh Graph 37. Gross electricity production, 2008-2010, GWh ................................................................................................ 70 Grafikon 38. Finalna potrošnja električne energije, 2008-2010, GWh Graph 38. Final electricity consumption, 2008-2010, GWh .............................................................................................. 71 Grafikon 39. Proizvodnja energije transformacijom, 2008-2010, TJ Graph 39. Transformation output, 2008-2010, TJ ............................................................................................................ 72 Grafikon 40. Finalna potrošnja prirodnog plina, 2009-2010, 1.000 Sm3 Graph 40. Final natural gas consumption, 2009-2010, 1.000 Sm3 ................................................................................... 73 Grafikon 41. Cijene električne energije za domaćinstva, 2011, EUR/kWh Graph 41. Electricity prices for households, 2011, EUR/kWh ........................................................................................... 78 Grafikon 42. Cijene električne energije za industriju, 2011, EUR/kWh Graph 42. Electricity prices for industry, 2011, EUR/kWh ................................................................................................ 78 Grafikon 43. Cijene prirodnog plina za domaćinstva, 2011, EUR/kWh Graph 43. Natural gas prices for households, 2011, EUR/kWh ........................................................................................ 79 Grafikon 44. Cijene prirodnog plina za industriju, 2011, EUR/kWh Graph 44. Natural gas prices for industry, 2011, EUR/kWh ............................................................................................. 79 Grafikon 45. Registrovana cestovna motorna vozila, 2010. Graph 45. Registered road motor vehicle, 2010 ............................................................................................................... 86 Grafikon 46. Registrovana cestovna motorna vozila po tipu pogonske energije, 2010. Graph 46. Registered road motor vehicles by type of motor energy, 2010 ...................................................................... 86 Grafikon 47. Prvi put registrovana cestovna motorna vozila, 2010. Graph 47. First time registered road motor vehicles, 2010 .............................................................................................. 87 Grafikon 48. Prevezeni putnici, 2006-2010, ‘000 Graph 48. Passengers transported, 2006-2010, ‘000 ....................................................................................................... 87 Grafikon 49. Prevezena roba, 2006-2010, ‘000 Graph 49. Transport of goods, ‘000 .................................................................................................................................. 88 Grafikon 50. Prevezeni putnici u cestovnom saobraćaju, 2006-2010, ‘000 Graph 50. Passengers transported in road transport, 2006-2010,‘000 ............................................................................ 89 Grafikon 51. Prevezena roba u cestovnom saobraćaju, 2006-2010, ‘000 Graph .51. Tons of goods transported, 2006-2010,‘000 ................................................................................................... 89 Grafikon 52. Saobraćajne nezgode u cestovnom saobraćaju, 2006-2010. Graph 52. Road traffic accidents in road transport, 2006-2010 ....................................................................................... 90 Grafikon 53. Poginule i povrijeđene osobe u saobraćajnim nezgodama, 2006-2010. Graph 53. Killed and injured persons in road traffic accidents, 2006-2010 ...................................................................... 90 Grafikon 54. Prevezeni putnici vazdušnim saobraćajem, 2006-2010. Graph 54. Passengers transported by air transport, 2006-2010 ...................................................................................... 91 Grafikon 55. Prevezena roba i pošta vazdušnim saobraćajem, 2008-2010. Graph 55. Transport of goods and mail by air transport, 2008-2010 ............................................................................... 91
7

Predgovor
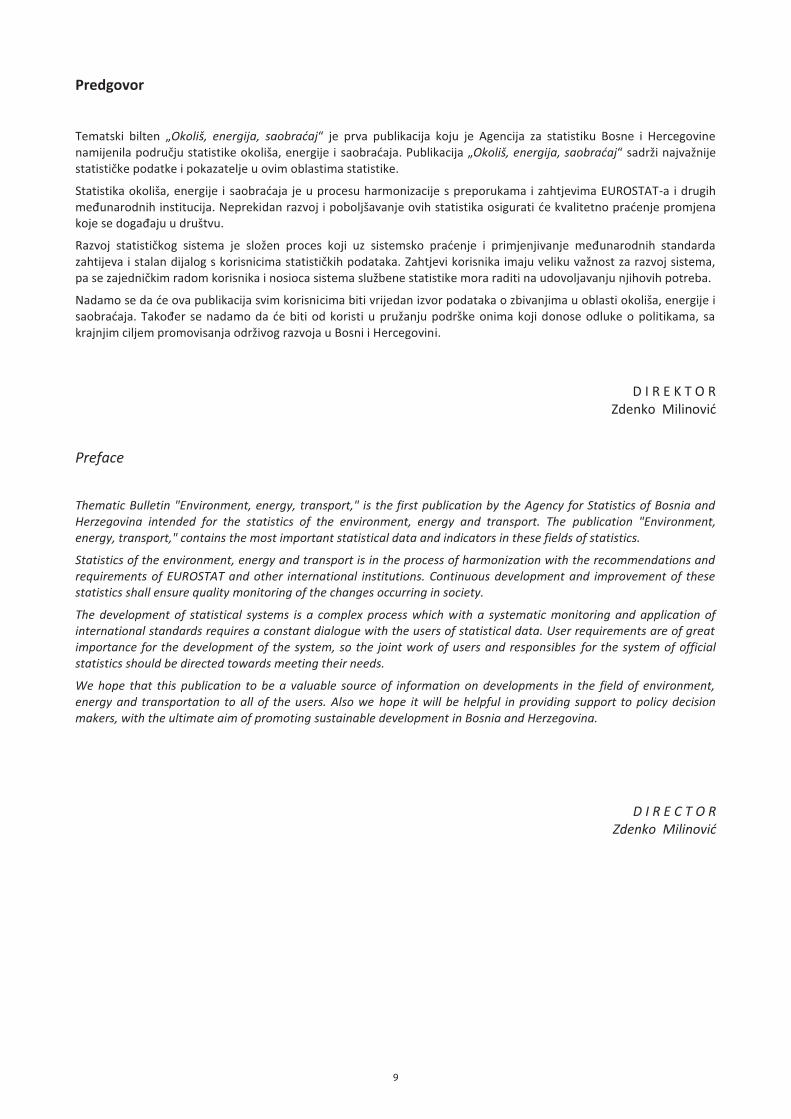
Tematski bilten „Okoliš, energija, saobraćaj“ je prva publikacija koju je Agencija za statistiku Bosne i Hercegovine namijenila području statistike okoliša, energije i saobraćaja. Publikacija „Okoliš, energija, saobraćaj“ sadrži najvažnije statističke podatke i pokazatelje u ovim oblastima statistike.
Statistika okoliša, energije i saobraćaja je u procesu harmonizacije s preporukama i zahtjevima EUROSTAT-a i drugih međunarodnih institucija. Neprekidan razvoj i poboljšavanje ovih statistika osigurati će kvalitetno praćenje promjena koje se događaju u društvu.
Razvoj statističkog sistema je složen proces koji uz sistemsko praćenje i primjenjivanje međunarodnih standarda zahtijeva i stalan dijalog s korisnicima statističkih podataka. Zahtjevi korisnika imaju veliku važnost za razvoj sistema, pa se zajedničkim radom korisnika i nosioca sistema službene statistike mora raditi na udovoljavanju njihovih potreba.
Nadamo se da će ova publikacija svim korisnicima biti vrijedan izvor podataka o zbivanjima u oblasti okoliša, energije i saobraćaja. Također se nadamo da će biti od koristi u pružanju podrške onima koji donose odluke o politikama, sa krajnjim ciljem promovisanja održivog razvoja u Bosni i Hercegovini.
D I R E K T O R Zdenko Milinović
Preface Thematic Bulletin "Environment, energy, transport," is the first publication by the Agency for Statistics of Bosnia and Herzegovina intended for the statistics of the environment, energy and transport. The publication "Environment, energy, transport," contains the most important statistical data and indicators in these fields of statistics.
Statistics of the environment, energy and transport is in the process of harmonization with the recommendations and requirements of EUROSTAT and other international institutions. Continuous development and improvement of these statistics shall ensure quality monitoring of the changes occurring in society.
The development of statistical systems is a complex process which with a systematic monitoring and application of international standards requires a constant dialogue with the users of statistical data. User requirements are of great importance for the development of the system, so the joint work of users and responsibles for the system of official statistics should be directed towards meeting their needs.
We hope that this publication to be a valuable source of information on developments in the field of environment, energy and transportation to all of the users. Also we hope it will be helpful in providing support to policy decision makers, with the ultimate aim of promoting sustainable development in Bosnia and Herzegovina.
D I R E C T O R
Zdenko Milinović
9
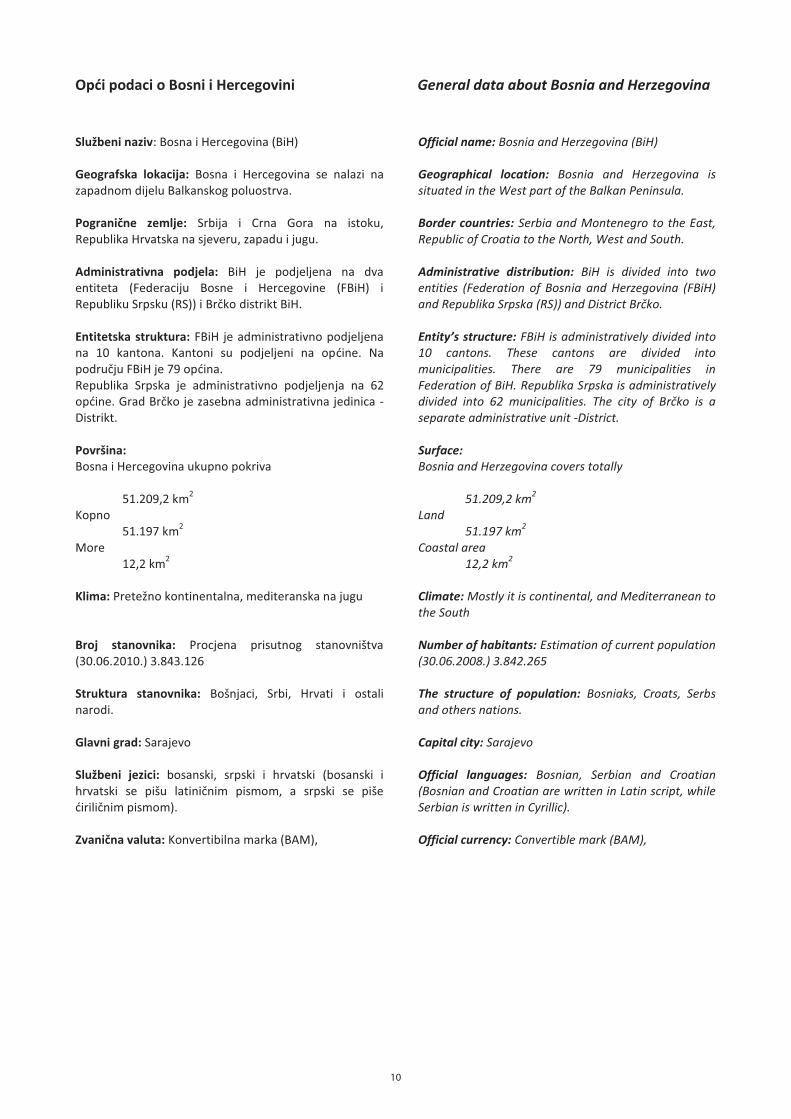
Opći podaci o Bosni i Hercegovini General data about Bosnia and Herzegovina
Službeni naziv: Bosna i Hercegovina (BiH)
Official name: Bosnia and Herzegovina (BiH)
Geografska lokacija: Bosna i Hercegovina se nalazi na zapadnom dijelu Balkanskog poluostrva.
Geographical location: Bosnia and Herzegovina is situated in the West part of the Balkan Peninsula.
Pogranične zemlje: Srbija i Crna Gora na istoku, Republika Hrvatska na sjeveru, zapadu i jugu.
Border countries: Serbia and Montenegro to the East, Republic of Croatia to the North, West and South.
Administrativna podjela: BiH je podjeljena na dva entiteta (Federaciju Bosne i Hercegovine (FBiH) i Republiku Srpsku (RS)) i Brčko distrikt BiH.
Administrative distribution: BiH is divided into two entities (Federation of Bosnia and Herzegovina (FBiH) and Republika Srpska (RS)) and District Brčko.
Entitetska struktura: FBiH je administrativno podjeljena na 10 kantona. Kantoni su podjeljeni na općine. Na području FBiH je 79 općina. Republika Srpska je administrativno podjeljenja na 62 općine. Grad Brčko je zasebna administrativna jedinica - Distrikt.
Entity’s structure: FBiH is administratively divided into 10 cantons. These cantons are divided into municipalities. There are 79 municipalities in Federation of BiH. Republika Srpska is administratively divided into 62 municipalities. The city of Brčko is a separate administrative unit -District.
Površina: Surface: Bosna i Hercegovina ukupno pokriva Bosnia and Herzegovina covers totally
51.209,2 km2 51.209,2 km2 Kopno Land 51.197 km2 51.197 km2 More Coastal area 12,2 km2 12,2 km2 Klima: Pretežno kontinentalna, mediteranska na jugu
Climate: Mostly it is continental, and Mediterranean to the South
Broj stanovnika: Procjena prisutnog stanovništva (30.06.2010.) 3.843.126
Number of habitants: Estimation of current population (30.06.2008.) 3.842.265
Struktura stanovnika: Bošnjaci, Srbi, Hrvati i ostali narodi.
The structure of population: Bosniaks, Croats, Serbs and others nations.
Glavni grad: Sarajevo
Capital city: Sarajevo
Službeni jezici: bosanski, srpski i hrvatski (bosanski i hrvatski se pišu latiničnim pismom, a srpski se piše ćiriličnim pismom).
Official languages: Bosnian, Serbian and Croatian (Bosnian and Croatian are written in Latin script, while Serbian is written in Cyrillic).
Zvanična valuta: Konvertibilna marka (BAM), Official currency: Convertible mark (BAM),
10

Metodološka objašnjenja i definicije Methodological notes and definitions
Osnova za prikupljanje podataka o statistici otpada su statistička istraživanja predviđena u godišnjem Planu rada Agencije za statistiku BiH i godišnjih planova entitetskih statističkih institucija:
Statistika otpada uključuje četiri različita istraživanja:
� Godišnji istraživanje o generiranju otpada u proizvodnim aktivnostima – OTP
� Godišnje istraživanje o preradi/odstranjivanju otpada OTP-P
� Godišnje istraživanje o sakupljenom komunalnom otpadu (KOM- 6aS)
� Godišnje istraživanje o otpadu odloženom na deponije, KOM-6aD
Istraživanjem se obezbjeđuju strukturni podaci o otpadu prema Statističkoj nomenklaturi otpada EWC-Stat i u skladu sa Regulativom o statistici otpada 2150/2002/EC. Regulativa 2150/2002/EC Evropskog parlamenta i Vijeća od 25. novembra 2002. godine obavezuje izvještavanje Evropskog statističkog ureda (EUROSTAT) o statističkim podacima o otpadu, kao i korištenje zajedničkih definicija i klasifikacija.
The basis for collecting data on waste statisticsares statistical surveys foreseen by the Annual Plan of the Agency for Statistics and the Annual Plan of Entity statistics institutions:
Waste statistics include four different surveys:
� Annual survey on waste generation in production activities – OTP
� Annual survey on the processing / removing waste - OTP-P
� Annual survey of collected municipal waste - KOM-6aS
� Annual survey of waste disposed to landfill - KOM-6aD
Survey provides structural data on waste by waste statistical Classification EWC-Stat in accordance with Regulation 2150/2002/EC on waste statistics. Regulation 2150/2002/EC of the European Parliament and the Council of 25 November 2002 requires reporting to the European Statistical Office (EUROSTAT) about the statistical data on waste, as well as the use of common definitions and classifications.
Agencija za statistiku Bosne i Hercegovine poštujući odredbe ove Regulative, prikazuje podatke o nastajanju otpada u proizvodnim aktivnostima prema Klasifikaciji ekonomskih djelatnosti i 48 kategorija otpada, kako opasnog, tako i neopasnog. Za prikaz podataka su korištene dvije klasifikacije otpada: evropska Lista otpada - LoW i statistička klasifikacija otpada - EWC-Stat.
Agency for Statistics of Bosnia and Herzegovina following the provisions of these Regulations, display the data on waste generation in production activities according to the classification of economic activities and 48 categories of waste, both hazardous, and nonhazardous. To view the data, two classifications of waste were used: European List of Waste - LoW and Statistical Classification of Waste - EWC-Stat.
Podaci o otpadu nastalom u proizvodnim aktivnostima u referentnom periodu 2008 – 2010. prikupljaju se putem statističkog istraživanja OTP.
Data on waste as a result from the production activities during the reference period of 2008 – 2010 are collected by the statistical surveys OTP.
Izvještajne jedinice za ovo istraživanje su poslovni subjekti i dijelovi poslovnih subjekata koji su registrovani u sektoru C - vađenje ruda i kamena, D - prerađivačka industrija i E – Proizvodnja i snabdijevanje električnom energijom, plinom i toplom vodom prema Klasifikaciji djelatnosti (KD BiH). U istraživanju učestvuju subjekti koji imaju 10 i više zaposlenih. Podaci su dobiveni evidentiranjem i dokumentiranjem, a tamo gdje nije moguće, procjenom.
Reporting units for this study are business entities and parts of businesses which are registered in sector C - Mining and quarrying, D - Manufacturing and E - Electricity, gas and hot water production and supply from the Classification of Economic Activities (NACE Rev. 1.1). Operators taken into account are those who have 10 or more employees. Data were obtained by recording and documenting, and where not possible, an estimate.
Otpad je svaka tvar ili predmet određen kategorijama otpada propisanim provedbenim propisom Zakona o upravljanju otpadom FBiH (Sl. novine FBiH 33/03), i Zakona o upravljanju otpadom RS (Sl. Gl. 53/02) koje posjednik odbacuje, namjerava ili mora odbaciti.
Waste is any substance or item determined by certain waste categories prescribed by the implementing regulation of the Law on Waste (Official Gazette FBiH No. 33/03) and the Law on Waste RS (Official Gazette of RS, No. 53/02), discarded, or intended to be discarded by the holder.
13
Inertni otpad je otpad koji ne podliježe bitnim fizikalnim hemijskim i/ili biološkim promjenama, a određen je propisom iz člana 4. (FBiH) i člana 5 (RS) Zakona.
Inert waste is waste that is not subject to significant physical, chemical and / or biological changes, and is determined by the regulation from the Article 4 (FBiH) and Article 5 (RS) of the Laws.
Neopasni otpad je otpad koji je po sastavu i svojstvima određen kao neopasni otpad propisom iz člana 4. (FBiH) i člana 5. (RS) Zakona.
Non-hazardous waste is waste that by its composition and properties is designated as non-hazardous waste by the regulation from the Article 4 (FBiH) and Article 5 (RS) of the Laws.
Opasni otpad je svaki otpad koji je po sastavu i svojstvima određen kao opasni otpad propisom iz člana 4. (FBiH) i člana 5. (RS) Zakona.
Hazardous waste is waste that by its composition and properties is designated as hazardous waste by the regulation from the Article 4 (FBiH) and Article 5 (RS) of the Laws.
Proizvodni otpad je otpad koji nastaje u proizvodnom procesu u industriji, obrtu i drugim procesima, a po sastavu i svojstvima razlikuje se od komunalnog otpada. Proizvodnim otpadom ne smatraju se ostaci iz proizvodnog procesa koji se koriste u proizvodnom procesu istog proizvođača.
Production waste is waste generated in the production process in industry, crafts and other processes, and its composition and properties differ from municipal waste. Production waste is not considered to be remnants from the manufacturing process that are used in the production process of the same manufacturer.
Proizvođač otpada je svaka osoba čijom aktivnošću nastaje otpad (izvorni proizvođač) i/ili koja prethodnom obradom, miješanjem ili drugim postupkom, mijenja sastav ili svojstva otpada.
Waste producer is any person whose activity generates waste (original producer) and / or which by the previous treatment, mixing or other treatment, changes the composition or characteristics of waste.
14
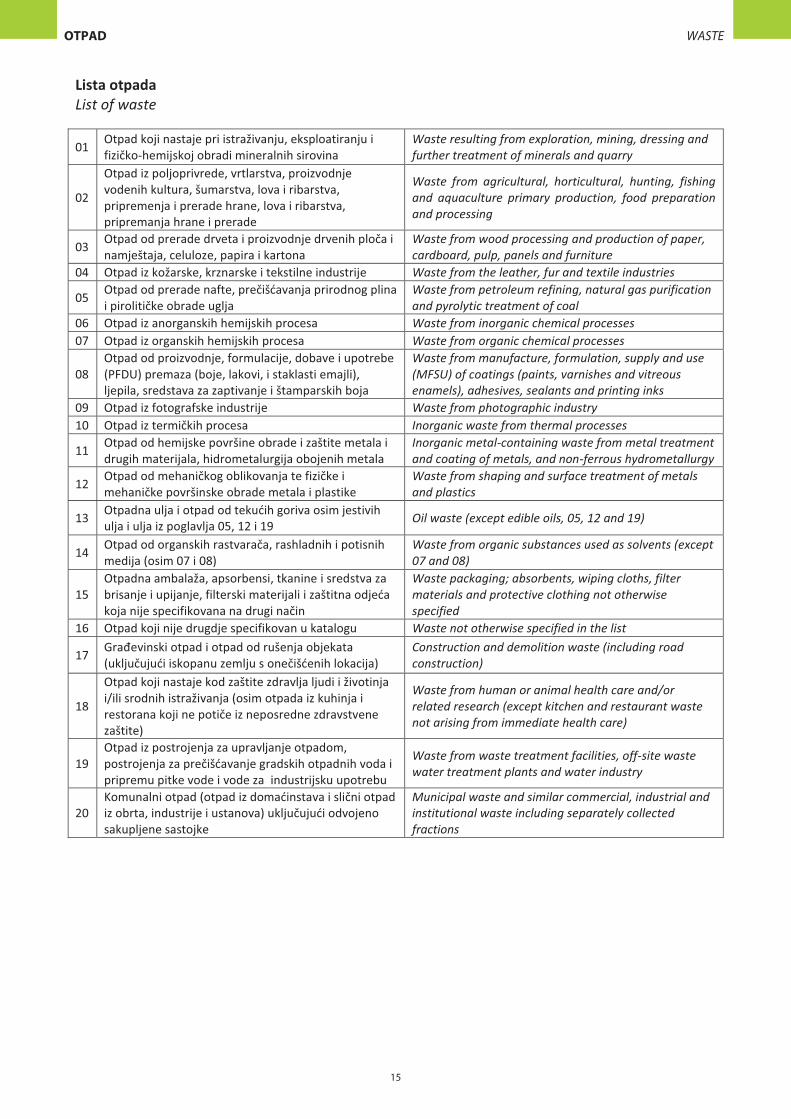
Lista otpada List of waste
01 Otpad koji nastaje pri istraživanju, eksploatiranju i fizičko-hemijskoj obradi mineralnih sirovina
Waste resulting from exploration, mining, dressing and further treatment of minerals and quarry
02
Otpad iz poljoprivrede, vrtlarstva, proizvodnje vodenih kultura, šumarstva, lova i ribarstva, pripremenja i prerade hrane, lova i ribarstva, pripremanja hrane i prerade
Waste from agricultural, horticultural, hunting, fishing and aquaculture primary production, food preparation and processing
03 Otpad od prerade drveta i proizvodnje drvenih ploča i namještaja, celuloze, papira i kartona
Waste from wood processing and production of paper, cardboard, pulp, panels and furniture
04 Otpad iz kožarske, krznarske i tekstilne industrije Waste from the leather, fur and textile industries
05 Otpad od prerade nafte, prečišćavanja prirodnog plina i pirolitičke obrade uglja
Waste from petroleum refining, natural gas purification and pyrolytic treatment of coal
06 Otpad iz anorganskih hemijskih procesa Waste from inorganic chemical processes 07 Otpad iz organskih hemijskih procesa Waste from organic chemical processes
08 Otpad od proizvodnje, formulacije, dobave i upotrebe (PFDU) premaza (boje, lakovi, i staklasti emajli), ljepila, sredstava za zaptivanje i štamparskih boja
Waste from manufacture, formulation, supply and use (MFSU) of coatings (paints, varnishes and vitreous enamels), adhesives, sealants and printing inks
09 Otpad iz fotografske industrije Waste from photographic industry 10 Otpad iz termičkih procesa Inorganic waste from thermal processes
11 Otpad od hemijske površine obrade i zaštite metala i drugih materijala, hidrometalurgija obojenih metala
Inorganic metal-containing waste from metal treatment and coating of metals, and non-ferrous hydrometallurgy
12 Otpad od mehaničkog oblikovanja te fizičke i mehaničke površinske obrade metala i plastike
Waste from shaping and surface treatment of metals and plastics
13 Otpadna ulja i otpad od tekućih goriva osim jestivih ulja i ulja iz poglavlja 05, 12 i 19 Oil waste (except edible oils, 05, 12 and 19)
14 Otpad od organskih rastvarača, rashladnih i potisnih medija (osim 07 i 08)
Waste from organic substances used as solvents (except 07 and 08)
15 Otpadna ambalaža, apsorbensi, tkanine i sredstva za brisanje i upijanje, filterski materijali i zaštitna odjeća koja nije specifikovana na drugi način
Waste packaging; absorbents, wiping cloths, filter materials and protective clothing not otherwise specified
16 Otpad koji nije drugdje specifikovan u katalogu Waste not otherwise specified in the list
17 Građevinski otpad i otpad od rušenja objekata (uključujući iskopanu zemlju s onečišćenih lokacija)
Construction and demolition waste (including road construction)
18
Otpad koji nastaje kod zaštite zdravlja ljudi i životinja i/ili srodnih istraživanja (osim otpada iz kuhinja i restorana koji ne potiče iz neposredne zdravstvene zaštite)
Waste from human or animal health care and/or related research (except kitchen and restaurant waste not arising from immediate health care)
19 Otpad iz postrojenja za upravljanje otpadom, postrojenja za prečišćavanje gradskih otpadnih voda i pripremu pitke vode i vode za industrijsku upotrebu
Waste from waste treatment facilities, off-site waste water treatment plants and water industry
20 Komunalni otpad (otpad iz domaćinstava i slični otpad iz obrta, industrije i ustanova) uključujući odvojeno sakupljene sastojke
Municipal waste and similar commercial, industrial and institutional waste including separately collected fractions
15
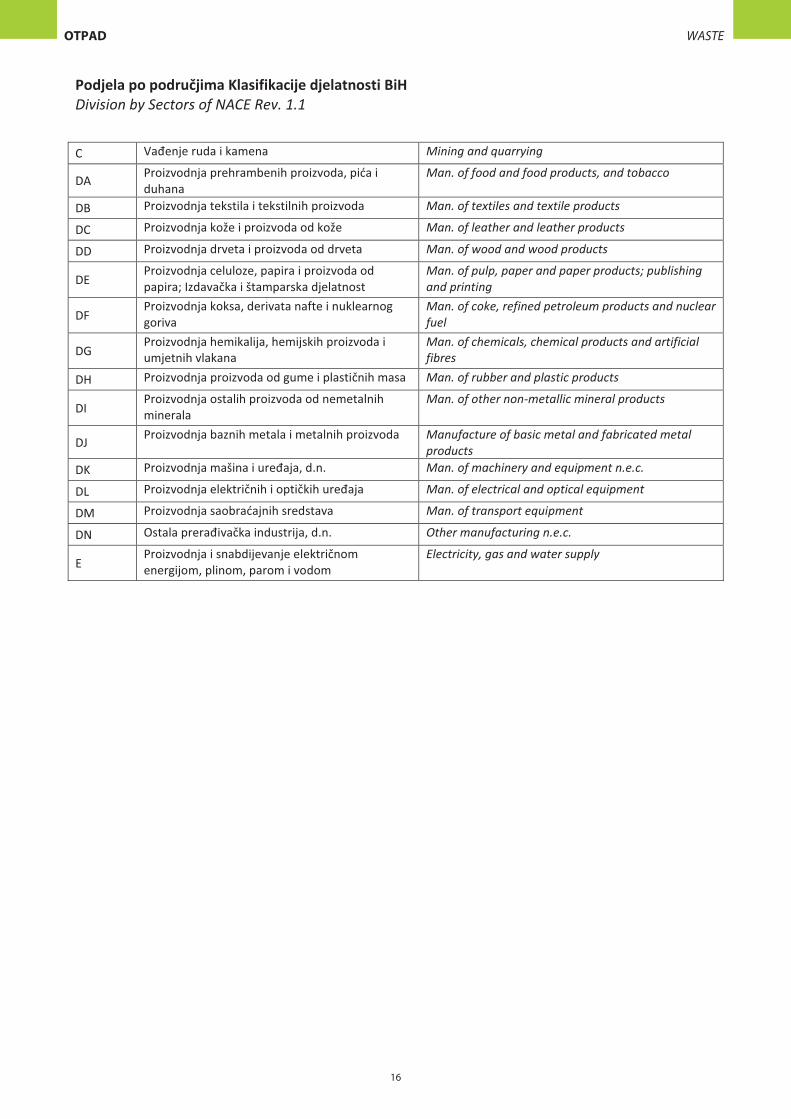
Podjela po područjima Klasifikacije djelatnosti BiH Division by Sectors of NACE Rev. 1.1
C Vađenje ruda i kamena Mining and quarrying
DA Proizvodnja prehrambenih proizvoda, pića i duhana
Man. of food and food products, and tobacco
DB Proizvodnja tekstila i tekstilnih proizvoda Man. of textiles and textile products
DC Proizvodnja kože i proizvoda od kože Man. of leather and leather products
DD Proizvodnja drveta i proizvoda od drveta Man. of wood and wood products
DE Proizvodnja celuloze, papira i proizvoda od papira; Izdavačka i štamparska djelatnost
Man. of pulp, paper and paper products; publishing and printing
DF Proizvodnja koksa, derivata nafte i nuklearnog goriva
Man. of coke, refined petroleum products and nuclear fuel
DG Proizvodnja hemikalija, hemijskih proizvoda i umjetnih vlakana
Man. of chemicals, chemical products and artificial fibres
DH Proizvodnja proizvoda od gume i plastičnih masa Man. of rubber and plastic products
DI Proizvodnja ostalih proizvoda od nemetalnih minerala
Man. of other non-metallic mineral products
DJ Proizvodnja baznih metala i metalnih proizvoda Manufacture of basic metal and fabricated metal products
DK Proizvodnja mašina i uređaja, d.n. Man. of machinery and equipment n.e.c.
DL Proizvodnja električnih i optičkih uređaja Man. of electrical and optical equipment
DM Proizvodnja saobraćajnih sredstava Man. of transport equipment
DN Ostala prerađivačka industrija, d.n. Other manufacturing n.e.c.
E Proizvodnja i snabdijevanje električnom energijom, plinom, parom i vodom
Electricity, gas and water supply
16
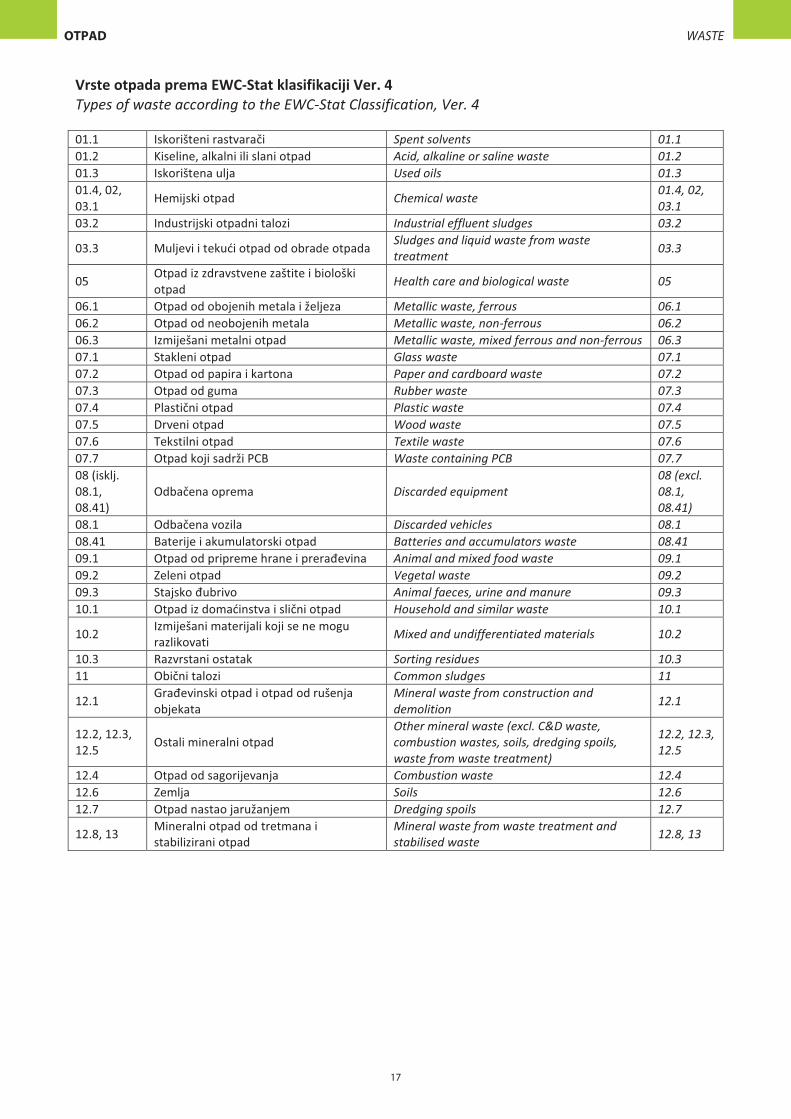
Vrste otpada prema EWC-Stat klasifikaciji Ver. 4 Types of waste according to the EWC-Stat Classification, Ver. 4
01.1 Iskorišteni rastvarači Spent solvents 01.1 01.2 Kiseline, alkalni ili slani otpad Acid, alkaline or saline waste 01.2 01.3 Iskorištena ulja Used oils 01.3 01.4, 02, 03.1 Hemijski otpad Chemical waste 01.4, 02,
03.1 03.2 Industrijski otpadni talozi Industrial effluent sludges 03.2
03.3 Muljevi i tekući otpad od obrade otpada Sludges and liquid waste from waste treatment 03.3
05 Otpad iz zdravstvene zaštite i biološki otpad Health care and biological waste 05
06.1 Otpad od obojenih metala i željeza Metallic waste, ferrous 06.1 06.2 Otpad od neobojenih metala Metallic waste, non-ferrous 06.2 06.3 Izmiješani metalni otpad Metallic waste, mixed ferrous and non-ferrous 06.3 07.1 Stakleni otpad Glass waste 07.1 07.2 Otpad od papira i kartona Paper and cardboard waste 07.2 07.3 Otpad od guma Rubber waste 07.3 07.4 Plastični otpad Plastic waste 07.4 07.5 Drveni otpad Wood waste 07.5 07.6 Tekstilni otpad Textile waste 07.6 07.7 Otpad koji sadrži PCB Waste containing PCB 07.7 08 (isklj. 08.1, 08.41)
Odbačena oprema Discarded equipment 08 (excl. 08.1, 08.41)
08.1 Odbačena vozila Discarded vehicles 08.1 08.41 Baterije i akumulatorski otpad Batteries and accumulators waste 08.41 09.1 Otpad od pripreme hrane i prerađevina Animal and mixed food waste 09.1 09.2 Zeleni otpad Vegetal waste 09.2 09.3 Stajsko đubrivo Animal faeces, urine and manure 09.3 10.1 Otpad iz domaćinstva i slični otpad Household and similar waste 10.1
10.2 Izmiješani materijali koji se ne mogu razlikovati Mixed and undifferentiated materials 10.2
10.3 Razvrstani ostatak Sorting residues 10.3 11 Obični talozi Common sludges 11
12.1 Građevinski otpad i otpad od rušenja objekata
Mineral waste from construction and demolition 12.1
12.2, 12.3, 12.5 Ostali mineralni otpad
Other mineral waste (excl. C&D waste, combustion wastes, soils, dredging spoils, waste from waste treatment)
12.2, 12.3, 12.5
12.4 Otpad od sagorijevanja Combustion waste 12.4 12.6 Zemlja Soils 12.6 12.7 Otpad nastao jaružanjem Dredging spoils 12.7
12.8, 13 Mineralni otpad od tretmana i stabilizirani otpad
Mineral waste from waste treatment and stabilised waste 12.8, 13
17
1.1 Otpad iz proizvodnih aktivnosti prema EWC-Stat Klasifikaciji Waste generated from production activities according to EWC – Stat Classification
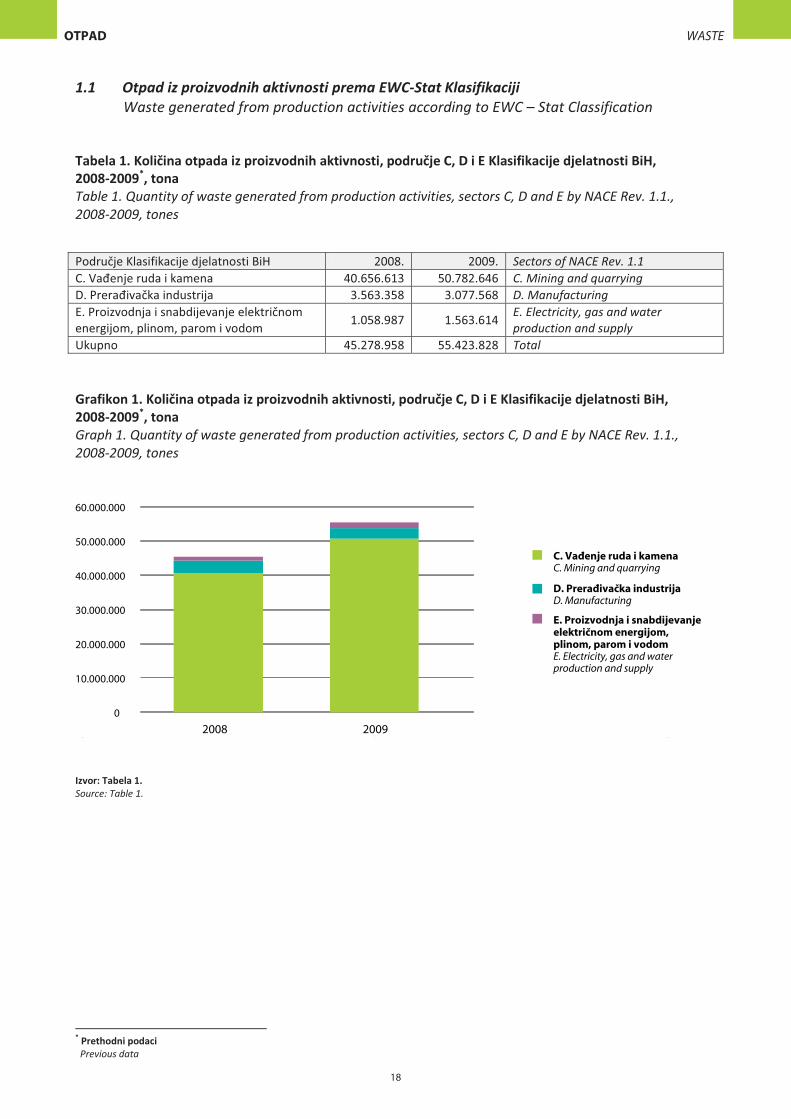
Tabela 1. Količina otpada iz proizvodnih aktivnosti, područje C, D i E Klasifikacije djelatnosti BiH, 2008-2009*, tona Table 1. Quantity of waste generated from production activities, sectors C, D and E by NACE Rev. 1.1., 2008-2009, tones
Područje Klasifikacije djelatnosti BiH 2008. 2009. Sectors of NACE Rev. 1.1 C. Vađenje ruda i kamena 40.656.613 50.782.646 C. Mining and quarrying D. Prerađivačka industrija 3.563.358 3.077.568 D. Manufacturing E. Proizvodnja i snabdijevanje električnom energijom, plinom, parom i vodom 1.058.987 1.563.614 E. Electricity, gas and water
production and supply Ukupno 45.278.958 55.423.828 Total
Grafikon 1. Količina otpada iz proizvodnih aktivnosti, područje C, D i E Klasifikacije djelatnosti BiH, 2008-2009*, tona Graph 1. Quantity of waste generated from production activities, sectors C, D and E by NACE Rev. 1.1., 2008-2009, tones
Izvor: Tabela 1. Source: Table 1.
* Pre�hodni podaci Previous data
18
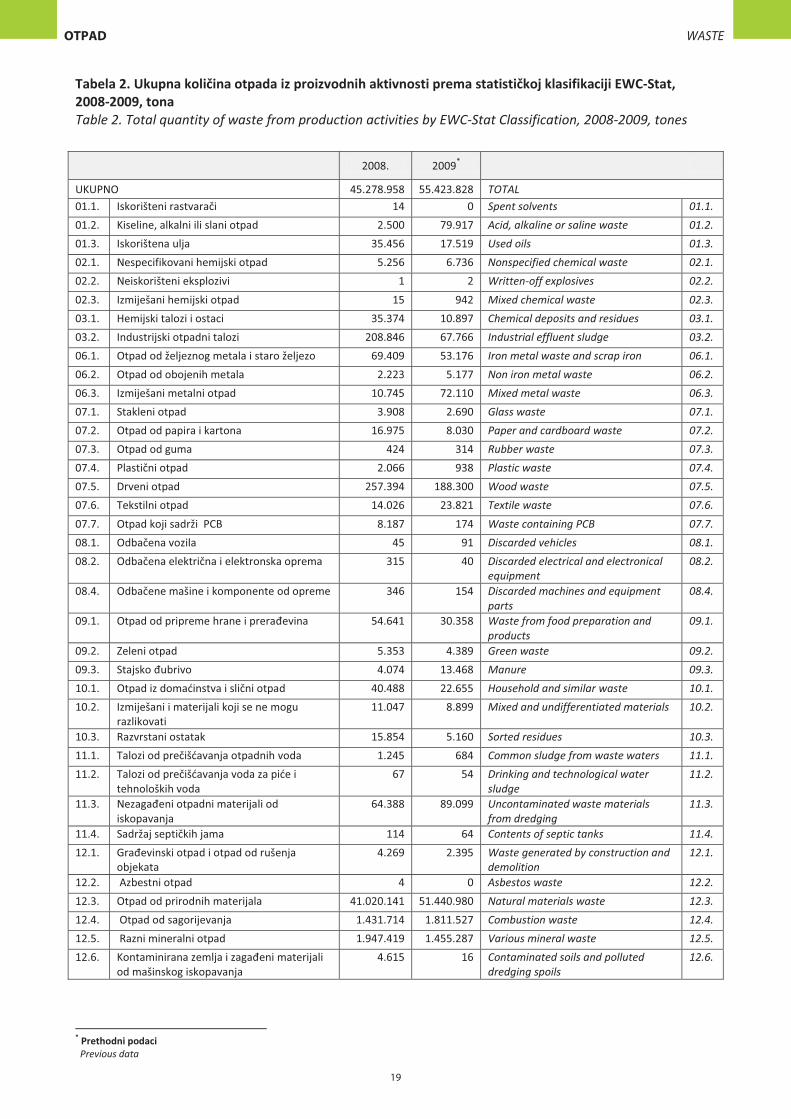
Tabela 2. Ukupna količina otpada iz proizvodnih aktivnosti prema statističkoj klasifikaciji EWC-Stat, 2008-2009, tona Table 2. Total quantity of waste from production activities by EWC-Stat Classification, 2008-2009, tones
2008. 2009*
UKUPNO 45.278.958 55.423.828 TOTAL 01.1. Iskorišteni rastvarači 14 0 Spent solvents 01.1. 01.2. Kiseline, alkalni ili slani otpad 2.500 79.917 Acid, alkaline or saline waste 01.2. 01.3. Iskorištena ulja 35.456 17.519 Used oils 01.3. 02.1. Nespecifikovani hemijski otpad 5.256 6.736 Nonspecified chemical waste 02.1. 02.2. Neiskorišteni eksplozivi 1 2 Written-off explosives 02.2. 02.3. Izmiješani hemijski otpad 15 942 Mixed chemical waste 02.3. 03.1. Hemijski talozi i ostaci 35.374 10.897 Chemical deposits and residues 03.1. 03.2. Industrijski otpadni talozi 208.846 67.766 Industrial effluent sludge 03.2. 06.1. Otpad od željeznog metala i staro željezo 69.409 53.176 Iron metal waste and scrap iron 06.1. 06.2. Otpad od obojenih metala 2.223 5.177 Non iron metal waste 06.2. 06.3. Izmiješani metalni otpad 10.745 72.110 Mixed metal waste 06.3. 07.1. Stakleni otpad 3.908 2.690 Glass waste 07.1. 07.2. Otpad od papira i kartona 16.975 8.030 Paper and cardboard waste 07.2. 07.3. Otpad od guma 424 314 Rubber waste 07.3. 07.4. Plastični otpad 2.066 938 Plastic waste 07.4. 07.5. Drveni otpad 257.394 188.300 Wood waste 07.5. 07.6. Tekstilni otpad 14.026 23.821 Textile waste 07.6. 07.7. Otpad koji sadrži PCB 8.187 174 Waste containing PCB 07.7. 08.1. Odbačena vozila 45 91 Discarded vehicles 08.1. 08.2. Odbačena električna i elektronska oprema 315 40 Discarded electrical and electronical
equipment 08.2.
08.4. Odbačene mašine i komponente od opreme 346 154 Discarded machines and equipment parts
08.4.
09.1. Otpad od pripreme hrane i prerađevina 54.641 30.358 Waste from food preparation and products
09.1.
09.2. Zeleni otpad 5.353 4.389 Green waste 09.2. 09.3. Stajsko đubrivo 4.074 13.468 Manure 09.3. 10.1. Otpad iz domaćinstva i slični otpad 40.488 22.655 Household and similar waste 10.1. 10.2. Izmiješani i materijali koji se ne mogu
razlikovati 11.047 8.899 Mixed and undifferentiated materials 10.2.
10.3. Razvrstani ostatak 15.854 5.160 Sorted residues 10.3. 11.1. Talozi od prečišćavanja otpadnih voda 1.245 684 Common sludge from waste waters 11.1. 11.2. Talozi od prečišćavanja voda za piće i
tehnoloških voda 67 54 Drinking and technological water
sludge 11.2.
11.3. Nezagađeni otpadni materijali od iskopavanja
64.388 89.099 Uncontaminated waste materials from dredging
11.3.
11.4. Sadržaj septičkih jama 114 64 Contents of septic tanks 11.4. 12.1. Građevinski otpad i otpad od rušenja
objekata 4.269 2.395 Waste generated by construction and
demolition 12.1.
12.2. Azbestni otpad 4 0 Asbestos waste 12.2. 12.3. Otpad od prirodnih materijala 41.020.141 51.440.980 Natural materials waste 12.3. 12.4. Otpad od sagorijevanja 1.431.714 1.811.527 Combustion waste 12.4. 12.5. Razni mineralni otpad 1.947.419 1.455.287 Various mineral waste 12.5. 12.6. Kontaminirana zemlja i zagađeni materijali
od mašinskog iskopavanja 4.615 16 Contaminated soils and polluted
dredging spoils 12.6.
19
* Pre�hodni podaci Previous data
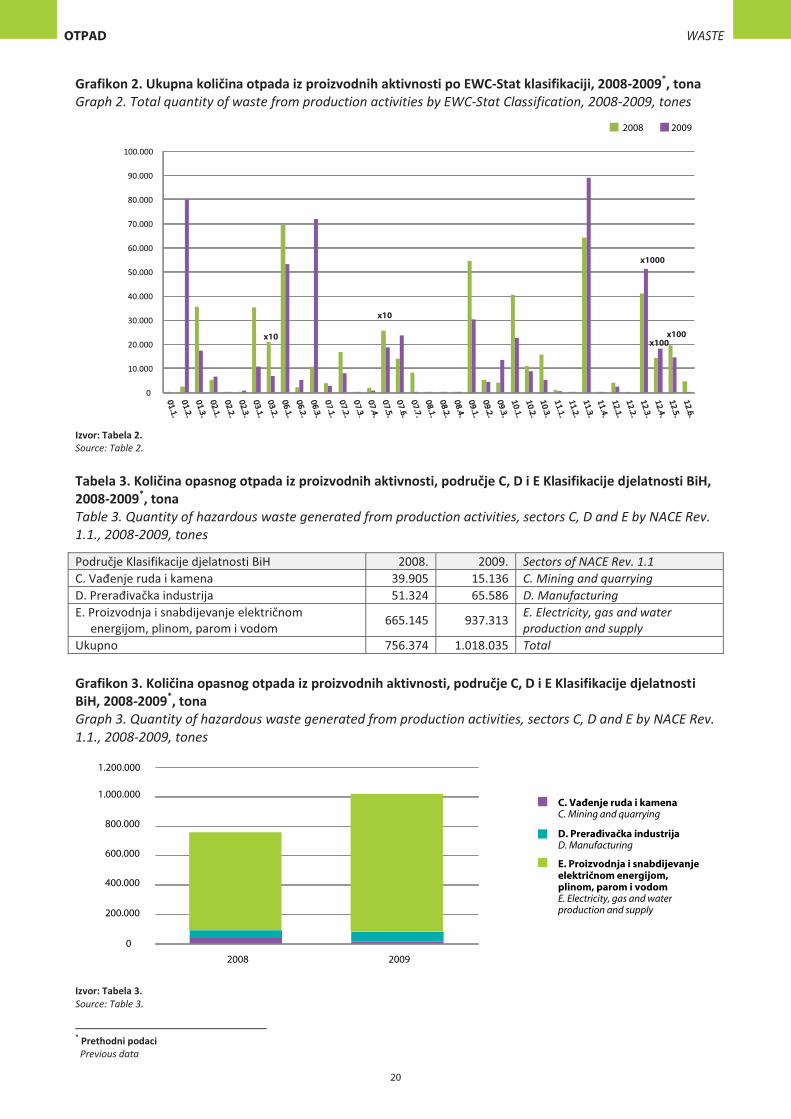
Grafikon 2. Ukupna količina otpada iz proizvodnih aktivnosti po EWC-Stat klasifikaciji, 2008-2009*, tona Graph 2. Total quantity of waste from production activities by EWC-Stat Classification, 2008-2009, tones
Izvor: Tabela 2. Source: Table 2. Tabela 3. Količina opasnog otpada iz proizvodnih aktivnosti, područje C, D i E Klasifikacije djelatnosti BiH, 2008-2009*, tona Table 3. Quantity of hazardous waste generated from production activities, sectors C, D and E by NACE Rev. 1.1., 2008-2009, tones
Područje Klasifikacije djelatnosti BiH 2008. 2009. Sectors of NACE Rev. 1.1 C. Vađenje ruda i kamena 39.905 15.136 C. Mining and quarrying D. Prerađivačka industrija 51.324 65.586 D. Manufacturing E. Proizvodnja i snabdijevanje električnom energijom, plinom, parom i vodom 665.145 937.313 E. Electricity, gas and water
production and supply Ukupno 756.374 1.018.035 Total
Grafikon 3. Količina opasnog otpada iz proizvodnih aktivnosti, područje C, D i E Klasifikacije djelatnosti BiH, 2008-2009*, tona Graph 3. Quantity of hazardous waste generated from production activities, sectors C, D and E by NACE Rev. 1.1., 2008-2009, tones
Izvor: Tabela 3. Source: Table 3.
20
* Pre�hodni podaci Previous data
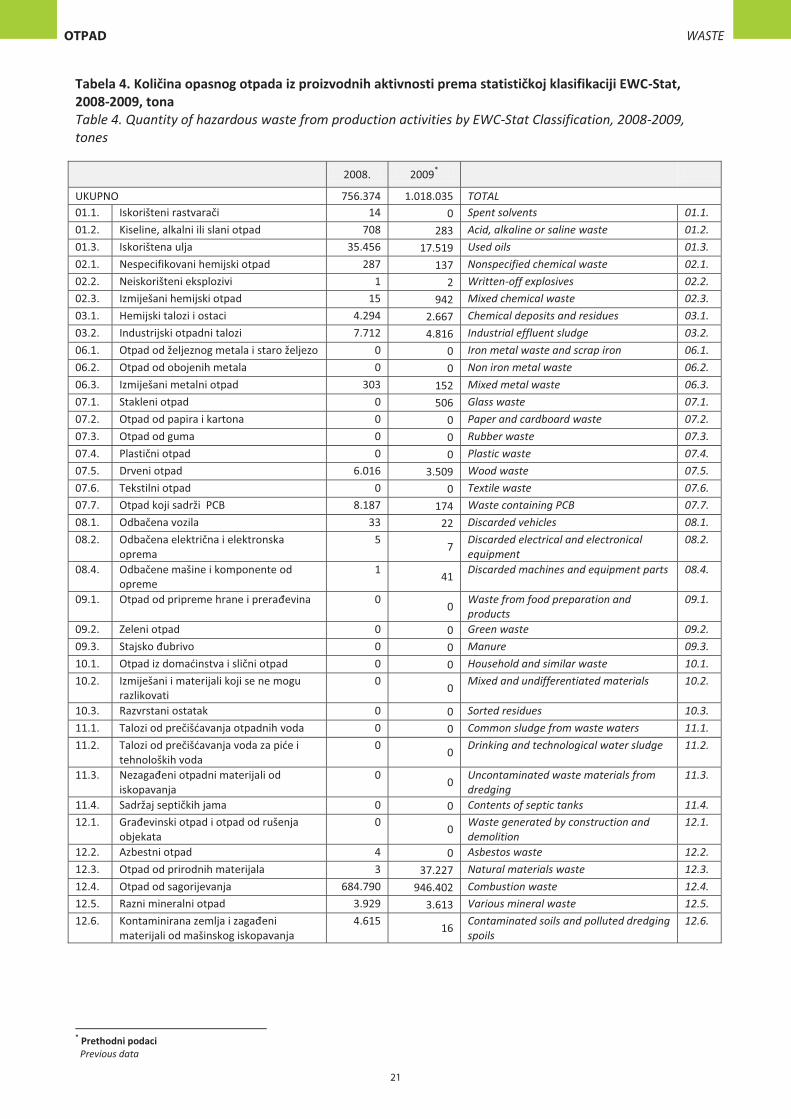
Tabela 4. Količina opasnog otpada iz proizvodnih aktivnosti prema statističkoj klasifikaciji EWC-Stat, 2008-2009, tona Table 4. Quantity of hazardous waste from production activities by EWC-Stat Classification, 2008-2009, tones
2008. 2009*
UKUPNO 756.374 1.018.035 TOTAL 01.1. Iskorišteni rastvarači 14 0 Spent solvents 01.1. 01.2. Kiseline, alkalni ili slani otpad 708 283 Acid, alkaline or saline waste 01.2. 01.3. Iskorištena ulja 35.456 17.519 Used oils 01.3. 02.1. Nespecifikovani hemijski otpad 287 137 Nonspecified chemical waste 02.1. 02.2. Neiskorišteni eksplozivi 1 2 Written-off explosives 02.2. 02.3. Izmiješani hemijski otpad 15 942 Mixed chemical waste 02.3. 03.1. Hemijski talozi i ostaci 4.294 2.667 Chemical deposits and residues 03.1. 03.2. Industrijski otpadni talozi 7.712 4.816 Industrial effluent sludge 03.2. 06.1. Otpad od željeznog metala i staro željezo 0 0 Iron metal waste and scrap iron 06.1. 06.2. Otpad od obojenih metala 0 0 Non iron metal waste 06.2. 06.3. Izmiješani metalni otpad 303 152 Mixed metal waste 06.3. 07.1. Stakleni otpad 0 506 Glass waste 07.1. 07.2. Otpad od papira i kartona 0 0 Paper and cardboard waste 07.2. 07.3. Otpad od guma 0 0 Rubber waste 07.3. 07.4. Plastični otpad 0 0 Plastic waste 07.4. 07.5. Drveni otpad 6.016 3.509 Wood waste 07.5. 07.6. Tekstilni otpad 0 0 Textile waste 07.6. 07.7. Otpad koji sadrži PCB 8.187 174 Waste containing PCB 07.7. 08.1. Odbačena vozila 33 22 Discarded vehicles 08.1. 08.2. Odbačena električna i elektronska
oprema 5 7 Discarded electrical and electronical
equipment 08.2.
08.4. Odbačene mašine i komponente od opreme
1 41 Discarded machines and equipment parts 08.4.
09.1. Otpad od pripreme hrane i prerađevina 0 0 Waste from food preparation and products
09.1.
09.2. Zeleni otpad 0 0 Green waste 09.2. 09.3. Stajsko đubrivo 0 0 Manure 09.3. 10.1. Otpad iz domaćinstva i slični otpad 0 0 Household and similar waste 10.1. 10.2. Izmiješani i materijali koji se ne mogu
razlikovati 0 0 Mixed and undifferentiated materials 10.2.
10.3. Razvrstani ostatak 0 0 Sorted residues 10.3. 11.1. Talozi od prečišćavanja otpadnih voda 0 0 Common sludge from waste waters 11.1. 11.2. Talozi od prečišćavanja voda za piće i
tehnoloških voda 0 0 Drinking and technological water sludge 11.2.
11.3. Nezagađeni otpadni materijali od iskopavanja
0 0 Uncontaminated waste materials from dredging
11.3.
11.4. Sadržaj septičkih jama 0 0 Contents of septic tanks 11.4. 12.1. Građevinski otpad i otpad od rušenja
objekata 0 0 Waste generated by construction and
demolition 12.1.
12.2. Azbestni otpad 4 0 Asbestos waste 12.2. 12.3. Otpad od prirodnih materijala 3 37.227 Natural materials waste 12.3. 12.4. Otpad od sagorijevanja 684.790 946.402 Combustion waste 12.4. 12.5. Razni mineralni otpad 3.929 3.613 Various mineral waste 12.5. 12.6. Kontaminirana zemlja i zagađeni
materijali od mašinskog iskopavanja 4.615 16 Contaminated soils and polluted dredging
spoils 12.6.
21
* Pre�hodni podaci Previous data
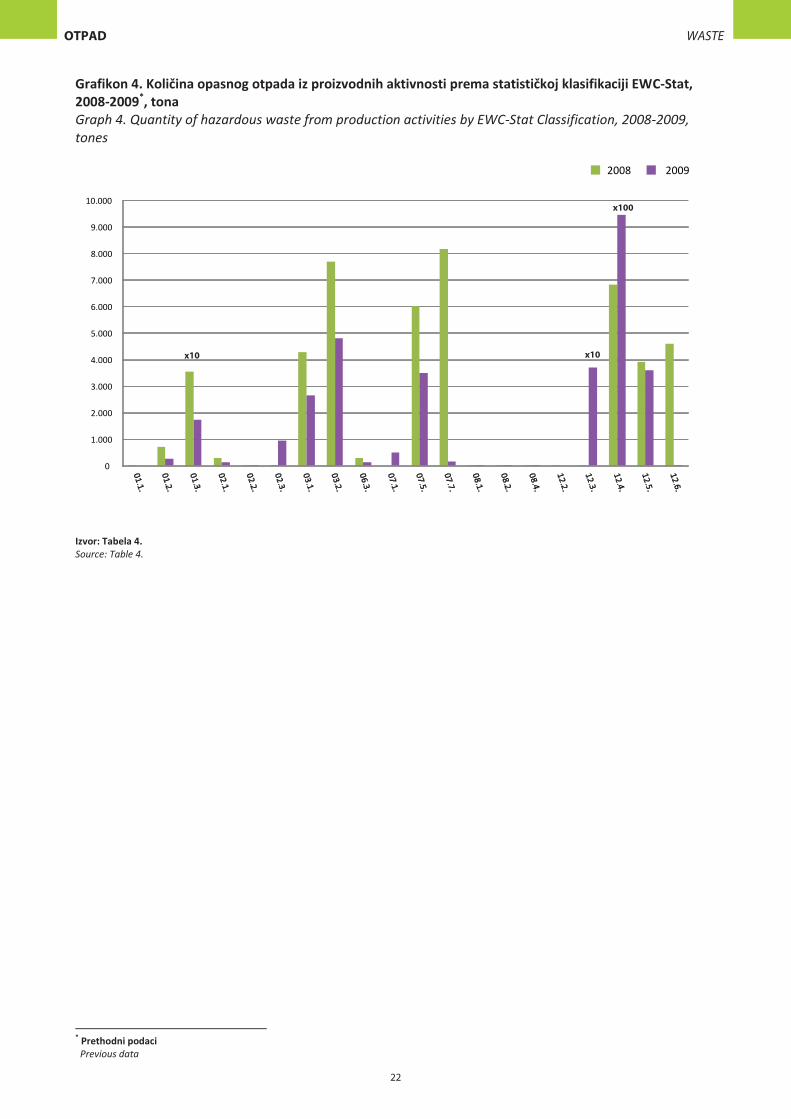
Grafikon 4. Količina opasnog otpada iz proizvodnih aktivnosti prema statističkoj klasifikaciji EWC-Stat, 2008-2009*, tona Graph 4. Quantity of hazardous waste from production activities by EWC-Stat Classification, 2008-2009, tones
Izvor: Tabela 4. Source: Table 4.
22
* Pre�hodni podaci Previous data
1.2 Otpad iz proizvodnih aktivnosti prema Listi otpada - LoW Waste generated from production activities according to European List of Waste - LoW
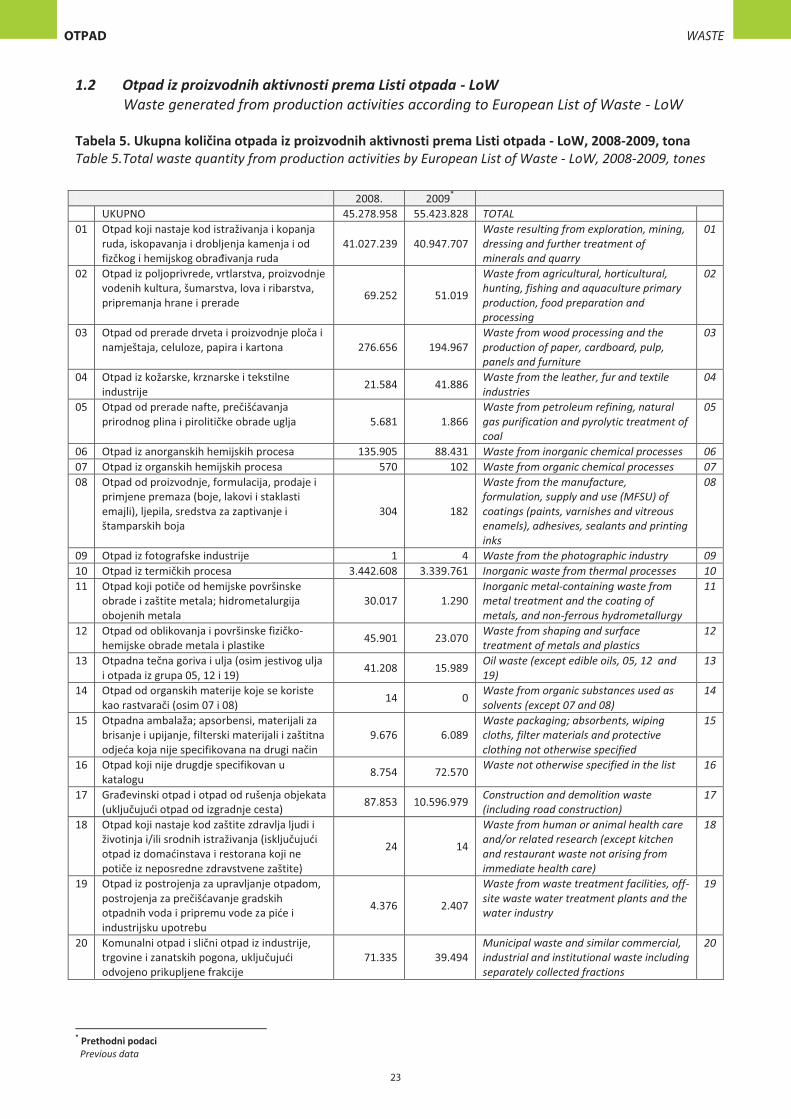
Tabela 5. Ukupna količina otpada iz proizvodnih aktivnosti prema Listi otpada - LoW, 2008-2009, tona Table 5.Total waste quantity from production activities by European List of Waste - LoW, 2008-2009, tones
2008. 2009* UKUPNO 45.278.958 55.423.828 TOTAL 01 Otpad koji nastaje kod istraživanja i kopanja
ruda, iskopavanja i drobljenja kamenja i od fizčkog i hemijskog obrađivanja ruda
41.027.239 40.947.707 Waste resulting from exploration, mining, dressing and further treatment of minerals and quarry
01
02 Otpad iz poljoprivrede, vrtlarstva, proizvodnje vodenih kultura, šumarstva, lova i ribarstva, pripremanja hrane i prerade 69.252 51.019
Waste from agricultural, horticultural, hunting, fishing and aquaculture primary production, food preparation and processing
02
03 Otpad od prerade drveta i proizvodnje ploča i namještaja, celuloze, papira i kartona 276.656 194.967
Waste from wood processing and the production of paper, cardboard, pulp, panels and furniture
03
04 Otpad iz kožarske, krznarske i tekstilne industrije 21.584 41.886 Waste from the leather, fur and textile
industries 04
05 Otpad od prerade nafte, prečišćavanja prirodnog plina i pirolitičke obrade uglja 5.681 1.866
Waste from petroleum refining, natural gas purification and pyrolytic treatment of coal
05
06 Otpad iz anorganskih hemijskih procesa 135.905 88.431 Waste from inorganic chemical processes 06 07 Otpad iz organskih hemijskih procesa 570 102 Waste from organic chemical processes 07 08 Otpad od proizvodnje, formulacija, prodaje i
primjene premaza (boje, lakovi i staklasti emajli), ljepila, sredstva za zaptivanje i štamparskih boja
304 182
Waste from the manufacture, formulation, supply and use (MFSU) of coatings (paints, varnishes and vitreous enamels), adhesives, sealants and printing inks
08
09 Otpad iz fotografske industrije 1 4 Waste from the photographic industry 09 10 Otpad iz termičkih procesa 3.442.608 3.339.761 Inorganic waste from thermal processes 10 11 Otpad koji potiče od hemijske površinske
obrade i zaštite metala; hidrometalurgija obojenih metala
30.017 1.290 Inorganic metal-containing waste from metal treatment and the coating of metals, and non-ferrous hydrometallurgy
11
12 Otpad od oblikovanja i površinske fizičko-hemijske obrade metala i plastike 45.901 23.070 Waste from shaping and surface
treatment of metals and plastics 12
13 Otpadna tečna goriva i ulja (osim jestivog ulja i otpada iz grupa 05, 12 i 19) 41.208 15.989 Oil waste (except edible oils, 05, 12 and
19) 13
14 Otpad od organskih materije koje se koriste kao rastvarači (osim 07 i 08) 14 0 Waste from organic substances used as
solvents (except 07 and 08) 14
15 Otpadna ambalaža; apsorbensi, materijali za brisanje i upijanje, filterski materijali i zaštitna odjeća koja nije specifikovana na drugi način
9.676 6.089 Waste packaging; absorbents, wiping cloths, filter materials and protective clothing not otherwise specified
15
16 Otpad koji nije drugdje specifikovan u katalogu 8.754 72.570 Waste not otherwise specified in the list 16
17 Građevinski otpad i otpad od rušenja objekata (uključujući otpad od izgradnje cesta) 87.853 10.596.979 Construction and demolition waste
(including road construction) 17
18 Otpad koji nastaje kod zaštite zdravlja ljudi i životinja i/ili srodnih istraživanja (isključujući otpad iz domaćinstava i restorana koji ne potiče iz neposredne zdravstvene zaštite)
24 14
Waste from human or animal health care and/or related research (except kitchen and restaurant waste not arising from immediate health care)
18
19 Otpad iz postrojenja za upravljanje otpadom, postrojenja za prečišćavanje gradskih otpadnih voda i pripremu vode za piće i industrijsku upotrebu
4.376 2.407
Waste from waste treatment facilities, off-site waste water treatment plants and the water industry
19
20 Komunalni otpad i slični otpad iz industrije, trgovine i zanatskih pogona, uključujući odvojeno prikupljene frakcije
71.335 39.494 Municipal waste and similar commercial, industrial and institutional waste including separately collected fractions
20
23
* Pre�hodni podaci Previous data
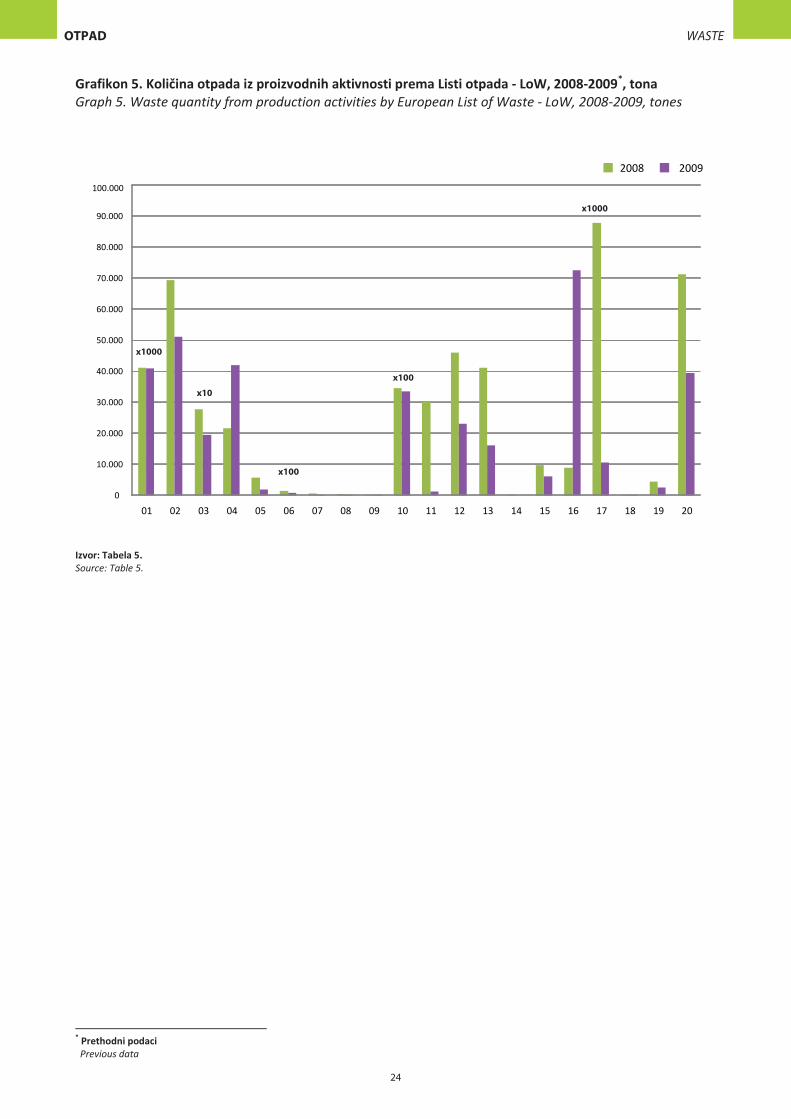
Grafikon 5. Količina otpada iz proizvodnih aktivnosti prema Listi otpada - LoW, 2008-2009*, tona Graph 5. Waste quantity from production activities by European List of Waste - LoW, 2008-2009, tones
Izvor: Tabela 5. Source: Table 5.
24
* Pre�hodni podaci Previous data
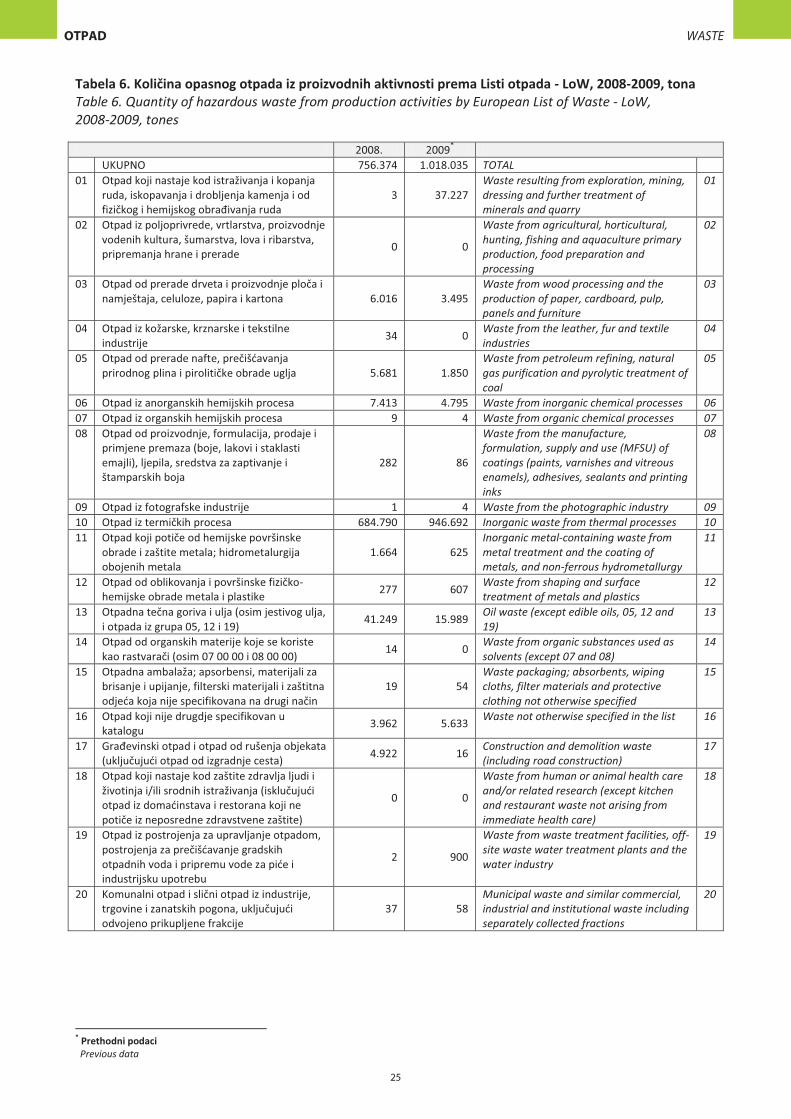
Tabela 6. Količina opasnog otpada iz proizvodnih aktivnosti prema Listi otpada - LoW, 2008-2009, tona Table 6. Quantity of hazardous waste from production activities by European List of Waste - LoW, 2008-2009, tones
2008. 2009* UKUPNO 756.374 1.018.035 TOTAL 01 Otpad koji nastaje kod istraživanja i kopanja
ruda, iskopavanja i drobljenja kamenja i od fizičkog i hemijskog obrađivanja ruda
3 37.227 Waste resulting from exploration, mining, dressing and further treatment of minerals and quarry
01
02 Otpad iz poljoprivrede, vrtlarstva, proizvodnje vodenih kultura, šumarstva, lova i ribarstva, pripremanja hrane i prerade 0 0
Waste from agricultural, horticultural, hunting, fishing and aquaculture primary production, food preparation and processing
02
03 Otpad od prerade drveta i proizvodnje ploča i namještaja, celuloze, papira i kartona 6.016 3.495
Waste from wood processing and the production of paper, cardboard, pulp, panels and furniture
03
04 Otpad iz kožarske, krznarske i tekstilne industrije 34 0 Waste from the leather, fur and textile
industries 04
05 Otpad od prerade nafte, prečišćavanja prirodnog plina i pirolitičke obrade uglja 5.681 1.850
Waste from petroleum refining, natural gas purification and pyrolytic treatment of coal
05
06 Otpad iz anorganskih hemijskih procesa 7.413 4.795 Waste from inorganic chemical processes 06 07 Otpad iz organskih hemijskih procesa 9 4 Waste from organic chemical processes 07 08 Otpad od proizvodnje, formulacija, prodaje i
primjene premaza (boje, lakovi i staklasti emajli), ljepila, sredstva za zaptivanje i štamparskih boja
282 86
Waste from the manufacture, formulation, supply and use (MFSU) of coatings (paints, varnishes and vitreous enamels), adhesives, sealants and printing inks
08
09 Otpad iz fotografske industrije 1 4 Waste from the photographic industry 09 10 Otpad iz termičkih procesa 684.790 946.692 Inorganic waste from thermal processes 10 11 Otpad koji potiče od hemijske površinske
obrade i zaštite metala; hidrometalurgija obojenih metala
1.664 625 Inorganic metal-containing waste from metal treatment and the coating of metals, and non-ferrous hydrometallurgy
11
12 Otpad od oblikovanja i površinske fizičko-hemijske obrade metala i plastike 277 607 Waste from shaping and surface
treatment of metals and plastics 12
13 Otpadna tečna goriva i ulja (osim jestivog ulja, i otpada iz grupa 05, 12 i 19) 41.249 15.989 Oil waste (except edible oils, 05, 12 and
19) 13
14 Otpad od organskih materije koje se koriste kao rastvarači (osim 07 00 00 i 08 00 00) 14 0 Waste from organic substances used as
solvents (except 07 and 08) 14
15 Otpadna ambalaža; apsorbensi, materijali za brisanje i upijanje, filterski materijali i zaštitna odjeća koja nije specifikovana na drugi način
19 54 Waste packaging; absorbents, wiping cloths, filter materials and protective clothing not otherwise specified
15
16 Otpad koji nije drugdje specifikovan u katalogu 3.962 5.633 Waste not otherwise specified in the list 16
17 Građevinski otpad i otpad od rušenja objekata (uključujući otpad od izgradnje cesta) 4.922 16 Construction and demolition waste
(including road construction) 17
18 Otpad koji nastaje kod zaštite zdravlja ljudi i životinja i/ili srodnih istraživanja (isklučujući otpad iz domaćinstava i restorana koji ne potiče iz neposredne zdravstvene zaštite)
0 0
Waste from human or animal health care and/or related research (except kitchen and restaurant waste not arising from immediate health care)
18
19 Otpad iz postrojenja za upravljanje otpadom, postrojenja za prečišćavanje gradskih otpadnih voda i pripremu vode za piće i industrijsku upotrebu
2 900
Waste from waste treatment facilities, off-site waste water treatment plants and the water industry
19
20 Komunalni otpad i slični otpad iz industrije, trgovine i zanatskih pogona, uključujući odvojeno prikupljene frakcije
37 58 Municipal waste and similar commercial, industrial and institutional waste including separately collected fractions
20
25
* Pre�hodni podaci Previous data
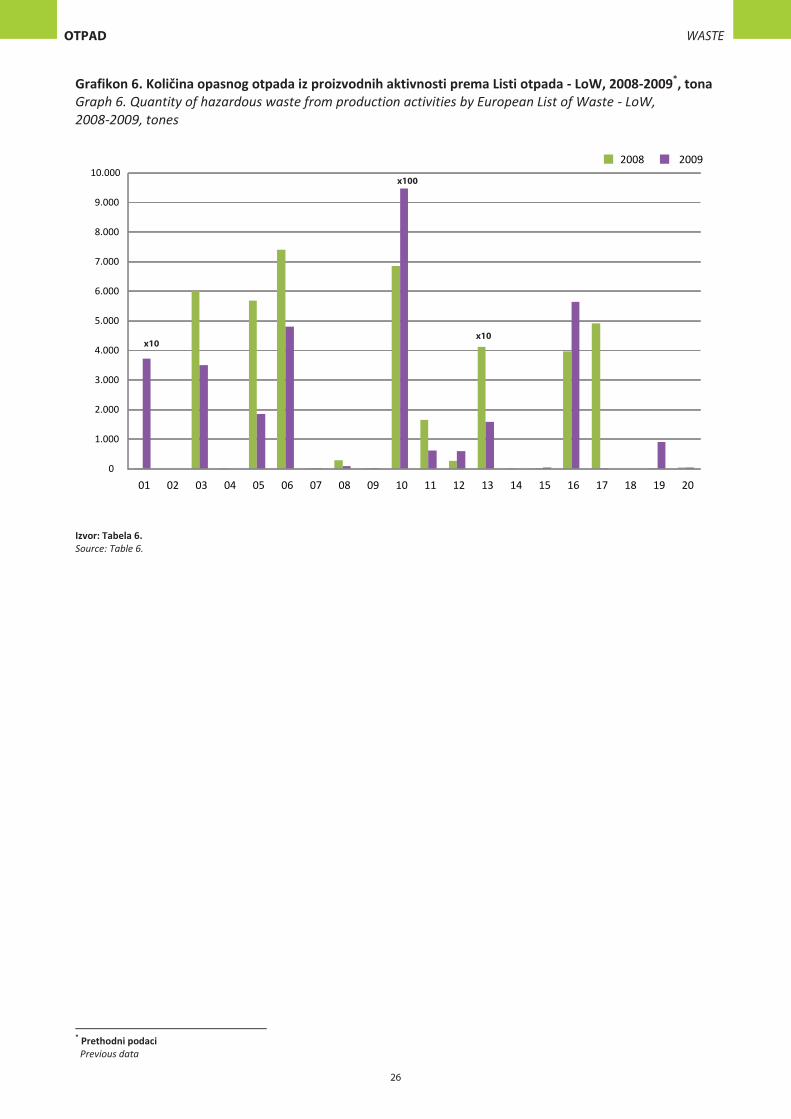
Grafikon 6. Količina opasnog otpada iz proizvodnih aktivnosti prema Listi otpada - LoW, 2008-2009*, tona Graph 6. Quantity of hazardous waste from production activities by European List of Waste - LoW, 2008-2009, tones
Izvor: Tabela 6. Source: Table 6.
26
* Pre�hodni podaci Previous data
1.3 Komunalni otpad Municipal waste
Metodološka objašnjenja i definicije Methodological notes and definitions
Otpad je svaki predmet ili materija razvrstan u jednu od grupa otpada prema Klasifikacijskom katalogu otpada, kojeg vlasnik ili imalac odlaže, namjerava ili mora odložiti.
Waste is any material or object from one of the groups of waste of the List of Waste which the owner or possessor intended to for disposal or it must be disposed.
Komunalni otpad predstavlja otpad iz domaćinstva, kao i otpad koji je zbog svoje prirode ili sastava sličan otpadu iz domaćinstava, a potiče od poslovnih subjekata.
Municipal waste is waste from households and any other waste which is in its characteristics or contents similar to waste from households and is generated in business entities.
Klasifikacijski katalog otpada sadrži listu opasnog i neopasnog otpada koji je razvrstan u odnosu na izvor nastanka otpada prema određenim grupama.
List of waste (LoW) includes non-hazardous and hazardous waste classified by proper group with regard to the origin of waste.
1) Odvojeno prikupljene vrste otpada podrazumijevaju prikupljene količine papira, kartona, stakla, tekstila i dr.
1) Separately collected types of waste comprises collected amount of paper, cartoon, glass, textile and similar.
2) Otpad iz vrtova i parkova uključuje biorazgradivi otpad, zemlju i kamenje i ostali otpad koji nije biorazgradiv.
2) Waste from gardens and parks include biodegradable waste, soil and stones, as well as other waste which is not biodegradable
3) Ostali komunalni otpad obuhvata miješani komunalni otpad, otpad sa pijaca, otpad od čišćenja ulica, od čišćenja iz kanalizacije, kabasti otpad i sl.
3) Other municipal waste comprises mixed municipal waste from markets, from cleaning streets, from sewage cleaning, bulky waste and similar.
4) Na drugi način odstranjen otpad je obuhvaćen operacijama čiji je cilj završno zbrinjavanje otpada, koji se ne može preraditi i koji prolazi različite postupke obrade i odlaganja otpada.
4) Other types of disposal of waste covers operations aimed at final management of waste that cannot be recovered, comprising mostly different waste processing procedures and waste landfilling.
Za Godišnje istraživanje o komunalnom otpadu – KOM 6aS izvještajne jedinice su poslovni subjekti, kojima je općina dodijelila pravo na sakupljanje otpada, bez obzira na to da li su oni samo sakupljači otpada ili u isto vrijeme upravljaju odlagalištem otpada.
For the annual survey of municipal waste –KOM 6aS Reporting units are business entities, to which municipality granted the right to collect waste, regardless of whether they are just collectors of waste or at the same time they also manage the landfill.
U izvještaju se prikazuju podaci o svim količinama komunalnog otpada, koji su prikupljeni u toku referentne godine.
The report displays information about all municipal waste collected during the reference year.
Za Godišnje istraživanje o komunalnom otpadu – KOM 6aD izvještajne jedinice su poslovni subjekti koji upravljaju komunalnim odlagalištem otpada. U upitniku se prikazuju sve količine otpada koje su u godini izvještavanja prispjele na odlagalište, bez obzira na to kako je otpad prikupljen.
For the annual survey of municipal waste –KOM 6aD Reporting units are business entities that manage municipal landfills. The questionnaire lists all quantities of waste that are received during the reporting year to the landfill, regardless the method for the waste collecting.
Komunalni otpad se u Listi otpada klasifikuje u grupu 20: Komunalni otpad i slični otpad iz industrije, trgovine i uslužnih djelatnosti, uključujući odvojeno prikupljene frakcije.
Municipal solid waste in the list of waste is classified in the Group 20: Municipal and similar commercial, industrial, trade and services waste, including separately collected fractions.
27
5) Prerađen otpad je korisni otpad ili komponente otpada, uključujući prije svega reciklirani otpad, ponovno korišteni otpad, kompostirani otpad, otpad korišten u uređajima za sagorjevanje i industrijskim pećima ili otpad korišten za stvaranje goriva. Ne smatra se prerađenim onaj otpad koji se koristi za spaljivanje otpada i druge toplinske postupke predviđene za zbrinjavanje otpada.
5) Recovered waste is designed for beneficial use of waste or waste components, comprising first of all recycled, reused, composted, and waste used in fuelling devices and industrial ovens or waste used for fuel generation. Waste used for incineration and other thermal procedures designed for waste disposal are not considered to be recovered waste.
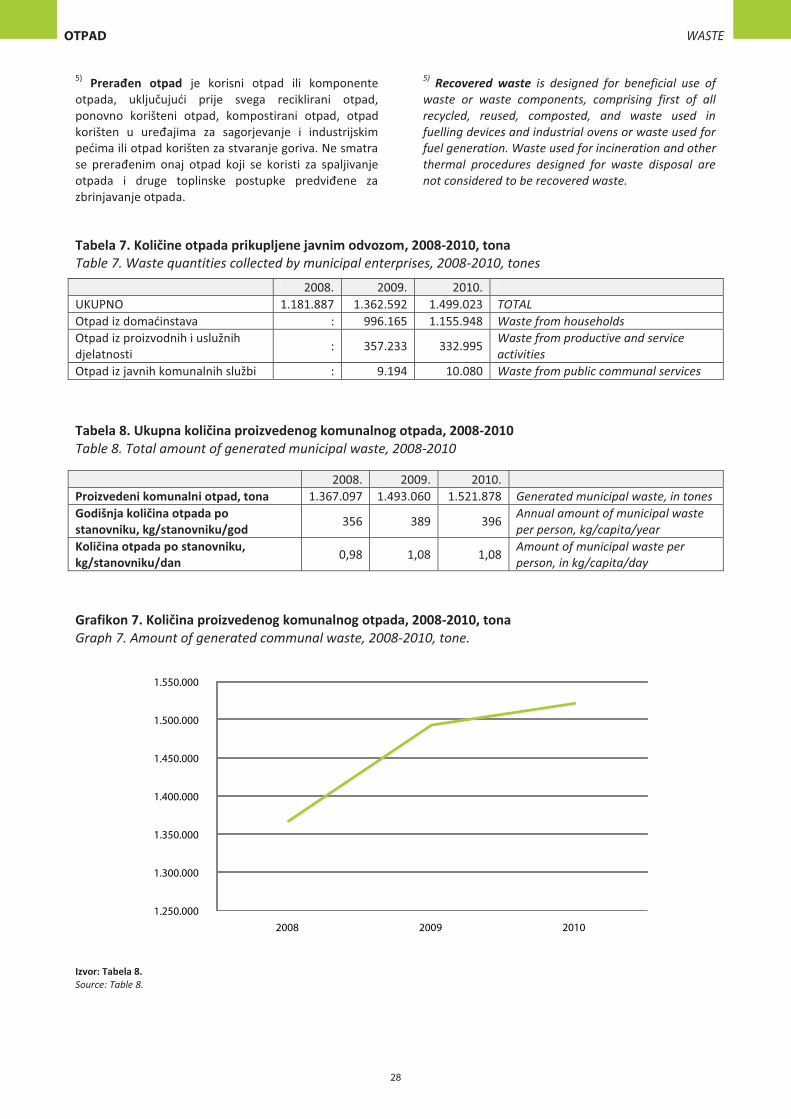
Tabela 7. Količine otpada prikupljene javnim odvozom, 2008-2010, tona Table 7. Waste quantities collected by municipal enterprises, 2008-2010, tones
2008. 2009. 2010. UKUPNO 1.181.887 1.362.592 1.499.023 TOTAL Otpad iz domaćinstava : 996.165 1.155.948 Waste from households Otpad iz proizvodnih i uslužnih djelatnosti : 357.233 332.995 Waste from productive and service
activities Otpad iz javnih komunalnih službi : 9.194 10.080 Waste from public communal services
Tabela 8. Ukupna količina proizvedenog komunalnog otpada, 2008-2010 Table 8. Total amount of generated municipal waste, 2008-2010
2008. 2009. 2010. Proizvedeni komunalni otpad, tona 1.367.097 1.493.060 1.521.878 Generated municipal waste, in tones Godišnja količina otpada po stanovniku, kg/stanovniku/god 356 389 396 Annual amount of municipal waste
per person, kg/capita/year Količina otpada po stanovniku, kg/stanovniku/dan 0,98 1,08 1,08 Amount of municipal waste per
person, in kg/capita/day Grafikon 7. Količina proizvedenog komunalnog otpada, 2008-2010, tona Graph 7. Amount of generated communal waste, 2008-2010, tone.
Izvor: Tabela 8. Source: Table 8.
28
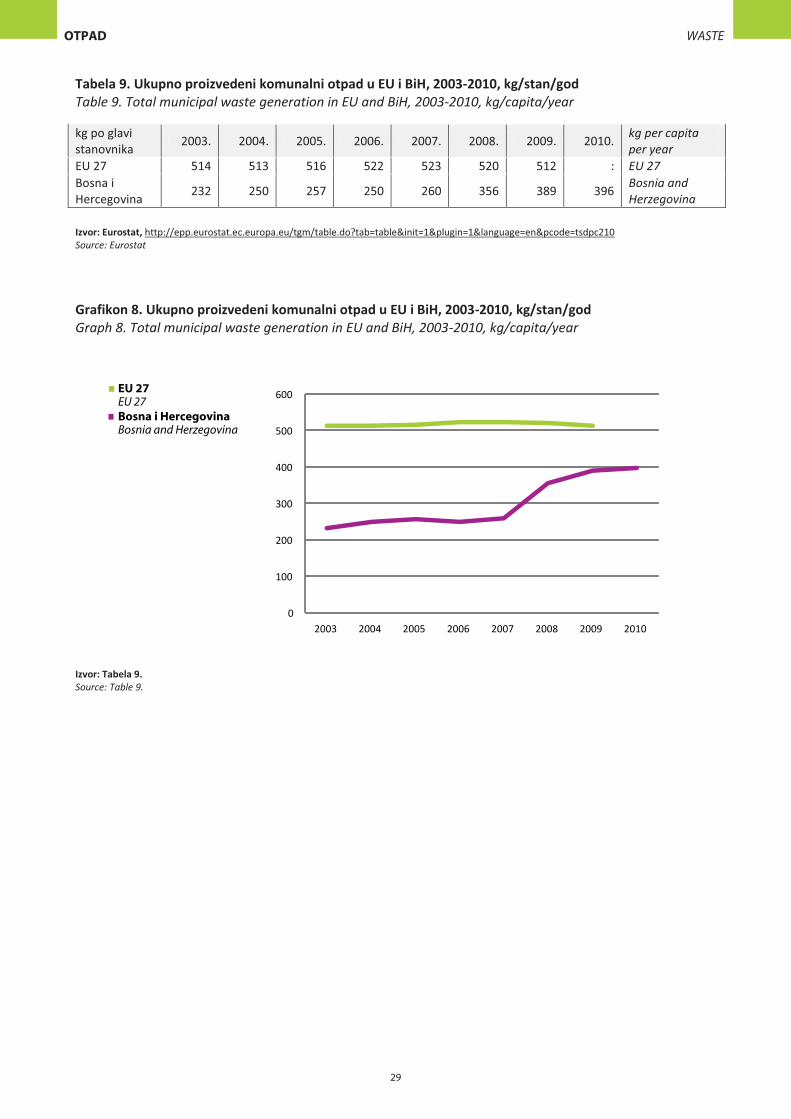
Tabela 9. Ukupno proizvedeni komunalni otpad u EU i BiH, 2003-2010, kg/stan/god Table 9. Total municipal waste generation in EU and BiH, 2003-2010, kg/capita/year
kg po glavi stanovnika 2003. 2004. 2005. 2006. 2007. 2008. 2009. 2010. kg per capita
per year EU 27 514 513 516 522 523 520 512 : EU 27 Bosna i Hercegovina 232 250 257 250 260 356 389 396 Bosnia and
Herzegovina Izvor: Eurostat, http://epp.eurostat.ec.europa.eu/tgm/table.do?tab=table&init=1&plugin=1&language=en&pcode=tsdpc210 Source: Eurostat
Grafikon 8. Ukupno proizvedeni komunalni otpad u EU i BiH, 2003-2010, kg/stan/god Graph 8. Total municipal waste generation in EU and BiH, 2003-2010, kg/capita/year
Izvor: Tabela 9. Source: Table 9.
29
1.4 Statistika vanjske trgovine – izvoz neopasnog otpada Foreign trade statistics – export of non hazardous waste
Metodološka objašnjenja i definicije Methodological notes and definitions
Zbog nedostatka podataka u Bosni i Hercegovini o uvozu/izvozu neopasnog otpada prema Regulativi 259/93/EEC o prekograničnom prometu otpada, Odjel za statistiku okoliša Agencije za statistiku BiH je preduzeo aktivnosti na obradi dostupnih podataka statistike vanjske trgovine.
Due to lack of information in Bosnia and Herzegovina on import / export of non-hazardous waste according to 259/93/EEC Regulation on the transboundary movement of waste, the Department of Environmental Statistics of Statistics Agency Bosnia and Herzegovina has taken action to process the available data of external trade statistics.
Razvoj i proizvodnja statistike vanjske trgovine u BiH se odvija kroz statističke institucije.Osnova razvoja je utvrđena evropskim propisima i stoga je statistika vanjske trgovine u velikoj mjeri usklađena sa zemljama EU. Osnovni izvor podataka je Jedinstvena carinska isprava (JCI). Agencija za statistiku BiH dobija potrebne podatke iz Jedinstvenih carinskih isprava od Uprave za indirektno oporezivanje BiH, u skladu sa Protokolom o saradnji potpisanim između ove dvije institucije.
Development and production of external trade statistics in BiH is done through statistical institutions. Basis for the development is defined by European regulations and therefore the statistics of foreign trade is largely in line with EU countries. The main data source is the Unique Customs Declaration (UCD). Agency for Statistics of BiH receives the necessary data from the single administrative document of the Indirect Taxation Authority, in accordance with the Protocol on Cooperation signed between the two institutions.
Podaci o izvezenim/uvezenim količinama neopasnog otpada su dobijeni na osnovu obrade baze podataka statistike vanjske trgovine. Baza sadrži podatke koji su relevantni za statistiku o uvozu i izvozu otpada. Ovi podaci uključuju slijedeće elemente:
Data on exported / imported quantities of non-hazardous waste were obtained from processing databases of external trade statistics. The database contains information that is relevant to statistics on import and export of waste. These data include the following elements:
� Opis robe
� Description of goods
� Količine kojima se trguje u tonama
� The quantities traded in tons
� Zemlja porijekla i odredište
� Country of origin and destination
� Dostupne su i druge informacije kao što je vrijednost robe, ali one nisu relevantne za statistiku uvoza i izvoza otpada u kontekstu Regulative o statistici otpada 2150/2002/EC.
� There are also other information such as the value of the goods, but they are not relevant to the statistics of imports and exports of waste in the context of Regulation 2150/2002/EC on waste statistics.
CN – (Kombinovana nomenklatura) je klasifikacija roba unutar EU za potrebe prikupljanja carina, statističko praćenje vanjske trgovine, te za primjenu posebnih mjera u okviru trgovačke, poljoprivredne, fiskalne i monetarne politike EU. Ona se zasniva na međunarodnoj klasifikaciji harmonizovanog sistema, koju sastavlja Svjetska carinska organizacija, a Evropska unija dopunjava se svojim potpodjelama tzv. CN podnaslovima. Kombinovana nomenklatura se sastoji od oko 10.000 različitih kodova koji opisuju robu. Od tih kodova, oko 250 su kodovi koji se sastoje od ili sadrže otpad, a koji bi mogli biti osnova za prikupljanje statističkih podataka o uvozu i izvozu otpada za različite materijale. Obradom baze podataka statistike vanjske trgovine su ekstraktovani tarifni brojevi (CN kodovi) koji sadrže otpad.
CN - (Combined Nomenclature) the classification of goods within the EU for the purpose of collecting customs duties, statistical monitoring of foreign trade, and for the implementation of special measures in the commercial, agricultural, fiscal and monetary policy. It is based on the international harmonized system of classification, compiled by the World Customs Organization and the European Union to complement its subclauses so. CN subheadings. Combined Nomenclature comprises about 10.000 different codes that describe the goods. Of these codes, about 250 codes that consist of or contain waste, which could be the basis for collecting statistical data on imports and exports of waste for different materials. Processing of a database of external trade statistics are extracted tariff numbers (CN codes) containing waste.
30
Izbor tih kodova bio je zasnovan na osnovu procjene i identifikacije koju je uradio Njemački zavod za statistiku, kao i dopuna koje je predložila Savezna agencija zaštite okoliša UBA (Federal Environment Agency).
The choice of these codes was based on an assessment and identification conducted by German Bureau of Statistics, as well as amendments proposed by the Federal Environment Agency UBA (Federal Environment Agency).
Svi izabrani kodovi nisu bili pogodni za prikupljanje statističkih podataka o uvozu i izvozu otpada i taj broj je morao biti smanjen zbog toga što:
All selected codes were not suitable for collecting statistical data on imports and exports of waste and this figure has to be reduced because:
� Neki kodovi sadrže i otpad i proizvod u istom kodu.
� Some codes contain waste and products in the same code
� Neki kodovi sadrže otpad koji je u potpunosti ili djelomično obuhvaćen izvještavanjem u skladu s Regulativom 259/93/EEC o prekograničnom prometu otpada.
� Some codes may contain waste which is wholly or partly covered by the reporting in accordance with Regulation 259/93/EEC on transboundary movement of waste.
Ovo su neki od zaključaka o prikladnosti korištenja vanjskotrgovačke statistike za potrebe statistike uvoza/izvoza otpada:
These are some of the conclusions about the appropriateness of using the foreign trade statistics for statistics of import / export of waste:
� Za neke vrste otpada, kao što je metalni otpad, papir i karton, staklo i plastični otpad, tekstilni otpad i otpad od sagorijevanja (pepeo i šljaka), statistika vanjske trgovine omogućava relevantne podatke o uvozu i izvozu otpada, i ti podaci se mogu koristiti kao dopuna podacima zasnovanim na Regulativi o prekograničnom prometu otpada.
� For some types of waste such as scrap metal, paper and cardboard, glass and plastic waste, textile waste and combustion (ash and slag), foreign trade statistics to the relevant data on imports and exports of waste, and these data can be used as a supplement to the data based on the Regulation on the transboundary movement of waste..
� Za druge vrste otpada, kao što su iskorištene gume, otpad elektronske opreme i otpad iz poljoprivredno-prehrambene industrije, vanjskotrgovačka statistika ne pruža dobru osnovu za statistiku o uvozu i izvozu otpada, budući da se podaci o otpadu i proizvodima obično kombinuju u istom kodu Kombinovane nomenklature.
� For other types of waste such as used tires, scrap electronic equipment and waste from the agri-food industry, foreign trade statistics do not provide a good basis for statistics on import and export of waste, since the data on waste and products are usually combined in the same code of Combined Nomenclature
� Podaci statistike vanjske trgovine imaju češću frekvenciju proizvodnje podataka u odnosu na frekvenciju koja je zahtjevana u Regulativi o statistici otpada, dostupni su na vrijeme i uz poštovanje rokova.
� The data of external trade statistics have higher frequency of production data in relation to the frequency that is required by the Regulation on waste statistics, and they are available on time and respecting deadlines.
� Potrebni podaci o uvozu i izvozu otpada se mogu lahko izvaditi iz postojeće baze podataka statistike vanjske trgovine, i stoga korištenje tih podataka za potrebe Regulative o statistici otpada, uključuje malo ili je to bez ikakvih dodatnih troškova.
� Necessary data on import and export of waste can be easily removed from an existing database of external trade statistics, and therefore use these data for purposes of Regulation on waste statistics involve little or no additional cost.
� Metodologija koja se primijenjuje u Njemačkoj bi se u načelu mogla koristiti od strane svih država članica EU i šire.
� The methodology applied in Germany could in principle be used by all EU member states and beyond.
31
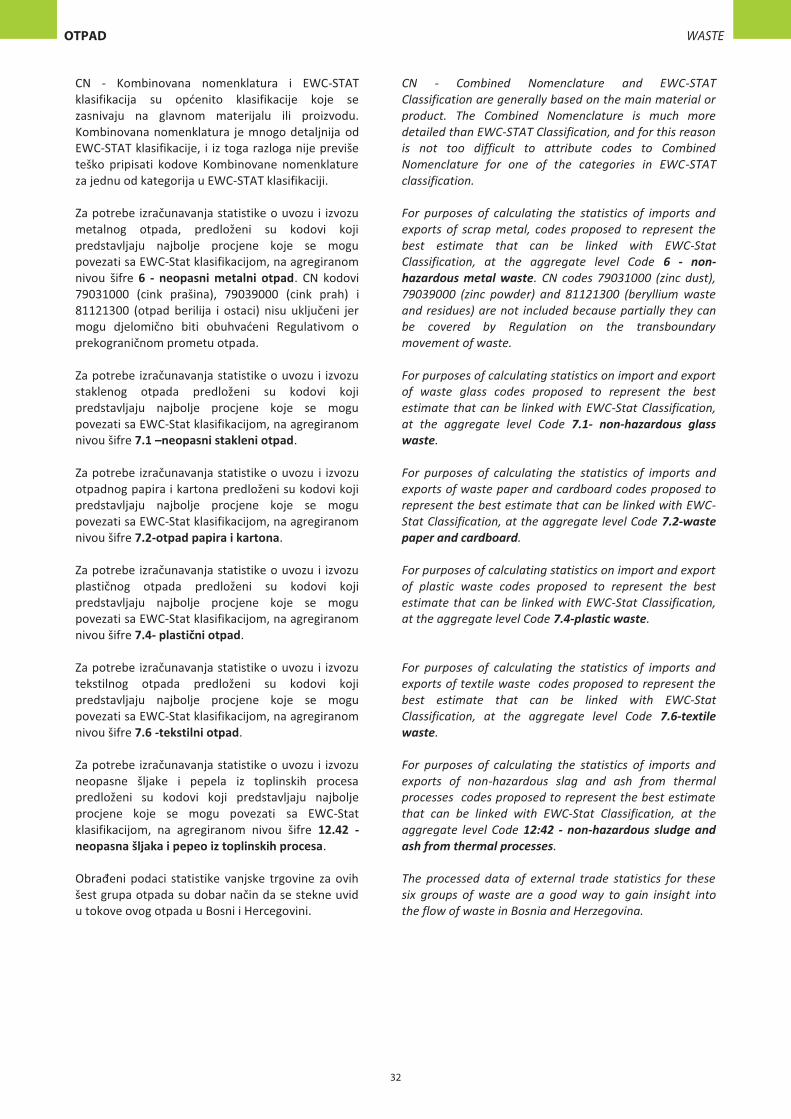
CN - Kombinovana nomenklatura i EWC-STAT klasifikacija su općenito klasifikacije koje se zasnivaju na glavnom materijalu ili proizvodu. Kombinovana nomenklatura je mnogo detaljnija od EWC-STAT klasifikacije, i iz toga razloga nije previše teško pripisati kodove Kombinovane nomenklature za jednu od kategorija u EWC-STAT klasifikaciji.
CN - Combined Nomenclature and EWC-STAT Classification are generally based on the main material or product. The Combined Nomenclature is much more detailed than EWC-STAT Classification, and for this reason is not too difficult to attribute codes to Combined Nomenclature for one of the categories in EWC-STAT classification.
Za potrebe izračunavanja statistike o uvozu i izvozu metalnog otpada, predloženi su kodovi koji predstavljaju najbolje procjene koje se mogu povezati sa EWC-Stat klasifikacijom, na agregiranom nivou šifre 6 - neopasni metalni otpad. CN kodovi 79031000 (cink prašina), 79039000 (cink prah) i 81121300 (otpad berilija i ostaci) nisu uključeni jer mogu djelomično biti obuhvaćeni Regulativom o prekograničnom prometu otpada.
For purposes of calculating the statistics of imports and exports of scrap metal, codes proposed to represent the best estimate that can be linked with EWC-Stat Classification, at the aggregate level Code 6 - non-hazardous metal waste. CN codes 79031000 (zinc dust), 79039000 (zinc powder) and 81121300 (beryllium waste and residues) are not included because partially they can be covered by Regulation on the transboundary movement of waste.
Za potrebe izračunavanja statistike o uvozu i izvozu staklenog otpada predloženi su kodovi koji predstavljaju najbolje procjene koje se mogu povezati sa EWC-Stat klasifikacijom, na agregiranom nivou šifre 7.1 –neopasni stakleni otpad.
For purposes of calculating statistics on import and export of waste glass codes proposed to represent the best estimate that can be linked with EWC-Stat Classification, at the aggregate level Code 7.1- non-hazardous glass waste.
Za potrebe izračunavanja statistike o uvozu i izvozu otpadnog papira i kartona predloženi su kodovi koji predstavljaju najbolje procjene koje se mogu povezati sa EWC-Stat klasifikacijom, na agregiranom nivou šifre 7.2-otpad papira i kartona.
For purposes of calculating the statistics of imports and exports of waste paper and cardboard codes proposed to represent the best estimate that can be linked with EWC-Stat Classification, at the aggregate level Code 7.2-waste paper and cardboard.
Za potrebe izračunavanja statistike o uvozu i izvozu plastičnog otpada predloženi su kodovi koji predstavljaju najbolje procjene koje se mogu povezati sa EWC-Stat klasifikacijom, na agregiranom nivou šifre 7.4- plastični otpad.
For purposes of calculating statistics on import and export of plastic waste codes proposed to represent the best estimate that can be linked with EWC-Stat Classification, at the aggregate level Code 7.4-plastic waste.
Za potrebe izračunavanja statistike o uvozu i izvozu tekstilnog otpada predloženi su kodovi koji predstavljaju najbolje procjene koje se mogu povezati sa EWC-Stat klasifikacijom, na agregiranom nivou šifre 7.6 -tekstilni otpad.
For purposes of calculating the statistics of imports and exports of textile waste codes proposed to represent the best estimate that can be linked with EWC-Stat Classification, at the aggregate level Code 7.6-textile waste.
Za potrebe izračunavanja statistike o uvozu i izvozu neopasne šljake i pepela iz toplinskih procesa predloženi su kodovi koji predstavljaju najbolje procjene koje se mogu povezati sa EWC-Stat klasifikacijom, na agregiranom nivou šifre 12.42 - neopasna šljaka i pepeo iz toplinskih procesa.
For purposes of calculating the statistics of imports and exports of non-hazardous slag and ash from thermal processes codes proposed to represent the best estimate that can be linked with EWC-Stat Classification, at the aggregate level Code 12:42 - non-hazardous sludge and ash from thermal processes.
Obrađeni podaci statistike vanjske trgovine za ovih šest grupa otpada su dobar način da se stekne uvid u tokove ovog otpada u Bosni i Hercegovini.
The processed data of external trade statistics for these six groups of waste are a good way to gain insight into the flow of waste in Bosnia and Herzegovina.
32
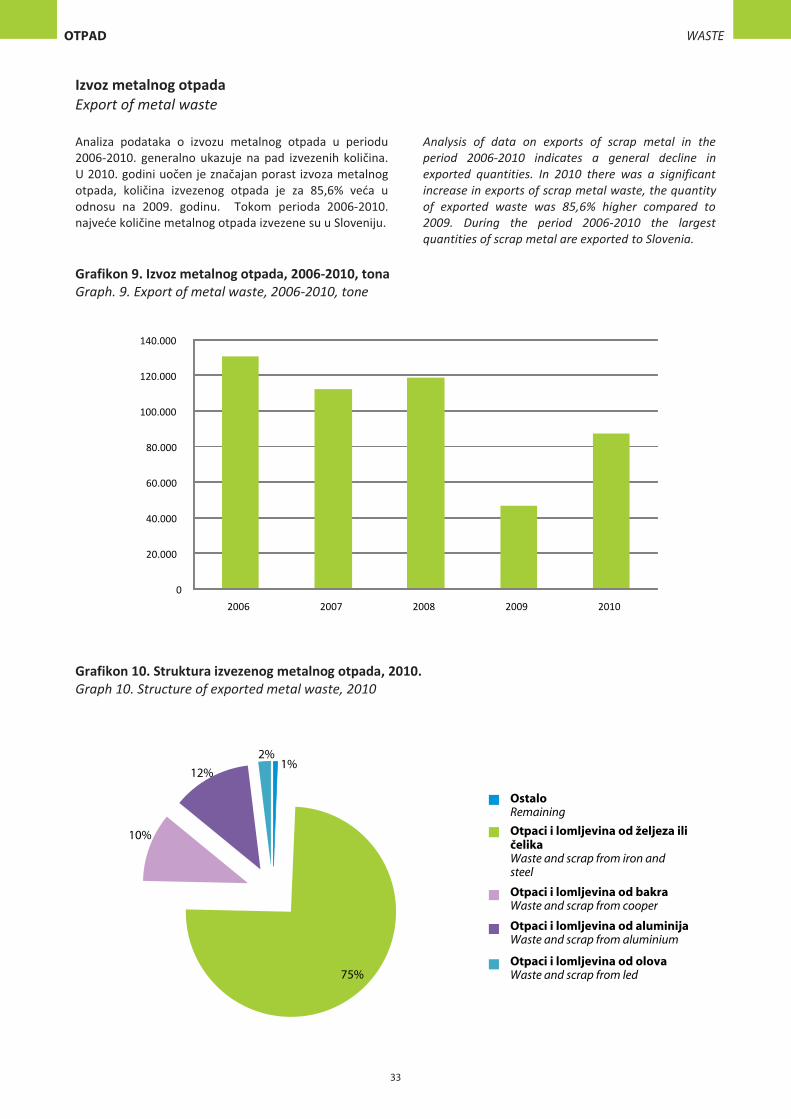
Izvoz metalnog otpada Export of metal waste Analiza podataka o izvozu metalnog otpada u periodu 2006-2010. generalno ukazuje na pad izvezenih količina. U 2010. godini uočen je značajan porast izvoza metalnog otpada, količina izvezenog otpada je za 85,6% veća u odnosu na 2009. godinu. Tokom perioda 2006-2010. najveće količine metalnog otpada izvezene su u Sloveniju.
Analysis of data on exports of scrap metal in the period 2006-2010 indicates a general decline in exported quantities. In 2010 there was a significant increase in exports of scrap metal waste, the quantity of exported waste was 85,6% higher compared to 2009. During the period 2006-2010 the largest quantities of scrap metal are exported to Slovenia.
Grafikon 9. Izvoz metalnog otpada, 2006-2010, tona Graph. 9. Export of metal waste, 2006-2010, tone
Grafikon 10. Struktura izvezenog metalnog otpada, 2010. Graph 10. Structure of exported metal waste, 2010
33
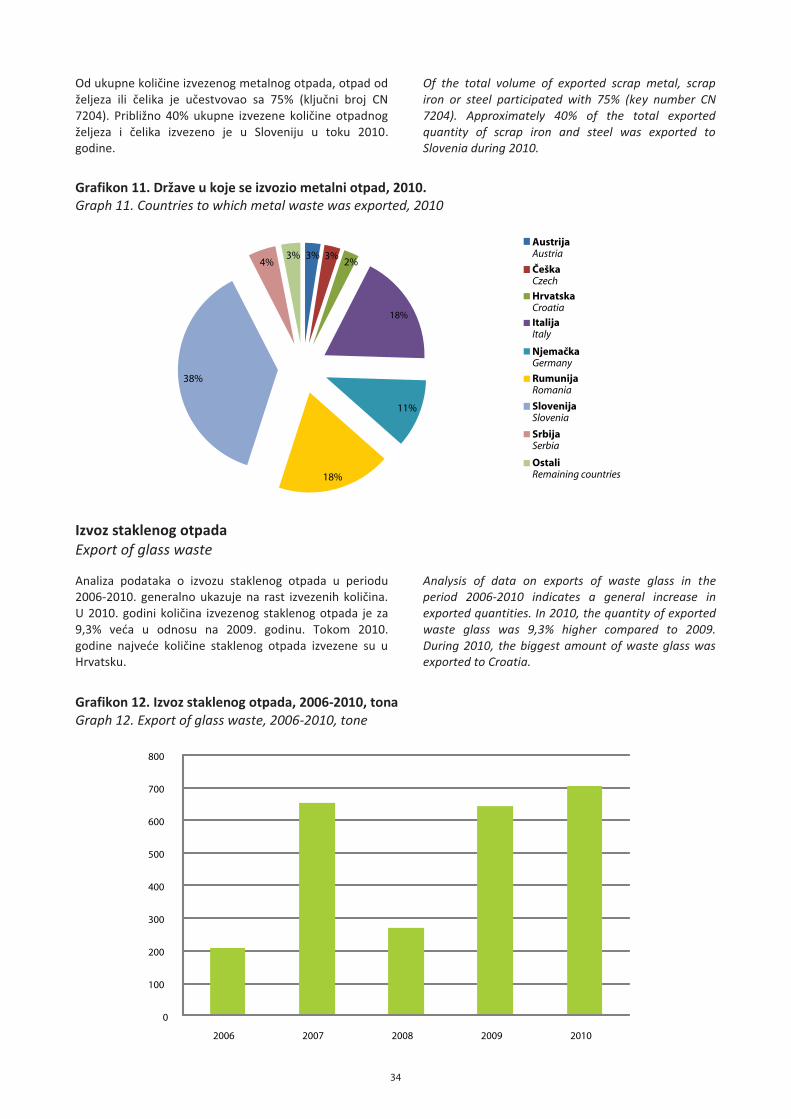
Od ukupne količine izvezenog metalnog otpada, otpad od željeza ili čelika je učestvovao sa 75% (ključni broj CN 7204). Približno 40% ukupne izvezene količine otpadnog željeza i čelika izvezeno je u Sloveniju u toku 2010. godine.
Of the total volume of exported scrap metal, scrap iron or steel participated with 75% (key number CN 7204). Approximately 40% of the total exported quantity of scrap iron and steel was exported to Slovenia during 2010.
Grafikon 11. Države u koje se izvozio metalni otpad, 2010. Graph 11. Countries to which metal waste was exported, 2010
Izvoz staklenog otpada Export of glass waste
Analiza podataka o izvozu staklenog otpada u periodu 2006-2010. generalno ukazuje na rast izvezenih količina. U 2010. godini količina izvezenog staklenog otpada je za 9,3% veća u odnosu na 2009. godinu. Tokom 2010. godine najveće količine staklenog otpada izvezene su u Hrvatsku.
Analysis of data on exports of waste glass in the period 2006-2010 indicates a general increase in exported quantities. In 2010, the quantity of exported waste glass was 9,3% higher compared to 2009. During 2010, the biggest amount of waste glass was exported to Croatia.
Grafikon 12. Izvoz staklenog otpada, 2006-2010, tona Graph 12. Export of glass waste, 2006-2010, tone
34
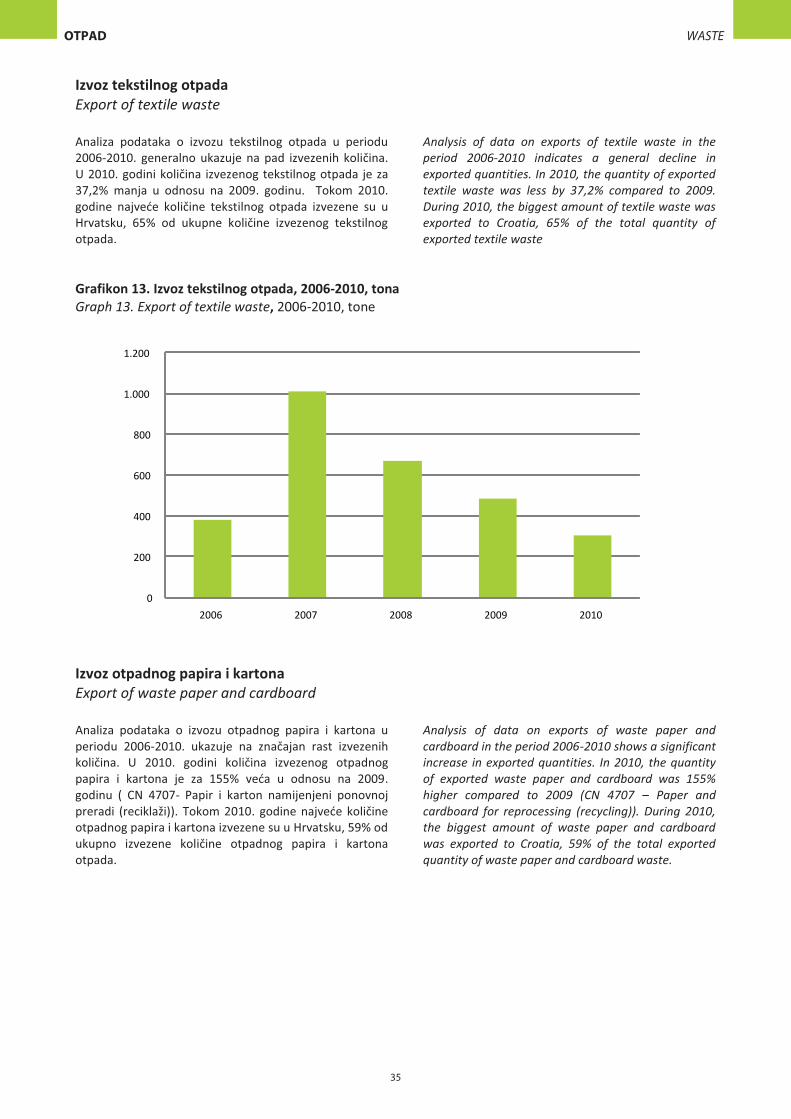
Izvoz tekstilnog otpada Export of textile waste Analiza podataka o izvozu tekstilnog otpada u periodu 2006-2010. generalno ukazuje na pad izvezenih količina. U 2010. godini količina izvezenog tekstilnog otpada je za 37,2% manja u odnosu na 2009. godinu. Tokom 2010. godine najveće količine tekstilnog otpada izvezene su u Hrvatsku, 65% od ukupne količine izvezenog tekstilnog otpada.
Analysis of data on exports of textile waste in the period 2006-2010 indicates a general decline in exported quantities. In 2010, the quantity of exported textile waste was less by 37,2% compared to 2009. During 2010, the biggest amount of textile waste was exported to Croatia, 65% of the total quantity of exported textile waste
Grafikon 13. Izvoz tekstilnog otpada, 2006-2010, tona Graph 13. Export of textile waste, 2006-2010, tone
Izvoz otpadnog papira i kartona Export of waste paper and cardboard Analiza podataka o izvozu otpadnog papira i kartona u periodu 2006-2010. ukazuje na značajan rast izvezenih količina. U 2010. godini količina izvezenog otpadnog papira i kartona je za 155% veća u odnosu na 2009. godinu ( CN 4707- Papir i karton namijenjeni ponovnoj preradi (reciklaži)). Tokom 2010. godine najveće količine otpadnog papira i kartona izvezene su u Hrvatsku, 59% od ukupno izvezene količine otpadnog papira i kartona otpada.
Analysis of data on exports of waste paper and cardboard in the period 2006-2010 shows a significant increase in exported quantities. In 2010, the quantity of exported waste paper and cardboard was 155% higher compared to 2009 (CN 4707 – Paper and cardboard for reprocessing (recycling)). During 2010, the biggest amount of waste paper and cardboard was exported to Croatia, 59% of the total exported quantity of waste paper and cardboard waste.
35
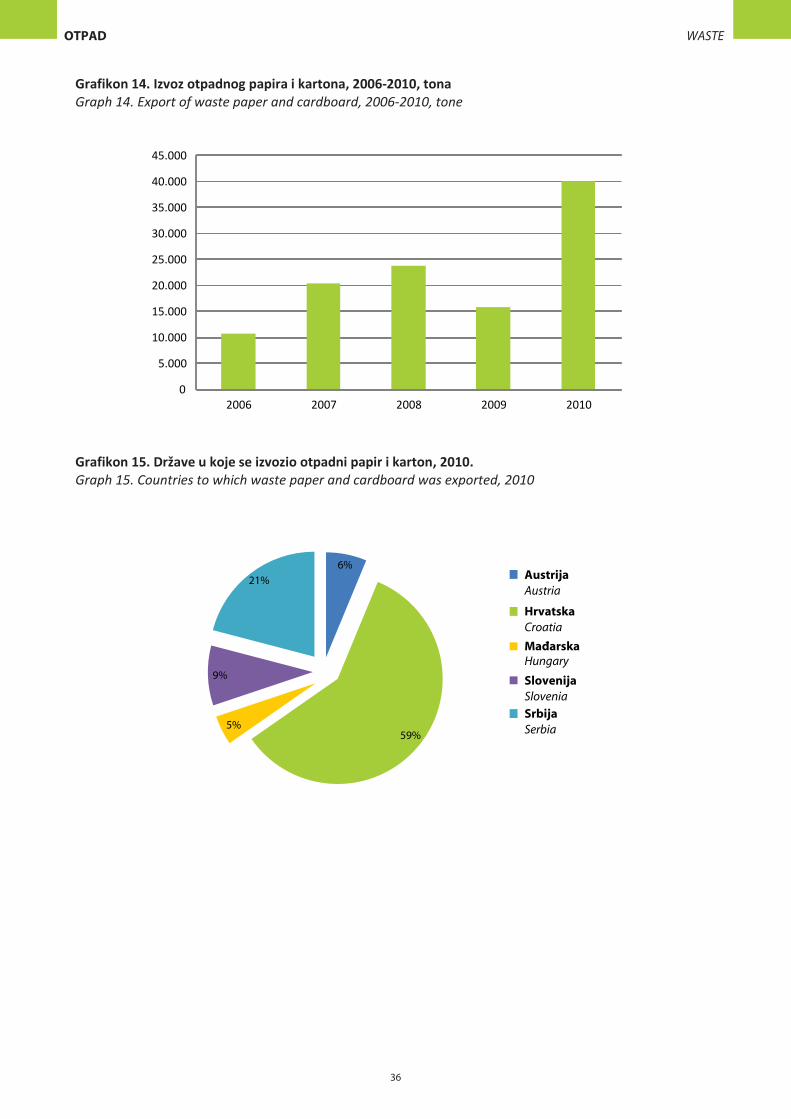
Grafikon 14. Izvoz otpadnog papira i kartona, 2006-2010, tona Graph 14. Export of waste paper and cardboard, 2006-2010, tone
Grafikon 15. Države u koje se izvozio otpadni papir i karton, 2010. Graph 15. Countries to which waste paper and cardboard was exported, 2010
36
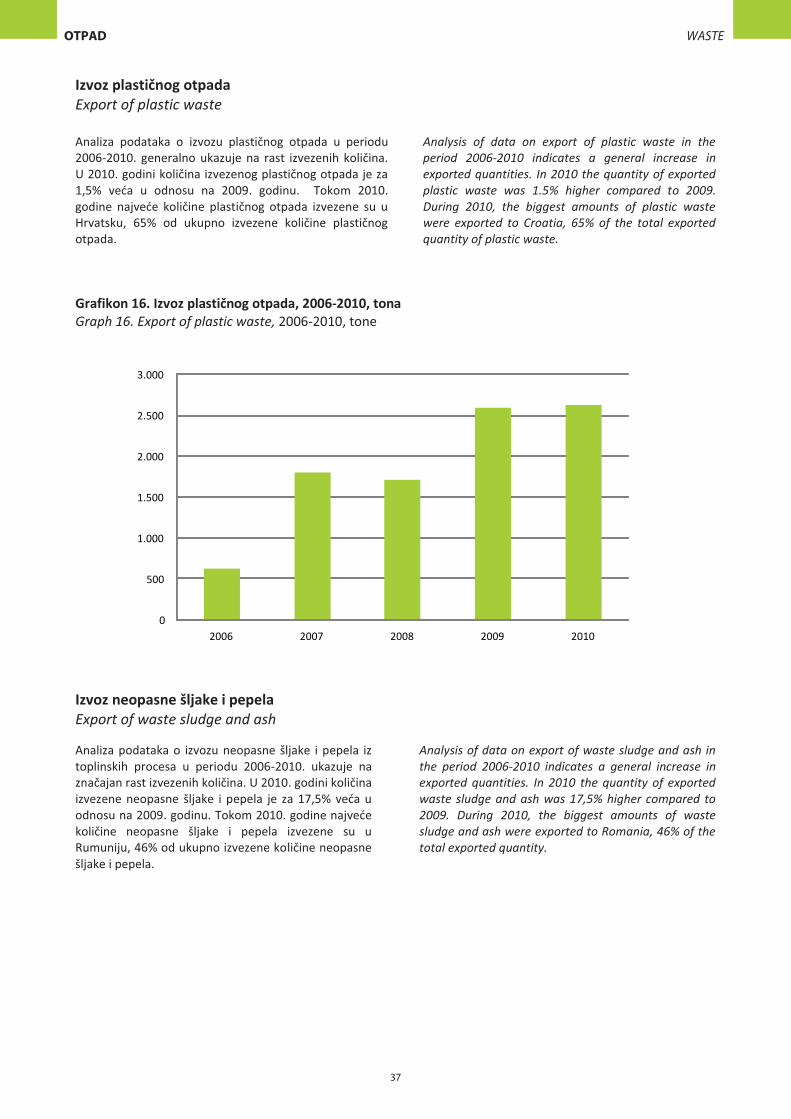
Izvoz plastičnog otpada Export of plastic waste Analiza podataka o izvozu plastičnog otpada u periodu 2006-2010. generalno ukazuje na rast izvezenih količina. U 2010. godini količina izvezenog plastičnog otpada je za 1,5% veća u odnosu na 2009. godinu. Tokom 2010. godine najveće količine plastičnog otpada izvezene su u Hrvatsku, 65% od ukupno izvezene količine plastičnog otpada.
Analysis of data on export of plastic waste in the period 2006-2010 indicates a general increase in exported quantities. In 2010 the quantity of exported plastic waste was 1.5% higher compared to 2009. During 2010, the biggest amounts of plastic waste were exported to Croatia, 65% of the total exported quantity of plastic waste.
Grafikon 16. Izvoz plastičnog otpada, 2006-2010, tona Graph 16. Export of plastic waste, 2006-2010, tone
Izvoz neopasne šljake i pepela Export of waste sludge and ash
Analiza podataka o izvozu neopasne šljake i pepela iz toplinskih procesa u periodu 2006-2010. ukazuje na značajan rast izvezenih količina. U 2010. godini količina izvezene neopasne šljake i pepela je za 17,5% veća u odnosu na 2009. godinu. Tokom 2010. godine najveće količine neopasne šljake i pepela izvezene su u Rumuniju, 46% od ukupno izvezene količine neopasne šljake i pepela.
Analysis of data on export of waste sludge and ash in the period 2006-2010 indicates a general increase in exported quantities. In 2010 the quantity of exported waste sludge and ash was 17,5% higher compared to 2009. During 2010, the biggest amounts of waste sludge and ash were exported to Romania, 46% of the total exported quantity.
37
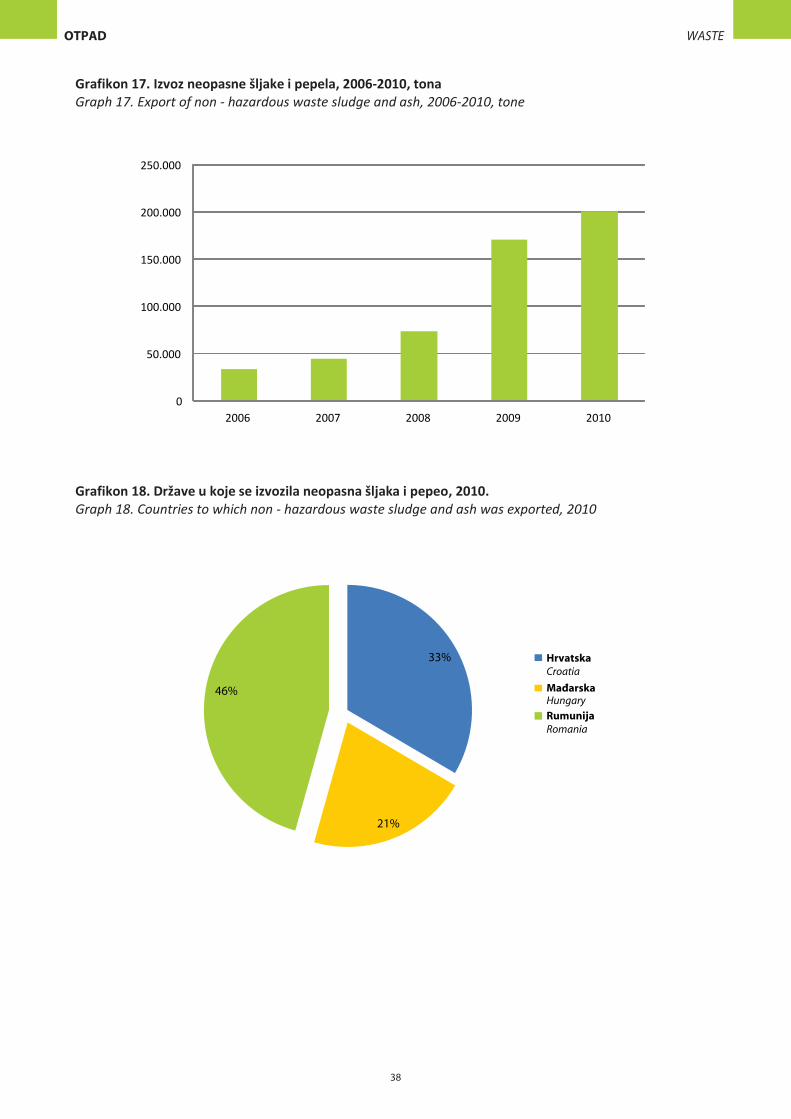
Grafikon 17. Izvoz neopasne šljake i pepela, 2006-2010, tona Graph 17. Export of non - hazardous waste sludge and ash, 2006-2010, tone
Grafikon 18. Države u koje se izvozila neopasna šljaka i pepeo, 2010. Graph 18. Countries to which non - hazardous waste sludge and ash was exported, 2010
38
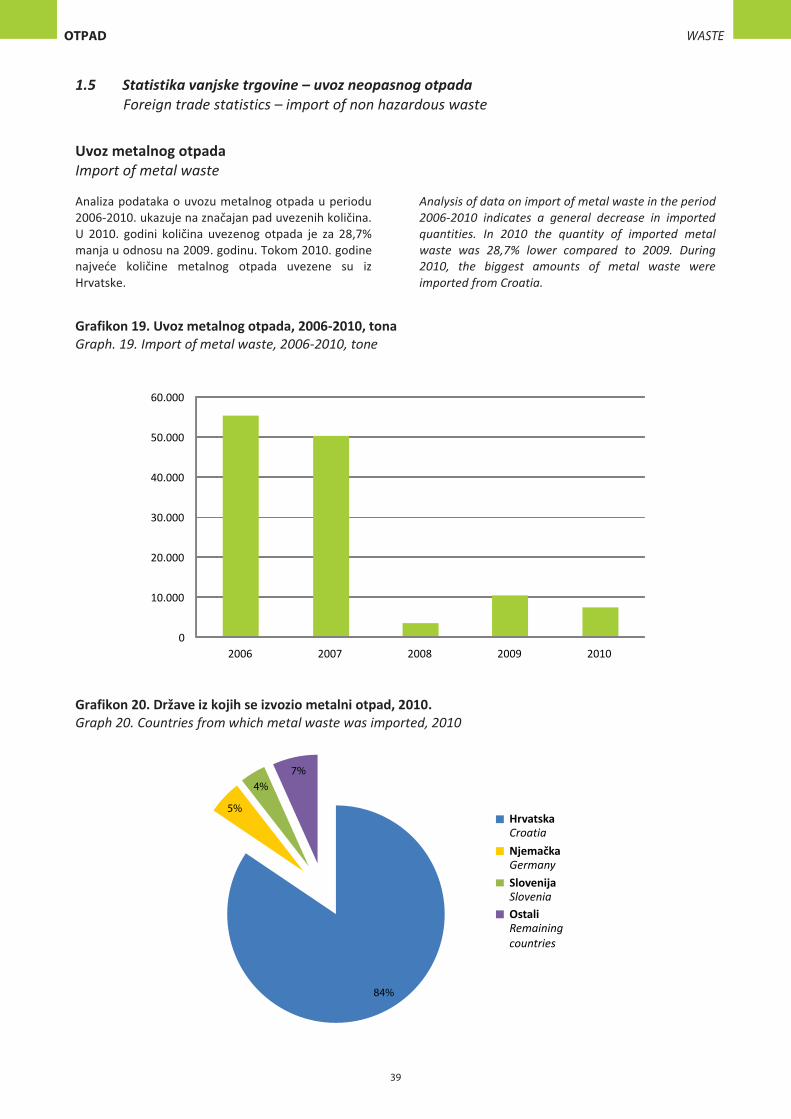
1.5 Statistika vanjske trgovine – uvoz neopasnog otpada Foreign trade statistics – import of non hazardous waste
Uvoz metalnog otpada Import of metal waste
Analiza podataka o uvozu metalnog otpada u periodu 2006-2010. ukazuje na značajan pad uvezenih količina. U 2010. godini količina uvezenog otpada je za 28,7% manja u odnosu na 2009. godinu. Tokom 2010. godine najveće količine metalnog otpada uvezene su iz Hrvatske.
Analysis of data on import of metal waste in the period 2006-2010 indicates a general decrease in imported quantities. In 2010 the quantity of imported metal waste was 28,7% lower compared to 2009. During 2010, the biggest amounts of metal waste were imported from Croatia.
Grafikon 19. Uvoz metalnog otpada, 2006-2010, tona Graph. 19. Import of metal waste, 2006-2010, tone
Grafikon 20. Države iz kojih se izvozio metalni otpad, 2010. Graph 20. Countries from which metal waste was imported, 2010
39
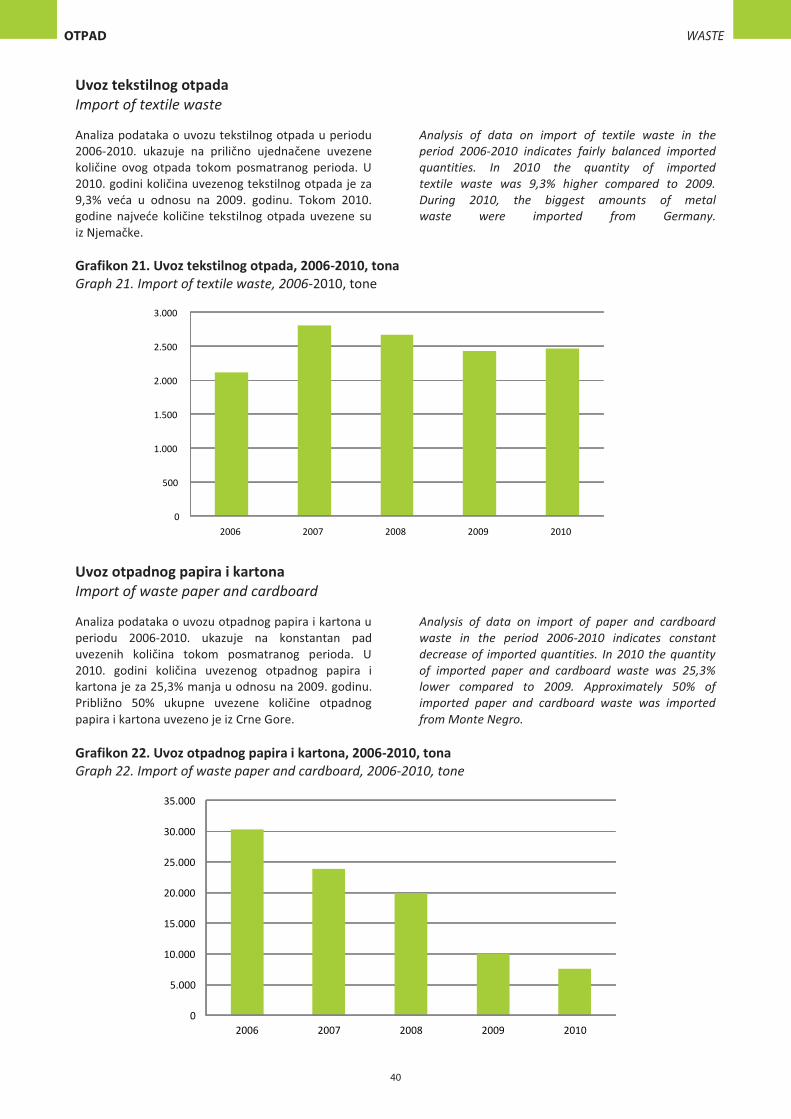
Uvoz tekstilnog otpada Import of textile waste Analiza podataka o uvozu tekstilnog otpada u periodu 2006-2010. ukazuje na prilično ujednačene uvezene količine ovog otpada tokom posmatranog perioda. U 2010. godini količina uvezenog tekstilnog otpada je za 9,3% veća u odnosu na 2009. godinu. Tokom 2010. godine najveće količine tekstilnog otpada uvezene su iz Njemačke.
Analysis of data on import of textile waste in the period 2006-2010 indicates fairly balanced imported quantities. In 2010 the quantity of imported textile waste was 9,3% higher compared to 2009. During 2010, the biggest amounts of metal waste were imported from Germany.
Grafikon 21. Uvoz tekstilnog otpada, 2006-2010, tona Graph 21. Import of textile waste, 2006-2010, tone
Uvoz otpadnog papira i kartona Import of waste paper and cardboard Analiza podataka o uvozu otpadnog papira i kartona u periodu 2006-2010. ukazuje na konstantan pad uvezenih količina tokom posmatranog perioda. U 2010. godini količina uvezenog otpadnog papira i kartona je za 25,3% manja u odnosu na 2009. godinu. Približno 50% ukupne uvezene količine otpadnog papira i kartona uvezeno je iz Crne Gore.
Analysis of data on import of paper and cardboard waste in the period 2006-2010 indicates constant decrease of imported quantities. In 2010 the quantity of imported paper and cardboard waste was 25,3% lower compared to 2009. Approximately 50% of imported paper and cardboard waste was imported from Monte Negro.
Grafikon 22. Uvoz otpadnog papira i kartona, 2006-2010, tona Graph 22. Import of waste paper and cardboard, 2006-2010, tone
40
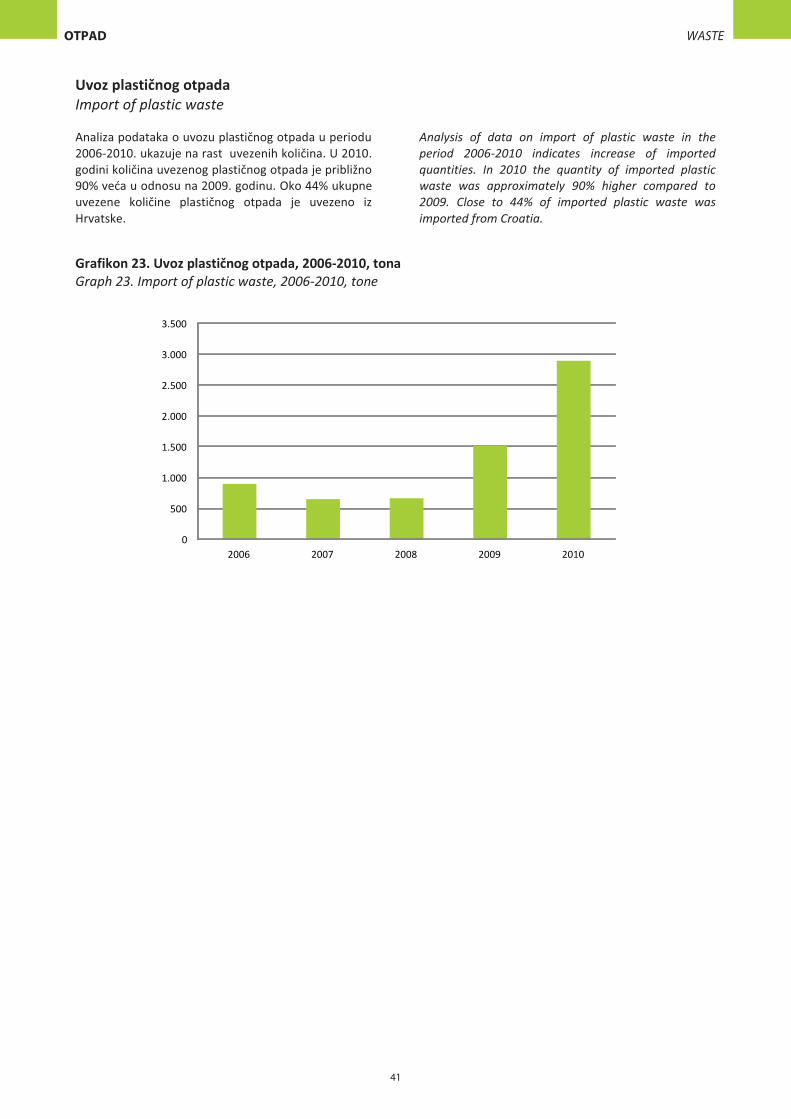
Uvoz plastičnog otpada Import of plastic waste
Analiza podataka o uvozu plastičnog otpada u periodu 2006-2010. ukazuje na rast uvezenih količina. U 2010. godini količina uvezenog plastičnog otpada je približno 90% veća u odnosu na 2009. godinu. Oko 44% ukupne uvezene količine plastičnog otpada je uvezeno iz Hrvatske.
Analysis of data on import of plastic waste in the period 2006-2010 indicates increase of imported quantities. In 2010 the quantity of imported plastic waste was approximately 90% higher compared to 2009. Close to 44% of imported plastic waste was imported from Croatia.
Grafikon 23. Uvoz plastičnog otpada, 2006-2010, tona Graph 23. Import of plastic waste, 2006-2010, tone
41
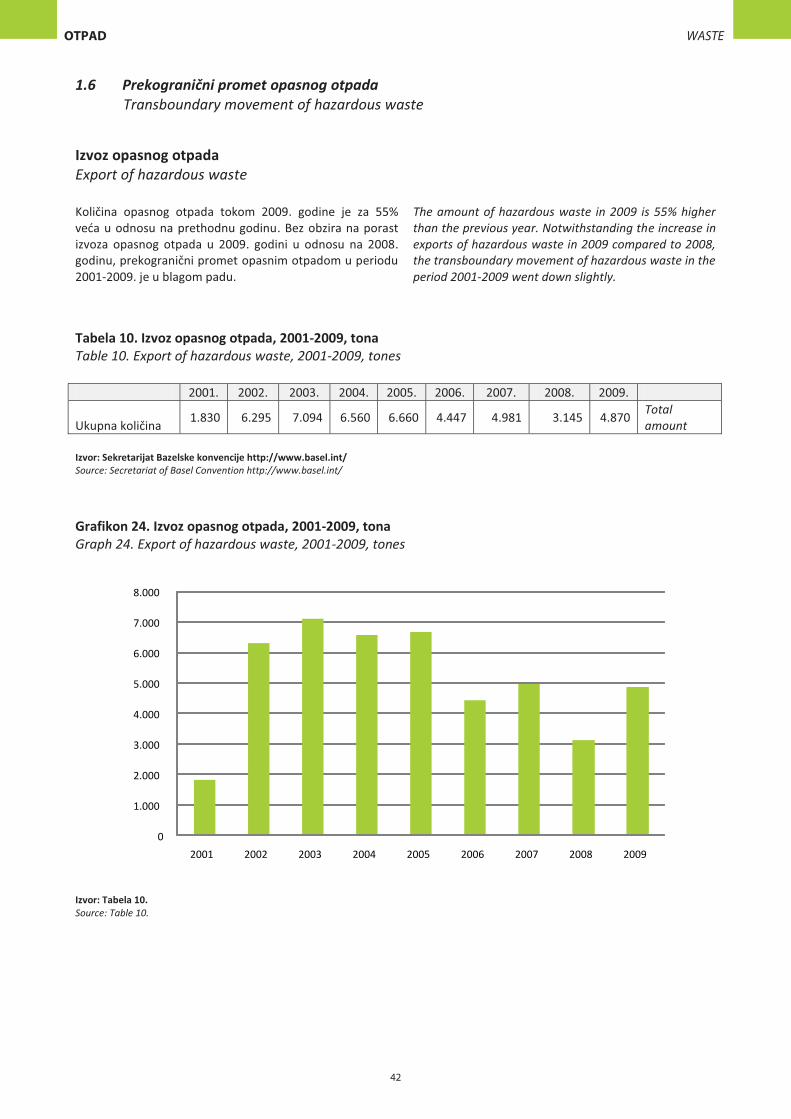
1.6 Prekogranični promet opasnog otpada Transboundary movement of hazardous waste
Izvoz opasnog otpada Export of hazardous waste Količina opasnog otpada tokom 2009. godine je za 55% veća u odnosu na prethodnu godinu. Bez obzira na porast izvoza opasnog otpada u 2009. godini u odnosu na 2008. godinu, prekogranični promet opasnim otpadom u periodu 2001-2009. je u blagom padu.
The amount of hazardous waste in 2009 is 55% higher than the previous year. Notwithstanding the increase in exports of hazardous waste in 2009 compared to 2008, the transboundary movement of hazardous waste in the period 2001-2009 went down slightly.
Tabela 10. Izvoz opasnog otpada, 2001-2009, tona Table 10. Export of hazardous waste, 2001-2009, tones
Izvor: Sekretarijat Bazelske konvencije http://www.basel.int/ Source: Secretariat of Basel Convention http://www.basel.int/
Grafikon 24. Izvoz opasnog otpada, 2001-2009, tona Graph 24. Export of hazardous waste, 2001-2009, tones
Izvor: Tabela 10. Source: Table 10.
2001. 2002. 2003. 2004. 2005. 2006. 2007. 2008. 2009.
Ukupna količina 1.830 6.295 7.094 6.560 6.660 4.447 4.981 3.145 4.870 Total amount
42
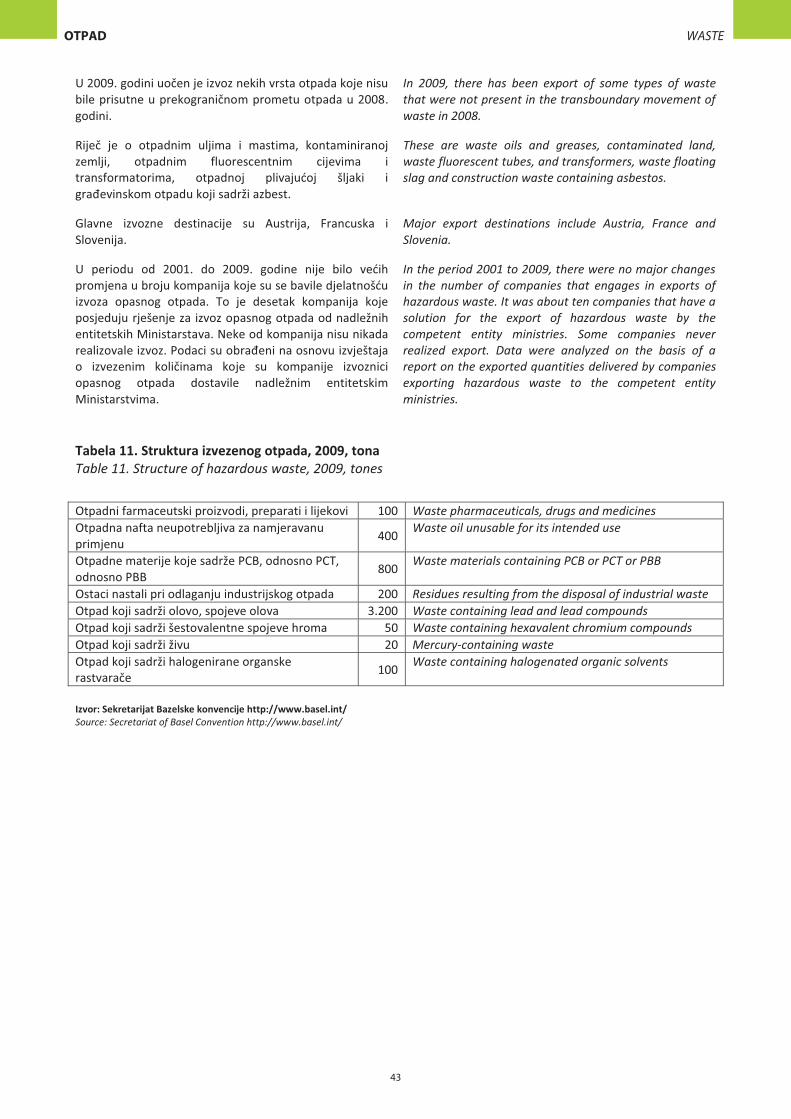
U 2009. godini uočen je izvoz nekih vrsta otpada koje nisu bile prisutne u prekograničnom prometu otpada u 2008. godini.
In 2009, there has been export of some types of waste that were not present in the transboundary movement of waste in 2008.
Riječ je o otpadnim uljima i mastima, kontaminiranoj zemlji, otpadnim fluorescentnim cijevima i transformatorima, otpadnoj plivajućoj šljaki i građevinskom otpadu koji sadrži azbest.
These are waste oils and greases, contaminated land, waste fluorescent tubes, and transformers, waste floating slag and construction waste containing asbestos.
Glavne izvozne destinacije su Austrija, Francuska i Slovenija.
Major export destinations include Austria, France and Slovenia.
U periodu od 2001. do 2009. godine nije bilo većih promjena u broju kompanija koje su se bavile djelatnošću izvoza opasnog otpada. To je desetak kompanija koje posjeduju rješenje za izvoz opasnog otpada od nadležnih entitetskih Ministarstava. Neke od kompanija nisu nikada realizovale izvoz. Podaci su obrađeni na osnovu izvještaja o izvezenim količinama koje su kompanije izvoznici opasnog otpada dostavile nadležnim entitetskim Ministarstvima.
In the period 2001 to 2009, there were no major changes in the number of companies that engages in exports of hazardous waste. It was about ten companies that have a solution for the export of hazardous waste by the competent entity ministries. Some companies never realized export. Data were analyzed on the basis of a report on the exported quantities delivered by companies exporting hazardous waste to the competent entity ministries.
Tabela 11. Struktura izvezenog otpada, 2009, tona Table 11. Structure of hazardous waste, 2009, tones
Otpadni farmaceutski proizvodi, preparati i lijekovi 100 Waste pharmaceuticals, drugs and medicines Otpadna nafta neupotrebljiva za namjeravanu primjenu 400 Waste oil unusable for its intended use
Otpadne materije koje sadrže PCB, odnosno PCT, odnosno PBB 800 Waste materials containing PCB or PCT or PBB
Ostaci nastali pri odlaganju industrijskog otpada 200 Residues resulting from the disposal of industrial waste Otpad koji sadrži olovo, spojeve olova 3.200 Waste containing lead and lead compounds Otpad koji sadrži šestovalentne spojeve hroma 50 Waste containing hexavalent chromium compounds Otpad koji sadrži živu 20 Mercury-containing waste Otpad koji sadrži halogenirane organske rastvarače 100 Waste containing halogenated organic solvents
Izvor: Sekretarijat Bazelske konvencije http://www.basel.int/ Source: Secretariat of Basel Convention http://www.basel.int/
43
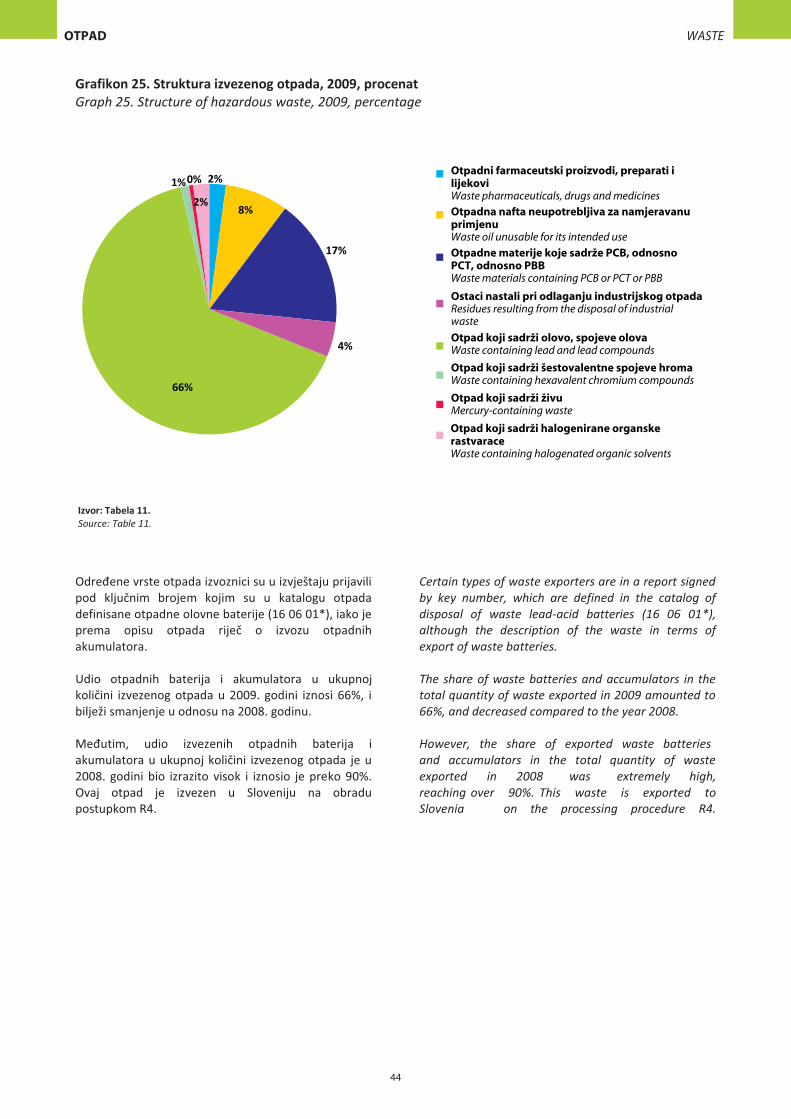
Grafikon 25. Struktura izvezenog otpada, 2009, procenat Graph 25. Structure of hazardous waste, 2009, percentage
Izvor: Tabela 11. Source: Table 11.
Određene vrste otpada izvoznici su u izvještaju prijavili pod ključnim brojem kojim su u katalogu otpada definisane otpadne olovne baterije (16 06 01*), iako je prema opisu otpada riječ o izvozu otpadnih akumulatora. Udio otpadnih baterija i akumulatora u ukupnoj količini izvezenog otpada u 2009. godini iznosi 66%, i bilježi smanjenje u odnosu na 2008. godinu. Međutim, udio izvezenih otpadnih baterija i akumulatora u ukupnoj količini izvezenog otpada je u 2008. godini bio izrazito visok i iznosio je preko 90%. Ovaj otpad je izvezen u Sloveniju na obradu postupkom R4.
Certain types of waste exporters are in a report signed by key number, which are defined in the catalog of disposal of waste lead-acid batteries (16 06 01*), although the description of the waste in terms of export of waste batteries. The share of waste batteries and accumulators in the total quantity of waste exported in 2009 amounted to 66%, and decreased compared to the year 2008. However, the share of exported waste batteries and accumulators in the total quantity of waste exported in 2008 was extremely high, reaching over 90%. This waste is exported to Slovenia on the processing procedure R4.
44
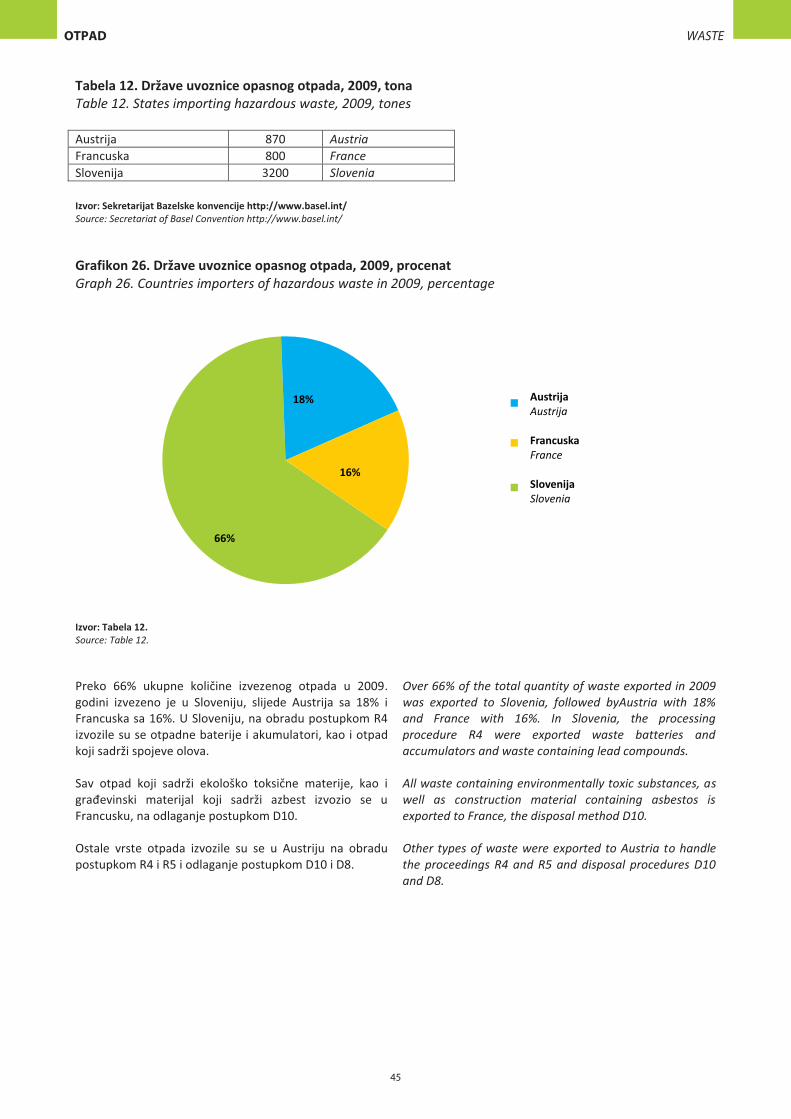
Tabela 12. Države uvoznice opasnog otpada, 2009, tona Table 12. States importing hazardous waste, 2009, tones Austrija 870 Austria Francuska 800 France Slovenija 3200 Slovenia Izvor: Sekretarijat Bazelske konvencije http://www.basel.int/ Source: Secretariat of Basel Convention http://www.basel.int/
Grafikon 26. Države uvoznice opasnog otpada, 2009, procenat Graph 26. Countries importers of hazardous waste in 2009, percentage
Izvor: Tabela 12. Source: Table 12.
Preko 66% ukupne količine izvezenog otpada u 2009. godini izvezeno je u Sloveniju, slijede Austrija sa 18% i Francuska sa 16%. U Sloveniju, na obradu postupkom R4 izvozile su se otpadne baterije i akumulatori, kao i otpad koji sadrži spojeve olova.
Over 66% of the total quantity of waste exported in 2009 was exported to Slovenia, followed byAustria with 18% and France with 16%. In Slovenia, the processing procedure R4 were exported waste batteries and accumulators and waste containing lead compounds.
Sav otpad koji sadrži ekološko toksične materije, kao i građevinski materijal koji sadrži azbest izvozio se u Francusku, na odlaganje postupkom D10.
All waste containing environmentally toxic substances, as well as construction material containing asbestos is exported to France, the disposal method D10.
Ostale vrste otpada izvozile su se u Austriju na obradu postupkom R4 i R5 i odlaganje postupkom D10 i D8.
Other types of waste were exported to Austria to handle the proceedings R4 and R5 and disposal procedures D10 and D8.
45


Metodološka objašnjenja i definicije Methodological notes and definitions
Podaci se prikupljaju na osnovu godišnjih istraživanja u statistici voda koja se provode u Federalnom zavodu za statistiku BiH (FZS), Republičkom zavodu za statistiku Republike Srpske (RZS RS), Agenciji za statistiku BiH i Brčko distriktu BiH (podružnici BHAS-a). Na osnovu prikupljenih podataka, BHAS publikuje saopštenje na nivou Bosne i Hercegovine.
Data for compilation of energy balances are provided from annual water statistical surveys that are conducted by Federal Office for Statistics of Federation of BiH (FOS), Republika Srpska Institute of Statistics (RSIS), Agency for Statistics of Bosnia and Herzegovina (BHAS) and Brčko District. BHAS publishes energy balances for Bosnia and Herzegovina based on data collected.
Podaci o javnom vodovodu prikupljaju se redovnim godišnjim statističkim istraživanjem (VOD-2V) od komunalnih poslovnih subjekata i od općinskih službi koje upravljaju javnim vodovodom u posmatranim naseljima.
Data on public water supply are collected through regular annual reports (VOD-2V) from municipal business entities and municipal services which run the public water supply.
Pod snabdijevanjem vodom u javnom vodovodu smatra se ukupno zahvaćena količina vode iz podzemnih voda, izvora, vodotoka, akumulacija i jezera, te ukupno zahvaćena količina vode iz drugih vodovodnih sistema.
Water supply from public water mains is the total volume of water abstracted from ground waters, springs, watercourses, reservoirs and lakes as well as total volume of water abstracted from other water systems.
Pod zahvaćenim količinama voda podrazumijevaju se ukupne količine zahvaćene vode iz izvorišta voda.
Abstracted volume of water is the total volume of water abstracted from water springs.
Pod javnim izvorištima podrazumijevaju se sva kaptirana izvorišta odakle se vrši snabdijevanje vodovoda vodom, kao što su podzemni tok, izvor, vodotok, akumulacija i jezero.
Public springs are all sources that are used in supplying of water mains, such as ground watercourses, springs, watercourses, reservoirs and lakes.
Pod isporučenom količinom vode podrazumijeva se količina vode prodate potrošačima.
Distributed volume of water is the volume of water sold to consumers.
Pod ukupnim gubicima vode podrazumijevaju se stvarno ustanovljeni gubici u vodovodnoj mreži nastali zbog kvara ili neispravnosti instalacija na mreži.
Total water losses are actually found losses in water mains caused by mechanical troubles or installation defects on water mains.
Pod uređajima za pročišćavanje vode za piće podrazumijevaju se uređaji za pročišćavanje (kondicioniranje). Pod rezervoarima se podrazumijevaju ukopni i nadzemni rezervoari (u obliku tornja – kule) koji služe za akumuliranje vode i osiguranje potrebnog pritiska.
Water treatment plants are facilities used for purification (conditioning). Tanks are divided into underground and elevated (tower-shaped) ones, used for the accumulation of water and reaching the required pressure.
Dužina glavnog dovoda je dužina cijevi za dovod vode i osiguranje potrebnog pritiska.
Lenght of water mains is the length of pipes used for the supply of water and reaching of the required pressure.
Dužina razvodne mreže je dužina vodovodne mreže od rezervoara do potrošača (bez dužine priključka i mreže u zgradi).
The length of distribution network is the length of the water supply network from a tank to a consumer (excluded are the length of connections and network in a building).
Kanalizacijski priključak je spoj objekata s uličnom kanalizacijom.
Connecting pipe is a connection between the object and street drains.
49
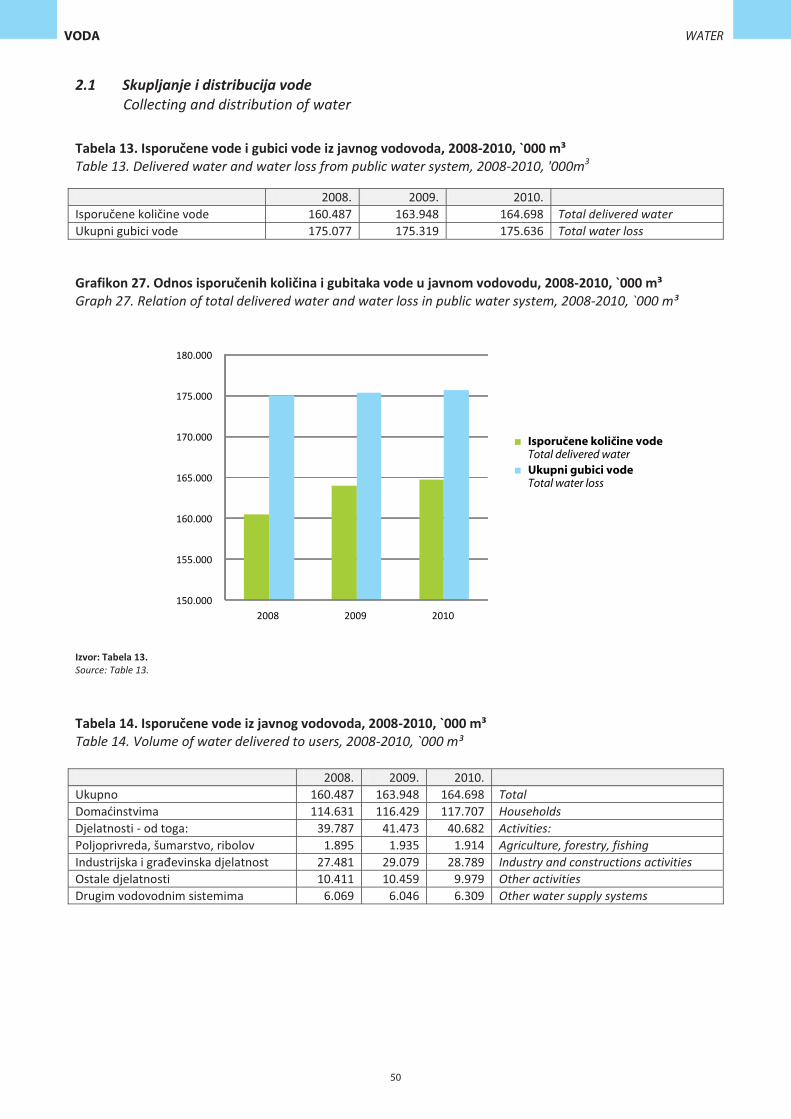
2.1 Skupljanje i distribucija vode Collecting and distribution of water
Tabela 13. Isporučene vode i gubici vode iz javnog vodovoda, 2008-2010, `000 m³ Table 13. Delivered water and water loss from public water system, 2008-2010, '000m3
2008. 2009. 2010. Isporučene količine vode 160.487 163.948 164.698 Total delivered water Ukupni gubici vode 175.077 175.319 175.636 Total water loss
Grafikon 27. Odnos isporučenih količina i gubitaka vode u javnom vodovodu, 2008-2010, `000 m³ Graph 27. Relation of total delivered water and water loss in public water system, 2008-2010, `000 m³
Izvor: Tabela 13. Source: Table 13.
Tabela 14. Isporučene vode iz javnog vodovoda, 2008-2010, `000 m³ Table 14. Volume of water delivered to users, 2008-2010, `000 m³
2008. 2009. 2010. Ukupno 160.487 163.948 164.698 Total Domaćinstvima 114.631 116.429 117.707 Households Djelatnosti - od toga: 39.787 41.473 40.682 Activities: Poljoprivreda, šumarstvo, ribolov 1.895 1.935 1.914 Agriculture, forestry, fishing Industrijska i građevinska djelatnost 27.481 29.079 28.789 Industry and constructions activities Ostale djelatnosti 10.411 10.459 9.979 Other activities Drugim vodovodnim sistemima 6.069 6.046 6.309 Other water supply systems
50
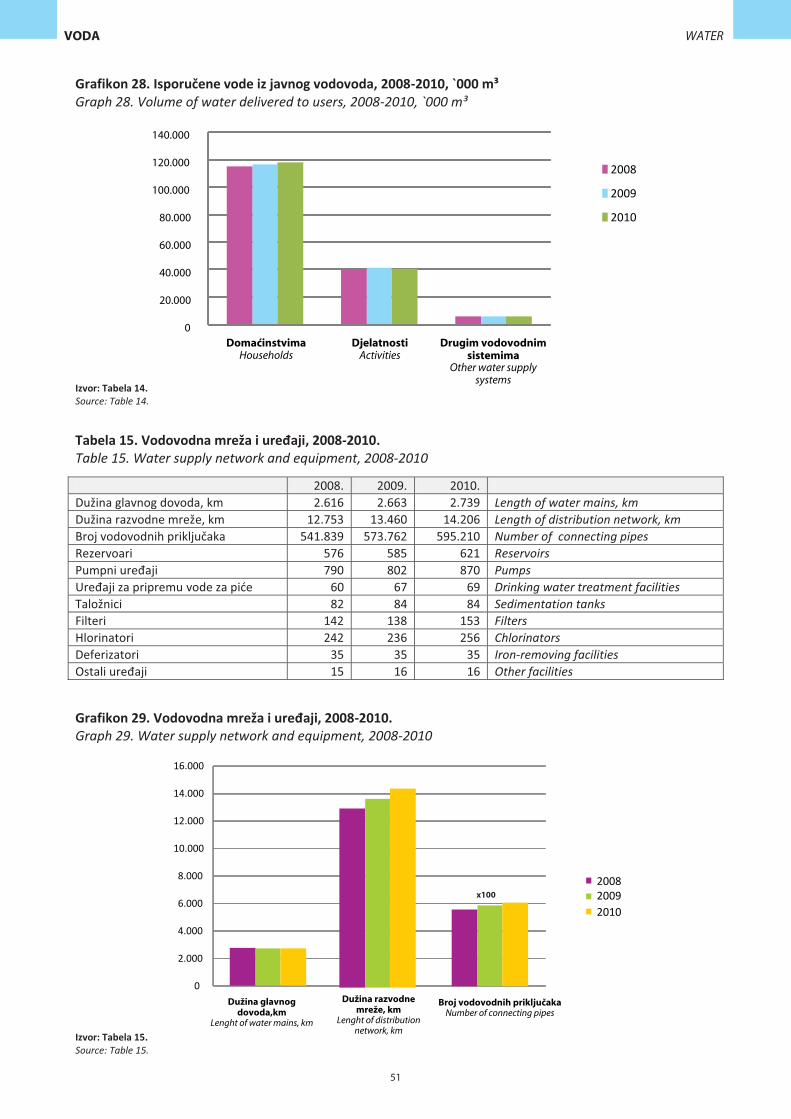
Grafikon 28. Isporučene vode iz javnog vodovoda, 2008-2010, `000 m³ Graph 28. Volume of water delivered to users, 2008-2010, `000 m³
Izvor: Tabela 14. Source: Table 14.
Tabela 15. Vodovodna mreža i uređaji, 2008-2010. Table 15. Water supply network and equipment, 2008-2010
2008. 2009. 2010. Dužina glavnog dovoda, km 2.616 2.663 2.739 Length of water mains, km Dužina razvodne mreže, km 12.753 13.460 14.206 Length of distribution network, km Broj vodovodnih priključaka 541.839 573.762 595.210 Number of connecting pipes Rezervoari 576 585 621 Reservoirs Pumpni uređaji 790 802 870 Pumps Uređaji za pripremu vode za piće 60 67 69 Drinking water treatment facilities Taložnici 82 84 84 Sedimentation tanks Filteri 142 138 153 Filters Hlorinatori 242 236 256 Chlorinators Deferizatori 35 35 35 Iron-removing facilities Ostali uređaji 15 16 16 Other facilities
Grafikon 29. Vodovodna mreža i uređaji, 2008-2010. Graph 29. Water supply network and equipment, 2008-2010
Izvor: Tabela 15. Source: Table 15.
51
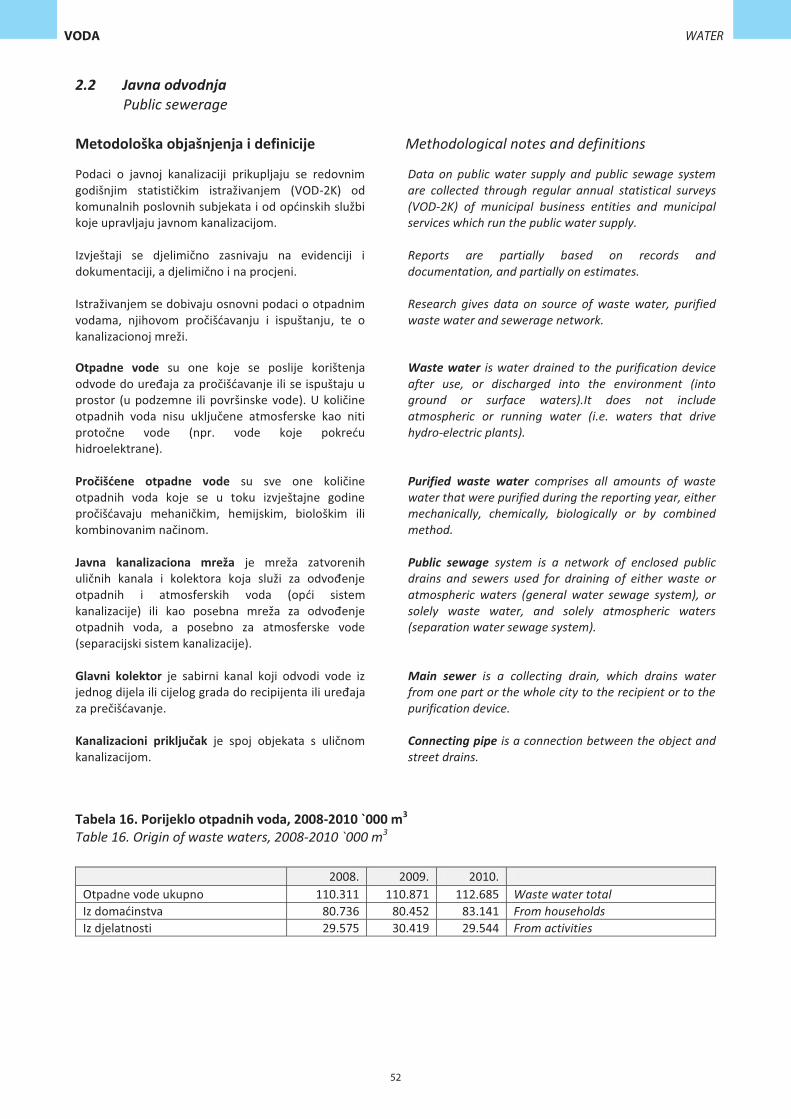
2.2 Javna odvodnja Public sewerage
Metodološka objašnjenja i definicije Methodological notes and definitions
Otpadne vode su one koje se poslije korištenja odvode do uređaja za pročišćavanje ili se ispuštaju u prostor (u podzemne ili površinske vode). U količine otpadnih voda nisu uključene atmosferske kao niti protočne vode (npr. vode koje pokreću hidroelektrane).
Waste water is water drained to the purification device after use, or discharged into the environment (into ground or surface waters).It does not include atmospheric or running water (i.e. waters that drive hydro-electric plants).
Pročišćene otpadne vode su sve one količine otpadnih voda koje se u toku izvještajne godine pročišćavaju mehaničkim, hemijskim, biološkim ili kombinovanim načinom.
Purified waste water comprises all amounts of waste water that were purified during the reporting year, either mechanically, chemically, biologically or by combined method.
Javna kanalizaciona mreža je mreža zatvorenih uličnih kanala i kolektora koja služi za odvođenje otpadnih i atmosferskih voda (opći sistem kanalizacije) ili kao posebna mreža za odvođenje otpadnih voda, a posebno za atmosferske vode (separacijski sistem kanalizacije).
Public sewage system is a network of enclosed public drains and sewers used for draining of either waste or atmospheric waters (general water sewage system), or solely waste water, and solely atmospheric waters (separation water sewage system).
Glavni kolektor je sabirni kanal koji odvodi vode iz jednog dijela ili cijelog grada do recipijenta ili uređaja za prečišćavanje.
Main sewer is a collecting drain, which drains water from one part or the whole city to the recipient or to the purification device.
Kanalizacioni priključak je spoj objekata s uličnom kanalizacijom.
Connecting pipe is a connection between the object and street drains.
Tabela 16. Porijeklo otpadnih voda, 2008-2010 `000 m3 Table 16. Origin of waste waters, 2008-2010 `000 m3
2008. 2009. 2010. Otpadne vode ukupno 110.311 110.871 112.685 Waste water total Iz domaćinstva 80.736 80.452 83.141 From households Iz djelatnosti 29.575 30.419 29.544 From activities
Podaci o javnoj kanalizaciji prikupljaju se redovnim godišnjim statističkim istraživanjem (VOD-2K) od komunalnih poslovnih subjekata i od općinskih službi koje upravljaju javnom kanalizacijom.
Data on public water supply and public sewage system are collected through regular annual statistical surveys (VOD-2K) of municipal business entities and municipal services which run the public water supply.
Izvještaji se djelimično zasnivaju na evidenciji i dokumentaciji, a djelimično i na procjeni.
Reports are partially based on records and documentation, and partially on estimates.
Istraživanjem se dobivaju osnovni podaci o otpadnim vodama, njihovom pročišćavanju i ispuštanju, te o kanalizacionoj mreži.
Research gives data on source of waste water, purified waste water and sewerage network.
52
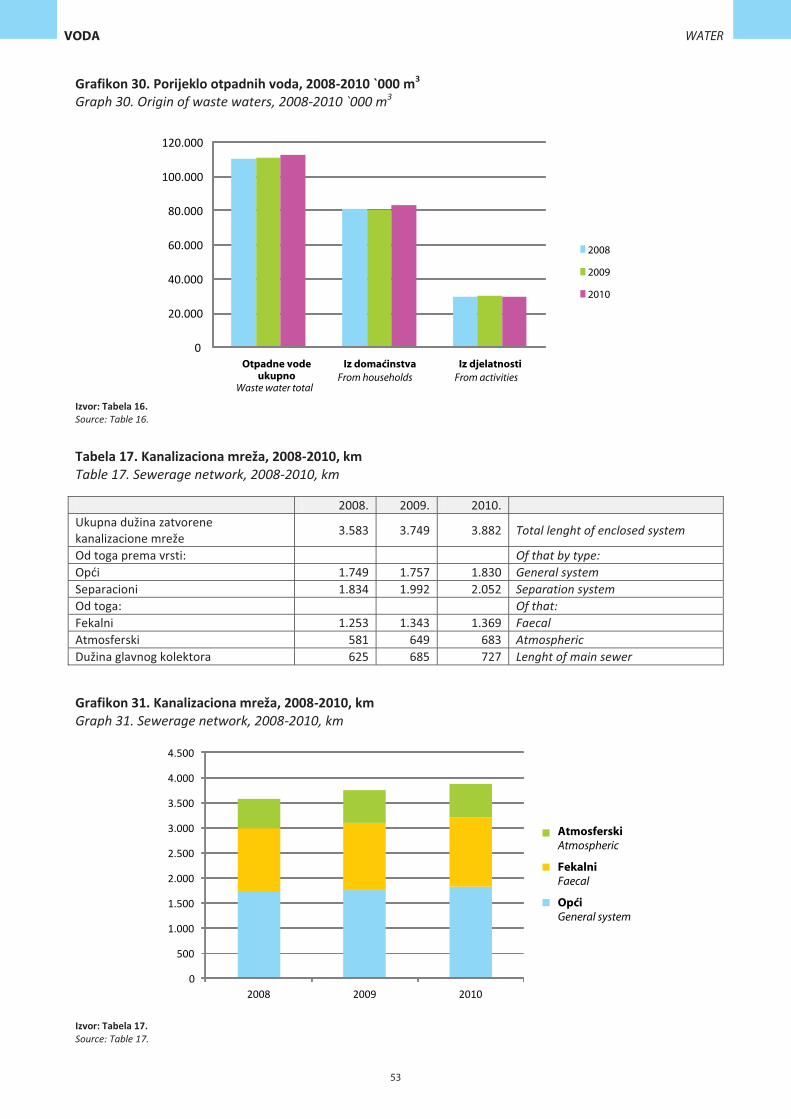
Grafikon 30. Porijeklo otpadnih voda, 2008-2010 `000 m3 Graph 30. Origin of waste waters, 2008-2010 `000 m3
Izvor: Tabela 16. Source: Table 16.
Tabela 17. Kanalizaciona mreža, 2008-2010, km Table 17. Sewerage network, 2008-2010, km
2008. 2009. 2010. Ukupna dužina zatvorene kanalizacione mreže 3.583 3.749 3.882 Total lenght of enclosed system
Od toga prema vrsti: Of that by type: Opći 1.749 1.757 1.830 General system Separacioni 1.834 1.992 2.052 Separation system Od toga: Of that: Fekalni 1.253 1.343 1.369 Faecal Atmosferski 581 649 683 Atmospheric Dužina glavnog kolektora 625 685 727 Lenght of main sewer
Grafikon 31. Kanalizaciona mreža, 2008-2010, km Graph 31. Sewerage network, 2008-2010, km
Izvor: Tabela 17. Source: Table 17.
53
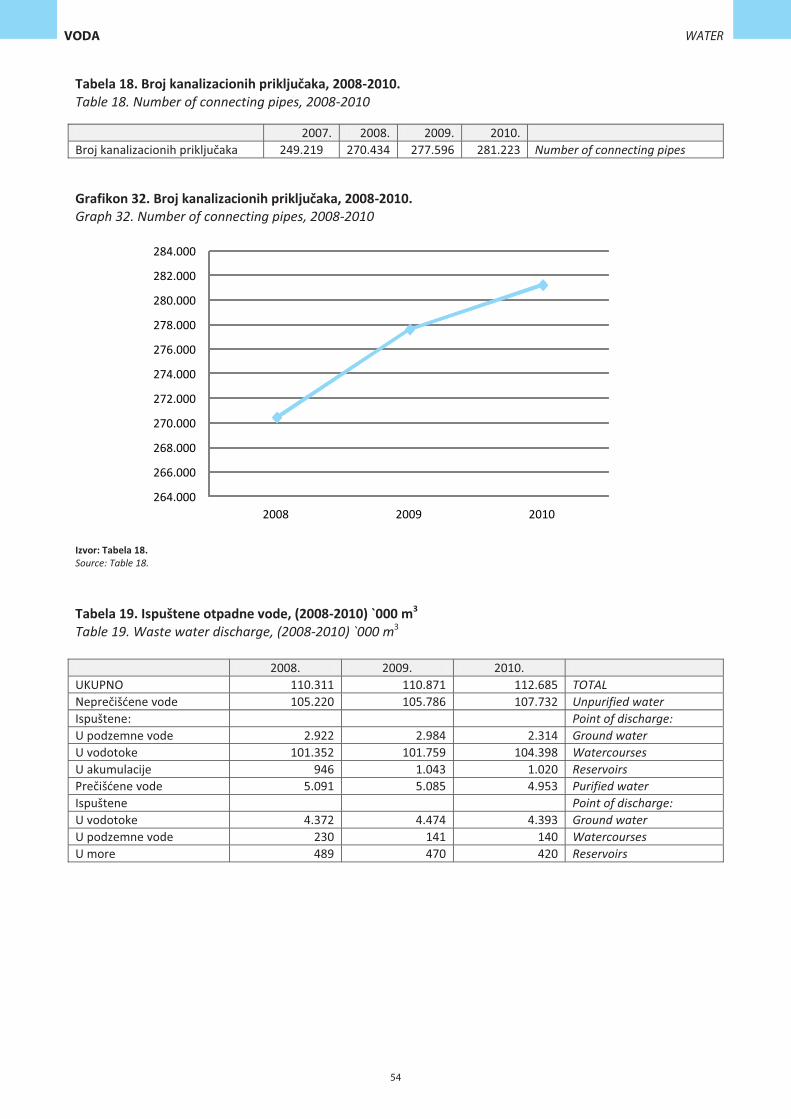
Tabela 18. Broj kanalizacionih priključaka, 2008-2010. Table 18. Number of connecting pipes, 2008-2010
2007. 2008. 2009. 2010. Broj kanalizacionih priključaka 249.219 270.434 277.596 281.223 Number of connecting pipes
Grafikon 32. Broj kanalizacionih priključaka, 2008-2010. Graph 32. Number of connecting pipes, 2008-2010
Izvor: Tabela 18. Source: Table 18.
Tabela 19. Ispuštene otpadne vode, (2008-2010) `000 m3 Table 19. Waste water discharge, (2008-2010) `000 m3
2008. 2009. 2010. UKUPNO 110.311 110.871 112.685 TOTAL Neprečišćene vode 105.220 105.786 107.732 Unpurified water Ispuštene: Point of discharge: U podzemne vode 2.922 2.984 2.314 Ground water U vodotoke 101.352 101.759 104.398 Watercourses U akumulacije 946 1.043 1.020 Reservoirs Prečišćene vode 5.091 5.085 4.953 Purified water Ispuštene Point of discharge: U vodotoke 4.372 4.474 4.393 Ground water U podzemne vode 230 141 140 Watercourses U more 489 470 420 Reservoirs
54
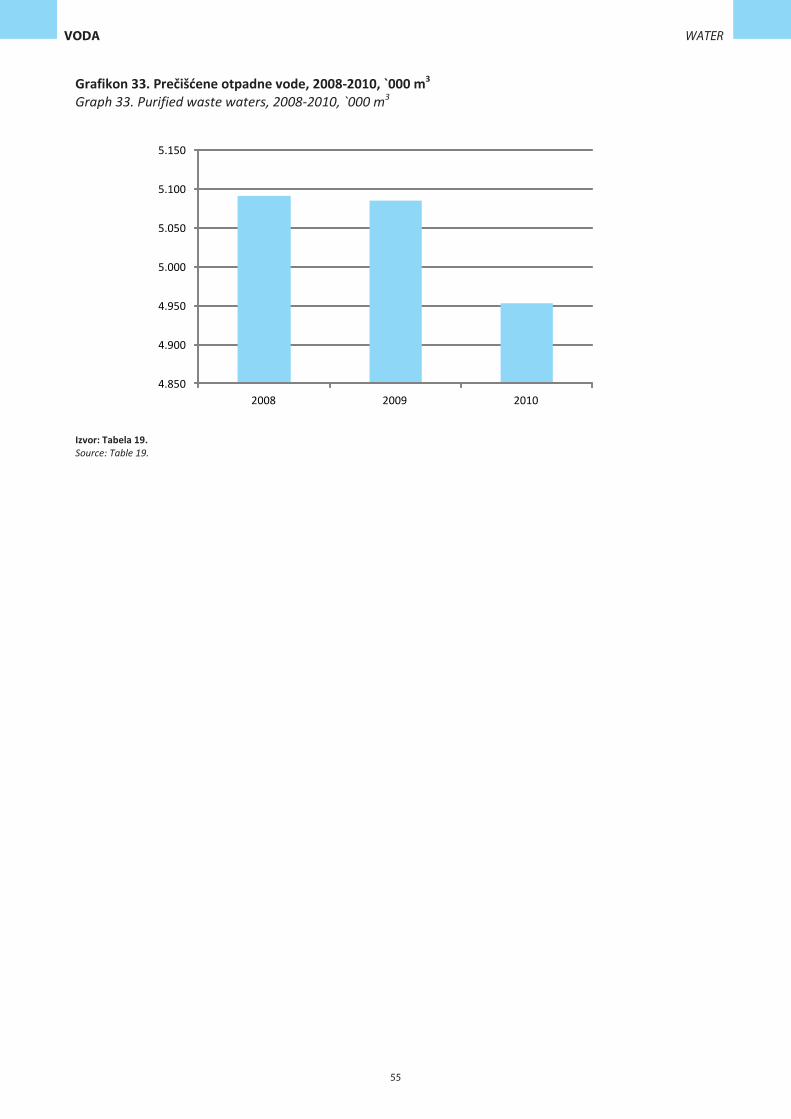
Grafikon 33. Prečišćene otpadne vode, 2008-2010, `000 m3 Graph 33. Purified waste waters, 2008-2010, `000 m3
Izvor: Tabela 19. Source: Table 19.
55
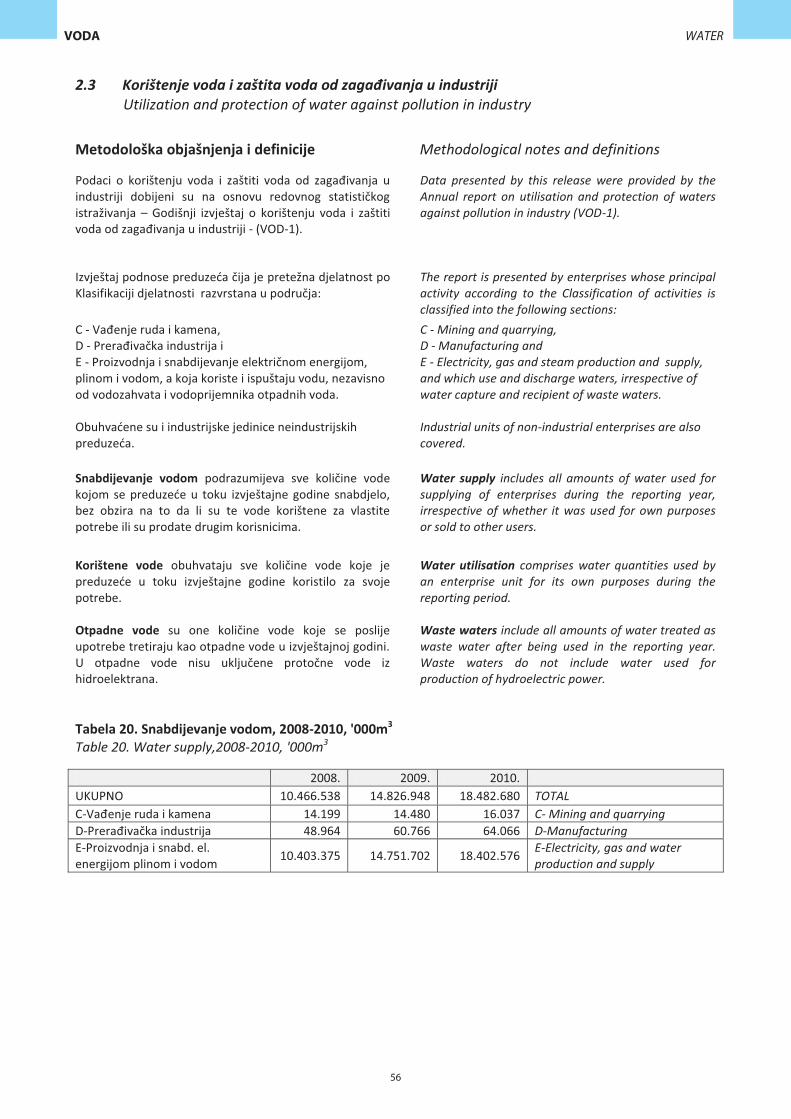
2.3 Korištenje voda i zaštita voda od zagađivanja u industriji Utilization and protection of water against pollution in industry
Metodološka objašnjenja i definicije Methodological notes and definitions
Podaci o korištenju voda i zaštiti voda od zagađivanja u industriji dobijeni su na osnovu redovnog statističkog istraživanja – Godišnji izvještaj o korištenju voda i zaštiti voda od zagađivanja u industriji - (VOD-1).
Data presented by this release were provided by the Annual report on utilisation and protection of waters against pollution in industry (VOD-1).
Izvještaj podnose preduzeća čija je pretežna djelatnost po Klasifikaciji djelatnosti razvrstana u područja:
The report is presented by enterprises whose principal activity according to the Classification of activities is classified into the following sections:
C - Vađenje ruda i kamena, D - Prerađivačka industrija i E - Proizvodnja i snabdijevanje električnom energijom, plinom i vodom, a koja koriste i ispuštaju vodu, nezavisno od vodozahvata i vodoprijemnika otpadnih voda.
C - Mining and quarrying, D - Manufacturing and E - Electricity, gas and steam production and supply, and which use and discharge waters, irrespective of water capture and recipient of waste waters.
Obuhvaćene su i industrijske jedinice neindustrijskih preduzeća.
Industrial units of non-industrial enterprises are also covered.
Snabdijevanje vodom podrazumijeva sve količine vode kojom se preduzeće u toku izvještajne godine snabdjelo, bez obzira na to da li su te vode korištene za vlastite potrebe ili su prodate drugim korisnicima.
Water supply includes all amounts of water used for supplying of enterprises during the reporting year, irrespective of whether it was used for own purposes or sold to other users.
Korištene vode obuhvataju sve količine vode koje je preduzeće u toku izvještajne godine koristilo za svoje potrebe.
Water utilisation comprises water quantities used by an enterprise unit for its own purposes during the reporting period.
Otpadne vode su one količine vode koje se poslije upotrebe tretiraju kao otpadne vode u izvještajnoj godini. U otpadne vode nisu uključene protočne vode iz hidroelektrana.
Waste waters include all amounts of water treated as waste water after being used in the reporting year. Waste waters do not include water used for production of hydroelectric power.
Tabela 20. Snabdijevanje vodom, 2008-2010, '000m3 Table 20. Water supply,2008-2010, '000m3
2008. 2009. 2010. UKUPNO 10.466.538 14.826.948 18.482.680 TOTAL C-Vađenje ruda i kamena 14.199 14.480 16.037 C- Mining and quarrying D-Prerađivačka industrija 48.964 60.766 64.066 D-Manufacturing E-Proizvodnja i snabd. el. energijom plinom i vodom 10.403.375 14.751.702 18.402.576 E-Electricity, gas and water
production and supply
56
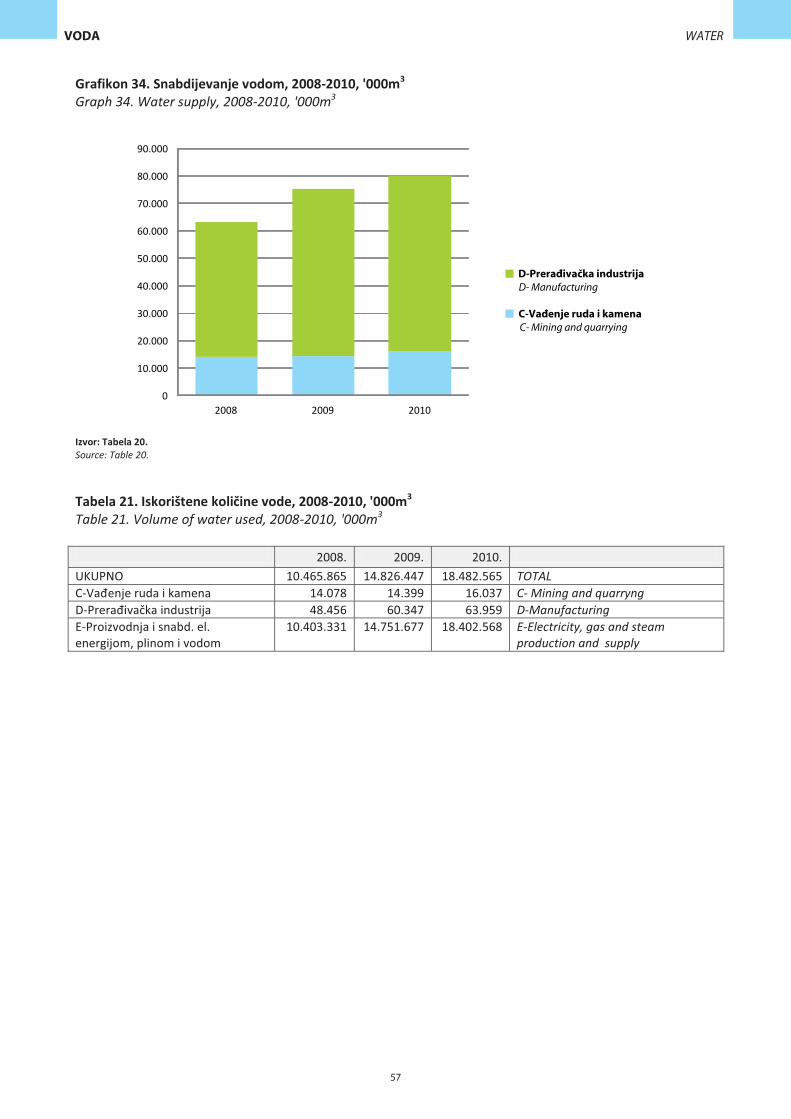
Grafikon 34. Snabdijevanje vodom, 2008-2010, '000m3 Graph 34. Water supply, 2008-2010, '000m3
Izvor: Tabela 20. Source: Table 20.
Tabela 21. Iskorištene količine vode, 2008-2010, '000m3 Table 21. Volume of water used, 2008-2010, '000m3
2008. 2009. 2010.
UKUPNO 10.465.865 14.826.447 18.482.565 TOTAL C-Vađenje ruda i kamena 14.078 14.399 16.037 C- Mining and quarryng D-Prerađivačka industrija 48.456 60.347 63.959 D-Manufacturing E-Proizvodnja i snabd. el. energijom, plinom i vodom
10.403.331 14.751.677 18.402.568 E-Electricity, gas and steam production and supply
57
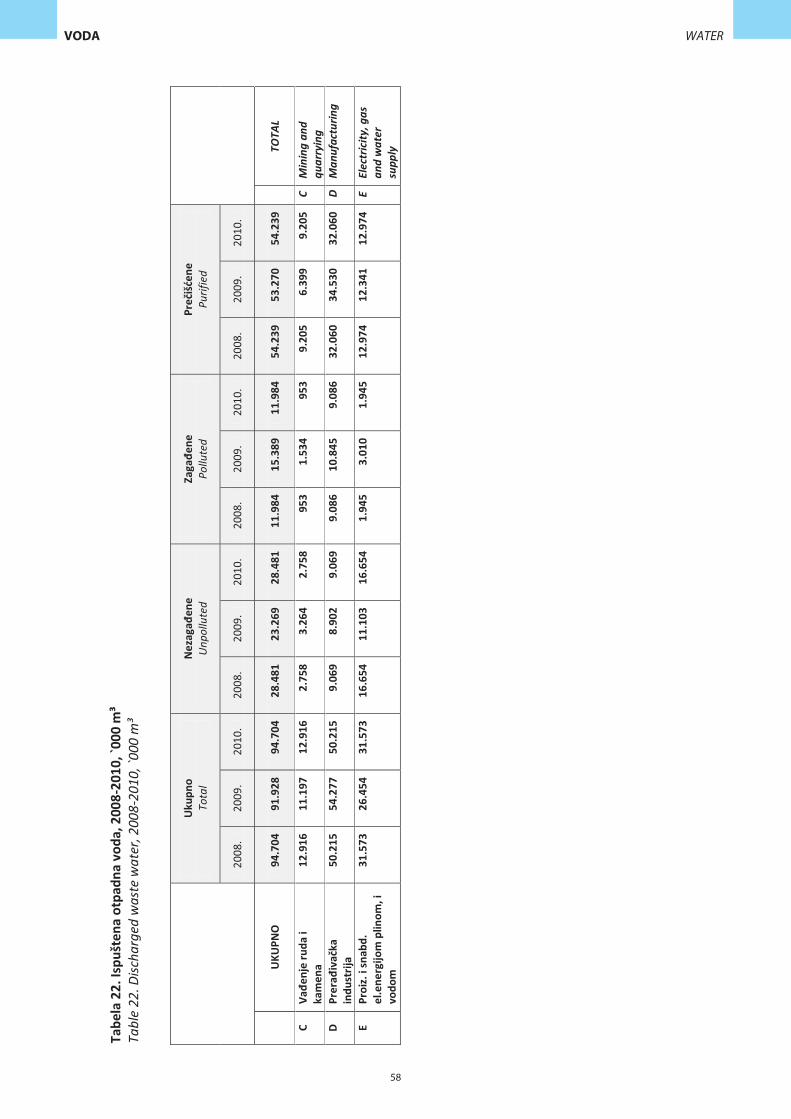
Tabe
la 2
2. Is
pušt
ena
otpa
dna
voda
, 200
8-20
10, `
000
m³
Ta
ble
22. D
ischa
rged
was
te w
ater
, 200
8-20
10, `
000
m³
Uku
pno
Tota
l N
ezag
ađen
e U
npol
lute
d Za
gađe
ne
Pollu
ted
Preč
išće
ne
Purif
ied
2008
. 20
09.
2010
. 20
08.
2009
. 20
10.
2008
. 20
09.
2010
. 20
08.
2009
. 20
10.
U
KUPN
O
94.7
04
91.9
28
94.7
04
28.4
81
23.2
69
28.4
81
11.9
84
15.3
89
11.9
84
54.2
39
53.2
70
54.2
39
TO
TAL
C Va
đenj
e ru
da i
kam
ena
12.9
16
11.1
97
12.9
16
2.75
8 3.
264
2.75
8 95
3 1.
534
953
9.20
5 6.
399
9.20
5 C
Min
ing
and
quar
ryin
g D
Prer
ađiv
ačka
in
dust
rija
50.2
15
54.2
77
50.2
15
9.06
9 8.
902
9.06
9 9.
086
10.8
45
9.08
6 32
.060
34
.530
32
.060
D
Man
ufac
turin
g
E Pr
oiz.
i sn
abd.
el
.ene
rgijo
m p
linom
, i
vodo
m
31.5
73
26.4
54
31.5
73
16.6
54
11.1
03
16.6
54
1.94
5 3.
010
1.94
5 12
.974
12
.341
12
.974
E
Elec
tric
ity, g
as
and
wat
er
supp
ly
58

3.1 Supstance koje oštećuju ozonski omotač Ozone depleting substances
Kao potpisnica Bečke konvencije o zaštiti ozonskog omotača i pratećeg Montrealskog protokola o materijama koje oštećuju ozonski omotač, BiH je odgovorna za poduzimanje neophodnih mjera za zaštitu ozonskog omotača i ostvarivanje dinamike postepenog isključivanja supstanci koje oštećuju ozonski omotač (SOOO).
As a party to the Vienna Convention for the Protection of the Ozone Layer and the accompanying Montreal Protocol on Substances that Deplete the Ozone Layer, BiH is responsible for taking the necessary measures to protect the ozone layer and achieve phase-out schedules for ozone depleting substances (ODSs).
BiH ispunjava svoje obaveze izvještavanja prema Konvenciji: u skladu sa članom 7, od 2001. godine podnose se redovni godišnji izvještaji o potrošnji supstanci koje oštećuju ozonski omotač Sekretarijatu za ozon UN-ovog Programa za okoliš (UNEP). Izvještaji o provedbenoj strategiji su također podneseni Organizaciji za industrijski razvoj Ujedinjenih naroda (UNIDO), te Vijeću ministara BiH o Provedbi programa za zemlju i Multilateralnom fondu (MLF) o Programu za zemlju.
BiH is fulfilling its reporting obligations under the Convention: pursuant to article 7, since 2001 regular annual reports on consumption of ozone depleting substances have been submitted to the United Nations Environment Programme (UNEP) Ozone Secretariat. Reports on implementation strategy have also been submitted to the United Nations Industrial Development Organization (UNIDO), to the BiH Council of Ministers on Country Programme (CP) implementation, and to the Multilateral Fund (MLF) on the Country Programme.
Kao što je i vidljivo iz ilustracije BiH je od 2006. postigla značajan napredak u postepenom isključivanju potrošnje hlorofluorougljika (CFC), trihloretana (TCA), metilbromida i halona. Zemlja je dramatično poboljšala svoje poštivanje odredbi Konvencije i od 2009. godine u potpunosti poštuje sve svoje obaveze u vezi sa svim reguliranim supstancama.
As it is visible from the graph BiH has made significant progress since 2006 in phasing-out the consumption of chlorofluorocarbons (CFCs), trichloroethane (TCA), methyl bromide and halons. The country has dramatically improved its compliance under the Convention and since 2009 fully complies with all its obligations on all regulated substances.
Godišnje emisije stakleničkih plinova (GHG) se procijenjuju i izvještavaju prema revidiranim (1996) smjernicama Međuvladinog Panela o klimatskim promjenama (IPCC). Korištenjem koncepta potencijala globalnog zagrijavanja (GWP), svih šest stakleničkih plinova se može sažeti u jednu godišnju vrijednost.
Annual greenhouse gas (GHG) emissions are estimated and reported according to the revised 1996 Intergovernmental Panel on Climate Change (IPCC) guidelines. By using the global warming potential (GWP) concept, all six GHGs can be summed up to a single value per year.
Indikator pokazuje trendove u emisija u “Kyoto koš“: ugljični dioksid (CO2), metan (CH4), azotni oksid (N2O), hidrofluorougljici (HFC), perfluorougljici (PFC) i sumporov heksafluorid (SF6). Brojevi su izraženi u CO2 ekvivalentu na osnovu tonaže.
The indicator shows trends in emissions of the ‘Kyoto basket’: carbon dioxide (CO2), methane (CH4), nitrous oxide (N2O), hydro fluorocarbons (HFCs), per fluorocarbons (PFCs), and sulphur hexafluoride (SF6). Figures are given in CO2 equivalents based on tonnage.
Izračunate GHG u sektoru poljoprivrede su rezultat uspješne saradnje Agencije za statistiku Bosne i Hercegovine i eksperata statistike Švedske, koji su pružili stručnu metodološku pomoć u izračunavanju emisija. Podaci za baznu 1990. godinu su preuzeti iz Prvog nacionalnog izvještaja BiH (INC BiH) u skladu sa Okvirnom Konvencijom Ujedinjenih nacija o klimatskim promjenama (UNFCC).
The calculated GHG emissions from agriculture sector (Table 1), the time series 2005-2009, are the result of successful cooperation between the Agency for Statistics of Bosnia and Herzegovina and experts of Statistics Sweden, who gave methodological assistance in calculating emissions. Data for base year 1990 were taken from the Initial National Communication of BiH (INC BiH) in accordance with the United Nations Framework Convention on Climate Changes (UNFCCC).
61
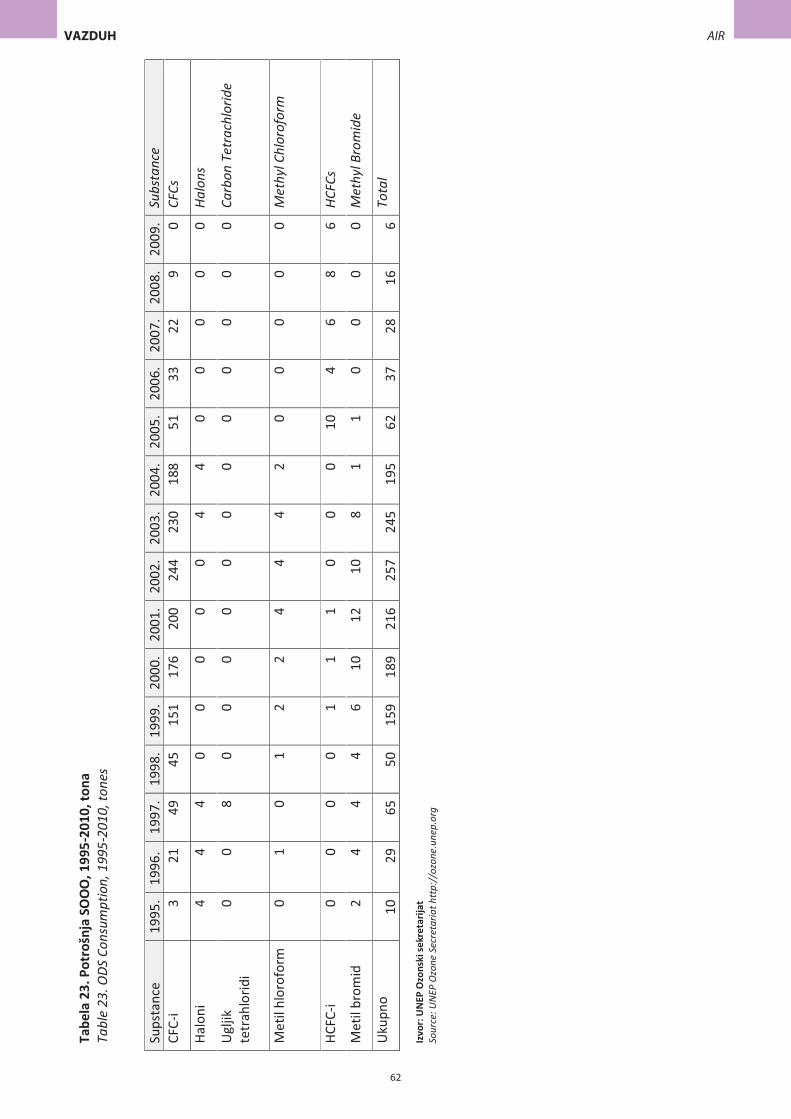
Tabe
la 2
3. P
otro
šnja
SO
OO
, 199
5-20
10, t
ona
Ta
ble
23. O
DS C
onsu
mpt
ion,
199
5-20
10, t
ones
Izvo
r: U
NEP
Ozo
nski
sekr
etar
ijat
Sour
ce: U
NEP
Ozo
ne S
ecre
taria
t htt
p://
ozon
e.un
ep.o
rg
Sups
tanc
e 19
95.
1996
. 19
97.
1998
. 19
99.
2000
. 20
01.
2002
. 20
03.
2004
. 20
05.
2006
. 20
07.
2008
. 20
09.
Subs
tanc
e CF
C-i
3 21
49
45
15
1 17
6 20
0 24
4 23
0 18
8 51
33
22
9
0 CF
Cs
Halo
ni
4 4
4 0
0 0
0 0
4 4
0 0
0 0
0 Ha
lons
Ugl
jik
tetr
ahlo
ridi
0 0
8 0
0 0
0 0
0 0
0 0
0 0
0 Ca
rbon
Tet
rach
lorid
e
Met
il hl
orof
orm
0
1 0
1 2
2 4
4 4
2 0
0 0
0 0
Met
hyl C
hlor
ofor
m
HCFC
-i 0
0 0
0 1
1 1
0 0
0 10
4
6 8
6 HC
FCs
Met
il br
omid
2
4 4
4 6
10
12
10
8 1
1 0
0 0
0 M
ethy
l Bro
mid
e
Uku
pno
10
29
65
50
159
189
216
257
245
195
62
37
28
16
6 To
tal
62
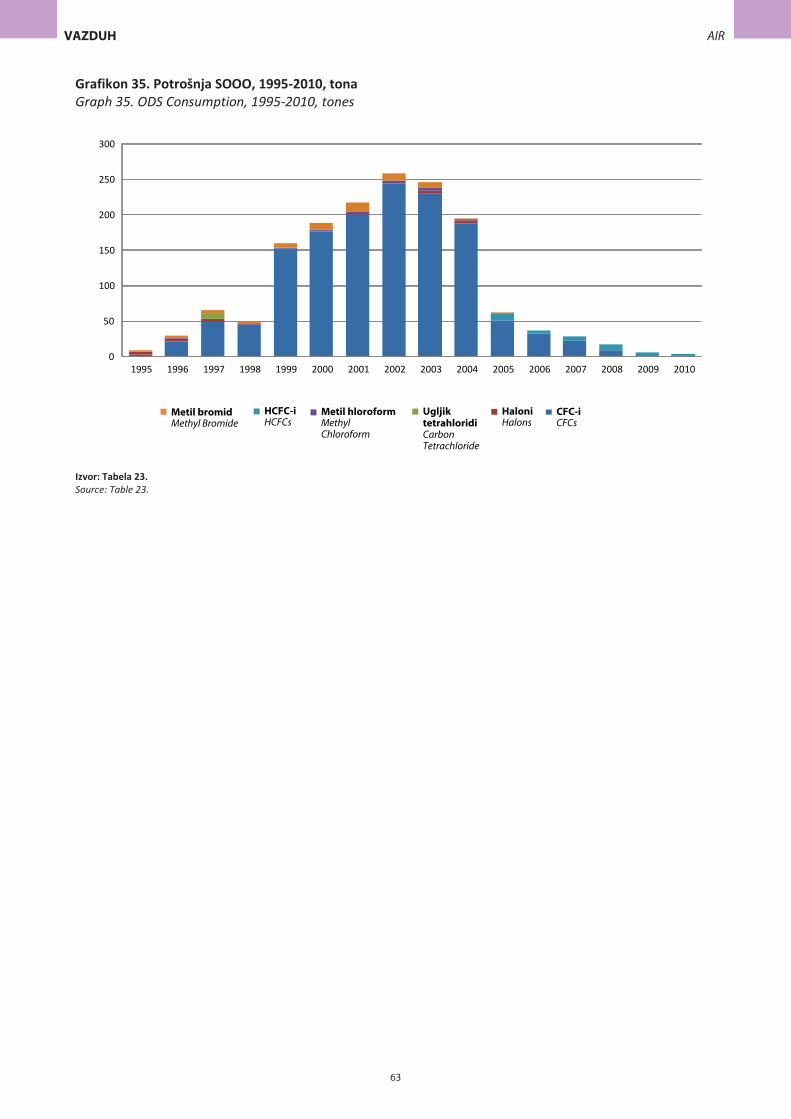
Grafikon 35. Potrošnja SOOO, 1995-2010, tona Graph 35. ODS Consumption, 1995-2010, tones
Izvor: Tabela 23. Source: Table 23.
63
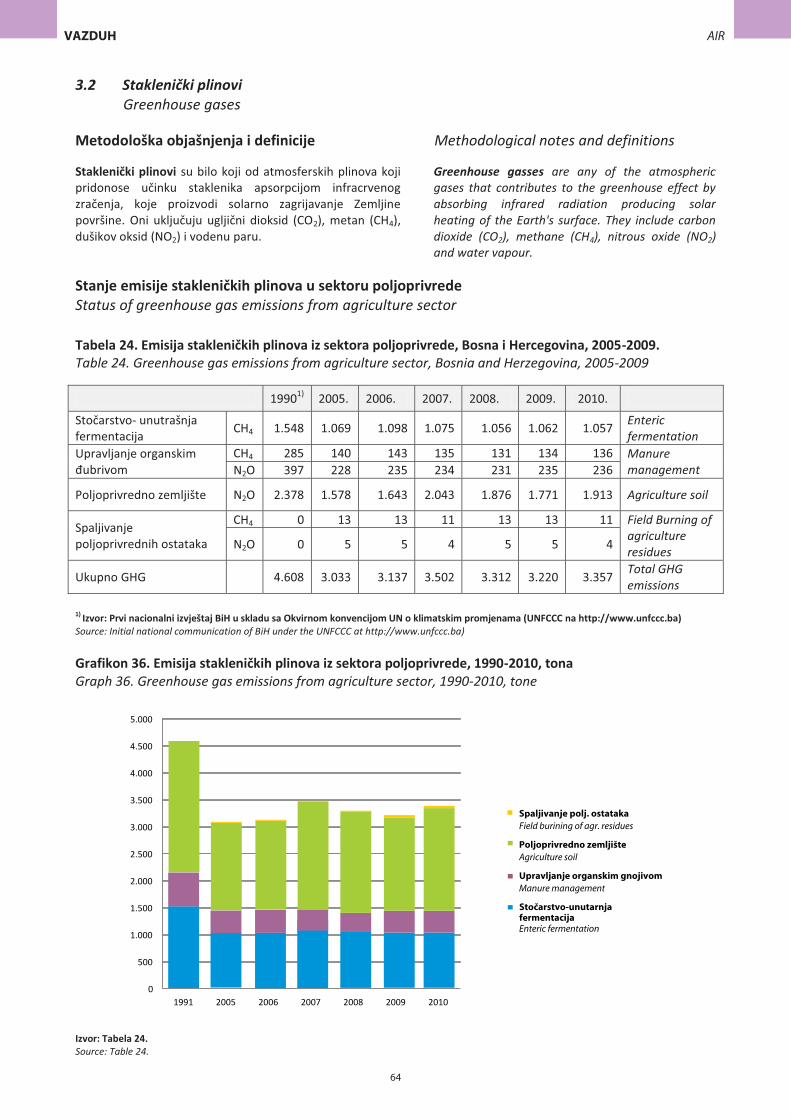
3.2 Staklenički plinovi Greenhouse gases
Metodološka objašnjenja i definicije Methodological notes and definitions
Staklenički plinovi su bilo koji od atmosferskih plinova koji pridonose učinku staklenika apsorpcijom infracrvenog zračenja, koje proizvodi solarno zagrijavanje Zemljine površine. Oni uključuju ugljični dioksid (CO2), metan (CH4), dušikov oksid (NO2) i vodenu paru.
Greenhouse gasses are any of the atmospheric gases that contributes to the greenhouse effect by absorbing infrared radiation producing solar heating of the Earth's surface. They include carbon dioxide (CO2), methane (CH4), nitrous oxide (NO2) and water vapour.
Stanje emisije stakleničkih plinova u sektoru poljoprivrede Status of greenhouse gas emissions from agriculture sector
Tabela 24. Emisija stakleničkih plinova iz sektora poljoprivrede, Bosna i Hercegovina, 2005-2009. Table 24. Greenhouse gas emissions from agriculture sector, Bosnia and Herzegovina, 2005-2009
19901) 2005. 2006. 2007. 2008. 2009. 2010.
Stočarstvo- unutrašnja fermentacija CH4 1.548 1.069 1.098 1.075 1.056 1.062 1.057 Enteric
fermentation Upravljanje organskim đubrivom
CH4 285 140 143 135 131 134 136 Manure management N2O 397 228 235 234 231 235 236
Poljoprivredno zemljište N2O 2.378 1.578 1.643 2.043 1.876 1.771 1.913 Agriculture soil
Spaljivanje poljoprivrednih ostataka
CH4 0 13 13 11 13 13 11 Field Burning of agriculture residues N2O 0 5 5 4 5 5 4
Ukupno GHG 4.608 3.033 3.137 3.502 3.312 3.220 3.357 Total GHG emissions
1) Izvor: Prvi nacionalni izvještaj BiH u skladu sa Okvirnom konvencijom UN o klimatskim promjenama (UNFCCC na http://www.unfccc.ba) Source: Initial national communication of BiH under the UNFCCC at http://www.unfccc.ba)
Grafikon 36. Emisija stakleničkih plinova iz sektora poljoprivrede, 1990-2010, tona Graph 36. Greenhouse gas emissions from agriculture sector, 1990-2010, tone
Izvor: Tabela 24. Source: Table 24.
64

Metodološka objašnjenja i definicije Methodological notes and definitions
Podaci se prikupljaju na osnovu godišnjih istraživanja u energetskoj statistici koja se provode u Federalnom zavodu za statistiku BiH (FZS), Republičkom zavodu za statistiku Republike Srpske (RZS RS), Agenciji za statistiku BiH (BHAS) i Brčko distriktu BiH (podružnici BHAS-a). Na osnovu prikupljenih podataka, BHAS publikuje saopštenje na nivou Bosne i Hercegovine.
Data for compilation of energy balances are provided from annual energy statistical surveys that are conducted by Federal Office for Statistics of Federation of BiH (FOS), Republika Srpska Institute of Statistics (RSIS), Agency for Statistics of Bosnia and Herzegovina (BHAS) and Brčko District. BHAS publishes energy balances for Bosnia and Herzegovina based on data collected.
Izvještajne jedinice za bilans električne energije su preduzeća koja se bave proizvodnjom, prijenosom i distribucijom električne energije, kao i industrijske energane.
Reporting units for electricity balance are enterprises whose activity is production, transmission and distribution of electricity, as well as autoproducers.
Izvještajne jedinice za bilans toplote su preduzeća koja se bave proizvodnjom i distribucijom toplote, kao i industrijske energane.
Reporting units for heat balance are enterprises whose activity is production and distribution of heat, as well as autoproducers.
Izvještajne jedinice za bilans prirodnog plina su preduzeća koja se bave uvozom i distribucijom prirodnog plina.
Reporting units for natural gas balance are enterprises whose activity is import and distribution of natural gas.
Izvještajne jedinice za bilans uglja i koksa su preduzeća koja se bave proizvodnjom i trgovinom ugljem/koksom.
Reporting units for coal/ coke-oven coke balance are enterprises whose activity is production and trade of coal/ coke-oven coke.
Posebnim obrascem se prikupljaju podaci o utrošku pojedinih energenata u industriji.
Data on energy and fuel consumption in industry are collected by special form.
Prikazani podaci za 2008. i 2009. godinu za bilans električne energije su podaci iz pilot istraživanja i biće naknadno podložni izmjenama.
Data for electricity balance for 2008 and 2009 are data from pilot-survey and will be subject to change.
Bruto proizvodnja električne energije predstavlja ukupno proizvedenu električnu energiju na generatoru.
Gross electricity production is the sum of the electrical energy production by all the generating sets concerned measured at the output terminals of the main generators.
Neto proizvodnja električne energije jednaka je bruto proizvodnji umanjenoj za vlastitu potrošnju elektrana. Uobičajen naziv za neto proizvodnju električne energije je proizvodnja električne energije na pragu elektrane.
Net electricity production is equal to the gross electricity production less the electrical energy absorbed by the generating auxiliaries and the losses in the main generator transformers.
Uvoz / Izvoz električne energije su količine električne energije koje su prešle državnu granicu.
Import / Export of electricity include quantities that crossed the national border.
Gubici električne energije obuhvataju sve gubitke prijenosa i distribucije električne energije, kao i ostale gubitke u mreži.
Losses of electricity include all transmission and distribution losses of electricity and other losses in the grid.
Finalna potrošnja električne i toplotne energije predstavlja finalnu potrošnju energije u industriji, građevinarstvu, saobraćaju, poljoprivredi, domaćinstvima i ostalim sektorima.
Final consumption of electricity and heat is final energy consumption in industry, construction, transport, agriculture, households and other sectors.
Industrijske energane (samoproizvođači) su preduzeća koja pored svoje osnovne djelatnosti proizvode električnu energiju i/ili toplotnu energiju za prodaju trećim stranama.
Autoproducer undertakings generate electricity and/or heat, wholly or partly for their own use as an activity which supports their primary activity.
67
Proizvodnja energije transformacijom predstavlja ukupnu toplotnu energiju proizvedenu transformacijom različitih vrsta energenata.
Transformation output is total heat production from different kind of fuels.
Uvoz prirodnog plina se odnosi na količine koje su prešle državnu granicu.
Import of natural gas includes quantities that crossed the national border.
Finalna potrošnja prirodnog plina predstavlja finalnu potrošnju u industriji, građevinarstvu, saobraćaju, poljoprivredi, domaćinstvima i ostalim sektorima.
Sm3 je standardni kubni metar pri temperaturi od 15 °C i pritisku od 760mmHg.
Final consumption of natural gas is final energy consumption in industry, construction, transport, agriculture, households and other sectors.
Sm 3 is standard cubic meter on temperature of 15 °C and under pressure of 760mmHg.
Proizvodnja ugljena i koksa obuhvata ukupnu proizvodnju uglja i koksa na teritoriji države.
Production of coal and coke-oven coke comprises the total of coal and coke-oven coke production in the country.
Uvoz / Izvoz su količine uglja i koksa koje su prešle državnu granicu.
Import / Export of coal and coke-oven coke include quantities that crossed the national border.
Saldo zaliha je razlika između zaliha u prvom danu u godini (početnih zaliha) i zaliha u zadnjem danu u godini (krajnjih zaliha).
Stock changes is a difference between stocks on the first day of the year (initial stocks) and stocks on the last day of the year (final stocks).
Finalna potrošnja ugljena i koksa predstavlja finalnu potrošnju uglja i koksa u industriji, građevinarstvu, saobraćaju, poljoprivredi, domaćinstvima i ostalim sektorima.
Final consumption of coal and coke-oven coke is final energy consumption in industry, construction, transport, agriculture, households and other sectors.
Električna energija je energija koju dobivamo sagorijevanjem fosilnih goriva, kao što su ugalj, nafta i prirodni plin. U drugu kategoriju dobivanja električne energije spadaju nuklearne elektrane i obnovljivi izvori (energija sunca, vjetra, valova, hidroenergija, biomasa, plimna i geotermalna energija).
Electricity is energy that is obtained by burning fossil fuels such as coal, oil and natural gas. The second category of obtaining electricity covers nuclear power plants and renewable sources (solar energy, wind, waves, hydroenergy, biomass, tide, geothermal energy).
Prirodni plin je mješavina više vrsta plinova, ali se uglavnom sastoji od metana. Nastaje prirodno u podzemnim nalazištima, bilo u plinovitom ili u tekućem agregatnom stanju.
Natural gas comprises gases, occurring in underground deposits, whether liquefied or gaseous, consisting mainly of methane.
Kameni ugalj Kameni ugalj se odnosi na ugalj čija je bruto kalorična vrijednost veća od 23.865 kJ/kg (5.700 kcal/kg) na vlažnoj osnovi, bez pepela i obuhvata:
Hard Coal: Hard Coal refers to coal of gross calorific value greater than 23 865 kJ/kg (5 700 kcal/kg) on an ashfree but moist basis. Hard coal comprises:
- Antracit Visokokvalitetan ugalj koji se uglavnom koristi u industrijske svrhe.
-Anthracite: High rank coal used for industrial applications.
- Koksni ugalj Bitumenski ugalj s kvalitetom koji dopušta proizvodnju koksa pogodnog za punjenje visoke peći.
- Coking Coal: Bituminous coal with a quality that allows the production of a coke suitable to support a blast furnace charge.
- Ostali bitumenski ugalj (parni ugalj) Ugalj koji se koristi za proizvodnju pare i obuhvata sve vrste bitumenskog uglja koje nisu navedene pod koksnim ugljom ili antracitom.
- Other Bituminous Coal (Steam Coal): Coal used for steam raising purposes and includes all bituminous coal that is not included under coking coal nor anthracite.
Lignit/mrki ugalj Neaglomeratni ugalj (ugalj koji se ne gruda), s bruto
Lignite/Brown Coal: Non-agglomerating coal with a gross calorific value
68
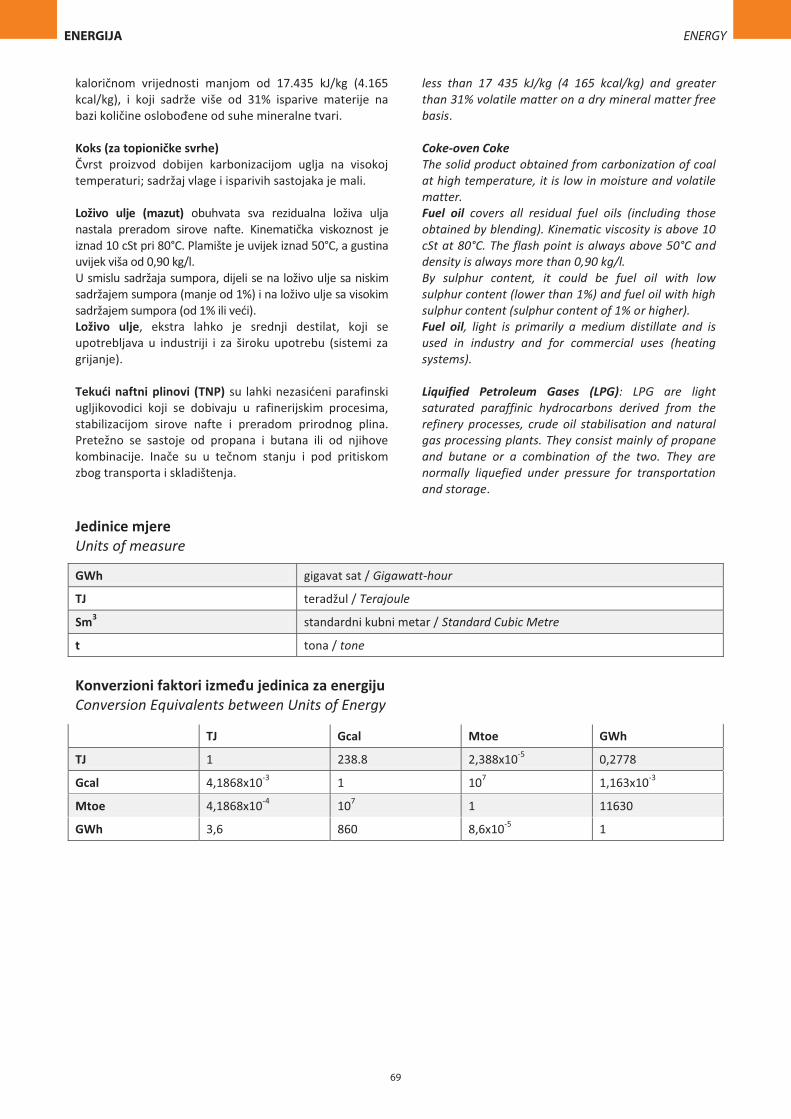
Jedinice mjere Units of measure
GWh gigavat sat / Gigawatt-hour
TJ teradžul / Terajoule
Sm3 standardni kubni metar / Standard Cubic Metre
t tona / tone
Konverzioni faktori između jedinica za energiju Conversion Equivalents between Units of Energy
TJ Gcal Mtoe GWh
TJ 1 238.8 2,388x10-5 0,2778
Gcal 4,1868x10⁻³ 1 107 1,163x10-3
Mtoe 4,1868x10⁻⁴ 107 1 11630
GWh 3,6 860 8,6x10⁻⁵ 1
kaloričnom vrijednosti manjom od 17.435 kJ/kg (4.165 kcal/kg), i koji sadrže više od 31% isparive materije na bazi količine oslobođene od suhe mineralne tvari.
less than 17 435 kJ/kg (4 165 kcal/kg) and greater than 31% volatile matter on a dry mineral matter free basis.
Koks (za topioničke svrhe) Čvrst proizvod dobijen karbonizacijom uglja na visokoj temperaturi; sadržaj vlage i isparivih sastojaka je mali.
Coke-oven Coke The solid product obtained from carbonization of coal at high temperature, it is low in moisture and volatile matter.
Loživo ulje (mazut) obuhvata sva rezidualna loživa ulja nastala preradom sirove nafte. Kinematička viskoznost je iznad 10 cSt pri 80°C. Plamište je uvijek iznad 50°C, a gustina uvijek viša od 0,90 kg/l.
Fuel oil covers all residual fuel oils (including those obtained by blending). Kinematic viscosity is above 10 cSt at 80°C. The flash point is always above 50°C and density is always more than 0,90 kg/l.
U smislu sadržaja sumpora, dijeli se na loživo ulje sa niskim sadržajem sumpora (manje od 1%) i na loživo ulje sa visokim sadržajem sumpora (od 1% ili veći).
By sulphur content, it could be fuel oil with low sulphur content (lower than 1%) and fuel oil with high sulphur content (sulphur content of 1% or higher).
Loživo ulje, ekstra lahko je srednji destilat, koji se upotrebljava u industriji i za široku upotrebu (sistemi za grijanje).
Fuel oil, light is primarily a medium distillate and is used in industry and for commercial uses (heating systems).
Tekući naftni plinovi (TNP) su lahki nezasićeni parafinski ugljikovodici koji se dobivaju u rafinerijskim procesima, stabilizacijom sirove nafte i preradom prirodnog plina. Pretežno se sastoje od propana i butana ili od njihove kombinacije. Inače su u tečnom stanju i pod pritiskom zbog transporta i skladištenja.
Liquified Petroleum Gases (LPG): LPG are light saturated paraffinic hydrocarbons derived from the refinery processes, crude oil stabilisation and natural gas processing plants. They consist mainly of propane and butane or a combination of the two. They are normally liquefied under pressure for transportation and storage.
69
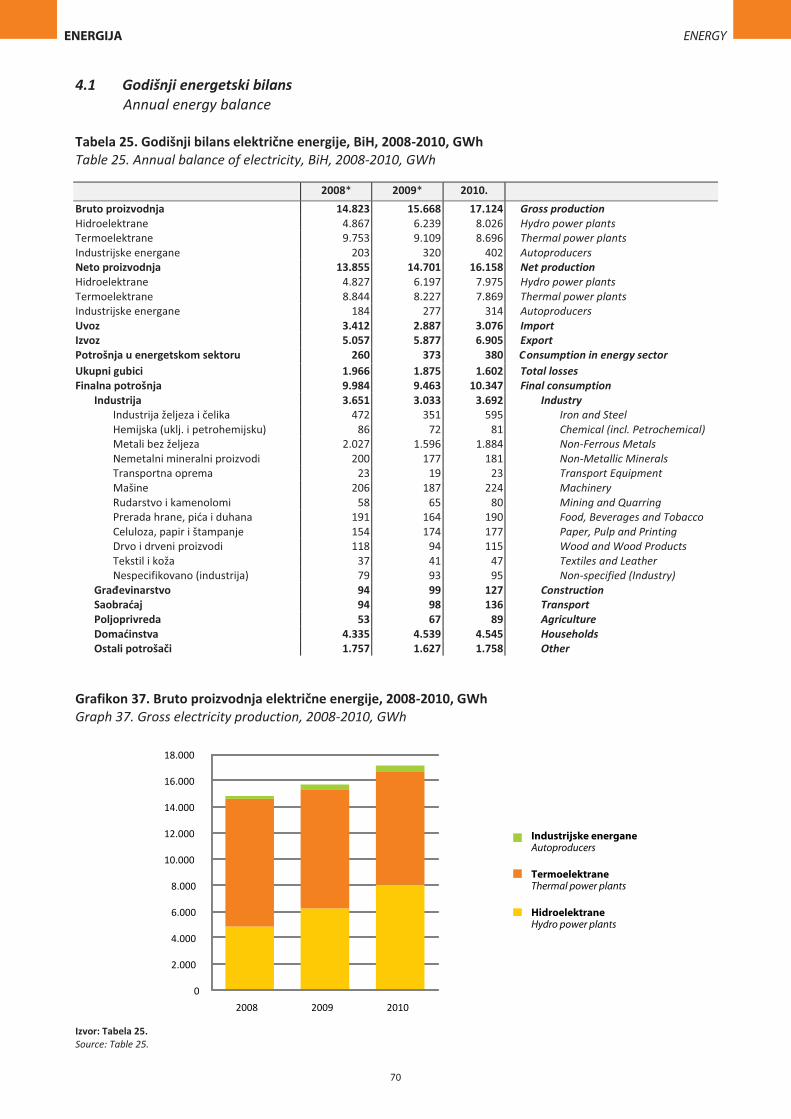
4.1 Godišnji energetski bilans Annual energy balance
Tabela 25. Godišnji bilans električne energije, BiH, 2008-2010, GWh Table 25. Annual balance of electricity, BiH, 2008-2010, GWh
2008* 2009* 2010. Bruto proizvodnja 14.823 15.668 17.124 Gross production Hidroelektrane 4.867 6.239 8.026 Hydro power plants Termoelektrane 9.753 9.109 8.696 Thermal power plants Industrijske energane 203 320 402 Autoproducers Neto proizvodnja 13.855 14.701 16.158 Net production Hidroelektrane 4.827 6.197 7.975 Hydro power plants Termoelektrane 8.844 8.227 7.869 Thermal power plants Industrijske energane 184 277 314 Autoproducers Uvoz 3.412 2.887 3.076 Import Izvoz 5.057 5.877 6.905 Export Potrošnja u energetskom sektoru 260 373 380 Consumption in energy sector Ukupni gubici 1.966 1.875 1.602 Total losses Finalna potrošnja 9.984 9.463 10.347 Final consumption
Industrija 3.651 3.033 3.692 Industry Industrija željeza i čelika 472 351 595 Iron and Steel Hemijska (uklj. i petrohemijsku) 86 72 81 Chemical (incl. Petrochemical) Metali bez željeza 2.027 1.596 1.884 Non-Ferrous Metals Nemetalni mineralni proizvodi 200 177 181 Non-Metallic Minerals Transportna oprema 23 19 23 Transport Equipment Mašine 206 187 224 Machinery Rudarstvo i kamenolomi 58 65 80 Mining and Quarring Prerada hrane, pića i duhana 191 164 190 Food, Beverages and Tobacco Celuloza, papir i štampanje 154 174 177 Paper, Pulp and Printing Drvo i drveni proizvodi 118 94 115 Wood and Wood Products Tekstil i koža 37 41 47 Textiles and Leather Nespecifikovano (industrija) 79 93 95 Non-specified (Industry)
Građevinarstvo 94 99 127 Construction Saobraćaj 94 98 136 Transport Poljoprivreda 53 67 89 Agriculture Domaćinstva 4.335 4.539 4.545 Households Ostali potrošači 1.757 1.627 1.758 Other
Grafikon 37. Bruto proizvodnja električne energije, 2008-2010, GWh Graph 37. Gross electricity production, 2008-2010, GWh
Izvor: Tabela 25. Source: Table 25.
70
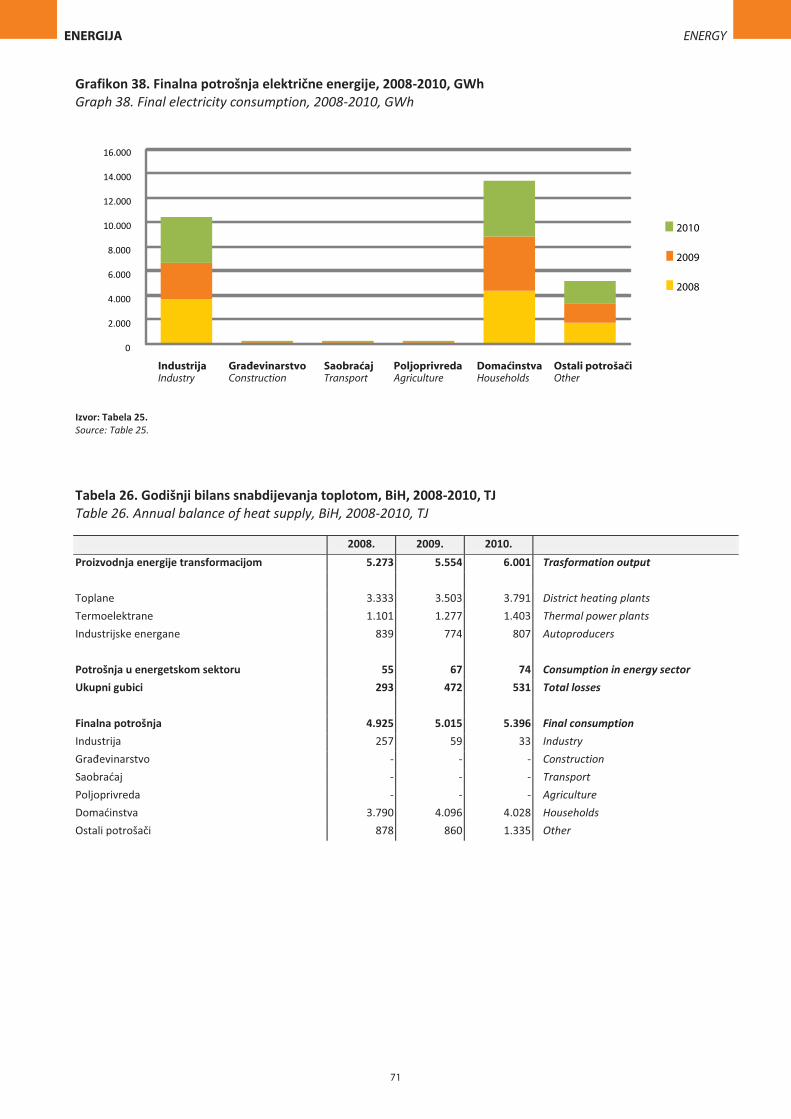
Grafikon 38. Finalna potrošnja električne energije, 2008-2010, GWh Graph 38. Final electricity consumption, 2008-2010, GWh
Izvor: Tabela 25. Source: Table 25.
Tabela 26. Godišnji bilans snabdijevanja toplotom, BiH, 2008-2010, TJ Table 26. Annual balance of heat supply, BiH, 2008-2010, TJ
2008. 2009. 2010. Proizvodnja energije transformacijom 5.273 5.554 6.001 Trasformation output
Toplane 3.333 3.503 3.791 District heating plants Termoelektrane 1.101 1.277 1.403 Thermal power plants Industrijske energane 839 774 807 Autoproducers
Potrošnja u energetskom sektoru 55 67 74 Consumption in energy sector Ukupni gubici 293 472 531 Total losses
Finalna potrošnja 4.925 5.015 5.396 Final consumption Industrija 257 59 33 Industry Građevinarstvo - - - Construction Saobraćaj - - - Transport Poljoprivreda - - - Agriculture Domaćinstva 3.790 4.096 4.028 Households Ostali potrošači 878 860 1.335 Other
71
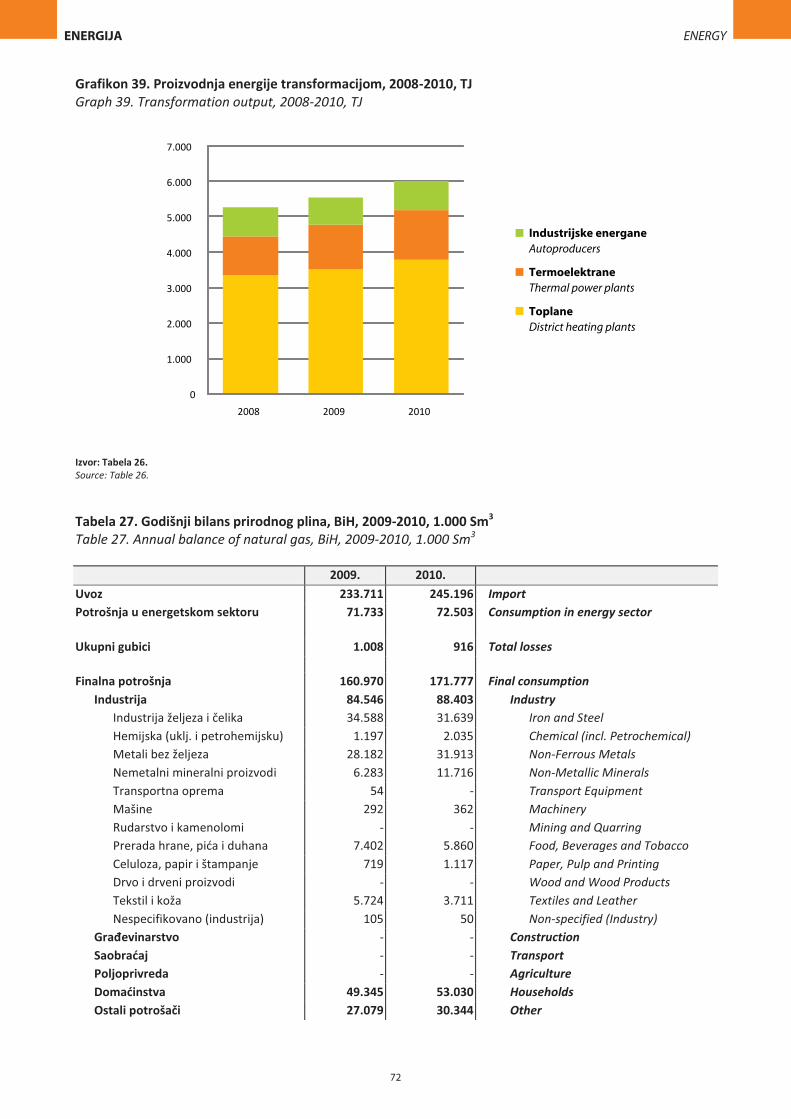
Grafikon 39. Proizvodnja energije transformacijom, 2008-2010, TJ Graph 39. Transformation output, 2008-2010, TJ
Izvor: Tabela 26. Source: Table 26.
Tabela 27. Godišnji bilans prirodnog plina, BiH, 2009-2010, 1.000 Sm3 Table 27. Annual balance of natural gas, BiH, 2009-2010, 1.000 Sm3
2009. 2010. Uvoz 233.711 245.196 Import Potrošnja u energetskom sektoru 71.733 72.503 Consumption in energy sector
Ukupni gubici 1.008 916 Total losses
Finalna potrošnja 160.970 171.777 Final consumption
Industrija 84.546 88.403 Industry Industrija željeza i čelika 34.588 31.639 Iron and Steel Hemijska (uklj. i petrohemijsku) 1.197 2.035 Chemical (incl. Petrochemical) Metali bez željeza 28.182 31.913 Non-Ferrous Metals Nemetalni mineralni proizvodi 6.283 11.716 Non-Metallic Minerals Transportna oprema 54 - Transport Equipment Mašine 292 362 Machinery Rudarstvo i kamenolomi - - Mining and Quarring Prerada hrane, pića i duhana 7.402 5.860 Food, Beverages and Tobacco Celuloza, papir i štampanje 719 1.117 Paper, Pulp and Printing Drvo i drveni proizvodi - - Wood and Wood Products Tekstil i koža 5.724 3.711 Textiles and Leather Nespecifikovano (industrija) 105 50 Non-specified (Industry)
Građevinarstvo - - Construction Saobraćaj - - Transport Poljoprivreda - - Agriculture Domaćinstva 49.345 53.030 Households Ostali potrošači 27.079 30.344 Other
72
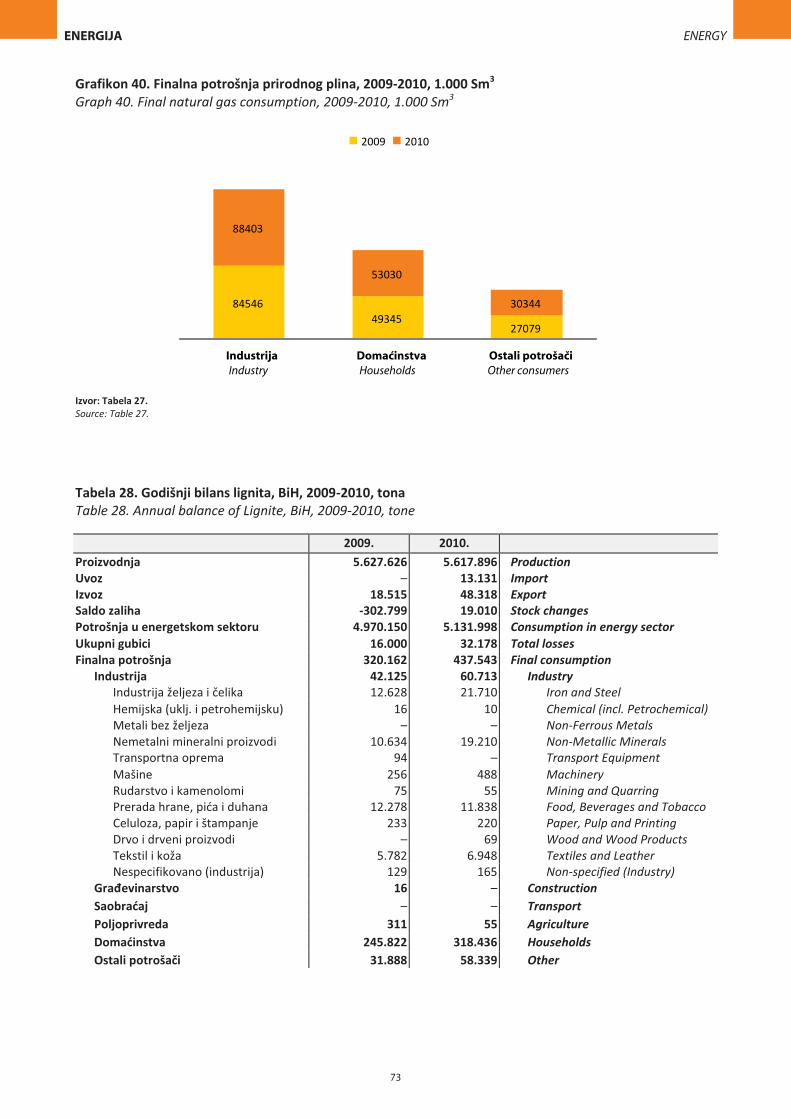
Grafikon 40. Finalna potrošnja prirodnog plina, 2009-2010, 1.000 Sm3 Graph 40. Final natural gas consumption, 2009-2010, 1.000 Sm3
Izvor: Tabela 27. Source: Table 27.
Tabela 28. Godišnji bilans lignita, BiH, 2009-2010, tona Table 28. Annual balance of Lignite, BiH, 2009-2010, tone
2009. 2010. Proizvodnja 5.627.626 5.617.896 Production Uvoz – 13.131 Import Izvoz 18.515 48.318 Export Saldo zaliha -302.799 19.010 Stock changes Potrošnja u energetskom sektoru 4.970.150 5.131.998 Consumption in energy sector Ukupni gubici 16.000 32.178 Total losses Finalna potrošnja 320.162 437.543 Final consumption
Industrija 42.125 60.713 Industry Industrija željeza i čelika 12.628 21.710 Iron and Steel Hemijska (uklj. i petrohemijsku) 16 10 Chemical (incl. Petrochemical) Metali bez željeza – – Non-Ferrous Metals Nemetalni mineralni proizvodi 10.634 19.210 Non-Metallic Minerals Transportna oprema 94 – Transport Equipment Mašine 256 488 Machinery Rudarstvo i kamenolomi 75 55 Mining and Quarring Prerada hrane, pića i duhana 12.278 11.838 Food, Beverages and Tobacco Celuloza, papir i štampanje 233 220 Paper, Pulp and Printing Drvo i drveni proizvodi – 69 Wood and Wood Products Tekstil i koža 5.782 6.948 Textiles and Leather Nespecifikovano (industrija) 129 165 Non-specified (Industry)
Građevinarstvo 16 – Construction Saobraćaj – – Transport Poljoprivreda 311 55 Agriculture Domaćinstva 245.822 318.436 Households Ostali potrošači 31.888 58.339 Other
73
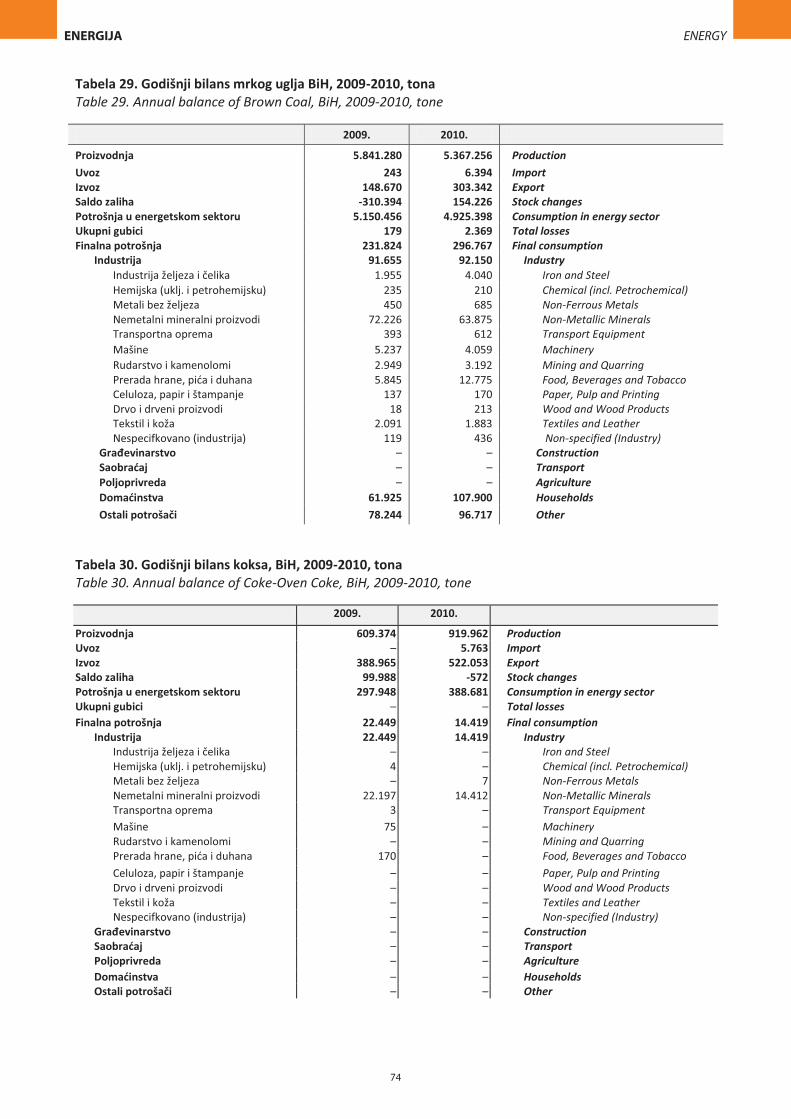
Tabela 29. Godišnji bilans mrkog uglja BiH, 2009-2010, tona Table 29. Annual balance of Brown Coal, BiH, 2009-2010, tone
2009. 2010.
Proizvodnja 5.841.280 5.367.256 Production Uvoz 243 6.394 Import Izvoz 148.670 303.342 Export Saldo zaliha -310.394 154.226 Stock changes Potrošnja u energetskom sektoru 5.150.456 4.925.398 Consumption in energy sector Ukupni gubici 179 2.369 Total losses Finalna potrošnja 231.824 296.767 Final consumption
Industrija 91.655 92.150 Industry Industrija željeza i čelika 1.955 4.040 Iron and Steel Hemijska (uklj. i petrohemijsku) 235 210 Chemical (incl. Petrochemical) Metali bez željeza 450 685 Non-Ferrous Metals Nemetalni mineralni proizvodi 72.226 63.875 Non-Metallic Minerals Transportna oprema 393 612 Transport Equipment Mašine 5.237 4.059 Machinery Rudarstvo i kamenolomi 2.949 3.192 Mining and Quarring Prerada hrane, pića i duhana 5.845 12.775 Food, Beverages and Tobacco Celuloza, papir i štampanje 137 170 Paper, Pulp and Printing Drvo i drveni proizvodi 18 213 Wood and Wood Products Tekstil i koža 2.091 1.883 Textiles and Leather Nespecifkovano (industrija) 119 436 Non-specified (Industry)
Građevinarstvo – – Construction Saobraćaj – – Transport Poljoprivreda – – Agriculture Domaćinstva 61.925 107.900 Households Ostali potrošači 78.244 96.717 Other
Tabela 30. Godišnji bilans koksa, BiH, 2009-2010, tona Table 30. Annual balance of Coke-Oven Coke, BiH, 2009-2010, tone
2009. 2010.
Proizvodnja 609.374 919.962 Production Uvoz – 5.763 Import Izvoz 388.965 522.053 Export Saldo zaliha 99.988 -572 Stock changes Potrošnja u energetskom sektoru 297.948 388.681 Consumption in energy sector Ukupni gubici – – Total losses Finalna potrošnja 22.449 14.419 Final consumption
Industrija 22.449 14.419 Industry Industrija željeza i čelika – – Iron and Steel Hemijska (uklj. i petrohemijsku) 4 – Chemical (incl. Petrochemical) Metali bez željeza – 7 Non-Ferrous Metals Nemetalni mineralni proizvodi 22.197 14.412 Non-Metallic Minerals Transportna oprema 3 – Transport Equipment Mašine 75 – Machinery Rudarstvo i kamenolomi – – Mining and Quarring Prerada hrane, pića i duhana 170 – Food, Beverages and Tobacco Celuloza, papir i štampanje – – Paper, Pulp and Printing Drvo i drveni proizvodi – – Wood and Wood Products Tekstil i koža – – Textiles and Leather Nespecifkovano (industrija) – – Non-specified (Industry)
Građevinarstvo – – Construction Saobraćaj – – Transport Poljoprivreda – – Agriculture Domaćinstva – – Households Ostali potrošači – – Other
74
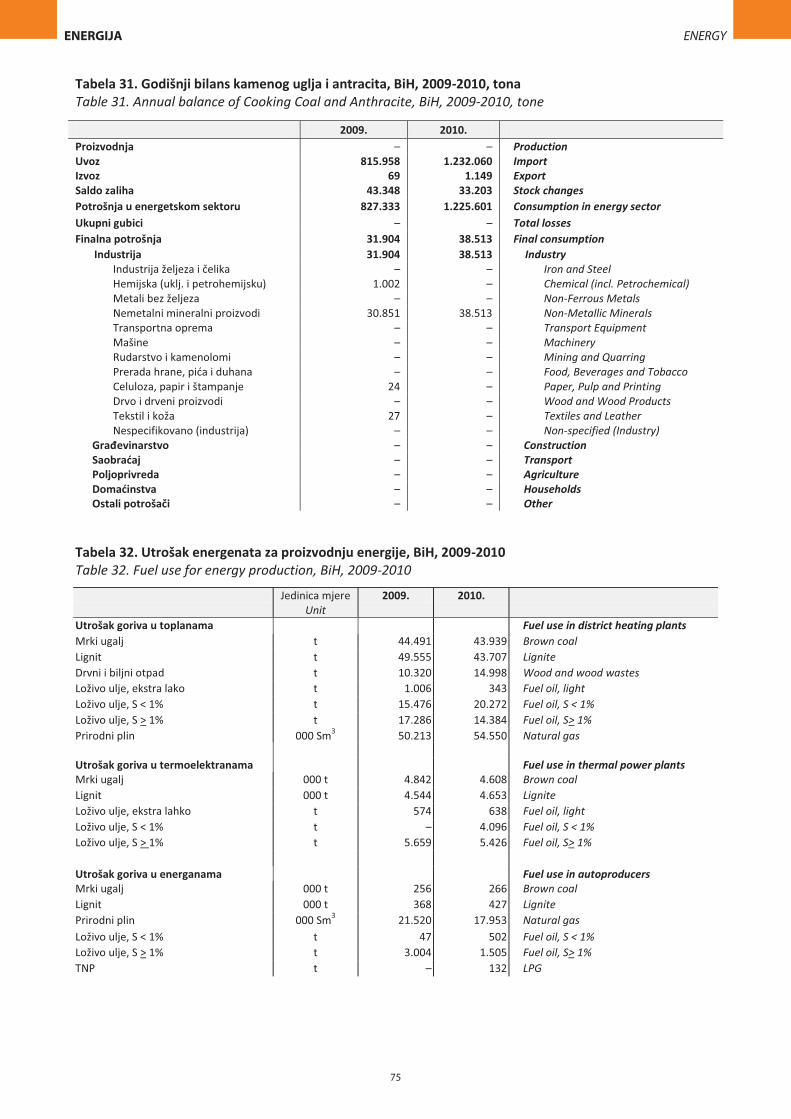
Tabela 31. Godišnji bilans kamenog uglja i antracita, BiH, 2009-2010, tona Table 31. Annual balance of Cooking Coal and Anthracite, BiH, 2009-2010, tone
2009. 2010. Proizvodnja – – Production Uvoz 815.958 1.232.060 Import Izvoz 69 1.149 Export Saldo zaliha 43.348 33.203 Stock changes Potrošnja u energetskom sektoru 827.333 1.225.601 Consumption in energy sector Ukupni gubici – – Total losses Finalna potrošnja 31.904 38.513 Final consumption
Industrija 31.904 38.513 Industry Industrija željeza i čelika – – Iron and Steel Hemijska (uklj. i petrohemijsku) 1.002 – Chemical (incl. Petrochemical) Metali bez željeza – – Non-Ferrous Metals Nemetalni mineralni proizvodi 30.851 38.513 Non-Metallic Minerals Transportna oprema – – Transport Equipment Mašine – – Machinery Rudarstvo i kamenolomi – – Mining and Quarring Prerada hrane, pića i duhana – – Food, Beverages and Tobacco Celuloza, papir i štampanje 24 – Paper, Pulp and Printing Drvo i drveni proizvodi – – Wood and Wood Products Tekstil i koža 27 – Textiles and Leather Nespecifikovano (industrija) – – Non-specified (Industry)
Građevinarstvo – – Construction Saobraćaj – – Transport Poljoprivreda – – Agriculture Domaćinstva – – Households Ostali potrošači – – Other
Tabela 32. Utrošak energenata za proizvodnju energije, BiH, 2009-2010 Table 32. Fuel use for energy production, BiH, 2009-2010
Jedinica mjere Unit
2009. 2010.
Utrošak goriva u toplanama Fuel use in district heating plants Mrki ugalj t 44.491 43.939 Brown coal Lignit t 49.555 43.707 Lignite Drvni i biljni otpad t 10.320 14.998 Wood and wood wastes Loživo ulje, ekstra lako t 1.006 343 Fuel oil, light Loživo ulje, S < 1% t 15.476 20.272 Fuel oil, S < 1% Loživo ulje, S > 1% t 17.286 14.384 Fuel oil, S> 1% Prirodni plin 000 Sm3 50.213 54.550 Natural gas
Utrošak goriva u termoelektranama Fuel use in thermal power plants Mrki ugalj 000 t 4.842 4.608 Brown coal Lignit 000 t 4.544 4.653 Lignite Loživo ulje, ekstra lahko t 574 638 Fuel oil, light Loživo ulje, S < 1% t – 4.096 Fuel oil, S < 1% Loživo ulje, S > 1% t 5.659 5.426 Fuel oil, S> 1%
Utrošak goriva u energanama Fuel use in autoproducers Mrki ugalj 000 t 256 266 Brown coal Lignit 000 t 368 427 Lignite Prirodni plin 000 Sm3 21.520 17.953 Natural gas Loživo ulje, S < 1% t 47 502 Fuel oil, S < 1% Loživo ulje, S > 1% t 3.004 1.505 Fuel oil, S> 1% TNP t – 132 LPG
75
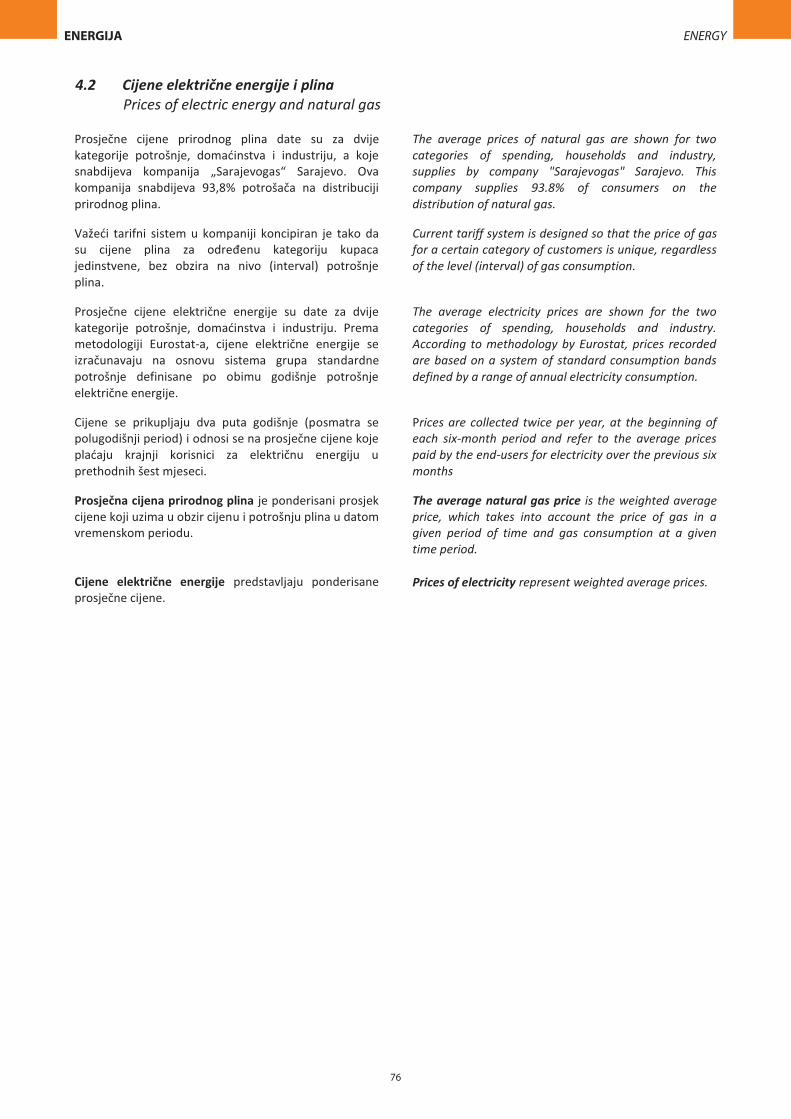
4.2 Cijene električne energije i plina Prices of electric energy and natural gas
Prosječne cijene prirodnog plina date su za dvije kategorije potrošnje, domaćinstva i industriju, a koje snabdijeva kompanija „Sarajevogas“ Sarajevo. Ova kompanija snabdijeva 93,8% potrošača na distribuciji prirodnog plina.
The average prices of natural gas are shown for two categories of spending, households and industry, supplies by company "Sarajevogas" Sarajevo. This company supplies 93.8% of consumers on the distribution of natural gas.
Važeći tarifni sistem u kompaniji koncipiran je tako da su cijene plina za određenu kategoriju kupaca jedinstvene, bez obzira na nivo (interval) potrošnje plina.
Current tariff system is designed so that the price of gas for a certain category of customers is unique, regardless of the level (interval) of gas consumption.
Prosječne cijene električne energije su date za dvije kategorije potrošnje, domaćinstva i industriju. Prema metodologiji Eurostat-a, cijene električne energije se izračunavaju na osnovu sistema grupa standardne potrošnje definisane po obimu godišnje potrošnje električne energije.
The average electricity prices are shown for the two categories of spending, households and industry. According to methodology by Eurostat, prices recorded are based on a system of standard consumption bands defined by a range of annual electricity consumption.
Cijene se prikupljaju dva puta godišnje (posmatra se polugodišnji period) i odnosi se na prosječne cijene koje plaćaju krajnji korisnici za električnu energiju u prethodnih šest mjeseci.
Prices are collected twice per year, at the beginning of each six-month period and refer to the average prices paid by the end-users for electricity over the previous six months
Prosječna cijena prirodnog plina je ponderisani prosjek cijene koji uzima u obzir cijenu i potrošnju plina u datom vremenskom periodu.
The average natural gas price is the weighted average price, which takes into account the price of gas in a given period of time and gas consumption at a given time period.
Cijene električne energije predstavljaju ponderisane prosječne cijene.
Prices of electricity represent weighted average prices.
76
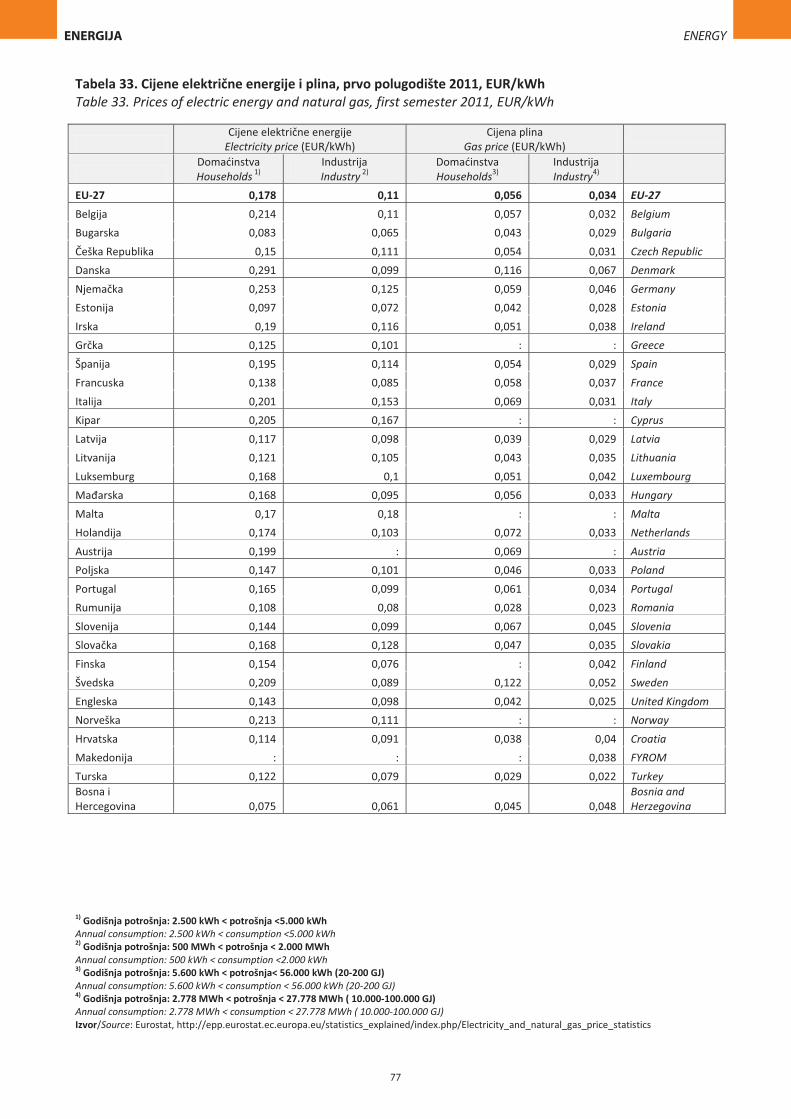
Tabela 33. Cijene električne energije i plina, prvo polugodište 2011, EUR/kWh Table 33. Prices of electric energy and natural gas, first semester 2011, EUR/kWh
Cijene električne energije
Electricity price (EUR/kWh) Cijena plina
Gas price (EUR/kWh)
Domaćinstva Households 1)
Industrija Industry 2)
Domaćinstva Households3)
Industrija Industry4)
EU-27 0,178 0,11 0,056 0,034 EU-27 Belgija 0,214 0,11 0,057 0,032 Belgium Bugarska 0,083 0,065 0,043 0,029 Bulgaria Češka Republika 0,15 0,111 0,054 0,031 Czech Republic Danska 0,291 0,099 0,116 0,067 Denmark Njemačka 0,253 0,125 0,059 0,046 Germany Estonija 0,097 0,072 0,042 0,028 Estonia Irska 0,19 0,116 0,051 0,038 Ireland Grčka 0,125 0,101 : : Greece Španija 0,195 0,114 0,054 0,029 Spain Francuska 0,138 0,085 0,058 0,037 France Italija 0,201 0,153 0,069 0,031 Italy Kipar 0,205 0,167 : : Cyprus Latvija 0,117 0,098 0,039 0,029 Latvia Litvanija 0,121 0,105 0,043 0,035 Lithuania Luksemburg 0,168 0,1 0,051 0,042 Luxembourg Mađarska 0,168 0,095 0,056 0,033 Hungary Malta 0,17 0,18 : : Malta Holandija 0,174 0,103 0,072 0,033 Netherlands Austrija 0,199 : 0,069 : Austria Poljska 0,147 0,101 0,046 0,033 Poland Portugal 0,165 0,099 0,061 0,034 Portugal Rumunija 0,108 0,08 0,028 0,023 Romania Slovenija 0,144 0,099 0,067 0,045 Slovenia Slovačka 0,168 0,128 0,047 0,035 Slovakia Finska 0,154 0,076 : 0,042 Finland Švedska 0,209 0,089 0,122 0,052 Sweden Engleska 0,143 0,098 0,042 0,025 United Kingdom Norveška 0,213 0,111 : : Norway Hrvatska 0,114 0,091 0,038 0,04 Croatia Makedonija : : : 0,038 FYROM Turska 0,122 0,079 0,029 0,022 Turkey Bosna i Hercegovina 0,075 0,061 0,045 0,048
Bosnia and Herzegovina
1) Godišnja potrošnja: 2.500 kWh < potrošnja <5.000 kWh Annual consumption: 2.500 kWh < consumption <5.000 kWh 2) Godišnja potrošnja: 500 MWh < potrošnja < 2.000 MWh Annual consumption: 500 kWh < consumption <2.000 kWh 3) Godišnja potrošnja: 5.600 kWh < potrošnja< 56.000 kWh (20-200 GJ) Annual consumption: 5.600 kWh < consumption < 56.000 kWh (20-200 GJ) 4) Godišnja potrošnja: 2.778 MWh < potrošnja < 27.778 MWh ( 10.000-100.000 GJ) Annual consumption: 2.778 MWh < consumption < 27.778 MWh ( 10.000-100.000 GJ) Izvor/Source: Eurostat, http://epp.eurostat.ec.europa.eu/statistics_explained/index.php/Electricity_and_natural_gas_price_statistics
77
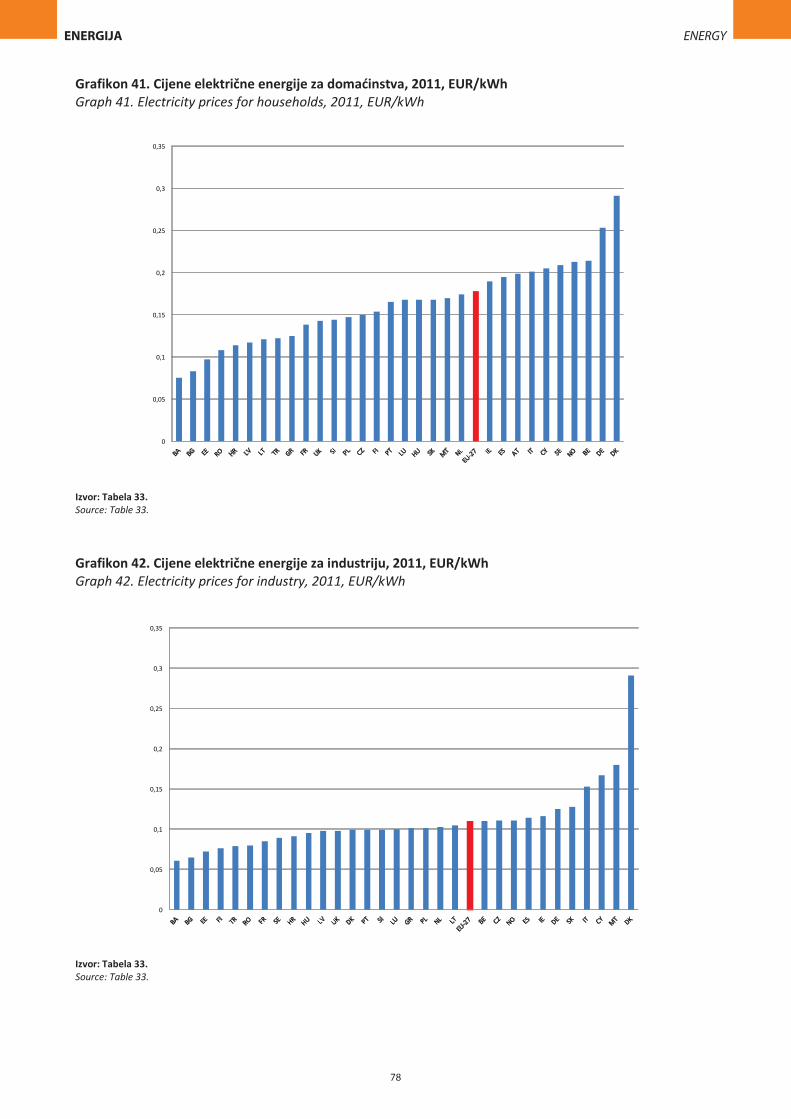
Grafikon 41. Cijene električne energije za domaćinstva, 2011, EUR/kWh Graph 41. Electricity prices for households, 2011, EUR/kWh
Izvor: Tabela 33. Source: Table 33.
Grafikon 42. Cijene električne energije za industriju, 2011, EUR/kWh Graph 42. Electricity prices for industry, 2011, EUR/kWh
Izvor: Tabela 33. Source: Table 33.
78
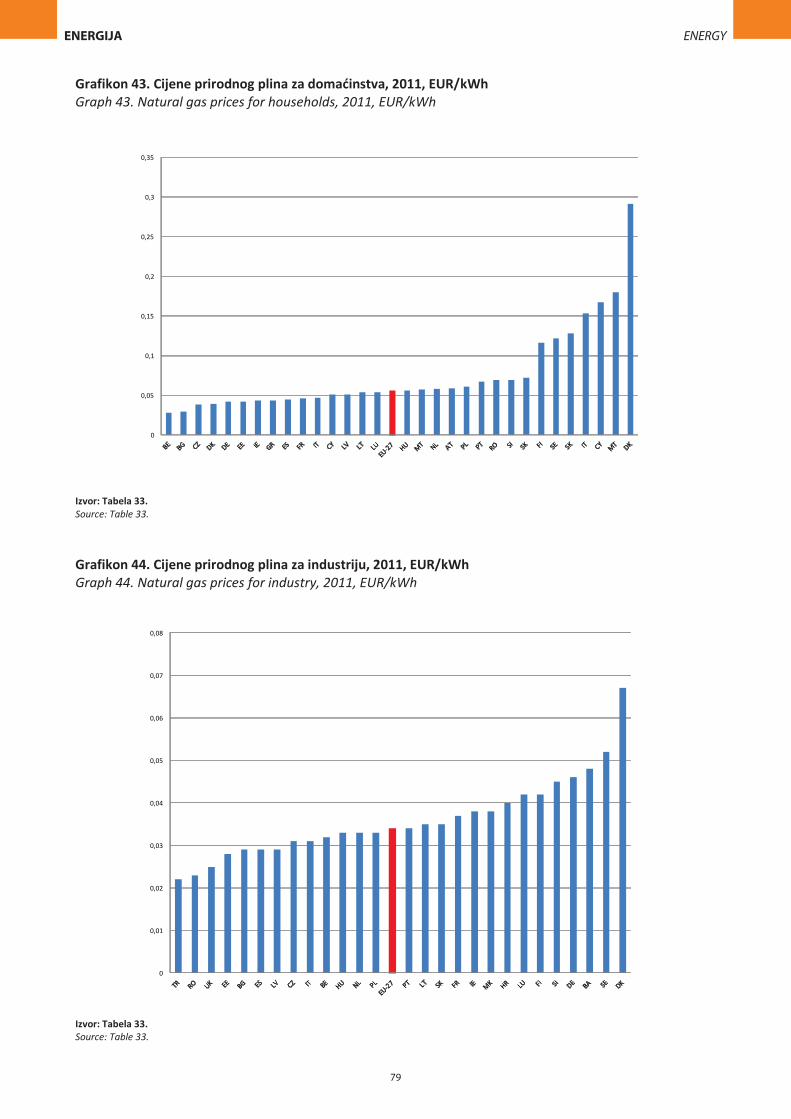
Grafikon 43. Cijene prirodnog plina za domaćinstva, 2011, EUR/kWh Graph 43. Natural gas prices for households, 2011, EUR/kWh
Izvor: Tabela 33. Source: Table 33.
Grafikon 44. Cijene prirodnog plina za industriju, 2011, EUR/kWh Graph 44. Natural gas prices for industry, 2011, EUR/kWh
Izvor: Tabela 33. Source: Table 33.
79


Metodološka objašnjenja i definicije Methodological notes and definitions
Podaci o cestovnom i željezničkom saobraćaju dobijeni su obradom mjesečnih i kvartalnih statističkih izvještaja koje su entitetski statistički zavodi prikupili. Izvještajne jedinice su preduzeća i drugi poslovni subjekti koji se bave prijevozom putnika i robe (tereta) u unutrašnjem i međunarodnom prijevozu.
Data on Road and Railway transport were obtained by processing monthly and quarterly statistical data from surveys conducted by the Statistical Offices at the level of entities. The reporting units for these surveys are enterprises and other business subjects engaged in domestic and international transport of passengers and goods.
Agencija za statistiku Bosne i Hercegovine preuzela je podatke o aerodromskim operacijama, prevezenim putnicima, teretu i pošti na aerodromima u BiH od Direkcije za civilno vazduhoplovstvo Bosne i Hercegovine. Direkcija je podatke obradila u skladu sa standardima International Civil Aviation Organization (ICAO)
Agency for statistics of Bosnia and Herzegovina are taken data on aircraft movements, number of passengers, freight and mail transported or airports in BiH from Directorate of civil aviation of BiH. Directorate processed data in accordance with International Civil Aviation Organization (ICAO) standards.
Svi podaci o broju prevezenih putnika, tereta i pošte odnose se na međunarodni vazdušni saobraćaj, jer u Bosni i Hercegovini nema domaćeg vazdušnog saobraćaja.
All data on number of passengers, freight and mail are related to international air transport. Bosnia and Herzegovina has no domestic air transport.
Agencija za statistiku Bosne i Hercegovine preuzela je bazu o registrovanim cestovnim motornim vozilima za 2010. godinu od Agencije za identifikacione dokumenete, evidenciju i razmjenu podataka Bosne i Hercegovine.
Agency for statistics of Bosnia and Herzegovina receives database about registered road motor vehicles in 2010 year from the Agency for Identification Documents Registers and data Exchange of Bosnia and Herzegovina.
DEFINICIJE
DEFINITIONS
Pod pojmom prijevoz podrazumijeva se kretanje putnika ili tereta od jednog mjesta (mjesto ukrcaja/utovara) do drugog mjesta (mjesta iskrcaja/istovara) i predstavlja mjeru aktivnosti prijevoznih preduzeća.
Considered as transport is movement of passengers or cargo from one place (loading place) to another place (unloading place) and representing the operation of transport enterprises.
Unutrašnji prijevoz obuhvata prijevoz putnika obavljen između mjesta ukrcaja i mjesta iskrcaja unutar granica naše zemlje.
Domestic transport implies transport of passenger between places of loading and unloading within the borders of the country.
Međunarodni prijevoz obuhvata prijevoz putnika između mjesta ukrcaja u našoj zemlji i mjesta iskrcaja u inostranstvu i obrnuto.
International transport implies transport of passengers between the place of loading in our country and the place of unloading abroad, or the other way round.
Prijevoz putnika obuhvata prevezene putnike u unutrašnjem i međunarodnom saobraćaju.
Transport of passengers includes transported passengers into domestic and international transport.
Putnički kilometar je jedinica mjere koja predstavlja prijevoz jednog putnika na udaljenosti od jednog kilometra.
Passenger kilometre is a unit of measure which refers to transport of one passenger at the distance of one kilometre.
Pod robom se podrazumijeva svaka roba koja se prevozi željezničkim i cestovnim sredstvima.
Goods are any goods transported by railway or road transport means.
Prijevoz robe iskazuje se u tonama i u tonskim kilometrima, a predstavlja zbir svih kilometara ostvarenih u unutrašnjem i međunarodnom prijevozu.
Goods transport is given in tons and ton kilometres, and it is the sum of all kilometres realized in domestic and international transport.
Tonski kilometar je jedinica mjere koja predstavlja prijevoz jedne tone robe na udaljenosti od jednog kilometra.
Tonne kilometre is a unit of measure which refers to transport of one tone of goods at the distance of one kilometre.
Kretanje aviona Aircraft movement Polijetanje i slijetanje aviona na aerodrom. U statistici vazdušnog saobraćaja jedan dolazak i jedan polazak računaju se kao dva kretanja. Uključena su sva kretanja aviona u komercijalne svrhe i ne-komercijalne operacije genereralne avijacije. Isključeni su državni letovi dodirni i idi (touch and go) i neuspjeli prilazi (overshoot).
An aircraft take-off or landing at an airport. For airport traffic purposes one arrival and one departure is counted as two movements. Included are all commercial aircraft movements and non commercial general aviation operations. Excluded are State flights, touch and goes, overshoots and unsuccessful approaches.
83
Vazdušni prijevoz Air transport Bilo koje kretanje robe i/ili putnika avionom. Any movement of goods and/or passengers on an aircraft
movement. Komercijalni vazdušni prijevoz Commercial air transport Bilo koje kretanje robe i/ili putnika avionom u komercijalne svrhe.
Any movement of goods and/or passengers on a commercial aircraft movement.
Domaći vazdušni prijevoz National air transport Vazdušni prijevoz na domaćim letovima. Air transport on a domestic flight. Međunarodni vazdušni prijevoz International air transport Vazdušni prijevoz na međunarodnim letovima. Air transport on an international flight. Mjesto polaska i dolaska na letu On flight origin and destination (OFOD) Saobraćaj u okviru obavljanja komercijalne vazdušne usluge koja je označena jedinstvenim brojem leta i podijeljena na parove aerodroma prema mjestima utovara/ukrcaja i mjestima istovara/iskrcaja na tom letu.
Traffic on a commercial air service identified by a unique flight number subdivided by airport pairs in accordance with point of embarkation and point of disembarkation on that flight.
Prevezeni putnici u vazdušnom prijevozu Air passengers carried Svi putnici na određenom letu (pod istim brojem leta) računati samo jedanput, a ne iznova na svakoj dionici tog leta. Uključuju se svi putnici koji se prevoze uz naknadu ili bez naknade, čije putovanje počinje ili završava se na izvještajnom aerodromu i putnici u transferu koji se pridružuju ili napuštaju let na izvještajnom aerodromu. Isključuju se putnici u direktnom tranzitu.
All passengers on a particular flight (with one flight number) counted once only and not repeatedly on each individual stage of that flight. All revenue and non revenue passengers whose journey begins or terminates at the reporting airport and transfer passengers joining or leaving the flight at the reporting airport. Excludes direct transit passengers.
Teret Freight Bilo koji predmet prevežen avionom, osim pošte, potrepština posade i prtljaga.U statističke svrhe, teret obuhvata ekspresno poslat teret i pošiljke, diplomatske torbe, ali ne i putnički prtljag. Svaki prijevoz kamionima, uz korištenje vazduhoplovnog tovarnog lista, treba da bude isključen.
Any property carried on an aircraft other than mail, stores and baggage. For statistical purposes, freight includes express freight and parcels and diplomatic bags but not passenger baggage. All trucking operations using an air waybill should be excluded.
Pošta Mail Prepiske i ostale pošiljke prevezene avionom, koje su poslate od strane poštanske administracije i namijenjene za isporuku poštanskoj administraciji. Isključuje se ekspresni teret i ekspresne pošiljke.
Dispatches of correspondence and other objects carried on an aircraft, which have been dispatched by and intended for delivery to postal administrations. Express freight and express parcel shipments are excluded.
Datum prve registracije Date of first registration of motor vehicle Datum prve registracije motornog vozila je datum prve registracije novog vozila kada je upisan u jedinstvenu bazu registrovanih vozila, bez obzira na zemlju registrovanja.
The date of first registration of a motor vehicle is the first-time registration of the vehicle as new in a Motor Vehicle Register, irrespective of the nationality of the register.
Prvi put registrovana vozila First time registered motor vehicles Prvi put registrovana vozila uključuju prvi put registrovana vozila u referentnom periodu (datum prve registracije), kao i ponovnu registraciju ranije registrovanih vozila, koja su određeni period bila u stanju mirovanja. U ovu kategoriju uključuju se i uvezena polovna vozila.
First time registered motor vehicles include first time registrations of vehicles (date of first registration) and registrations with a new licence of vehicles that have been previously registered and thereafter retired. Registrations of imported second-hand vehicles are included in these figures
Cestovno motorno vozilo Road motor vehicle Cestovno vozilo sa motorom koji čini njegovo jedino pogonsko sredstvo, koje obično služi za prijevoz putnika ili robe, odnosno za vuču cestom vozila koja se koriste za prijevoz putnika ili robe.
A road vehicle fitted with an engine whence it derives its sole means of propulsion, which is normally used for carrying persons or goods or for drawing, on the road, vehicles used for the carriage of persons or goods.
Cestovno vozilo za prijevoz putnika Passenger road vehicle Cestovno vozilo koje je isključivo ili uglavnom projektovano za prijevoz jedne ili više osoba.
A road vehicle designed, exclusively or primarily, to carry one or more persons.
84
Starost cestovnog vozila Age of road vehicle Broj godina proteklih od prve registracije cestovnog vozila, bez obzira na zemlju registrovanja.
Length of time after the first registration of the road vehicle, irrespective of the registering country.
Pogonska energija Motor energy Osnovna vrsta pogonske energije koju koriste motorna vozila odobrena od nadležnog tijela zemlje registracije vozila.
The principal type of motor energy used by the vehicle as certified by the competent authority of the country of registration.
Alternativno gorivo Alternative fuel Vrsta pogonske energije motora koja nije konvencionalno gorivo.
A type of motor energy other than the conventional fuels.
Saobraćajna nezgoda (sa nastradalim osobama) Injury accident Bilo koja saobraćajna nezgoda na putu u kojoj učestvuje najmanje jedno vozilo u pokretu po javnom ili privatnom putu na kojem je dozvoljen javni pristup, i u kojoj je najmanje jedna osoba povrijeđena ili poginula. Obuhvataju se: sudari između cestovnih vozila; između cestovnih vozila i pješaka; između cestovnih vozila i životinja ili nepokretnih preprijeka i sudara u kojima učestvuje jedno cestovno vozilo. Obuhvataju se sudari između cestovnih i željezničkih vozila. Sudari više cestovnih vozila računaju se kao jedna saobraćajna nezgoda ako se svaki uzastopni sudar dogodio u veoma kratkom vremenskom period.
Any accident involving at least one road vehicle in motion on a public road or private road to which the public has right of access, resulting in at least one injured or killed person. Included are: collisions between road vehicles; between road vehicles and pedestrians; between road vehicles and animals or fixed obstacles and with one road vehicle alone. Included are collisions between road and rail vehicles. Multi-vehicle collisions are counted as only one accident provided that any successive collisions happen within a very short time period. Injury accidents exclude accidents incurring only material damage.
Poginula osoba Person killed Svaka osoba koja je izgubila život odmah ili je umrla u periodu od 30 dana od posljedica saobraćajne nezgoda sa povrijeđenom osobom. Samoubistva se ne obuhvataju u ovoj kategoriji.
Any person killed immediately or dying within 30 days as a result of an injury accident, excluding suicides
Povrijeđena osoba Person injured Svaka osoba koja nije izgubila život odmah ili umrla u periodu od 30 dana od posljedica saobraćajne nezgoda sa povrijeđenom osobom, ali je zadobila povrede koje obično zahtjevaju medicinsku njegu, ne obuhvata se namjera samoubistva.
Any person who as result of an injury accident was not killed immediately or not dying within 30 days, but sustained an injury, normally needing medical treatment, excluding attempted suicides.
5.1 Infrastruktura Infrastructure
Tabela 34. Infrastruktura, 2006-2010, km Table 34. Infrastructure, 2006-2010, km
2006. 2007. 2008. 2009. 2010. Dužina željezničkih pruga 1.024 1.017 1.017 1.017 1.027 Length of railway lines
Elektrificirane pruge 771 771 771 771 771 Electrified lines Ostale pruge 253 253 246 246 256 Other lines
Dužina cesta 8.656 8.646 8.592 8.521 8.445 Length of roads Magistralne 3.771 3.808 3.801 3.801 3.800 Main Regionalne 4.865 4.810 4.763 4.685 4.645 Regional Autocesta 20 28 28 35 35 Motorway
85
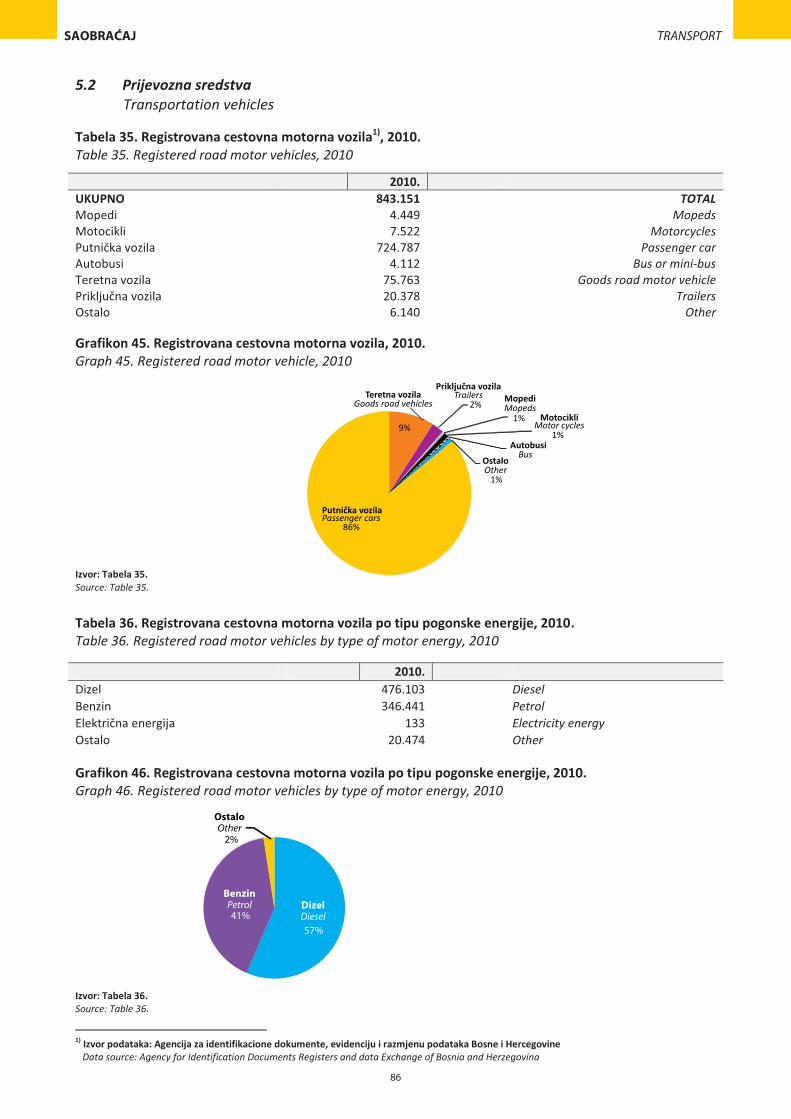
5.2 Prijevozna sredstva Transportation vehicles
Tabela 35. Registrovana cestovna motorna vozila1), 2010. Table 35. Registered road motor vehicles, 2010
2010. UKUPNO 843.151 TOTAL Mopedi 4.449 Mopeds Motocikli 7.522 Motorcycles Putnička vozila 724.787 Passenger car Autobusi 4.112 Bus or mini-bus Teretna vozila 75.763 Goods road motor vehicle Priključna vozila 20.378 Trailers Ostalo 6.140 Other Grafikon 45. Registrovana cestovna motorna vozila, 2010. Graph 45. Registered road motor vehicle, 2010
Izvor: Tabela 35. Source: Table 35.
Tabela 36. Registrovana cestovna motorna vozila po tipu pogonske energije, 2010. Table 36. Registered road motor vehicles by type of motor energy, 2010 2010. Dizel 476.103 Diesel Benzin 346.441 Petrol Električna energija 133 Electricity energy Ostalo 20.474 Other Grafikon 46. Registrovana cestovna motorna vozila po tipu pogonske energije, 2010. Graph 46. Registered road motor vehicles by type of motor energy, 2010
Izvor: Tabela 36. Source: Table 36.
1) Izvor podataka: Agencija za identifikacione dokumente, evidenciju i razmjenu podataka Bosne i Hercegovine Data source: Agency for Identification Documents Registers and data Exchange of Bosnia and Herzegovina
86
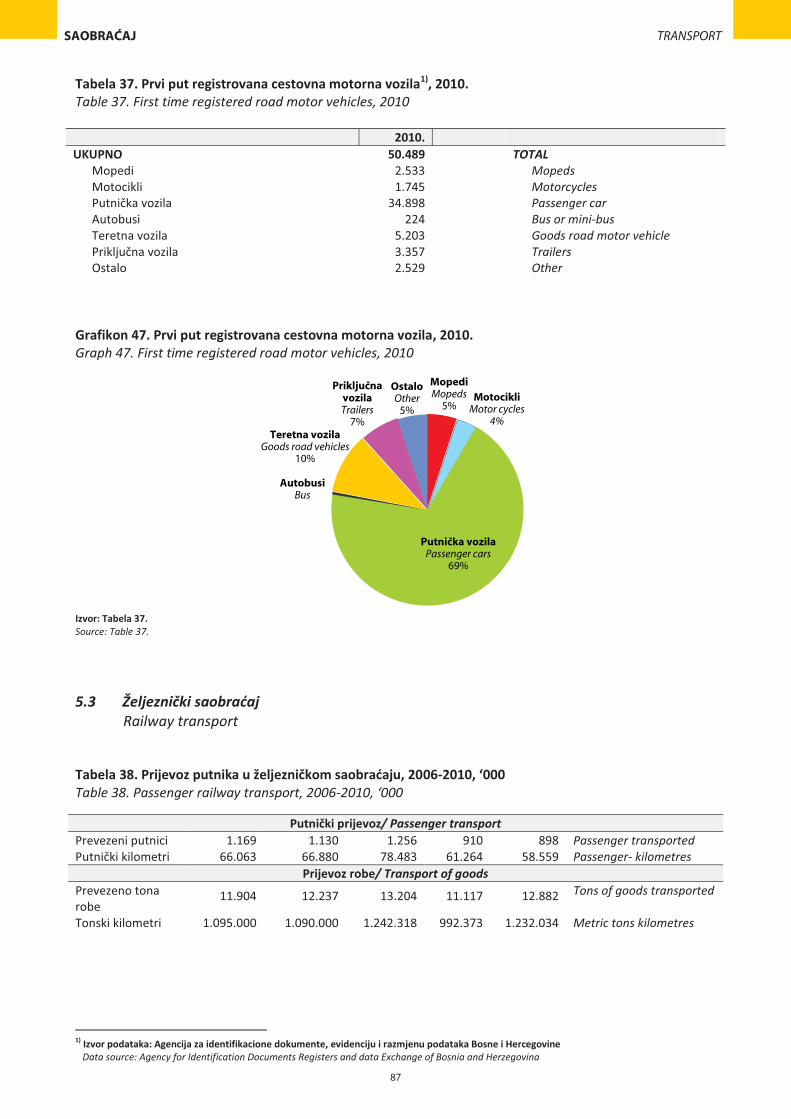
Tabela 37. Prvi put registrovana cestovna motorna vozila1), 2010. Table 37. First time registered road motor vehicles, 2010 2010. UKUPNO 50.489 TOTAL
Mopedi 2.533 Mopeds Motocikli 1.745 Motorcycles Putnička vozila 34.898 Passenger car Autobusi 224 Bus or mini-bus Teretna vozila 5.203 Goods road motor vehicle Priključna vozila 3.357 Trailers Ostalo 2.529 Other
Grafikon 47. Prvi put registrovana cestovna motorna vozila, 2010. Graph 47. First time registered road motor vehicles, 2010
Izvor: Tabela 37. Source: Table 37.
5.3 Željeznički saobraćaj Railway transport
Tabela 38. Prijevoz putnika u željezničkom saobraćaju, 2006-2010, ‘000 Table 38. Passenger railway transport, 2006-2010, ‘000
Putnički prijevoz/ Passenger transport Prevezeni putnici 1.169 1.130 1.256 910 898 Passenger transported Putnički kilometri 66.063 66.880 78.483 61.264 58.559 Passenger- kilometres
Prijevoz robe/ Transport of goods Prevezeno tona robe
11.904 12.237 13.204 11.117 12.882
Tons of goods transported
Tonski kilometri 1.095.000 1.090.000 1.242.318 992.373 1.232.034 Metric tons kilometres
1) Izvor podataka: Agencija za identifikacione dokumente, evidenciju i razmjenu podataka Bosne i Hercegovine Data source: Agency for Identification Documents Registers and data Exchange of Bosnia and Herzegovina
87
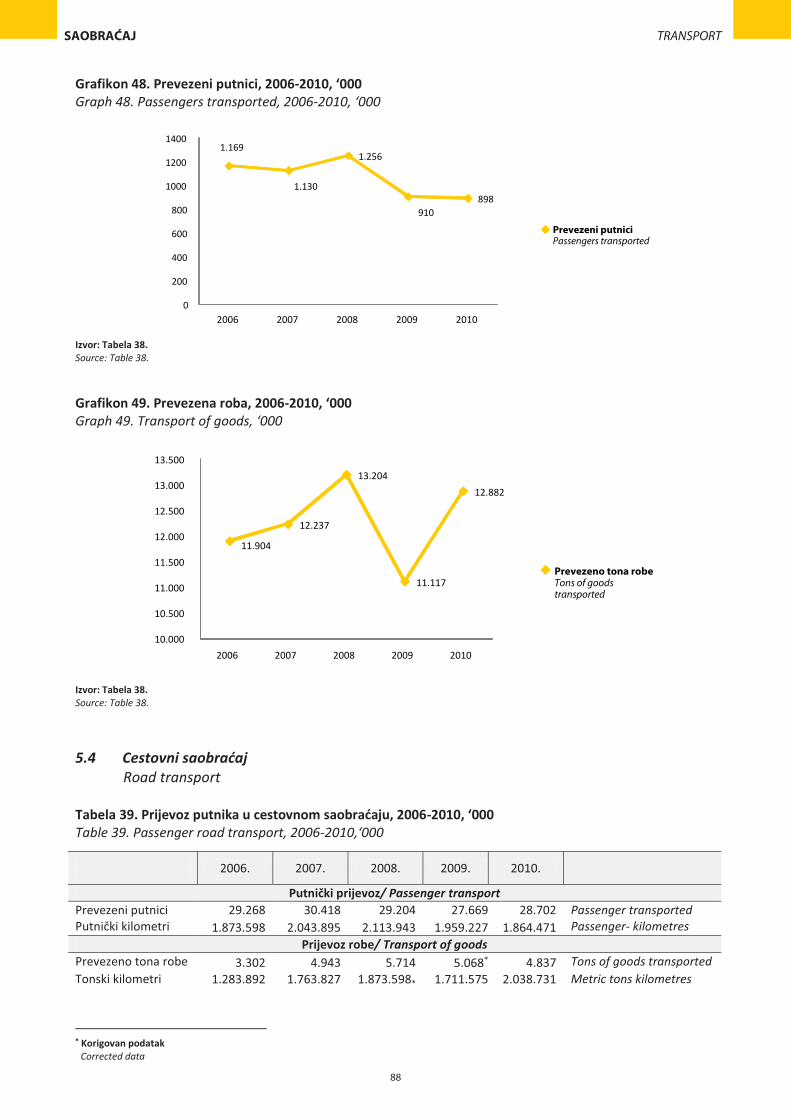
Grafikon 48. Prevezeni putnici, 2006-2010, ‘000 Graph 48. Passengers transported, 2006-2010, ‘000
Izvor: Tabela 38. Source: Table 38.
Grafikon 49. Prevezena roba, 2006-2010, ‘000 Graph 49. Transport of goods, ‘000
Izvor: Tabela 38. Source: Table 38.
5.4 Cestovni saobraćaj Road transport
Tabela 39. Prijevoz putnika u cestovnom saobraćaju, 2006-2010, ‘000 Table 39. Passenger road transport, 2006-2010,‘000
2006. 2007. 2008. 2009. 2010.
Putnički prijevoz/ Passenger transport Prevezeni putnici 29.268 30.418 29.204 27.669 28.702 Passenger transported Putnički kilometri 1.873.598 2.043.895 2.113.943 1.959.227 1.864.471 Passenger- kilometres
Prijevoz robe/ Transport of goods Prevezeno tona robe 3.302 4.943 5.714 5.068� 4.837 Tons of goods transported Tonski kilometri 1.283.892 1.763.827 1.873.598* 1.711.575 2.038.731
Metric tons kilometres
�� Korigovan podatak
Corrected data
transported
88
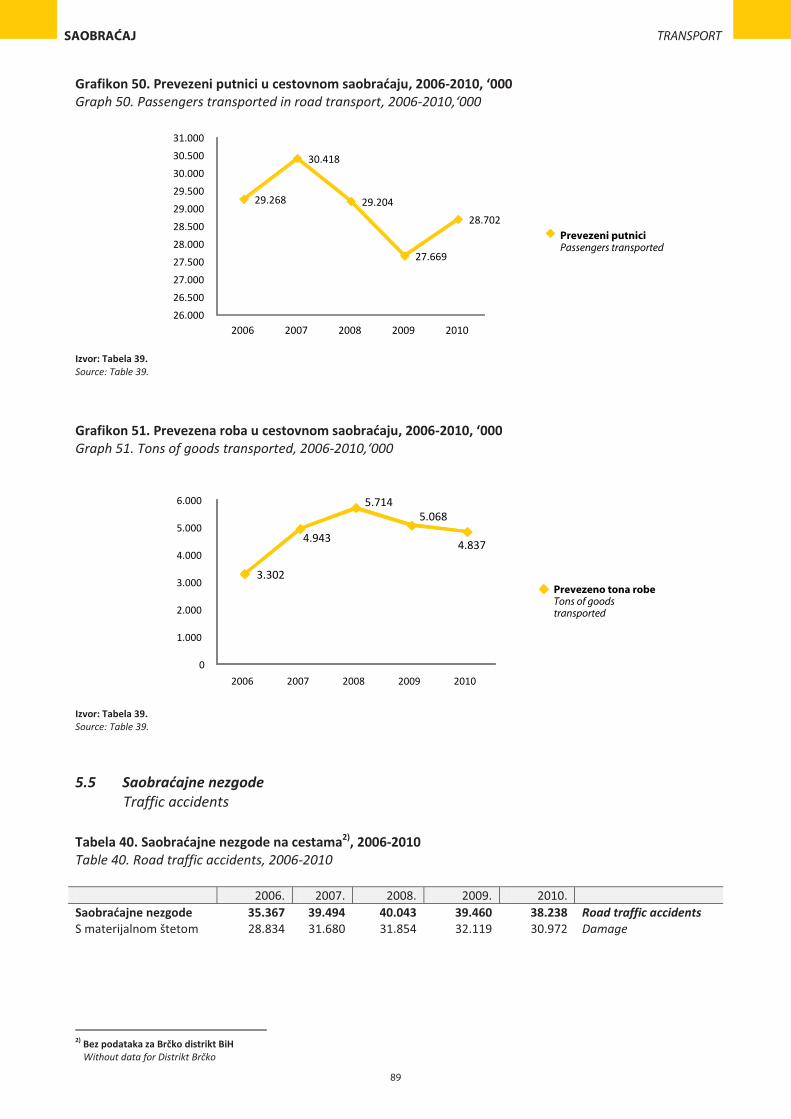
Grafikon 50. Prevezeni putnici u cestovnom saobraćaju, 2006-2010, ‘000 Graph 50. Passengers transported in road transport, 2006-2010,‘000
Izvor: Tabela 39. Source: Table 39.
Grafikon 51. Prevezena roba u cestovnom saobraćaju, 2006-2010, ‘000 Graph 51. Tons of goods transported, 2006-2010,‘000
Izvor: Tabela 39. Source: Table 39.
5.5 Saobraćajne nezgode Traffic accidents
Tabela 40. Saobraćajne nezgode na cestama2), 2006-2010 Table 40. Road traffic accidents, 2006-2010 2006. 2007. 2008. 2009. 2010. Saobraćajne nezgode 35.367 39.494 40.043 39.460 38.238 Road traffic accidents S materijalnom štetom 28.834 31.680 31.854 32.119 30.972 Damage
2) Bez podataka za Brčko distrikt BiH
Without data for Distrikt Brčko
transported
89
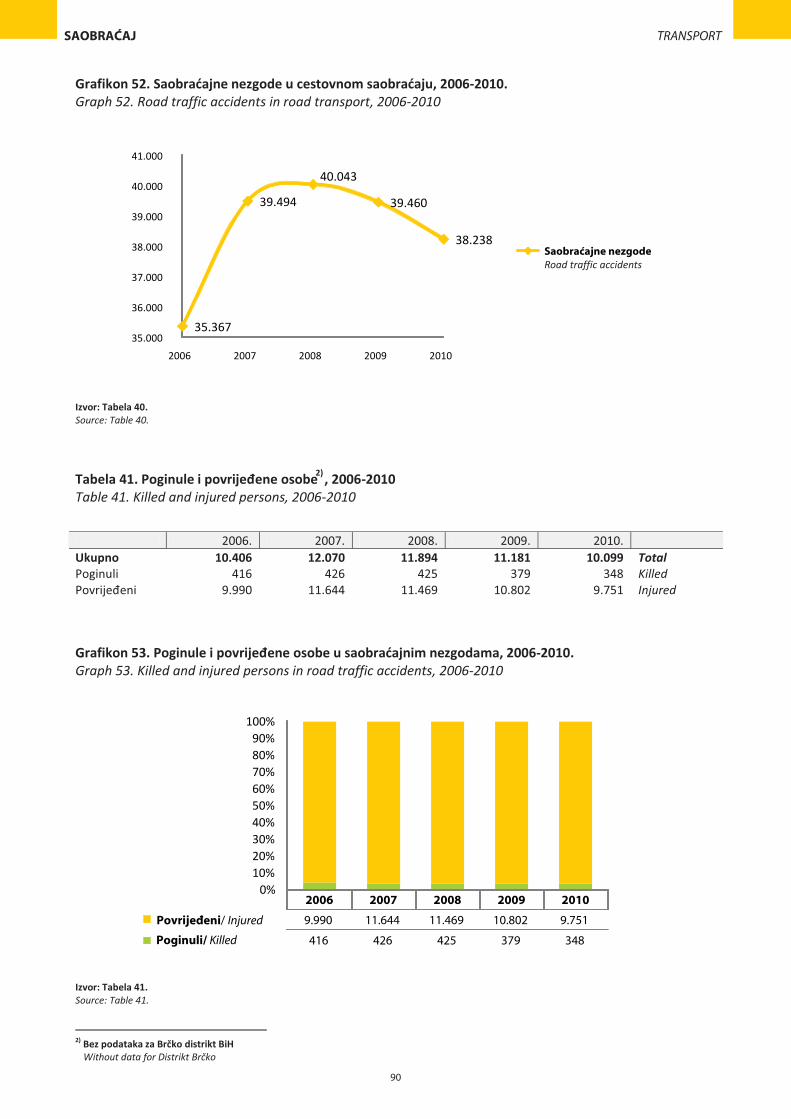
Grafikon 52. Saobraćajne nezgode u cestovnom saobraćaju, 2006-2010. Graph 52. Road traffic accidents in road transport, 2006-2010
Izvor: Tabela 40. Source: Table 40.
2006. 2007. 2008. 2009. 2010. Ukupno 10.406 12.070 11.894 11.181 10.099 Total Poginuli 416 426 425 379 348 Killed Povrijeđeni 9.990 11.644 11.469 10.802 9.751 Injured
Grafikon 53. Poginule i povrijeđene osobe u saobraćajnim nezgodama, 2006-2010. Graph 53. Killed and injured persons in road traffic accidents, 2006-2010
Izvor: Tabela 41. Source: Table 41.
90
Tabela 41. Poginule i povrijeđene osobe��, 2006-2010 Table 41. Killed and injured persons, 2006-2010
2�
2) Bez podataka za Brčko distrikt BiH
Without data for Distrikt Brčko
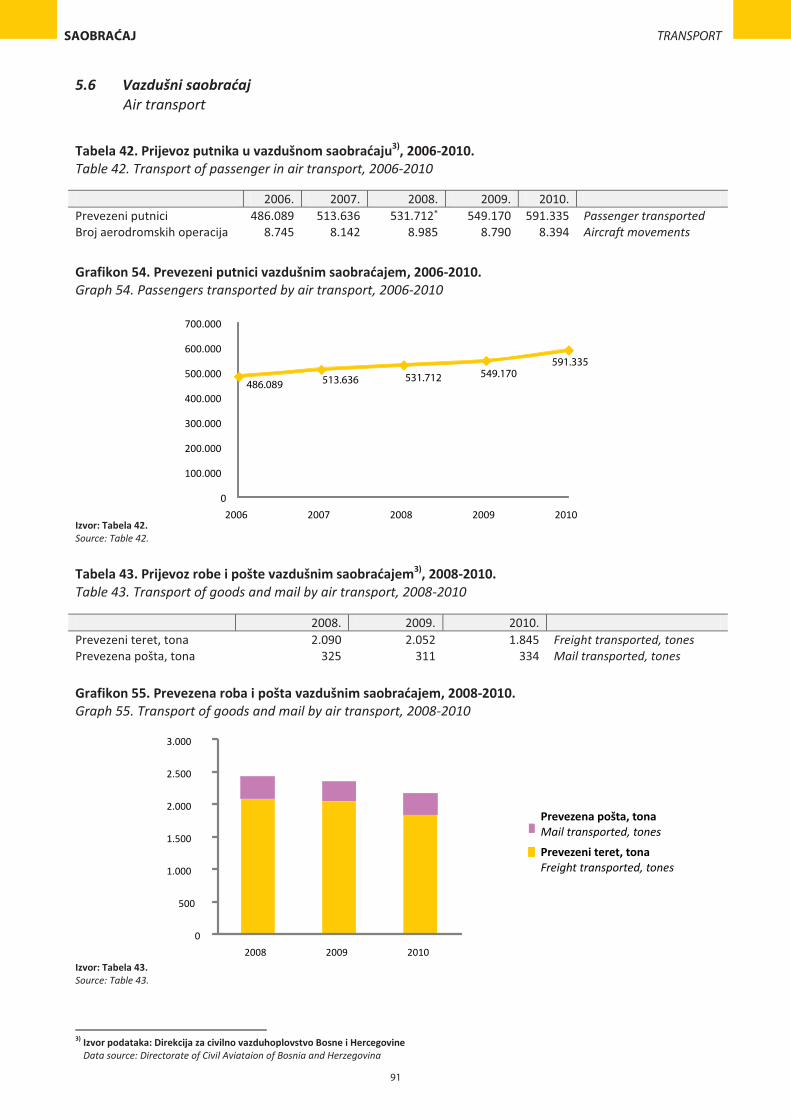
5.6 Vazdušni saobraćaj Air transport
Tabela 42. Prijevoz putnika u vazdušnom saobraćaju), 2006-2010. Table 42. Transport of passenger in air transport, 2006-2010 2006. 2007. 2008. 2009. 2010. Prevezeni putnici 486.089 513.636 531.712* 549.170 591.335 Passenger transported Broj aerodromskih operacija 8.745 8.142 8.985 8.790 8.394 Aircraft movements
Grafikon 54. Prevezeni putnici vazdušnim saobraćajem, 2006-2010. Graph 54. Passengers transported by air transport, 2006-2010
Izvor: Tabela 42. Source: Table 42.
Tabela 43. Prijevoz robe i pošte vazdušnim saobraćajem), 2008-2010. Table 43. Transport of goods and mail by air transport, 2008-2010
2008. 2009. 2010. Prevezeni teret, tona 2.090 2.052 1.845 Freight transported, tones Prevezena pošta, tona 325 311 334 Mail transported, tones
Grafikon 55. Prevezena roba i pošta vazdušnim saobraćajem, 2008-2010. Graph 55. Transport of goods and mail by air transport, 2008-2010
Izvor: Tabela 43. Source: Table 43.
) Izvor podataka: Direkcija za civilno vazduhoplovstvo Bosne i Hercegovine
Data source: Directorate of Civil Aviataion of Bosnia and Herzegovina
91
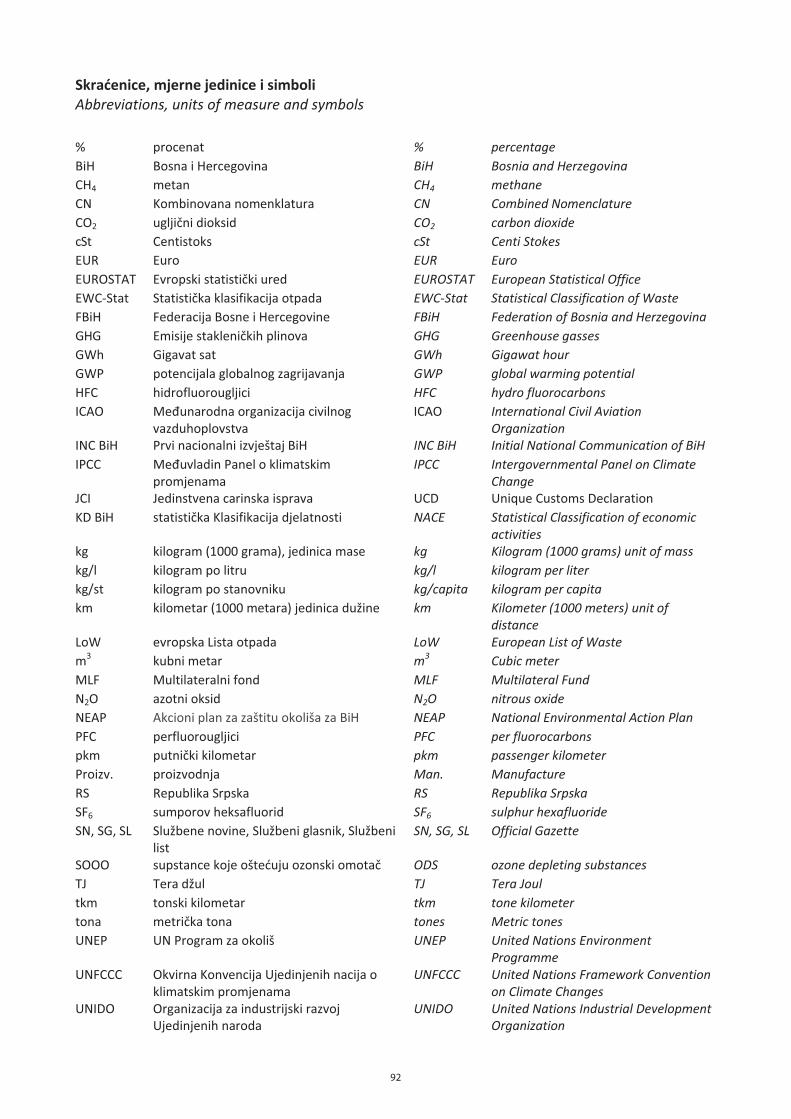
Skraćenice, mjerne jedinice i simboli Abbreviations, units of measure and symbols
% procenat % percentage BiH Bosna i Hercegovina BiH Bosnia and Herzegovina CH4 metan CH4 methane CN Kombinovana nomenklatura CN Combined Nomenclature CO2 ugljični dioksid CO2 carbon dioxide cSt Centistoks cSt Centi Stokes EUR Euro EUR Euro EUROSTAT Evropski statistički ured EUROSTAT European Statistical Office EWC-Stat Statistička klasifikacija otpada EWC-Stat Statistical Classification of Waste FBiH Federacija Bosne i Hercegovine FBiH Federation of Bosnia and Herzegovina GHG Emisije stakleničkih plinova GHG Greenhouse gasses GWh Gigavat sat GWh Gigawat hour GWP potencijala globalnog zagrijavanja GWP global warming potential HFC hidrofluorougljici HFC hydro fluorocarbons ICAO Međunarodna organizacija civilnog
vazduhoplovstva ICAO International Civil Aviation
Organization INC BiH Prvi nacionalni izvještaj BiH INC BiH Initial National Communication of BiH IPCC Međuvladin Panel o klimatskim
promjenama IPCC Intergovernmental Panel on Climate
Change JCI Jedinstvena carinska isprava UCD Unique Customs Declaration KD BiH statistička Klasifikacija djelatnosti NACE Statistical Classification of economic
activities kg kilogram (1000 grama), jedinica mase kg Kilogram (1000 grams) unit of mass kg/l kilogram po litru kg/l kilogram per liter kg/st kilogram po stanovniku kg/capita kilogram per capita km kilometar (1000 metara) jedinica dužine km Kilometer (1000 meters) unit of
distance LoW evropska Lista otpada LoW European List of Waste m3 kubni metar m3 Cubic meter MLF Multilateralni fond MLF Multilateral Fund N2O azotni oksid N2O nitrous oxide NEAP Akcioni plan za zaštitu okoliša za BiH NEAP National Environmental Action Plan PFC perfluorougljici PFC per fluorocarbons pkm putnički kilometar pkm passenger kilometer Proizv. proizvodnja Man. Manufacture RS Republika Srpska RS Republika Srpska SF6 sumporov heksafluorid SF6 sulphur hexafluoride SN, SG, SL Službene novine, Službeni glasnik, Službeni
list SN, SG, SL Official Gazette
SOOO supstance koje oštećuju ozonski omotač ODS ozone depleting substances TJ Tera džul TJ Tera Joul tkm tonski kilometar tkm tone kilometer tona metrička tona tones Metric tones UNEP UN Program za okoliš UNEP United Nations Environment
Programme UNFCCC Okvirna Konvencija Ujedinjenih nacija o
klimatskim promjenama UNFCCC United Nations Framework Convention
on Climate Changes UNIDO Organizacija za industrijski razvoj
Ujedinjenih naroda UNIDO United Nations Industrial Development
Organization
92
Izvori i literature Sources and literature
Eurostat, Uspostava operativne jedinice pod ESC (2003-2007)
Setting up an Operational Unit under the ESC (2003-2007)
Katalog otpada („Sl. Glasnik RS“, br.39/05) List of Waste from the "Official Gazette of the of RS", no. 39/05)
Pravilnik o kategorijama otpada sa listama "Sl.novine Federacije BiH" br. 9/05
List of Waste from the "Official Gazette of the Federation of BiH" no. 9 / 05
Prvi nacionalni izvještaj BiH u skladu sa Okvirnom konvencijom UN o klimatskim promjenama (UNFCCC)
Initial national communication of BiH under the UNFCCC
Statistička klasifikacija otpada Waste Statistics Classification Drugi pregeld stanja okoliša u BiH Second Environmental Performance Review BiH Pregled pravnog i institucionalnog okvira za zaštitu okoliša u Bosni i Hercegovini
Desk review of the legal and institutional framework of environmental protection in BiH
Priručnik za energetsku statistiku Energy Statistics Manual Rječnik za statistiku saobraćaja Glossary for transport statistics Bazelska konvencija Basel Convention Okvirna Konvencija Ujedinjenih nacija o klimatskim promjenama
United Nations Framework Convention on Climate Changes
93


![Untitled-1 [bhas.ba]bhas.ba/tematskibilteni/sps sr.pdfРеклама (реклама и пропаганда) и истраживање тржишта, подручје n – Административне](https://img.dokumen.tips/doc/110x75/5e5e8c0b63f4de7a321b7a1f/untitled-1-bhasbabhasbatematskibiltenisps-srpdf-.jpg)