Embed Size (px)
Citation preview

In Partnership With
Photo Courtesy Syncrude Canada Ltd.
Oil Sands Construction, Maintenance and Operations Labour Demand Outlook to 2023

May 2014 Page 2 of 60
Oil Sands Construction, Maintenance and Operations Labour Demand Outlook to 2023
OIL SANDS CONSTRUCTION, MAINTENANCE AND OPERATIONS LABOUR DEMAND OUTLOOK TO 2023
TABLE OF CONTENTS
Executive Summary ...................................................................... 3
Introduction ................................................................................... 9
Overview of Canada’s Oil Sands ................................................ 14
Oil Sands Construction, Maintenance and
Operations Workforce Requirements ......................................... 17
Aggregated Oil Sands Construction Labour
Demand (BuildForce Canada) ..................................................... 18
On-site Oil Sands Construction and Maintenance
Workforce Projections (OILMAP) ............................................... 20
Oil Sands Operations Labour Demand
(Petroleum HR Council) .............................................................. 27
Workforce Challenges For Oil Sands Construction,
Maintenance and Operations ...................................................... 42
Meeting Future Workforce Demands – Oil Sands
Construction and Operations ..................................................... 44
Conclusion ................................................................................... 46
Appendix 1: BuildForce Oil Sands Construction Sector
Labour Demand Methodology .................................................... 47
Appendix 2: OILMAP Methodology for Workforce
Projections for Oil Sands Construction and Maintenance ........ 49
Appendix 3: Petroleum HR Council Oil Sands
Operations Sector Labour Demand Methodology .................... 50
Appendix 4: Oil Sands Operations Workforce
Requirements to 2023 ................................................................. 51
Appendix 5: Glossary .................................................................. 54
List of Abbreviations ................................................................... 55
List of Tables ............................................................................... 56
List of Figures .............................................................................. 56
Endnotes ...................................................................................... 57
Acknowledgements ..................................................................... 59

May 2014 Page 3 of 60
Oil Sands Construction, Maintenance and Operations Labour Demand Outlook to 2023
EXECUTIVE SUMMARY
The oil sands sector remains a key economic and employment driver for Canada. Attracting and
retaining skilled workers for oil sands construction, maintenance and operations are critical to cost-
effective expansion. Nearly one-third of the economic benefits of oil sands investment will carry over
to other Canadian provinces, including economic gains from the spending of some $172 billion in
wages and salaries.1
Expansion-related hiring for both construction and oil
sands operations is projected to reach approximately
98,380 jobs over the next decade, and each of the
sectors face common challenges when addressing
skills shortages and meeting workforce demands.
To help stakeholders understand these challenges,
the Petroleum HR Council (a division of Enform
Canada); BuildForce Canada (formerly the
Construction Sector Council); Construction Owners
Association of Alberta (COAA); and the Government
of Alberta’s Ministry of Jobs, Skills, Training and
Labour (GoA) have combined efforts to produce the
Oil Sands Construction, Maintenance and
Operations Labour Demand Outlook to 2023.
This report presents three distinct models and is
intended to complement, not replace, the detailed
labour market projections and analysis offered by
each organization:
BuildForce Canada’s annual Construction
and Maintenance Looking Forward forecasts
GoA and COAA’s Oil Sands Information,
Labour Market Analysis and Projection
(OILMAP) workforce projection model
Petroleum HR Council’s Oil Sands Labour
Demand model
The first two models project numbers for construction
labour demand. BuildForce’s model captures the
need for off-site and on-site construction workers and
analyzes production numbers from CAPP’s Crude Oil
Forecast, Markets & Transportation2 outlook to build
its projections. OILMAP’s model is driven by current
and announced (planned) oil sands construction
projects, and data (for on-site workers only) collected
from oil and gas companies.
The Petroleum HR Council’s model covers operations
labour demand and also uses production numbers
from CAPP’s Crude Oil Forecast as inputs to its model.
Similar to CAPP’s oil sands production forecast, the
Petroleum HR Council’s projections are available by
operation type: in situ, mining and upgrading.
Because the inputs into each model are slightly
different, it is not possible to derive cumulative
labour demand; however, this data can assist oil
sands companies with workforce development
planning by highlighting trends and labour demand
at an occupational level. The combined look at
BuildForce, OILMAP and the Petroleum HR
Council’s respective labour demand projections
into a single report provides the most reliable,
comprehensive picture of oil sands construction,
maintenance and operations workforce requirements
currently available.
May 2014 Page 4 of 60
Oil Sands Construction, Maintenance and Operations Labour Demand Outlook to 2023
OIL SANDS CONSTRUCTION, MAINTENANCE AND OPERATIONS WORKFORCE REQUIREMENTS
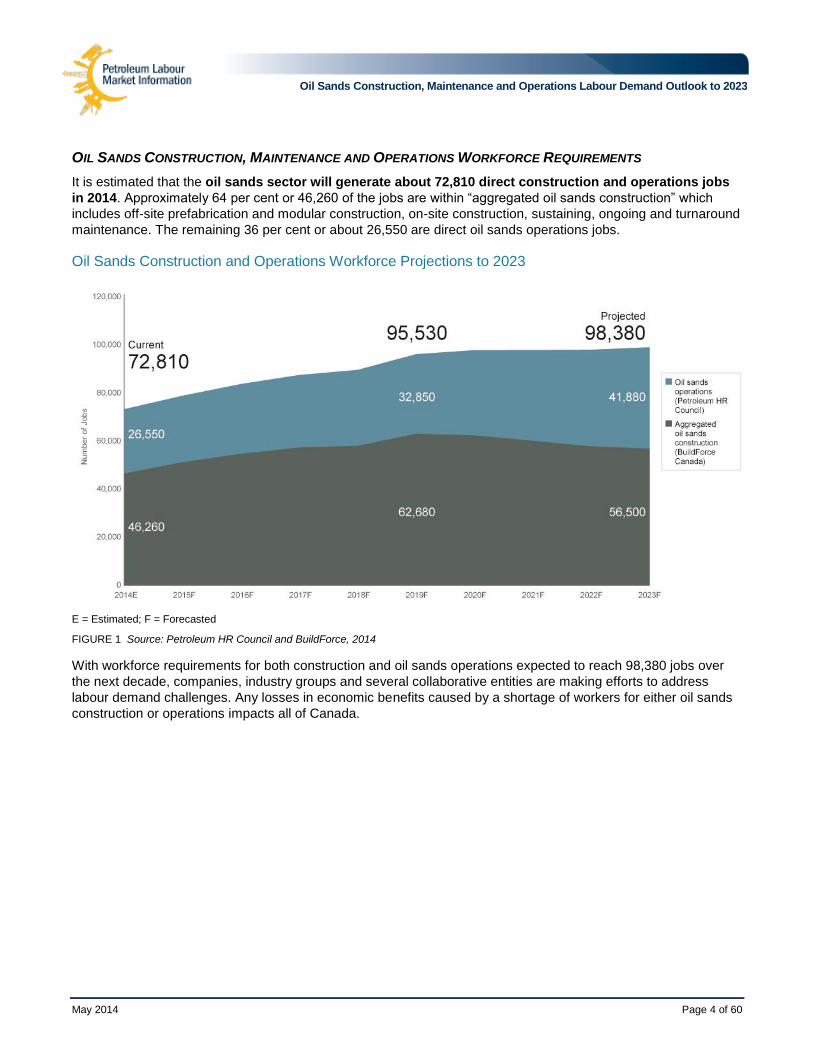
It is estimated that the oil sands sector will generate about 72,810 direct construction and operations jobs
in 2014. Approximately 64 per cent or 46,260 of the jobs are within “aggregated oil sands construction” which
includes off-site prefabrication and modular construction, on-site construction, sustaining, ongoing and turnaround
maintenance. The remaining 36 per cent or about 26,550 are direct oil sands operations jobs.
Oil Sands Construction and Operations Workforce Projections to 2023
E = Estimated; F = Forecasted
FIGURE 1 Source: Petroleum HR Council and BuildForce, 2014
With workforce requirements for both construction and oil sands operations expected to reach 98,380 jobs over
the next decade, companies, industry groups and several collaborative entities are making efforts to address
labour demand challenges. Any losses in economic benefits caused by a shortage of workers for either oil sands
construction or operations impacts all of Canada.

May 2014 Page 5 of 60
Oil Sands Construction, Maintenance and Operations Labour Demand Outlook to 2023
AGGREGATED OIL SANDS CONSTRUCTION (BUILDFORCE CANADA)
Job creation in the oil sands construction sector will be significant over the next five years. Based on the current
oil sands production forecast, the average annual aggregated oil sands construction workforce requirements
will peak3 in 2019 at about 62,680 workers – an increase of 16,420 jobs or a 35 per cent increase over 2014
employment levels. The oil sands construction workforce is currently projected to decrease after 2019 but this will
change if additional oil sands expansion is announced.
BuildForce – Aggregated Oil Sands Construction Workforce Projections to 2023
E = Estimated; F = Forecasted
FIGURE 2 Source: BuildForce Canada, 2014
For aggregated oil sands construction, the top five occupations make-up over 50 per cent of the workforce at the
peak in 2019. These occupations also account for over 50 per cent of new jobs created between 2014 and 2019.
BUILDFORCE – TOP FIVE AGGREGATED OIL SANDS CONSTRUCTION LABOUR DEMAND & WORKFORCE AT PEAK (2019)
Occupation Estimated
Employment in 2014
Estimated Employment at
Peak (2019)
Increase in Number of
Jobs (2015-2019)
Per Cent of Peak Workforce
Total BuildForce Trades Occupations 46,260 62,680 16,420 100%
1 Contractors and supervisors 6,370 8,635 2,265 14%
2 Steamfitters, pipefitters and plumbers 6,105 8,275 2,170 13%
3 Electricians 5,595 7,585 1,990 12%
4 Trades helpers and labourers 3,700 5,015 1,315 8%
5 Carpenters (including scaffolders) 3,285 4,450 1,165 7%
TABLE 1 Source: BuildForce Canada, 2014.

May 2014 Page 6 of 60
Oil Sands Construction, Maintenance and Operations Labour Demand Outlook to 2023
ON-SITE CONSTRUCTION, TURNAROUND AND ONGOING MAINTENANCE (OILMAP)
OILMAP provides insight into the construction and maintenance occupations required to be on-site at oil sands
key operating areas. OILMAP’s model has been designed to look at the annual peak demands associated with
three distinct activities: construction, turnaround maintenance and ongoing maintenance.
The workforce required for on-site oil sands construction, turnaround and ongoing maintenance will be
around 48,710 workers in 2014 and will increase to about 56,900 jobs in 2020, a 17 per cent increase over
2014 levels. The workforce will peak at about 59,390 jobs in 2019.
OILMAP – Oil Sands On-Site Construction, Turnaround and Ongoing Maintenance Employment to 2020
E = Estimated; F = Forecasted
FIGURE 3 Source: OILMAP, 2014
TABLE 2 Source: OILMAP, 2014
OILMAP – TOP FIVE ON-SITE OIL SANDS CONSTRUCTION, TURNAROUND AND ONGOING MAINTENANCE EMPLOYMENT AT PEAK (2019)
Occupation Estimated
Employment in 2014
Estimated Employment
at Peak (2019)
Increase in Number of
Jobs (2015-2019)
Per Cent of 2014 Workforce
Total OILMAP Trades Occupations 37,680 58,840 21,160 56%
1 Pipefitters 6,480 11,265 4,785 74%
2 Boilermakers 5,045 9,670 4,625 92%
3 Carpenters 3,970 6,750 2,780 70%
4 Electricians 3,030 4,765 1,735 57%
5 Labourers 7,165 9,150 1,985 28%
May 2014 Page 7 of 60
Oil Sands Construction, Maintenance and Operations Labour Demand Outlook to 2023
OIL SANDS OPERATIONS LABOUR DEMAND (PETROLEUM HR COUNCIL)
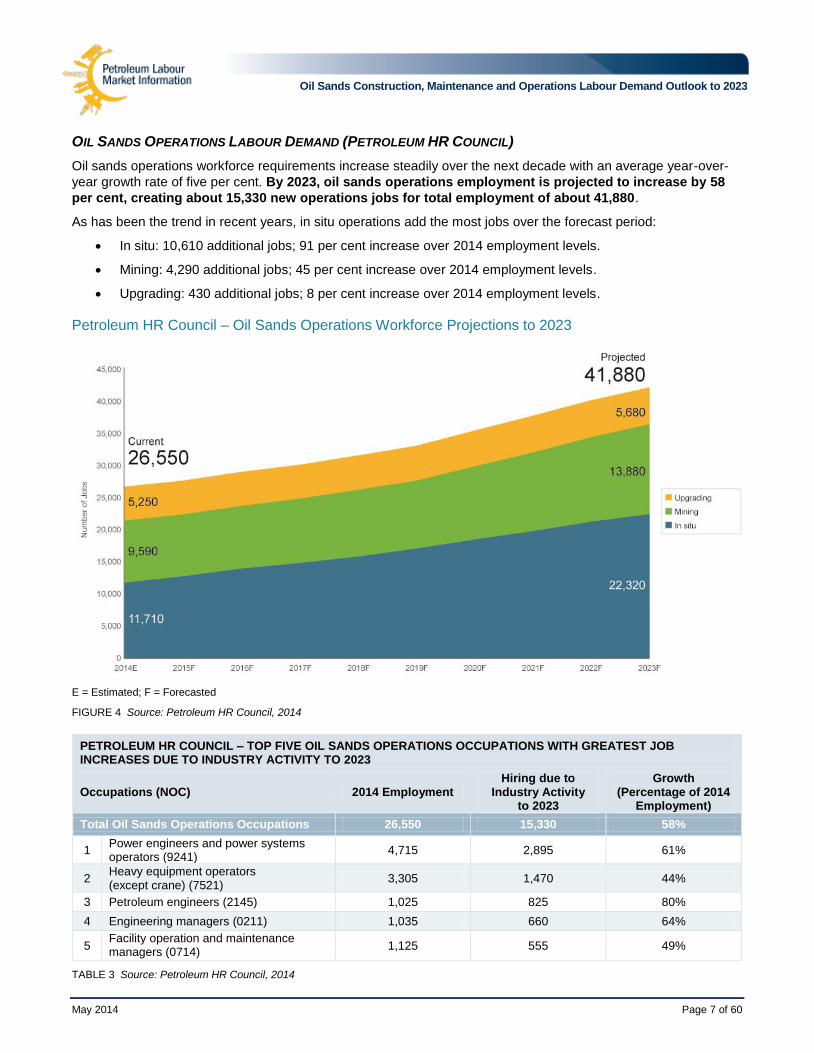
Oil sands operations workforce requirements increase steadily over the next decade with an average year-over-
year growth rate of five per cent. By 2023, oil sands operations employment is projected to increase by 58
per cent, creating about 15,330 new operations jobs for total employment of about 41,880.
As has been the trend in recent years, in situ operations add the most jobs over the forecast period:
In situ: 10,610 additional jobs; 91 per cent increase over 2014 employment levels.
Mining: 4,290 additional jobs; 45 per cent increase over 2014 employment levels.
Upgrading: 430 additional jobs; 8 per cent increase over 2014 employment levels.
Petroleum HR Council – Oil Sands Operations Workforce Projections to 2023
E = Estimated; F = Forecasted
FIGURE 4 Source: Petroleum HR Council, 2014
PETROLEUM HR COUNCIL – TOP FIVE OIL SANDS OPERATIONS OCCUPATIONS WITH GREATEST JOB INCREASES DUE TO INDUSTRY ACTIVITY TO 2023
Occupations (NOC) 2014 Employment Hiring due to
Industry Activity to 2023
Growth (Percentage of 2014
Employment)
Total Oil Sands Operations Occupations 26,550 15,330 58%
1 Power engineers and power systems operators (9241)
4,715 2,895 61%
2 Heavy equipment operators (except crane) (7521)
3,305 1,470 44%
3 Petroleum engineers (2145) 1,025 825 80%
4 Engineering managers (0211) 1,035 660 64%
5 Facility operation and maintenance managers (0714)
1,125 555 49%
TABLE 3 Source: Petroleum HR Council, 2014

May 2014 Page 8 of 60
Oil Sands Construction, Maintenance and Operations Labour Demand Outlook to 2023
In addition to support new jobs created due to
industry expansion, age-related attrition has the
potential to drive a significant number of job
openings within oil sands operations over the next
decade. Approximately 6,380 jobs or 24 per cent
of 2014 employment levels are eligible for
retirement during the projection period.
WORKFORCE CHALLENGES FOR OIL SANDS
CONSTRUCTION, MAINTENANCE AND OPERATIONS
An unemployment rate of 4.9 per cent4 is an
indicator that Alberta is experiencing a tight labour
market, which exacerbates the task of addressing
labour demand for oil sands construction,
maintenance and operations.
Construction spending and labour demand
requirements are up across Canada, adding to the
challenges of meeting workforce requirements for
the foreseeable future. Major resource, infrastructure
and engineering projects in other provinces will
compete for the same key trades and occupations
that are in high demand in Alberta.
The growing demand for maintenance and
sustaining capital projects in Alberta’s existing major
industrial facilities will contribute to the labour supply
challenges within the construction sector. For oil
sands operations, shortages will be especially acute
for occupations requiring specialized training, as well
as occupations that are in demand in other
industries including construction. The challenges of
a competitive labour environment and shortages of
specific skills are worsened by an aging workforce
for both the construction and operations sectors.
Many oil sands project owners have multiple projects
planned (e.g., oil sands, LNG, offshore) and they
are susceptible to the cumulative risks of labour
shortages. There is a significant upside to investing
in increasing the pool of qualified construction and
operations labour, rather than the alternative, where
different companies compete for workers.
MEETING FUTURE WORKFORCE DEMANDS – OIL
SANDS CONSTRUCTION AND OPERATIONS
The need for collaborative action is required in the
construction and oil and gas industries to increase
the workforce and address labour requirements.
This report is a prime example of the oil sands
sector, industrial construction sector, provincial
government and industry associations collaborating
to provide robust labour market analysis and
information to mitigate workforce challenges.
Initiatives aimed at enhancing the supply of skilled
workers to support the future hiring needs of oil
sands construction and operations include:
Attracting and retaining workforce groups that
are under-represented in the construction and
oil sands operations sectors.
Recruiting workers from across Canada and
internationally to augment local labour supply.
Improving productivity through the use of
fabrication facilities and modular assembly
yards and advances in construction
workforce procurement and training. Owner
companies are taking a “cookie cutter” or
manufacturing approach by constructing
large projects in smaller, repeatable phases
and pre-building sites for future expansion.
Investing in talent management, including
career development and succession
planning programs and competency-based
programs to assist with shortening the “time
to productivity” for new hires.

May 2014 Page 9 of 60
Oil Sands Construction, Maintenance and Operations Labour Demand Outlook to 2023
INTRODUCTION
The oil sands sector continues to demonstrate resiliency and remain a key economic and employment
driver for Canada. Alberta’s economy and employment consistently outperformed the rest of Canada.5
The construction and oil sands operations sectors were key contributors to job creation. This is despite
the fact that the oil sands sector has not seen significant developments to address key business
constraints such as market diversification and securing capital.6 Attracting and retaining a skilled
workforce for oil sands construction and operations remain critical to cost-effective expansion.
Market diversification remains a top priority as the
United States, Canada’s primary oil customer,
continues to increase its own oil production and
decrease its reliance on imports from Canada.
Pipeline projects that will transport oil to other
geographic areas are progressing but final approvals
are still pending. In the meantime, the sector is using
rail and trucking to transport production to market.
The number of carloads of oil moving by rail
increased 75 per cent between 2012 and 2013.7
New federal rules and increased scrutiny on foreign
investment affected the level of investment and
merger and acquisition activity in 2013 bringing it to
low levels experienced in 2004.8 In 2014 some large
projects have moved forward, including the approval
of the Fort Hills mine; a 180,000 barrels per day
Suncor Energy Inc. operated joint venture with Total
E&P Canada Ltd. and Teck Resources Limited.9
While at the same time, some smaller start-up
operations have struggled to secure capital and are
openly examining strategic and financial alternatives
to ensure project viability.
In response to changing demographics and the
pace of industry activity, focused attraction, retention
and development of workers for the construction
and operations of oil sands is now the new normal.
The industrial construction industry and the oil sands
sector are linked by the multi-year, multi-phase
construction strategy used by oil sands companies
to expand their operations. In addition, the need for
ongoing and scheduled turnaround maintenance
has resulted in a common quest for a productive
labour force.
A shortage of workers for either oil sands
construction or operations impacts all of
Canada. Nearly one-third of the economic
benefits of oil sands investment will accrue to
other Canadian provinces including economic
gains from the spending of some $172 billion
in wages and salaries.10
“Worker shortages have inflationary
implications, including cost increases for
construction projects and increased project
execution risk, and could impact the private
sector’s ability to attract investment.”
– Canadian Association of Petroleum Producers. Oil and
natural gas industry supports budget measures for
improved access to skilled trades training and building
future workforce. February 12, 2014.11
Labour market information (LMI) can serve
as a powerful tool to assist oil sands partners
with workforce development planning. To help
stakeholders to understand the most serious risks
associated with oil sands construction, maintenance
and operations labour shortages, the Petroleum HR
Council (a division of Enform Canada); BuildForce
Canada12
; Construction Owners Association of
Alberta (COAA); and the Government of Alberta’s
Ministry of Jobs, Skills, Training and Labour (GoA)
have worked together to produce the Oil Sands
Construction, Maintenance and Operations Labour
Demand Outlook to 2023. This year’s report will
replace the Petroleum HR Council’s annual Oil Sands
Outlook to provide broadened labour demand
projections, insights into workforce trends and
information on potential labour solutions for oil
sands construction, operations and ongoing and
turnaround maintenance.
This report aims to increase understanding of the
occupational demand and workforce trends for oil
sands construction and operations by compiling
information and data from each source. It is intended
to complement, not replace, the detailed labour
market projections and analysis offered by each
organization by looking at the workforce required
to support an industry sector that has proven to
be a key contributor to the well-being of the
Canadian economy.

May 2014 Page 10 of 60
Oil Sands Construction, Maintenance and Operations Labour Demand Outlook to 2023
This report presents three separate labour demand
modelling systems:
BuildForce Canada’s annual Construction
and Maintenance Looking Forward forecasts
GoA and COAA’s Oil Sands Information,
Labour Market Analysis and Projection
(OILMAP) workforce projection model
Petroleum HR Council’s Oil Sands Labour
Demand model
The report begins with an overview of the scope
and methodology for each model (BuildForce,
OILMAP and Petroleum HR Council) and then
provides highlights of their respective workforce
projections. Where possible, consolidated tables
and graphs have been developed.
Quantitative data may overlap in some instances
because three distinct models are presented. The
quantitative data is useful for highlighting trends and
labour demand at an occupational level but should
not be used to calculate cumulative labour demand.
Summary analysis and observations on workforce
solutions are offered by the Petroleum HR Council.
Further information on BuildForce’s and Petroleum
HR Council’s labour market products can be
obtained from their websites. Additional information
on OILMAP is included in Appendix 2.
OVERVIEW OF SCOPE AND METHODOLOGY
BuildForce, OILMAP and the Petroleum HR Council employ similar labour demand models as they all analyze
the relationship between oil sands production and their in-scope occupations to project workforce requirements.
Although the oil sands production forecasts used as inputs are slightly different, this consolidated report provides
the most reliable, comprehensive picture of oil sands construction, maintenance and operations workforce
requirements currently available.
The following is a summary of each of the three labour demand methodologies used to produce the Oil Sands
Construction, Maintenance & Operations Labour Demand to 2023. Detailed methodology descriptions can be
found in Appendices 1, 2 and 3.
BUILDFORCE METHODOLOGY
BuildForce publishes the outlook report Construction and Maintenance Looking Forward for the oil sands
sector, which covers off-site prefabrication and modular construction, on-site construction, maintenance
and sustaining capital work. BuildForce’s methodology compares the Canadian Association of Petroleum
Producers’ (CAPP) annual Crude Oil Forecast, Markets & Transportation outlook with other industry data
sources, such as the Alberta Government’s Alberta Oil Sands Quarterly Update, which details the expected
start date for operations and the production targets by project. BuildForce then estimates the construction
investment necessary to meet oil sands production targets and the model converts construction investment
into labour requirements. BuildForce’s Alberta Labour Market Information Committee completes the final
review of the oil sands construction investment and employment forecast.

May 2014 Page 11 of 60
Oil Sands Construction, Maintenance and Operations Labour Demand Outlook to 2023
OILMAP METHODOLOGY
OILMAP projects the trades workforce required on-site to construct and maintain oil sands operations. OILMAP
does not include manager or supervisor roles. OILMAP’s model includes only construction trades. Consequently,
these occupations as well as others are a part of the occupational scope for BuildForce projections.
OILMAP determines on-site construction workforce requirements by analyzing data from oil sands companies
to establish the relationship between the following:
different types of construction trades
project type (mining, in situ and upgrading)
project size (production capacity)
Input from oil sands companies on the type, timing and capacity of their projects allows OILMAP to determine
on-site construction workforce requirements by trade. OILMAP’s workforce projection for turnarounds and
ongoing maintenance is driven by historical workforce data provided by the General Presidents’ Maintenance
Committee for Canada and the National Maintenance Council for Canada. The OILMAP methodology relies
on input and validation from industry groups including Alberta Council of Turnarounds Industry Maintenance
Stakeholders (ACTIMS), Rose Committee, COAA and individual oil sands companies.
PETROLEUM HR COUNCIL METHODOLOGY
The Petroleum HR Council’s oil sands labour demand model estimates the operations workforce required to
support industry expansion. It calculates the number of workers required by occupation to realize projected
production increases. Similar to BuildForce, the Petroleum HR Council also uses CAPP’s Crude Oil Forecast as
a key indicator for industry expansion. Like CAPP’s oil sands production forecast, the Petroleum HR Council’s
projections are available by operation type: in situ, mining and upgrading.
The Petroleum HR Council’s model also calculates age-related attrition of the oil sands workforce by
comparing occupation-specific age of retirement to the age demographic of industry’s core occupations.
Net hiring requirements are determined by adding the labour demand required to support industry expansion
and age-related attrition.
IN-SCOPE OCCUPATIONS
The quantitative labour demand projections provided
by BuildForce, OILMAP and the Petroleum HR
Council provide workforce requirements and
analysis for 64 different occupations, as defined by
the National Occupational Classification (NOC):13
Aggregated oil sands construction: 23
occupations required for off-site
prefabrication and modular construction, on-
site construction, maintenance and
sustaining capital work14
as provided by
BuildForce.15
On-site oil sands construction and
maintenance: 16 occupations required on-
site to construct and maintain oil sands
operations as provided by OILMAP.16
Oil sands operations: 52 occupations hired
by oil sands companies for on-site and head
office operations as provided by the
Petroleum HR Council.17
Additionally, an
“other occupations” category captures any
residual occupations and ensures the total
oil sands workforce is incorporated.
The Petroleum HR Council defines the oil sands
operations sector as the extraction, production and
upgrading of bitumen, which is broken down into the
following operation types:
Mining: activities to explore and recover oil
sands reserves through open pit mines.
In situ: activities to explore and recover
oil sands reserves in place or in situ, by
drilling wells.
Upgrading: converting bitumen into a
product with a lower density and viscosity.

May 2014 Page 12 of 60
Oil Sands Construction, Maintenance and Operations Labour Demand Outlook to 2023
IN-SCOPE OIL SANDS CONSTRUCTION, MAINTENANCE AND OPERATIONS OCCUPATIONS
Occupation (NOC)
BuildForce
(Aggregated Oil Sands
Construction)
OILMAP
(On-site Oil Sands
Construction & Maintenance)
Petroleum HR Council
(Oil Sands Operations)
1 Automotive service technicians, truck and bus mechanics and mechanical repairers (7321)
•
2 Boilermakers (7234) • • 3 Bricklayers (primarily refractory) (7281) • 4 Carpenters (7271) • • 5 Cement masons/Concrete finishers (7282) • • 6 Chemical engineers (2134) • 7 Chemical technologists and technicians (2211) • 8 Civil engineering technologists and technicians (2231) • 9 Civil engineers (2131) • 10 Construction estimators (2234) • • 11 Construction managers (0711) • • 12 Construction millwrights and industrial mechanics (7311) • • •
13 Contractors and supervisors, trades and related
occupations18
(7202, 7302, 7201, 7301, 7203) • •
14 Crane operators (7371) • • • 15 Drafting technologists and technicians (2253) • 16 Drillers and blasters (7372) •
17 Electrical and electronics engineering technologists and technicians (2241) •
18 Electrical and electronics engineers (2133) • 19 Electrical power line and cable workers (7244) • 20 Engineering managers (0211) • 21 Facility operation and maintenance managers (0714) • 22 Geological and mineral technologists and technicians (2212) • 23 Geological engineers (2144) • 24 Geoscientists and oceanographers (2113) • 25 Heavy equipment operators (except crane) (7521) • • • 26 Heavy-duty equipment mechanics (7312) • • 27 Industrial and manufacturing engineers (2141) • 28 Industrial electricians (7242) • • •
29 Industrial engineering and manufacturing technologists and technicians (2233) •
30 Industrial instrument technicians and mechanics (2243) • • •
31 Inspectors in public and environmental health and occupational health and safety (2263) •
32 Insulators (7293) • • 33 Ironworkers (7236) • • 34 Land survey technologists and technicians (2254) •

May 2014 Page 13 of 60
Oil Sands Construction, Maintenance and Operations Labour Demand Outlook to 2023
IN-SCOPE OIL SANDS CONSTRUCTION, MAINTENANCE AND OPERATIONS OCCUPATIONS
Occupation (NOC)
BuildForce
(Aggregated Oil Sands
Construction)
OILMAP
(On-site Oil Sands
Construction & Maintenance)
Petroleum HR Council
(Oil Sands Operations)
35 Machinists and machining and tooling inspectors (7231) • 36 Managers in natural resources production and fishing (0811) •
37 Mechanical engineering technologists and technicians (2232) •
38 Mechanical engineers (2132) • 39 Metallurgical and materials engineers (2142) • 40 Mining engineers (2143) •
41 Natural and applied science policy researchers, consultants and program officers (4161) •
42 Non-destructive testers and inspection technicians (2261) • 43 Oil and gas drilling, servicing, and related labourers (8615) • 44 Other automotive mechanical installers and servicers (7535) • 45 Painters (7294) • • 46 Petroleum engineers (2145) • 47 Petroleum, gas, and chemical process operator (9232) • 48 Power engineers and power systems operators (9241) • 49 Power system electricians (7243) • 50 Production logistics co-ordinators (1523) •
51 Professional occupations in advertising, marketing and public relations (1123) •
52 Purchasing agents and officers (1225) • 53 Purchasing and inventory control workers (1524) • 54 Purchasing managers (0113) • 55 Scaffolders (7611) • • 56 Sheet metal workers (7233) • 57 Shippers and receivers (1521) •
58 Steamfitters, pipefitters and sprinkler system installers (7252) • • •
59 Supervisors, mining and quarrying (8221) •
60 Supervisors, supply chain, tracking and scheduling co-ordination occupations (1215) •
61 Trades helpers and labourers (7611) • • 62 Truck drivers (7511) • • 63 Water and waste treatment plant operators (9243) • 64 Welders and related machine operators (7237) • • • 65 Other occupations • •
TABLE 4

May 2014 Page 14 of 60
Oil Sands Construction, Maintenance and Operations Labour Demand Outlook to 2023
OVERVIEW OF CANADA’S OIL SANDS
The majority of Canada’s oil sands deposits and all of its current operations are located in Alberta.
Although the Athabasca deposit near Fort McMurray is the largest and the most well-known, the Cold
Lake deposit has also undergone significant development in recent years. Peace River is the province’s
smallest oil sands deposit with five small projects currently operating, three other pilot/demonstration
projects either approved or under-construction and one larger 40,000 barrel per day project under
construction.19
Figure 5 illustrates the oil sands key operations areas.20
Oil Sands Key Operating Areas
FIGURE 5
OIL SANDS CONSTRUCTION
Oil sands construction activities include off-site
prefabrication and modular construction, on-site
construction, and maintenance and sustaining
capital work.
Off-site prefabrication and modular construction
involves the building of oil sands operations modules
in a plant setting where construction, assembly,
testing and pre-commissioning can occur in a
controlled environment. Modules are then
transported to the operations site for final assembly.
In Alberta, the majority of off-site pre-fabrication
and modular construction for the oil sands sector
takes place in the Edmonton region, so it is closer to
oil sands operations, making transportation easier.
Some oil sands fabrication and modularization
also occurs outside of Alberta and in some cases,
outside of Canada.
On-site construction involves the assembly and
construction work that needs to be completed in the
field. In Alberta, on-site oil sands construction takes

May 2014 Page 15 of 60
Oil Sands Construction, Maintenance and Operations Labour Demand Outlook to 2023
place in the same locations as ongoing operations:
Athabasca, Cold Lake and Peace River regions.
Operations also require ongoing maintenance and
large-scale shutdown or “turnarounds” of plants for
maintenance and equipment replacement to ensure
the operations are as efficient as possible. Again,
ongoing and turnaround maintenance occur at the
operation site.
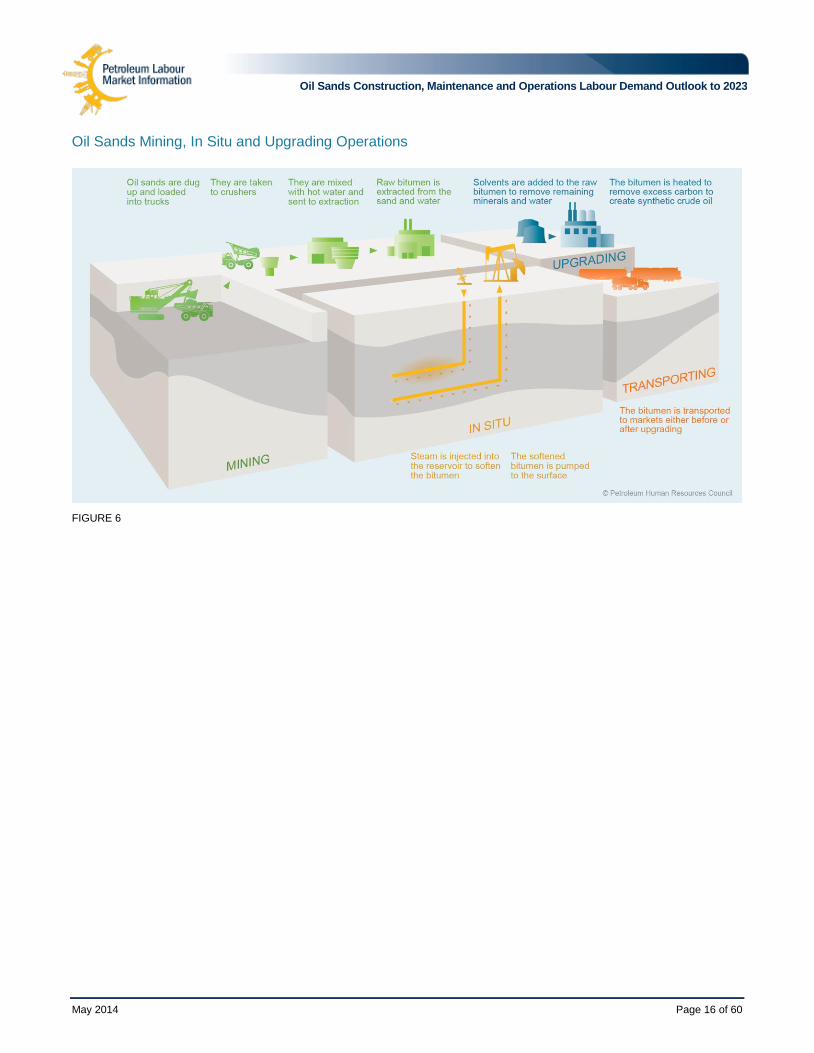
OIL SANDS OPERATIONS
Since 1967, Canada has been commercially
producing oil from the oil sands. Initially, bitumen
was extracted using huge shovels and trucks and
open-pit mining techniques. However, only 20 per
cent of Canada’s known oil sands resource is close
enough to the surface to be mined.
The other 80 per cent of Canada’s oil sands resource
is deeper or in situ and requires different extraction
technologies, such as steam-assisted gravity
drainage (SAGD), to bring the bitumen to the surface.
As the name suggests, steam is used in SAGD to
soften the bitumen so it can be pumped to the
surface. In many ways, SAGD is similar to
conventional oil production in that it uses
horizontal drilling and wells.
Upgrading is a process manufacturing operation
that converts bitumen into a product similar to light
conventional oil. It also produces a number of other
useful by-products, such as sulphur which is used
in the manufacturing of fertilizers, pharmaceuticals
and other products.
Figure 6 illustrates the three distinct types of
operations within the oil sands sector.
Photo Courtesy Suncor Energy Inc.
May 2014 Page 16 of 60
Oil Sands Construction, Maintenance and Operations Labour Demand Outlook to 2023
Oil Sands Mining, In Situ and Upgrading Operations
FIGURE 6

May 2014 Page 17 of 60
Oil Sands Construction, Maintenance and Operations Labour Demand Outlook to 2023
OIL SANDS CONSTRUCTION, MAINTENANCE AND OPERATIONS WORKFORCE REQUIREMENTS
Current
It is estimated the oil sands sector will generate
about 72,810 direct construction and operations
jobs in 2014. Approximately 46,260 or 64 per cent
of the jobs are within “aggregated oil sands
construction” which includes off-site prefabrication
and modular construction, on-site construction,
ongoing and turnaround maintenance. The
remaining 36 per cent or about 26,550 are direct oil
sands operations jobs.
Peak
Based on current oil sands production forecasts, the
oil sands construction workforce will peak in 2019.
Between 2014 and 2019, the sector will require
16,420 additional workers, a 35 per cent increase
over 2014 employment levels. Currently, the oil
sands construction workforce is projected to
decrease after 2019, as new capital investment
slows, but this will change if additional oil sands
expansion projects are announced.
Projected
Oil sands operations demand increases steadily
throughout the forecast period. By 2023 an
additional 15,330 positions will be required to
support new oil sands production, a 58 per cent
increase over 2014 employment levels.
Figure 7 consolidates oil sands construction,
maintenance and operations workforce projections
to 2023.
Total Oil Sands Construction and Operations Workforce Projections to 2023
E = Estimated F = Forecasted
FIGURE 7 Source: Petroleum HR Council and BuildForce, 2014
May 2014 Page 18 of 60
Oil Sands Construction, Maintenance and Operations Labour Demand Outlook to 2023
AGGREGATED OIL SANDS CONSTRUCTION LABOUR DEMAND (BUILDFORCE CANADA)
The following section is the analysis for aggregated oil sands construction labour demand based on
BuildForce Canada’s labour market model.
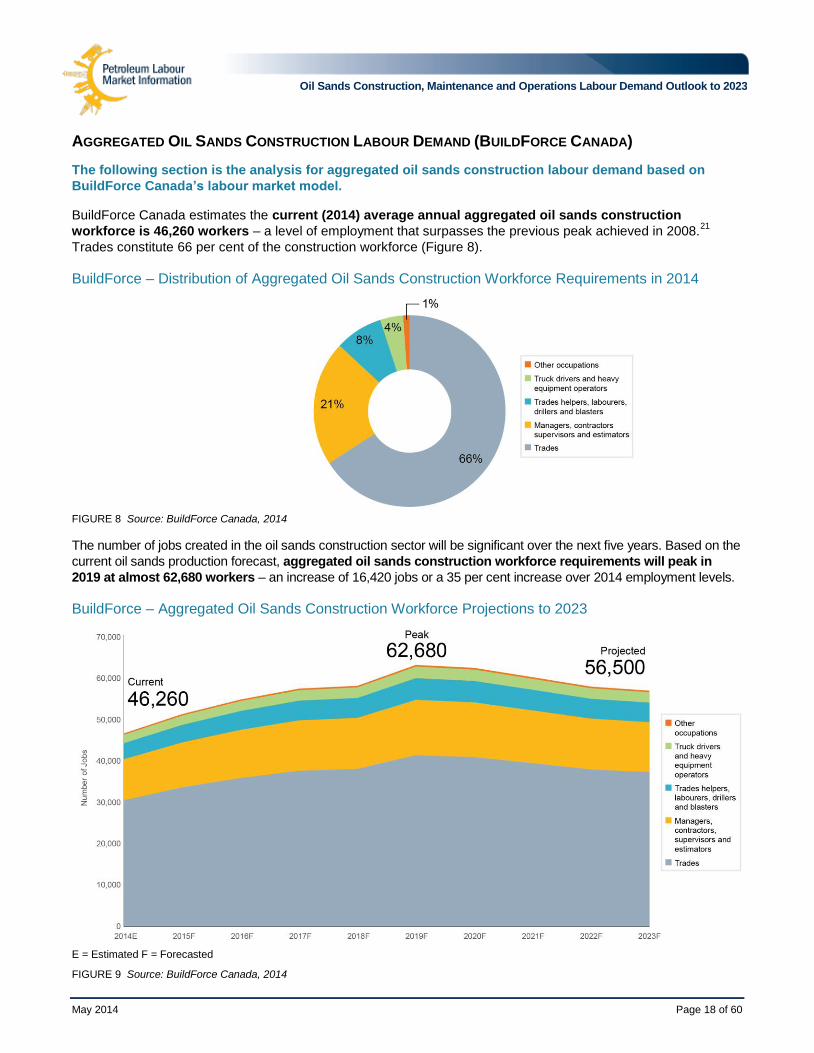
BuildForce Canada estimates the current (2014) average annual aggregated oil sands construction
workforce is 46,260 workers – a level of employment that surpasses the previous peak achieved in 2008.21
Trades constitute 66 per cent of the construction workforce (Figure 8).
BuildForce – Distribution of Aggregated Oil Sands Construction Workforce Requirements in 2014
FIGURE 8 Source: BuildForce Canada, 2014
The number of jobs created in the oil sands construction sector will be significant over the next five years. Based on the
current oil sands production forecast, aggregated oil sands construction workforce requirements will peak in
2019 at almost 62,680 workers – an increase of 16,420 jobs or a 35 per cent increase over 2014 employment levels.
BuildForce – Aggregated Oil Sands Construction Workforce Projections to 2023
E = Estimated F = Forecasted
FIGURE 9 Source: BuildForce Canada, 2014
May 2014 Page 19 of 60
Oil Sands Construction, Maintenance and Operations Labour Demand Outlook to 2023
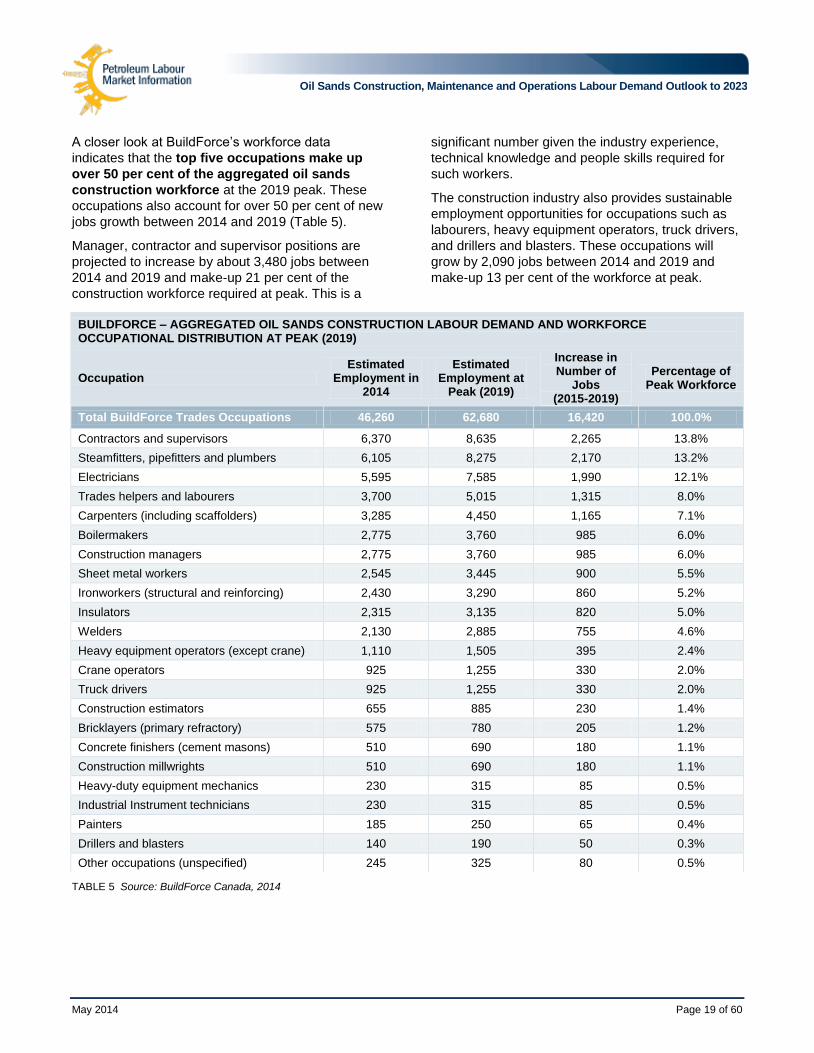
A closer look at BuildForce’s workforce data
indicates that the top five occupations make up
over 50 per cent of the aggregated oil sands
construction workforce at the 2019 peak. These
occupations also account for over 50 per cent of new
jobs growth between 2014 and 2019 (Table 5).
Manager, contractor and supervisor positions are
projected to increase by about 3,480 jobs between
2014 and 2019 and make-up 21 per cent of the
construction workforce required at peak. This is a
significant number given the industry experience,
technical knowledge and people skills required for
such workers.
The construction industry also provides sustainable
employment opportunities for occupations such as
labourers, heavy equipment operators, truck drivers,
and drillers and blasters. These occupations will
grow by 2,090 jobs between 2014 and 2019 and
make-up 13 per cent of the workforce at peak.
TABLE 5 Source: BuildForce Canada, 2014
BUILDFORCE – AGGREGATED OIL SANDS CONSTRUCTION LABOUR DEMAND AND WORKFORCE OCCUPATIONAL DISTRIBUTION AT PEAK (2019)
Occupation Estimated
Employment in 2014
Estimated Employment at
Peak (2019)
Increase in Number of
Jobs (2015-2019)
Percentage of Peak Workforce
Total BuildForce Trades Occupations 46,260 62,680 16,420 100.0%
Contractors and supervisors 6,370 8,635 2,265 13.8%
Steamfitters, pipefitters and plumbers 6,105 8,275 2,170 13.2%
Electricians 5,595 7,585 1,990 12.1%
Trades helpers and labourers 3,700 5,015 1,315 8.0%
Carpenters (including scaffolders) 3,285 4,450 1,165 7.1%
Boilermakers 2,775 3,760 985 6.0%
Construction managers 2,775 3,760 985 6.0%
Sheet metal workers 2,545 3,445 900 5.5%
Ironworkers (structural and reinforcing) 2,430 3,290 860 5.2%
Insulators 2,315 3,135 820 5.0%
Welders 2,130 2,885 755 4.6%
Heavy equipment operators (except crane) 1,110 1,505 395 2.4%
Crane operators 925 1,255 330 2.0%
Truck drivers 925 1,255 330 2.0%
Construction estimators 655 885 230 1.4%
Bricklayers (primary refractory) 575 780 205 1.2%
Concrete finishers (cement masons) 510 690 180 1.1%
Construction millwrights 510 690 180 1.1%
Heavy-duty equipment mechanics 230 315 85 0.5%
Industrial Instrument technicians 230 315 85 0.5%
Painters 185 250 65 0.4%
Drillers and blasters 140 190 50 0.3%
Other occupations (unspecified) 245 325 80 0.5%

May 2014 Page 20 of 60
Oil Sands Construction, Maintenance and Operations Labour Demand Outlook to 2023
ON-SITE OIL SANDS CONSTRUCTION AND MAINTENANCE WORKFORCE PROJECTIONS (OILMAP)
The following section is a summary of the trade workforce requirements produced by OILMAP for on-site
oil sands construction, turnaround and ongoing maintenance between 2014 and 2020.
OILMAP provides insight into the construction and
maintenance trades required to be physically on site
at oil sands key operating areas. OILMAP’s model
examines the annual peak demands associated with
three distinct activities: construction, turnaround
maintenance and ongoing maintenance.
ON-SITE CONSTRUCTION
On-site oil sands construction refers to the building
of new industrial infrastructure at oil sands
operations sites to support production expansion.
The OILMAP model has the capability to project
workforce requirements for on-site construction by
operations type: mining, in situ and upgrading. New
and expanding in situ projects are expected to lead
oil sands expansion over the projection period,
driving most of the on-site construction demand.
On-site in situ construction trades are
projected to peak over the summer of 2015
at approximately 10,920.
Based on current project announcements,
on-site mining construction trades will peak
in the fall of 2018 at about 8,310.
On-site upgrading construction trades will
peak in early 2019 at approximately 5,850
(Figure 10).
Based on current project plans, labour force demand
for oil sands on-site construction projects will peak
twice during the forecast period. The first peak
hiring requirement occurs in late 2014 at 22,260
jobs. The second peak projects 21,540 jobs in
late 2018. The decline in on-site construction labour
demand at the end of the forecast period to
approximately 15,630 jobs may be reversed if new
projects are announced.
OILMAP – On-site Oil Sands Construction Employment to 2020
E = Estimated F = Forecasted
FIGURE 10 Source: OILMAP, 2014
May 2014 Page 21 of 60
Oil Sands Construction, Maintenance and Operations Labour Demand Outlook to 2023
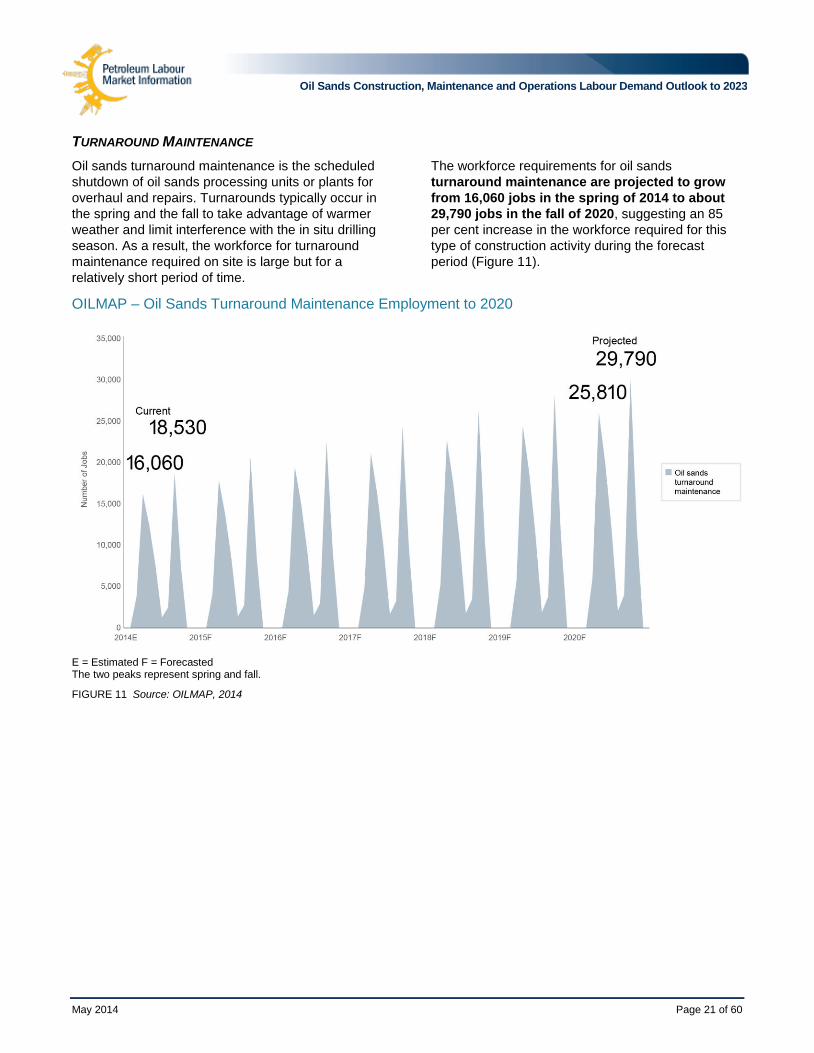
TURNAROUND MAINTENANCE
Oil sands turnaround maintenance is the scheduled
shutdown of oil sands processing units or plants for
overhaul and repairs. Turnarounds typically occur in
the spring and the fall to take advantage of warmer
weather and limit interference with the in situ drilling
season. As a result, the workforce for turnaround
maintenance required on site is large but for a
relatively short period of time.
The workforce requirements for oil sands
turnaround maintenance are projected to grow
from 16,060 jobs in the spring of 2014 to about
29,790 jobs in the fall of 2020, suggesting an 85
per cent increase in the workforce required for this
type of construction activity during the forecast
period (Figure 11).
OILMAP – Oil Sands Turnaround Maintenance Employment to 2020
E = Estimated F = Forecasted The two peaks represent spring and fall.
FIGURE 11 Source: OILMAP, 2014

May 2014 Page 22 of 60
Oil Sands Construction, Maintenance and Operations Labour Demand Outlook to 2023
ONGOING MAINTENANCE
OILMAP projects the workforce requirements for ongoing or day-to-day maintenance of oil sands operations
will grow from 7,910 jobs in 2014 to 11,480 jobs in 2020, representing a 45 per cent increase. The projection
illustrates a steady annual increase of about 500 jobs as new projects move from the construction phase into the
operations phase across the projection period (Figure 12).
OILMAP – Oil Sands Ongoing Maintenance Employment to 2020
E = Estimated F = Forecasted
FIGURE 12 Source: OILMAP, 2014

May 2014 Page 23 of 60
Oil Sands Construction, Maintenance and Operations Labour Demand Outlook to 2023
COMBINED ON-SITE WORKFORCE REQUIREMENTS
In 2014, it is estimated that the combined workforce required for on-site oil sands construction, turnaround and
ongoing maintenance will increase to about 48,710 workers. OILMAP’s forecast shows that jobs required to
support on-site construction, turnaround and ongoing maintenance projects will grow to about 56,900
jobs in 2020 (accounting for a 17 per cent increase) with a peak of about 59,390 jobs in 2019 (Figure 13).
Turnaround and ongoing maintenance includes the workforce required for maintenance activities for existing oil
sands facilities as well as those that are expected to become operational between 2014 and 2020.
OILMAP – Oil Sands On-site Construction, Turnaround and Ongoing Maintenance Employment to 2020
E = Estimated F = Forecasted The two peaks represent spring and fall.
FIGURE 13 Source: OILMAP, 2014

May 2014 Page 24 of 60
Oil Sands Construction, Maintenance and Operations Labour Demand Outlook to 2023
DISTRIBUTION OF OCCUPATIONS
The distinct activities associated with on-site,
turnaround and ongoing maintenance require a
different mix of occupations with some overlap.
Table 6 shows the percentage distribution of each
occupation by type of on-site oil sands construction
and maintenance activity.
Electricians, labourers, crane and hoisting
equipment operators, welders and pipefitters
constitute the bulk of the on-site construction
workforce.
The turnaround maintenance workforce
includes boilermakers, pipefitters, labourers,
carpenters and electricians. Boilermakers
and pipefitters account for over 50 per cent
of the turnaround maintenance workforce.22
The occupations hired in greatest numbers
for ongoing maintenance include pipefitters,
carpenters, boilermakers, labourers and
electricians. Both turnaround and ongoing
maintenance use the same trades.
TABLE 6 Source: OILMAP, 2014
OILMAP – DISTRIBUTION OF ON-SITE OIL SANDS CONSTRUCTION AND MAINTENANCE WORKFORCE BY CONSTRUCTION TYPE AND OCCUPATION
Occupation Percentage of 2014 Workforce
Construction Turnaround Ongoing Maintenance
Boilermakers 4.3% 27.0% 12.1% Carpenters 2.6% 13.6% 19.4% Cement masons 1.8% 0.2% 0.1% Crane and hoisting equipment operators 13.6% 1.7% 2.5% Electricians 14.7% 4.0% 7.7% Heavy equipment operators 2.6% n/a n/a Instrument mechanics 2.0% n/a n/a Insulators 1.8% 3.0% 6.5%
Ironworkers See Reinforcing and
Structural Ironworkers 1.6% 3.2%
Labourers 15.6% 17.6% 16.7% Millwrights 3.5% 3.5% 6.5% Operators n/a 1.7% 2.5% Painters n/a 2.1% 0.7% Pipefitters 11.5% 24.9% 22.1%
Reinforcing ironworkers 2.3% Included as Ironworkers
Included as Ironworkers
Scaffolders 5.6% n/a n/a Sheet metal workers n/a 0.1% 0.8%
Structural ironworkers 5.0% Included as Ironworkers
Included as Ironworkers
Truck drivers n/a 0.7% 1.8%
Welders 13.1%
Most welding completed by
Boilermakers and Pipefitters
Most welding completed by
Boilermakers and Pipefitters
May 2014 Page 25 of 60
Oil Sands Construction, Maintenance and Operations Labour Demand Outlook to 2023
OIL SANDS CONSTRUCTION WORKFORCE REQUIREMENTS
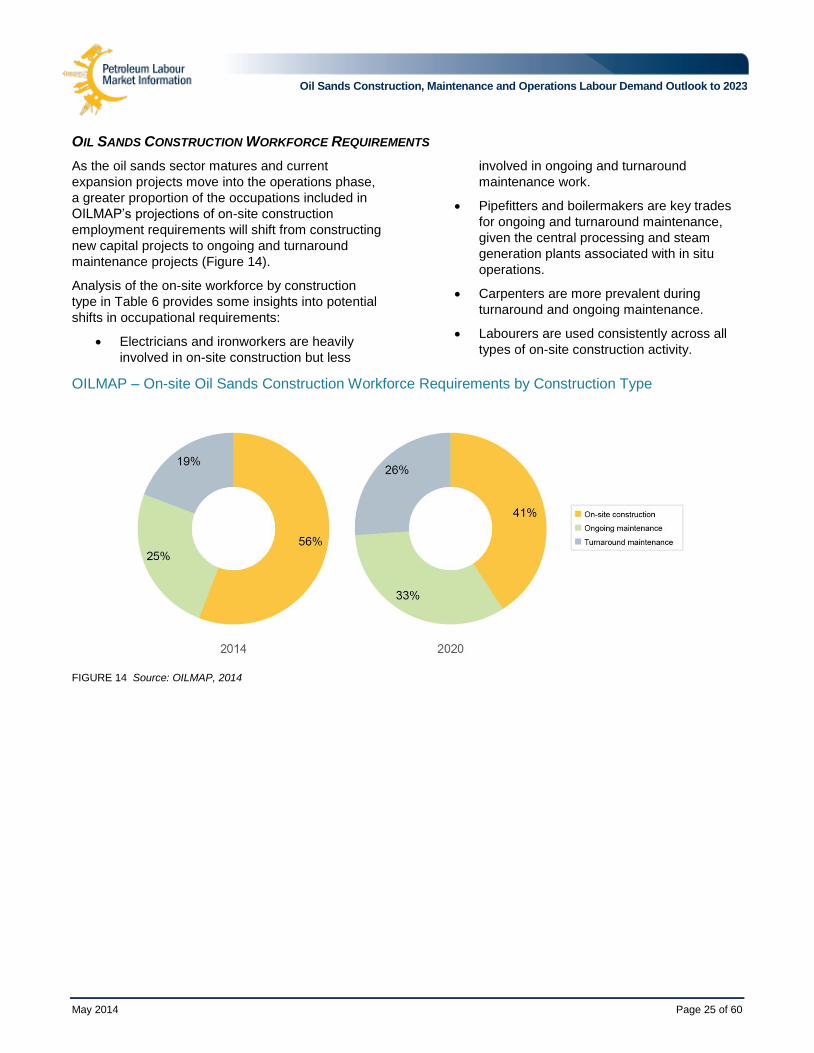
As the oil sands sector matures and current
expansion projects move into the operations phase,
a greater proportion of the occupations included in
OILMAP’s projections of on-site construction
employment requirements will shift from constructing
new capital projects to ongoing and turnaround
maintenance projects (Figure 14).
Analysis of the on-site workforce by construction
type in Table 6 provides some insights into potential
shifts in occupational requirements:
Electricians and ironworkers are heavily
involved in on-site construction but less
involved in ongoing and turnaround
maintenance work.
Pipefitters and boilermakers are key trades
for ongoing and turnaround maintenance,
given the central processing and steam
generation plants associated with in situ
operations.
Carpenters are more prevalent during
turnaround and ongoing maintenance.
Labourers are used consistently across all
types of on-site construction activity.
OILMAP – On-site Oil Sands Construction Workforce Requirements by Construction Type
FIGURE 14 Source: OILMAP, 2014
May 2014 Page 26 of 60
Oil Sands Construction, Maintenance and Operations Labour Demand Outlook to 2023
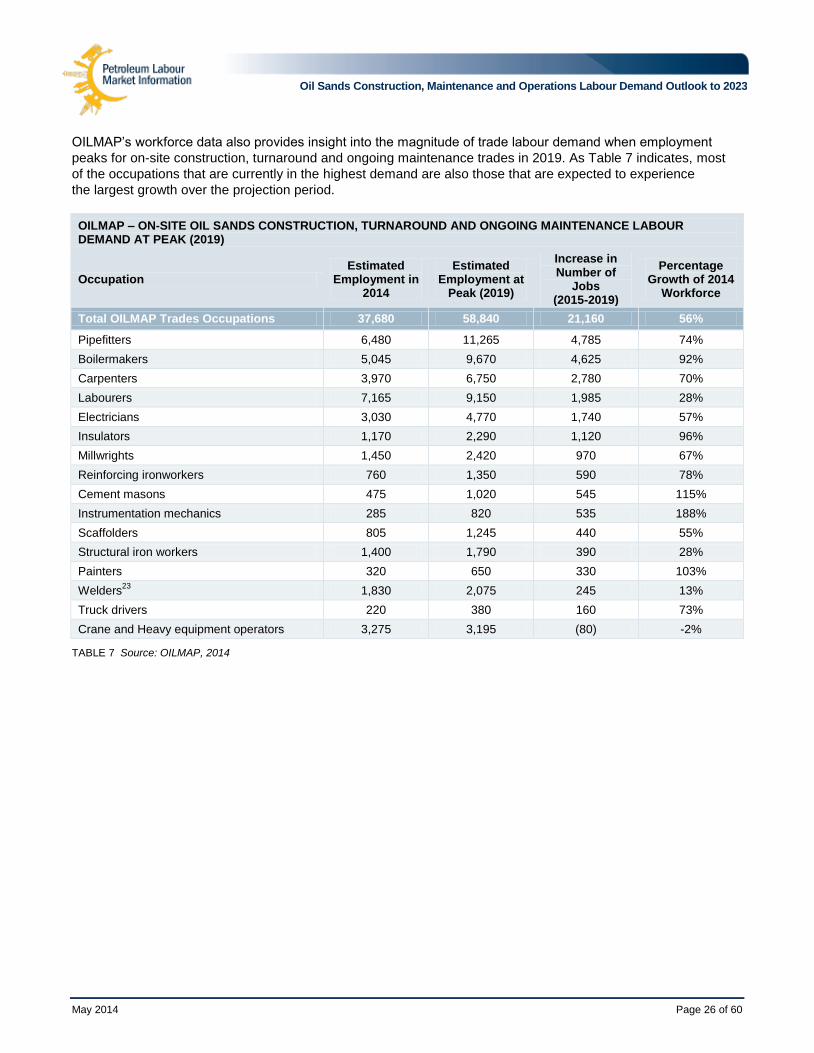
OILMAP’s workforce data also provides insight into the magnitude of trade labour demand when employment
peaks for on-site construction, turnaround and ongoing maintenance trades in 2019. As Table 7 indicates, most
of the occupations that are currently in the highest demand are also those that are expected to experience
the largest growth over the projection period.
OILMAP – ON-SITE OIL SANDS CONSTRUCTION, TURNAROUND AND ONGOING MAINTENANCE LABOUR DEMAND AT PEAK (2019)
Occupation Estimated
Employment in 2014
Estimated Employment at
Peak (2019)
Increase in Number of
Jobs (2015-2019)
Percentage Growth of 2014
Workforce
Total OILMAP Trades Occupations 37,680 58,840 21,160 56%
Pipefitters 6,480 11,265 4,785 74%
Boilermakers 5,045 9,670 4,625 92%
Carpenters 3,970 6,750 2,780 70%
Labourers 7,165 9,150 1,985 28%
Electricians 3,030 4,770 1,740 57%
Insulators 1,170 2,290 1,120 96%
Millwrights 1,450 2,420 970 67%
Reinforcing ironworkers 760 1,350 590 78%
Cement masons 475 1,020 545 115%
Instrumentation mechanics 285 820 535 188%
Scaffolders 805 1,245 440 55%
Structural iron workers 1,400 1,790 390 28%
Painters 320 650 330 103%
Welders23
1,830 2,075 245 13%
Truck drivers 220 380 160 73%
Crane and Heavy equipment operators 3,275 3,195 (80) -2%
TABLE 7 Source: OILMAP, 2014

May 2014 Page 27 of 60
Oil Sands Construction, Maintenance and Operations Labour Demand Outlook to 2023
OIL SANDS OPERATIONS LABOUR DEMAND (PETROLEUM HR COUNCIL)
The following section is the labour demand analysis for direct oil sands operations based on the
Petroleum HR Council’s labour market model.
The current oil sands operations workforce is estimated to be around 26,550. The following is a breakdown
of employment by operations type:
In situ: 11,710 jobs or 44 per cent of the sector’s employment.
Mining: 9,590 jobs or 36 per cent of the sector’s employment.
Upgrading: 5,250 or 20 per cent of the sector’s employment.
Petroleum HR Council – Oil Sands Operations Workforce Projections to 2023
E = Estimated F = Forecasted
FIGURE 15 Source: Petroleum HR Council, 2014
Oil sands operations workforce requirements increase steadily over the next decade: an average annual growth
rate of five per cent. By 2023, oil sands operations employment is projected to increase by 58 per cent,
creating about 15,330 new operations jobs for total employment of about 41,880 (Figure 15).
As has been the trend in recent years, in situ operations add the most jobs over the forecast period:
In situ: 10,610 additional jobs; 91 per cent increase over 2014 employment levels.
Mining: 4,290 additional jobs; 45 per cent increase over 2014 employment levels.
Upgrading: 430 additional jobs; 8 per cent increase over 2014 employment levels.
May 2014 Page 28 of 60
Oil Sands Construction, Maintenance and Operations Labour Demand Outlook to 2023
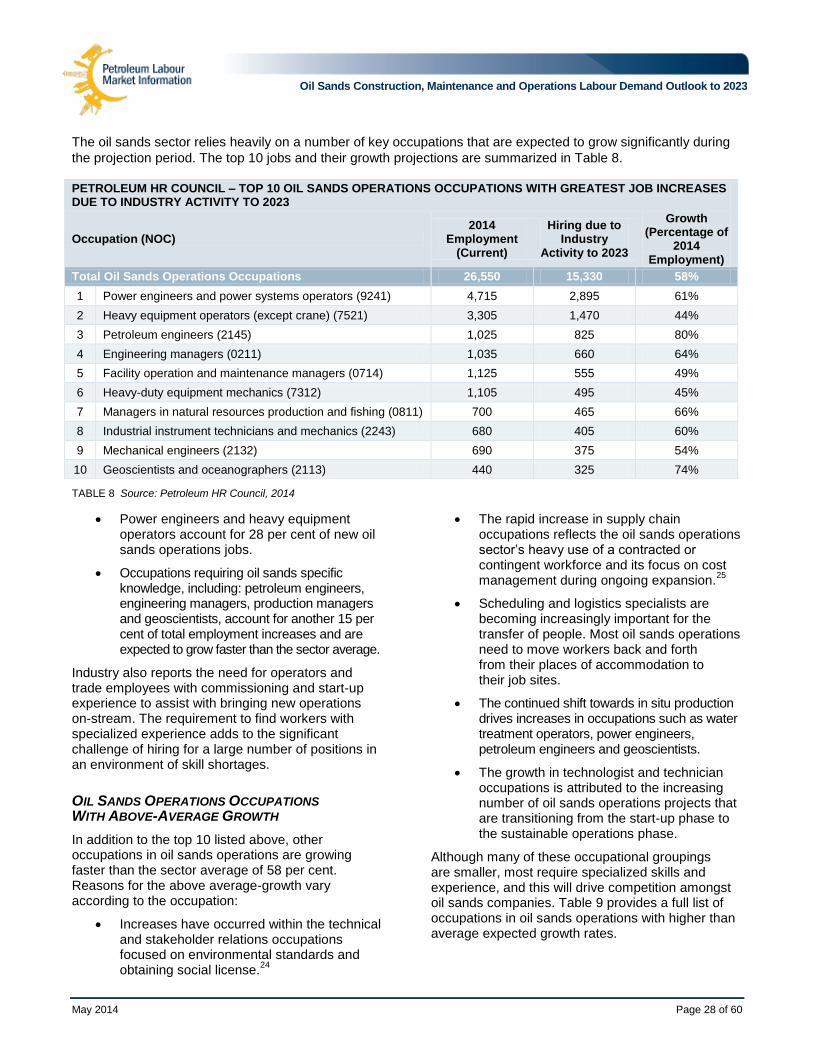
The oil sands sector relies heavily on a number of key occupations that are expected to grow significantly during
the projection period. The top 10 jobs and their growth projections are summarized in Table 8.
TABLE 8 Source: Petroleum HR Council, 2014
Power engineers and heavy equipment operators account for 28 per cent of new oil sands operations jobs.
Occupations requiring oil sands specific knowledge, including: petroleum engineers, engineering managers, production managers and geoscientists, account for another 15 per cent of total employment increases and are expected to grow faster than the sector average.
Industry also reports the need for operators and trade employees with commissioning and start-up experience to assist with bringing new operations on-stream. The requirement to find workers with specialized experience adds to the significant challenge of hiring for a large number of positions in an environment of skill shortages.
OIL SANDS OPERATIONS OCCUPATIONS WITH ABOVE-AVERAGE GROWTH
In addition to the top 10 listed above, other occupations in oil sands operations are growing faster than the sector average of 58 per cent. Reasons for the above average-growth vary according to the occupation:
Increases have occurred within the technical and stakeholder relations occupations focused on environmental standards and obtaining social license.
24
The rapid increase in supply chain occupations reflects the oil sands operations sector’s heavy use of a contracted or contingent workforce and its focus on cost management during ongoing expansion.
25
Scheduling and logistics specialists are becoming increasingly important for the transfer of people. Most oil sands operations need to move workers back and forth from their places of accommodation to their job sites.
The continued shift towards in situ production drives increases in occupations such as water treatment operators, power engineers, petroleum engineers and geoscientists.
The growth in technologist and technician occupations is attributed to the increasing number of oil sands operations projects that are transitioning from the start-up phase to the sustainable operations phase.
Although many of these occupational groupings are smaller, most require specialized skills and experience, and this will drive competition amongst oil sands companies. Table 9 provides a full list of occupations in oil sands operations with higher than average expected growth rates.
PETROLEUM HR COUNCIL – TOP 10 OIL SANDS OPERATIONS OCCUPATIONS WITH GREATEST JOB INCREASES DUE TO INDUSTRY ACTIVITY TO 2023
Occupation (NOC) 2014
Employment (Current)
Hiring due to Industry
Activity to 2023
Growth (Percentage of
2014 Employment)
Total Oil Sands Operations Occupations 26,550 15,330 58% 1 Power engineers and power systems operators (9241) 4,715 2,895 61%
2 Heavy equipment operators (except crane) (7521) 3,305 1,470 44%
3 Petroleum engineers (2145) 1,025 825 80%
4 Engineering managers (0211) 1,035 660 64%
5 Facility operation and maintenance managers (0714) 1,125 555 49%
6 Heavy-duty equipment mechanics (7312) 1,105 495 45%
7 Managers in natural resources production and fishing (0811) 700 465 66%
8 Industrial instrument technicians and mechanics (2243) 680 405 60%
9 Mechanical engineers (2132) 690 375 54%
10 Geoscientists and oceanographers (2113) 440 325 74%

May 2014 Page 29 of 60
Oil Sands Construction, Maintenance and Operations Labour Demand Outlook to 2023
PETROLEUM HR COUNCIL – OIL SANDS OPERATIONS OCCUPATIONS WITH ABOVE-AVERAGE GROWTH
Occupation (NOC) 2014 Employment
(Current)
Hiring due to Industry Activity
to 2023
Growth (Percentage of 2014
Employment)
Total Oil Sands Operations Occupations 26,550 15,330 58%
Water and waste treatment plant operators (9243)
140 125 89%
Geological and mineral technologists and technicians (2212)
335 295 88%
Purchasing agents and officers (1225) 335 295 88%
Professional occupations in advertising, marketing and public relations (1123)
55 45 82%
Petroleum engineers (2145) 1,025 825 80%
Industrial engineering and manufacturing technologists and technicians (2233)
45 35 78%
Purchasing managers (0113) 20 15 75%
Contractors and supervisors, machining, metal forming, shaping and erecting trades and related occupations (7201)
20 15 75%
Geoscientists and oceanographers (2113) 440 325 74%
Natural and applied science policy researchers, consultants and program officers (4161)
180 130 72%
Contractors and supervisors, mechanic trades (7301)
195 140 72%
Construction managers (0711) 380 265 70%
Industrial and manufacturing engineers (2141) 430 290 67%
Managers in natural resources production and fishing (0811)
700 465 66%
Purchasing and inventory control workers (1524)
85 55 65%
Shippers and receivers (1521) 100 65 65%
Inspectors in public and environmental health and occupational health and safety (2263)
270 175 65%
Contractors and supervisors, electrical trades and telecommunications occupations (7202)
130 85 65%
Supervisors, supply chain, tracking and scheduling co-ordination occupations (1215)
55 35 64%
Engineering managers (0211) 1,035 660 64%
Construction estimators (2234) 65 40 62%
Power engineers and power systems operators (9241)
4,715 2,895 61%
Drafting technologists and technicians (2253) 155 95 61%
Electrical and electronics engineering technologists and technicians (2241)
150 90 60%
Industrial instrument technicians and mechanics (2243)
680 405 60%
Mechanical engineering technologists and technicians (2232)
225 135 60%
Civil engineering technologists and technicians (2231)
185 110 59%
TABLE 9 Source: Petroleum HR Council, 2014

May 2014 Page 30 of 60
Oil Sands Construction, Maintenance and Operations Labour Demand Outlook to 2023
AGE-RELATED ATTRITION INCREASES HIRING
REQUIREMENTS
Workforce demographics continue to affect
Canada’s labour market and available labour supply.
Historically, roughly six persons in the workforce
were available to replace each retiree. That number
is expected to fall to 2.7 in 2031.26
Oil sands companies are reporting anecdotally that
workers are remaining in the workforce longer. This
could be for a number of reasons:
Companies have programs in place to entice
experienced workers to remain working.
Workers enjoy their work and are not ready
to retire.
Workers cannot afford to retire.
However, a high rate of retirement eligibility remains
a risk as it is uncertain when these workers will
begin their retirement.
Age-related attrition could potentially drive a
significant number of job openings within oil sands
operations over the next decade. For the total
sector, 24 per cent of 2014 employment or about
6,380 workers are eligible for retirement during
the projection period. The following is a breakdown
of retirement eligibility by operations type:
In situ: 28 per cent of 2014 employment or
about 3,340 workers.
Mining: 21 per cent of 2014 employment or
about 1,990 workers.
Upgrading: 20 per cent of 2014 employment
or about 1,050 workers.
NET HIRING REQUIREMENTS
Net hiring requirements are determined by adding
the labour demand required to support industry
expansion to age-related attrition demand. (Net
hiring requirements for the oil sands sector
described in the following section do not include
non-retirement turnover.)
In a tight labour market, companies may choose to
use their full-time workers for commissioning and
start-up of operations, rather than contractors. In this
case, recruitment starts well in advance of
production coming on stream.
Figure 16 illustrates net hiring requirements for oil
sands operations.
Petroleum HR Council – Net Hiring Requirements by Operations Type to 2023
FIGURE 16 Source: Petroleum HR Council, 2014
May 2014 Page 31 of 60
Oil Sands Construction, Maintenance and Operations Labour Demand Outlook to 2023
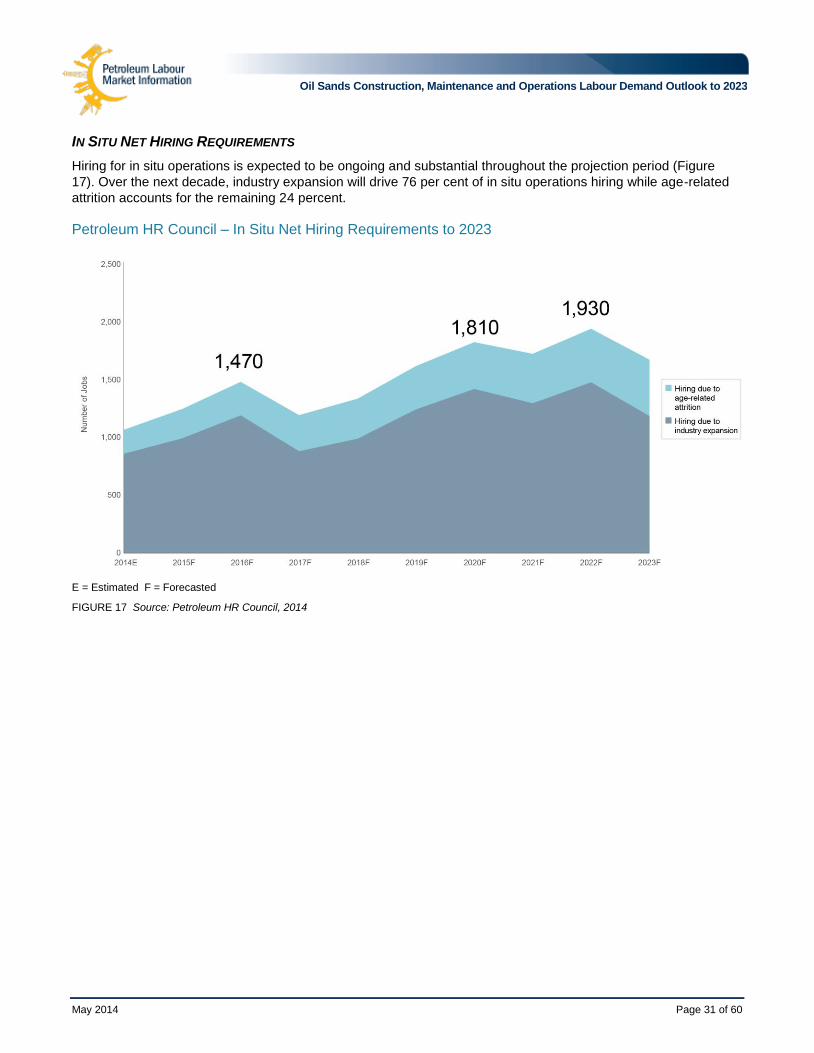
IN SITU NET HIRING REQUIREMENTS
Hiring for in situ operations is expected to be ongoing and substantial throughout the projection period (Figure
17). Over the next decade, industry expansion will drive 76 per cent of in situ operations hiring while age-related
attrition accounts for the remaining 24 percent.
Petroleum HR Council – In Situ Net Hiring Requirements to 2023
E = Estimated F = Forecasted
FIGURE 17 Source: Petroleum HR Council, 2014

May 2014 Page 32 of 60
Oil Sands Construction, Maintenance and Operations Labour Demand Outlook to 2023
Table 10 identifies the top 10 in situ occupations projected to have the greatest net hiring requirements over the
projection period.
PETROLEUM HR COUNCIL – TOP 10 IN SITU OCCUPATIONS WITH GREATEST NET HIRING REQUIREMENTS TO 2023
Occupation (NOC) 2014
Employment (Current)
Hiring Due to Net Hiring
Requirements to 2023
Hiring Rate (Percentage
of 2014 Employment)
Industry Expansion
Age-related
Attrition
Total In Situ Occupations 11,710 10,610 3,340 13,950 119%
1 Power engineers and power systems operators (9241)
2,815 2,550 830 3,380 120%
2 Petroleum engineers (2145) 870 790 200 990 114%
3 Engineering managers (0211) 585 530 200 730 125%
4 Managers in natural resources production and fishing (0811)
435 390 150 540 124%
5 Facility operation and maintenance managers (0714)
365 330 125 455 125%
6 Industrial instrument technicians and mechanics (2243)
355 325 85 410 115%
7 Purchasing agents and officers (1225) 320 290 100 390 122%
8 Geological and mineral technologists and technicians (2212)
320 290 90 380 119%
9 Geoscientists and oceanographers (2113)
305 280 100 380 125%
10 Mechanical engineers (2132) 300 270 65 335 112%
TABLE 10 Source: Petroleum HR Council, 2014
May 2014 Page 33 of 60
Oil Sands Construction, Maintenance and Operations Labour Demand Outlook to 2023
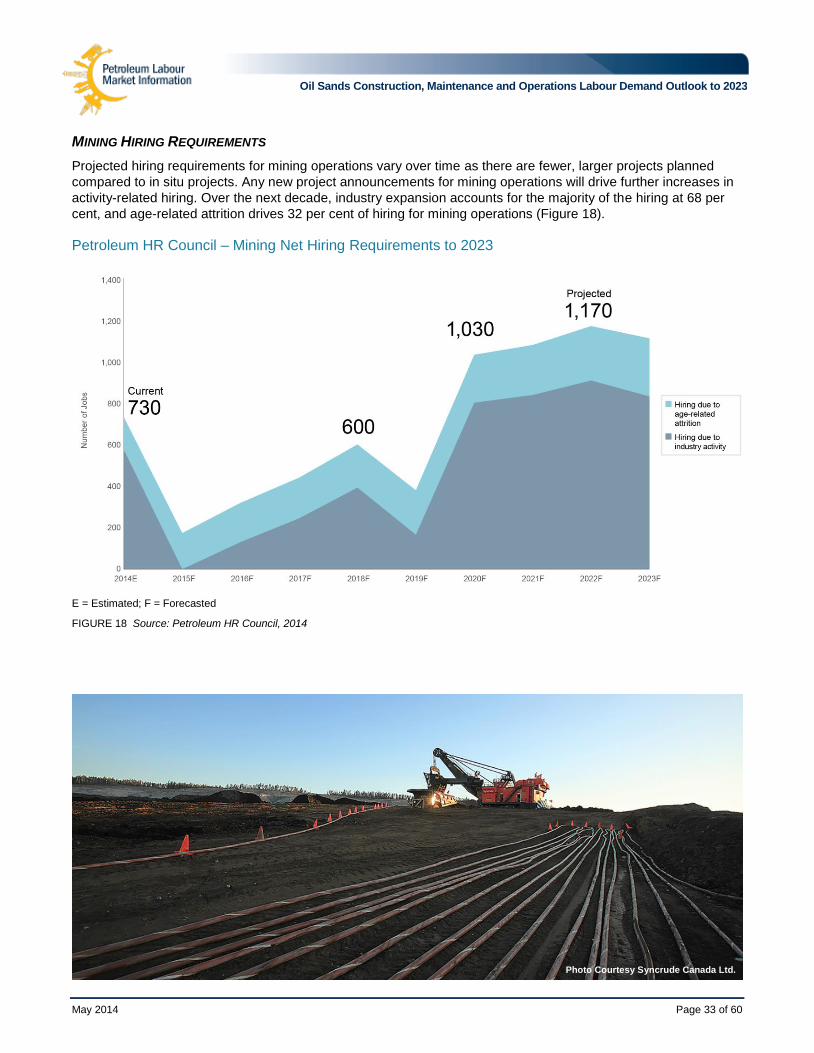
MINING HIRING REQUIREMENTS
Projected hiring requirements for mining operations vary over time as there are fewer, larger projects planned
compared to in situ projects. Any new project announcements for mining operations will drive further increases in
activity-related hiring. Over the next decade, industry expansion accounts for the majority of the hiring at 68 per
cent, and age-related attrition drives 32 per cent of hiring for mining operations (Figure 18).
Petroleum HR Council – Mining Net Hiring Requirements to 2023
E = Estimated; F = Forecasted
FIGURE 18 Source: Petroleum HR Council, 2014
Photo Courtesy Syncrude Canada Ltd.
May 2014 Page 34 of 60
Oil Sands Construction, Maintenance and Operations Labour Demand Outlook to 2023
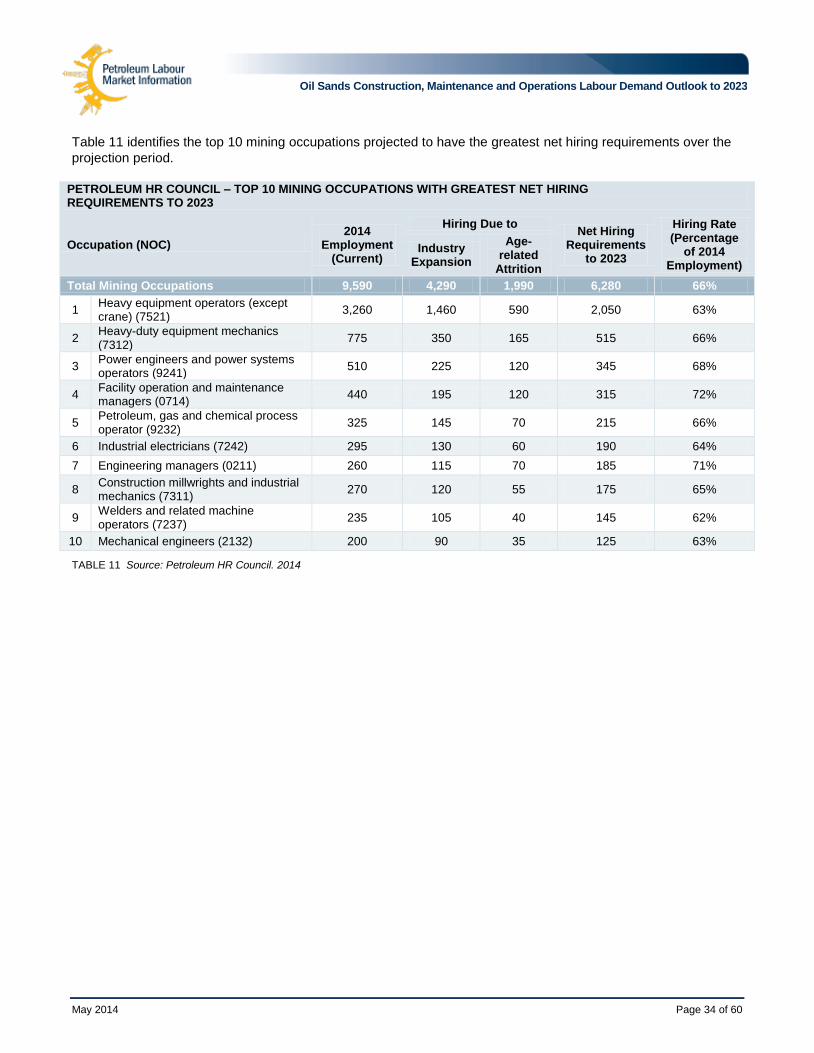
Table 11 identifies the top 10 mining occupations projected to have the greatest net hiring requirements over the
projection period.
PETROLEUM HR COUNCIL – TOP 10 MINING OCCUPATIONS WITH GREATEST NET HIRING REQUIREMENTS TO 2023
Occupation (NOC) 2014
Employment (Current)
Hiring Due to Net Hiring
Requirements to 2023
Hiring Rate (Percentage
of 2014 Employment)
Industry Expansion
Age-related
Attrition
Total Mining Occupations 9,590 4,290 1,990 6,280 66%
1 Heavy equipment operators (except crane) (7521)
3,260 1,460 590 2,050 63%
2 Heavy-duty equipment mechanics (7312)
775 350 165 515 66%
3 Power engineers and power systems operators (9241)
510 225 120 345 68%
4 Facility operation and maintenance managers (0714)
440 195 120 315 72%
5 Petroleum, gas and chemical process operator (9232)
325 145 70 215 66%
6 Industrial electricians (7242) 295 130 60 190 64%
7 Engineering managers (0211) 260 115 70 185 71%
8 Construction millwrights and industrial mechanics (7311)
270 120 55 175 65%
9 Welders and related machine operators (7237)
235 105 40 145 62%
10 Mechanical engineers (2132) 200 90 35 125 63%
TABLE 11 Source: Petroleum HR Council. 2014

May 2014 Page 35 of 60
Oil Sands Construction, Maintenance and Operations Labour Demand Outlook to 2023
UPGRADING HIRING REQUIREMENTS
For upgrading operations, age-related attrition accounts for 71 per cent of the net hiring to 2023, based on current
plans for upgrading production. Expansion of upgrading operations accounts for 29 per cent; however, this
growth-related hiring is not expected to occur until later in the projection period because new upgrading projects
are still in the early stages of construction (Figure 19).
Petroleum HR Council – Upgrading Net Hiring Requirements to 2023
FIGURE 19 Source: Petroleum HR Council, 2014
May 2014 Page 36 of 60
Oil Sands Construction, Maintenance and Operations Labour Demand Outlook to 2023
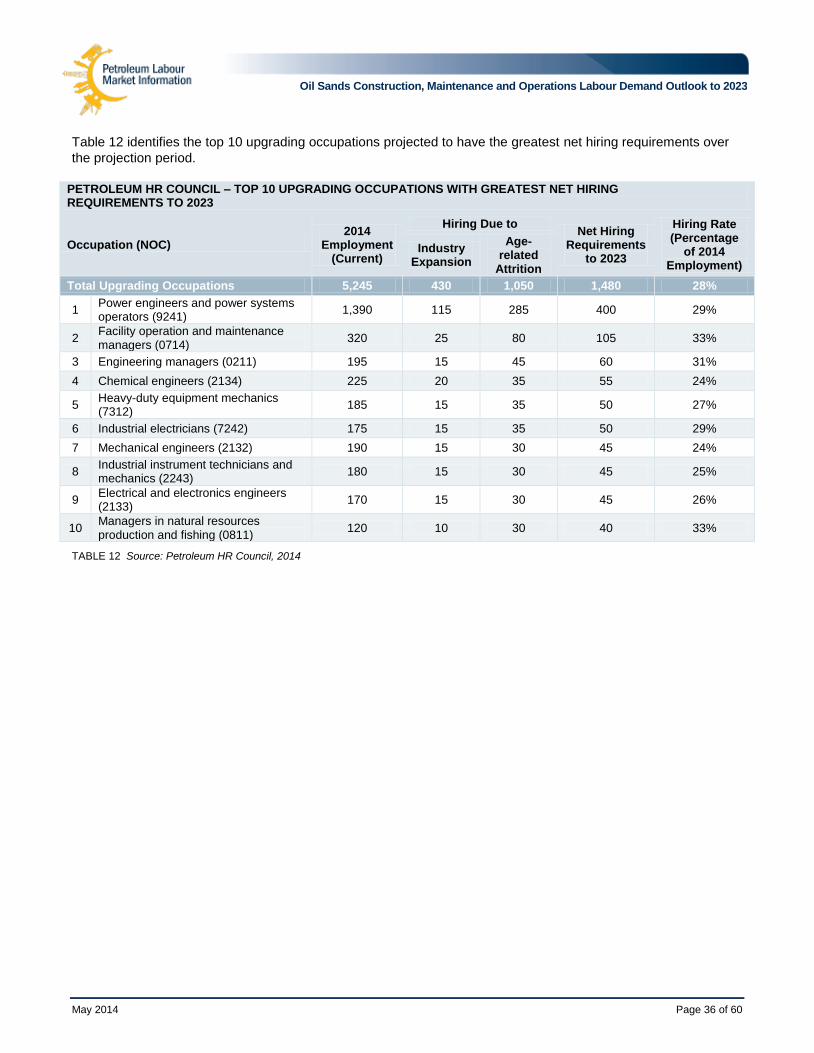
Table 12 identifies the top 10 upgrading occupations projected to have the greatest net hiring requirements over
the projection period.
PETROLEUM HR COUNCIL – TOP 10 UPGRADING OCCUPATIONS WITH GREATEST NET HIRING REQUIREMENTS TO 2023
Occupation (NOC) 2014
Employment (Current)
Hiring Due to Net Hiring
Requirements to 2023
Hiring Rate (Percentage
of 2014 Employment)
Industry Expansion
Age-related
Attrition
Total Upgrading Occupations 5,245 430 1,050 1,480 28%
1 Power engineers and power systems operators (9241)
1,390 115 285 400 29%
2 Facility operation and maintenance managers (0714)
320 25 80 105 33%
3 Engineering managers (0211) 195 15 45 60 31%
4 Chemical engineers (2134) 225 20 35 55 24%
5 Heavy-duty equipment mechanics (7312)
185 15 35 50 27%
6 Industrial electricians (7242) 175 15 35 50 29%
7 Mechanical engineers (2132) 190 15 30 45 24%
8 Industrial instrument technicians and mechanics (2243)
180 15 30 45 25%
9 Electrical and electronics engineers (2133)
170 15 30 45 26%
10 Managers in natural resources production and fishing (0811)
120 10 30 40 33%
TABLE 12 Source: Petroleum HR Council, 2014

May 2014 Page 37 of 60
Oil Sands Construction, Maintenance and Operations Labour Demand Outlook to 2023
OVERVIEW OF POWER ENGINEER HIRING REQUIREMENTS
Over the next decade, the oil sands operations
sector will have the greatest need for power
engineers – operators who require power
engineering certification or a steam ticket. Power
engineers are hired across the sector. It is projected
that this occupation will account for the following:
Total oil sands: 19 per cent of total oil sands
net hiring requirements.
In situ: 24 per cent of in situ net hiring
requirements.
Mining: 5 per cent of mining net hiring
requirements.
Upgrading: 27 per cent of upgrading net
hiring requirements.
Four levels of interprovincial power engineering
certifications are recognized: the entry-level ticket is
class four, and the most qualified power engineers
possess a first-class ticket. Power engineers can
advance levels by gaining work experience (firing
time) and writing exams at each level. Provincial
regulations govern the class of the ticket required to
oversee and operate boilers and pressure vessels.
The previous survey of oil sands operators helped
determine the distribution of the sector’s power
engineering workforce in 2010, broken down by
class/level (Figure 20). Assuming oil sands
operators continue to maintain the 2010 distribution
of power engineering certification to 2023, the hiring
requirements for each level of power engineering
ticket is summarized in Table 13.
Distribution of Power Engineering Workforce in 2010
FIGURE 20 Source: Petroleum HR Council, 2011
PETROLEUM HR COUNCIL – POWER ENGINEER LABOUR DEMAND BY TICKET LEVEL TO 2023
Power Engineering Level Estimated Number of New Power Engineer Jobs to 2023
Total Oil Sands In Situ
All tickets 2,895 2,550
1st class 85 25
2nd
class 260 230
3rd
class 1,450 1,480
4th
class 1,100 815
TABLE 13 Source: Petroleum HR Council, 2014

May 2014 Page 38 of 60
Oil Sands Construction, Maintenance and Operations Labour Demand Outlook to 2023
OIL SANDS OPERATIONS OCCUPATIONS WITH ABOVE-AVERAGE NET HIRING REQUIREMENTS
Net hiring requirements across the oil sands sector
are significant – an average of an additional 82 per
cent of current employment levels is needed. If hiring
for key oil sands operations occupations cannot
keep pace with requirements, the viability of oil
sands projects becomes uncertain. Succession
planning for managerial roles, career development
for technical roles and strategic recruiting will be
essential; given the high rates of net hiring for a
number of critical oil sands operations occupations.
Table 14 outlines the managerial occupations for oil
sands operations that have above-average net hiring
requirements.
TABLE 14 Source: Petroleum HR Council, 2014
PETROLEUM HR COUNCIL – MANAGERIAL OCCUPATIONS WITH ABOVE-AVERAGE NET HIRING REQUIREMENTS TO 2023
Occupation (NOC) 2014
Employment (Current)
Hiring Due to Net Hiring
Requirements to 2023
Net Hiring Rate
(Percentage of 2014
Employment)
Industry Expansion
Age-related Attrition
Total Oil Sands Operations Occupations 26,550 15,330 6,380 21,710 82%
Purchasing managers (0113) 20 15 10 25 125%
Contractors and supervisors, machining, metal forming, shaping and erecting trades, and related occupations (7201)
20 15 5 20 100%
Managers in natural resources production and fishing (0811)
700 465 215 680 97%
Contractors and supervisors, mechanic trades (7301)
195 140 45 185 95%
Engineering managers (0211) 1,035 660 315 975 94%
Construction managers (0711) 380 265 80 345 91%
Supervisors, supply chain, tracking and scheduling co-ordination occupations (1215)
55 35 15 50 91%
Contractors and supervisors, electrical trades and telecommunications occupations (7202)
130 85 30 115 88%

May 2014 Page 39 of 60
Oil Sands Construction, Maintenance and Operations Labour Demand Outlook to 2023
Table 15 lists oil sands technical occupations with above-average hiring requirements.
PETROLEUM HR COUNCIL – TECHNICAL OCCUPATIONS WITH ABOVE-AVERAGE NET HIRING REQUIREMENTS TO 2023
Occupation (NOC) 2014
Employment (Current)
Hiring Due to Net Hiring
Requirements to 2023
Net Hiring Rate
(Percentage of 2014
Employment)
Industry Expansion
Age-related Attrition
Total Oil Sands Operations Occupations 26,550 15,330 6,380 21,710 82%
Water and waste treatment plant operators (9243)
140 125 40 165 118%
Geological and mineral technologists and technicians (2212)
335 295 90 385 115%
Professional occupations in advertising, marketing and public relations (1123)
55 45 15 60 109%
Geoscientists and oceanographers (2113) 440 325 130 455 103%
Petroleum engineers (2145) 1,025 825 225 1,050 102%
Industrial engineering and manufacturing technologists and technicians (2233)
45 35 10 45 100%
Inspectors in public and environmental health and occupational health and safety (2263)
270 175 80 255 94%
Natural and applied science policy researchers, consultants and program officers (4161)
180 130 40 170 94%
Power engineers and power systems operators (9241)
4,715 2,895 1,235 4,130 88%
Construction estimators (2234) 65 40 15 55 85%
Drafting technologists and technicians (2253) 155 95 35 130 84%
Civil engineering technologists and technicians (2231)
185 110 45 155 84%
Industrial and manufacturing engineers (2141)
430 290 65 355 83%
TABLE 15 Source: Petroleum HR Council, 2014
May 2014 Page 40 of 60
Oil Sands Construction, Maintenance and Operations Labour Demand Outlook to 2023
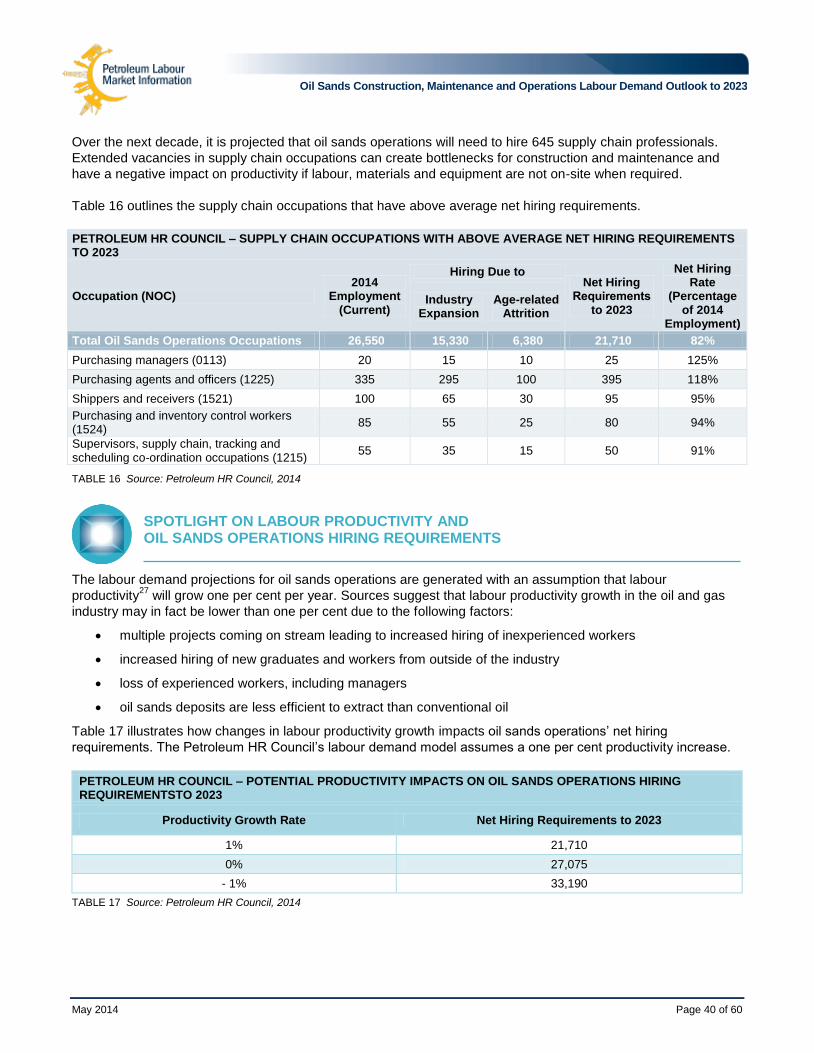
Over the next decade, it is projected that oil sands operations will need to hire 645 supply chain professionals.
Extended vacancies in supply chain occupations can create bottlenecks for construction and maintenance and
have a negative impact on productivity if labour, materials and equipment are not on-site when required.
Table 16 outlines the supply chain occupations that have above average net hiring requirements.
PETROLEUM HR COUNCIL – SUPPLY CHAIN OCCUPATIONS WITH ABOVE AVERAGE NET HIRING REQUIREMENTS TO 2023
Occupation (NOC) 2014
Employment (Current)
Hiring Due to Net Hiring
Requirements to 2023
Net Hiring Rate
(Percentage of 2014
Employment)
Industry Expansion
Age-related Attrition
Total Oil Sands Operations Occupations 26,550 15,330 6,380 21,710 82%
Purchasing managers (0113) 20 15 10 25 125%
Purchasing agents and officers (1225) 335 295 100 395 118%
Shippers and receivers (1521) 100 65 30 95 95%
Purchasing and inventory control workers (1524)
85 55 25 80 94%
Supervisors, supply chain, tracking and scheduling co-ordination occupations (1215)
55 35 15 50 91%
TABLE 16 Source: Petroleum HR Council, 2014
SPOTLIGHT ON LABOUR PRODUCTIVITY AND OIL SANDS OPERATIONS HIRING REQUIREMENTS
The labour demand projections for oil sands operations are generated with an assumption that labour
productivity27
will grow one per cent per year. Sources suggest that labour productivity growth in the oil and gas
industry may in fact be lower than one per cent due to the following factors:
multiple projects coming on stream leading to increased hiring of inexperienced workers
increased hiring of new graduates and workers from outside of the industry
loss of experienced workers, including managers
oil sands deposits are less efficient to extract than conventional oil
Table 17 illustrates how changes in labour productivity growth impacts oil sands operations’ net hiring
requirements. The Petroleum HR Council’s labour demand model assumes a one per cent productivity increase.
PETROLEUM HR COUNCIL – POTENTIAL PRODUCTIVITY IMPACTS ON OIL SANDS OPERATIONS HIRING REQUIREMENTSTO 2023
Productivity Growth Rate Net Hiring Requirements to 2023
1% 21,710
0% 27,075
- 1% 33,190
TABLE 17 Source: Petroleum HR Council, 2014
May 2014 Page 41 of 60
Oil Sands Construction, Maintenance and Operations Labour Demand Outlook to 2023
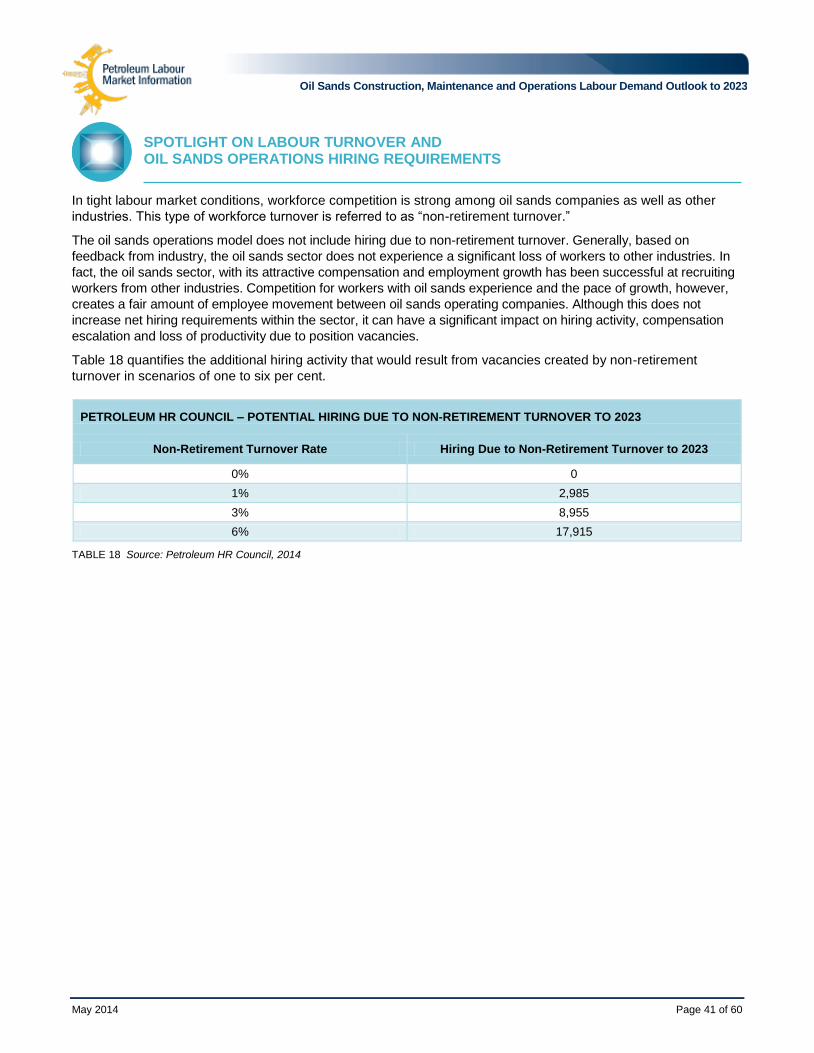
SPOTLIGHT ON LABOUR TURNOVER AND OIL SANDS OPERATIONS HIRING REQUIREMENTS
In tight labour market conditions, workforce competition is strong among oil sands companies as well as other
industries. This type of workforce turnover is referred to as “non-retirement turnover.”
The oil sands operations model does not include hiring due to non-retirement turnover. Generally, based on
feedback from industry, the oil sands sector does not experience a significant loss of workers to other industries. In
fact, the oil sands sector, with its attractive compensation and employment growth has been successful at recruiting
workers from other industries. Competition for workers with oil sands experience and the pace of growth, however,
creates a fair amount of employee movement between oil sands operating companies. Although this does not
increase net hiring requirements within the sector, it can have a significant impact on hiring activity, compensation
escalation and loss of productivity due to position vacancies.
Table 18 quantifies the additional hiring activity that would result from vacancies created by non-retirement
turnover in scenarios of one to six per cent.
PETROLEUM HR COUNCIL – POTENTIAL HIRING DUE TO NON-RETIREMENT TURNOVER TO 2023
Non-Retirement Turnover Rate Hiring Due to Non-Retirement Turnover to 2023
0% 0
1% 2,985
3% 8,955
6% 17,915
TABLE 18 Source: Petroleum HR Council, 2014

May 2014 Page 42 of 60
Oil Sands Construction, Maintenance and Operations Labour Demand Outlook to 2023
WORKFORCE CHALLENGES FOR OIL SANDS CONSTRUCTION, MAINTENANCE AND OPERATIONS
CONSTRUCTION
Alberta’s unemployment rate of 4.9 per cent28
is an
indicator that its labour market is experiencing a
significant labour demand challenge. The following
section, prepared by the Petroleum HR Council,
examines how a tough labour market can impact
labour demand for oil sands construction,
maintenance and operations.
Construction spending and labour demand
requirements are up across most markets adding to the
challenges of meeting workforce requirements for the
foreseeable future. As oil sands capacity grows, there
is a need for supporting infrastructure, including
transportation, utilities, pipelines, roads and highways
and other downstream oil and gas developments that
add to the growth in labour requirements. In addition,
institutional and commercial building construction picks
up across the outlook period in line with increased
business activity and population growth. BuildForce
Canada projects that commercial and institutional
spending will increase from $6.6 billion in 2013
(adjusted for inflation in 2007 dollars) to $9.3 billion by
2023; a 40 per cent increase. Residential construction
is predicted to be robust with new people moving to
Alberta in large numbers. BuildForce reports a 22 per
cent increase in new residential and renovations
spending over the next decade increasing from $18
billion (2007 dollars) in 2013 to $22 billion by 2023, with
annual new housing starts averaging over 40,000 units.
Labour supply shortages are compounded by the fact
that maintenance and sustaining capital projects on
Alberta’s existing major industrial facilities now demand
a workforce that is equal to or greater than the worker
demands for new engineering construction. According
to BuildForce Canada, Alberta is likely to experience a
significant loss of skilled workers due to retirement: 24
per cent of the current labour force or an estimated
37,500 workers between 2014 and 2023.
As Figure 21 illustrates, industrial construction
planned across Canada is significant, further
creating a tight labour market.
Cross Canada Industrial Construction
FIGURE 21 Source: BuildForce Canada

May 2014 Page 43 of 60
Oil Sands Construction, Maintenance and Operations Labour Demand Outlook to 2023
OPERATIONS
On top of the risk to oil sands expansion associated
with construction labour shortages, oil sands
operations will require 58 per cent more workers,
about 15,330 new jobs, over the next decade. For oil
sands operations, shortages will be particularly
acute for occupations requiring specialized training
in the sector as well as occupations that are also
coveted by construction and other industries. An
aging workforce also adds to the challenges
associated with a competitive labour environment
and shortages of specific skills. According to the
Petroleum HR Council, 24 per cent or 6,380 of 2014
oil sands employment will be eligible for retirement
over the next decade.
Operations are located in relatively remote locations,
with lack of available housing, where the cost of
living tends to be higher than in other parts of
Canada. These factors make recruiting difficult
for remote locations. The use of rotational work
arrangements (for example fly-in/fly-out) is one
solution enabling oil sands companies’ to draw
more workers from across the country.
WORKING TOWARDS A SOLUTION
Addressing labour challenges is a shared concern
amongst many employers, industry associations,
labour groups, education and training providers, and
government. Many oil sands project owners have
multiple projects planned (e.g., oil sands, LNG,
offshore) and they are susceptible to the cumulative
risks of labour shortages.
Photo Courtesy Suncor Energy Inc.

May 2014 Page 44 of 60
Oil Sands Construction, Maintenance and Operations Labour Demand Outlook to 2023
MEETING FUTURE WORKFORCE DEMANDS – OIL SANDS CONSTRUCTION AND OPERATIONS
Labour shortages are costly from a quality, time and capital perspective. A significant benefit can be
gained from investing in growing the pool of qualified construction and operations workers, rather than
competing for workers within and across companies.
Collaborative action is required in the construction
and oil and gas industries to increase the workforce
and address labour supply challenges.
The insights below demonstrate initiatives that are
aimed at increasing the supply of skilled workers to
support the future hiring needs of oil sands
construction and operations.
ATTRACTING AND RETAINING UNDER-REPRESENTED WORKERS
Workforce groups that are under-represented in the
construction and oil sands operations sectors are
potential sources of talent to meet future demands.
The following includes a selection of initiatives aimed
to attract under-represented workers:
Association for Construction Worker
Acquisition (ACWA) is an organization of
eight oil sands construction company
owners who work with government agencies
to address the shortage of skilled workers in
Alberta’s oil sands region.29
Women Building Futures is an
organization that delivers programs and
services that enable women to enter careers
in construction trades. Services include
assessment, training, coaching, and job
search and retention support.30
The Aboriginal Programs Project was
initiated by the Alberta Chamber of
Resources (ACR) and enables its members
to share the benefits of their experiences of
working with Aboriginal communities.31
ALTERNATIVE SOURCES OF LABOUR SUPPLY
Alberta companies, governments and associations
are engaged in the recruitment of workers from
across Canada and internationally to augment local
labour supply.
Helmets to Hardhats (H2H)
This program provides an opportunity for those who
have served in the Canadian Armed Forces (Regular
or Reserve Force components) to access
apprenticeship training in order to achieve
journeyperson status in any of the applicable
trades within the construction industry.32
PRODUCTIVITY IMPROVEMENT
The efficiency of the construction workforce has
improved by utilizing the most modern and efficient
pipe and steel fabrication facilities and modular
assembly yards in North America. The development
of these processes and technologies, along with
other advances in construction workforce
procurement, training, and productivity will help meet
the challenges that face Alberta’s construction
workforce demands.
Workface Planning (WFP) is a partnership
initiative of the Alberta construction industry
and oil sands project owners. The
partnership aims to increase productivity on
worksites and mitigate some of the labour
challenges by sharing best practices and
developing workface planning training
programs.33
Individual companies are also implementing
practices to enhance oil sands construction
productivity, including implementing a
“cookie-cutter” or manufacturing
approach by constructing large projects in
smaller, repeatable phases and pre-building
sites for future expansion. Using Alberta-
based modular yards to pre-build, mitigates
the challenges associated with the following:
o equipment and materials logistics
o weather
o attracting workers to remote locations
and worker turnover
o importing/transporting modules from
outside the province or country
TRAINING AND DEVELOPMENT
Industrial Construction Crew Supervisor
is a designated occupation developed by
industry and administered and certified by

May 2014 Page 45 of 60
Oil Sands Construction, Maintenance and Operations Labour Demand Outlook to 2023
the Government of Alberta to certify the
knowledge and capabilities of construction
supervisors and foremen. The occupation
involves a combination of approved training
and specific experience to meet certification
requirements.34
The Government of Alberta has increased
training facilities for apprentices and is
taking in record numbers into a system that
already trains more apprentices than any
other Canadian jurisdiction.
The Oil Sands Learning Network is a
consortium of oil sands operators and labour
supply stakeholders coming together to
address workforce issues that impact the oil
sands. The Network’s key areas of focus
include
o increasing awareness of occupations in
demand
o establishing a framework for sharing
information between secondary and
post-secondary education
o increasing the supply of skilled trade
professionals
o ensure enough operators are available
to meet demand
Individual oil sands companies are leading
the way on investing in talent
management. This includes a variety of
activities: gathering internal metrics and
intelligence through workforce planning,
company branding, and strong career
development and succession planning
programs. Companies are also investing in
competency-based programs to assist with
shortening the “time to productivity” for new
hires, including those that are either new
graduates or from other industries.
While “Canadians first” should be top
priority, temporary foreign workers (TFW)
are a solution for filling temporary or shorter-
term work assignments. In addition,
economic immigration programs can be
utilized to address labour and skill shortages
within industry-specific occupations. Industry
and government need to continue working
together to ensure that the TFW and
economic immigration programs are meeting
the needs of the oil and gas industry.
COMBINING EFFORTS
Analysis of future workforce demands has led to an
understanding on the part of oil sands construction
and operations companies that labour and skills
constraints are not temporary. Rather, they
recognize that effective workforce planning requires
innovative and collaborative approaches that deliver
talent for both short-term and long-term timeframes.

May 2014 Page 46 of 60
Oil Sands Construction, Maintenance and Operations Labour Demand Outlook to 2023
CONCLUSION
Canada’s oil sands sector is a key contributor to the country’s economy by generating income,
investment, business opportunities and employment. While the industry continues to face obstacles
to market diversification, the sector is growing, and the outlook for employment is strong both in
industrial construction and operations. Each of these sectors share common needs and challenges
when it comes to finding skilled workers in a competitive employment environment. Examining
construction and operations together enables a closer investigation of both the magnitude of the
hiring challenges and the occupations and skills that are important for each sector.
With expansion-related hiring for both construction and
oil sands operations expected to reach approximately
98,380 jobs over the next decade, not accounting for
age-related attrition and other turnover, it’s no surprise
that companies, industry groups and several
collaborative entities are making efforts to address
labour demand challenges.
Evidently, a focus on recruiting and competing for
workers is not enough to address the skilled worker
requirements for oil sands construction and
operations. Cross-sector partnerships are growing
and this trend towards collaboration needs to continue
to address the most difficult labour supply challenges
such as attracting Aboriginal workers, trades
completions rates, skills mobility, and youth
unemployment.

May 2014 Page 47 of 60
Oil Sands Construction, Maintenance and Operations Labour Demand Outlook to 2023
APPENDIX 1: BUILDFORCE OIL SANDS CONSTRUCTION SECTOR LABOUR DEMAND METHODOLOGY
BuildForce Canada has been producing construction forecasts since 2004, using the most advanced
and detailed industry model available in Canada to accurately forecast the future demand and supply
for 33 construction trades and occupations.
BuildForce’s LMI program consists of a database and
model, annual reports, PowerPoint presentations and a
website (www.constructionforecasts.ca). The system uses
a scenario-based forecasting model and consults with
industry, including labour groups, contractors and owners,
to validate the scenario assumptions and construction
project lists. Stakeholder feedback improves the outlook
accuracy and provides information on the context in which
the data is interpreted. This approach offers efficient
access to project information and detailed first-hand
assessments of labour supply and demand by province for
individual construction trades and occupations.
The LMI system takes into account such factors as the
economic environment, demographics and major
construction projects, in order to access by province:
construction investment by sector
labour market demand requirements by trade and
occupation
changes in labour supply by trade and occupation
(new entrants, retirements and mobility)
labour market conditions by trade and occupation
This and other information is used annually to generate
national, provincial and regional Construction and
Maintenance Looking Forward reports that are used by
industry and government to help assess labour market
challenges and training requirements. The reports can be
found online at www.constructionforecasts.ca .
Summary outlook data is also available at
www.constructionforecasts.ca. Data is available for 10
provinces from 2006 to 2023 including the following:
Construction labour market statistics, by trade and
occupation.
Residential investment (new, renovation and
maintenance).
Non-residential investment (industrial, commercial,
institutional, engineering and
roads/highways/bridges, maintenance).
Key economic indicators (GDP, exchange rate,
population growth, CPI, etc.).
Commodity prices (WTI, Henry Hub, Agriculture,
Other Non-Energy).
LMI SYSTEM
The LMI model is a computer based system that links
economic conditions, major projects information and
demographics to assess construction labour market
conditions by province. The system starts with provincial
macroeconomic models that incorporate global, national
and provincial economic assumptions that are reviewed by
the provincial LMI Committee. Information on select major
construction projects developed by the provincial LMI
Committees is added to the system. Based on the
economic assumptions and major projects data the
provincial construction investment outlook, by sector,
is estimated.
To estimate labour demand requirements (expansion
demand) the forecast system uses custom trade
requirements coefficients (labour requirements by trade
per million dollars of construction investment) developed
by BuildForce to convert construction investment into
demand requirements for each of the 33 trades and
occupations by province. An increase in investment
increases the demand on construction tradespersons.
Large expenditures will increase demand on the
workforce, which leads to tighter labour markets not only
in the region where the project is taking place, but also in
other Canadian provinces as workers move to where
employment opportunities exist.
For labour supply, the LMI system breaks down the annual
change in the labour supply into key components:
Retirements (including mortality): The estimated
number of persons permanently leaving the labour force.
Persons that leave a trade as they grow older and move to
another trade or occupation are not included in this
concept as they are still in the labour force. Mortality is the
estimated number of persons in the local labour force who
become deceased during the year based on age-specific
mortality rates. Retirements plus mortality measure
permanent losses to the workforce.
New entrants: The number of residents aged 30 and
younger estimated to enter the labour force for the first
time. People in this age group are typically in a transition
from school to permanent positions in the labour force,
including apprentices that are first-time entrants to the
labour force. New apprentices that previously worked in
construction or non-construction are not included in this
concept. Each trade gets its share of total new entrants
based on historical patterns across all trades and
occupations tracked by BuildForce.

May 2014 Page 48 of 60
Oil Sands Construction, Maintenance and Operations Labour Demand Outlook to 2023
Mobility: Recruiting required by the construction industry
from other industries, other trades or occupations outside
construction and/or other provinces or countries to meet
labour requirements. Requirements are measured by the
change employment (expansion demand) plus the loss of
workers due to retirements (replacement demand) minus
new entrants.
Mobility acts as the residual source of labour, meeting
labour requirements after accounting for first-time new
entrants. This means that when construction activity
increases and the available new entrants are not sufficient
to meet demand, in-mobility will measure recruiting from
outside the industry or province. Alternatively, when
markets weaken, out-mobility will track the potential
movement of the workforce out to other industries or other
provinces. Thus, in periods of rising construction, when
local new entrants fall below requirements, in-mobility is
the only supply-side option.
Labour market conditions are assessed based on changes
in supply and demand. Conditions are summarized
through a ranking system where an annual rank from 1
(very weak conditions where workers will seek jobs in
other markets) to 5 (where labour shortages will force
recruiting from distant markets) is assigned to each trade
and occupations. Rankings are calculated as a summary
that combines measures of employment growth,
unemployment and changes in supply (retirements, new
entrants and in-mobility). Industry stakeholders contribute
their experience and expectations to the rankings to
ensure they capture market realities.
OIL SANDS MARKET ANALYSIS
BuildForce publishes the report Construction and
Maintenance Looking Forward, which assesses labour
market conditions unique to oil sands investment. The first
step in BuildForce’s methodology is to compare CAPP’s
annual Crude Oil Forecast, Markets & Transportation
outlook with other industry data sources, such as the
Alberta Government’s Oil Sands Quarterly which details
start dates and expected production by projects. The final
review is by BuildForce’s Alberta LMI Committee. If
required, the production outlook is revised to reflect
industry’s feedback. Based on projected production levels
BuildForce estimates the increased oil sands construction
investment necessary to meet the production targets and
the associated construction labour requirements. The
analysis focuses on a select group of trades and
occupations specific (with specializations noted in
parenthesis) to oil sands projects:
boilermakers
bricklayers (in refractory work)
carpenters (often as scaffolders)
construction estimators
construction managers
construction millwrights
crane operators
electricians
heavy equipment operators
heavy-duty equipment mechanics
insulators
ironworkers
steamfitters and pipefitters
trades helpers and labourers
truck drivers
Labour demand for this group spans off-site prefabrication
and modular construction, on-site construction,
maintenance and sustaining capital work. Sustaining
production from the oil sands deposits requires regular
and large-scale shutdowns for maintenance and
equipment replacement. Maintenance and sustaining
capital work will sustain a very large workforce in the key
construction trades and occupations long after
construction projects are complete.
The rankings system in the BuildForce LMI analysis was
adapted to track labour markets specific to the oil sands.
The key driver that distinguishes this market from the
overall provincial rankings is employment growth. Each
labour market is assigned an annual ranking from 1 (very
weak markets where job search is difficult) to 5 (where
labour shortages will force recruiting from distant markets).
Rankings are offered as a summary that combines the
measures of employment growth, unemployment and net
in-mobility requirements.
Rankings for the oil sands markets are generally higher
than the equivalent rankings for the province because
employment is growing more rapidly across the scenario
period. For example, employment in the oil sands
construction workforce grows by almost 40 percent
from 2014 to 2023, while the overall non-residential
construction workforce in Alberta grows by just 10 percent.
Higher rankings in the oil sands markets suggest
movement of the workforce from projects and jobs
elsewhere in the province and from other provinces
to the oil sands.
The BuildForce Canada data and reports are available
online at www.constructionforecasts.ca.
May 2014 Page 49 of 60
Oil Sands Construction, Maintenance and Operations Labour Demand Outlook to 2023
APPENDIX 2: OILMAP METHODOLOGY FOR WORKFORCE PROJECTIONS FOR OIL SANDS
CONSTRUCTION AND MAINTENANCE
The Government of Alberta’s Ministry of Jobs, Skills, Training and Labour has partnered with the
Construction Owners Association of Alberta to develop a comprehensive labour market information tool
called Oil Sands Information, Labour Market Analysis and Projection (OILMAP). The model projects
workforce requirements for Alberta’s oil sands sector (mining, in situ, upgrading, turnaround and
ongoing maintenance) at an individual and aggregate level.
OILMAP provides insight into the labour force requirements
for heavy industrial construction projects, enabling industry,
government and other stakeholders to better prepare for
workforce planning and policy development.
An outstanding feature of OILMAP is its capability to capture
the occupational breakdown of the projected demand and
the specific workforce needs for the different sub-sectors of
oil sands construction and maintenance projects (in situ,
mining, upgrading, turnaround and ongoing maintenance)
over the timeframe of the projection.
This numerical workforce projection model is driven by
current and announced (planned) oil sands construction
projects and incorporates the size, timing and different types
of oil sands construction projects to capture occupational
labour force demand for 16 key trades over the projection
horizon.
In order to project workforce requirements for oil sands
construction projects, data sets on current and planned
construction projects (size, project start and end dates, type
of project and project regulatory approval status) were
obtained from oil sands companies.
Through regression analysis, a relationship is established
between the project size (capacity) and trade hours to
estimate the hours per barrel by project type (in situ, mining
and upgrading) for the various trades type (electricians,
carpenters, e.tc.). With the estimated hours per barrel, a
projection of work hour requirements is developed using the
list of planned projects with their design capacities and
durations.
By factoring in trades timing (per cent of trade hours used at
per cent of project schedule), the estimated tradespersons’
hours are distributed per project across the project duration.
By dividing the tradespersons’ hours per project by the
average number of hours that construction trade workers put
in per month, the workforce requirements (persons) per
project are obtained. By aggregating the workforce
requirements per project and by project type, the total
workforce requirements for all the planned oil sands
construction projects are obtained.
Workforce demand projections for turnaround and ongoing
maintenance projects rely on aggregate Alberta data from
the General Presidents’ Maintenance Committee for Canada
and the National Maintenance Council for Canada with
adjustments to account for the role of non-union contractors
in maintenance.
The methodology and results of the model were validated by
industry groups including Alberta Council of Turnarounds
and Industry Maintenance Stakeholders, Rose Committee35
,
COAA, and individual oil sands companies.
OILMAP projections are based on a list of planned oil sands
projects, some of which have yet to receive regulatory
approval or board sanction. As such, the projections may not
be matched if initially planned projects are cancelled or
postponed.
Additional information about OILMAP can be obtained by
contacting:
Lance Wilson, Branch Head, Labour Market Information
and Intelligence Workforce Strategies Division, Jobs, Skills,
Training and Labour

May 2014 Page 50 of 60
Oil Sands Construction, Maintenance and Operations Labour Demand Outlook to 2023
APPENDIX 3: PETROLEUM HR COUNCIL OIL SANDS OPERATIONS SECTOR LABOUR DEMAND METHODOLOGY
The Petroleum HR Council’s labour demand projections are produced using a modelling system
developed in consultation with industry and labour market forecasting economists.
The model produces projections for the petroleum industry’s:
Employment: the number of workers required to
support the activity levels in a given year (direct
employment only).
Hiring due to industry expansion: also referred to
as “expansion demand,” this is the projected change
in the number of workers required to support industry
activity levels.
Hiring due to age-related attrition: also referred to
as “replacement demand,” this is the number of jobs
that will be vacated due to retirements and natural
deaths among industry’s workforce.
DETERMINING OIL SANDS WORKFORCE
In 2011, the Petroleum HR Council enhanced oil sands
labour market information by conducting a
headcount/workforce survey as of December 31, 2010.
Respondents represented:
100 per cent of mining production
100 per cent of upgrading production
73 per cent of in situ production
Companies were asked to report their headcount by
occupation, operation-type and location of work and to
include only those positions that are 100 per cent dedicated
to oil sands operations. Both on-site and off-site workers
(head-office roles) were included in the workforce survey.
DETERMINING OCCUPATIONAL SCOPE
Based on oil sands headcount information, the occupational
scope for oil sands labour demand was determined by
identifying the occupations/job titles that were most
prominent within each company.
Most prominent occupations/job titles were then
mapped to the 56 National Occupational
Classifications (NOC) 2011. An “other occupations”
category is used to capture any residual occupations
and ensure total oil sands workforce is accounted for.
For purpose of analysis and reporting, some
occupations were grouped resulting in 52
occupational groups. The grouped occupations
include:
o contractors and supervisors, trades and related
occupations, includes:
contractors and supervisors, mechanic
trades
contractors and supervisors, electrical trades
and telecommunications occupations
contractors and supervisors, heavy
equipment operator crews
contractors and supervisors, pipefitting
trades
contractors and supervisors, machining,
metal forming, shaping and erecting trades
and related occupations
HIRING DUE TO INDUSTRY EXPANSION
The model projects an oil sands occupation’s employment
growth using an oil sands production forecast. The
production forecast used to develop the projections in this
report was taken from CAPP’s Crude Oil and Market
Outlook36
, published in June 2013. In the outlook, there was
only one scenario developed to forecast oil sands
production, i.e., the “Growth” or “Expected” Case.
The oil sands production forecast is available by
operation-type: in situ, mining and upgrading.
Therefore, the Petroleum HR Council’s labour market
modelling can also project demand by each of those
operation-types.
The timing of oil sands employment growth aligns with
new production being realized, i.e., oil sands
production coming on-stream. It is important to note
the hiring of workers often precedes the employment
driver—particularly in a tight labour market. Oil sands
companies will ramp up hiring to meet production
goals. If the labour market is particularly tight and
there are labour shortages, a company may start
hiring six to 12 months in advance of when additional
production is scheduled to come on stream.
HIRING DUE TO AGE-RELATED ATTRITION
The Petroleum HR Council’s model also compares the ages
of retirement for each occupation to the age demographic of
industry’s core occupations to calculate age-related attrition
of the oil sands workforce. Net hiring requirements are
determined by adding the labour demand required to support
industry expansion to age-related attrition demand.

May 2014 Page 51 of 60
Oil Sands Construction, Maintenance and Operations Labour Demand Outlook to 2023
APPENDIX 4: OIL SANDS OPERATIONS WORKFORCE REQUIREMENTS TO 2023
TOTAL OIL SANDS OPERATIONS LABOUR DEMAND PROJECTIONS
Occupation (NOC) 2014
Estimated Employment
Hiring due to Net Hiring Requirements
to 2023
% of 2014 Employment Industry
Expansion % of 2014
Employment Age-related
Attrition % of 2014
Employment
Oil Sands Total 26,548 15,333 58% 6,377 24% 21,710 82%
Purchasing managers (0113)
20 17 85% 8 38% 25 123%
Engineering managers (0211)
1,037 722 70% 317 31% 1,039 100%
Construction managers (0711)
381 289 76% 79 21% 368 96%
Facility operation and maintenance managers (0714)
1,126 611 54% 324 29% 935 83%
Managers in natural resources production and fishing (0811)
700 510 73% 216 31% 726 104%
Professional occupations in advertising, marketing and public relations (1123)
54 48 89% 14 26% 62 115%
Supervisors, supply chain, tracking and scheduling co-ordination occupations (1215)
56 39 70% 16 28% 55 98%
Purchasing agents and officers (1225)
337 320 95% 102 30% 422 125%
Shippers and receivers (1521)
101 71 70% 29 28% 100 99%
Production logistics co-ordinators (1523)
6 2 33% - 0% 2 33%
Purchasing and inventory control workers (1524)
86 62 72% 24 28% 86 100%
Geoscientists and oceanographers (2113)
439 352 80% 132 30% 484 110%
Civil engineers (2131) 77 47 61% 15 19% 62 80%
Mechanical engineers (2132)
688 411 60% 129 19% 540 79%
Electrical and electronics engineers (2133)
528 306 58% 104 20% 410 78%
Chemical engineers (2134)
558 306 55% 111 20% 417 75%
Industrial and manufacturing engineers (2141)
428 315 74% 66 15% 381 89%
Metallurgical and materials engineers (2142)
43 20 47% 9 22% 29 68%
Mining engineers (2143) 169 78 46% 26 15% 104 62%
Geological engineers (2144)
55 28 51% 9 17% 37 68%
Petroleum engineers (2145)
1,024 893 87% 225 22% 1,118 109%
Chemical technologists and technicians (2211)
175 105 60% 35 20% 140 80%
Geological and mineral technologists and
335 321 96% 91 27% 412 123%

May 2014 Page 52 of 60
Oil Sands Construction, Maintenance and Operations Labour Demand Outlook to 2023
TOTAL OIL SANDS OPERATIONS LABOUR DEMAND PROJECTIONS
Occupation (NOC) 2014
Estimated Employment
Hiring due to Net Hiring Requirements
to 2023
% of 2014 Employment Industry
Expansion % of 2014
Employment Age-related
Attrition % of 2014
Employment
technicians (2212)
Civil engineering technologists and technicians (2231)
183 118 64% 44 24% 162 89%
Mechanical engineering technologists and technicians (2232)
227 148 65% 42 19% 190 84%
Industrial engineering and manufacturing technologists and technicians (2233)
47 40 85% 10 20% 50 105%
Construction estimators (2234)
67 44 66% 17 25% 61 91%
Electrical and electronics engineering technologists and technicians (2241)
148 99 67% 30 20% 129 87%
Industrial instrument technicians and mechanics (2243)
679 442 65% 143 21% 585 86%
Drafting technologists and technicians (2253)
155 102 66% 37 24% 139 90%
Land survey technologists and technicians (2254)
33 16 48% 9 28% 25 77%
Non-destructive testers and inspection technicians (2261)
228 146 64% 47 21% 193 85%
Inspectors in public and environmental health and occupational health and safety (2263)
271 191 70% 80 30% 271 100%
Natural and applied science policy researchers, consultants and program officers (4161)
181 142 78% 38 21% 180 100%
Contractors and supervisors, trades and heavy construction (7201, 7202, 7203, 7301, 7302)
425 306 72% 93 22% 399 94%
Machinists and machining and tooling inspectors (7231)
7 3 43% - 0% 3 43%
Welders and related machine operators (7237)
363 180 50% 64 18% 244 67%
Industrial electricians (7242)
659 350 53% 145 22% 495 75%
Power system electricians (7243)
33 8 24% 9 28% 17 52%
Electrical power line and cable workers (7244)
6 1 17% - 0% 1 17%
Steamfitters, pipefitters and sprinkler system installers (7252)
166 69 42% 30 18% 99 60%
Construction millwrights and industrial mechanics (7311)
609 344 56% 131 22% 475 78%

May 2014 Page 53 of 60
Oil Sands Construction, Maintenance and Operations Labour Demand Outlook to 2023
TOTAL OIL SANDS OPERATIONS LABOUR DEMAND PROJECTIONS
Occupation (NOC) 2014
Estimated Employment
Hiring due to Net Hiring Requirements
to 2023
% of 2014 Employment Industry
Expansion % of 2014
Employment Age-related
Attrition % of 2014
Employment
Heavy-duty equipment mechanics (7312)
1,106 554 50% 241 22% 795 72%
Automotive service technicians, truck and bus mechanics and mechanical repairers (7321)
51 15 29% 9 18% 24 48%
Crane operators (7371) 41 21 51% 9 23% 30 74%
Heavy equipment operators (except crane) (7521)
3,303 1,668 50% 597 18% 2,265 69%
Other automotive mechanical installers and servicers (7535)
108 53 49% 20 18% 73 67%
Supervisors, mining and quarrying (8221)
46 24 52% 9 20% 33 73%
Oil and gas drilling, servicing, and related labourers (8615)
4 2 50% - 0% 2 50%
Petroleum, gas, and chemical process operator (9232)
398 217 55% 90 23% 307 77%
Power engineers and power systems operators (9241)
4,717 3,147 67% 1,233 26% 4,380 93%
Water and waste treatment plant operators (9243)
139 135 97% 40 29% 175 126%
Other Occupations 3,725 2,361 63% 1,077 29% 3,438 92%

May 2014 Page 54 of 60
Oil Sands Construction, Maintenance and Operations Labour Demand Outlook to 2023
APPENDIX 5: GLOSSARY
Aggregated oil sands construction: Includes off-site
prefabrication and modular construction, on-site
construction, ongoing and turnaround maintenance.
Age-related attrition: Workers leaving their jobs because
of retirements and deaths.
Bitumen: Heavy, viscous form of crude oil, often found in
oil sand deposits.
Conventional: Process of recovering petroleum from a well
using standard drilling production methods.
Expansion demand: Hiring due to industry activity levels.
May be a negative number.
In situ: Technique using steam to recover oil from the sand
in oil sands extraction.
Labour market: Collective term describing the dynamics
and interaction of workers and employers, including
employment, unemployment, participation rates and wages.
Labour market information (LMI): Powerful tool to assist oil
sands partners with workforce development planning.
Labour shortage: Situation where there is not enough
labour supply to meet labour demand.
Labour supply: Availability of suitable workers in a
particular labour market.
Maintenance and sustaining capital work: Occurs at
the operations site and involves the large-scale shutdown
or “turnarounds” of plants for maintenance and equipment
replacement to ensure the operations are as efficient
as possible.
National Occupational Classification: Developed and
updated in partnership with Statistics Canada, the NOC
provides a standardized language for describing the work
performed by Canadians in the labour market.
Net hiring requirements: Sum of job openings due to
industry expansion and age-related attrition.
Non-retirement employee turnover: Ratio of the number
of workers that have to be replaced in a given time period
to the average number of workers. Turnover includes:
Employees moving from one company to another (churn)
and employees leaving the industry (leakage) but excludes
age-related attrition.
Off-site prefabrication and modular construction:
Building oil sands operations modules in a plant setting
where construction, assembly, testing and pre-
commissioning occurs in a controlled environment. Modules
are then transported to the operations site for final assembly.
Oil and gas services sector: Contracted exploration,
extraction and production services to the E&P sector. This
sector includes:
Drilling and completions services – Include drilling
and service rigs activities.
Geophysical services (also known as seismic) –
Include survey, permitting and reclamation, line
construction, drilling and data acquisition.
Petroleum services – Include well services, oilfield
construction and maintenance, production and
transportation services.
Oil sands sector: The petroleum industry sector involved in
the extraction and upgrading of bitumen.
On-site construction: Assembly and construction work that
needs to be completed in the field. In Alberta, on-site oil
sands construction takes place in the same locations as
ongoing operations.
Operations phase: Defined as the extraction, production
and upgrading of bitumen, which consists of three operation
types: mining, in situ and upgrading.
Open-pit mine: An excavation or cut made at the surface of
the ground for the purpose of extracting bitumen and remains
open to the surface for the duration of the mine’s life.
Petroleum industry: Global processes of exploration
extraction, refining, transporting and marketing
petroleum products.
Retention: Activities based on keeping or retaining workers
within a company, organization or industry.
Sector: Distinct subset of an industry whose components
share similar characteristics. Seven sectors operate in
Canada’s petroleum industry.
Steam-assisted gravity drainage (SAGD): In situ method
of producing heavy oil which involves two horizontal
wellbores, one above the other. Steam is injected into
the upper wellbore and softened bitumen is recovered
from the lower wellbore.
Turnaround Maintenance: Scheduled shutdown of oil
sands processing units or plants for overhaul and repairs.
Unemployment rate: Percentage of the economically active
population that is not working but wants to work and is
actively looking for employment.
Upgrading: Process by which heavy oil and bitumen are
converted into lighter crude by increasing the ratio of
hydrogen to carbon, normally using either coking or
hydroprocessing.
Workforce: Labour pool available in an industry
and/or sector.

May 2014 Page 55 of 60
Oil Sands Construction, Maintenance and Operations Labour Demand Outlook to 2023
LIST OF ABBREVIATIONS
ACR Alberta Chamber of Resources
ACWA Association for Construction Worker Acquisition
CAPP Canadian Association of Petroleum Producers
COAA Construction Owners Association of Alberta
CPI Consumer Price Index
JSTL Government of Alberta’s Ministry of Jobs,
Skills, Training and Labour
GDP Gross Domestic Product
H2H Helmets to Hardhats
LMI Labour market information
NOC National Occupation Classifications
OILMAP Oil Sands Information, Labour Market
Analysis and Projection
PHRC Petroleum Human Resources Council
SAGD Steam-assisted gravity drainage
TFWs Temporary foreign workers
WFP Workforce planning
WTI World Trade Institute
May 2014 Page 56 of 60
Oil Sands Construction, Maintenance and Operations Labour Demand Outlook to 2023
LIST OF TABLES
Table 1 BuildForce – Top Five Aggregated Oil
Sands Construction Labour Demand & Workforce at Peak (2019) .................................. 5
Table 2 OILMAP – Top Five On-site Oil Sands
Construction, Turnaround and Ongoing Maintenance Employment at Peak (2019) ............ 6
Table 3 Petroleum HR Council – Top Five Oil Sands
Operations Occupations with Greatest Job Increases due to Industry Activity to 2023 .......... 7
Table 4 In-scope Oil Sands Construction, Maintenance and Operations Occupations ............................ 12
Table 5 BuildForce – Aggregated Oil Sands Construction
Labour Demand and Workforce Occupational Distribution at Peak (2019) ............................... 19
Table 6 OILMAP – Distribution of On-site Oil Sands
Construction and Maintenance Workforce by Construction Type and Occupation .................. 24
Table 7 OILMAP – On-site Oil Sands Construction,
Turnaround and Ongoing Maintenance Labour Demand at Peak (2019) ....................... 25
Table 8 Petroleum HR Council – Top 10 Oil Sands
Operations Occupations With Greatest Job Increases Due to Industry Activity to 2023 ....... 27
Table 9 Petroleum HR Council – Oil Sands Operations Occupations with Above-Average Growth ......... 28
Table 10 Petroleum HR Council – Top 10
In Situ Occupations with Greatest Net Hiring Requirements to 2023 ..................... 30
Table 11 Petroleum HR Council – Top 10
Mining Occupations with Greatest Net Hiring Requirements to 2023............................ 32
Table 12 Petroleum HR Council – Top 10
Upgrading Occupations with Greatest Net Hiring Requirements to 2023 ..................... 33
Table 13 Petroleum HR Council – Power Engineer Labour Demand by Ticket Level to 2023 ........................ 34
Table 14 Petroleum HR Council – Managerial Occupations
with Above-Average Net Hiring Requirements to 2023 ...................................... 35
Table 15 Petroleum HR Council – Technical Occupations
with Above-Average Net Hiring Requirements to 2023............................ 35
Table 16 Petroleum HR Council – Supply Chain Occupations
with Above Average Net Hiring Requirements to 2023 ................................................................. 36
Table 17 Petroleum HR Council – Potential Productivity
Impacts on Oil Sands Operations Hiring Requirements to 2023 ...................................... 37
Table 18 Petroleum HR Council – Potential Hiring Due to Non-Retirement Turnover to 2023 ................ 37
LIST OF FIGURES
Figure 1 Oil Sands Construction and Operations Workforce Projections to 2023 .......................... 4
Figure 2 BuildForce – Aggregated Oil Sands Construction Workforce Projections to 2023 ........ 5
Figure 3 OILMAP – Oil Sands On-Site Construction,
Turnaround and Ongoing Maintenance Employment to 2020 ......................................... 6
Figure 4 Petroleum HR Council – Oil Sands Operations Workforce Projections to 2023........... 7
Figure 5 Oil Sands Key Operating Areas ...................... 14
Figure 6 Oil Sands Mining, In Situ and Upgrading Operations ..................................... 16
Figure 7 Total Oil Sands Construction and Operations Workforce Projections to 2023 ........................ 17
Figure 8 BuildForce – Distribution of Aggregated
Oil Sands Construction Workforce Requirements in 2014 ........................................................... 18
Figure 9 BuildForce – Aggregated Oil Sands Construction
Workforce Projections to 2023 ........................ 18
Figure 10 OILMAP – On-site Oil Sands Construction Employment to 2020 .................. 20
Figure 11 OILMAP – Oil Sands Turnaround Maintenance Employment to 2020 ................. 21
Figure 12 OILMAP – Oil Sands Ongoing Maintenance Employment to 2020 ................. 22
Figure 13 OILMAP – Oil Sands On-site Construction,
Turnaround and Ongoing Maintenance Employment to 2020 ....................................... 23
Figure 14 OILMAP – On-site Oil Sands
Construction Workforce Requirements by Construction Type ...................................... 25
Figure 15 Petroleum HR Council – Oil Sands Operations Workforce Projections to 2023......... 26
Figure 16 Petroleum HR Council – Net Hiring Requirements by Operations Type to 2023 .............................. 29
Figure 17 Petroleum HR Council – In Situ Net Hiring Requirements to 2023 .......................... 30
Figure 18 Petroleum HR Council – Mining Net
Hiring Requirements to 2023 .......................... 31
Figure 19 Petroleum HR Council – Upgrading Year-
over-Year Net Hiring Requirements to 2023 ...... 33
Figure 20 Distribution of Power Engineering Workforce in 2010 ........................................... 34
Figure 21 Cross Canada Industrial Construction ............ 38

May 2014 Page 57 of 60
Oil Sands Construction, Maintenance and Operations Labour Demand Outlook to 2023
ENDNOTES
1 The Conference Board of Canada. (2012, October). Fuel for Thought: The Economic Benefits of Oil Sands Investment for Canada’s Regions.
Retrieved from http://www.conferenceboard.ca/e-library/abstract.aspx?did=5148
2 Canadian Association of Petroleum Producers. (2013). Crude Oil Forecasts, Markets and Transportation Report. Retrieved from
http://www.capp.ca/getdoc.aspx?DocId=227308&DT=NTV
3 Peak is defined as the highest annual average value (point) in the projection period due to the ramp up of workers required to meet
production goals.
4 Statistics Canada. (2014, April 4). Labour Force Characteristics, seasonally adjusted, by province. Retrieved from
http://www.statcan.gc.ca/tables-tableaux/sum-som/l01/cst01/lfss01c-eng.htm
5 Statistics Canada. (2014, January 10). Labour force characteristics by province – Seasonally adjusted. Retrieved from
http://www.statcan.gc.ca/daily-quotidien/140110/t140110a003-eng.htm
6 Petroleum Human Resources Council. (2013, April). The Decade Ahead: Oil Sands Labour Demand Outlook to 2022. Retrieved from
http://www.careersinoilandgas.com/labour-market-information/reports/
7 Statistics Canada. (2013). Railway carloadings of fuel oils and crude petroleum. Found at: http://www.statcan.gc.ca/pub/11-626-x/2013030/c-
g/desc/desc08-eng.htm
8 Financial Post. (2013) Canadian oil sands deals slump to 9-year low on heightened government scrutiny. Retrieved from
http://business.financialpost.com/2013/09/30/canadian-oil-sands-deals-slump-to-9-year-low-on-heightened-government-scrutiny/?__lsa=d5f7-
bc38)
9 Suncor Energy Inc. Fort Hills Oil Sands Project. Retrieved from http://forthills.suncor.com/
10 The Conference Board of Canada. (2012, October). Fuel for Thought: The Economic Benefits of Oil Sands Investment for Canada’s
Regions. Retrieved from http://www.conferenceboard.ca/e-library/abstract.aspx?did=5148
11 Canadian Association of Petroleum Producers. (2014, February 12). Oil and natural gas industry supports budget measures for improved
access to skilled trades training and building future workforce. Retrieved from
http://www.capp.ca/aboutUs/mediaCentre/NewsReleases/Pages/Oilandnaturalgasindustrysupportsbudgetmeasuresforimprovedaccesstoskille
dtradestrainingandbuildingfutureworkforce.aspx
12 BuildForce Canada is formerly the Construction Sector Council.
13 Labour demand projections for the in-scope occupations have been mapped to the corresponding National Occupational Classification
(NOC) 2011. For more information about NOC 2011, visit http://www5.hrsdc.gc.ca/NOC/English/NOC/2011/Welcome.aspx
14 Sustaining capital are the expenditures required to sustain/maintain existing assets. This includes ensuring that assets retain their design
value in terms of productive capacity and enhancing assets to minimum standards for reliability, safety and environmental security.
15 Estimated to be 75 per cent of the workforce involved in off-site prefabrication and modular construction, on-site construction, maintenance
and sustaining capital work. (BuildForce)
16 Estimated to be 90 per cent of the on-site oil sands construction workforce. (OILMAP)
17 Estimated to be 86 per cent of the oil sands workforce hired by oil sands companies. (Petroleum HR Council)
18 Includes Contractors and supervisors, electrical trades and telecommunications occupations (7202), heavy equipment operator crews
(7302), machining, metal forming, shaping and erecting trades and related occupations (7201), mechanic trades (7301), and pipefitting trades
(7203).
19 Government of Alberta. Alberta Oil Sands Industry Quarterly Update (Spring 2014). Retrieved from
https://albertacanada.com/business/statistics/oil-sands-quarterly.aspx
20 Government of Alberta. Alberta Oil Sands Industry Quarterly Update (Spring 2014). Retrieved from
https://albertacanada.com/business/statistics/oil-sands-quarterly.aspx
21 BuildForce Canada. (2014, April). Construction and Maintenance Looking ForwardAlberta Oil Sands 2014 – 2023 Highlights. Retrieved
from http://www.buildforce.ca/en/products/alberta-oil-sands-2014-highlights
22 Due to the seasonal nature of the work, construction workers that focus on turnaround maintenance need to be prepared to move between
turnaround/shutdown projects, work seasonally and be away from home for long periods of time.

May 2014 Page 58 of 60
Oil Sands Construction, Maintenance and Operations Labour Demand Outlook to 2023
23 Welders do not include sub- specialties like pipefitter welders, boilermaker welders, etc.; these are included under the respective trades
(pipefitters, boilermakers, etc.).
24 Social license to operate is defined as the ongoing approval and/or broad social acceptance with the local community and other
stakeholders. http://socialicense.com/definition.html
25 Supply chain professionals play a key role in the procurement of contractors and vendor management as well as the administration of
associated contracts. They are also responsible for finding cost-saving opportunities for the company. Supply chain occupations also help to
enable timely and cost-effective turnaround maintenance by ensuring the right equipment, materials and skills are available at the right time.
26 Statistics Canada. (2011, August 17). Study: Projected Trends to 2031 for the Canadian labour force. Retrieved from
http://www.statcan.gc.ca/daily-quotidien/110817/dq110817b-eng.htm
27 Labour productivity measures the amount of output produced per hour worked. The Petroleum HR Council’s labour demand model assumes
a one per cent productivity rate. 28
Statistics Canada. Labour Force Characteristics, seasonally adjusted, by province. Released April 4, 2014.
29 Suncor Energy Oil Sands Question and Response Blog. (2012, July). Oil Sands Growth: Solving Worker Shortages. Retrieved from
http://osqar.suncor.com/2012/07/oil-sands-growth-solving-worker-shortages.html
30 Women Building Futures, http://www.womenbuildingfutures.com/
31 Alberta Chamber of Resources, Aboriginal Programs Project, http://www.acr-alberta.com/AboriginalProgramsProject/tabid/229/Default.aspx
32 Helmets To Hardhats, http://www.helmetstohardhats.ca/en/home.htm
33 WorkFace Planning (WFP) is a best practice that emphasizes the development of small, manageable work packages in construction
projects so that construction crews can perform their work safely, effectively, and efficiently.
34 Alberta’s Apprenticeship and Industry Training. Industrial Construction Crew Supervisor Job Profile. Retrieved from
http://tradesecrets.alberta.ca/trades-occupations/profiles/208/
35 The Rose Committee is comprised of Managers of Turnaround projects in Alberta’s oil sands and non-oil sands companies
36 Canadian Association of Petroleum Producers (2013) Crude Oil Forecasts, Markets and Transportation report. Retrieved from
http://www.capp.ca/forecast/Pages/default.aspx

May 2014 Page 59 of 60
Oil Sands Construction, Maintenance and Operations Labour Demand Outlook to 2023
ACKNOWLEDGEMENTS
The Petroleum Human Resources Council (a division of Enform Canada) gratefully acknowledges
the Government of Alberta for the funding to undertake and complete this study.
The Petroleum HR Council is grateful for the time and expertise provided by BuildForce Canada, Construction
Owners Association of Alberta, and the Government of Alberta’s Ministry of Jobs, Skills, Training and Labour and
also by oil sands company representatives and Canadian Association of Petroleum Producers staff.
Last but not least, the Petroleum HR Council acknowledges the contributions of Creative Links International Inc.,
Cheryl Knight and Associates and Clay Graphic Design Inc. for assisting in the production of this report.
Copyright © Petroleum Human Resources Council 2014
Published May 2014
Disclaimer
All rights reserved.
The reader of this report has permission to use “limited labour market information (or LMI) content” for general reference or educational purposes in the reader’s
analysis or research reports. “Limited LMI Content” is defined as not exceeding 400 words or a maximum of two data tables or graphs per document. Where
Limited LMI Content is used, the reader must cite the source of the Limited LMI Content as follows: Source (or “adapted from”): Petroleum Human Resources
Council, name or product, catalogue, volume and issue numbers, reference period and page(s).
The reader of this report cannot:
Market, distribute, export, translate, transmit, merge, modify, transfer, adapt, loan, rent, lease, assign, share, sub-license or make available to
another person or entity, this report in any way, in whole or in part
Use this report and its contents to develop or derive any other information product or information service for commercial distribution or sale
Use this report and its contents in any manner deemed competitive with any other product or service sold by the Petroleum HR Council
The information and projections contained herein have been prepared with information sources the Petroleum HR Council has deemed to be reliable.
The Petroleum HR Council makes no representations or warranties that this report is error free and therefore shall not be liable for any financial or other
losses or damages of any nature whatsoever arising from or otherwise relating to any use of this document.
The opinions and interpretations in this publication are those of the Petroleum HR Council and do not necessarily reflect those of the Government of Alberta.
For more information, contact:
Petroleum Human Resources Council (a division of Enform Canada)
Phone: 403-516-8100; Fax: 403-516-8171
Email: [email protected]
www.careersinoilandgas.com

In Partnership With
The Petroleum Human Resources Council (a division
of Enform Canada) is the primary resource to address
workforce development and labour market issues in the
Canadian petroleum industry. We provide innovative and
strategic HR solutions to help the industry develop its
workforce and proactively address labour challenges.
The Petroleum HR Council addresses issues by:
developing strategies, solutions, products and services to address industry’s short, medium and long-term workforce issues
facilitating the exchange of ideas and information
providing industry-related information on workforce issues and career opportunities
Learn more about the Petroleum HR Council
and find our labour market information reports
at www.careersinoilandgas.com or contact us at
403-516-8100 or at [email protected]
for more information.
www.careersinoilandgas.com
contact us at
follow us on