Embed Size (px)
Citation preview

© Academy of Sciences Malaysia 2015
All rights reserved. No part of this publicaion may be reproduced, stored in a retrieval system, or transmited in any form or by any means, electronic, mechanical, photocopying, recording, or otherwise without prior permission of the copyright owner.
The views and opinions expressed or implied in this publicaion are those of the author and do not necessarily relect the views of the Academy of Sciences Malaysia.
ASM Advisory Report 03/15
Endorsed: December 2015
Perpustakaan Negara Malaysia Cataloguing-in-Publicaion Data
CARBON FREE ENERGY : ROADMAP FOR MALAYSIA
ISBN 978-983-2915-28-7
1. Carbon – Environmental aspects.
2. Renewable energy sources – Technological innovaions.557.1440286
Published by:
Academy of Sciences Malaysia
Level 20, West Wing, MATRADE Tower,Jalan Sultan Haji Ahmad Shah, of Jalan Tuanku Abdul Halim,50480 Kuala Lumpur, MalaysiaPhone : +6 (03) 6203 0633
Fax : +6 (03) 6203 [email protected]
v
Contents
Foreword viii
Preface x
Carbon Free Energy Task Force Committee & Contributors xii
Abbreviations xv
Executive Summary xviii
Chapter 1: Background & Introduction
1.1 Background 2
1.2 Introduction to Carbon Free Energy Task Force 7
Chapter 2: The Current Status of Carbon Free Energy Technologies
2.1 Bioenergy 10
State of the Art 10
Applications in Malaysia 11
The Potential of Technologies 13
Initiatives in Malaysia 14
2.2 Geothermal 15
State of the Art 15
Applications in Malaysia 16
The Potential of Technologies 16
Initiatives in Malaysia 18
2.3 Hydropower 19
State of the Art 20
Applications in Malaysia 25
The Potential of Technologies 26
Initiatives in Malaysia 26
vi
2.4 Nuclear Energy 27
State of the Art 28
Applications in Malaysia 32
The Potential of Technologies 34
Initiatives in Malaysia 35
2.5 Ocean Thermal Energy Conversion (OTEC) 37
State of the Art 38
Applications in Malaysia 39
The Potential of Technologies 39
Initiatives in Malaysia 40
2.6 Solar Photovoltaic 41
State of the Art 41
Applications in Malaysia 43
The Potential of Technologies 47
Initiatives in Malaysia 49
2.7 Wave Energy and Tidal Current Energy 51
State of the Art 51
Applications in Malaysia 54
The Potential of Technologies 54
Initiatives in Malaysia 56
2.8 Wind Energy 56
State of the Art 56
Applications in Malaysia 57
The Potential of Technologies 60
Initiatives in Malaysia 64
Chapter 3: Carbon Free Energy Roadmap
3.1 Methodology Approach 66
Stage 1: Planning and preparation 66
Stage 2: Roadmap development workshop 68
Stage3:Reviseandreiningtheroadmap 70 3.2 Introduction of Hydrogen Economy 71
3.3 Projections of Future Energy Mix Patterns 72
3.4 Vision for Carbon Free Energy Future 73
vii
Scenario-1: Carbon Free Energy Mix in Electricity Generation 74
•DirectElectricityGeneration 74 •HydrogenGenerationContributetoFuelCell 75 •TotalInstalledCapacity 76 •CarbonFreeEnergyinDiverseFutureEnergyMix 77 •CarbonDioxide(CO
2) Emission Avoidance 78
Scenario-2: Net Zero Carbon Emissions 79
•DirectElectricityGeneration 79 •HydrogenGenerationContributetoFuelCell 80 •TotalInstalledCapacity 82 •CarbonFreeEnergyinDiverseFutureEnergyMix 84 •CarbonDioxide(CO
2) Emission Avoidance 85
Chapter 4: Technology Development Roadmap: Action Plan and Time Frame
4.1 Bioenergy 87
4.2 Geothermal 89
4.3 Hydropower 91
4.4 Nuclear Energy 94
4.5 OTEC 95
4.6 Solar Photovoltaic 96
4.7 Wave Energy and Tidal Current Energy 99
4.8 Wind Energy 100
4.9 Fuel Cell & Hydrogen Energy 102
Chapter 5: Conclusions and Key Messages to Decision Makers 107
References 108
viii
In carrying out its mandate as the ‘Thought Leader’ in science, technology and innovation (STI),
the Academy of Sciences Malaysia (ASM) has always endeavoured to address the nation’s highest
concerns. On the energy front, the focus of ASM’s strategic studies has been on greening energy
through technology. Malaysia has responded to anticipated energy security crisis and climate
change risks by diversifying fuel-resources to include renewable and alternative energy as well
as developing green technologies for the future. In consonance with this, ASM completed three
energyrelatedadvisoryreportsthisyearnamelyCarbonFreeEnergyRoadmap,EnergyEficiencyand Energy Usage in Transportation, and Blueprint for Fuel Cell Industries in Malaysia.
The global energy landscape is rapidly changing to respond to growing demand and the
need to minimise environmental impact. Today, we are not totally reliant on fossil fuels for
energy.Energysourcesaremorediversiiedrangingfromthedeepbelowtheoceanloor,thesun,wind,biomass,bedsofshalerockaswellasnuclearission.However,sourcesofenergywhich are relevant to Malaysia need to be effectively harnessed through science, technology and
innovation.
Malaysia pledged a voluntary reduction of up to 40% in terms of emissions intensity of
grossdomesticproduct(GDP)bytheyear2020comparedto2005levelsattheConferenceofParties (COP15) to the United Nations Framework Convention on Climate Change (UNFCCC)
in Copenhagen in 2009. To ensure the achievement of this target, Malaysia has embarked on
implementing several national policies, legislation and strategies such as the National Green
Technology Policy (2009), National Renewable Energy Policy and Action Plan (2010), New Energy
Policy (2010), Renewable Energy Act (2011) and National Biomass Strategy 2020 (2011). The
adoptionofrenewableenergyandpromotionofenergyeficiencyinitiativesareimportanttomeet Malaysia’s energy needs in the long run.
Foreword
ix
In playing our part to contribute to this effort, ASM through its Task Force on Carbon Free
Energy embarked on this study and developed the roadmap for Malaysia to achieve net zero
carbon emission by 2050. The task force has engaged various stakeholders and experts in the
energy arena during the course of this study. I believe this report is timely as we usher a new era
ofenergypossibilitiesthroughcuttingedgescientiicinterventionsandtechnologies.
IwishtocongratulatetheASMTaskForceonCarbonFreeEnergychairedbyProfessorDato’DrKamaruzzamanSopianFAScforproducingthisadvisoryreport.ThisReportwouldnothavebeen possible without the strong support, cooperation as well as relevant constructive input from
variouspartiesincludingGovernmentministriesandagencies,thescientiiccommunity,industrypractitioners as well as the corporate sector.
I hope this advisory report would provide valuable insights towards ensuring a secure and
sustainable energy future for Malaysia.
Tan Sri Dr Ahmad Tajuddin Ali FASc.
President of the Academy of Sciences Malaysia
x
Malaysia’s commitment at the United Nations Climate Change Conference 2009 (COP 15) to
reduceupto40%ofitsemissionintensityofGDPbytheyear2020comparedtothe2005levels has resulted in several national level renewable power capacity targets. These include
the achievement of 985 MW of installed renewable power capacity by 2015, contributing 6%
of generation, rising to 11% in 2020, 17% in 2030 and 73% in 2050. Nonetheless, as of 31
December2014,only243.4MWhasbeenconnectedtothegridandthisrepresentsonlyabout1% of the total installed capacity in Peninsular Malaysia and Sabah. Meeting the set target
is a big challenge. Hence, it is necessary to develop an achievable roadmap considering the
adoption of appropriate policies and strategies as well as enhancement of a sustainable market
for relevant technologies.
Though there were earlier roadmaps developed by various agencies for renewable energy
technologies, none of these roadmaps were designed based on carbon emission from the energy
sector. Thus, the ASM Task Force on Carbon Free Energy embarked on developing a roadmap
with a set target to achieve a carbon free energy future by 2050. The energy targets by this
taskforceweresetthroughscenarioanalysisinwhichthetaskforceidentiiedthedesirablefuture and conducted “back-casting” instead of the normal “forecasting”. Thus, development
paths between the future and the present were created in terms of strategies and concrete
action plans, describing a continuous process of change towards realising the desirable future.
Nevertheless, the scope of this roadmap focuses only on the electricity sector with a projection
period of 2015 to 2050.
“Carbonfree”inthisroadmaphasbeendeinedas“netzerocarbonemissions”wherethetotal carbon dioxide emission avoidance from the carbon free energy resources will off-set the
emissions from the fossil fuels combustion by 2050; whereas the “Carbon free energy resources”
refer to resources that have no carbon emission or with net zero emissions of carbon. Therefore,
the energy resources considered in this roadmap are bioenergy, geothermal, hydropower, nuclear
Preface
xi
energy, ocean thermal energy conversion (OTEC), solar photovoltaic (PV), wave and tidal current
as well as wind energy. Moreover, hydrogen generation from renewable energy as an energy
carrier has been proposed by this task force and consequently fuel cell technology has been
included in this present roadmap.
The task force has reviewed the potential of the carbon free energy resources and their
challenges, followed by the development of a roadmap, back-casting of the scenarios from 2050
to the present. Recommendations and action plans were also deliberated through brainstorming
sessions with the stakeholders.
Inordertoachievetheseambitiousenergytargetsandgoals,adiversiiedenergymixiscrucial. This roadmap excels in exploring all kinds of indigenous carbon free energy resources
including the potential of fuel cell technology, compared to other existing roadmaps that
only considered a few types of renewable energy. Hence, this report provides insights and a
quantitative framework for policymakers to understand the supply and demand of the future
energy trends. This would facilitate the formulation of appropriate policies and targets to address
energy related issues and challenges.
Professor Dato’ Dr Kamaruzzaman Sopian FASc,
Chairman of ASM Task Force on Carbon Free Energy
xii
Carbon Free Energy Task Force Committee & Contributors
Task Force Committee
ProfessorDato’DrKamaruzzamanSopianFASc,UKMChairman of Task Force
Editor
Working Group Leader of Solar PV
ProfessorIrDrAbdHalimShamsuddinFASc,UNITENWorking Group Leader of Hydropower
ProfessorDato’IrDrAbdulWahabMohammadFASc,UKM
ProfessorDato’IrDrAbuBakarJaafarFASc,UTMEditor
Working Group Leader of OTEC
ProfessorDato’DrBaharudinYatim,UKMEditor
Working Group Leader of Nuclear Energy
AssociateProfessorDrChongWenTong,UMWorking Group Leader of Wind Energy
ProfessorDrHamdaniSaidiFASc,UTM
ProfessorDrMasjukiBinHajiHassan,UM
xiii
ProfessorDrMohdAliHassan,UPMWorking Group Leader of Bioenergy
ProfessorDato’DrMohdYusofHjOthmanFASc,UKM
Experts
ProfessorDrMohdZamriIbrahim,TATIUCWorking Group Leader of Wave & Tidal Current
ProfessorDrSanudinTahir,UMSWorking Group Leader of Geothermal
Workshop Participants
Abdul Bahari Othman, TNB Research Sdn. Bhd (Contributed in Chapter 2.3)
AmiruddinKemat,MDVAssociateProfessorDrAzhailiBaharun,UNIMASProfessorDrFaridNasirHajiAni,UTMCaptainZaharuddinMohdMaideen,NOD,MOSTIG. Lalchand, ASM
Hamdan Mokhtar, SIRIM
JeyaSeelanSubramaniam,EPUMahalil Amin Abdul Malek, MIGHT
MichelleKwa,ISISMohamadFaizFirman,KinetixTechnologiesDrMohdAmranMohdSalleh,UPMMohd Ilham Udin, MOSTI
DrMohdShaharinUmar,EPUMuhammad Nazry Chik , TNB Research Sdn. Bhd.
Muhammad Rawi Mohamed Zin, MNA
Nasrin Abu Bakar, MPOB
ProfessorDrNoraniMutiMohamedFASc,UTP(WorkshopGroupLeader:SolarPV)AssociateProfessorDrNorMariahAdam,UPMAssociateProfessorDrNorZainiZakaria,UiTMNurazninWahabSharifuddin,MDV
Carbon Free Energy Task Force Committee & Contributors
xiv
PaulWongKokKiong,KeTTHARosliDarmawan,MNADrSamsudinMusa,FRIMSashikalaMaruthaiPillai,MARDIAssociateProfessorDrSuzanaYusup,UTPDrWongPuiWah,MIGHT
Writer
DrChanHoyYen,UKM
Coordinated & Managed by
Mohd Ikhwan Abdullah, ASM
Nitia Samuel, ASM
The task force would like to thank those who participated and contributed towards the shaping
of the Carbon-Free Energy vision.
Carbon Free Energy Task Force Committee & Contributors
xv
Abbreviations
ASEAN Association of Southeast Asian Nations
ASM Academy of Sciences Malaysia
CAAGR Compounded Average Annual Growth Rate
capex Capital expenditures
CO2
CarbonDioxideEFB Empty fruit bunches
EPP Entry Point Project
EPU Economic Planning Unit
ETP Economic Transformation Programme
FMM Federation of Malaysian Manufacturers
GDP GrossDomesticProductGNI Gross national income
GWh Gigawatt-hour
IAEA International Atomic Energy Agency
IEA International Energy Agency
INTAN Institut Tadbiran Awam Negara
JLM JabatanLautMalaysiaJMGM JabatanMineraldanGeosainsMalaysiaJKR JabatanKerjaRayaJPN JabatanPendaftaranNegaraJPS JabatanPerairanandSaliranJUPEM JabatanUkurdanPemetaanMalaysiaKeTTHA KementerianTenaga,TeknologiHijaudanAir/MinistryofEnergy,GreenTechnologyandWaterKKLW KementerianKemajuanLuarBandardanWilayahMalaysia/MinistryofRural&Regional
DevelopmentLNG LiqueiednaturalgasMDV MalaysiaDebtVenturesBerhadMGTC Malaysian Green Technology Corporation
xvi
MIDA MalaysianInvestmentDevelopmentAuthorityMETMalaysia MalaysianMeteorologicalDepartmentMF MesocarpiberMITI Ministry of International Trade and Industry
MNPC Malaysia Nuclear Power Corporation
MOA Ministry of Agriculture
MOE Ministry of Education
MOF Ministry of Finance
MOHA Ministry of Home Affairs
MOHE Ministry of Higher Education
MOSTI Ministry of Science, Technology and Innovation
MOTAC Ministry of Tourism and Culture Malaysia
MSW Municipal solid waste
MW Megawatt
NAHRIM National Hydraulic Research Institute of Malaysia
NanoMalaysia NanoMalaysia Berhad
NBS National Biomass Strategy
NEB National Energy Balance
NGO Non-Government Organisation
NKEAs NationalKeyEconomicAreasNRE Ministry of Natural Reseaorces and Environment
OTEC Ocean thermal energy conversion
PKS Palm-kernel shells
POME PalmoilmillefluentPV Photovoltaic
RE Renewable energy
SEB Sarawak Energy Berhad
SEDA SustainableEnergyDevelopmentAuthoritySESB Sabah Electricity Sdn Bhd
SIRIM SIRIM Berhad, formerly known as the Standards and Industrial Research Institute of Malaysia
SPV Special Purpose Vehicle
ST Suruhanjaya Tenaga
STIPAC Science Technology Innovation Policy Advisory Committee
TATIUC TATI University College
TCT Tidal current turbine
Abbreviations
xvii
TES Total energy supply
TGE Tawau Geothermal Energy
TNB Tenaga national Berhad
UMS Universiti Malaysia Sabah
UKM UniversitiKebangsaanMalaysiaUM Universiti Malaya
UNIMAS Universiti Malaysia Sarawak
UNITEN Universiti Tenaga Malaysia
UPM Universiti Putra Malaysia
UTM Universiti Teknologi Malaysia
UTP Universiti Teknologi PETRONAS
Abbreviations
xviii
Executive Summary
The main deliverable of the Carbon-Free
Energy Task Force is the Carbon-Free
Energy Roadmap for Malaysia (2015 – 2050).
The roadmap aims to assess the prospects
of energy mixes and actions that need to be
undertaken to achieve a carbon-free energy
future for Malaysia. Furthermore, the roadmap
also provides policymakers a quantitative
framework to understand the supply and
demand of the future energy trends and
hence to formulate appropriate policies and
targets to address energy related issues and
challenges.
The scope of the roadmap focuses only on
the electricity sector for the projected period
of 2015 to 2050. Carbon-free energy in this
report refers to energy sources that have no
carbon emission or with net zero emissions of
carbon. These energy resources are bioenergy,
geothermal, hydropower, nuclear energy,
ocean thermal energy conversion (OTEC), solar
photovoltaic (PV), wave and tidal current, and
wind energy. Moreover, hydrogen generation
from renewable energy as an energy carrier
was also proposed by this task force, and thus
fuel cell was included as an additional energy
conversion system during the later stage of the
roadmap development process.
This roadmap has been developed
through a series of meetings to gather
inputs and discussions on the technological
and deployment issues among the task
force committee. In addition, the task force
conducted a Carbon-Free Energy Roadmap
WorkshopinMalacca,from20to22January2015. Stakeholders from universities, power
sectors,R&Dinstitutions,inancecommunity,industries and government institutions were
invited to the workshop for brainstorming
sessions to discuss the targets and action plans
for the carbon-free energy vision.
After the workshop, the scope and targets
were further reviewed and revised through
several meetings and email communications.
The task force arrived at two different
scenarios for the carbon-free energy roadmap.
Scenario-1 aims to achieve carbon-free energy
mix in electricity generation by 2050; and
Scenario-2 aims to achieve net zero carbon
emissions in electricity generation by 2050.
Highlightsoftheindingsaresummarisedasfollows:
xix
Scenario-1: Carbon Free Energy Mix in
Electricity Generation
In this scenario, carbon free energy sources
have been introduced, and by 2050, fossil
fuels will be completely phased out and
replaced by eight types of alternative resources
in energy mix:
1) Among these resources, OTEC with an
estimated capacity factor of 0.9 can be
the main supplier of energy. Hence, this
comprises about 41% of the electricity
generation mainly for the production of
hydrogen.
2) Wind energy, would be the second major
resource for electricity supply. This wind
energy is generated from on and offshore
facilities.
3) Combined wave and tidal current energy
will be the next important resource for
electricity generation.
4) Solar PV, whilst its technology and
market have been well developed, the
low capacity factor remains a constraint
due to the low availability of resources (4
hours during daytime only). Nonetheless,
the peak performance operational time
of solar PV – midday - happens to be
also the peak demand period of the day.
This gives an advantage to solar PV in
supplying for peaking loads.
5) Presently, the main sources for bioenergy
in Malaysia are the biomass from the oil
palm industry. However, the wastes of
the oil palm can be turned into value-
added products such as fertilisers and
Executive Summary
animal feedstock that can generate more
income. It is not extensively used as an
energy resource for electricity generation.
Hence, it is expected that in the future, the
main sources for bioenergy in electricity
generation would come from municipal
solid waste and biogas despite the
abundance of oil palm wastes.
6) Theirstnuclear power station has been
planned for 2021. In this report, it is
assumed that a total of 2 GW nuclear
power plants will be in place by 2025. This
energy resource can help in supplying
non-carbon electricity for the medium
term action plan due to the fact that other
alternative resources might take a longer
time to be developed.
7) Hydropower plants in Malaysia are mainly
commissioned for large-scale electricity
generation. The operational capacity
needs to be controlled in relation to its
environmental impact. Hydropower has
been used as peaking power plants and
for reserve margin. These strategies will be
continued in future energy mixes.
8) Geothermal is relatively a new technology
in Malaysia. Its technology will take a
longer time to develop due the lack of
expertise and experience. In addition,
suitable sites for geothermal are limited in
Sabah. These contributing factors mean
geothermal will have the smallest share in
electricity generation.
The projections show that between 2035
and 2040, the present proposed energy
xx
mix will be able to achieve a net zero CO2
emission in the electricity sector. Furthermore,
in 2050, the total avoidance is about 217
Gtonnes of CO2. This amount is equivalent to
approximately the amount of emission avoided
from 106petagrams of coal burned.
Scenario-2: Net Zero Carbon Emissions
In this scenario, the total carbon dioxide
emission avoidance from carbon free energy
sources will offset the emissions from fossil
fuel combustion by 2050. Fossil fuels together
with nine carbon free energy resources will
contribute to in future energy mix as follows:
1) Fossil fuels will play an important role
in power generation, however, its share
of electricity generation in 2050 (97%)
will be reduced by more than half (42%)
compared to 2012.
2) Among the carbon-free energy resources,
OTEC will be the main supplier,
accounting to about 17% of electricity
generation by 2050. Furthermore, 50%
of its total installed capacity will be used
for hydrogen generation by 2050, making
it the main energy source for hydrogen
generation.
3) Fuel cell will be the next important
energy conversion system after OTEC.
However, full cell will rely on other carbon-
free energy sources that contribute to
hydrogen production. The share of fuel cell
in electricity generation (2020-2050) can
only be achieved if the energy supply for
hydrogenproductionissuficient.4) The capacity factor of bioenergy is higher
compared to wind energy and solar PV.
Moreover, electricity generation from the
bioenergy is higher compared to wind
and PV, although it has a smaller amount
Executive Summary
of installed capacity. In this scenario, it
is assumed that about 90% of municipal
solid wastes will be treated by incineration.
Furthermore, municipal solid wastes will
contributesigniicantlyintheelectricitygeneration mix.
5) Wind energywillbetheifthmajorenergysource for electricity generation by 2050.
6) Solar PV shares about the same amount
of installed capacity as wind energy.
However, electricity generation from the
PV is less than wind because of its lower
capacity factor.
7) Nuclear energy will supply non-carbon
electricity in the medium-term action plan.
Nuclear energy technology is relatively
more mature than other carbon-free
energy resources in terms of big-scale
commercial power plants. Hence, nuclear
energy is able to ease the reduction of
fossil fuel consumption when other carbon-
free energy technologies are still in their
developing stages.
8) The combination of wave energy and
tidal current energy will be the next
important source that can contribute to
electricity generation.
9) Hydropower plants in Malaysia are mainly
large scale. They are used as peaking
plants and reserve margin. However,
the operational capacity needs to be
controlled to safeguard the environment.
10) Geothermal is relatively a new technology
inMalaysia.Duetolackofexpertiseandexperience, it will take a longer time to
develop the technology. In addition,
suitable sites for geothermal are limited.
This results in geothermal resources as
having the smallest share in electricity
generation.
xxi
The projections show that by 2050, the present proposed energy mix would be able to offset
emissionsfromfossilfuelcombustionandinallyachieveanetzeroCO2 emission in the electricity
sector. In 2050, the total avoidance is about 92 billion tonnes of CO2. This amount is equivalent to
approximately emission avoided from 44 petagrams of coal burned.
Conclusions and Key Messages to Decision Makers
Basedontheindings,thetaskforcewouldliketoproposethatScenario-2isadoptedastheCarbon-Free Energy Roadmap for Malaysia. In this scenario, the “Carbon-Free Energy” is referred
to as “the total carbon dioxide emission avoidance from carbon-free energy sources that will
offset emissions from fossil fuel combustion by 2050 in the energy mix”.
Keymeasuresthattheteamwouldliketohighlighttothedecisionmakersareasfollows:
Executive Summary
1 6
7
8
9
10
2
3
4
Increase the share of renewable energy
(RE) in the energy mix by setting
long-term targets for RE deployment,
consistent with national energy
strategies and national contributions
to global climate change mitigation
efforts.
Enhance personnel capacity in RE
through training courses, university
and school curriculums.
Advanced planning of new RE plants
and thus address issues related to land
use and sea use planning.
Develop a inance mechanism that would attract and aide renewable
energy project developers.
Integrate energy policy with national
mitigation and adaptation plans to
address climate change issues.
Strengthen the institutional
framework in planning,
implementing, monitoring and
evaluating the policies and projects
related to energy and climate
change mitigation.
Explore the potential of RE resources
of wind, OTEC, wave and tidal current,
and geothermal.
Explore fuel cell technologies, including
the potential of large-scale applications
(power plant) for hydrogen economy in
the future.
Strengthen research and development,
knowledge and technology transfer
through international collaboration,
demonstration and deployment in local
context.


Background & Introduction
Chapter 1
2
1.1 Background
Energy Sector and Climate Change
TheKyotoProtocollegallybindsdevelopedcountries to emission reduction targets. The
Protocol’sirstcommitmentperiodstartedin2008 and ended in 2012. At the Conference of
theParties(COP)16inCancuninDecember2010, 196 Parties to the United Nations
Framework Convention on Climate Change
(UNFCCC) agreed a long-term global goal
of limiting the increase in global average
temperature below 2°C relative to pre-
industrial levels; whereby the concentration
of greenhouse gases stabilises after 2100 at
around 450ppm – “450 Scenario”. The second
commitmentperiodbeganon1January2013and will end in 2020. Hence, the Parties will
meet at the COP 21 to sign a new climate
changeagreement(ParisDeclaration)pledgingsupport for an international climate deal in
December2015.PriortotheCOP21,countriesaccounting for 34% of global energy-related
emissions had submitted their Intended
NationallyDeterminedContributions(INDCs)by 14 May 2015. The IEA has undertaken a
irstassessmentofnewlydeclaredgovernmentintentions, with the results presented through
an“INDCScenario”.
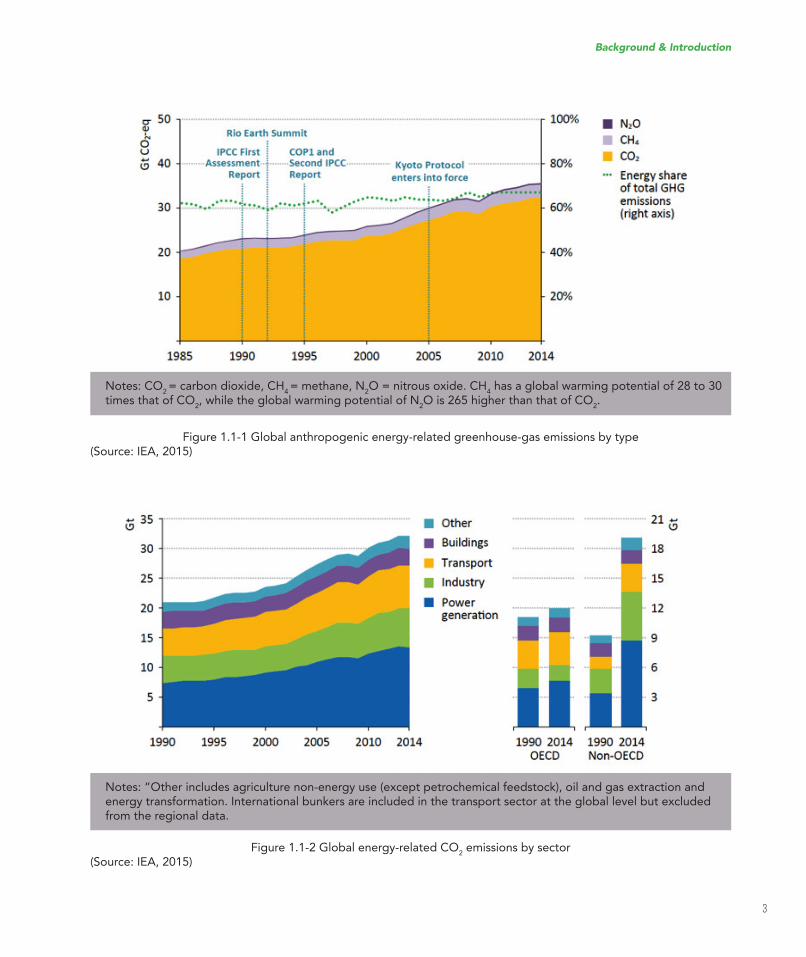
According to the IEA report (2015),
as of 2014, more than 60% of the global
anthropogenic CO2 emissions are from
the energy sector (Figure 1.1-1), and these
emissions by sector are as shown in Figure
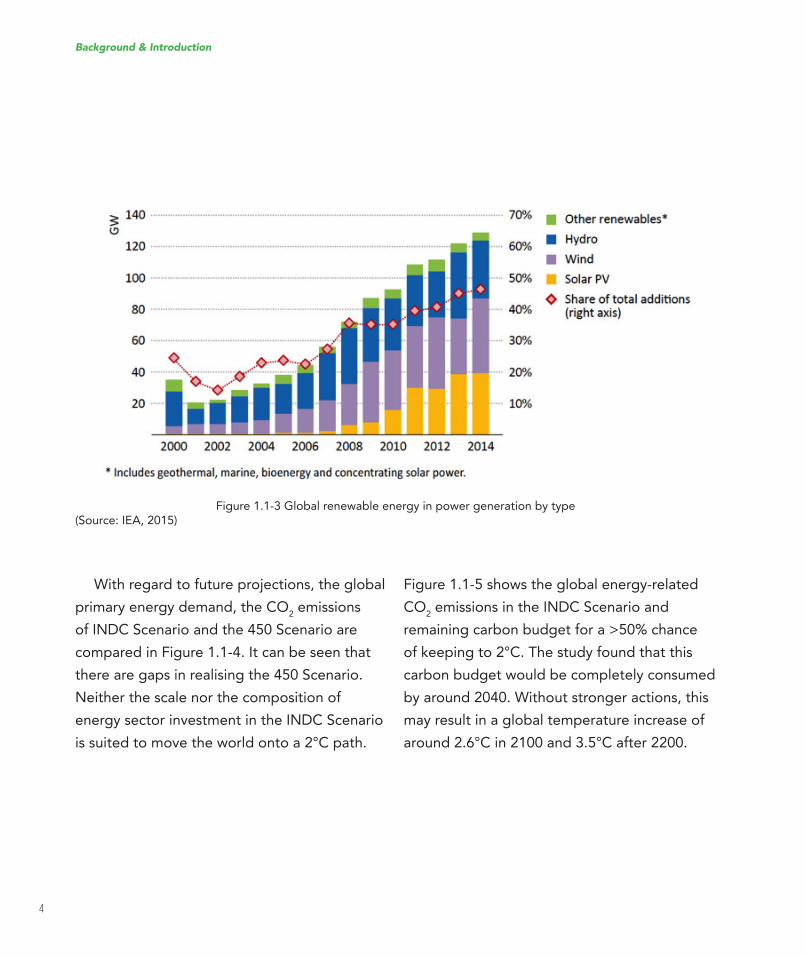
1.1-2. Electricity generation remains as the
dominant emitter since 1990, even though the
share of renewables in power generation has
been increasing gradually since 2000 (Figure
1.1-3).
3
Figure 1.1-1 Global anthropogenic energy-related greenhouse-gas emissions by type(Source: IEA, 2015)
Figure 1.1-2 Global energy-related CO2 emissions by sector
(Source: IEA, 2015)
Background & Introduction
Notes: CO2 = carbon dioxide, CH
4 = methane, N
2O = nitrous oxide. CH
4 has a global warming potential of 28 to 30
times that of CO2, while the global warming potential of N
2O is 265 higher than that of CO
2.
Notes: “Other includes agriculture non-energy use (except petrochemical feedstock), oil and gas extraction and energy transformation. International bunkers are included in the transport sector at the global level but excluded from the regional data.
4
Background & Introduction
Figure 1.1-3 Global renewable energy in power generation by type(Source: IEA, 2015)
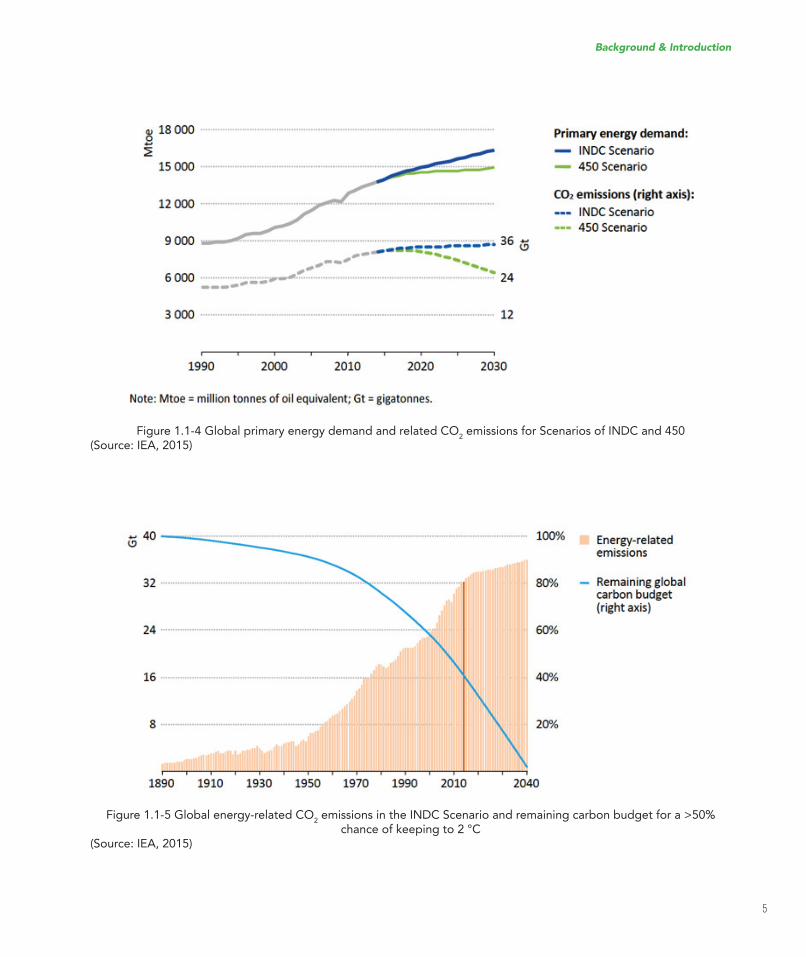
With regard to future projections, the global
primary energy demand, the CO2 emissions
ofINDCScenarioandthe450Scenarioarecompared in Figure 1.1-4. It can be seen that
there are gaps in realising the 450 Scenario.
Neither the scale nor the composition of
energysectorinvestmentintheINDCScenariois suited to move the world onto a 2°C path.
Figure 1.1-5 shows the global energy-related
CO2emissionsintheINDCScenarioand
remaining carbon budget for a >50% chance
of keeping to 2°C. The study found that this
carbon budget would be completely consumed
by around 2040. Without stronger actions, this
may result in a global temperature increase of
around 2.6°C in 2100 and 3.5°C after 2200.
5
Background & Introduction
Figure 1.1-5 Global energy-related CO2emissionsintheINDCScenarioandremainingcarbonbudgetfora>50%
chance of keeping to 2 °C(Source: IEA, 2015)
Figure 1.1-4 Global primary energy demand and related CO2emissionsforScenariosofINDCand450
(Source: IEA, 2015)
6
Background & Introduction
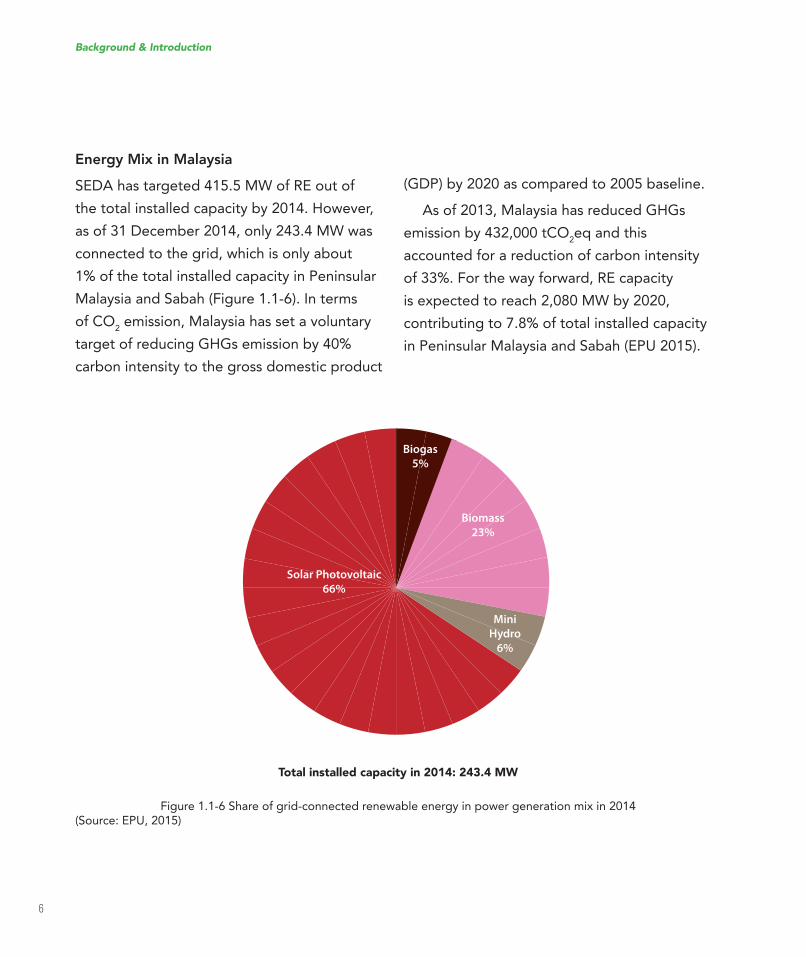
Figure 1.1-6 Share of grid-connected renewable energy in power generation mix in 2014(Source: EPU, 2015)
Energy Mix in Malaysia
SEDAhastargeted415.5MWofREoutofthe total installed capacity by 2014. However,
asof31December2014,only243.4MWwasconnected to the grid, which is only about
1% of the total installed capacity in Peninsular
Malaysia and Sabah (Figure 1.1-6). In terms
of CO2 emission, Malaysia has set a voluntary
target of reducing GHGs emission by 40%
carbon intensity to the gross domestic product
(GDP)by2020ascomparedto2005baseline.As of 2013, Malaysia has reduced GHGs
emission by 432,000 tCO2eq and this
accounted for a reduction of carbon intensity
of 33%. For the way forward, RE capacity
is expected to reach 2,080 MW by 2020,
contributing to 7.8% of total installed capacity
in Peninsular Malaysia and Sabah (EPU 2015).
Solar Photovoltaic
66%
Biomass
23%
Mini
Hydro
6%
Biogas
5%
Total installed capacity in 2014: 243.4 MW
7
Background & Introduction
1.2 Introduction to Carbon
Free Energy Task Force
Currently, the RE potentials in Malaysia is
focused only on solar, biogas, biomass and
mini-hydro. RE in the power generation mix
can be higher than the existing targets and
achievements if other types of RE can be
explored. The present task force’s challenge is
to target carbon-free energy by 2050. Thus, the
availabilities of all types of non-carbon energy
sources were taken into account in setting the
targets to develop a roadmap in achieving a
carbon-free energy future.
The objectives of the Carbon Free Energy
Task Force are:
i) To identify the major stakeholders involved
in carbon-free energy, research and
development;
ii) To identify the issues faced in implementing
carbon-free energy; and
iii) To develop a blueprint and roadmap
for a carbon-free energy programme in
Malaysia including proper funding, public
engagement and awareness programmes.
Therefore, the main deliverable of the task
force is the Carbon Free Energy Roadmap for
Malaysia, and thus, forms the main contents of
this report.
Purpose, Scope and Development Process of
Carbon Free Energy Roadmap
The roadmap aims to assess the prospects
of energy mix and actions that need to be
undertaken to achieve a carbon-free energy
future for Malaysia. Furthermore, the roadmap
also provides policymakers a quantitative
framework to understand the supply and
demand of the future energy trends, and
hence, to formulate appropriate policies and
targets to address energy related issues and
challenges.
The scope of the roadmap focuses only on
the electricity sector for the projected period
of 2015 to 2050. Carbon free energy in this
report refers to energy sources that have no
carbon emission or with net zero emissions of
carbon. These energy resources are bioenergy,
geothermal, hydropower, nuclear energy,
ocean thermal energy conversion (OTEC), solar
photovoltaic (PV), wave and tidal current, and
wind energy. Moreover, hydrogen generation
from renewable energy as an energy carrier
is also proposed in this task force, and thus,
fuel cell is included as an additional energy
conversion system at the later stage of the
roadmap development process.
8
Background & Introduction
This roadmap was developed through
series of meetings to gather inputs and
numerous discussion on the technological
and deployment issues among the task
force committee. In addition, the task force
committee conducted a Carbon Free Energy
Roadmap Workshop in Malacca, from 20
to22January2015.Stakeholdersfromuniversities,powersectors,R&Dinstitutions,inancecommunity,industriesandgovernmentinstitutions were invited to the workshop for
brainstorming sessions to discuss the targets
and action plans of a carbon free energy vision.
After the workshop, the scope and targets
were further reviewed and revised through
several meetings and email communications.
Detailsofthedevelopmentprocessarefurtherdiscussed in Chapter 3.
Structure of this Roadmap
i) Chapter 2 discusses the current status
of the carbon free energy technologies,
applications and initiatives in Malaysia;
ii) Chapter 3 explains the roadmap
development process and discusses the
projections of energy supply, as well as the
vision with deployment targets for carbon
free energy future by 2050;
iii) Chapter 4 concludes the roadmap
with proposed actions complete with
time frames to overcome barriers and
challenges,aswellasthenecessaryR&Dactivities; and
iv) Chapter 5 summarises the roadmap with
key messages to the decision makers.
9
Chapter 2
The Current Status of Carbon Free Energy
Technologies
10
2.1 Bioenergy
Bioenergy resources are renewable organic
matters, which include forest and mill
residues, wood wastes, agricultural crops and
wastes, animal wastes and municipal solid
wastes (MSW). Agricultural crops are such
as sugarcane, cassava and corn; agricultural
residues are such as rice straw, cassava
rhizome, corncobs, oil palm fronds; wood &
wood residues are such as fast-growing trees
and wood waste from wood mill; and waste
stream resources are such as rice husks from
rice mills, molasses and bagasse from sugar
reineries,residuesfrompalmoilmillsandMSW.
2.1.1 State of the Art
Malaysia has been utilising biomass to produce
wood products, animal feed, energy, as well
as using it directly as fertilisers. Furthermore,
bioenergy plants are being built to take
advantage of the Feed-in-Tariff. In fact, the
irstpelletplanthasbeensetup,fromwhichpellets are produced for domestic use and
alsoexportedtocountriessuchasJapanandKorea.Thetimelineoftechnologicalavailabilitysuggested in the National Biomass Strategy
2020 is as shown in Figure 2.1-1.
11
The Current Status of Carbon Free Energy Technologies
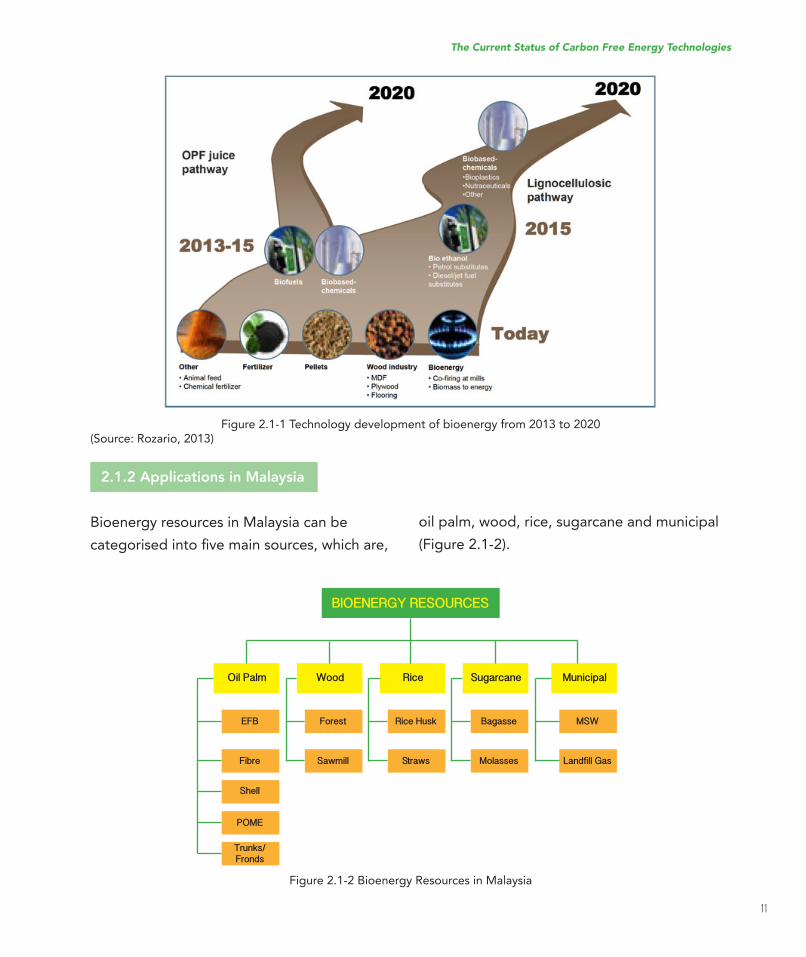
Figure 2.1-1 Technology development of bioenergy from 2013 to 2020(Source: Rozario, 2013)
Figure 2.1-2 Bioenergy Resources in Malaysia
2.1.2 Applications in Malaysia
Bioenergy resources in Malaysia can be
categorisedintoivemainsources,whichare,oil palm, wood, rice, sugarcane and municipal
(Figure 2.1-2).
BIOENERGY RESOURCES
Oil Palm
EFB Forest Rice Husk Bagasse MSW
Fibre Sawmill Straws Molasses Landfill Gas
Shell
POME
Trunks/Fronds
Wood Rice Sugarcane Municipal
12
The Current Status of Carbon Free Energy Technologies
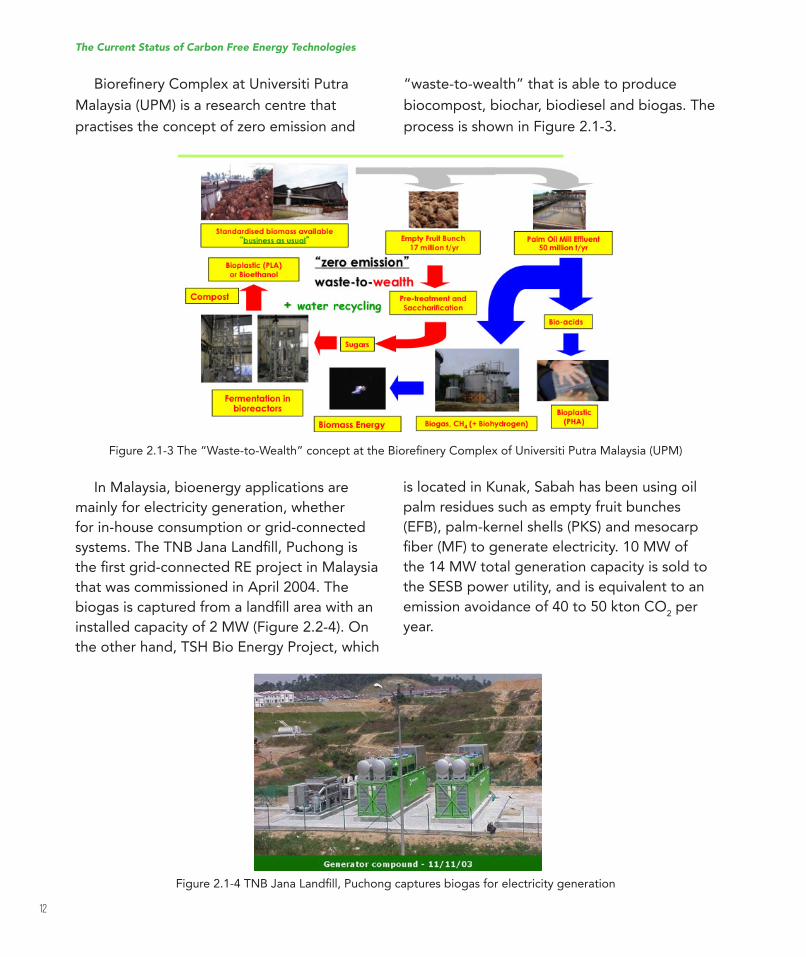
BioreineryComplexatUniversitiPutraMalaysia (UPM) is a research centre that
practises the concept of zero emission and
Figure2.1-3The“Waste-to-Wealth”conceptattheBioreineryComplexofUniversitiPutraMalaysia(UPM)
Figure2.1-4TNBJanaLandill,Puchongcapturesbiogasforelectricitygeneration
In Malaysia, bioenergy applications are
mainly for electricity generation, whether
for in-house consumption or grid-connected
systems.TheTNBJanaLandill,Puchongistheirstgrid-connectedREprojectinMalaysiathat was commissioned in April 2004. The
biogasiscapturedfromalandillareawithaninstalled capacity of 2 MW (Figure 2.2-4). On
the other hand, TSH Bio Energy Project, which
“waste-to-wealth” that is able to produce
biocompost, biochar, biodiesel and biogas. The
process is shown in Figure 2.1-3.
islocatedinKunak,Sabahhasbeenusingoilpalm residues such as empty fruit bunches
(EFB),palm-kernelshells(PKS)andmesocarpiber(MF)togenerateelectricity.10MWofthe 14 MW total generation capacity is sold to
the SESB power utility, and is equivalent to an
emission avoidance of 40 to 50 kton CO2 per
year.
13
The Current Status of Carbon Free Energy Technologies
Table 2.1-1 Potential of annual electricity generation from bioenergy in Malaysia
Table 2.1-2 An example of electricity generation from the oil palm industry
(Source:MPOB,SIRIM,FRIM,ForestryDept.andMinistryofAgriculture)
(Source: Malaysian Oil Palm Statistics, 22nd Edition, MPOB)
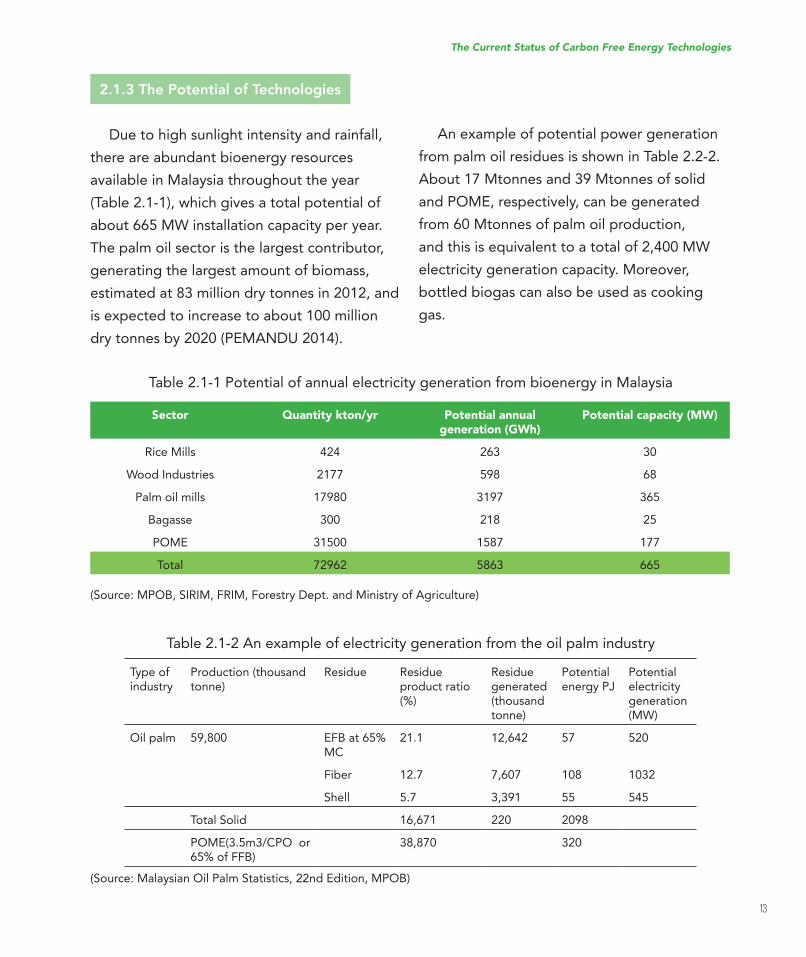
2.1.3 The Potential of Technologies
Duetohighsunlightintensityandrainfall,there are abundant bioenergy resources
available in Malaysia throughout the year
(Table 2.1-1), which gives a total potential of
about 665 MW installation capacity per year.
The palm oil sector is the largest contributor,
generating the largest amount of biomass,
estimated at 83 million dry tonnes in 2012, and
is expected to increase to about 100 million
drytonnesby2020(PEMANDU2014).
Sector Quantity kton/yr Potential annual generation (GWh)
Potential capacity (MW)
Rice Mills 424 263 30
Wood Industries 2177 598 68
Palm oil mills 17980 3197 365
Bagasse 300 218 25
POME 31500 1587 177
Total 72962 5863 665
Type ofindustry
Production (thousand tonne)
Residue Residue product ratio (%)
Residue generated (thousand tonne)
Potential energyPJ
Potential electricity generation (MW)
Oil palm 59,800 EFB at 65% MC
21.1 12,642 57 520
Fiber 12.7 7,607 108 1032
Shell 5.7 3,391 55 545
Total Solid 16,671 220 2098
POME(3.5m3/CPOor65% of FFB)
38,870 320
An example of potential power generation
from palm oil residues is shown in Table 2.2-2.
About 17 Mtonnes and 39 Mtonnes of solid
and POME, respectively, can be generated
from 60 Mtonnes of palm oil production,
and this is equivalent to a total of 2,400 MW
electricity generation capacity. Moreover,
bottled biogas can also be used as cooking
gas.
14
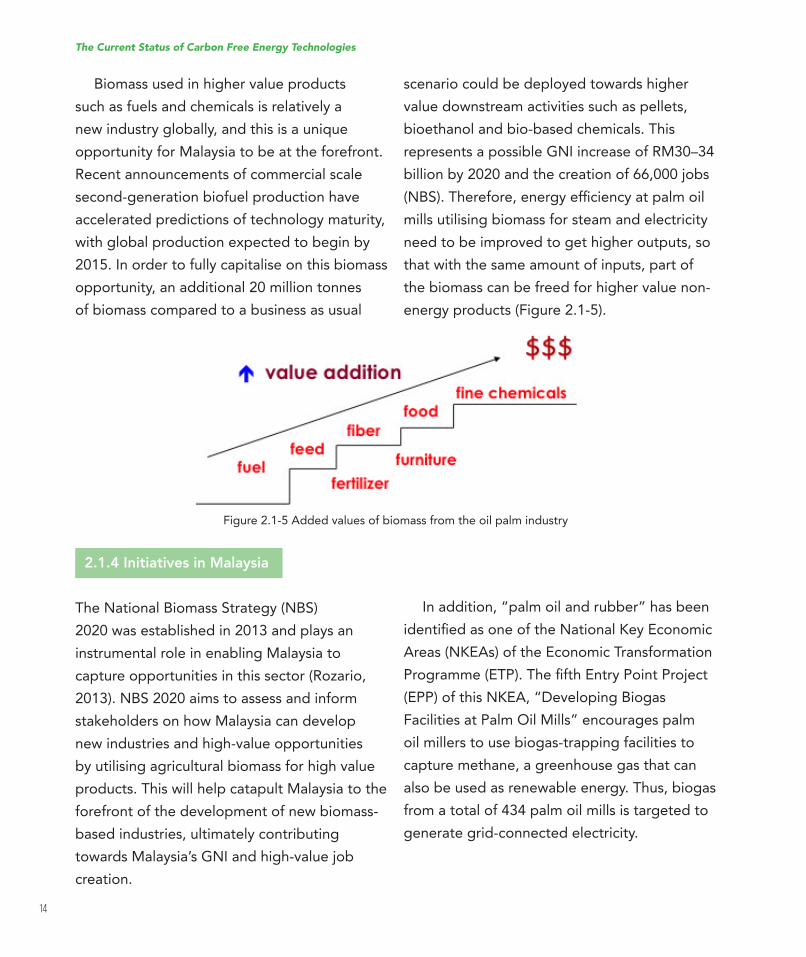
Biomass used in higher value products
such as fuels and chemicals is relatively a
new industry globally, and this is a unique
opportunity for Malaysia to be at the forefront.
Recent announcements of commercial scale
second-generation biofuel production have
accelerated predictions of technology maturity,
with global production expected to begin by
2015. In order to fully capitalise on this biomass
opportunity, an additional 20 million tonnes
of biomass compared to a business as usual
Figure 2.1-5 Added values of biomass from the oil palm industry
2.1.4 Initiatives in Malaysia
The National Biomass Strategy (NBS)
2020 was established in 2013 and plays an
instrumental role in enabling Malaysia to
capture opportunities in this sector (Rozario,
2013). NBS 2020 aims to assess and inform
stakeholders on how Malaysia can develop
new industries and high-value opportunities
by utilising agricultural biomass for high value
products. This will help catapult Malaysia to the
forefront of the development of new biomass-
based industries, ultimately contributing
towards Malaysia’s GNI and high-value job
creation.
scenario could be deployed towards higher
value downstream activities such as pellets,
bioethanol and bio-based chemicals. This
represents a possible GNI increase of RM30–34
billion by 2020 and the creation of 66,000 jobs
(NBS).Therefore,energyeficiencyatpalmoilmills utilising biomass for steam and electricity
need to be improved to get higher outputs, so
that with the same amount of inputs, part of
the biomass can be freed for higher value non-
energy products (Figure 2.1-5).
In addition, “palm oil and rubber” has been
identiiedasoneoftheNationalKeyEconomicAreas(NKEAs)oftheEconomicTransformationProgramme(ETP).TheifthEntryPointProject(EPP)ofthisNKEA,“DevelopingBiogasFacilities at Palm Oil Mills” encourages palm
oil millers to use biogas-trapping facilities to
capture methane, a greenhouse gas that can
also be used as renewable energy. Thus, biogas
from a total of 434 palm oil mills is targeted to
generate grid-connected electricity.
The Current Status of Carbon Free Energy Technologies
15
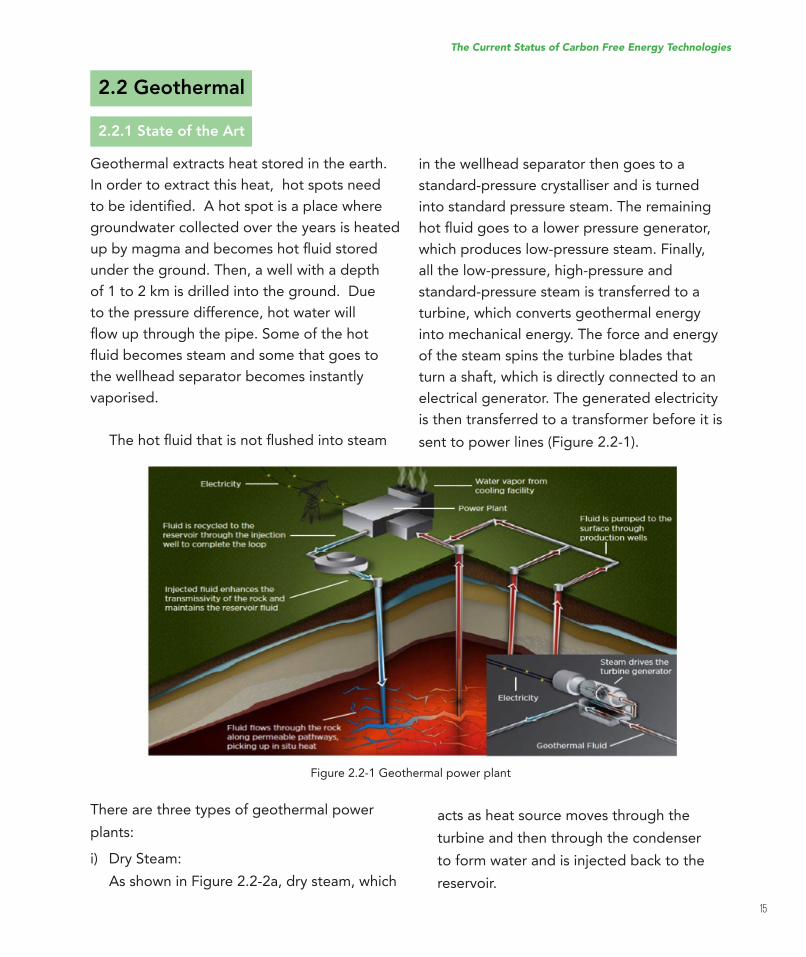
Figure 2.2-1 Geothermal power plant
2.2 Geothermal
2.2.1 State of the Art
Geothermal extracts heat stored in the earth.
In order to extract this heat, hot spots need
tobeidentiied.Ahotspotisaplacewheregroundwater collected over the years is heated
upbymagmaandbecomeshotluidstoredunder the ground. Then, a well with a depth
of1to2kmisdrilledintotheground.Dueto the pressure difference, hot water will
lowupthroughthepipe.Someofthehotluidbecomessteamandsomethatgoestothe wellhead separator becomes instantly
vaporised.
Thehotluidthatisnotlushedintosteam
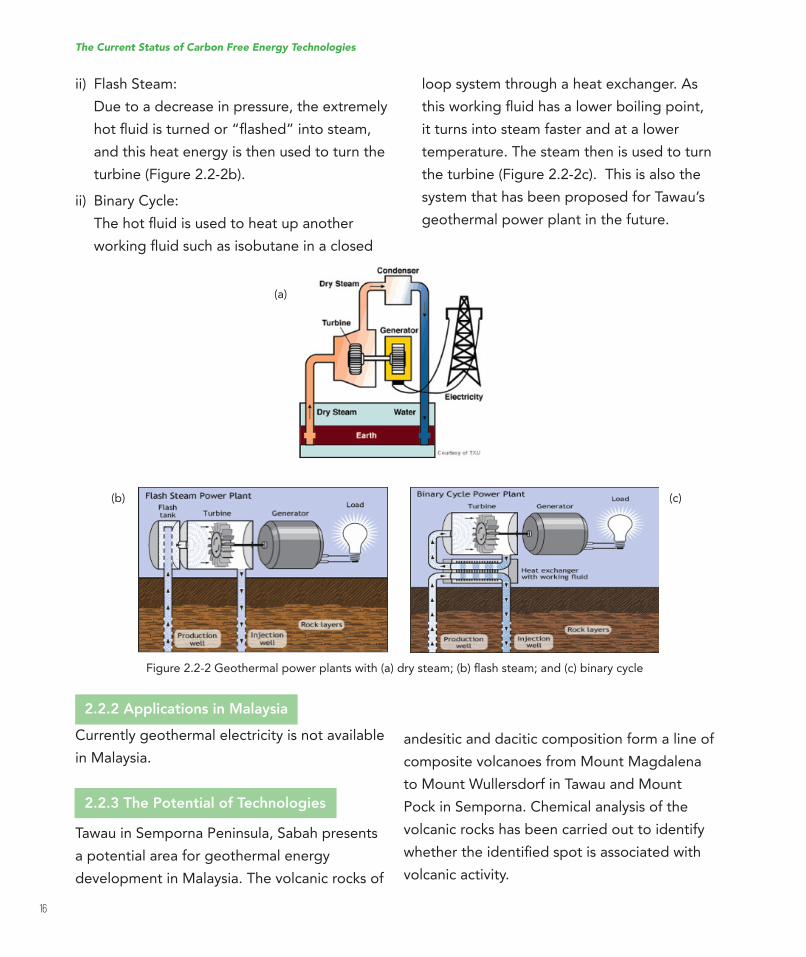
There are three types of geothermal power
plants:
i) DrySteam: As shown in Figure 2.2-2a, dry steam, which
in the wellhead separator then goes to a
standard-pressure crystalliser and is turned
into standard pressure steam. The remaining
hotluidgoestoalowerpressuregenerator,which produces low-pressure steam. Finally,
all the low-pressure, high-pressure and
standard-pressure steam is transferred to a
turbine, which converts geothermal energy
into mechanical energy. The force and energy
of the steam spins the turbine blades that
turn a shaft, which is directly connected to an
electrical generator. The generated electricity
is then transferred to a transformer before it is
sent to power lines (Figure 2.2-1).
acts as heat source moves through the
turbine and then through the condenser
to form water and is injected back to the
reservoir.
The Current Status of Carbon Free Energy Technologies
16
ii) Flash Steam:
Duetoadecreaseinpressure,theextremelyhotluidisturnedor“lashed”intosteam,and this heat energy is then used to turn the
turbine (Figure 2.2-2b).
ii) Binary Cycle:
Thehotluidisusedtoheatupanotherworkingluidsuchasisobutaneinaclosed
Figure2.2-2Geothermalpowerplantswith(a)drysteam;(b)lashsteam;and(c)binarycycle
(a)
(b) (c)
2.2.2 Applications in Malaysia
Currently geothermal electricity is not available
in Malaysia.
2.2.3 The Potential of Technologies
Tawau in Semporna Peninsula, Sabah presents
a potential area for geothermal energy
development in Malaysia. The volcanic rocks of
loop system through a heat exchanger. As
thisworkingluidhasalowerboilingpoint,it turns into steam faster and at a lower
temperature. The steam then is used to turn
the turbine (Figure 2.2-2c). This is also the
system that has been proposed for Tawau’s
geothermal power plant in the future.
andesitic and dacitic composition form a line of
composite volcanoes from Mount Magdalena
to Mount Wullersdorf in Tawau and Mount
Pock in Semporna. Chemical analysis of the
volcanic rocks has been carried out to identify
whethertheidentiiedspotisassociatedwithvolcanic activity.
The Current Status of Carbon Free Energy Technologies
17
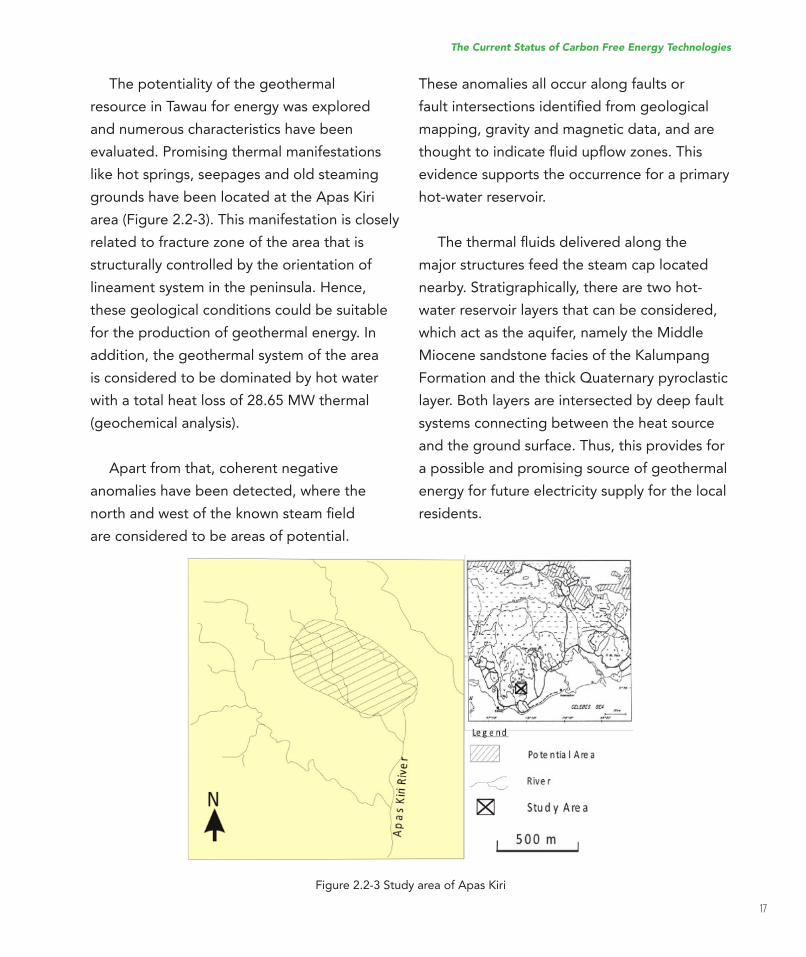
Figure2.2-3StudyareaofApasKiri
The potentiality of the geothermal
resource in Tawau for energy was explored
and numerous characteristics have been
evaluated. Promising thermal manifestations
like hot springs, seepages and old steaming
groundshavebeenlocatedattheApasKiriarea (Figure 2.2-3). This manifestation is closely
related to fracture zone of the area that is
structurally controlled by the orientation of
lineament system in the peninsula. Hence,
these geological conditions could be suitable
for the production of geothermal energy. In
addition, the geothermal system of the area
is considered to be dominated by hot water
with a total heat loss of 28.65 MW thermal
(geochemical analysis).
Apart from that, coherent negative
anomalies have been detected, where the
northandwestoftheknownsteamieldare considered to be areas of potential.
These anomalies all occur along faults or
faultintersectionsidentiiedfromgeologicalmapping, gravity and magnetic data, and are
thoughttoindicateluiduplowzones.Thisevidence supports the occurrence for a primary
hot-water reservoir.
Thethermalluidsdeliveredalongthemajor structures feed the steam cap located
nearby. Stratigraphically, there are two hot-
water reservoir layers that can be considered,
which act as the aquifer, namely the Middle
MiocenesandstonefaciesoftheKalumpangFormation and the thick Quaternary pyroclastic
layer. Both layers are intersected by deep fault
systems connecting between the heat source
and the ground surface. Thus, this provides for
a possible and promising source of geothermal
energy for future electricity supply for the local
residents.
The Current Status of Carbon Free Energy Technologies
18
Theirstmagnetotelluricinvestigationofthe Tawau geothermal potential was carried
out in 2010 to locate the geothermal system
deep below the surface. A recent geoelectrical
survey that was carried out in 2013 found that
theApasKiriareahasahotwatersourceatashallow depth. The survey used the pole-dipole
method for deeper penetrations to look at the
vertical and lateral variations. The hot water
with a temperature of 79oC at the surface is a
potential alternative source for future electricity
generation. Currently, the Tawau Geothermal
Energy (TGE) is exploring further to exploit
possible electricity potential based on the
above data.
Its geological, geophysical and geochemical
values are suitable for the production of
electricity. However, further investigation is
needed to identify the economic prospect.
Environmentally, there exists present
technology that can exploit this resource,
although cost effectiveness should be well
deined.Theamountofgeothermalenergyutilised in the future will depend upon the cost
and environmental concerns associated with
traditional sources of energy, rather than the
limits of the geothermal resource. As supplies
of fossil fuels dwindle, or the impacts of global
warming and acid rain become more severe,
geothermal energy will become an attractive
option for supplying heat and electricity in the
future.
2.2.4 Initiatives in Malaysia
The state government of Sabah has initiated
this exploration which was granted to Tawau
Geothermal Energy (TGE), with Universiti
Malaysia Sabah (UMS) as the research partner.
This initiative may contribute to the technology
commercialisation in the long run.
The Current Status of Carbon Free Energy Technologies
19
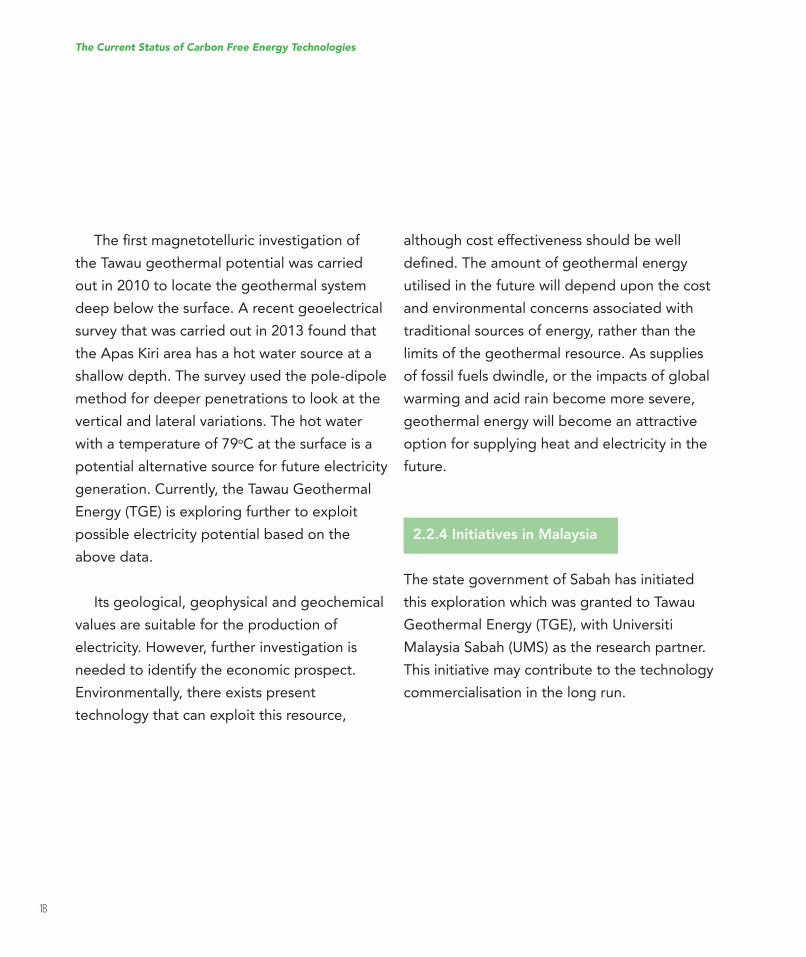
2.3 Hydropower
When water from a higher elevation is
channelled to a turbine located at lower
elevationvialowconduit,thepotentialenergy of the water from higher elevation is
converted into mechanical energy to rotate the
shaft of the turbine. The shaft that is coupled
with AC generator will then generate AC
supply by converting mechanical energy into
electricity (Figure 2.3-1). Conventional big scale
hydropower plants commonly consist of four
major components:
i) Dam: Raises the water level of the river to create
fallingwater,controlsthelowofwaterandcreates water reservoir that serves as stored
energy.
Figure 2.3-1 Schematic diagram of conventional major hydropower plant
ii) Turbine:
The force of falling water pushing against
turbine blades causes the turbine to spin.
and this yields mechanical energy.
iii) Generator:
Connected to the turbine by shafts and
possibly gears so that when the turbine
spins it causes the generator to spin as well.
This converts the mechanical energy from
the turbine into electrical energy.
iv) Transmission lines:
Conducts electricity from the hydropower
plant to end-users.
The Current Status of Carbon Free Energy Technologies
20
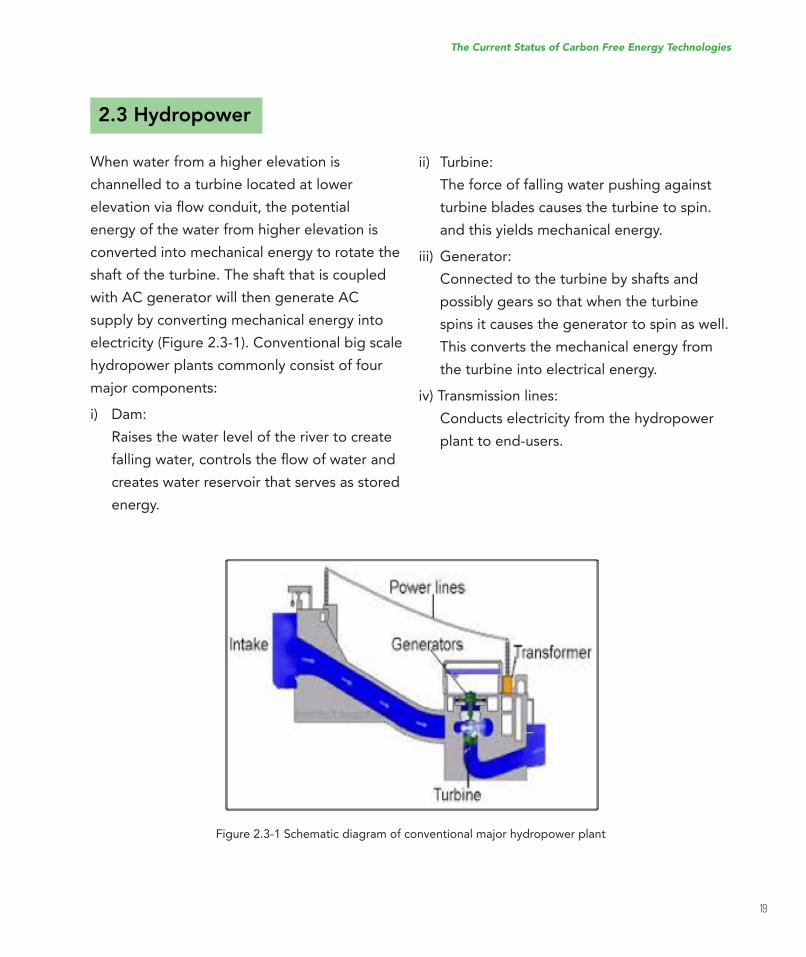
2.3.1 State of the Art
Hydropower Technology: Energy Conversion
Techniques
There are two types of turbines that convert
the potential energy of water into the kinetic
energy of the rotating shaft, namely impulse
and reaction turbines.
i) Impulse turbines
Potential energy is converted to fully kinetic
Figure 2.3-2 Velocity diagram of impulse turbine(U
i=bucket linear velocity; V
a= jet absolute velocity; V
r = jet relative velocity; V
w= peripheral velocity; i=inlet; o= outlet)
The power developed by the bucket can be calculated using Equation (2.3-1) as follows:
Power developed by bucket = ρQUi(v
ai-U
i)*(1-kCosβ) Eq. (2.3-1)
Whereby k = bucket friction factor; k=1.000 for lossless scenario; Q=volumetric flow rate of the jet stream
Maximum theoretical power developed by the buckets occurs if (1) Ui=0.5v
ai ,(2) β=180o and (3) k=1.00
Figure2.3.3showsexamplesofimpulseturbinessuchasPeltron,TurgoandCrosslow.
before hitting turbine buckets via high
velocity water jets, whereby the jet stream
is at ambient air pressure and the turbine
bucket is rotating in the air. The velocity
diagram of the turbine is as shown in Figure
2.3-2.
The Current Status of Carbon Free Energy Technologies
21
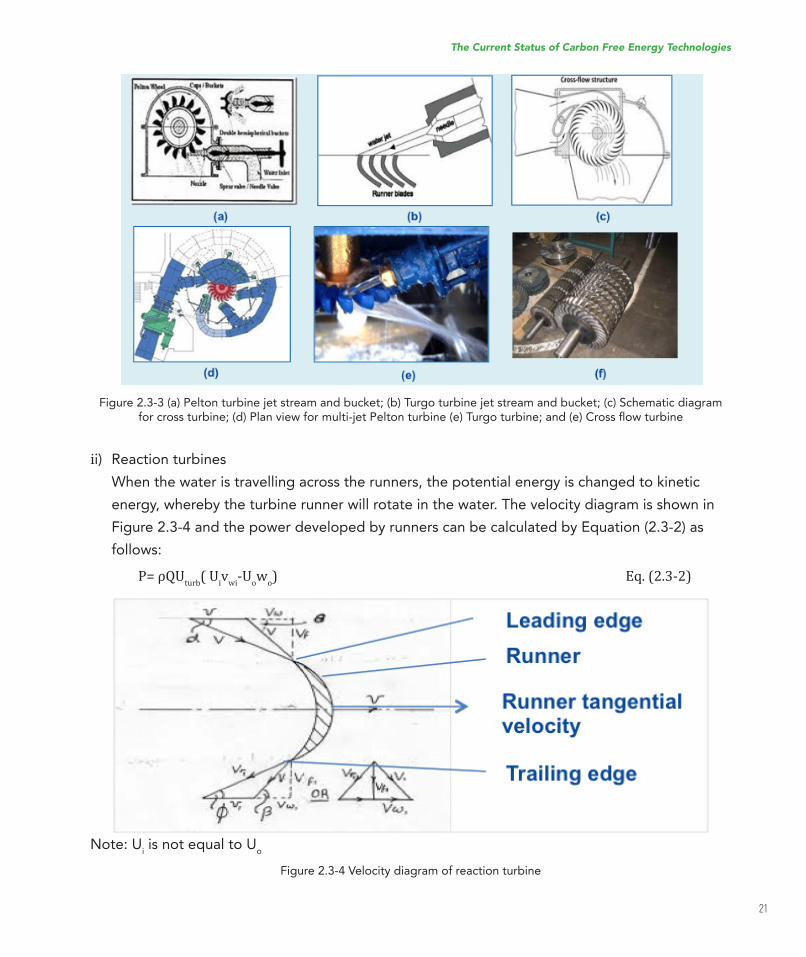
Figure 2.3-3 (a) Pelton turbine jet stream and bucket; (b) Turgo turbine jet stream and bucket; (c) Schematic diagram forcrossturbine;(d)Planviewformulti-jetPeltonturbine(e)Turgoturbine;and(e)Crosslowturbine
Figure 2.3-4 Velocity diagram of reaction turbine
ii) Reaction turbines
When the water is travelling across the runners, the potential energy is changed to kinetic
energy, whereby the turbine runner will rotate in the water. The velocity diagram is shown in
Figure 2.3-4 and the power developed by runners can be calculated by Equation (2.3-2) as
follows:
P= ρQUturb
( Uiv
wi-U
ow
o) Eq. (2.3-2)
Note: Ui is not equal to U
o
The Current Status of Carbon Free Energy Technologies
22
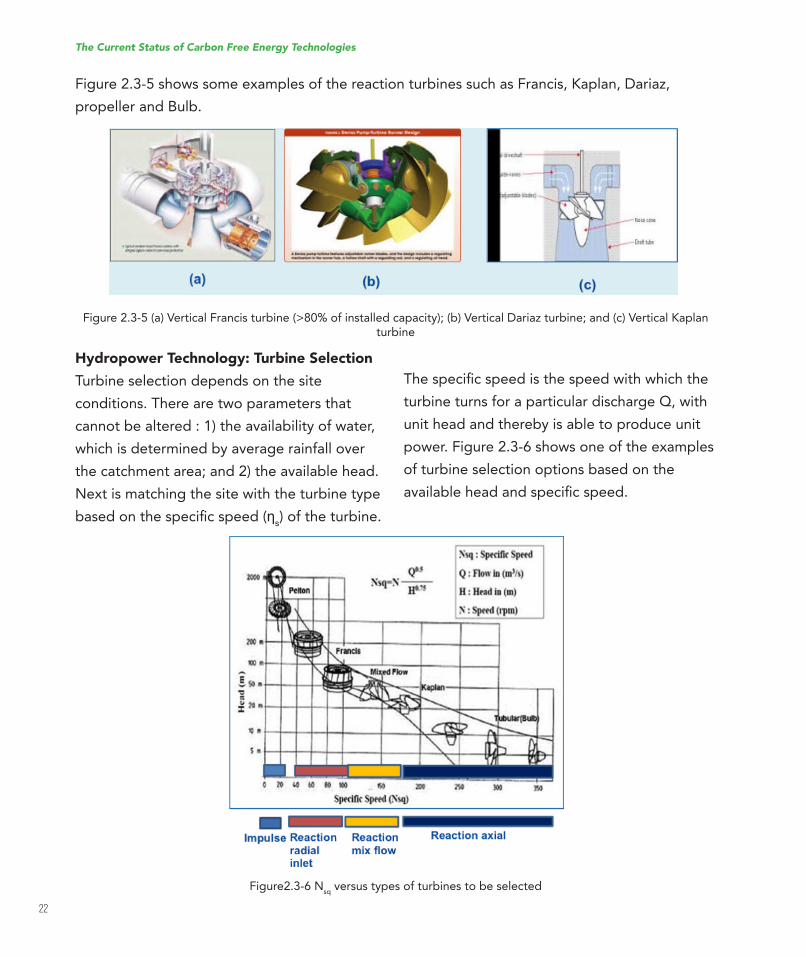
Figure2.3-5showssomeexamplesofthereactionturbinessuchasFrancis,Kaplan,Dariaz,propeller and Bulb.
Figure2.3-5(a)VerticalFrancisturbine(>80%ofinstalledcapacity);(b)VerticalDariazturbine;and(c)VerticalKaplanturbine
Figure2.3-6 Nsq
versus types of turbines to be selected
Hydropower Technology: Turbine Selection
Turbine selection depends on the site
conditions. There are two parameters that
cannot be altered : 1) the availability of water,
which is determined by average rainfall over
the catchment area; and 2) the available head.
Next is matching the site with the turbine type
basedonthespeciicspeed(ηs) of the turbine.
Thespeciicspeedisthespeedwithwhichtheturbine turns for a particular discharge Q, with
unit head and thereby is able to produce unit
power. Figure 2.3-6 shows one of the examples
of turbine selection options based on the
availableheadandspeciicspeed.
The Current Status of Carbon Free Energy Technologies
23
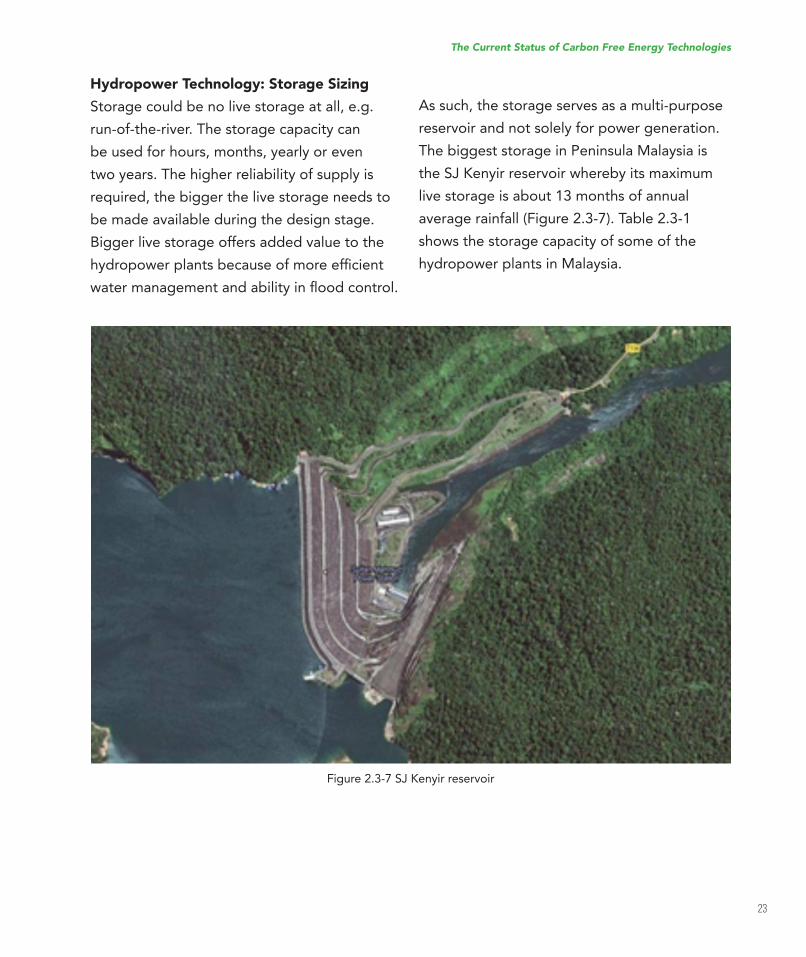
Figure2.3-7SJKenyirreservoir
Hydropower Technology: Storage Sizing
Storage could be no live storage at all, e.g.
run-of-the-river. The storage capacity can
be used for hours, months, yearly or even
two years. The higher reliability of supply is
required, the bigger the live storage needs to
be made available during the design stage.
Bigger live storage offers added value to the
hydropowerplantsbecauseofmoreeficientwatermanagementandabilityinloodcontrol.
As such, the storage serves as a multi-purpose
reservoir and not solely for power generation.
The biggest storage in Peninsula Malaysia is
theSJKenyirreservoirwherebyitsmaximumlive storage is about 13 months of annual
average rainfall (Figure 2.3-7). Table 2.3-1
shows the storage capacity of some of the
hydropower plants in Malaysia.
The Current Status of Carbon Free Energy Technologies
24
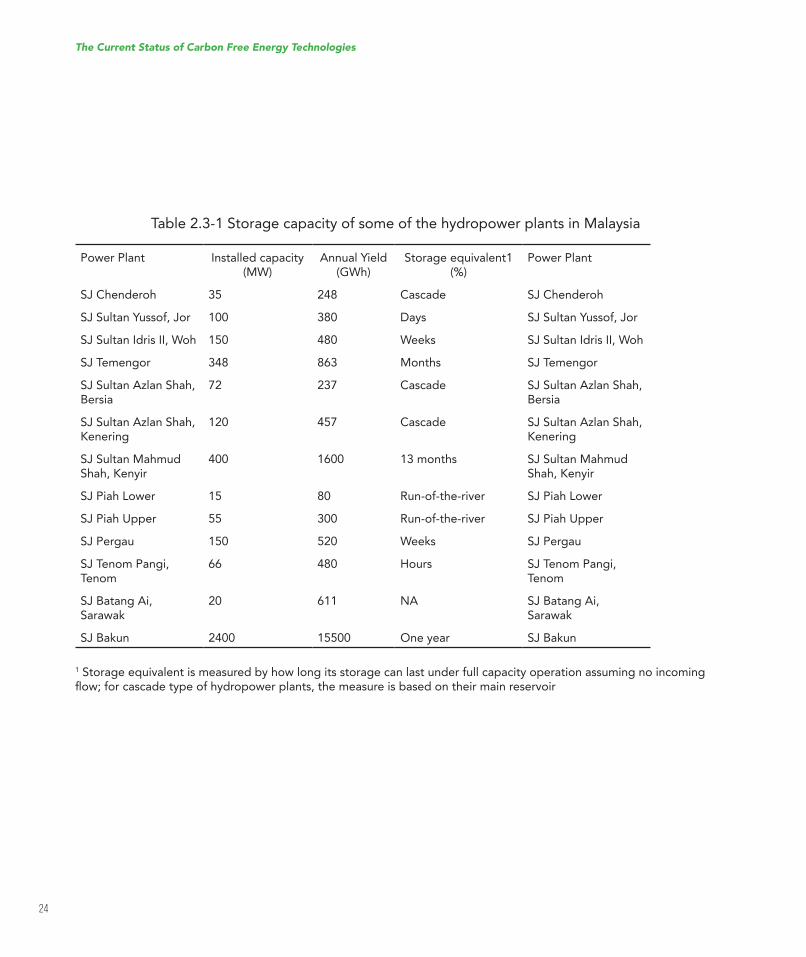
1 Storage equivalent is measured by how long its storage can last under full capacity operation assuming no incoming low;forcascadetypeofhydropowerplants,themeasureisbasedontheirmainreservoir
Table 2.3-1 Storage capacity of some of the hydropower plants in Malaysia
Power Plant Installed capacity (MW)
AnnualYield(GWh)
Storage equivalent1 (%)
Power Plant
SJChenderoh 35 248 Cascade SJChenderohSJSultanYussof,Jor 100 380 Days SJSultanYussof,JorSJSultanIdrisII,Woh 150 480 Weeks SJSultanIdrisII,WohSJTemengor 348 863 Months SJTemengorSJSultanAzlanShah,Bersia
72 237 Cascade SJSultanAzlanShah,Bersia
SJSultanAzlanShah,Kenering
120 457 Cascade SJSultanAzlanShah,Kenering
SJSultanMahmudShah,Kenyir
400 1600 13 months SJSultanMahmudShah,Kenyir
SJPiahLower 15 80 Run-of-the-river SJPiahLowerSJPiahUpper 55 300 Run-of-the-river SJPiahUpperSJPergau 150 520 Weeks SJPergauSJTenomPangi,Tenom
66 480 Hours SJTenomPangi,Tenom
SJBatangAi,Sarawak
20 611 NA SJBatangAi,Sarawak
SJBakun 2400 15500 One year SJBakun
The Current Status of Carbon Free Energy Technologies
25
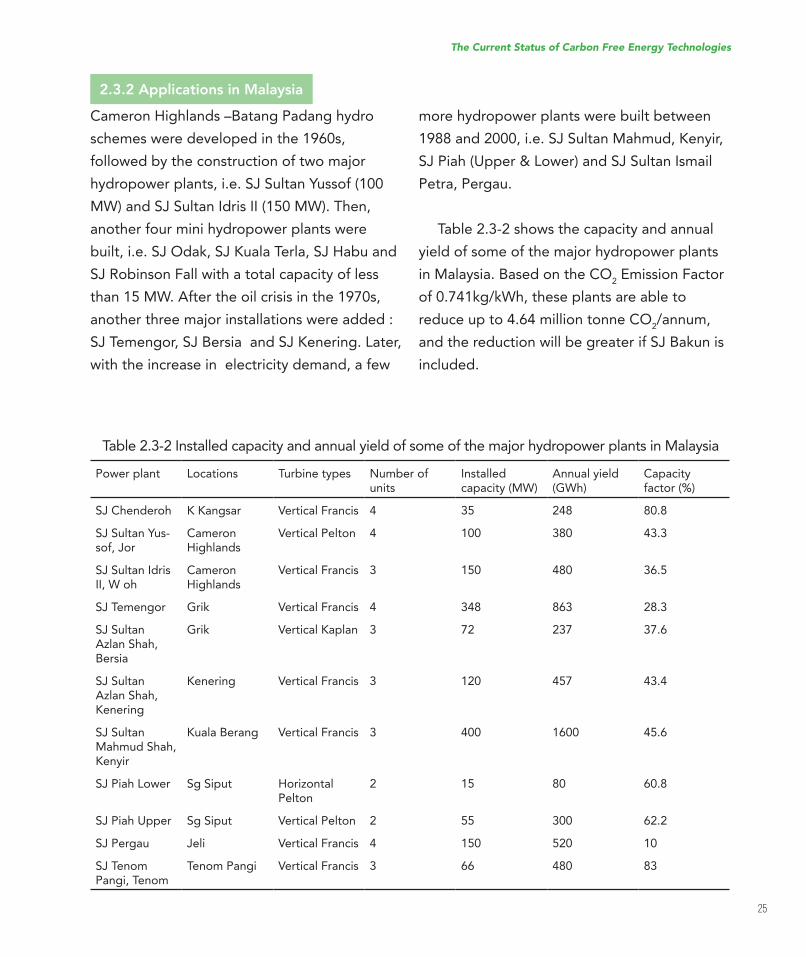
2.3.2 Applications in Malaysia
Cameron Highlands –Batang Padang hydro
schemes were developed in the 1960s,
followed by the construction of two major
hydropowerplants,i.e.SJSultanYussof(100MW)andSJSultanIdrisII(150MW).Then,another four mini hydropower plants were
built,i.e.SJOdak,SJKualaTerla,SJHabuandSJRobinsonFallwithatotalcapacityoflessthan 15 MW. After the oil crisis in the 1970s,
another three major installations were added :
SJTemengor,SJBersiaandSJKenering.Later,with the increase in electricity demand, a few
Power plant Locations Turbine types Number of units
Installed capacity (MW)
Annual yield (GWh)
Capacity factor (%)
SJChenderoh KKangsar Vertical Francis 4 35 248 80.8
SJSultanYus-sof,Jor
Cameron Highlands
Vertical Pelton 4 100 380 43.3
SJSultanIdrisII, W oh
Cameron Highlands
Vertical Francis 3 150 480 36.5
SJTemengor Grik Vertical Francis 4 348 863 28.3
SJSultanAzlan Shah, Bersia
Grik VerticalKaplan 3 72 237 37.6
SJSultanAzlan Shah, Kenering
Kenering Vertical Francis 3 120 457 43.4
SJSultanMahmud Shah, Kenyir
KualaBerang Vertical Francis 3 400 1600 45.6
SJPiahLower Sg Siput Horizontal Pelton
2 15 80 60.8
SJPiahUpper Sg Siput Vertical Pelton 2 55 300 62.2
SJPergau Jeli Vertical Francis 4 150 520 10
SJTenomPangi, Tenom
Tenom Pangi Vertical Francis 3 66 480 83
more hydropower plants were built between
1988and2000,i.e.SJSultanMahmud,Kenyir,SJPiah(Upper&Lower)andSJSultanIsmailPetra, Pergau.
Table 2.3-2 shows the capacity and annual
yield of some of the major hydropower plants
in Malaysia. Based on the CO2 Emission Factor
of0.741kg/kWh,theseplantsareabletoreduce up to 4.64 million tonne CO
2/annum,
andthereductionwillbegreaterifSJBakunisincluded.
Table 2.3-2 Installed capacity and annual yield of some of the major hydropower plants in Malaysia
The Current Status of Carbon Free Energy Technologies
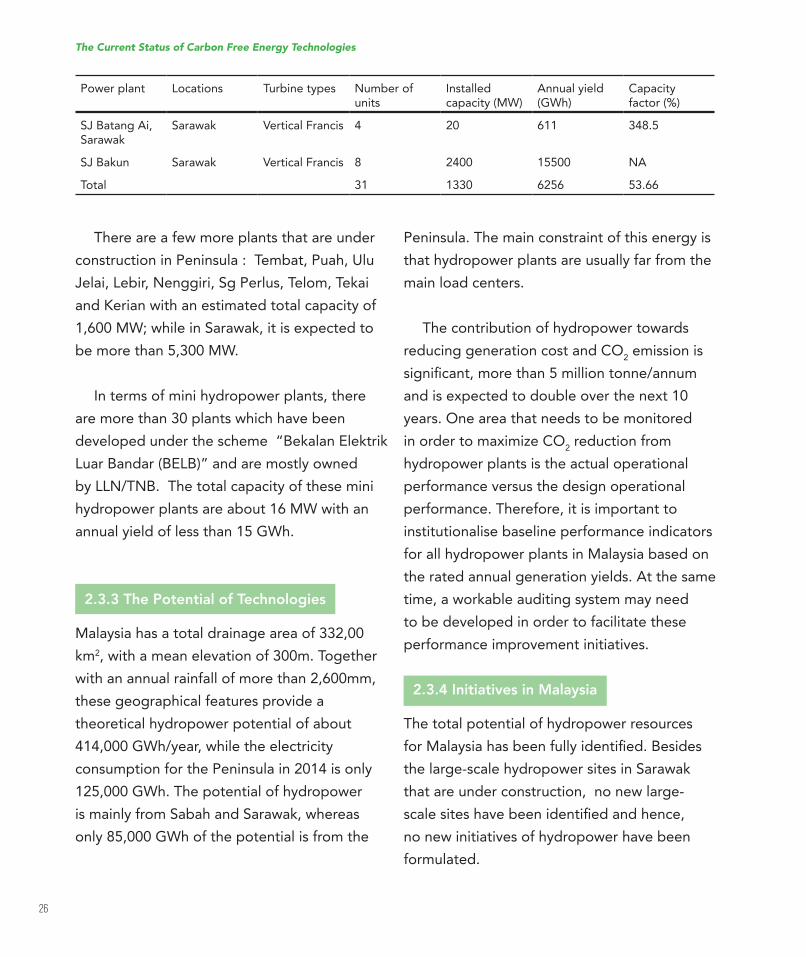
26
SJBatangAi,Sarawak
Sarawak Vertical Francis 4 20 611 348.5
SJBakun Sarawak Vertical Francis 8 2400 15500 NA
Total 31 1330 6256 53.66
There are a few more plants that are under
construction in Peninsula : Tembat, Puah, Ulu
Jelai,Lebir,Nenggiri,SgPerlus,Telom,TekaiandKerianwithanestimatedtotalcapacityof1,600 MW; while in Sarawak, it is expected to
be more than 5,300 MW.
In terms of mini hydropower plants, there
are more than 30 plants which have been
developed under the scheme “Bekalan Elektrik
Luar Bandar (BELB)” and are mostly owned
byLLN/TNB.Thetotalcapacityoftheseminihydropower plants are about 16 MW with an
annual yield of less than 15 GWh.
2.3.3 The Potential of Technologies
Malaysia has a total drainage area of 332,00
km2, with a mean elevation of 300m. Together
with an annual rainfall of more than 2,600mm,
these geographical features provide a
theoretical hydropower potential of about
414,000GWh/year,whiletheelectricityconsumption for the Peninsula in 2014 is only
125,000 GWh. The potential of hydropower
is mainly from Sabah and Sarawak, whereas
only 85,000 GWh of the potential is from the
Peninsula. The main constraint of this energy is
that hydropower plants are usually far from the
main load centers.
The contribution of hydropower towards
reducing generation cost and CO2 emission is
signiicant,morethan5milliontonne/annumand is expected to double over the next 10
years. One area that needs to be monitored
in order to maximize CO2 reduction from
hydropower plants is the actual operational
performance versus the design operational
performance. Therefore, it is important to
institutionalise baseline performance indicators
for all hydropower plants in Malaysia based on
the rated annual generation yields. At the same
time, a workable auditing system may need
to be developed in order to facilitate these
performance improvement initiatives.
2.3.4 Initiatives in Malaysia
The total potential of hydropower resources
forMalaysiahasbeenfullyidentiied.Besidesthe large-scale hydropower sites in Sarawak
that are under construction, no new large-
scalesiteshavebeenidentiiedandhence,no new initiatives of hydropower have been
formulated.
The Current Status of Carbon Free Energy Technologies
Power plant Locations Turbine types Number of units
Installed capacity (MW)
Annual yield (GWh)
Capacity factor (%)
27
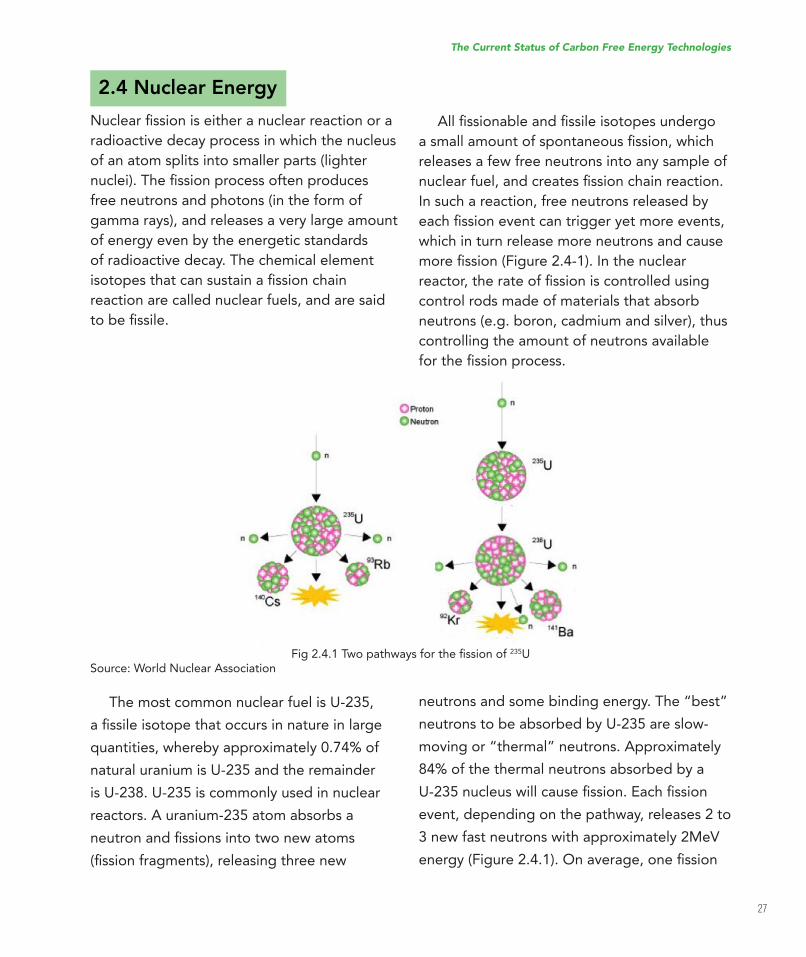
Fig2.4.1Twopathwaysfortheissionof235USource: World Nuclear Association
2.4 Nuclear Energy
Nuclearissioniseitheranuclearreactionoraradioactive decay process in which the nucleus
of an atom splits into smaller parts (lighter
nuclei).Theissionprocessoftenproducesfree neutrons and photons (in the form of
gamma rays), and releases a very large amount
of energy even by the energetic standards
of radioactive decay. The chemical element
isotopesthatcansustainaissionchainreaction are called nuclear fuels, and are said
tobeissile.
The most common nuclear fuel is U-235,
aissileisotopethatoccursinnatureinlargequantities, whereby approximately 0.74% of
natural uranium is U-235 and the remainder
is U-238. U-235 is commonly used in nuclear
reactors. A uranium-235 atom absorbs a
neutronandissionsintotwonewatoms(issionfragments),releasingthreenew
Allissionableandissileisotopesundergoasmallamountofspontaneousission,whichreleases a few free neutrons into any sample of
nuclearfuel,andcreatesissionchainreaction.In such a reaction, free neutrons released by
eachissioneventcantriggeryetmoreevents,which in turn release more neutrons and cause
moreission(Figure2.4-1).Inthenuclearreactor,therateofissioniscontrolledusingcontrol rods made of materials that absorb
neutrons (e.g. boron, cadmium and silver), thus
controlling the amount of neutrons available
fortheissionprocess.
neutrons and some binding energy. The “best”
neutrons to be absorbed by U-235 are slow-
moving or “thermal” neutrons. Approximately
84% of the thermal neutrons absorbed by a
U-235nucleuswillcauseission.Eachissionevent, depending on the pathway, releases 2 to
3 new fast neutrons with approximately 2MeV
energy(Figure2.4.1).Onaverage,oneission
The Current Status of Carbon Free Energy Technologies
28
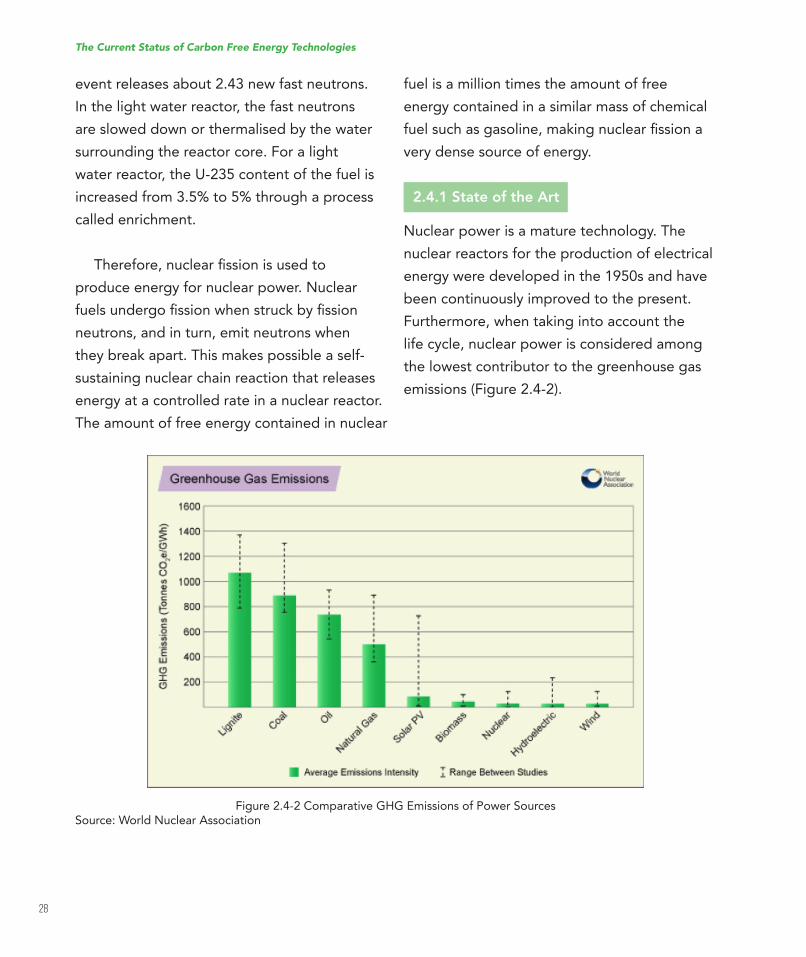
Figure 2.4-2 Comparative GHG Emissions of Power SourcesSource: World Nuclear Association
event releases about 2.43 new fast neutrons.
In the light water reactor, the fast neutrons
are slowed down or thermalised by the water
surrounding the reactor core. For a light
water reactor, the U-235 content of the fuel is
increased from 3.5% to 5% through a process
called enrichment.
Therefore,nuclearissionisusedtoproduce energy for nuclear power. Nuclear
fuelsundergoissionwhenstruckbyissionneutrons, and in turn, emit neutrons when
they break apart. This makes possible a self-
sustaining nuclear chain reaction that releases
energy at a controlled rate in a nuclear reactor.
The amount of free energy contained in nuclear
fuel is a million times the amount of free
energy contained in a similar mass of chemical
fuelsuchasgasoline,makingnuclearissionavery dense source of energy.
2.4.1 State of the Art
Nuclear power is a mature technology. The
nuclear reactors for the production of electrical
energy were developed in the 1950s and have
been continuously improved to the present.
Furthermore, when taking into account the
life cycle, nuclear power is considered among
the lowest contributor to the greenhouse gas
emissions (Figure 2.4-2).
The Current Status of Carbon Free Energy Technologies
29
According to World Nuclear Association, in
some countries, a large portion of their electricity
is generated using nuclear reactors. Some of
the notable ones are: France (75%), Sweden
(40%), Bulgaria (35%), Hungary (30%), South
Korea(30%),UnitedStatesofAmerica(19%)and Germany (18%). Further details are shown
in Figure 2.4-3. Some other countries that are
opting for nuclear power in the near future
include the United Arab Emirates and Saudi
Arabia. On the other hand, China is embarking
on accelerating the expansion of her nuclear
power capacity and reducing her coal plants in
order to reduce her greenhouse gases loading.
Types of Commercial Nuclear Reactors
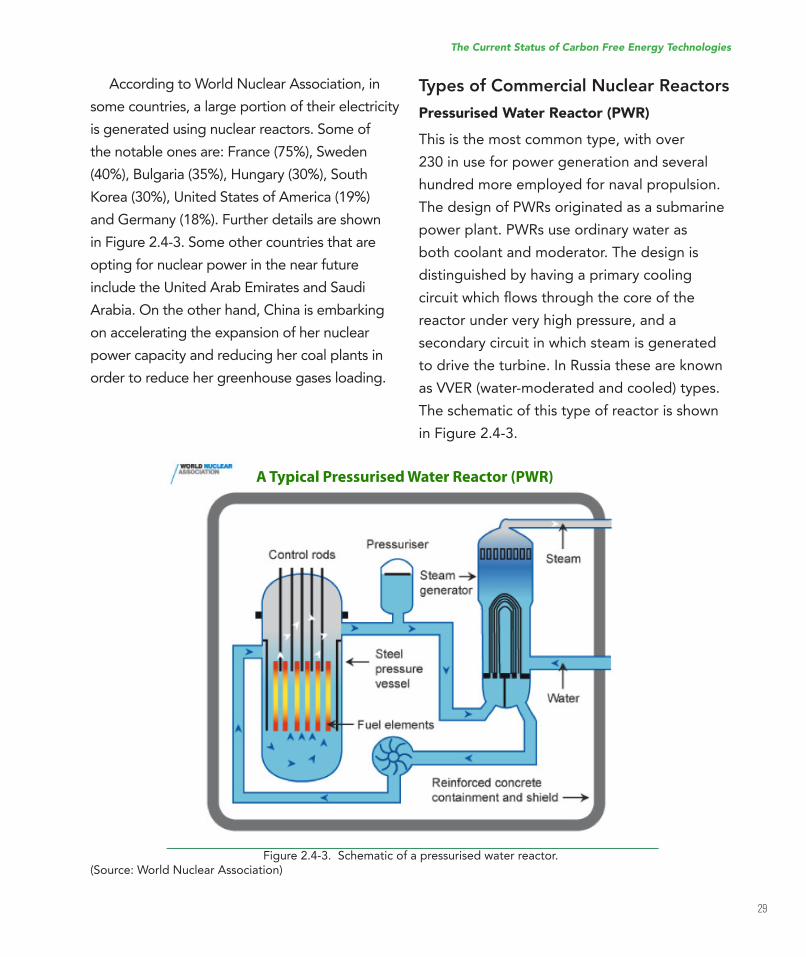
Pressurised Water Reactor (PWR)
This is the most common type, with over
230 in use for power generation and several
hundred more employed for naval propulsion.
The design of PWRs originated as a submarine
power plant. PWRs use ordinary water as
both coolant and moderator. The design is
distinguished by having a primary cooling
circuitwhichlowsthroughthecoreofthereactor under very high pressure, and a
secondary circuit in which steam is generated
to drive the turbine. In Russia these are known
as VVER (water-moderated and cooled) types.
The schematic of this type of reactor is shown
in Figure 2.4-3.
The Current Status of Carbon Free Energy Technologies
Figure 2.4-3. Schematic of a pressurised water reactor.(Source: World Nuclear Association)
A Typical Pressurised Water Reactor (PWR)
30
A PWR has fuel assemblies of 200-300 rods
each, arranged vertically in the core, and a
large reactor would have about 150-250 fuel
assemblies with 80-100 tonnes of uranium.
The water temperature in the reactor core
reaches about 325°C, hence it must be kept
under about 150 times atmospheric pressure to
prevent it from boiling. Pressure is maintained
by steam in a pressuriser (Figure 2.4-3). In
the primary cooling circuit, water is also the
moderator, and if any of it is turned to steam,
theissionreactionwouldslowdown.
This negative feedback effect is one of the
safety features of the reactor. The secondary
shutdown system involves adding boron to the
primary circuit. The secondary circuit is under
less pressure and the water here boils in the
heat exchangers or steam generators. The
steam drives the turbine to produce electricity,
and is then condensed and returned to the
heat exchangers in contact with the primary
circuit.
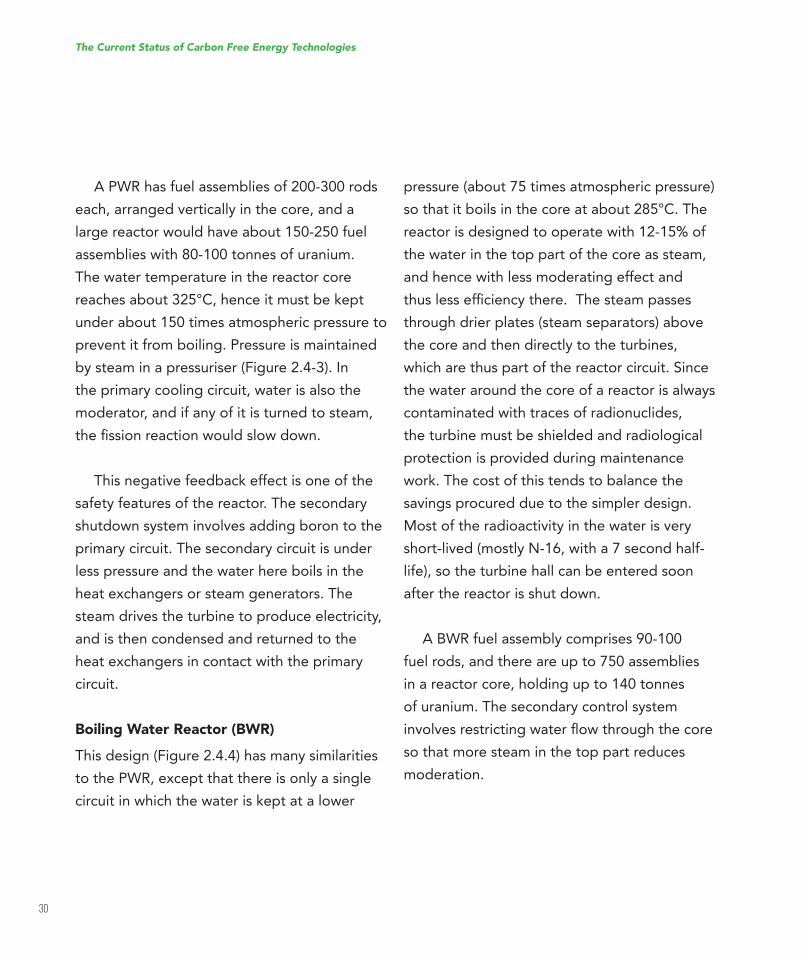
Boiling Water Reactor (BWR)
This design (Figure 2.4.4) has many similarities
to the PWR, except that there is only a single
circuit in which the water is kept at a lower
pressure (about 75 times atmospheric pressure)
so that it boils in the core at about 285°C. The
reactor is designed to operate with 12-15% of
the water in the top part of the core as steam,
and hence with less moderating effect and
thuslesseficiencythere.Thesteampassesthrough drier plates (steam separators) above
the core and then directly to the turbines,
which are thus part of the reactor circuit. Since
the water around the core of a reactor is always
contaminated with traces of radionuclides,
the turbine must be shielded and radiological
protection is provided during maintenance
work. The cost of this tends to balance the
savings procured due to the simpler design.
Most of the radioactivity in the water is very
short-lived (mostly N-16, with a 7 second half-
life), so the turbine hall can be entered soon
after the reactor is shut down.
A BWR fuel assembly comprises 90-100
fuel rods, and there are up to 750 assemblies
in a reactor core, holding up to 140 tonnes
of uranium. The secondary control system
involvesrestrictingwaterlowthroughthecoreso that more steam in the top part reduces
moderation.
The Current Status of Carbon Free Energy Technologies
31
Figure 2.4-4 Schematic of a Boiling Water Reactor(Source: World Nuclear Association)
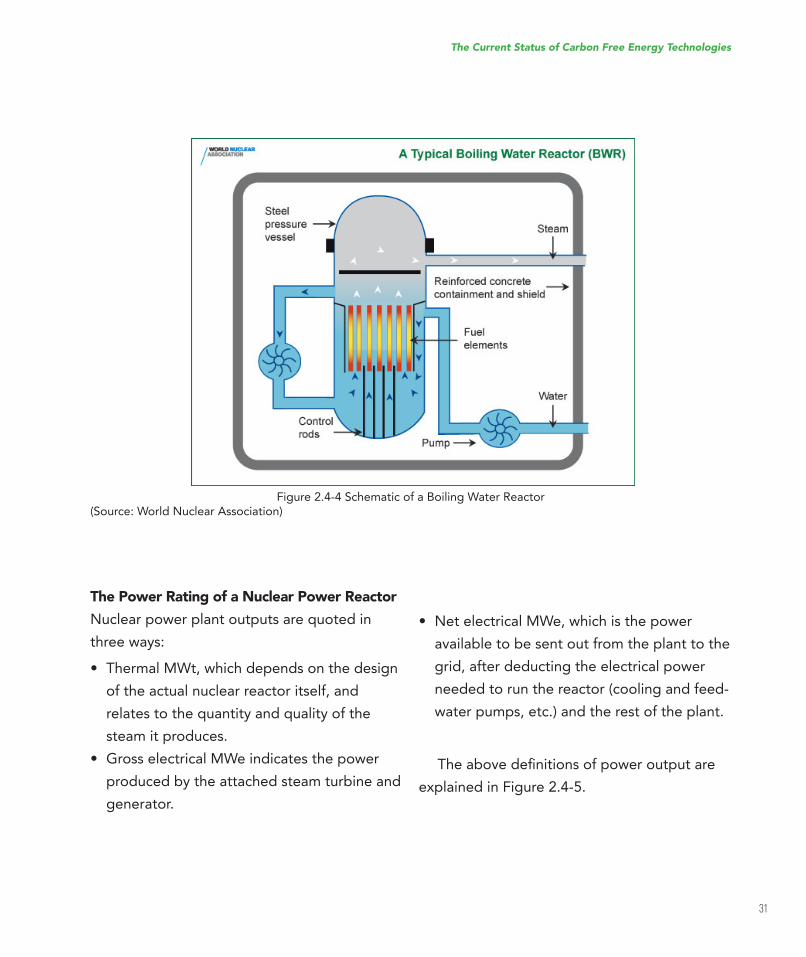
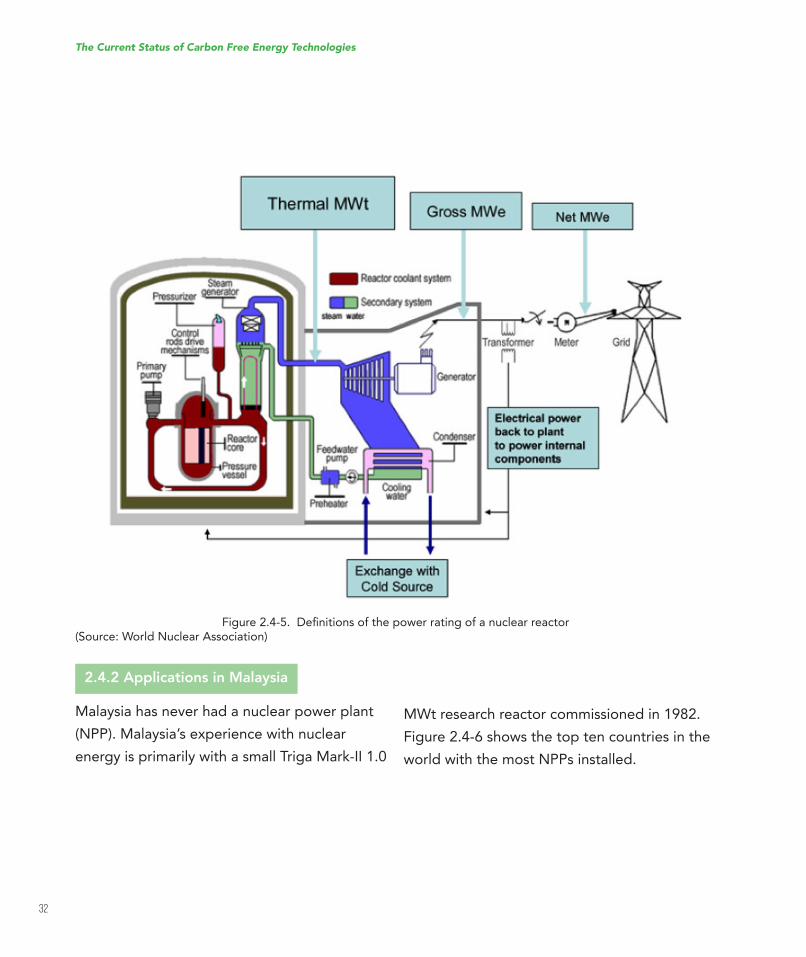
The Power Rating of a Nuclear Power Reactor
Nuclear power plant outputs are quoted in
three ways:
• ThermalMWt,whichdependsonthedesignof the actual nuclear reactor itself, and
relates to the quantity and quality of the
steam it produces.
• GrosselectricalMWeindicatesthepowerproduced by the attached steam turbine and
generator.
• NetelectricalMWe,whichisthepoweravailable to be sent out from the plant to the
grid, after deducting the electrical power
needed to run the reactor (cooling and feed-
water pumps, etc.) and the rest of the plant.
Theabovedeinitionsofpoweroutputareexplained in Figure 2.4-5.
The Current Status of Carbon Free Energy Technologies
32
Figure2.4-5.Deinitionsofthepowerratingofanuclearreactor(Source: World Nuclear Association)
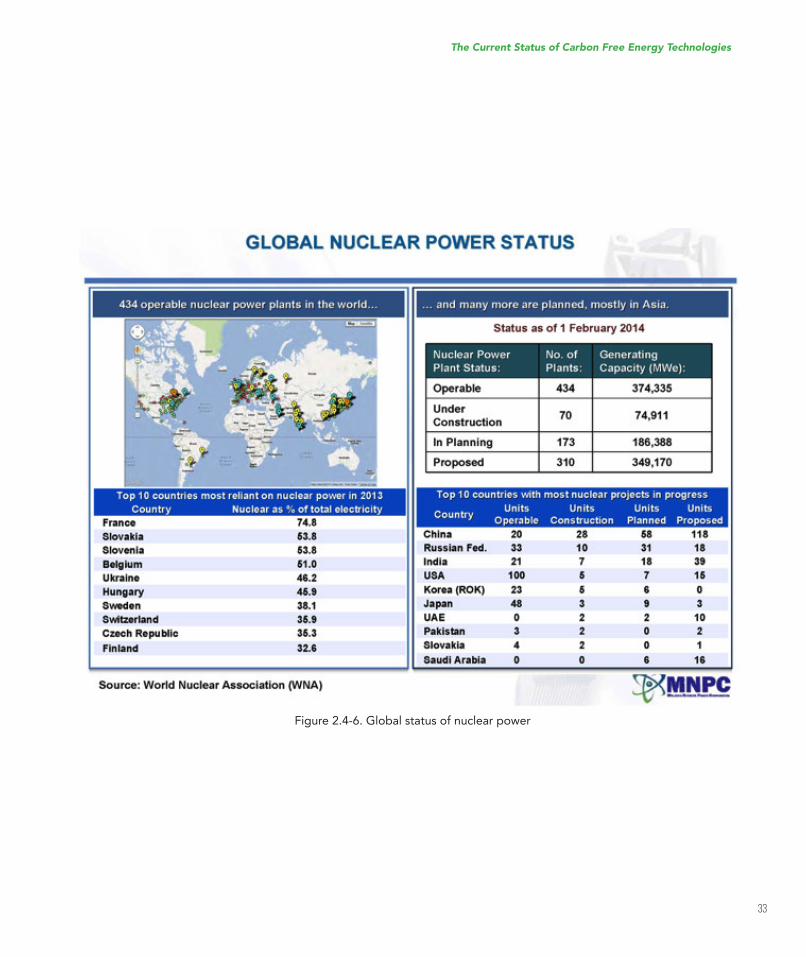
2.4.2 Applications in Malaysia
Malaysia has never had a nuclear power plant
(NPP). Malaysia’s experience with nuclear
energy is primarily with a small Triga Mark-II 1.0
MWt research reactor commissioned in 1982.
Figure 2.4-6 shows the top ten countries in the
world with the most NPPs installed.
The Current Status of Carbon Free Energy Technologies
33
Figure 2.4-6. Global status of nuclear power
The Current Status of Carbon Free Energy Technologies
34
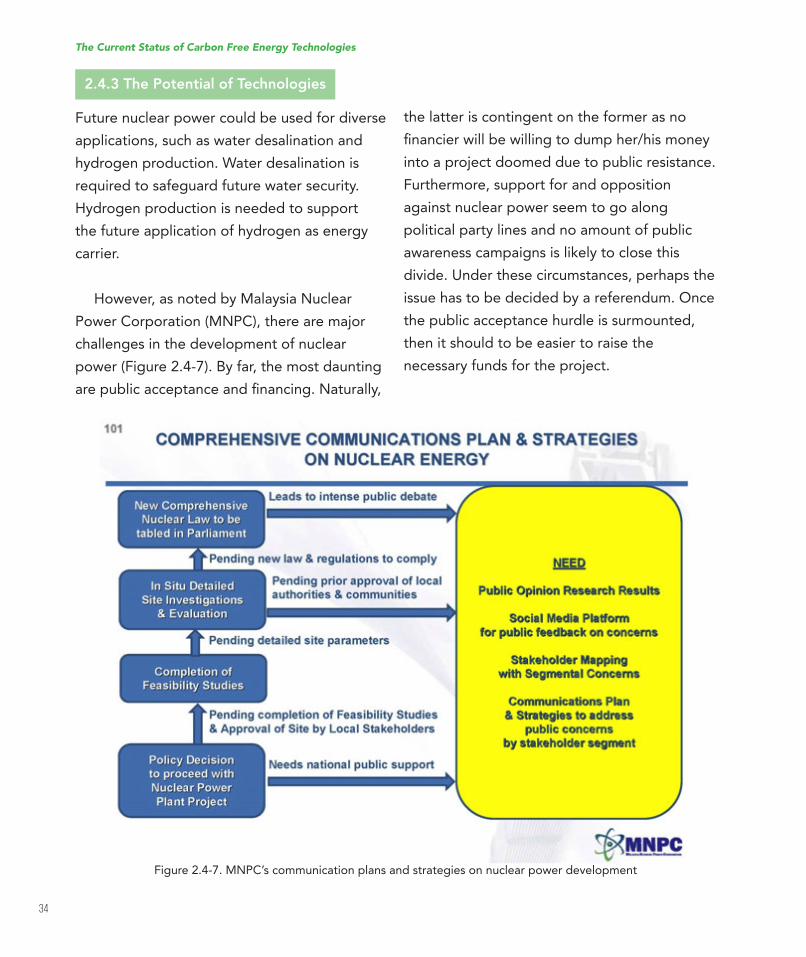
2.4.3 The Potential of Technologies
Future nuclear power could be used for diverse
applications, such as water desalination and
hydrogen production. Water desalination is
required to safeguard future water security.
Hydrogen production is needed to support
the future application of hydrogen as energy
carrier.
However, as noted by Malaysia Nuclear
Power Corporation (MNPC), there are major
challenges in the development of nuclear
power (Figure 2.4-7). By far, the most daunting
arepublicacceptanceandinancing.Naturally,
Figure 2.4-7. MNPC’s communication plans and strategies on nuclear power development
the latter is contingent on the former as no
inancierwillbewillingtodumpher/hismoneyinto a project doomed due to public resistance.
Furthermore, support for and opposition
against nuclear power seem to go along
political party lines and no amount of public
awareness campaigns is likely to close this
divide. Under these circumstances, perhaps the
issue has to be decided by a referendum. Once
the public acceptance hurdle is surmounted,
then it should to be easier to raise the
necessary funds for the project.
The Current Status of Carbon Free Energy Technologies
35
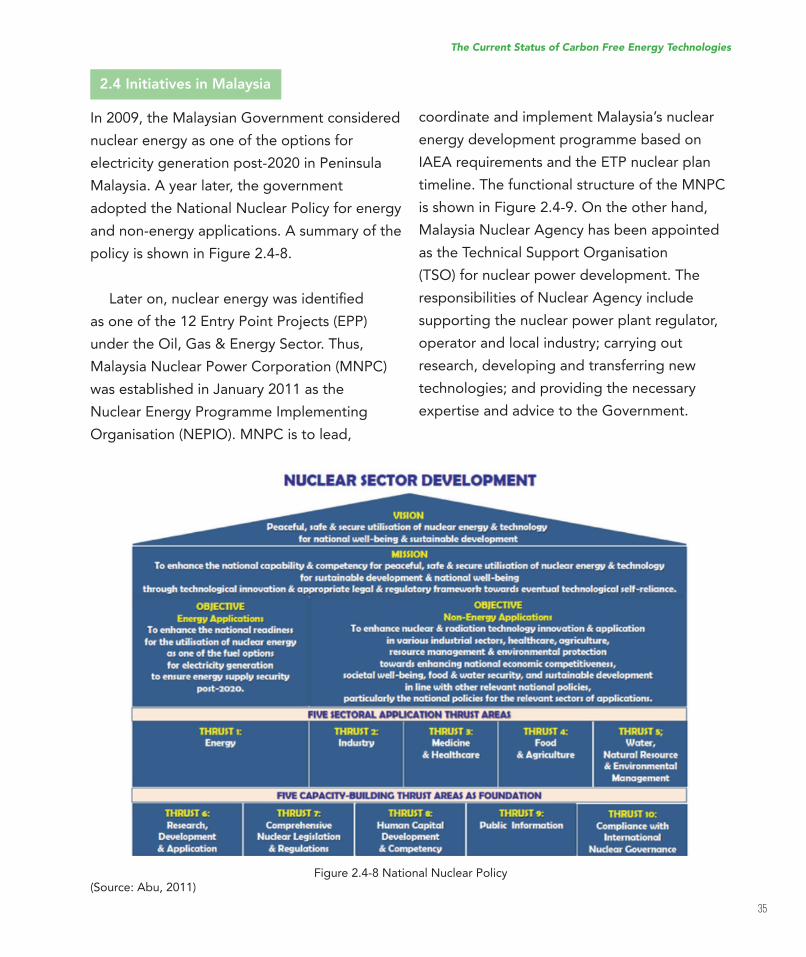
Figure 2.4-8 National Nuclear Policy(Source: Abu, 2011)
2.4 Initiatives in Malaysia
In 2009, the Malaysian Government considered
nuclear energy as one of the options for
electricity generation post-2020 in Peninsula
Malaysia. A year later, the government
adopted the National Nuclear Policy for energy
and non-energy applications. A summary of the
policy is shown in Figure 2.4-8.
Lateron,nuclearenergywasidentiiedas one of the 12 Entry Point Projects (EPP)
under the Oil, Gas & Energy Sector. Thus,
Malaysia Nuclear Power Corporation (MNPC)
wasestablishedinJanuary2011astheNuclear Energy Programme Implementing
Organisation (NEPIO). MNPC is to lead,
coordinate and implement Malaysia’s nuclear
energy development programme based on
IAEA requirements and the ETP nuclear plan
timeline. The functional structure of the MNPC
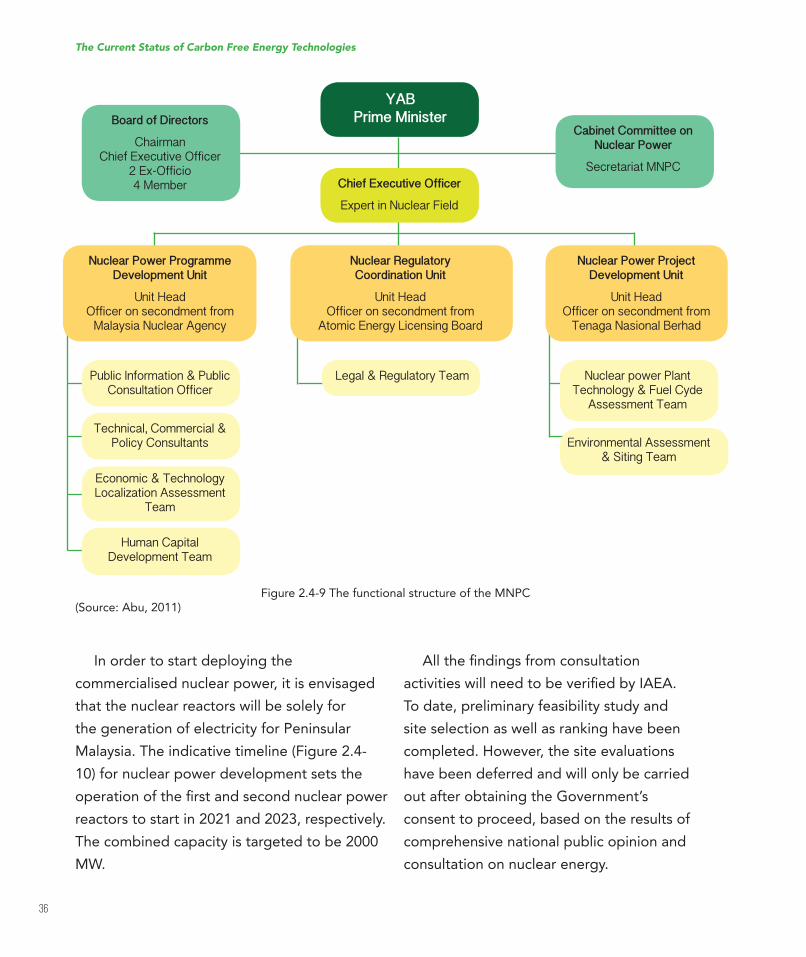
is shown in Figure 2.4-9. On the other hand,
Malaysia Nuclear Agency has been appointed
as the Technical Support Organisation
(TSO) for nuclear power development. The
responsibilities of Nuclear Agency include
supporting the nuclear power plant regulator,
operator and local industry; carrying out
research, developing and transferring new
technologies; and providing the necessary
expertise and advice to the Government.
The Current Status of Carbon Free Energy Technologies
36
Figure 2.4-9 The functional structure of the MNPC(Source: Abu, 2011)
In order to start deploying the
commercialised nuclear power, it is envisaged
that the nuclear reactors will be solely for
the generation of electricity for Peninsular
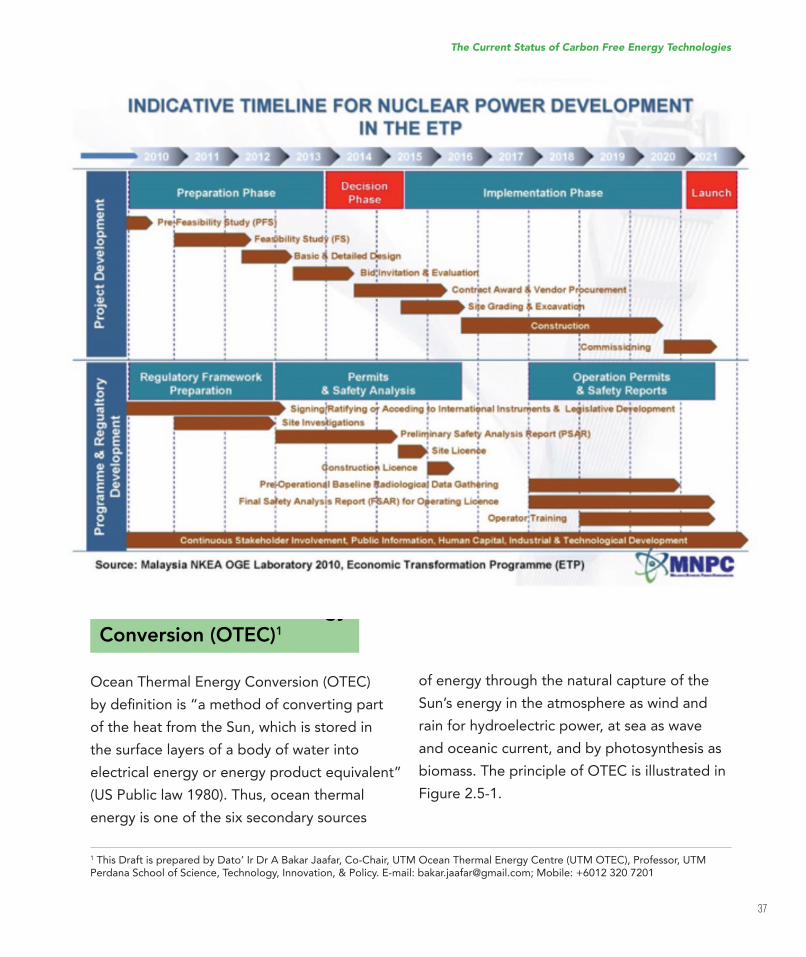
Malaysia. The indicative timeline (Figure 2.4-
10) for nuclear power development sets the
operationoftheirstandsecondnuclearpowerreactors to start in 2021 and 2023, respectively.
The combined capacity is targeted to be 2000
MW.
AlltheindingsfromconsultationactivitieswillneedtobeveriiedbyIAEA.To date, preliminary feasibility study and
site selection as well as ranking have been
completed. However, the site evaluations
have been deferred and will only be carried
out after obtaining the Government’s
consent to proceed, based on the results of
comprehensive national public opinion and
consultation on nuclear energy.
YABPrime Minister
Chief Executive Officer
Expert in Nuclear Field
Board of Directors
ChairmanChief Executive Officer
2 Ex-Officio4 Member
Nuclear Power ProgrammeDevelopment Unit
Unit HeadOfficer on secondment from
Malaysia Nuclear Agency
Public Information & Public Consultation Officer
Legal & Regulatory Team Nuclear power PlantTechnology & Fuel Cyde
Assessment Team
Technical, Commercial &Policy Consultants Environmental Assessment
& Siting Team
Economic & TechnologyLocalization Assessment
Team
Human CapitalDevelopment Team
Nuclear Regulatory Coordination Unit
Unit HeadOfficer on secondment from
Atomic Energy Licensing Board
Nuclear Power Project Development Unit
Unit HeadOfficer on secondment from
Tenaga Nasional Berhad
Cabinet Committee onNuclear Power
Secretariat MNPC
The Current Status of Carbon Free Energy Technologies
37
Figure 2.4-10. Indicative timeline for nuclear power development in Malaysia
2.5 Ocean Thermal Energy
Conversion (OTEC)1
Ocean Thermal Energy Conversion (OTEC)
bydeinitionis“amethodofconvertingpartof the heat from the Sun, which is stored in
the surface layers of a body of water into
electrical energy or energy product equivalent”
(US Public law 1980). Thus, ocean thermal
energy is one of the six secondary sources
of energy through the natural capture of the
Sun’s energy in the atmosphere as wind and
rain for hydroelectric power, at sea as wave
and oceanic current, and by photosynthesis as
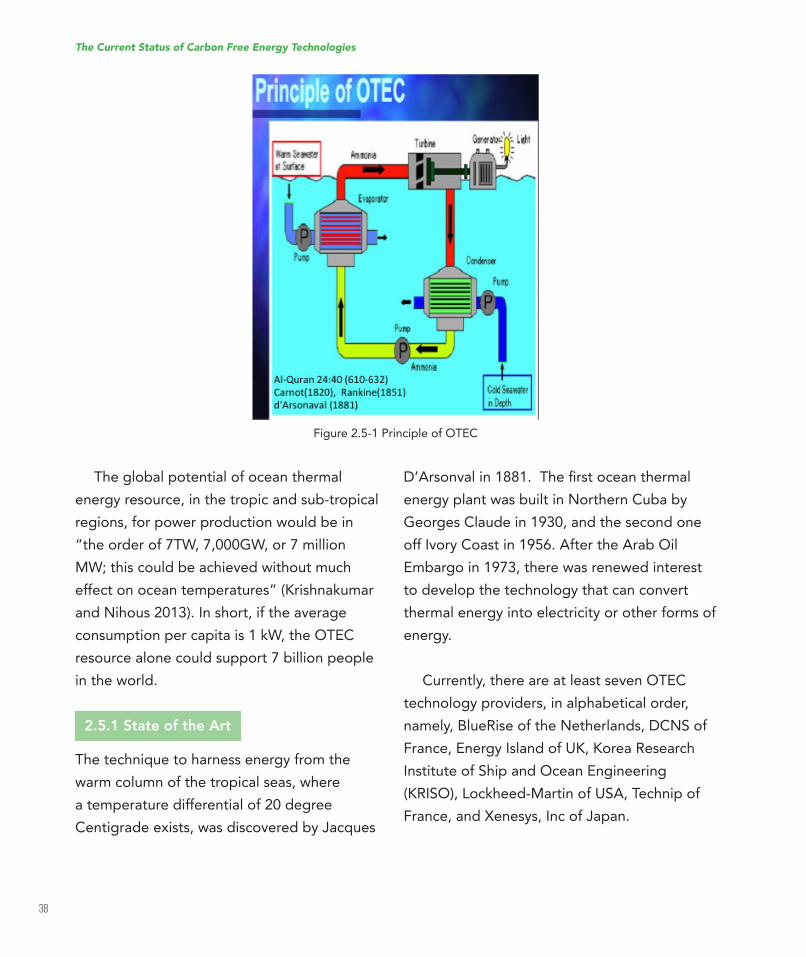
biomass. The principle of OTEC is illustrated in
Figure 2.5-1.
1ThisDraftispreparedbyDato’IrDrABakarJaafar,Co-Chair,UTMOceanThermalEnergyCentre(UTMOTEC),Professor,UTMPerdana School of Science, Technology, Innovation, & Policy. E-mail: [email protected]; Mobile: +6012 320 7201
The Current Status of Carbon Free Energy Technologies
38
Figure 2.5-1 Principle of OTEC
The global potential of ocean thermal
energy resource, in the tropic and sub-tropical
regions, for power production would be in
“the order of 7TW, 7,000GW, or 7 million
MW; this could be achieved without much
effectonoceantemperatures”(Krishnakumarand Nihous 2013). In short, if the average
consumption per capita is 1 kW, the OTEC
resource alone could support 7 billion people
in the world.
2.5.1 State of the Art
The technique to harness energy from the
warm column of the tropical seas, where
a temperature differential of 20 degree
Centigradeexists,wasdiscoveredbyJacques
D’Arsonvalin1881.Theirstoceanthermalenergy plant was built in Northern Cuba by
Georges Claude in 1930, and the second one
off Ivory Coast in 1956. After the Arab Oil
Embargo in 1973, there was renewed interest
to develop the technology that can convert
thermal energy into electricity or other forms of
energy.
Currently, there are at least seven OTEC
technology providers, in alphabetical order,
namely,BlueRiseoftheNetherlands,DCNSofFrance,EnergyIslandofUK,KoreaResearchInstitute of Ship and Ocean Engineering
(KRISO),Lockheed-MartinofUSA,TechnipofFrance,andXenesys,IncofJapan.
The Current Status of Carbon Free Energy Technologies
39
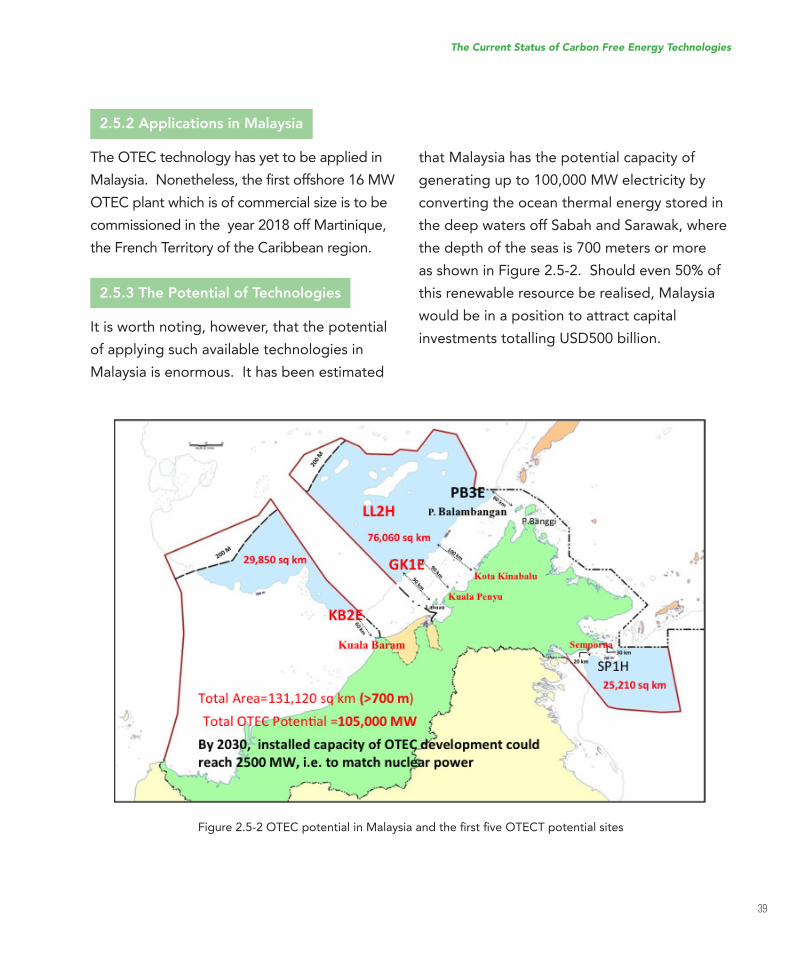
Figure2.5-2OTECpotentialinMalaysiaandtheirstiveOTECTpotentialsites
2.5.2 Applications in Malaysia
The OTEC technology has yet to be applied in
Malaysia.Nonetheless,theirstoffshore16MWOTEC plant which is of commercial size is to be
commissioned in the year 2018 off Martinique,
the French Territory of the Caribbean region.
2.5.3 The Potential of Technologies
It is worth noting, however, that the potential
of applying such available technologies in
Malaysia is enormous. It has been estimated
that Malaysia has the potential capacity of
generating up to 100,000 MW electricity by
converting the ocean thermal energy stored in
the deep waters off Sabah and Sarawak, where
the depth of the seas is 700 meters or more
as shown in Figure 2.5-2. Should even 50% of
this renewable resource be realised, Malaysia
would be in a position to attract capital
investmentstotallingUSD500billion.
The Current Status of Carbon Free Energy Technologies
40
In the instances where there are surpluses of
electrical power, it would be converted to any
energy product equivalent such as hydrogen
fuel. Hydrogen fuel is expected to be the most
dominant energy carrier in the 21st Century
(IbrahimDincer2008).
In addition, there are other spinoffs of the
OTEC technology that include the production
of temperate foods and produce, high-
value marine culture, mineral water, lithium,
cosmetics and other beauty products.
2.5.4 Initiatives in Malaysia
Malaysia discovered its potential for ocean
thermal energy resource during the Marine
Survey of South China in 2006-08. A series
of presentations to various agencies and
authorities including potential investors
has been made since then. On 10 May
2012, Maritime Institute of Malaysia (MIMA)
convened the InterAgency and Stakeholders
Consultation on OTEC in Putrajaya. On 16 May
2012, the Chairman of Ocean Thermal Energy
Corporation of USA paid a courtesy call to
YABPrimeMinisterofMalaysiaandexpressedhis interest to invest in OTEC in Malaysia.
On3January2013,UniversityofTechnologyMalaysia established its Ocean Thermal Energy
Centre.On18November2014,theirstSpecialPurpose Vehicle (SPV) for OTEC in Malaysia,
namely,DeepSeaThermalSolutionsSdnBhd,wasincorporatedbyPASDECHoldingsBerhad. As of this date, there are at least four
other companies that have registered: UTM
OTEC Sdn Bhd, UTM OTEC Solutions Sdn Bhd,
Sustainable Ocean Thermal Energy Resources
Sdn Bhd, and NMIT OTEC Sdn Bhd.
TheirstlikelyuseofOTECinMalaysiawould be to supply power to the oil & gas
production off the deep waters of Sabah.
Under the 11th Malaysia Plan (2016-2020),
UTM is bidding for an allocation of up to
RM350milliontobuildtheirsttaxpayer-funded 10 MW OTEC plant off Pulau Layang-
Layang, largely for security and for the sake
of maintaining national sovereignty within
Malaysia’s national maritime jurisdictions.
The Current Status of Carbon Free Energy Technologies
41
2.6 Solar Photovoltaic
Solar photovoltaic (PV) technology converts
sunlightintoelectricityusingaspeciictypeof semiconductor device known as a solar PV
cell. Solar PV cells are primarily used in grid-
connected PV systems to power residential
and commercial appliances, including lighting
and air-conditioning. When solar PV cells are
ittedinastandalonesystemequippedwithbatteries, they can be used in remote regions
where there is no grid electricity. Solar PV
panels can be ground-mounted, installed on
building rooftops or designed into building
materials at the point of manufacturing.
2.6.1 State of the Art
A solar photovoltaic (PV) cell is made of
semiconductor materials. When exposed
to light, the valence electrons of the
semiconductor are excited and freed,
producing an electrical current. The two major
types of solar PV cells are crystalline silicon and
thin-ilms,whichdifferfromeachotherintermsof light absorption ability, energy conversion
eficiency,manufacturingtechnology,andproduction costs. Solar PV cells are silent and
clean in operation, highly reliable, have low
maintenance, and extremely robust with an
expected lifetime of at least 20 to 30 years.
They are also very modular, and thus can be
adapted for many locations and applications.
Crystalline Silicon PV
Crystalline silicon solar cells can be divided into
two types, namely mono-crystalline and poly-
crystalline solar cells.
a. Mono-crystalline solar cell: Manufactured by
sawing wafers from a very pure single and
continuous cylindrical crystal of silicon with
zerodefectandimpurities.Mosteficient(~15% – 20%) and most expensive.
b. Poly-crystalline solar cell: Manufactured by
sawing wafers from an ingot of melted and
re-crystallised silicon (cast Si) of multiple
smallcrystals.Lesseficient(12%–15%typical modules), but less expensive than
mono-crystalline, and its manufacturing
process is simpler.
Thin-ilm Solar CellAthin-ilmsolarcell(TFSC),alsoknownasthin-ilmPVcell(TFPV),isasolarcellthatismade by depositing one or more thin layers of
PV material on a substrate, usually coated with
glass, metal or plastic. The thickness of such
a layer varies from a few nanometers to tens
ofmicrometers.Athin-ilmsolarcellismorelexible,cheaperandeasiertomanufacturecompared to crystalline silicon solar cell,
hence useful for small-scale applications such
ascalculators.Thin-ilmsolarcellsareusually
The Current Status of Carbon Free Energy Technologies
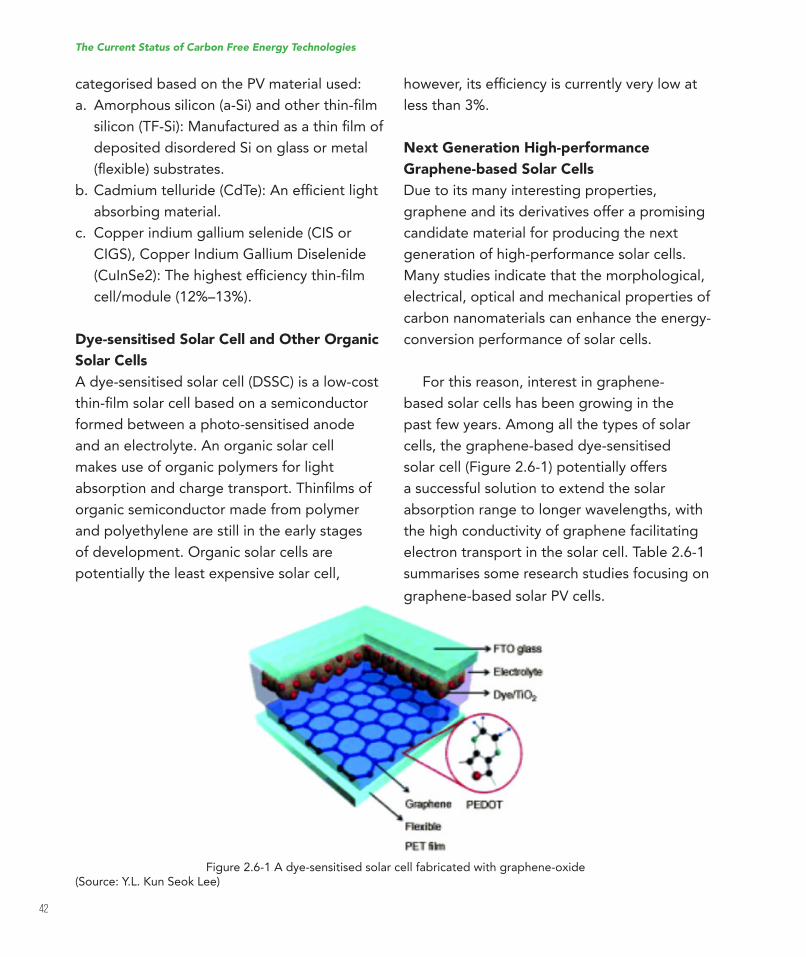
42
categorised based on the PV material used:
a. Amorphoussilicon(a-Si)andotherthin-ilmsilicon(TF-Si):Manufacturedasathinilmofdeposited disordered Si on glass or metal
(lexible)substrates.b.Cadmiumtelluride(CdTe):Aneficientlight
absorbing material.
c. Copper indium gallium selenide (CIS or
CIGS),CopperIndiumGalliumDiselenide(CuInSe2):Thehighesteficiencythin-ilmcell/module(12%–13%).
Dye-sensitised Solar Cell and Other Organic
Solar Cells
Adye-sensitisedsolarcell(DSSC)isalow-costthin-ilmsolarcellbasedonasemiconductorformed between a photo-sensitised anode
and an electrolyte. An organic solar cell
makes use of organic polymers for light
absorptionandchargetransport.Thinilmsoforganic semiconductor made from polymer
and polyethylene are still in the early stages
of development. Organic solar cells are
potentially the least expensive solar cell,
Figure 2.6-1 A dye-sensitised solar cell fabricated with graphene-oxide(Source:Y.L.KunSeokLee)
however,itseficiencyiscurrentlyverylowatless than 3%.
Next Generation High-performance
Graphene-based Solar Cells
Duetoitsmanyinterestingproperties,graphene and its derivatives offer a promising
candidate material for producing the next
generation of high-performance solar cells.
Many studies indicate that the morphological,
electrical, optical and mechanical properties of
carbon nanomaterials can enhance the energy-
conversion performance of solar cells.
For this reason, interest in graphene-
based solar cells has been growing in the
past few years. Among all the types of solar
cells, the graphene-based dye-sensitised
solar cell (Figure 2.6-1) potentially offers
a successful solution to extend the solar
absorption range to longer wavelengths, with
the high conductivity of graphene facilitating
electron transport in the solar cell. Table 2.6-1
summarises some research studies focusing on
graphene-based solar PV cells.
The Current Status of Carbon Free Energy Technologies
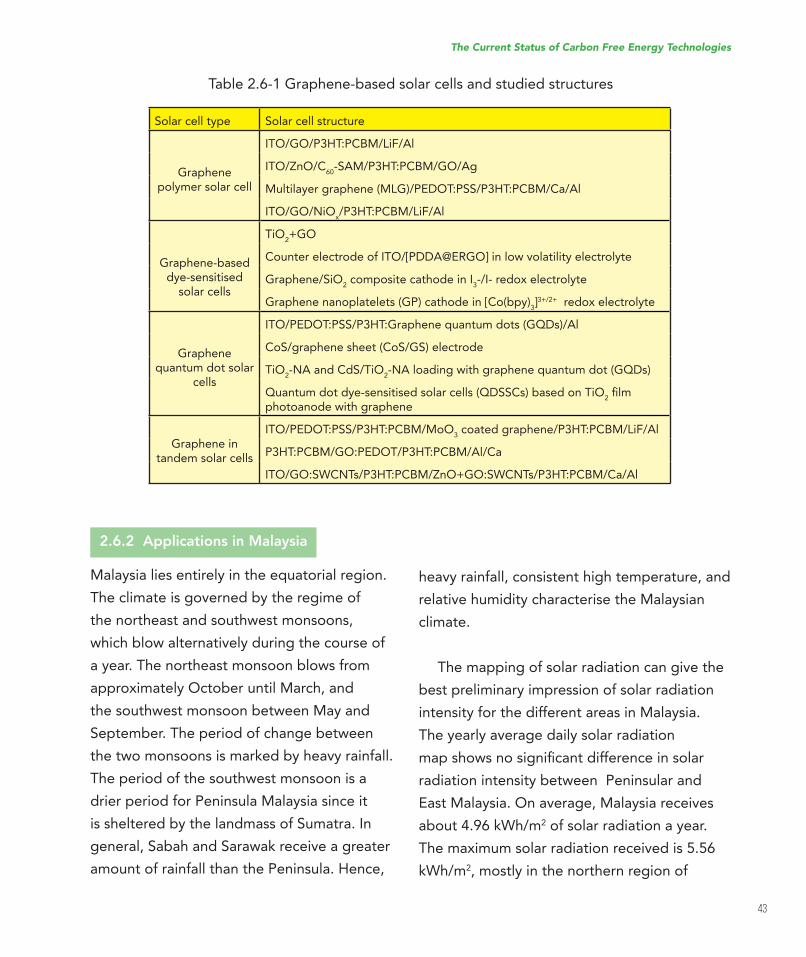
43
Table 2.6-1 Graphene-based solar cells and studied structures
Solar cell type Solar cell structure
Graphene polymer solar cell
ITO/GO/P3HT:PCBM/LiF/AlITO/ZnO/C
60-SAM/P3HT:PCBM/GO/Ag
Multilayergraphene(MLG)/PEDOT:PSS/P3HT:PCBM/Ca/AlITO/GO/NiO
x/P3HT:PCBM/LiF/Al
Graphene-based dye-sensitised
solar cells
TiO2+GO
CounterelectrodeofITO/[PDDA@ERGO]inlowvolatilityelectrolyteGraphene/SiO
2 composite cathode in I
3-/I-redoxelectrolyte
Graphenenanoplatelets(GP)cathodein[Co(bpy)3]3+/2+ redox electrolyte
Graphene quantum dot solar
cells
ITO/PEDOT:PSS/P3HT:Graphenequantumdots(GQDs)/AlCoS/graphenesheet(CoS/GS)electrodeTiO
2-NAandCdS/TiO
2-NAloadingwithgraphenequantumdot(GQDs)
Quantumdotdye-sensitisedsolarcells(QDSSCs)basedonTiO2ilm
photoanode with graphene
Graphene in tandem solar cells
ITO/PEDOT:PSS/P3HT:PCBM/MoO3coatedgraphene/P3HT:PCBM/LiF/Al
P3HT:PCBM/GO:PEDOT/P3HT:PCBM/Al/CaITO/GO:SWCNTs/P3HT:PCBM/ZnO+GO:SWCNTs/P3HT:PCBM/Ca/Al
2.6.2 Applications in Malaysia
Malaysia lies entirely in the equatorial region.
The climate is governed by the regime of
the northeast and southwest monsoons,
which blow alternatively during the course of
a year. The northeast monsoon blows from
approximately October until March, and
the southwest monsoon between May and
September. The period of change between
the two monsoons is marked by heavy rainfall.
The period of the southwest monsoon is a
drier period for Peninsula Malaysia since it
is sheltered by the landmass of Sumatra. In
general, Sabah and Sarawak receive a greater
amount of rainfall than the Peninsula. Hence,
heavy rainfall, consistent high temperature, and
relative humidity characterise the Malaysian
climate.
The mapping of solar radiation can give the
best preliminary impression of solar radiation
intensity for the different areas in Malaysia.
The yearly average daily solar radiation
mapshowsnosigniicantdifferenceinsolarradiation intensity between Peninsular and
East Malaysia. On average, Malaysia receives
about4.96kWh/m2 of solar radiation a year.
The maximum solar radiation received is 5.56
kWh/m2, mostly in the northern region of
The Current Status of Carbon Free Energy Technologies
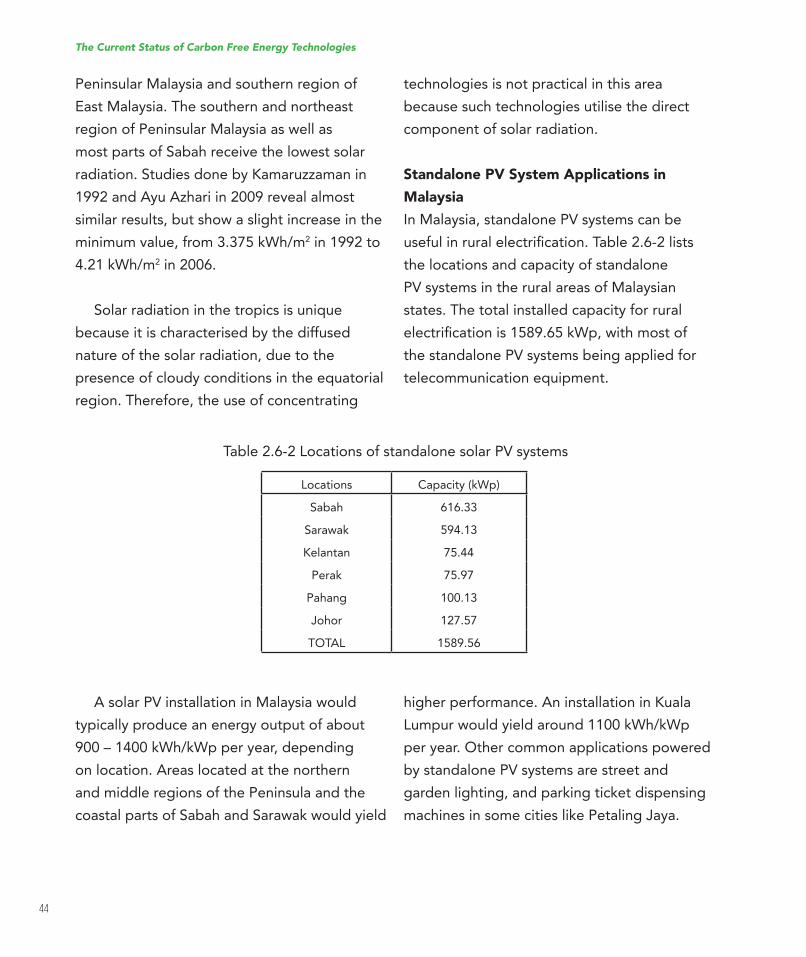
44
Peninsular Malaysia and southern region of
East Malaysia. The southern and northeast
region of Peninsular Malaysia as well as
most parts of Sabah receive the lowest solar
radiation.StudiesdonebyKamaruzzamanin1992 and Ayu Azhari in 2009 reveal almost
similar results, but show a slight increase in the
minimumvalue,from3.375kWh/m2 in 1992 to
4.21kWh/m2 in 2006.
Solar radiation in the tropics is unique
because it is characterised by the diffused
nature of the solar radiation, due to the
presence of cloudy conditions in the equatorial
region. Therefore, the use of concentrating
Table 2.6-2 Locations of standalone solar PV systems
Locations Capacity (kWp)
Sabah 616.33
Sarawak 594.13
Kelantan 75.44
Perak 75.97
Pahang 100.13
Johor 127.57
TOTAL 1589.56
technologies is not practical in this area
because such technologies utilise the direct
component of solar radiation.
Standalone PV System Applications in
Malaysia
In Malaysia, standalone PV systems can be
usefulinruralelectriication.Table2.6-2liststhe locations and capacity of standalone
PV systems in the rural areas of Malaysian
states. The total installed capacity for rural
electriicationis1589.65kWp,withmostofthe standalone PV systems being applied for
telecommunication equipment.
A solar PV installation in Malaysia would
typically produce an energy output of about
900–1400kWh/kWpperyear,dependingon location. Areas located at the northern
and middle regions of the Peninsula and the
coastal parts of Sabah and Sarawak would yield
higherperformance.AninstallationinKualaLumpurwouldyieldaround1100kWh/kWpper year. Other common applications powered
by standalone PV systems are street and
garden lighting, and parking ticket dispensing
machinesinsomecitieslikePetalingJaya.
The Current Status of Carbon Free Energy Technologies
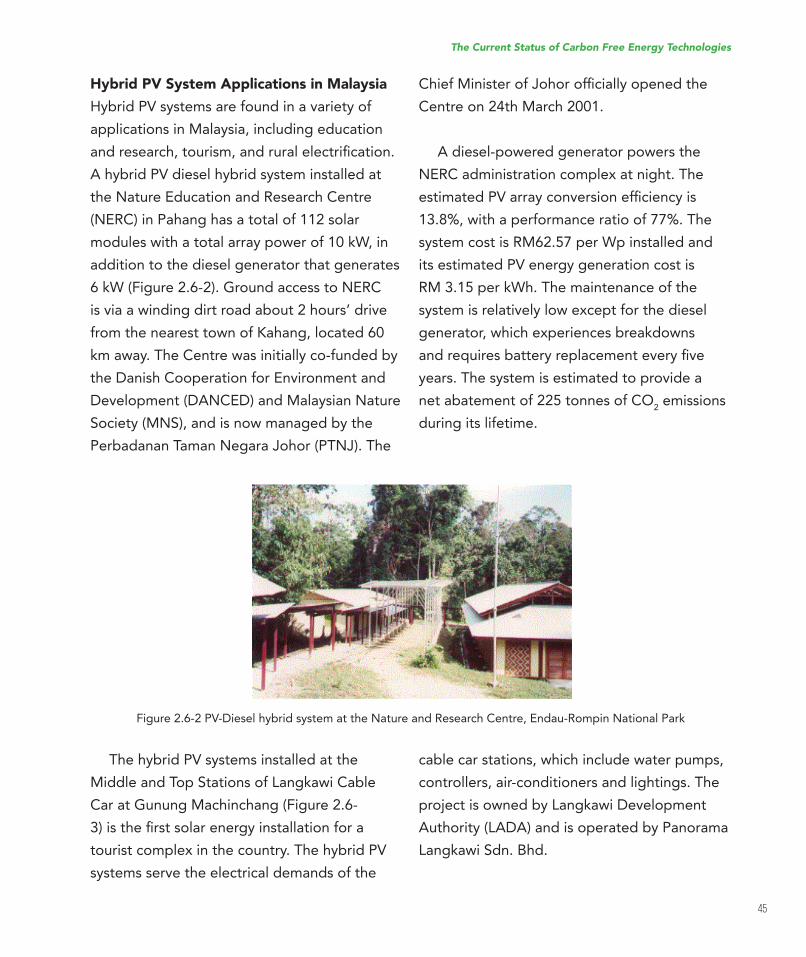
45
Hybrid PV System Applications in Malaysia
Hybrid PV systems are found in a variety of
applications in Malaysia, including education
andresearch,tourism,andruralelectriication.A hybrid PV diesel hybrid system installed at
the Nature Education and Research Centre
(NERC) in Pahang has a total of 112 solar
modules with a total array power of 10 kW, in
addition to the diesel generator that generates
6 kW (Figure 2.6-2). Ground access to NERC
is via a winding dirt road about 2 hours’ drive
fromthenearesttownofKahang,located60km away. The Centre was initially co-funded by
theDanishCooperationforEnvironmentandDevelopment(DANCED)andMalaysianNatureSociety (MNS), and is now managed by the
PerbadananTamanNegaraJohor(PTNJ).The
Figure2.6-2PV-DieselhybridsystemattheNatureandResearchCentre,Endau-RompinNationalPark
The hybrid PV systems installed at the
Middle and Top Stations of Langkawi Cable
Car at Gunung Machinchang (Figure 2.6-
3)istheirstsolarenergyinstallationforatourist complex in the country. The hybrid PV
systems serve the electrical demands of the
ChiefMinisterofJohoroficiallyopenedtheCentre on 24th March 2001.
A diesel-powered generator powers the
NERC administration complex at night. The
estimatedPVarrayconversioneficiencyis13.8%, with a performance ratio of 77%. The
system cost is RM62.57 per Wp installed and
its estimated PV energy generation cost is
RM 3.15 per kWh. The maintenance of the
system is relatively low except for the diesel
generator, which experiences breakdowns
andrequiresbatteryreplacementeveryiveyears. The system is estimated to provide a
net abatement of 225 tonnes of CO2 emissions
during its lifetime.
cable car stations, which include water pumps,
controllers, air-conditioners and lightings. The
projectisownedbyLangkawiDevelopmentAuthority(LADA)andisoperatedbyPanoramaLangkawi Sdn. Bhd.
The Current Status of Carbon Free Energy Technologies
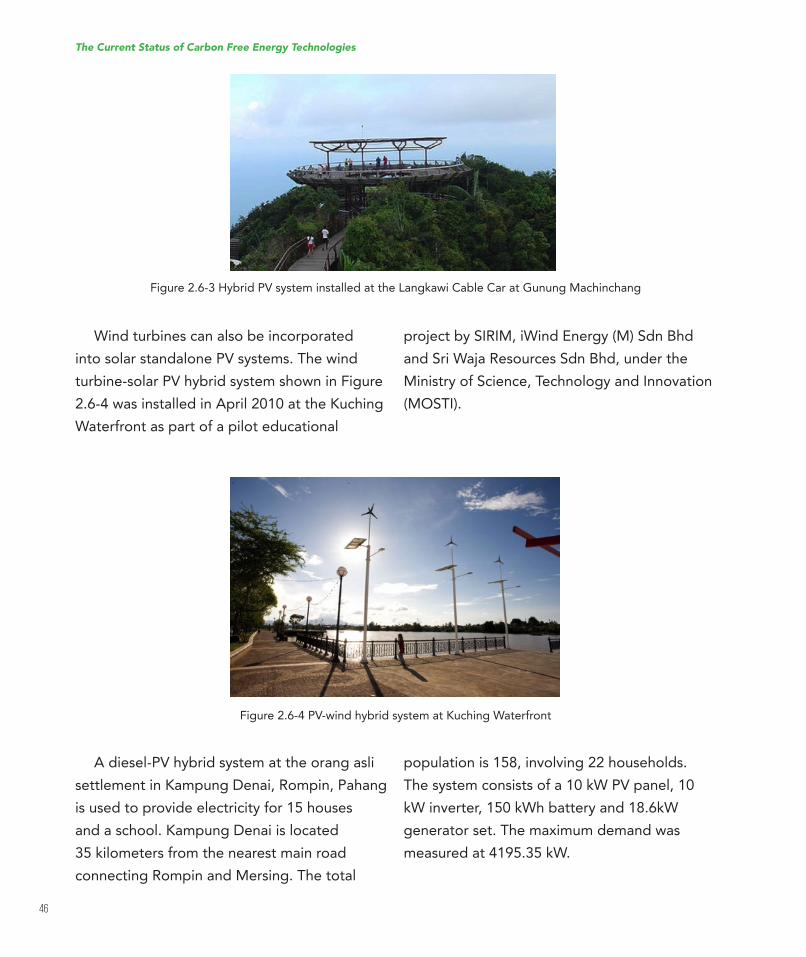
46
Figure 2.6-3 Hybrid PV system installed at the Langkawi Cable Car at Gunung Machinchang
Figure2.6-4PV-windhybridsystematKuchingWaterfront
Wind turbines can also be incorporated
into solar standalone PV systems. The wind
turbine-solar PV hybrid system shown in Figure
2.6-4wasinstalledinApril2010attheKuchingWaterfront as part of a pilot educational
A diesel-PV hybrid system at the orang asli
settlementinKampungDenai,Rompin,Pahangis used to provide electricity for 15 houses
andaschool.KampungDenaiislocated35 kilometers from the nearest main road
connecting Rompin and Mersing. The total
project by SIRIM, iWind Energy (M) Sdn Bhd
and Sri Waja Resources Sdn Bhd, under the
Ministry of Science, Technology and Innovation
(MOSTI).
population is 158, involving 22 households.
The system consists of a 10 kW PV panel, 10
kW inverter, 150 kWh battery and 18.6kW
generator set. The maximum demand was
measured at 4195.35 kW.
The Current Status of Carbon Free Energy Technologies
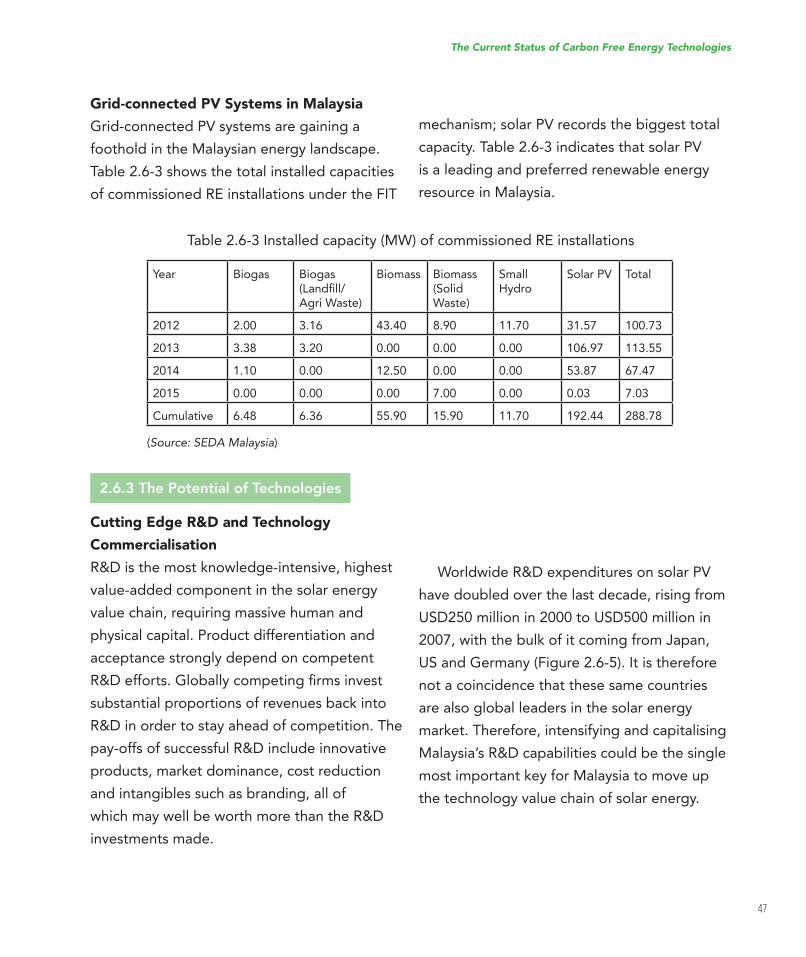
47
(Source: SEDA Malaysia)
Grid-connected PV Systems in Malaysia
Grid-connected PV systems are gaining a
foothold in the Malaysian energy landscape.
Table 2.6-3 shows the total installed capacities
of commissioned RE installations under the FIT
Year Biogas Biogas(Landill/Agri Waste)
Biomass Biomass (Solid Waste)
Small Hydro
Solar PV Total
2012 2.00 3.16 43.40 8.90 11.70 31.57 100.73
2013 3.38 3.20 0.00 0.00 0.00 106.97 113.55
2014 1.10 0.00 12.50 0.00 0.00 53.87 67.47
2015 0.00 0.00 0.00 7.00 0.00 0.03 7.03
Cumulative 6.48 6.36 55.90 15.90 11.70 192.44 288.78
2.6.3 The Potential of Technologies
Cutting Edge R&D and Technology
Commercialisation
R&Disthemostknowledge-intensive,highestvalue-added component in the solar energy
value chain, requiring massive human and
physical capital. Product differentiation and
acceptance strongly depend on competent
R&Defforts.Globallycompetingirmsinvestsubstantial proportions of revenues back into
R&Dinordertostayaheadofcompetition.Thepay-offsofsuccessfulR&Dincludeinnovativeproducts, market dominance, cost reduction
and intangibles such as branding, all of
whichmaywellbeworthmorethantheR&Dinvestments made.
mechanism; solar PV records the biggest total
capacity. Table 2.6-3 indicates that solar PV
is a leading and preferred renewable energy
resource in Malaysia.
Table 2.6-3 Installed capacity (MW) of commissioned RE installations
WorldwideR&DexpendituresonsolarPVhave doubled over the last decade, rising from
USD250millionin2000toUSD500millionin2007,withthebulkofitcomingfromJapan,US and Germany (Figure 2.6-5). It is therefore
not a coincidence that these same countries
are also global leaders in the solar energy
market. Therefore, intensifying and capitalising
Malaysia’sR&Dcapabilitiescouldbethesinglemost important key for Malaysia to move up
the technology value chain of solar energy.
The Current Status of Carbon Free Energy Technologies
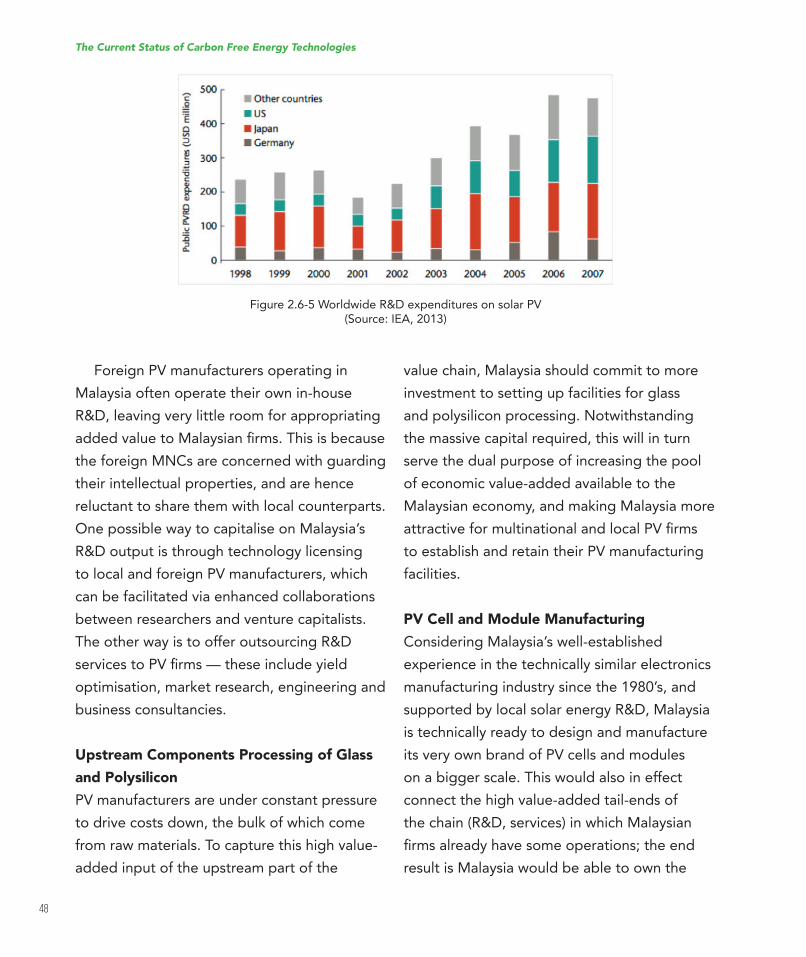
48
Figure2.6-5WorldwideR&DexpendituresonsolarPV(Source: IEA, 2013)
Foreign PV manufacturers operating in
Malaysia often operate their own in-house
R&D,leavingverylittleroomforappropriatingaddedvaluetoMalaysianirms.Thisisbecausethe foreign MNCs are concerned with guarding
their intellectual properties, and are hence
reluctant to share them with local counterparts.
One possible way to capitalise on Malaysia’s
R&Doutputisthroughtechnologylicensingto local and foreign PV manufacturers, which
can be facilitated via enhanced collaborations
between researchers and venture capitalists.
TheotherwayistoofferoutsourcingR&DservicestoPVirms—theseincludeyieldoptimisation, market research, engineering and
business consultancies.
Upstream Components Processing of Glass
and Polysilicon
PV manufacturers are under constant pressure
to drive costs down, the bulk of which come
from raw materials. To capture this high value-
added input of the upstream part of the
value chain, Malaysia should commit to more
investment to setting up facilities for glass
and polysilicon processing. Notwithstanding
the massive capital required, this will in turn
serve the dual purpose of increasing the pool
of economic value-added available to the
Malaysian economy, and making Malaysia more
attractiveformultinationalandlocalPVirmsto establish and retain their PV manufacturing
facilities.
PV Cell and Module Manufacturing
Considering Malaysia’s well-established
experience in the technically similar electronics
manufacturing industry since the 1980’s, and
supportedbylocalsolarenergyR&D,Malaysiais technically ready to design and manufacture
its very own brand of PV cells and modules
on a bigger scale. This would also in effect
connect the high value-added tail-ends of
thechain(R&D,services)inwhichMalaysianirmsalreadyhavesomeoperations;theendresult is Malaysia would be able to own the
The Current Status of Carbon Free Energy Technologies
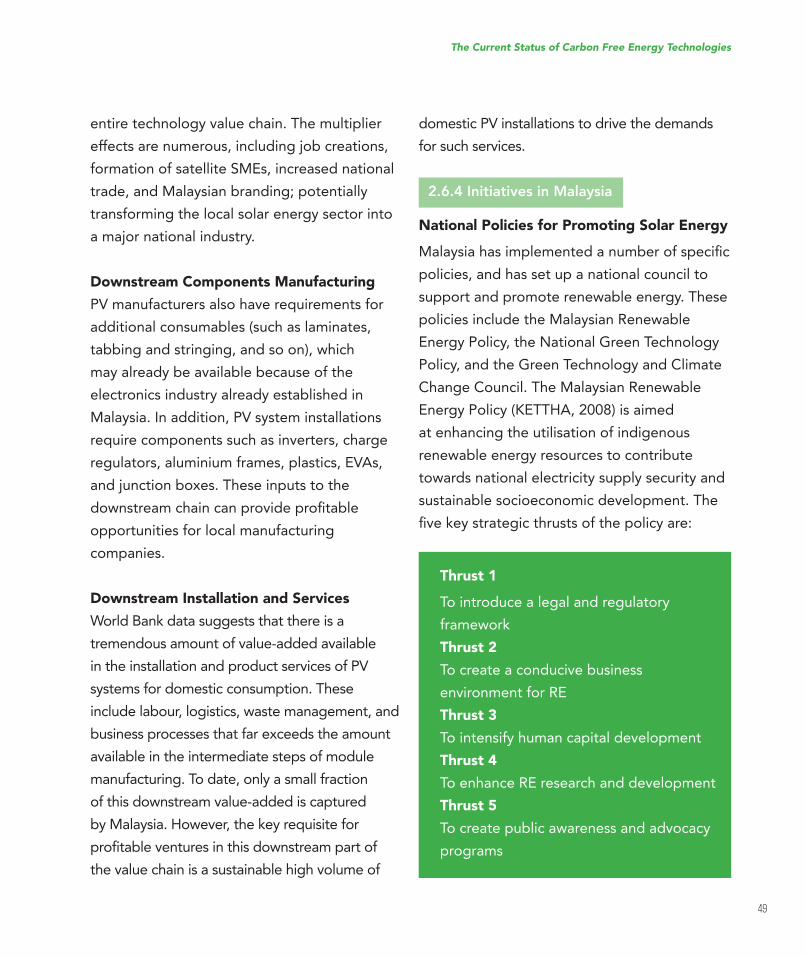
49
entire technology value chain. The multiplier
effects are numerous, including job creations,
formation of satellite SMEs, increased national
trade, and Malaysian branding; potentially
transforming the local solar energy sector into
a major national industry.
Downstream Components Manufacturing
PV manufacturers also have requirements for
additional consumables (such as laminates,
tabbing and stringing, and so on), which
may already be available because of the
electronics industry already established in
Malaysia. In addition, PV system installations
require components such as inverters, charge
regulators, aluminium frames, plastics, EVAs,
and junction boxes. These inputs to the
downstreamchaincanprovideproitableopportunities for local manufacturing
companies.
Downstream Installation and Services
World Bank data suggests that there is a
tremendous amount of value-added available
in the installation and product services of PV
systems for domestic consumption. These
include labour, logistics, waste management, and
business processes that far exceeds the amount
available in the intermediate steps of module
manufacturing. To date, only a small fraction
of this downstream value-added is captured
by Malaysia. However, the key requisite for
proitableventuresinthisdownstreampartofthe value chain is a sustainable high volume of
domestic PV installations to drive the demands
for such services.
2.6.4 Initiatives in Malaysia
National Policies for Promoting Solar Energy
Malaysiahasimplementedanumberofspeciicpolicies, and has set up a national council to
support and promote renewable energy. These
policies include the Malaysian Renewable
Energy Policy, the National Green Technology
Policy, and the Green Technology and Climate
Change Council. The Malaysian Renewable
EnergyPolicy(KETTHA,2008)isaimedat enhancing the utilisation of indigenous
renewable energy resources to contribute
towards national electricity supply security and
sustainable socioeconomic development. The
ivekeystrategicthrustsofthepolicyare:
Thrust 1
To introduce a legal and regulatory
framework
Thrust 2
To create a conducive business
environment for RE
Thrust 3
To intensify human capital development
Thrust 4
To enhance RE research and development
Thrust 5
To create public awareness and advocacy
programs
The Current Status of Carbon Free Energy Technologies
50
Thepolicyhasthefollowingivespeciicobjectives:
1. To increase RE contribution in the national
power generation mix in order to reduce
dependency on fossil fuel, contributing
towards energy security;
2. To promote the growth of the RE industry
and increase its contribution towards the
national economy – creating a new industry
which will provide new job opportunities;
3. To enhance competitiveness of RE against
conventional energy – this will happen when
RE electricity achieves grid parity where the
cost of RE power is equivalent to the cost
of generating electricity using conventional
sources;
4. To conserve the environment for future
generation by reducing GHG emission from
fossil fuel such as gas and coal; and
5. To enhance awareness on the role and
importance of RE by getting the buy-ins
from the public and decision makers to opt
for green energy.
The National Green Technology Policy
(KeTTHA2009)embodieselementsofeconomic, environment and social policies, as
relectedintheiveobjectivesasfollows:1. To minimise growth of energy consumption
while enhancing economic development;
2. To facilitate the growth of the Green
Technology industry and enhance its
contribution to the national economy;
3. To increase national capability and capacity
for innovation in Green Technology
development and enhance Malaysia’s
competitiveness in Green Technology in the
global arena;
4. To ensure sustainable development and
conserve the environment for future
generations; and
5. To enhance public education and awareness
on Green Technology and encourage its
widespread use.
The national goals of the Green Technology
Policy are to provide direction and motivation
for Malaysians to continuously enjoy good
quality living and a healthy environment. The
short-term goals, related to renewable energy,
of the 10th Malaysia Plan are:
1. To increase public awareness and
commitment for the adoption and
application of Green Technology through
advocacy programs;
2. Widespread availability and recognition of
Green Technology in terms of products,
appliances, equipment and systems in the
local market through standards, rating and
labelling programs; Increased foreign and
domesticdirectinvestments(FDIsandDDIs)in Green Technology manufacturing and
services sectors; and
3. Expansion of local research institutes and
institutions of higher learning to expand
Research,DevelopmentandInnovationactivities on Green Technology towards
commercialisation through appropriate
mechanisms.
The Current Status of Carbon Free Energy Technologies
51
Climate change is an issue that is high on the
agenda of the Malaysian government. A Green
Technology and Climate Change Council
chaired by the Prime Minister has been tasked
to formulate policies and measures on climate
change. The implementation of the Climate
Change Policy is aimed at driving efforts to
reduce emissions and contribute to the larger
agenda of resolving the issue of climate
change.
Development of Standards
Standards that are generally applied for PV
panels include IEC 61215 (crystalline silicon
performance),61646(thin-ilmperformance)and 61730 (all modules, safety), ISO 9488,
UL 1703, CE mark, and Electrical Safety
Tester (EST) Series (EST-460, EST-22V, EST-
22H, EST-110). There are no local testing and
standardisation facilities available in Malaysia.
However,certiicationcanbeconductedatrecognised standardisation centres in Germany,
United States and Taiwan.
Module performance is generally rated
under Standard Test Conditions (STC):
irradianceof1,000W/m²,solarspectrumofAM 1.5 and module temperature at 25°C.
Electrical characteristics include nominal power
(PMAX, measured in W), open circuit voltage
(VOC), short circuit current (ISC, measured in
amperes), maximum power voltage (VMPP),
maximum power current (IMPP), and module
eficiency(%).Solarmodulesarealsoratedin “kWp”, where “kW” is kilowatt and “p” is
“peak”. The “p” however does not indicate
peak performance, but rather the maximum
output according to Standard Testing
Conditions. Solar panels must withstand
heat, cold, rain and hail for many years. Many
crystalline silicon module manufacturers offer
warranties that guarantee electrical production
for 10 years at 90% of rated power output and
25 years at 80%.
2.7 Wave Energy & Tidal
Current Energy
2.7.1. State of the Art
Wave Energy
With the global attention now being drawn
to climate change and the rising level of
CO2, the focus of research once again shifts
to generating electricity from renewable
sources. The LIMPET shoreline oscillating water
column (OWC), installed at Islay, Scotland, in
2000 represents one system that is currently
producing power for the National Grid. In
September 2008, another commercial wave
power system started operating in Northern
Portugal. It makes use of the Pelamis power-
generating device built by Pelamis Wave
(formerlyOPD)inScotland.
The Current Status of Carbon Free Energy Technologies
52
Using waves as a source of renewable energy
offerssigniicantadvantagesasfollows:• Seawavesofferthehighestenergydensity
among renewable energy sources. Waves
are generated by winds, which in turn are
generated by solar energy. Solar energy
intensityoftypically0.1–0.3kW/m2
horizontal surface is converted to an average
powerlowintensityof2–3kW/m2 of a
vertical plane perpendicular to the direction
of wave propagation just below the water
surface;
• Itisreportedthatwavepowerdevicescangenerate power up to 90% of the time,
compared to approximately 20–30% for
wind and solar power devices.
• Thereisalargenumberofconceptsforwave energy conversion (WEC); over 1000
wave energy conversion techniques have
beenpatentedinJapan,NorthAmerica,andEurope.Despitethislargevariationindesign, WECs are generally categorised by
location and type.
Figure 2.7-1 shows the wave structure
produced by wind. Wave energy occurs in
the movements of water near the sea surface.
Up to 95% of the energy in a wave is located
between the water surface and one-quarter of
a wavelength below it. The potential energy
of a set of waves is proportional to the square
of wave height multiplied by squared times
wave period (the time between wave crests).
Longer period waves have relatively longer
wavelengths and move faster. The potential
energy is equal to the kinetic energy (that can
be expended). Wave power is expressed in
kilowatts per meter (at a location such as a
shoreline).
The formula below (Eq 2.7-1) shows how
wave power can be calculated. Excluding
waves created by major storms, the largest
waves are about 15 meters high and have a
period of about 15 seconds. According to
the formula, such waves carry about 1700
kilowatts of potential power across each meter
of wavefront. A good wave power location
willhaveanaverageluxmuchlessthanthis:perhapsabout50kw/m.
Formula:Power(inkw/m)=kH2 T ~ 0.5 H2 T,
Eq. (2.7-1)
where k = constant, H = wave height (crest to
trough) in meters, and T = wave period (crest
to crest) in seconds.
The Current Status of Carbon Free Energy Technologies
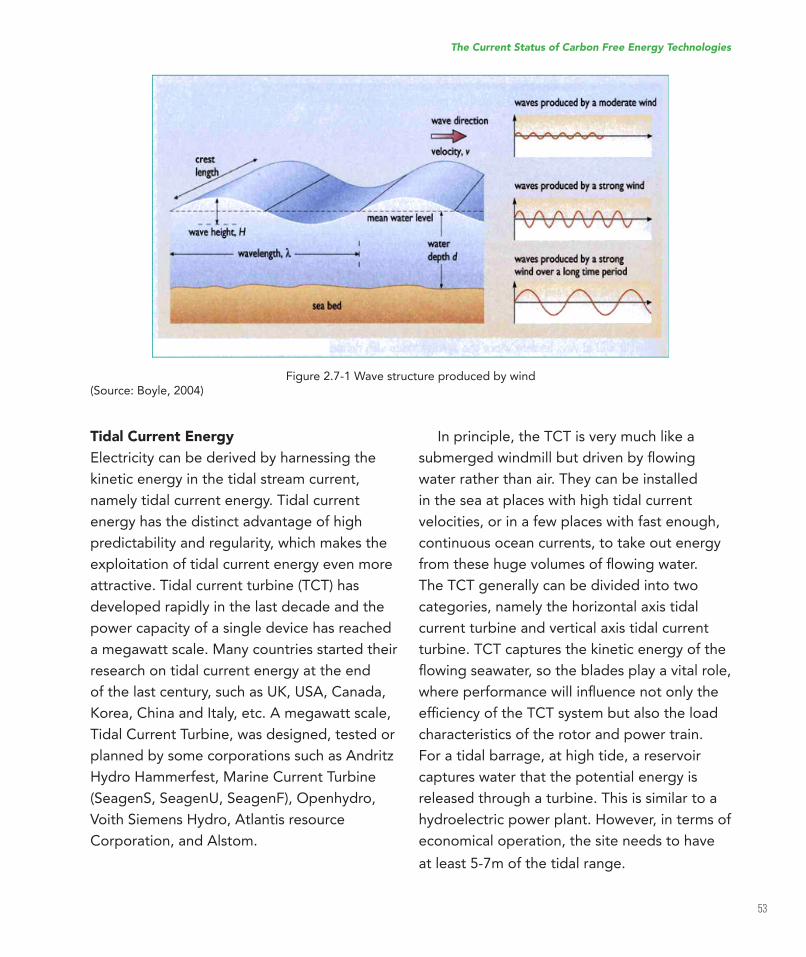
53
Figure 2.7-1 Wave structure produced by wind(Source: Boyle, 2004)
Tidal Current Energy
Electricity can be derived by harnessing the
kinetic energy in the tidal stream current,
namely tidal current energy. Tidal current
energy has the distinct advantage of high
predictability and regularity, which makes the
exploitation of tidal current energy even more
attractive. Tidal current turbine (TCT) has
developed rapidly in the last decade and the
power capacity of a single device has reached
a megawatt scale. Many countries started their
research on tidal current energy at the end
ofthelastcentury,suchasUK,USA,Canada,Korea,ChinaandItaly,etc.Amegawattscale,Tidal Current Turbine, was designed, tested or
planned by some corporations such as Andritz
Hydro Hammerfest, Marine Current Turbine
(SeagenS, SeagenU, SeagenF), Openhydro,
Voith Siemens Hydro, Atlantis resource
Corporation, and Alstom.
In principle, the TCT is very much like a
submergedwindmillbutdrivenbylowingwater rather than air. They can be installed
in the sea at places with high tidal current
velocities, or in a few places with fast enough,
continuous ocean currents, to take out energy
fromthesehugevolumesoflowingwater.The TCT generally can be divided into two
categories, namely the horizontal axis tidal
current turbine and vertical axis tidal current
turbine. TCT captures the kinetic energy of the
lowingseawater,sothebladesplayavitalrole,whereperformancewillinluencenotonlytheeficiencyoftheTCTsystembutalsotheloadcharacteristics of the rotor and power train.
For a tidal barrage, at high tide, a reservoir
captures water that the potential energy is
released through a turbine. This is similar to a
hydroelectric power plant. However, in terms of
economical operation, the site needs to have
at least 5-7m of the tidal range.
The Current Status of Carbon Free Energy Technologies
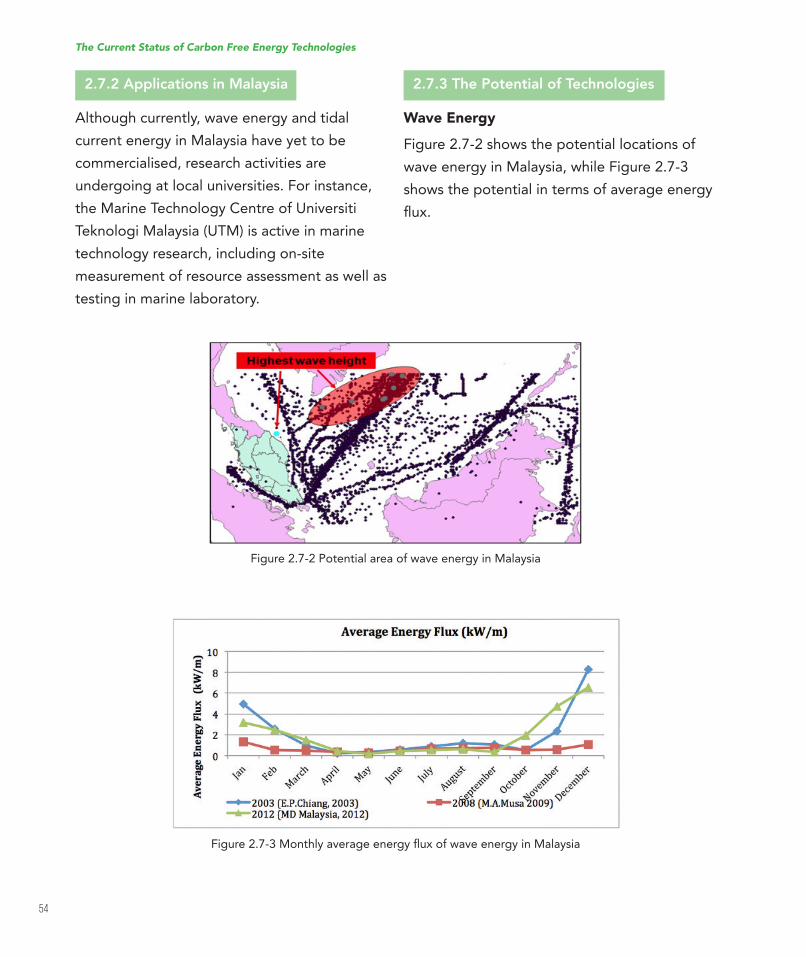
54
2.7.2 Applications in Malaysia
Although currently, wave energy and tidal
current energy in Malaysia have yet to be
commercialised, research activities are
undergoing at local universities. For instance,
the Marine Technology Centre of Universiti
Teknologi Malaysia (UTM) is active in marine
technology research, including on-site
measurement of resource assessment as well as
testing in marine laboratory.
Figure 2.7-2 Potential area of wave energy in Malaysia
Figure2.7-3MonthlyaverageenergyluxofwaveenergyinMalaysia
2.7.3 The Potential of Technologies
Wave Energy
Figure 2.7-2 shows the potential locations of
wave energy in Malaysia, while Figure 2.7-3
shows the potential in terms of average energy
lux.
The Current Status of Carbon Free Energy Technologies
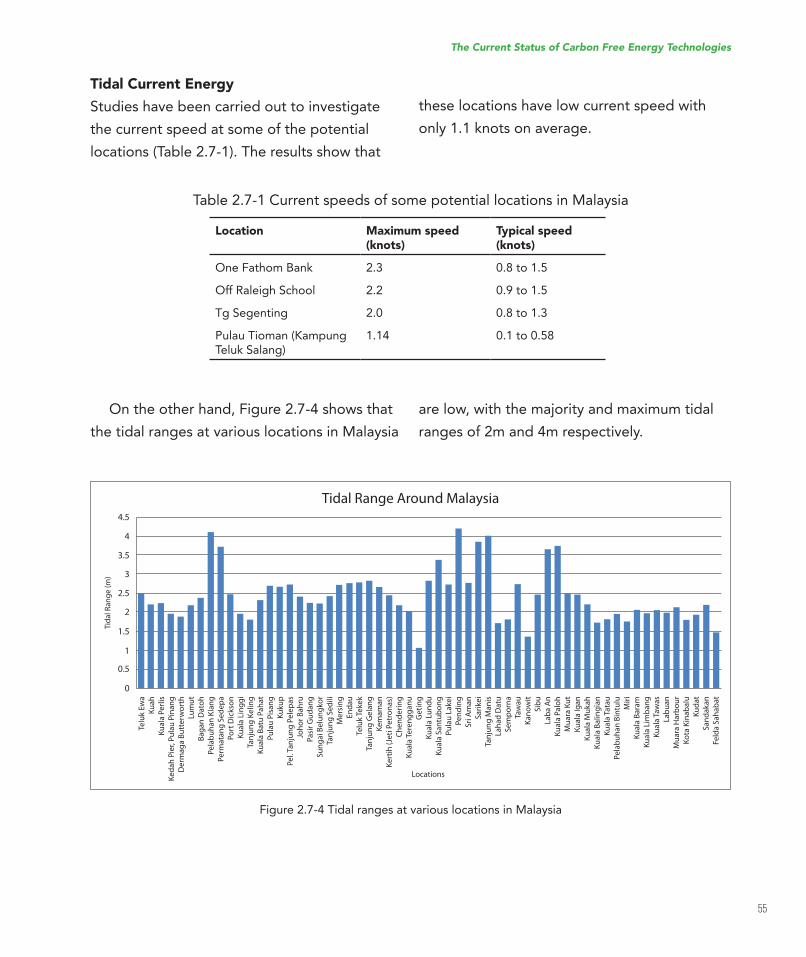
55
Figure 2.7-4 Tidal ranges at various locations in Malaysia
Tidal Current Energy
Studies have been carried out to investigate
the current speed at some of the potential
locations (Table 2.7-1). The results show that
Location Maximum speed (knots)
Typical speed (knots)
One Fathom Bank 2.3 0.8 to 1.5
Off Raleigh School 2.2 0.9 to 1.5
Tg Segenting 2.0 0.8 to 1.3
PulauTioman(KampungTeluk Salang)
1.14 0.1 to 0.58
On the other hand, Figure 2.7-4 shows that
the tidal ranges at various locations in Malaysia
Table 2.7-1 Current speeds of some potential locations in Malaysia
these locations have low current speed with
only 1.1 knots on average.
are low, with the majority and maximum tidal
ranges of 2m and 4m respectively.
The Current Status of Carbon Free Energy Technologies
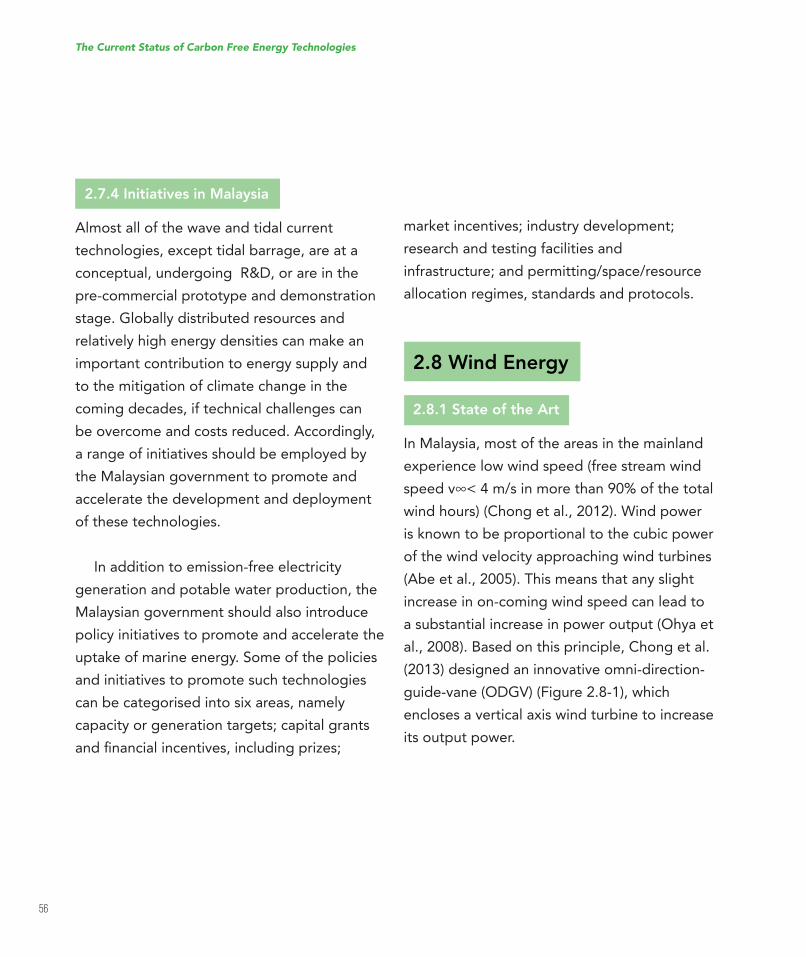
56
2.7.4 Initiatives in Malaysia
Almost all of the wave and tidal current
technologies, except tidal barrage, are at a
conceptual,undergoingR&D,orareinthepre-commercial prototype and demonstration
stage. Globally distributed resources and
relatively high energy densities can make an
important contribution to energy supply and
to the mitigation of climate change in the
coming decades, if technical challenges can
be overcome and costs reduced. Accordingly,
a range of initiatives should be employed by
the Malaysian government to promote and
accelerate the development and deployment
of these technologies.
In addition to emission-free electricity
generation and potable water production, the
Malaysian government should also introduce
policy initiatives to promote and accelerate the
uptake of marine energy. Some of the policies
and initiatives to promote such technologies
can be categorised into six areas, namely
capacity or generation targets; capital grants
andinancialincentives,includingprizes;
market incentives; industry development;
research and testing facilities and
infrastructure;andpermitting/space/resourceallocation regimes, standards and protocols.
2.8 Wind Energy
2.8.1 State of the Art
In Malaysia, most of the areas in the mainland
experience low wind speed (free stream wind
speedv∞<4m/sinmorethan90%ofthetotalwind hours) (Chong et al., 2012). Wind power
is known to be proportional to the cubic power
of the wind velocity approaching wind turbines
(Abe et al., 2005). This means that any slight
increase in on-coming wind speed can lead to
a substantial increase in power output (Ohya et
al., 2008). Based on this principle, Chong et al.
(2013) designed an innovative omni-direction-
guide-vane(ODGV)(Figure2.8-1),whichencloses a vertical axis wind turbine to increase
its output power.
The Current Status of Carbon Free Energy Technologies
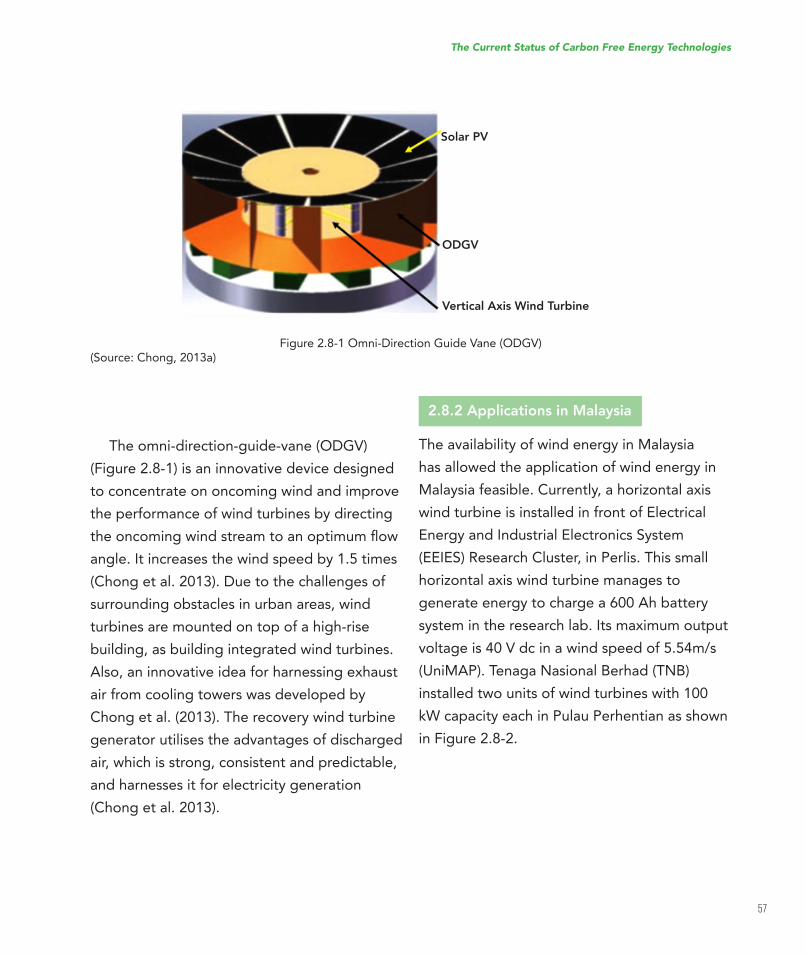
57
Figure2.8-1Omni-DirectionGuideVane(ODGV)(Source: Chong, 2013a)
Theomni-direction-guide-vane(ODGV)(Figure 2.8-1) is an innovative device designed
to concentrate on oncoming wind and improve
the performance of wind turbines by directing
theoncomingwindstreamtoanoptimumlowangle. It increases the wind speed by 1.5 times
(Chongetal.2013).Duetothechallengesofsurrounding obstacles in urban areas, wind
turbines are mounted on top of a high-rise
building, as building integrated wind turbines.
Also, an innovative idea for harnessing exhaust
air from cooling towers was developed by
Chong et al. (2013). The recovery wind turbine
generator utilises the advantages of discharged
air, which is strong, consistent and predictable,
and harnesses it for electricity generation
(Chong et al. 2013).
2.8.2 Applications in Malaysia
The availability of wind energy in Malaysia
has allowed the application of wind energy in
Malaysia feasible. Currently, a horizontal axis
wind turbine is installed in front of Electrical
Energy and Industrial Electronics System
(EEIES) Research Cluster, in Perlis. This small
horizontal axis wind turbine manages to
generate energy to charge a 600 Ah battery
system in the research lab. Its maximum output
voltageis40Vdcinawindspeedof5.54m/s(UniMAP). Tenaga Nasional Berhad (TNB)
installed two units of wind turbines with 100
kW capacity each in Pulau Perhentian as shown
in Figure 2.8-2.
The Current Status of Carbon Free Energy Technologies
Solar PV
ODGV
Vertical Axis Wind Turbine
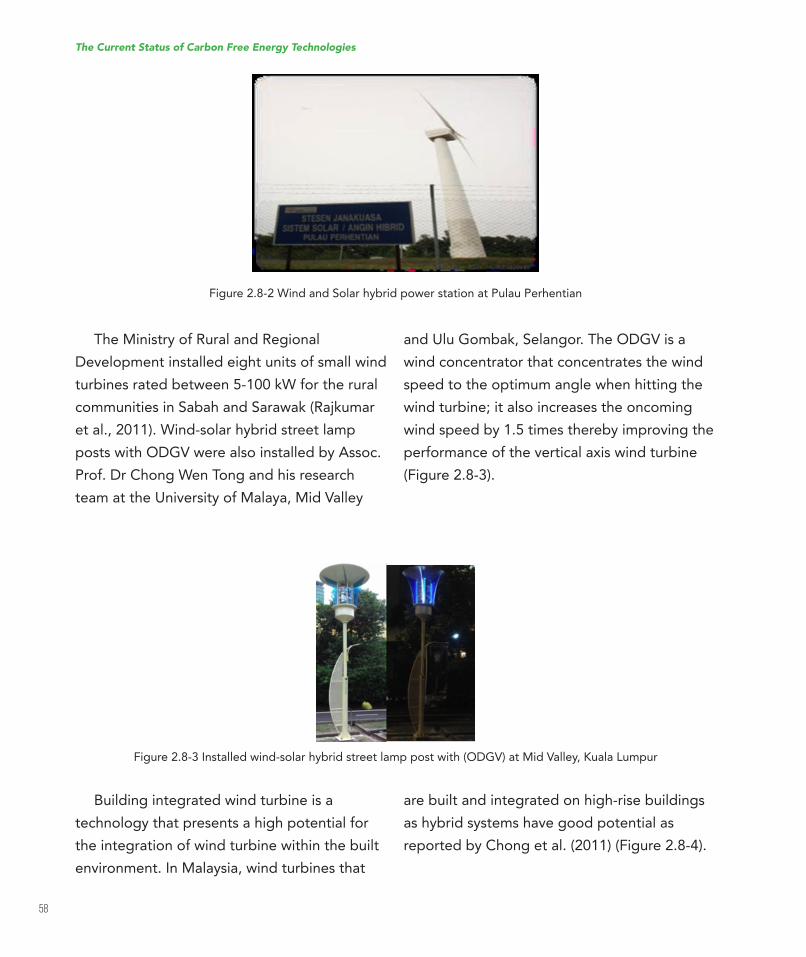
58
Figure 2.8-2 Wind and Solar hybrid power station at Pulau Perhentian
Figure2.8-3Installedwind-solarhybridstreetlamppostwith(ODGV)atMidValley,KualaLumpur
The Ministry of Rural and Regional
Developmentinstalledeightunitsofsmallwindturbines rated between 5-100 kW for the rural
communities in Sabah and Sarawak (Rajkumar
et al., 2011). Wind-solar hybrid street lamp
postswithODGVwerealsoinstalledbyAssoc.Prof.DrChongWenTongandhisresearchteam at the University of Malaya, Mid Valley
Building integrated wind turbine is a
technology that presents a high potential for
the integration of wind turbine within the built
environment. In Malaysia, wind turbines that
andUluGombak,Selangor.TheODGVisawind concentrator that concentrates the wind
speed to the optimum angle when hitting the
wind turbine; it also increases the oncoming
wind speed by 1.5 times thereby improving the
performance of the vertical axis wind turbine
(Figure 2.8-3).
are built and integrated on high-rise buildings
as hybrid systems have good potential as
reported by Chong et al. (2011) (Figure 2.8-4).
The Current Status of Carbon Free Energy Technologies
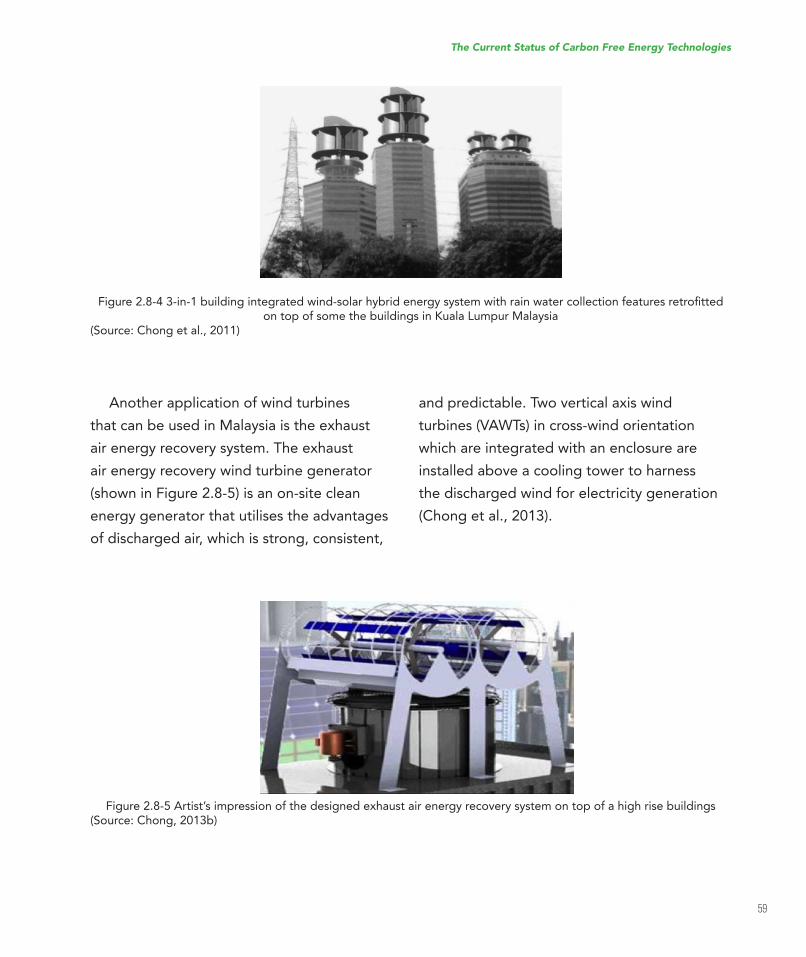
59
Figure2.8-43-in-1buildingintegratedwind-solarhybridenergysystemwithrainwatercollectionfeaturesretroittedontopofsomethebuildingsinKualaLumpurMalaysia
(Source: Chong et al., 2011)
Figure 2.8-5 Artist’s impression of the designed exhaust air energy recovery system on top of a high rise buildings (Source: Chong, 2013b)
Another application of wind turbines
that can be used in Malaysia is the exhaust
air energy recovery system. The exhaust
air energy recovery wind turbine generator
(shown in Figure 2.8-5) is an on-site clean
energy generator that utilises the advantages
of discharged air, which is strong, consistent,
and predictable. Two vertical axis wind
turbines (VAWTs) in cross-wind orientation
which are integrated with an enclosure are
installed above a cooling tower to harness
the discharged wind for electricity generation
(Chong et al., 2013).
The Current Status of Carbon Free Energy Technologies
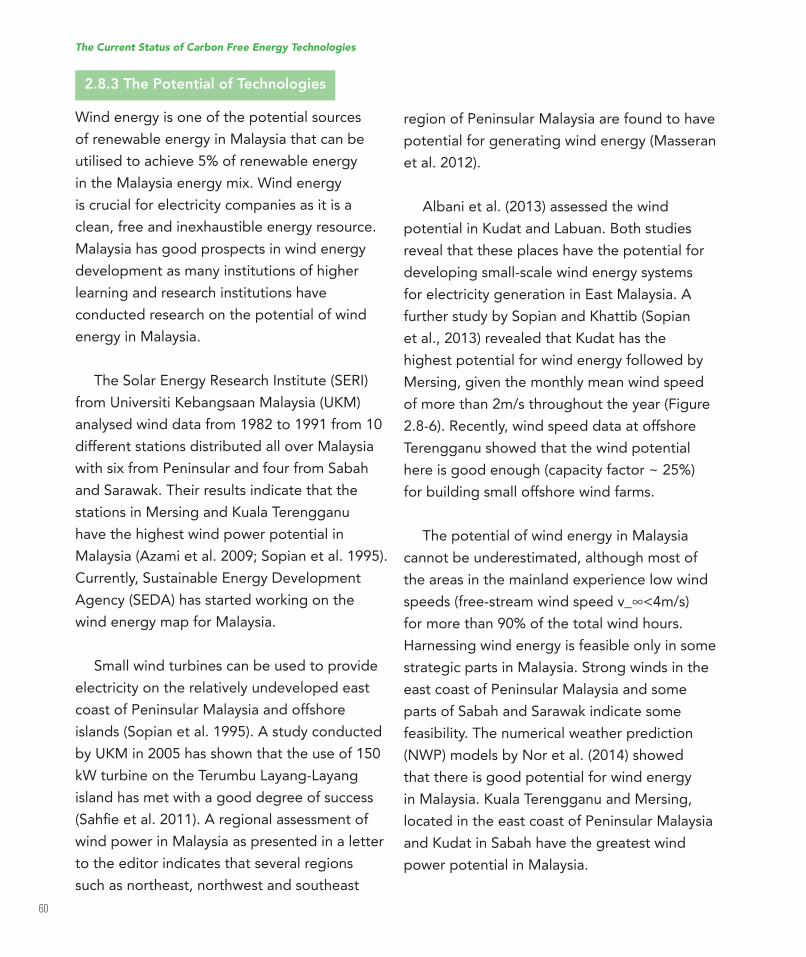
60
2.8.3 The Potential of Technologies
Wind energy is one of the potential sources
of renewable energy in Malaysia that can be
utilised to achieve 5% of renewable energy
in the Malaysia energy mix. Wind energy
is crucial for electricity companies as it is a
clean, free and inexhaustible energy resource.
Malaysia has good prospects in wind energy
development as many institutions of higher
learning and research institutions have
conducted research on the potential of wind
energy in Malaysia.
The Solar Energy Research Institute (SERI)
fromUniversitiKebangsaanMalaysia(UKM)analysed wind data from 1982 to 1991 from 10
different stations distributed all over Malaysia
with six from Peninsular and four from Sabah
and Sarawak. Their results indicate that the
stationsinMersingandKualaTerengganuhave the highest wind power potential in
Malaysia (Azami et al. 2009; Sopian et al. 1995).
Currently,SustainableEnergyDevelopmentAgency(SEDA)hasstartedworkingonthewind energy map for Malaysia.
Small wind turbines can be used to provide
electricity on the relatively undeveloped east
coast of Peninsular Malaysia and offshore
islands (Sopian et al. 1995). A study conducted
byUKMin2005hasshownthattheuseof150kW turbine on the Terumbu Layang-Layang
island has met with a good degree of success
(Sahieetal.2011).Aregionalassessmentofwind power in Malaysia as presented in a letter
to the editor indicates that several regions
such as northeast, northwest and southeast
region of Peninsular Malaysia are found to have
potential for generating wind energy (Masseran
et al. 2012).
Albani et al. (2013) assessed the wind
potentialinKudatandLabuan.Bothstudiesreveal that these places have the potential for
developing small-scale wind energy systems
for electricity generation in East Malaysia. A
furtherstudybySopianandKhattib(Sopianetal.,2013)revealedthatKudathasthehighest potential for wind energy followed by
Mersing, given the monthly mean wind speed
ofmorethan2m/sthroughouttheyear(Figure2.8-6). Recently, wind speed data at offshore
Terengganu showed that the wind potential
here is good enough (capacity factor ~ 25%)
for building small offshore wind farms.
The potential of wind energy in Malaysia
cannot be underestimated, although most of
the areas in the mainland experience low wind
speeds(free-streamwindspeedv_∞<4m/s)for more than 90% of the total wind hours.
Harnessing wind energy is feasible only in some
strategic parts in Malaysia. Strong winds in the
east coast of Peninsular Malaysia and some
parts of Sabah and Sarawak indicate some
feasibility. The numerical weather prediction
(NWP) models by Nor et al. (2014) showed
that there is good potential for wind energy
inMalaysia.KualaTerengganuandMersing,located in the east coast of Peninsular Malaysia
andKudatinSabahhavethegreatestwindpower potential in Malaysia.
The Current Status of Carbon Free Energy Technologies
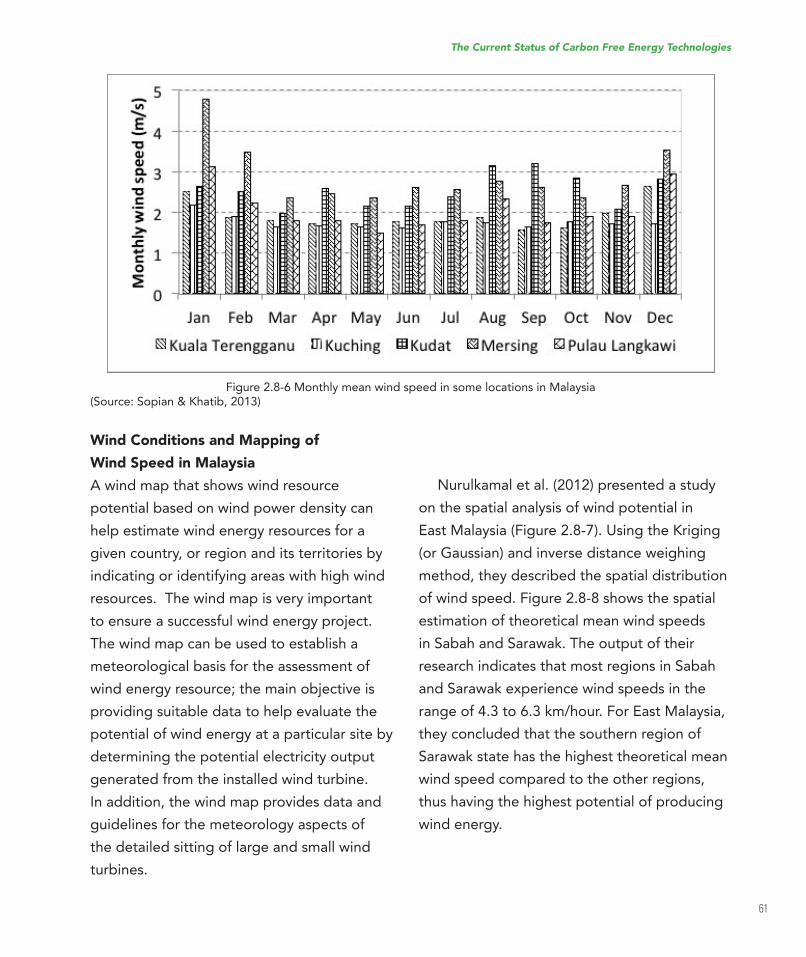
61
Figure 2.8-6 Monthly mean wind speed in some locations in Malaysia (Source:Sopian&Khatib,2013)
Wind Conditions and Mapping of
Wind Speed in Malaysia
A wind map that shows wind resource
potential based on wind power density can
help estimate wind energy resources for a
given country, or region and its territories by
indicating or identifying areas with high wind
resources. The wind map is very important
to ensure a successful wind energy project.
The wind map can be used to establish a
meteorological basis for the assessment of
wind energy resource; the main objective is
providing suitable data to help evaluate the
potential of wind energy at a particular site by
determining the potential electricity output
generated from the installed wind turbine.
In addition, the wind map provides data and
guidelines for the meteorology aspects of
the detailed sitting of large and small wind
turbines.
Nurulkamal et al. (2012) presented a study
on the spatial analysis of wind potential in
EastMalaysia(Figure2.8-7).UsingtheKriging(or Gaussian) and inverse distance weighing
method, they described the spatial distribution
of wind speed. Figure 2.8-8 shows the spatial
estimation of theoretical mean wind speeds
in Sabah and Sarawak. The output of their
research indicates that most regions in Sabah
and Sarawak experience wind speeds in the
rangeof4.3to6.3km/hour.ForEastMalaysia,they concluded that the southern region of
Sarawak state has the highest theoretical mean
wind speed compared to the other regions,
thus having the highest potential of producing
wind energy.
The Current Status of Carbon Free Energy Technologies
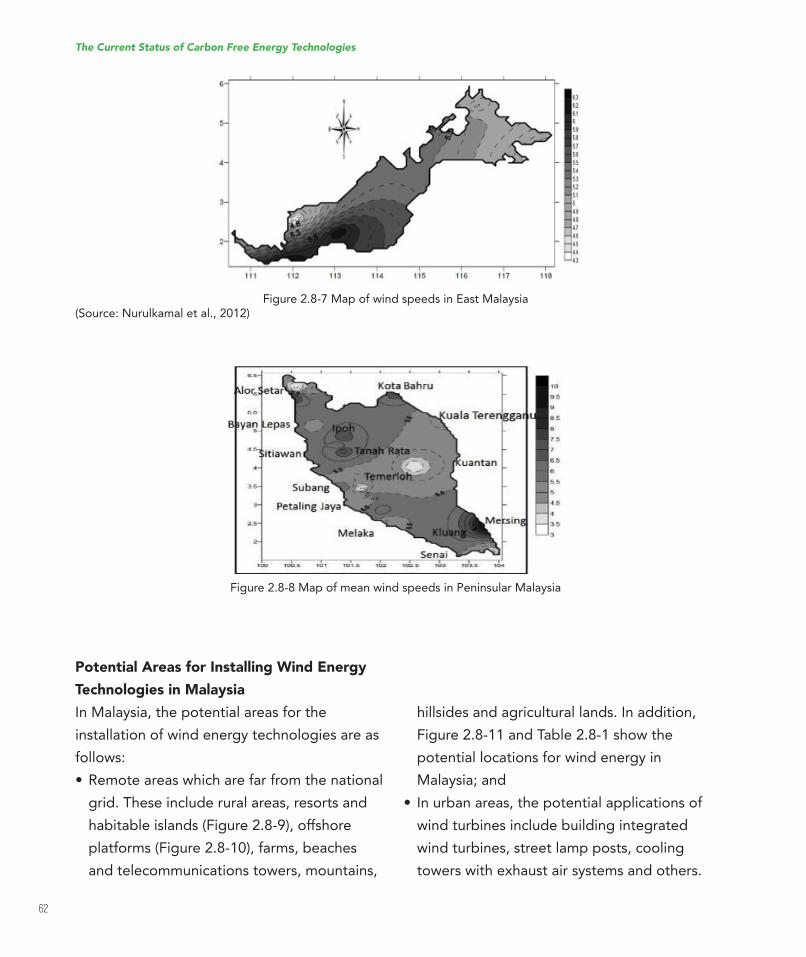
62
Figure 2.8-7 Map of wind speeds in East Malaysia(Source: Nurulkamal et al., 2012)
Figure 2.8-8 Map of mean wind speeds in Peninsular Malaysia
Potential Areas for Installing Wind Energy
Technologies in Malaysia
In Malaysia, the potential areas for the
installation of wind energy technologies are as
follows:
•Remoteareaswhicharefarfromthenationalgrid. These include rural areas, resorts and
habitable islands (Figure 2.8-9), offshore
platforms (Figure 2.8-10), farms, beaches
and telecommunications towers, mountains,
hillsides and agricultural lands. In addition,
Figure 2.8-11 and Table 2.8-1 show the
potential locations for wind energy in
Malaysia; and
• Inurbanareas,thepotentialapplicationsofwind turbines include building integrated
wind turbines, street lamp posts, cooling
towers with exhaust air systems and others.
The Current Status of Carbon Free Energy Technologies
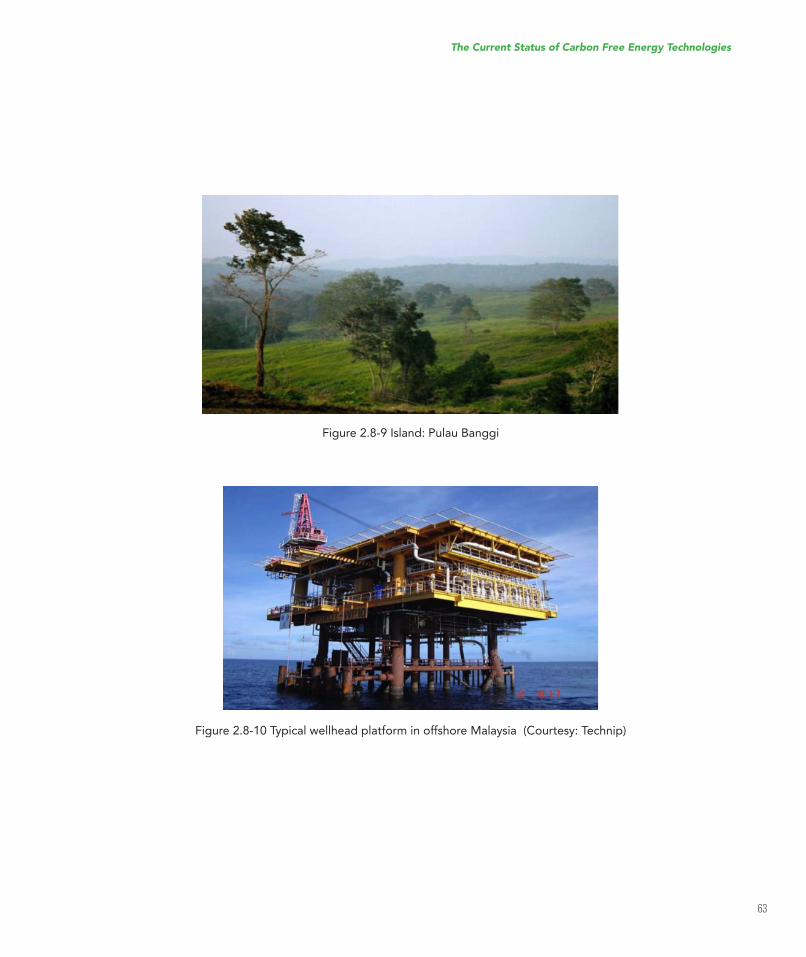
63
Figure 2.8-9 Island: Pulau Banggi
Figure 2.8-10 Typical wellhead platform in offshore Malaysia (Courtesy: Technip)
The Current Status of Carbon Free Energy Technologies
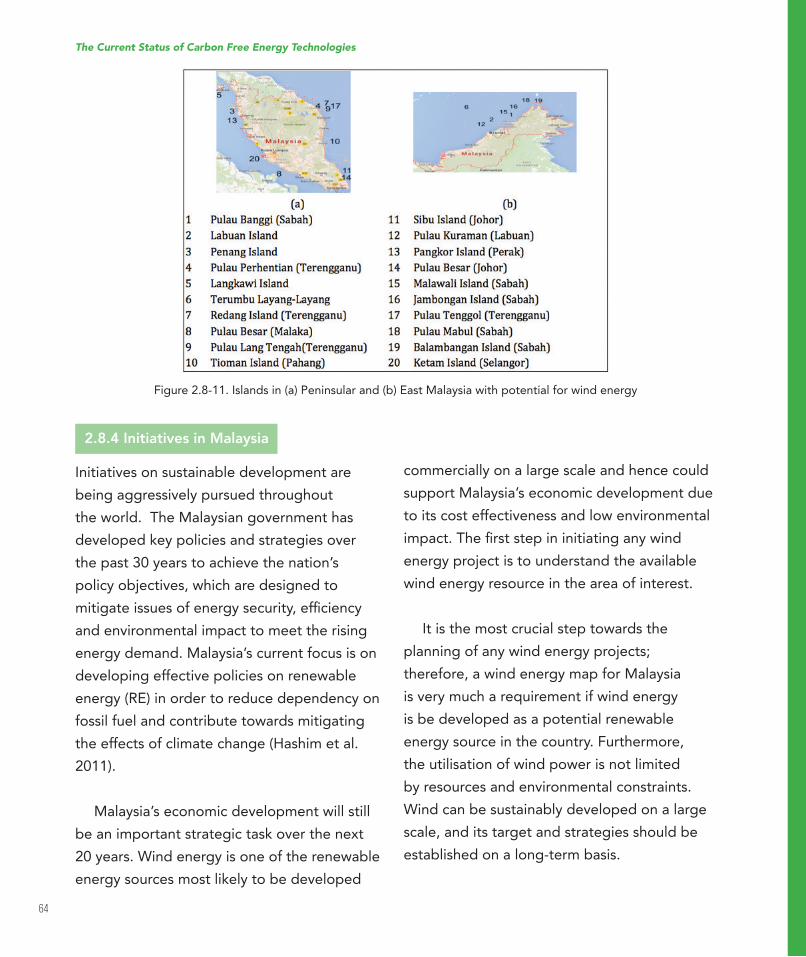
64
Figure 2.8-11. Islands in (a) Peninsular and (b) East Malaysia with potential for wind energy
2.8.4 Initiatives in Malaysia
Initiatives on sustainable development are
being aggressively pursued throughout
the world. The Malaysian government has
developed key policies and strategies over
the past 30 years to achieve the nation’s
policy objectives, which are designed to
mitigateissuesofenergysecurity,eficiencyand environmental impact to meet the rising
energy demand. Malaysia’s current focus is on
developing effective policies on renewable
energy (RE) in order to reduce dependency on
fossil fuel and contribute towards mitigating
the effects of climate change (Hashim et al.
2011).
Malaysia’s economic development will still
be an important strategic task over the next
20 years. Wind energy is one of the renewable
energy sources most likely to be developed
commercially on a large scale and hence could
support Malaysia’s economic development due
to its cost effectiveness and low environmental
impact.Theirststepininitiatinganywindenergy project is to understand the available
wind energy resource in the area of interest.
It is the most crucial step towards the
planning of any wind energy projects;
therefore, a wind energy map for Malaysia
is very much a requirement if wind energy
is be developed as a potential renewable
energy source in the country. Furthermore,
the utilisation of wind power is not limited
by resources and environmental constraints.
Wind can be sustainably developed on a large
scale, and its target and strategies should be
established on a long-term basis.
The Current Status of Carbon Free Energy Technologies
65
Chapter 3
Carbon Free Energy Roadmap
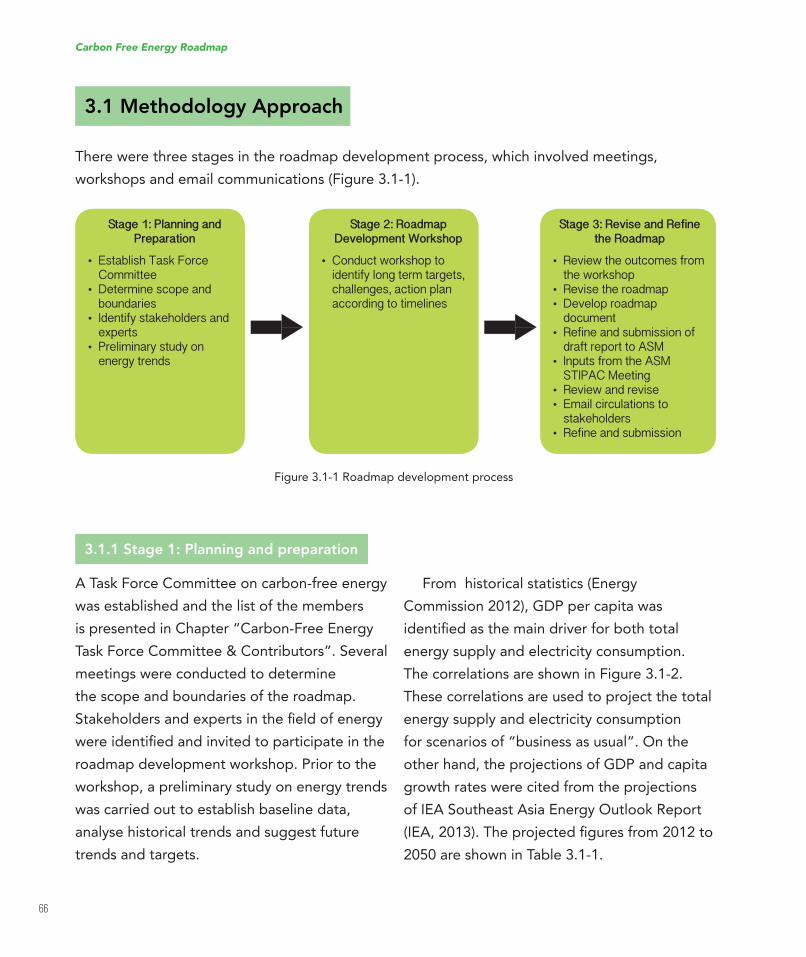
66
3.1 Methodology Approach
Carbon Free Energy Roadmap
3.1.1 Stage 1: Planning and preparation
A Task Force Committee on carbon-free energy
was established and the list of the members
is presented in Chapter “Carbon-Free Energy
Task Force Committee & Contributors”. Several
meetings were conducted to determine
the scope and boundaries of the roadmap.
Stakeholdersandexpertsintheieldofenergywereidentiiedandinvitedtoparticipateintheroadmap development workshop. Prior to the
workshop, a preliminary study on energy trends
was carried out to establish baseline data,
analyse historical trends and suggest future
trends and targets.
From historical statistics (Energy
Commission2012),GDPpercapitawasidentiiedasthemaindriverforbothtotalenergy supply and electricity consumption.
The correlations are shown in Figure 3.1-2.
These correlations are used to project the total
energy supply and electricity consumption
for scenarios of “business as usual”. On the
otherhand,theprojectionsofGDPandcapitagrowth rates were cited from the projections
of IEA Southeast Asia Energy Outlook Report
(IEA,2013).Theprojectediguresfrom2012to2050 are shown in Table 3.1-1.
Stage 1: Planning and Preparation
• Establish Task Force Committee
• Determine scope and boundaries
• Identify stakeholders and experts
• Preliminary study on energy trends
Stage 2: Roadmap Development Workshop
• Conduct workshop to identify long term targets, challenges, action plan according to timelines
Stage 3: Revise and Refine the Roadmap
• Review the outcomes from the workshop
• Revise the roadmap• Develop roadmap
document• Refine and submission of
draft report to ASM• Inputs from the ASM
STIPAC Meeting• Review and revise• Email circulations to
stakeholders• Refine and submission
Figure 3.1-1 Roadmap development process
There were three stages in the roadmap development process, which involved meetings,
workshops and email communications (Figure 3.1-1).
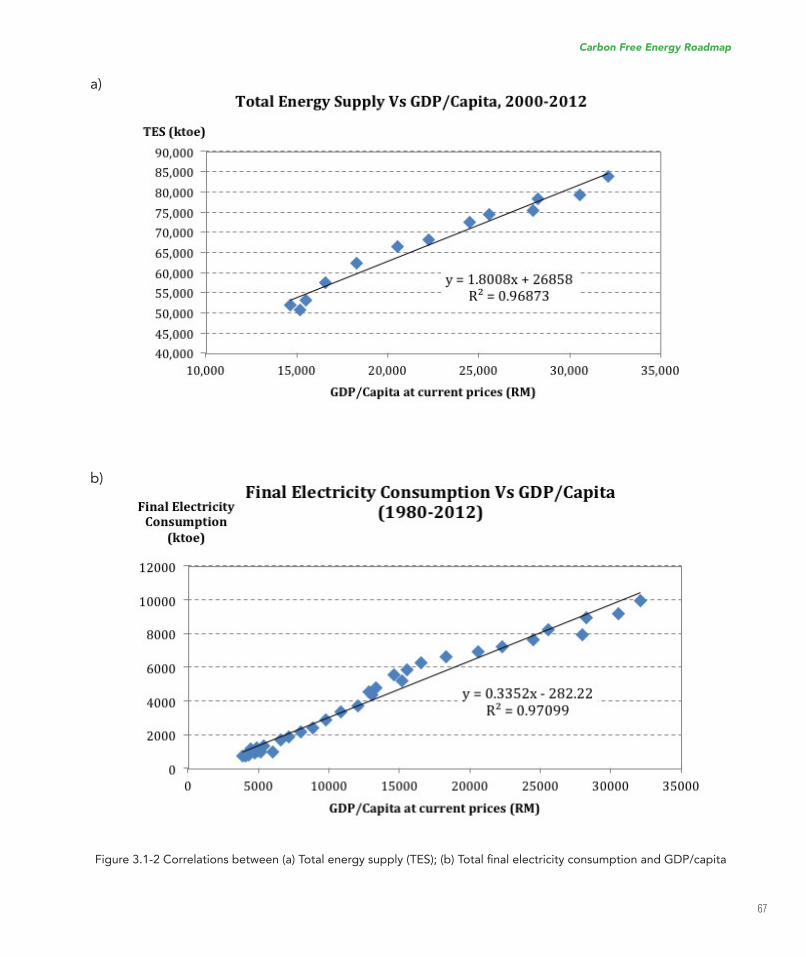
67
Figure3.1-2Correlationsbetween(a)Totalenergysupply(TES);(b)TotalinalelectricityconsumptionandGDP/capita
a)
b)
Carbon Free Energy Roadmap
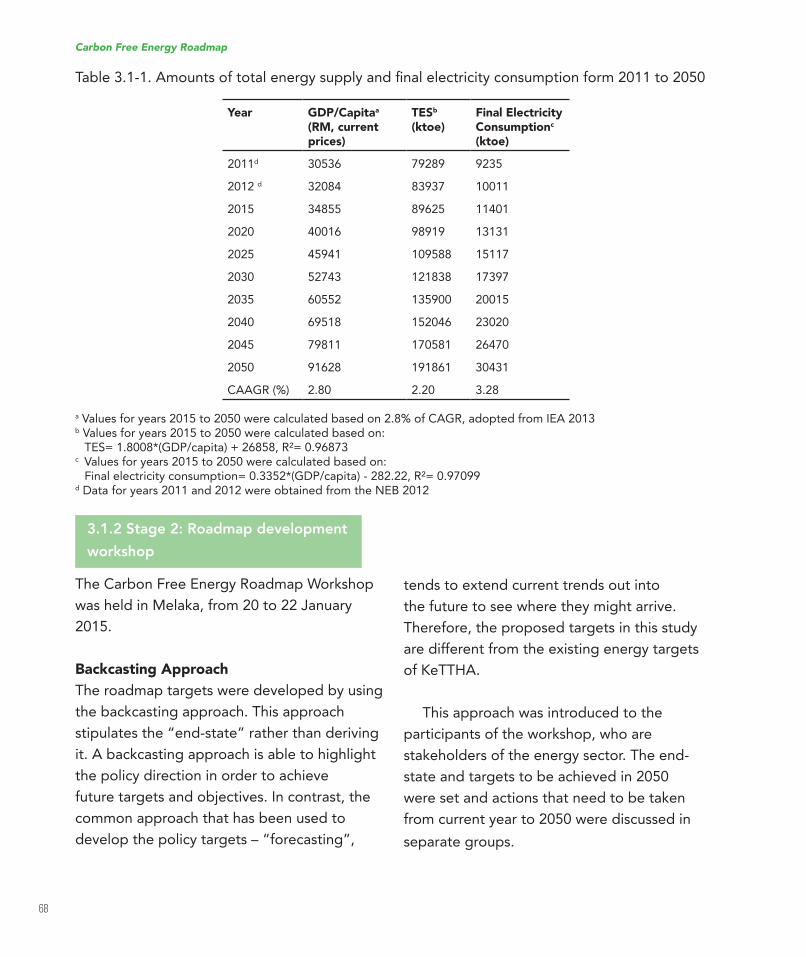
68
Table3.1-1.Amountsoftotalenergysupplyandinalelectricityconsumptionform2011to2050
Year GDP/Capitaa (RM, current prices)
TESb (ktoe)
Final Electricity Consumptionc (ktoe)
2011d 30536 79289 9235
2012 d 32084 83937 10011
2015 34855 89625 11401
2020 40016 98919 13131
2025 45941 109588 15117
2030 52743 121838 17397
2035 60552 135900 20015
2040 69518 152046 23020
2045 79811 170581 26470
2050 91628 191861 30431
CAAGR (%) 2.80 2.20 3.28
a Values for years 2015 to 2050 were calculated based on 2.8% of CAGR, adopted from IEA 2013b Values for years 2015 to 2050 were calculated based on: TES=1.8008*(GDP/capita)+26858,R²=0.96873c Values for years 2015 to 2050 were calculated based on: Finalelectricityconsumption=0.3352*(GDP/capita)-282.22,R²=0.97099dDataforyears2011and2012wereobtainedfromtheNEB2012
3.1.2 Stage 2: Roadmap development
workshop
The Carbon Free Energy Roadmap Workshop
washeldinMelaka,from20to22January2015.
Backcasting Approach
The roadmap targets were developed by using
the backcasting approach. This approach
stipulates the “end-state” rather than deriving
it. A backcasting approach is able to highlight
the policy direction in order to achieve
future targets and objectives. In contrast, the
common approach that has been used to
develop the policy targets – “forecasting”,
tends to extend current trends out into
the future to see where they might arrive.
Therefore, the proposed targets in this study
are different from the existing energy targets
ofKeTTHA.
This approach was introduced to the
participants of the workshop, who are
stakeholders of the energy sector. The end-
state and targets to be achieved in 2050
were set and actions that need to be taken
from current year to 2050 were discussed in
separate groups.
Carbon Free Energy Roadmap
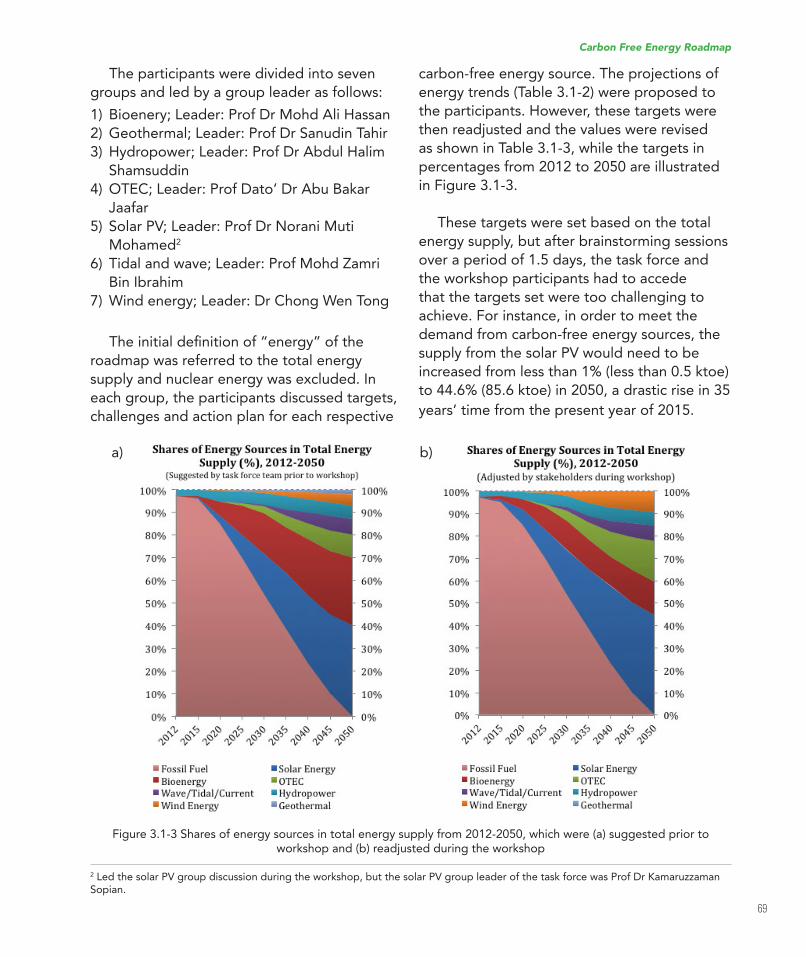
69
The participants were divided into seven
groups and led by a group leader as follows:
1) Bioenery;Leader:ProfDrMohdAliHassan2)Geothermal;Leader:ProfDrSanudinTahir3) Hydropower;Leader:ProfDrAbdulHalim
Shamsuddin
4)OTEC;Leader:ProfDato’DrAbuBakarJaafar
5) SolarPV;Leader:ProfDrNoraniMutiMohamed2
6) Tidal and wave; Leader: Prof Mohd Zamri
Bin Ibrahim
7)Windenergy;Leader:DrChongWenTong
Theinitialdeinitionof“energy”oftheroadmap was referred to the total energy
supply and nuclear energy was excluded. In
each group, the participants discussed targets,
challenges and action plan for each respective
a) b)
Figure 3.1-3 Shares of energy sources in total energy supply from 2012-2050, which were (a) suggested prior to workshop and (b) readjusted during the workshop
carbon-free energy source. The projections of
energy trends (Table 3.1-2) were proposed to
the participants. However, these targets were
then readjusted and the values were revised
as shown in Table 3.1-3, while the targets in
percentages from 2012 to 2050 are illustrated
in Figure 3.1-3.
These targets were set based on the total
energy supply, but after brainstorming sessions
over a period of 1.5 days, the task force and
the workshop participants had to accede
that the targets set were too challenging to
achieve. For instance, in order to meet the
demand from carbon-free energy sources, the
supply from the solar PV would need to be
increased from less than 1% (less than 0.5 ktoe)
to 44.6% (85.6 ktoe) in 2050, a drastic rise in 35
years’ time from the present year of 2015.
Carbon Free Energy Roadmap
2LedthesolarPVgroupdiscussionduringtheworkshop,butthesolarPVgroupleaderofthetaskforcewasProfDrKamaruzzamanSopian.
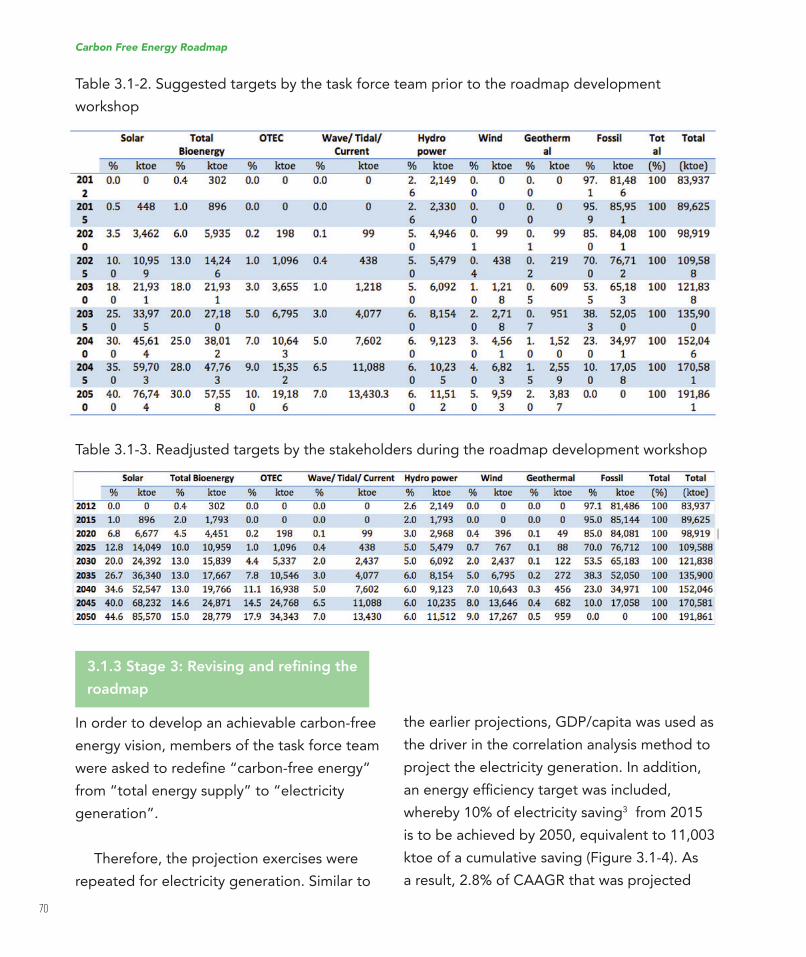
70
Table 3.1-2. Suggested targets by the task force team prior to the roadmap development
workshop
Table 3.1-3. Readjusted targets by the stakeholders during the roadmap development workshop
3.1.3 Stage 3: Revising and reining the roadmap
In order to develop an achievable carbon-free
energy vision, members of the task force team
wereaskedtoredeine“carbon-freeenergy”from “total energy supply” to “electricity
generation”.
Therefore, the projection exercises were
repeated for electricity generation. Similar to
theearlierprojections,GDP/capitawasusedasthe driver in the correlation analysis method to
project the electricity generation. In addition,
anenergyeficiencytargetwasincluded,whereby 10% of electricity saving3 from 2015
is to be achieved by 2050, equivalent to 11,003
ktoe of a cumulative saving (Figure 3.1-4). As
a result, 2.8% of CAAGR that was projected
Carbon Free Energy Roadmap
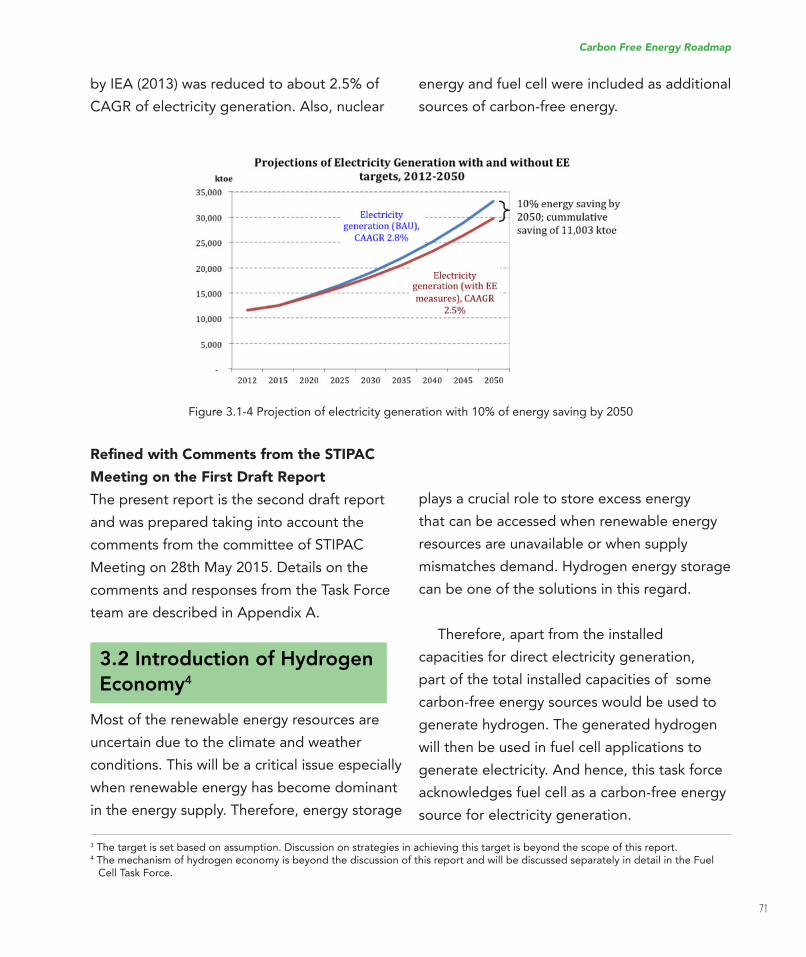
71
by IEA (2013) was reduced to about 2.5% of
CAGR of electricity generation. Also, nuclear
Figure 3.1-4 Projection of electricity generation with 10% of energy saving by 2050
Reined with Comments from the STIPAC Meeting on the First Draft Report
The present report is the second draft report
and was prepared taking into account the
comments from the committee of STIPAC
Meetingon28thMay2015.Detailsonthecomments and responses from the Task Force
team are described in Appendix A.
3.2 Introduction of Hydrogen
Economy4
Most of the renewable energy resources are
uncertain due to the climate and weather
conditions. This will be a critical issue especially
when renewable energy has become dominant
in the energy supply. Therefore, energy storage
energy and fuel cell were included as additional
sources of carbon-free energy.
plays a crucial role to store excess energy
that can be accessed when renewable energy
resources are unavailable or when supply
mismatches demand. Hydrogen energy storage
can be one of the solutions in this regard.
Therefore, apart from the installed
capacities for direct electricity generation,
part of the total installed capacities of some
carbon-free energy sources would be used to
generate hydrogen. The generated hydrogen
will then be used in fuel cell applications to
generate electricity. And hence, this task force
acknowledges fuel cell as a carbon-free energy
source for electricity generation.
3Thetargetissetbasedonassumption.Discussiononstrategiesinachievingthistargetisbeyondthescopeofthisreport.4 The mechanism of hydrogen economy is beyond the discussion of this report and will be discussed separately in detail in the Fuel
Cell Task Force.
Carbon Free Energy Roadmap
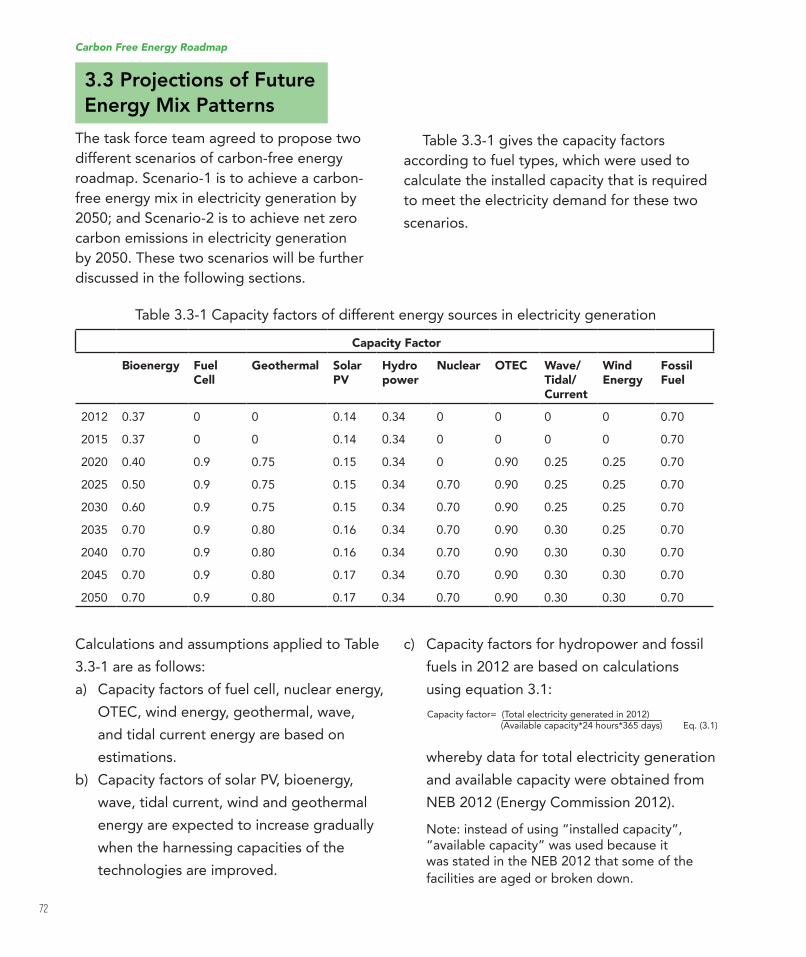
72
3.3 Projections of Future
Energy Mix Patterns
The task force team agreed to propose two
different scenarios of carbon-free energy
roadmap. Scenario-1 is to achieve a carbon-
free energy mix in electricity generation by
2050; and Scenario-2 is to achieve net zero
carbon emissions in electricity generation
by 2050. These two scenarios will be further
discussed in the following sections.
Capacity Factor
Bioenergy Fuel Cell
Geothermal Solar PV
Hydro power
Nuclear OTEC Wave/ Tidal/ Current
Wind Energy
Fossil Fuel
2012 0.37 0 0 0.14 0.34 0 0 0 0 0.70
2015 0.37 0 0 0.14 0.34 0 0 0 0 0.70
2020 0.40 0.9 0.75 0.15 0.34 0 0.90 0.25 0.25 0.70
2025 0.50 0.9 0.75 0.15 0.34 0.70 0.90 0.25 0.25 0.70
2030 0.60 0.9 0.75 0.15 0.34 0.70 0.90 0.25 0.25 0.70
2035 0.70 0.9 0.80 0.16 0.34 0.70 0.90 0.30 0.25 0.70
2040 0.70 0.9 0.80 0.16 0.34 0.70 0.90 0.30 0.30 0.70
2045 0.70 0.9 0.80 0.17 0.34 0.70 0.90 0.30 0.30 0.70
2050 0.70 0.9 0.80 0.17 0.34 0.70 0.90 0.30 0.30 0.70
Calculations and assumptions applied to Table
3.3-1 are as follows:
a) Capacity factors of fuel cell, nuclear energy,
OTEC, wind energy, geothermal, wave,
and tidal current energy are based on
estimations.
b) Capacity factors of solar PV, bioenergy,
wave, tidal current, wind and geothermal
energy are expected to increase gradually
when the harnessing capacities of the
technologies are improved.
Table 3.3-1 gives the capacity factors
according to fuel types, which were used to
calculate the installed capacity that is required
to meet the electricity demand for these two
scenarios.
c) Capacity factors for hydropower and fossil
fuels in 2012 are based on calculations
using equation 3.1:
whereby data for total electricity generation
and available capacity were obtained from
NEB 2012 (Energy Commission 2012).
Note: instead of using “installed capacity”, “available capacity” was used because it was stated in the NEB 2012 that some of the
facilities are aged or broken down.
Table 3.3-1 Capacity factors of different energy sources in electricity generation
Capacity factor= (Total electricity generated in 2012) (Available capacity*24 hours*365 days) Eq. (3.1)
Carbon Free Energy Roadmap
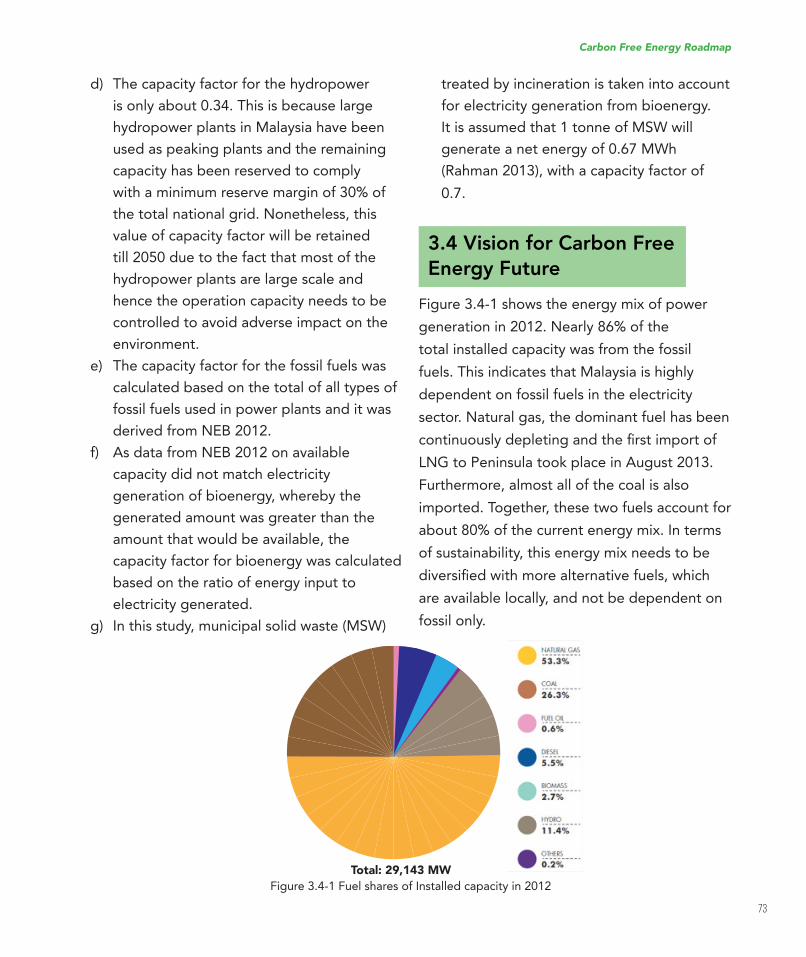
73
d) The capacity factor for the hydropower
is only about 0.34. This is because large
hydropower plants in Malaysia have been
used as peaking plants and the remaining
capacity has been reserved to comply
with a minimum reserve margin of 30% of
the total national grid. Nonetheless, this
value of capacity factor will be retained
till 2050 due to the fact that most of the
hydropower plants are large scale and
hence the operation capacity needs to be
controlled to avoid adverse impact on the
environment.
e) The capacity factor for the fossil fuels was
calculated based on the total of all types of
fossil fuels used in power plants and it was
derived from NEB 2012.
f) As data from NEB 2012 on available
capacity did not match electricity
generation of bioenergy, whereby the
generated amount was greater than the
amount that would be available, the
capacity factor for bioenergy was calculated
based on the ratio of energy input to
electricity generated.
g) In this study, municipal solid waste (MSW)
Figure 3.4-1 Fuel shares of Installed capacity in 2012
treated by incineration is taken into account
for electricity generation from bioenergy.
It is assumed that 1 tonne of MSW will
generate a net energy of 0.67 MWh
(Rahman 2013), with a capacity factor of
0.7.
3.4 Vision for Carbon Free
Energy Future
Figure 3.4-1 shows the energy mix of power
generation in 2012. Nearly 86% of the
total installed capacity was from the fossil
fuels. This indicates that Malaysia is highly
dependent on fossil fuels in the electricity
sector. Natural gas, the dominant fuel has been
continuouslydepletingandtheirstimportofLNG to Peninsula took place in August 2013.
Furthermore, almost all of the coal is also
imported. Together, these two fuels account for
about 80% of the current energy mix. In terms
of sustainability, this energy mix needs to be
diversiiedwithmorealternativefuels,whichare available locally, and not be dependent on
fossil only.
Carbon Free Energy Roadmap
Total: 29,143 MW
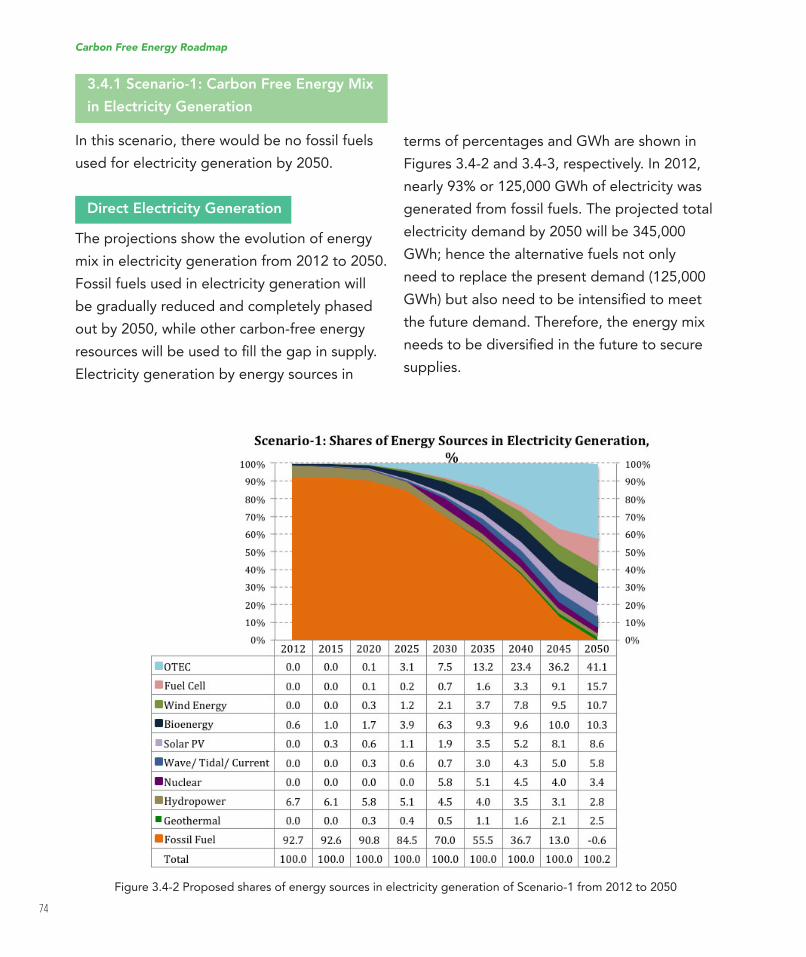
74
3.4.1 Scenario-1: Carbon Free Energy Mix
in Electricity Generation
In this scenario, there would be no fossil fuels
used for electricity generation by 2050.
Direct Electricity Generation
The projections show the evolution of energy
mix in electricity generation from 2012 to 2050.
Fossil fuels used in electricity generation will
be gradually reduced and completely phased
out by 2050, while other carbon-free energy
resourceswillbeusedtoillthegapinsupply.Electricity generation by energy sources in
Figure 3.4-2 Proposed shares of energy sources in electricity generation of Scenario-1 from 2012 to 2050
terms of percentages and GWh are shown in
Figures 3.4-2 and 3.4-3, respectively. In 2012,
nearly 93% or 125,000 GWh of electricity was
generated from fossil fuels. The projected total
electricity demand by 2050 will be 345,000
GWh; hence the alternative fuels not only
need to replace the present demand (125,000
GWh)butalsoneedtobeintensiiedtomeetthe future demand. Therefore, the energy mix
needstobediversiiedinthefuturetosecuresupplies.
Carbon Free Energy Roadmap
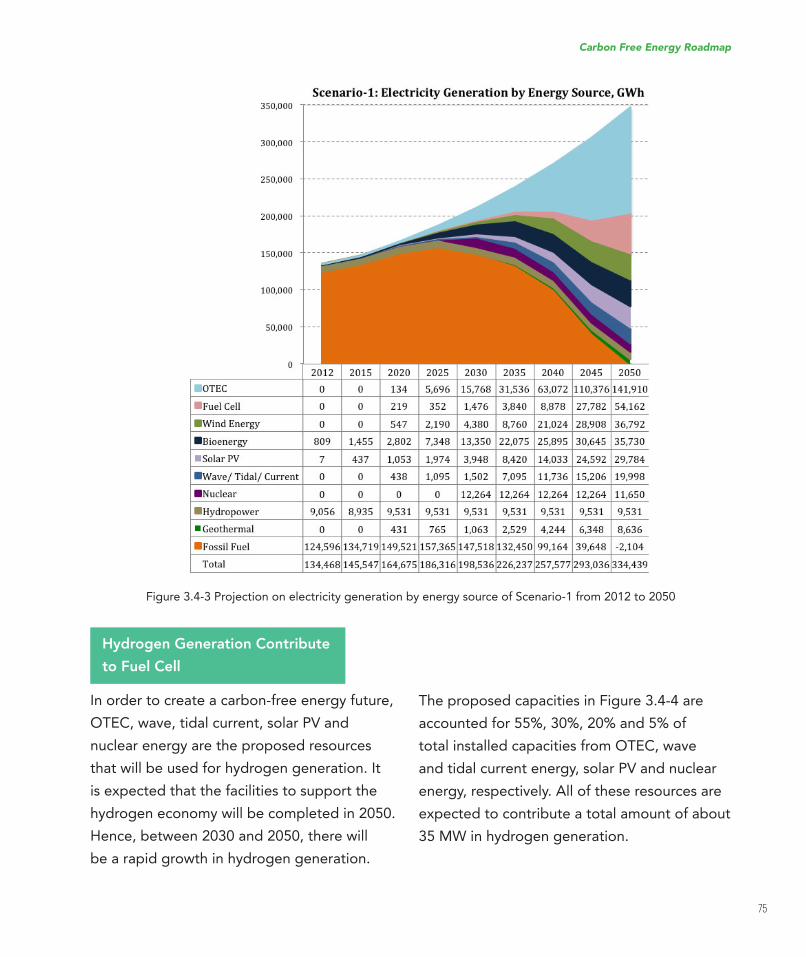
75
Figure 3.4-3 Projection on electricity generation by energy source of Scenario-1 from 2012 to 2050
Hydrogen Generation Contribute
to Fuel Cell
In order to create a carbon-free energy future,
OTEC, wave, tidal current, solar PV and
nuclear energy are the proposed resources
that will be used for hydrogen generation. It
is expected that the facilities to support the
hydrogen economy will be completed in 2050.
Hence, between 2030 and 2050, there will
be a rapid growth in hydrogen generation.
The proposed capacities in Figure 3.4-4 are
accounted for 55%, 30%, 20% and 5% of
total installed capacities from OTEC, wave
and tidal current energy, solar PV and nuclear
energy, respectively. All of these resources are
expected to contribute a total amount of about
35 MW in hydrogen generation.
Carbon Free Energy Roadmap
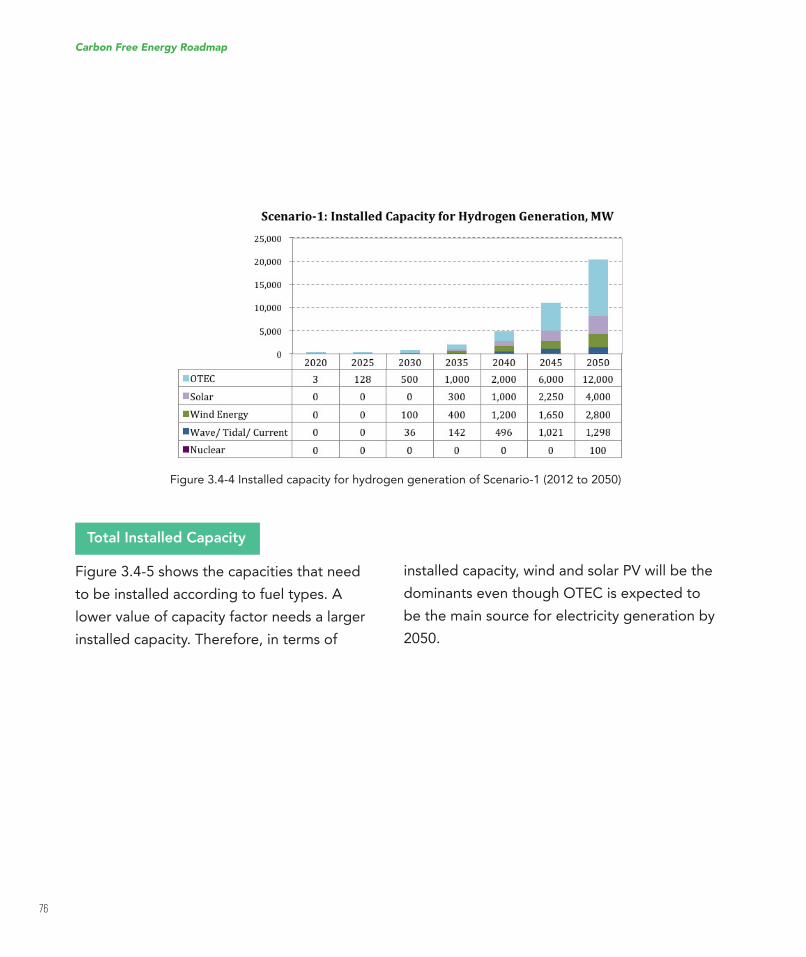
76
Figure 3.4-4 Installed capacity for hydrogen generation of Scenario-1 (2012 to 2050)
Total Installed Capacity
Figure 3.4-5 shows the capacities that need
to be installed according to fuel types. A
lower value of capacity factor needs a larger
installed capacity. Therefore, in terms of
installed capacity, wind and solar PV will be the
dominants even though OTEC is expected to
be the main source for electricity generation by
2050.
Carbon Free Energy Roadmap
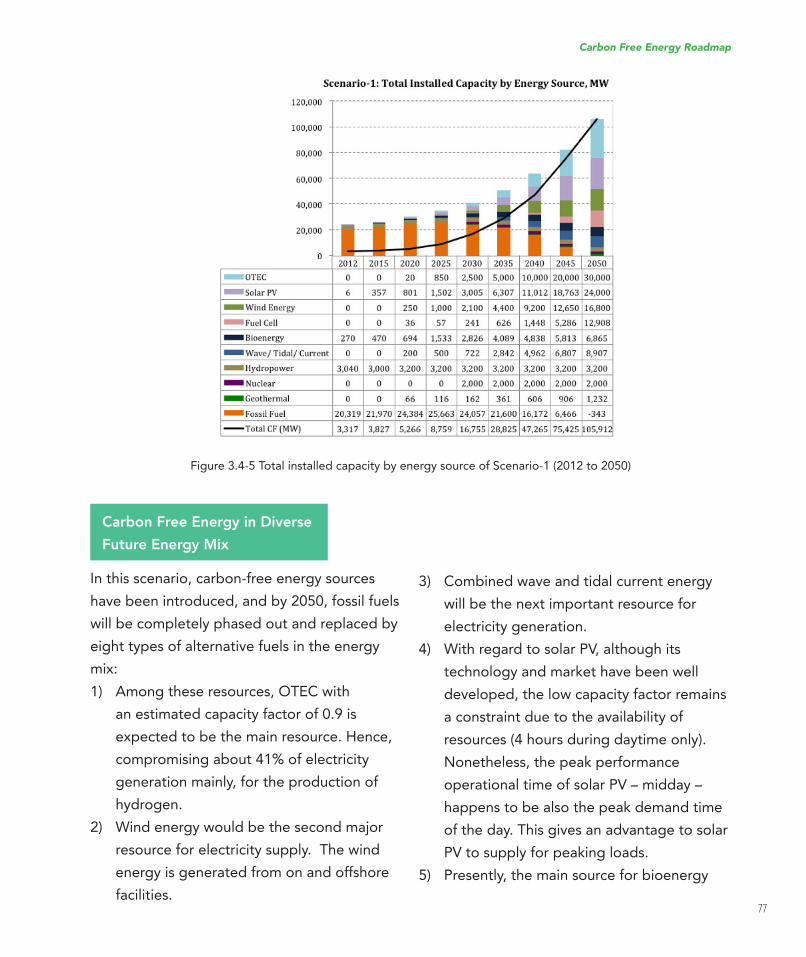
77
Figure 3.4-5 Total installed capacity by energy source of Scenario-1 (2012 to 2050)
Carbon Free Energy in Diverse
Future Energy Mix
In this scenario, carbon-free energy sources
have been introduced, and by 2050, fossil fuels
will be completely phased out and replaced by
eight types of alternative fuels in the energy
mix:
1) Among these resources, OTEC with
an estimated capacity factor of 0.9 is
expected to be the main resource. Hence,
compromising about 41% of electricity
generation mainly, for the production of
hydrogen.
2) Wind energy would be the second major
resource for electricity supply. The wind
energy is generated from on and offshore
facilities.
3) Combined wave and tidal current energy
will be the next important resource for
electricity generation.
4) With regard to solar PV, although its
technology and market have been well
developed, the low capacity factor remains
a constraint due to the availability of
resources (4 hours during daytime only).
Nonetheless, the peak performance
operational time of solar PV – midday –
happens to be also the peak demand time
of the day. This gives an advantage to solar
PV to supply for peaking loads.
5) Presently, the main source for bioenergy
Carbon Free Energy Roadmap
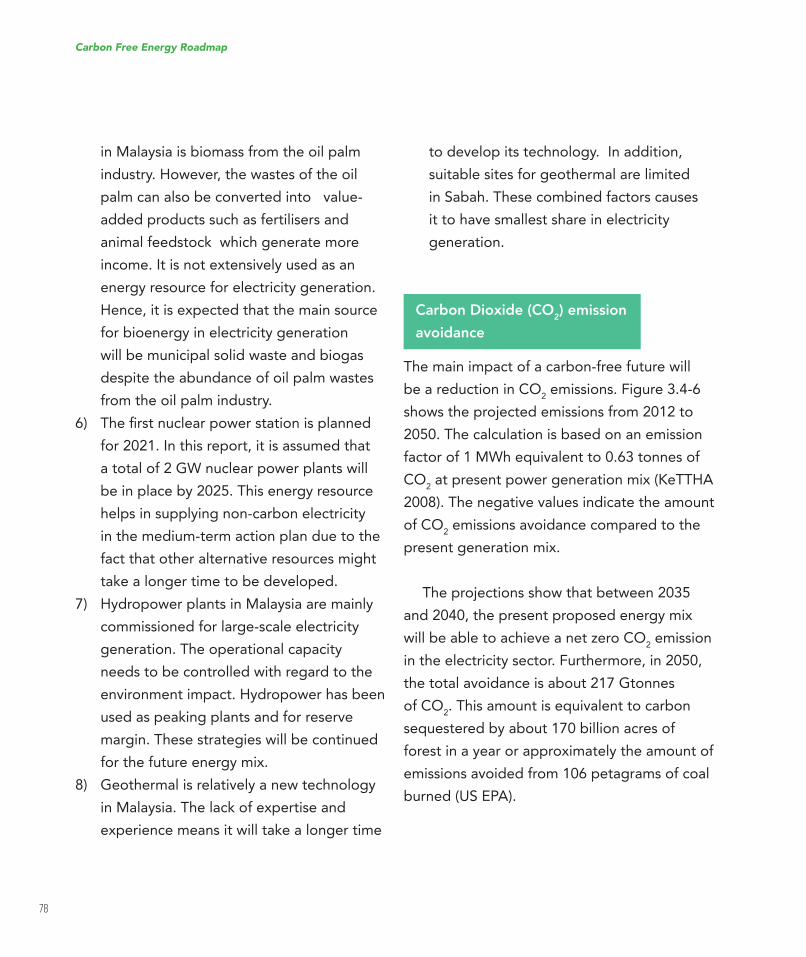
78
in Malaysia is biomass from the oil palm
industry. However, the wastes of the oil
palm can also be converted into value-
added products such as fertilisers and
animal feedstock which generate more
income. It is not extensively used as an
energy resource for electricity generation.
Hence, it is expected that the main source
for bioenergy in electricity generation
will be municipal solid waste and biogas
despite the abundance of oil palm wastes
from the oil palm industry.
6) Theirstnuclearpowerstationisplannedfor 2021. In this report, it is assumed that
a total of 2 GW nuclear power plants will
be in place by 2025. This energy resource
helps in supplying non-carbon electricity
in the medium-term action plan due to the
fact that other alternative resources might
take a longer time to be developed.
7) Hydropower plants in Malaysia are mainly
commissioned for large-scale electricity
generation. The operational capacity
needs to be controlled with regard to the
environment impact. Hydropower has been
used as peaking plants and for reserve
margin. These strategies will be continued
for the future energy mix.
8) Geothermal is relatively a new technology
in Malaysia. The lack of expertise and
experience means it will take a longer time
to develop its technology. In addition,
suitable sites for geothermal are limited
in Sabah. These combined factors causes
it to have smallest share in electricity
generation.
Carbon Dioxide (CO2) emission
avoidance
The main impact of a carbon-free future will
be a reduction in CO2 emissions. Figure 3.4-6
shows the projected emissions from 2012 to
2050. The calculation is based on an emission
factor of 1 MWh equivalent to 0.63 tonnes of
CO2atpresentpowergenerationmix(KeTTHA
2008). The negative values indicate the amount
of CO2 emissions avoidance compared to the
present generation mix.
The projections show that between 2035
and 2040, the present proposed energy mix
will be able to achieve a net zero CO2 emission
in the electricity sector. Furthermore, in 2050,
the total avoidance is about 217 Gtonnes
of CO2. This amount is equivalent to carbon
sequestered by about 170 billion acres of
forest in a year or approximately the amount of
emissions avoided from 106 petagrams of coal
burned (US EPA).
Carbon Free Energy Roadmap
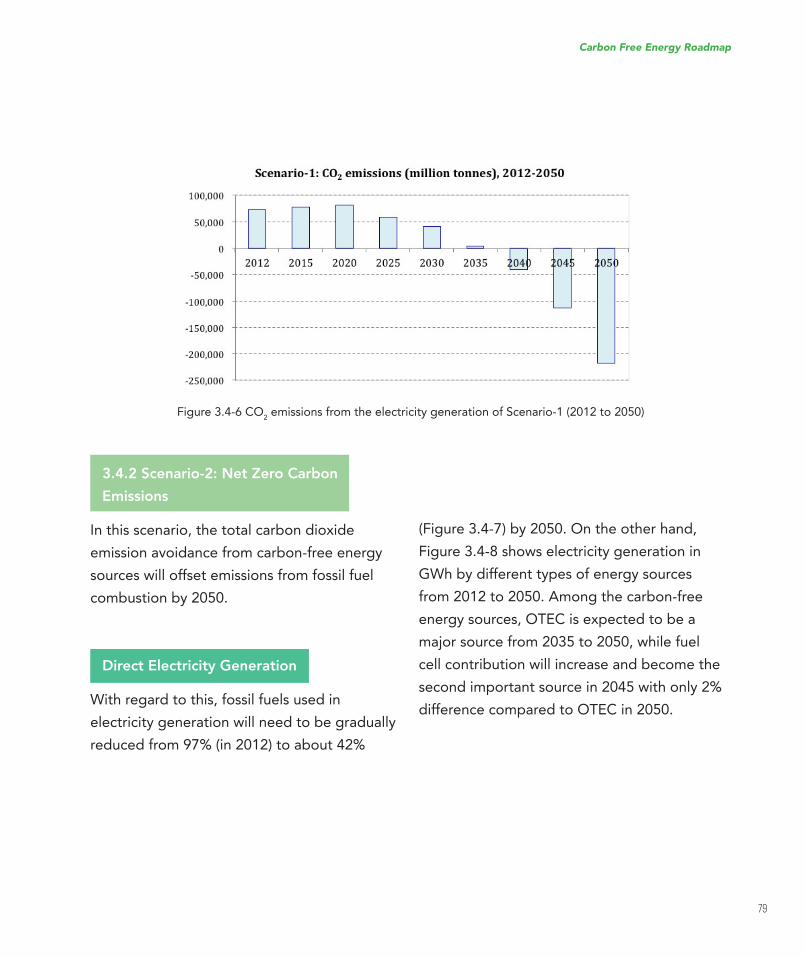
79
Figure 3.4-6 CO2 emissions from the electricity generation of Scenario-1 (2012 to 2050)
3.4.2 Scenario-2: Net Zero Carbon
Emissions
In this scenario, the total carbon dioxide
emission avoidance from carbon-free energy
sources will offset emissions from fossil fuel
combustion by 2050.
Direct Electricity Generation
With regard to this, fossil fuels used in
electricity generation will need to be gradually
reduced from 97% (in 2012) to about 42%
(Figure 3.4-7) by 2050. On the other hand,
Figure 3.4-8 shows electricity generation in
GWh by different types of energy sources
from 2012 to 2050. Among the carbon-free
energy sources, OTEC is expected to be a
major source from 2035 to 2050, while fuel
cell contribution will increase and become the
second important source in 2045 with only 2%
difference compared to OTEC in 2050.
Carbon Free Energy Roadmap
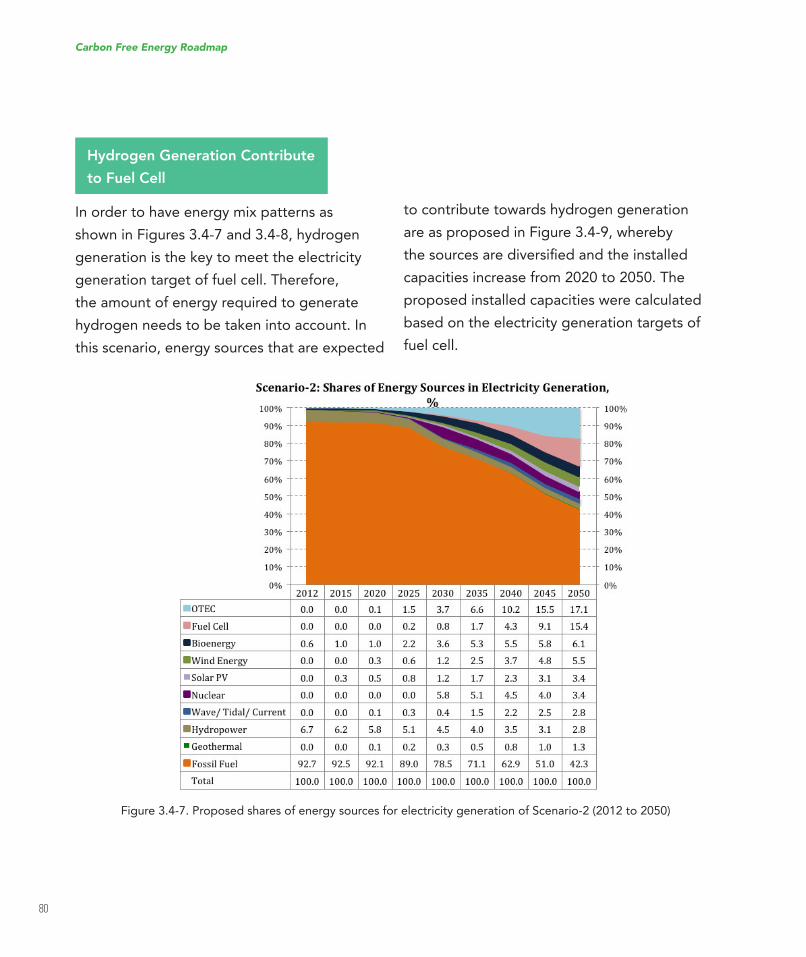
80
Figure 3.4-7. Proposed shares of energy sources for electricity generation of Scenario-2 (2012 to 2050)
Hydrogen Generation Contribute
to Fuel Cell
In order to have energy mix patterns as
shown in Figures 3.4-7 and 3.4-8, hydrogen
generation is the key to meet the electricity
generation target of fuel cell. Therefore,
the amount of energy required to generate
hydrogen needs to be taken into account. In
this scenario, energy sources that are expected
to contribute towards hydrogen generation
are as proposed in Figure 3.4-9, whereby
thesourcesarediversiiedandtheinstalledcapacities increase from 2020 to 2050. The
proposed installed capacities were calculated
based on the electricity generation targets of
fuel cell.
Carbon Free Energy Roadmap
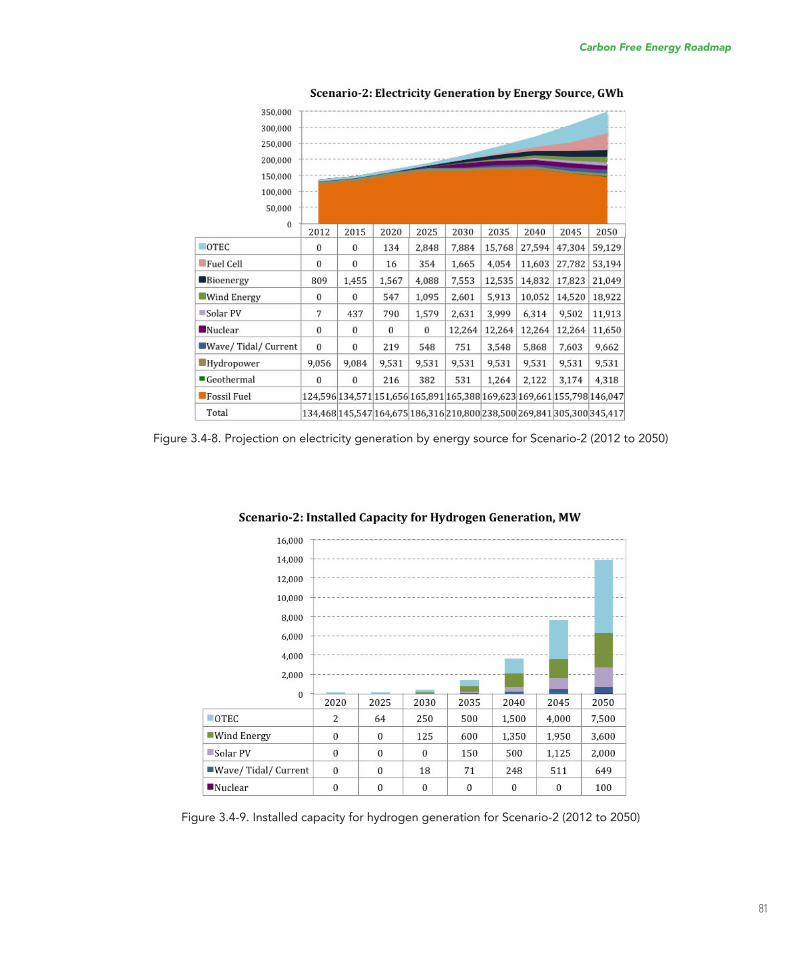
81
Figure 3.4-8. Projection on electricity generation by energy source for Scenario-2 (2012 to 2050)
Figure 3.4-9. Installed capacity for hydrogen generation for Scenario-2 (2012 to 2050)
Carbon Free Energy Roadmap
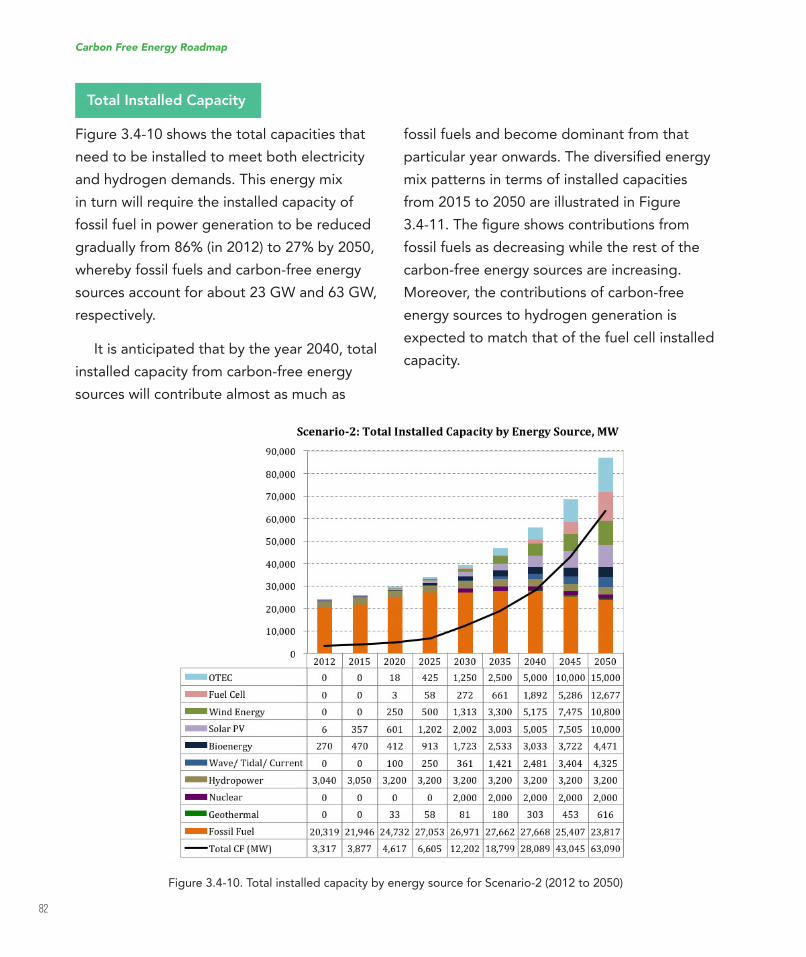
82
Figure 3.4-10. Total installed capacity by energy source for Scenario-2 (2012 to 2050)
Total Installed Capacity
Figure 3.4-10 shows the total capacities that
need to be installed to meet both electricity
and hydrogen demands. This energy mix
in turn will require the installed capacity of
fossil fuel in power generation to be reduced
gradually from 86% (in 2012) to 27% by 2050,
whereby fossil fuels and carbon-free energy
sources account for about 23 GW and 63 GW,
respectively.
It is anticipated that by the year 2040, total
installed capacity from carbon-free energy
sources will contribute almost as much as
fossil fuels and become dominant from that
particularyearonwards.Thediversiiedenergymix patterns in terms of installed capacities
from 2015 to 2050 are illustrated in Figure
3.4-11.Theigureshowscontributionsfromfossil fuels as decreasing while the rest of the
carbon-free energy sources are increasing.
Moreover, the contributions of carbon-free
energy sources to hydrogen generation is
expected to match that of the fuel cell installed
capacity.
Carbon Free Energy Roadmap
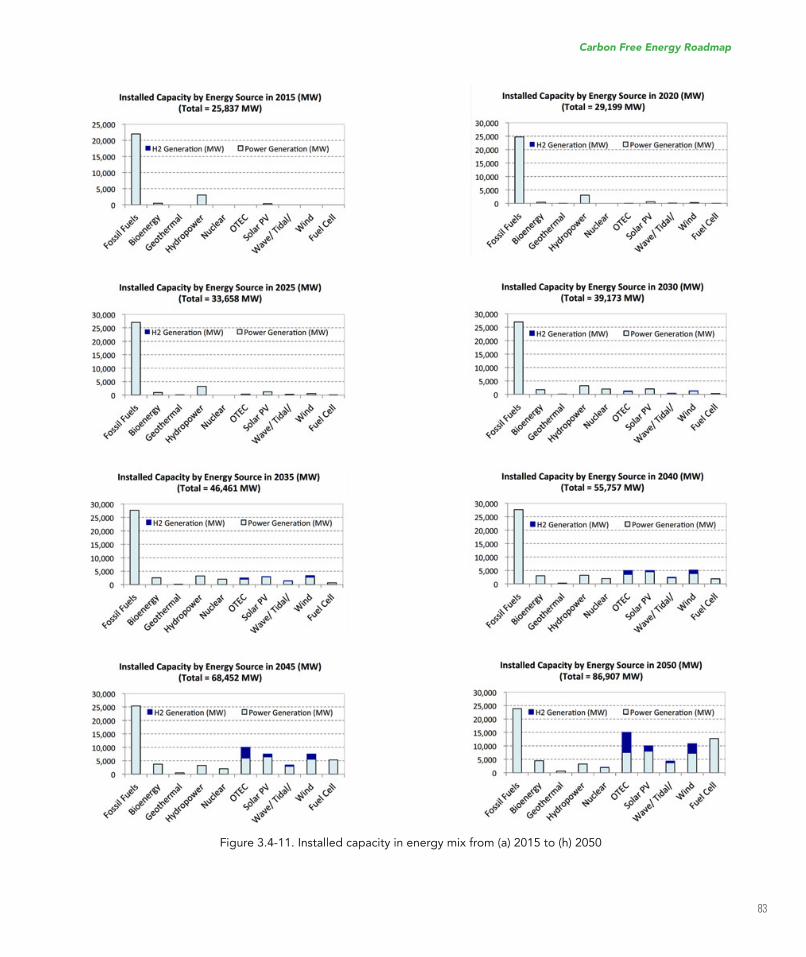
83
Figure 3.4-11. Installed capacity in energy mix from (a) 2015 to (h) 2050
Carbon Free Energy Roadmap
84
Carbon Free Energy in Diverse Future
Energy Mix
In this scenario, fossil fuels together with nine
carbon-free energy sources will contribute
towards the future energy mix as follows:
1) Fossil fuels will play an important role in
power generation, however, its share of
electricity generation in 2050 (97%) will
reduced by more than half (42%) compared
to 2012.
2) Among the carbon-free energy
resources, OTEC is expected to be the
main source and will account for about
17% of electricity generation by 2050.
Furthermore, 50% of its total installed
capacity will be used in hydrogen
generation by 2050, making it the main
energy source for hydrogen generation.
3) Fuel cell will be the next important energy
conversion system after OTEC. However,
full cell will rely on other carbon-free
energy sources that contribute to hydrogen
production. The share of fuel cell for
electricity generation (2020-2050) can
only be achieved if the energy supply for
hydrogenproductionissuficient.4) The capacity factor of bioenergy is higher
compared to wind energy and solar PV.
Moreover, electricity generation from the
bioenergy is higher compared to wind
and PV, although it has smaller amount
of installed capacity. In this scenario, it
is assumed that about 90% of municipal
solid waste will be treated by incineration.
Furthermore, municipal solid waste will
contributesigniicantlyintheelectricitygeneration mix.
5) Windenergywillbetheifthmajorenergysource for electricity generation by 2050.
6) Solar PV shares about the same amount of
installed capacity as wind energy. However,
electricity generation from PV is less than
the wind because of the lower capacity
factor.
7) Nuclear energy will supply the non-carbon
electricity in the medium-term action plan.
Nuclear energy technology is relatively
more mature than other carbon-free energy
sources in terms of big-scale commercial
power plants. Hence, nuclear energy
is able to ease the reduction of fossil
fuel consumption when other carbon-
free energy technologies are still in the
developing stages.
8) The combination of wave energy and tidal
current energy will be the next important
source that can contribute to electricity
generation.
9) Hydropower plants in Malaysia are mainly
large-scale. It has been used as peaking
plants and reserve margin. However, the
operational capacity needs to be controlled
to safeguard the environment.
10) Geothermal is relatively a new technology
in Malaysia. The lack of expertise and
experience means it will take a longer time
to develop this technology. In addition,
Carbon Free Energy Roadmap
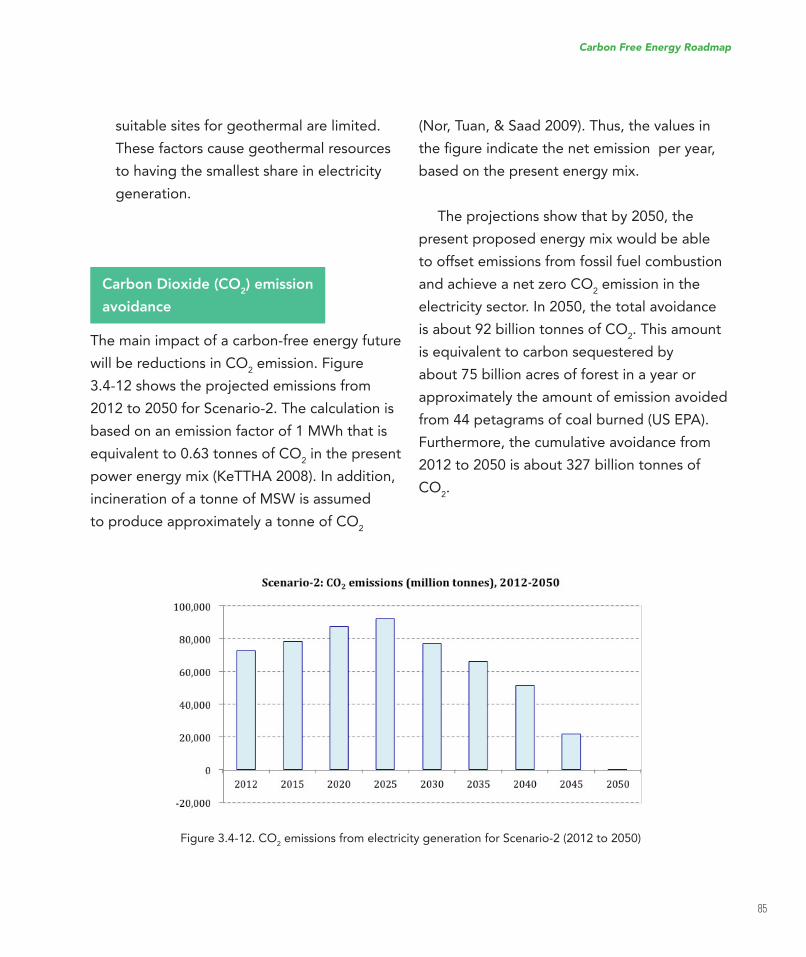
85
suitable sites for geothermal are limited.
These factors cause geothermal resources
to having the smallest share in electricity
generation.
Carbon Dioxide (CO2) emission
avoidance
The main impact of a carbon-free energy future
will be reductions in CO2 emission. Figure
3.4-12 shows the projected emissions from
2012 to 2050 for Scenario-2. The calculation is
based on an emission factor of 1 MWh that is
equivalent to 0.63 tonnes of CO2 in the present
powerenergymix(KeTTHA2008).Inaddition,incineration of a tonne of MSW is assumed
to produce approximately a tonne of CO2
Figure 3.4-12. CO2 emissions from electricity generation for Scenario-2 (2012 to 2050)
(Nor, Tuan, & Saad 2009). Thus, the values in
theigureindicatethenetemissionperyear,based on the present energy mix.
The projections show that by 2050, the
present proposed energy mix would be able
to offset emissions from fossil fuel combustion
and achieve a net zero CO2 emission in the
electricity sector. In 2050, the total avoidance
is about 92 billion tonnes of CO2. This amount
is equivalent to carbon sequestered by
about 75 billion acres of forest in a year or
approximately the amount of emission avoided
from 44 petagrams of coal burned (US EPA).
Furthermore, the cumulative avoidance from
2012 to 2050 is about 327 billion tonnes of
CO2.
Carbon Free Energy Roadmap

86
Chapter 4
Technology Development Roadmap:
Action Plan and Time Frame
87
A carbon-free energy future is only achievable
if all types of alternative fuels are developed
anddeployedwithinaspeciictimeframe.The failure of any of these fuels in meeting
the set milestones will delay or cause failure in
achieving the roadmap targets. Cumulatively
delay in achieving milestones will also create
bigger gaps between actual progress and
targets rendering targets impossible to be
achieved within the earlier planned time frame.
The proposed action plan was developed
using the backcasting approach, whereby
the energy policy is directed towards
achieving a net zero carbon emission in 2050
(Scenario-2). Actions that are required to
achieve the roadmap targets were proposed
andwereclassiiedintotwo,i.e.“TechnologyDevelopment”and“Policy,inance,publicacceptance and awareness”.
4.1 Bioenergy
The Challenges
The main challenge for bioenergy is feedstock
availability, which is biomass from the oil palm
industry. Other issues related to feedstock
include logistic and pricing. Currently, there
isnomarketcontrolinixingpricesandthereis competition from other non-energy usage.
There is also no existing technical standard for
the industry.
Furthermore,duetoloweficiency,theexisting technology is yet to reach the
maturity for commercialisation. High capital
expenditures(capex),poorinancingandfunding systems also hinder the technology
from being introduced into the market.
There is also no appropriate business model
in addressing issues related to banking. In
general, the general perception of bioenergy
that it is an expensive with low incentive
technology has made it unattractive to the
industry.
Apart from that, the lack of local,
skilled human resources has caused the
overdependence on international experts
for technical support. Very limited capacity
building and technology transfer opportunities
are made available for the locals.
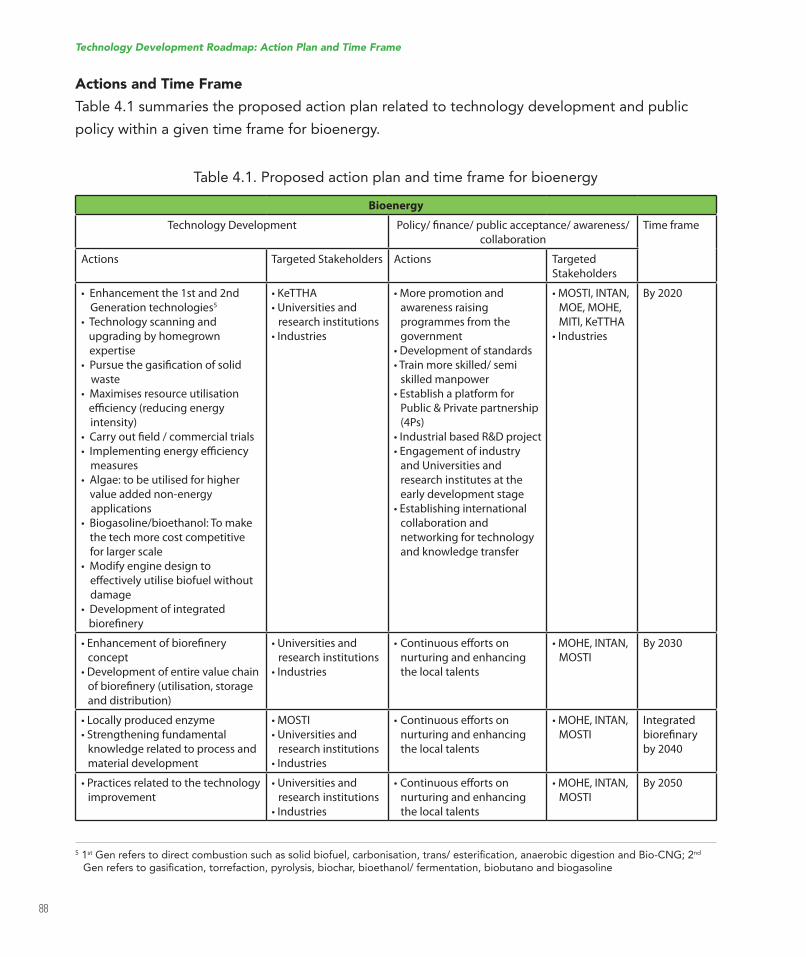
88
Technology Development Roadmap: Action Plan and Time Frame
Actions and Time Frame
Table 4.1 summaries the proposed action plan related to technology development and public
policy within a given time frame for bioenergy.
Bioenergy
Technology Development Policy/ inance/ public acceptance/ awareness/
collaboration
Time frame
Actions Targeted Stakeholders Actions Targeted
Stakeholders
• Enhancement the 1st and 2nd Generation technologies5
• Technology scanning and upgrading by homegrown
expertise
• Pursue the gasiication of solid waste
• Maximises resource utilisation eiciency (reducing energy
intensity)
• Carry out ield / commercial trials• Implementing energy eiciency measures
• Algae: to be utilised for higher value added non-energy
applications
• Biogasoline/bioethanol: To make the tech more cost competitive
for larger scale
• Modify engine design to efectively utilise biofuel without
damage
• Development of integrated bioreinery
• KeTTHA• Universities and
research institutions
• Industries
• More promotion and awareness raising
programmes from the
government
• Development of standards• Train more skilled/ semi
skilled manpower
• Establish a platform for Public & Private partnership
(4Ps)
• Industrial based R&D project• Engagement of industry
and Universities and research institutes at the
early development stage
• Establishing international collaboration and
networking for technology
and knowledge transfer
• MOSTI, INTAN, MOE, MOHE, MITI, KeTTHA
• Industries
By 2020
• Enhancement of bioreinery concept
• Development of entire value chain of bioreinery (utilisation, storage and distribution)
• Universities and research institutions
• Industries
• Continuous eforts on nurturing and enhancing
the local talents
• MOHE, INTAN, MOSTI
By 2030
• Locally produced enzyme• Strengthening fundamental
knowledge related to process and
material development
• MOSTI• Universities and
research institutions
• Industries
• Continuous eforts on nurturing and enhancing
the local talents
• MOHE, INTAN, MOSTI
Integrated bioreinary
by 2040
• Practices related to the technology improvement
• Universities and research institutions
• Industries
• Continuous eforts on nurturing and enhancing
the local talents
• MOHE, INTAN, MOSTI
By 2050
5 1stGenreferstodirectcombustionsuchassolidbiofuel,carbonisation,trans/esteriication,anaerobicdigestionandBio-CNG;2nd Genreferstogasiication,torrefaction,pyrolysis,biochar,bioethanol/fermentation,biobutanoandbiogasoline
Table 4.1. Proposed action plan and time frame for bioenergy
89
4.2 Geothermal
The Challenges
TheirstgeothermalprojectinMalaysiaiscurrently being spearheaded by an IPP, Tawau
Geothermal Energy (TGE) since 2012. A
working group on geothermal in Sabah has
beenestablished.TheirstexplorationphasewillbecarriedoutatApasKiriinTawau,where12 km2ofsub-surfaceheatedwaterieldhasbeen discovered. The production capacity
increases with the depth of the production
well.
According to the reservoir management
plan, a well with a capacity of 36 MW at a
depth of 2.5 km will be built. It is expected
to mitigate 200,000 tonnes of CO2/year.In
Technology Development Roadmap: Action Plan and Time Frame
addition, the electricity generated will be sold
to SESB under a 21-year Purchase Agreement.
The main challenges of the geothermal
technology include know-how stakeholder
involvement from the Minerals and Geoscience
DepartmentMalaysia(JMGM),SESBanduniversitiesaswellaslimitedinancialsupportfrom the state government.
Actions and Time Frame
Table 4.2 summaries the proposed action
plan related to technology development and
public policy within a given time frame for
geothermal.
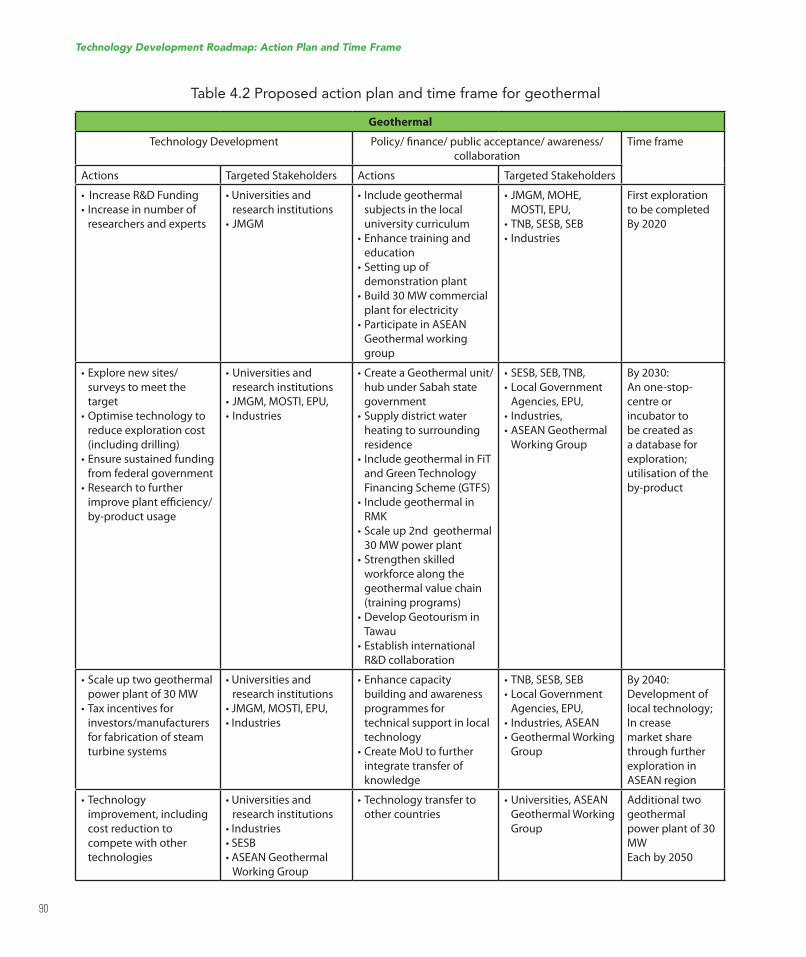
90
Table 4.2 Proposed action plan and time frame for geothermal
Geothermal
Technology Development Policy/ inance/ public acceptance/ awareness/
collaboration
Time frame
Actions Targeted Stakeholders Actions Targeted Stakeholders
• Increase R&D Funding• Increase in number of
researchers and experts
• Universities and research institutions
• JMGM
• Include geothermal subjects in the local university curriculum
• Enhance training and education
• Setting up of demonstration plant
• Build 30 MW commercial plant for electricity
• Participate in ASEAN Geothermal working
group
• JMGM, MOHE, MOSTI, EPU,
• TNB, SESB, SEB• Industries
First exploration to be completed
By 2020
• Explore new sites/surveys to meet the
target
• Optimise technology to reduce exploration cost
(including drilling)
• Ensure sustained funding from federal government
• Research to further improve plant eiciency/
by-product usage
• Universities and research institutions
• JMGM, MOSTI, EPU, • Industries
• Create a Geothermal unit/hub under Sabah state
government
• Supply district water heating to surrounding
residence
• Include geothermal in FiT and Green Technology
Financing Scheme (GTFS)• Include geothermal in
RMK• Scale up 2nd geothermal
30 MW power plant• Strengthen skilled
workforce along the
geothermal value chain
(training programs)
• Develop Geotourism in Tawau
• Establish international R&D collaboration
• SESB, SEB, TNB, • Local Government
Agencies, EPU, • Industries, • ASEAN Geothermal
Working Group
By 2030:An one-stop-
centre or
incubator to
be created as
a database for
exploration;
utilisation of the
by-product
• Scale up two geothermal power plant of 30 MW
• Tax incentives for investors/manufacturers
for fabrication of steam
turbine systems
• Universities and research institutions
• JMGM, MOSTI, EPU, • Industries
• Enhance capacity building and awareness
programmes for
technical support in local
technology
• Create MoU to further integrate transfer of
knowledge
• TNB, SESB, SEB• Local Government
Agencies, EPU, • Industries, ASEAN • Geothermal Working
Group
By 2040:Development of
local technology;
In crease market share
through further
exploration in
ASEAN region
• Technology improvement, including cost reduction to
compete with other
technologies
• Universities and research institutions
• Industries• SESB• ASEAN Geothermal
Working Group
• Technology transfer to other countries
• Universities, ASEAN Geothermal Working Group
Additional two
geothermal
power plant of 30 MWEach by 2050
Technology Development Roadmap: Action Plan and Time Frame
91
4.3 Hydropower
The Challenges
At the present, the total installed capacity
of hydropower plants is 5,421 MW, of which
5,000 MW is from major plants and 21 MW is
from mini and micro hydropower plants. The
main issue of hydropower is its impact on the
environment. Large hydropower plants create
large inundated areas. For instance, the Bakun
project required a land area equivalent to
Singapore. In Malaysia, the installed capacity is
larger than the demand, whereby the current
capacity factor is only about 0.34.
Large hydropower plants also tend to
cause intensive deforestation and population
displacement that not only damage the
ecosystem but also involves high capital
investment. Therefore, the mapping of any
possiblesiteshouldtakeintoaccountloraandfauna preservation. Other challenges include
limited local resources in turbine system turbo
machinery design and also the effects on
freshwater utilisation.
Actions and Time Frame
Table 4.3 summaries the proposed action
plan related to technology development and
public policy within a given time frame for
hydropower.
Technology Development Roadmap: Action Plan and Time Frame
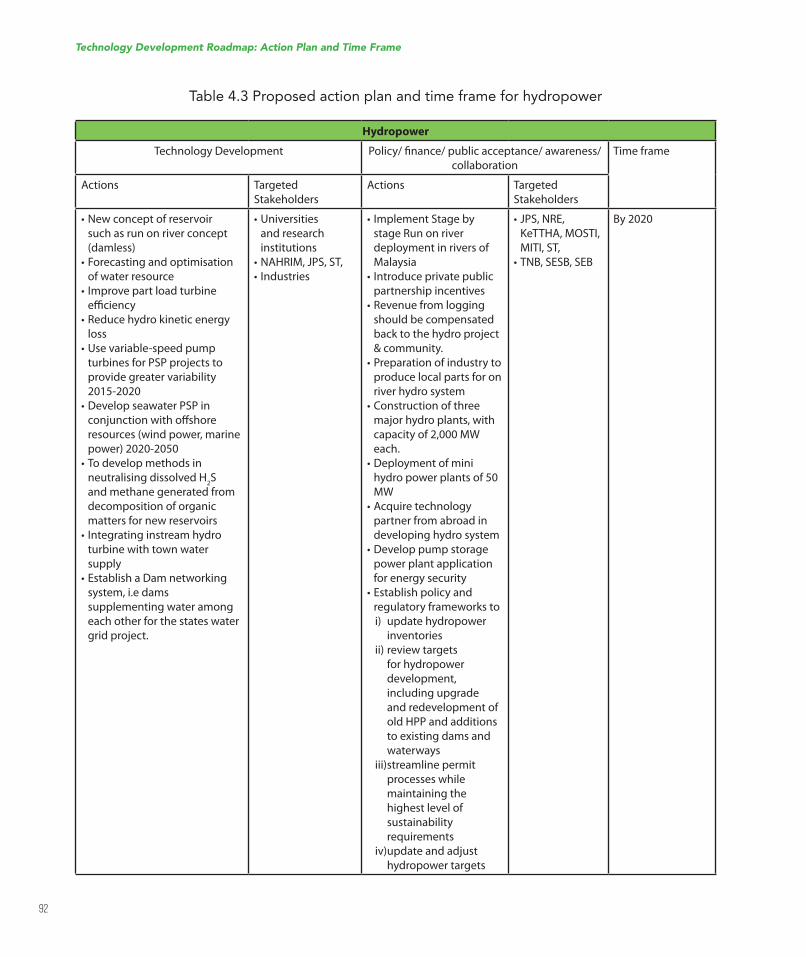
92
Table 4.3 Proposed action plan and time frame for hydropower
Hydropower
Technology Development Policy/ inance/ public acceptance/ awareness/
collaboration
Time frame
Actions Targeted
Stakeholders
Actions Targeted
Stakeholders
• New concept of reservoir such as run on river concept
(damless)
• Forecasting and optimisation of water resource
• Improve part load turbine eiciency
• Reduce hydro kinetic energy loss
• Use variable-speed pump turbines for PSP projects to provide greater variability
2015-2020• Develop seawater PSP in
conjunction with ofshore resources (wind power, marine power) 2020-2050
• To develop methods in neutralising dissolved H2S
and methane generated from
decomposition of organic
matters for new reservoirs
• Integrating instream hydro turbine with town water
supply
• Establish a Dam networking system, i.e dams supplementing water among
each other for the states water
grid project.
• Universities and research
institutions
• NAHRIM, JPS, ST, • Industries
• Implement Stage by stage Run on river deployment in rivers of
Malaysia• Introduce private public
partnership incentives
• Revenue from logging should be compensated
back to the hydro project & community.
• Preparation of industry to produce local parts for on
river hydro system
• Construction of three major hydro plants, with capacity of 2,000 MW each.
• Deployment of mini hydro power plants of 50 MW
• Acquire technology partner from abroad in
developing hydro system
• Develop pump storage power plant application
for energy security
• Establish policy and regulatory frameworks to
i) update hydropower
inventories
ii) review targets
for hydropower
development, including upgrade
and redevelopment of
old HPP and additions to existing dams and
waterways
iii) streamline permit
processes while
maintaining the
highest level of
sustainability
requirementsiv) update and adjust
hydropower targets
• JPS, NRE, KeTTHA, MOSTI, MITI, ST,
• TNB, SESB, SEB
By 2020
Technology Development Roadmap: Action Plan and Time Frame
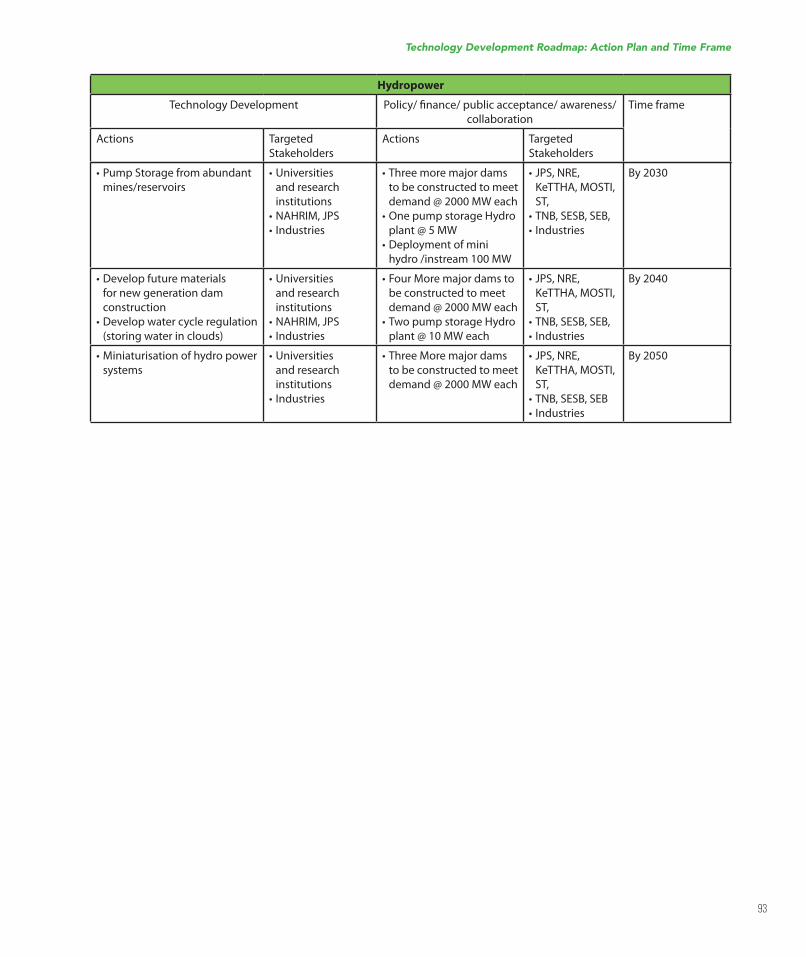
93
• Pump Storage from abundant mines/reservoirs
• Universities and research
institutions
• NAHRIM, JPS • Industries
• Three more major dams to be constructed to meet
demand @ 2000 MW each• One pump storage Hydro
plant @ 5 MW• Deployment of mini
hydro /instream 100 MW
• JPS, NRE, KeTTHA, MOSTI, ST,
• TNB, SESB, SEB, • Industries
By 2030
• Develop future materials for new generation dam
construction
• Develop water cycle regulation (storing water in clouds)
• Universities and research
institutions
• NAHRIM, JPS • Industries
• Four More major dams to be constructed to meet
demand @ 2000 MW each• Two pump storage Hydro
plant @ 10 MW each
• JPS, NRE, KeTTHA, MOSTI, ST,
• TNB, SESB, SEB, • Industries
By 2040
• Miniaturisation of hydro power systems
• Universities and research
institutions
• Industries
• Three More major dams to be constructed to meet
demand @ 2000 MW each
• JPS, NRE, KeTTHA, MOSTI, ST,
• TNB, SESB, SEB• Industries
By 2050
Technology Development Roadmap: Action Plan and Time Frame
Hydropower
Technology Development Policy/ inance/ public acceptance/ awareness/
collaboration
Time frame
Actions Targeted
Stakeholders
Actions Targeted
Stakeholders
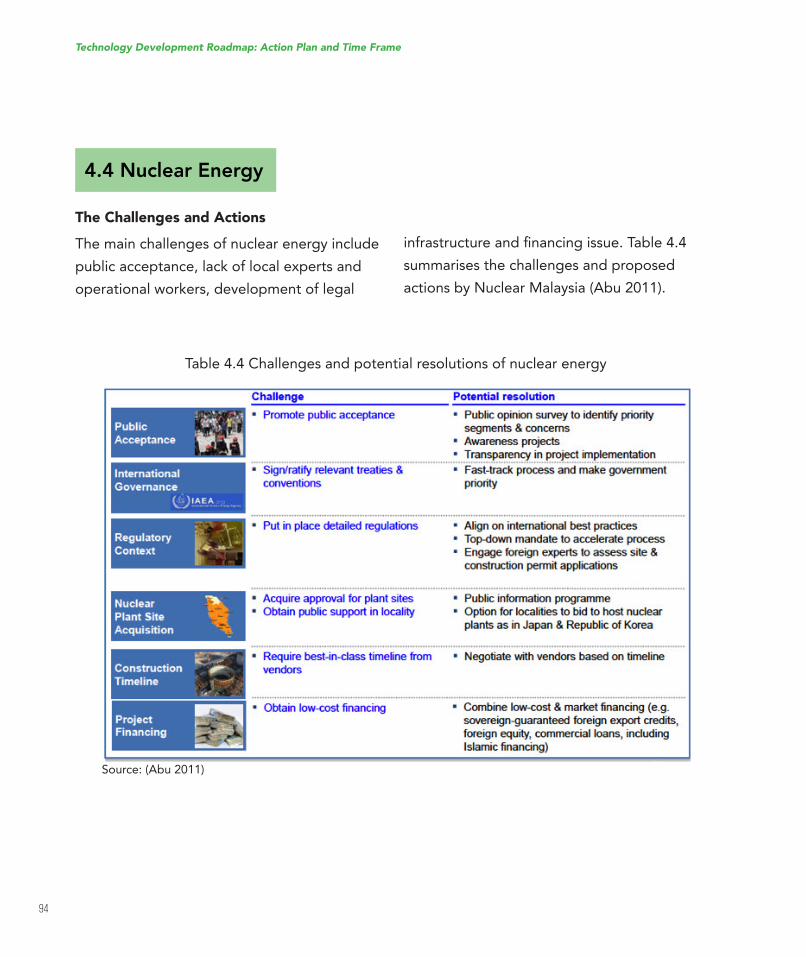
94
infrastructureandinancingissue.Table4.4summarises the challenges and proposed
actions by Nuclear Malaysia (Abu 2011).
4.4 Nuclear Energy
The Challenges and Actions
The main challenges of nuclear energy include
public acceptance, lack of local experts and
operational workers, development of legal
Table 4.4 Challenges and potential resolutions of nuclear energy
Source: (Abu 2011)
Technology Development Roadmap: Action Plan and Time Frame
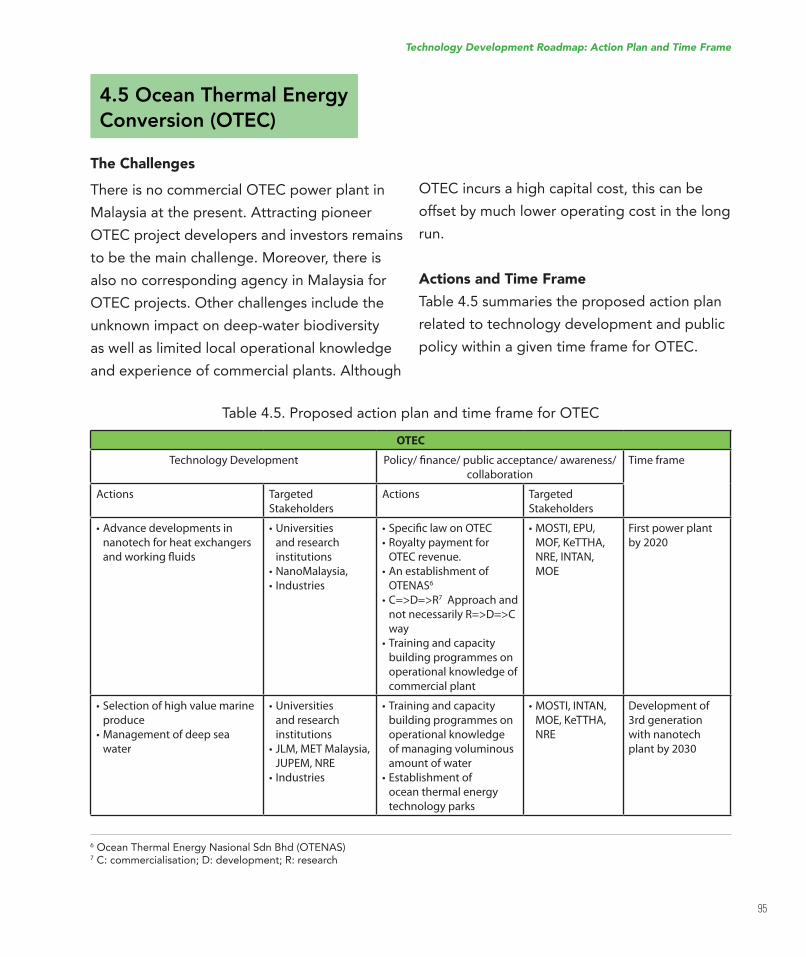
95
4.5 Ocean Thermal Energy
Conversion (OTEC)
The Challenges
There is no commercial OTEC power plant in
Malaysia at the present. Attracting pioneer
OTEC project developers and investors remains
to be the main challenge. Moreover, there is
also no corresponding agency in Malaysia for
OTEC projects. Other challenges include the
unknown impact on deep-water biodiversity
as well as limited local operational knowledge
and experience of commercial plants. Although
OTEC incurs a high capital cost, this can be
offset by much lower operating cost in the long
run.
Actions and Time Frame
Table 4.5 summaries the proposed action plan
related to technology development and public
policy within a given time frame for OTEC.
Table 4.5. Proposed action plan and time frame for OTEC
OTEC
Technology Development Policy/ inance/ public acceptance/ awareness/
collaboration
Time frame
Actions Targeted
Stakeholders
Actions Targeted
Stakeholders
• Advance developments in nanotech for heat exchangers
and working luids
• Universities and research
institutions
• NanoMalaysia, • Industries
• Speciic law on OTEC • Royalty payment for
OTEC revenue.• An establishment of
OTENAS6
• C=>D=>R7 Approach and
not necessarily R=>D=>C way
• Training and capacity building programmes on
operational knowledge of
commercial plant
• MOSTI, EPU, MOF, KeTTHA, NRE, INTAN, MOE
First power plant by 2020
• Selection of high value marine produce
• Management of deep sea water
• Universities and research
institutions
• JLM, MET Malaysia, JUPEM, NRE
• Industries
• Training and capacity building programmes on
operational knowledge
of managing voluminous
amount of water
• Establishment of ocean thermal energy
technology parks
• MOSTI, INTAN, MOE, KeTTHA, NRE
Development of
3rd generation with nanotech
plant by 2030
Technology Development Roadmap: Action Plan and Time Frame
6 Ocean Thermal Energy Nasional Sdn Bhd (OTENAS)7C:commercialisation;D:development;R:research
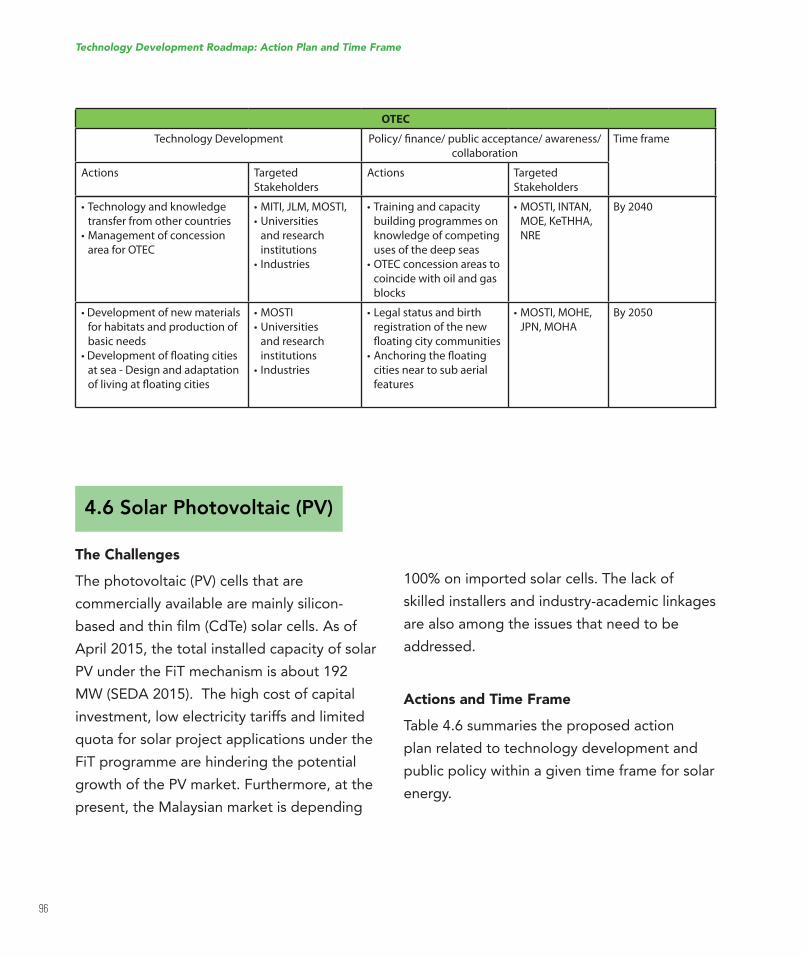
96
4.6 Solar Photovoltaic (PV)
The Challenges
The photovoltaic (PV) cells that are
commercially available are mainly silicon-
basedandthinilm(CdTe)solarcells.AsofApril 2015, the total installed capacity of solar
PV under the FiT mechanism is about 192
MW(SEDA2015).Thehighcostofcapitalinvestment, low electricity tariffs and limited
quota for solar project applications under the
FiT programme are hindering the potential
growth of the PV market. Furthermore, at the
present, the Malaysian market is depending
100% on imported solar cells. The lack of
skilled installers and industry-academic linkages
are also among the issues that need to be
addressed.
Actions and Time Frame
Table 4.6 summaries the proposed action
plan related to technology development and
public policy within a given time frame for solar
energy.
• Technology and knowledge transfer from other countries
• Management of concession area for OTEC
• MITI, JLM, MOSTI, • Universities
and research
institutions
• Industries
• Training and capacity building programmes on
knowledge of competing
uses of the deep seas
• OTEC concession areas to coincide with oil and gas
blocks
• MOSTI, INTAN, MOE, KeTHHA, NRE
By 2040
• Development of new materials for habitats and production of
basic needs
• Development of loating cities at sea - Design and adaptation
of living at loating cities
• MOSTI• Universities
and research
institutions
• Industries
• Legal status and birth registration of the new
loating city communities
• Anchoring the loating cities near to sub aerial
features
• MOSTI, MOHE, JPN, MOHA
By 2050
Technology Development Roadmap: Action Plan and Time Frame
OTEC
Technology Development Policy/ inance/ public acceptance/ awareness/
collaboration
Time frame
Actions Targeted
Stakeholders
Actions Targeted
Stakeholders
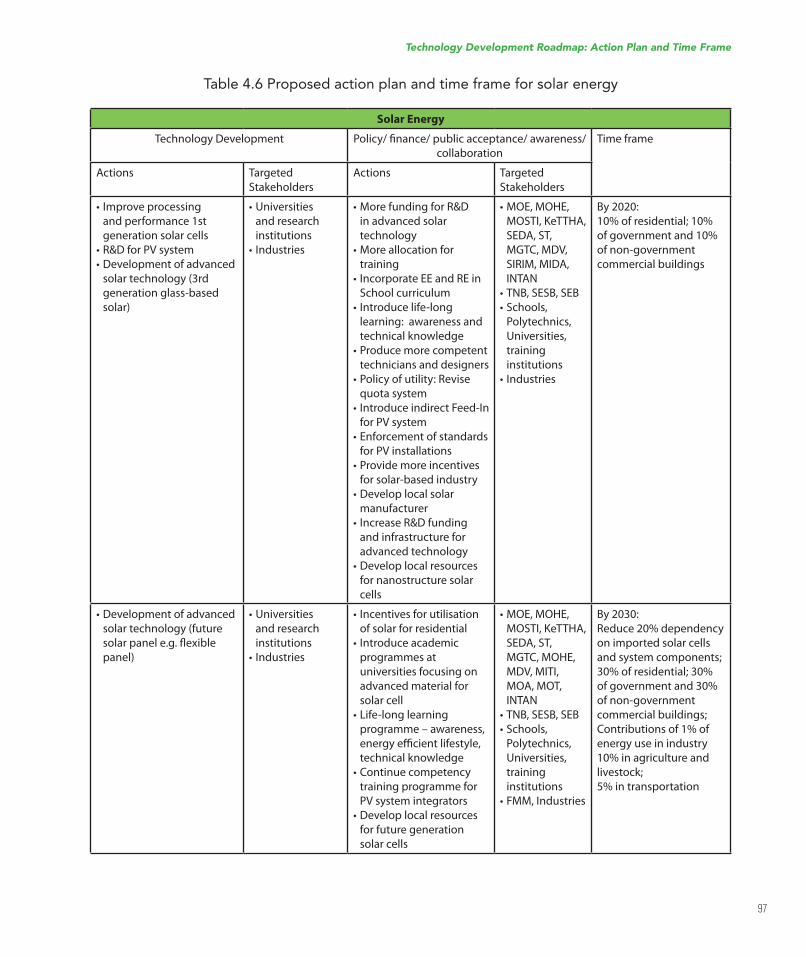
97
Table 4.6 Proposed action plan and time frame for solar energy
Solar Energy
Technology Development Policy/ inance/ public acceptance/ awareness/
collaboration
Time frame
Actions Targeted
Stakeholders
Actions Targeted
Stakeholders
• Improve processing and performance 1st generation solar cells
• R&D for PV system• Development of advanced
solar technology (3rd generation glass-based
solar)
• Universities and research
institutions
• Industries
• More funding for R&D in advanced solar
technology
• More allocation for training
• Incorporate EE and RE in School curriculum
• Introduce life-long learning: awareness and technical knowledge
• Produce more competent technicians and designers
• Policy of utility: Revise quota system
• Introduce indirect Feed-In for PV system
• Enforcement of standards for PV installations
• Provide more incentives for solar-based industry
• Develop local solar manufacturer
• Increase R&D funding and infrastructure for
advanced technology
• Develop local resources for nanostructure solar
cells
• MOE, MOHE, MOSTI, KeTTHA, SEDA, ST, MGTC, MDV, SIRIM, MIDA, INTAN
• TNB, SESB, SEB• Schools,
Polytechnics, Universities, training
institutions
• Industries
By 2020:10% of residential; 10% of government and 10% of non-government
commercial buildings
• Development of advanced solar technology (future
solar panel e.g. lexible panel)
• Universities and research
institutions
• Industries
• Incentives for utilisation of solar for residential
• Introduce academic programmes at
universities focusing on
advanced material for
solar cell
• Life-long learning programme – awareness, energy eicient lifestyle, technical knowledge
• Continue competency training programme for
PV system integrators• Develop local resources
for future generation
solar cells
• MOE, MOHE, MOSTI, KeTTHA, SEDA, ST, MGTC, MOHE, MDV, MITI, MOA, MOT, INTAN
• TNB, SESB, SEB• Schools,
Polytechnics, Universities, training
institutions
• FMM, Industries
By 2030:Reduce 20% dependency on imported solar cells
and system components;
30% of residential; 30% of government and 30% of non-government
commercial buildings;
Contributions of 1% of energy use in industry
10% in agriculture and livestock;
5% in transportation
Technology Development Roadmap: Action Plan and Time Frame
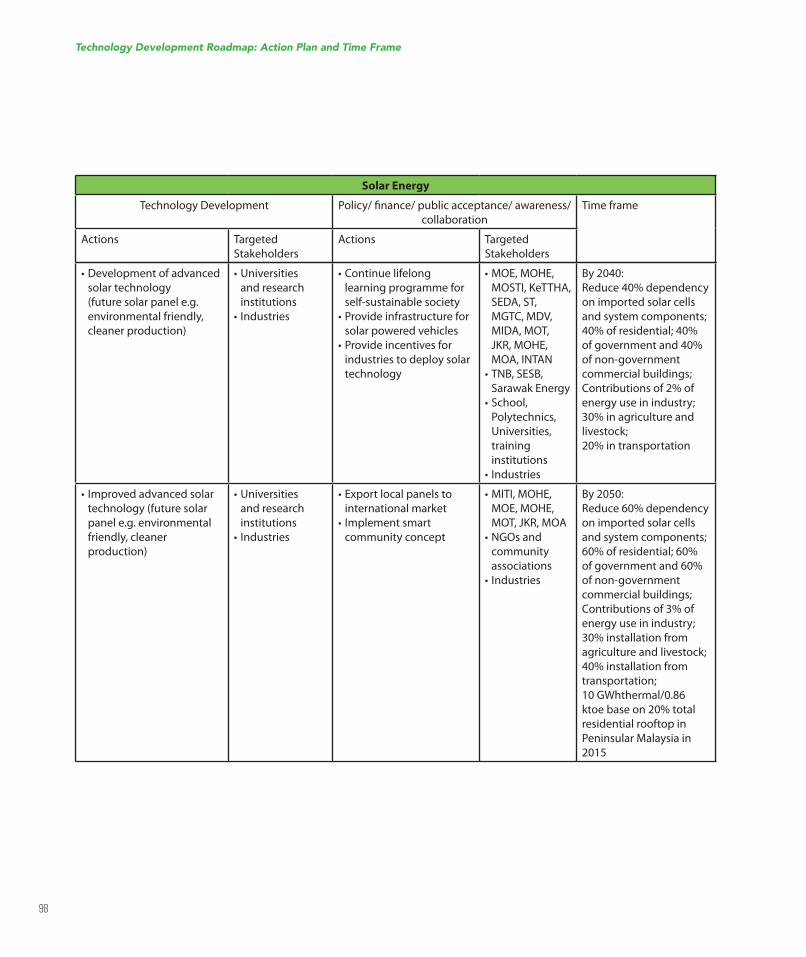
98
• Development of advanced solar technology
(future solar panel e.g. environmental friendly, cleaner production)
• Universities and research
institutions
• Industries
• Continue lifelong learning programme for
self-sustainable society
• Provide infrastructure for solar powered vehicles
• Provide incentives for industries to deploy solar
technology
• MOE, MOHE, MOSTI, KeTTHA, SEDA, ST, MGTC, MDV, MIDA, MOT, JKR, MOHE, MOA, INTAN
• TNB, SESB, Sarawak Energy
• School, Polytechnics, Universities, training
institutions
• Industries
By 2040:Reduce 40% dependency on imported solar cells
and system components;
40% of residential; 40% of government and 40% of non-government
commercial buildings;
Contributions of 2% of energy use in industry;
30% in agriculture and livestock;
20% in transportation
• Improved advanced solar technology (future solar
panel e.g. environmental friendly, cleaner production)
• Universities and research
institutions
• Industries
• Export local panels to international market
• Implement smart community concept
• MITI, MOHE, MOE, MOHE, MOT, JKR, MOA
• NGOs and community
associations
• Industries
By 2050:Reduce 60% dependency on imported solar cells
and system components;
60% of residential; 60% of government and 60% of non-government
commercial buildings;
Contributions of 3% of energy use in industry;
30% installation from agriculture and livestock;
40% installation from transportation;
10 GWhthermal/0.86 ktoe base on 20% total residential rooftop in
Peninsular Malaysia in 2015
Technology Development Roadmap: Action Plan and Time Frame
Solar Energy
Technology Development Policy/ inance/ public acceptance/ awareness/
collaboration
Time frame
Actions Targeted
Stakeholders
Actions Targeted
Stakeholders
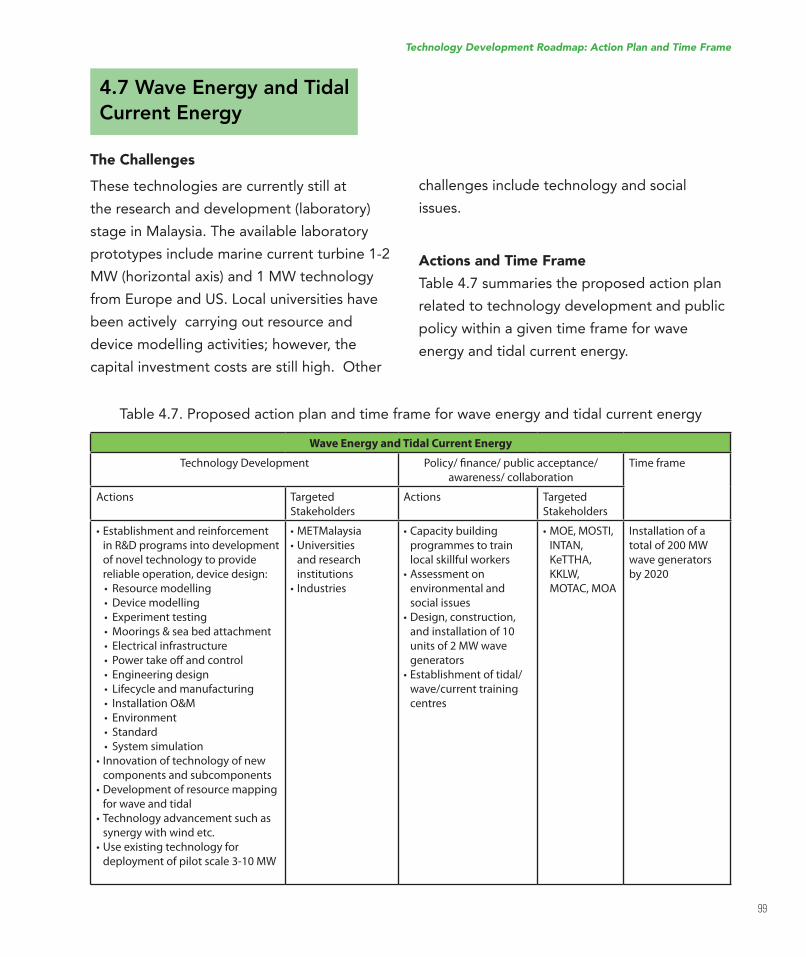
99
4.7 Wave Energy and Tidal
Current Energy
The Challenges
These technologies are currently still at
the research and development (laboratory)
stage in Malaysia. The available laboratory
prototypes include marine current turbine 1-2
MW (horizontal axis) and 1 MW technology
from Europe and US. Local universities have
been actively carrying out resource and
device modelling activities; however, the
capital investment costs are still high. Other
challenges include technology and social
issues.
Actions and Time Frame
Table 4.7 summaries the proposed action plan
related to technology development and public
policy within a given time frame for wave
energy and tidal current energy.
Table 4.7. Proposed action plan and time frame for wave energy and tidal current energy
Wave Energy and Tidal Current Energy
Technology Development Policy/ inance/ public acceptance/
awareness/ collaboration
Time frame
Actions Targeted
Stakeholders
Actions Targeted
Stakeholders
• Establishment and reinforcement in R&D programs into development of novel technology to provide
reliable operation, device design:• Resource modelling• Device modelling• Experiment testing• Moorings & sea bed attachment• Electrical infrastructure• Power take of and control• Engineering design• Lifecycle and manufacturing• Installation O&M• Environment• Standard• System simulation
• Innovation of technology of new components and subcomponents
• Development of resource mapping for wave and tidal
• Technology advancement such as synergy with wind etc.
• Use existing technology for deployment of pilot scale 3-10 MW
• METMalaysia• Universities
and research
institutions
• Industries
• Capacity building programmes to train
local skillful workers
• Assessment on environmental and
social issues
• Design, construction, and installation of 10 units of 2 MW wave generators
• Establishment of tidal/wave/current training
centres
• MOE, MOSTI, INTAN, KeTTHA, KKLW, MOTAC, MOA
Installation of a total of 200 MW wave generators
by 2020
Technology Development Roadmap: Action Plan and Time Frame
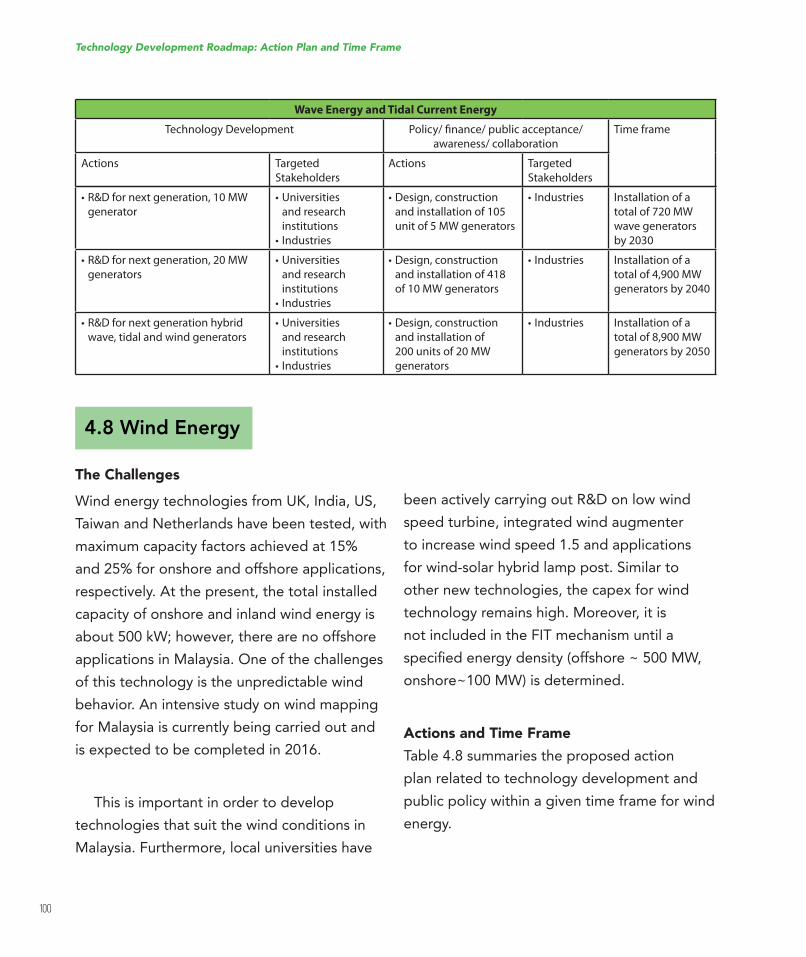
100
4.8 Wind Energy
The Challenges
WindenergytechnologiesfromUK,India,US,Taiwan and Netherlands have been tested, with
maximum capacity factors achieved at 15%
and 25% for onshore and offshore applications,
respectively. At the present, the total installed
capacity of onshore and inland wind energy is
about 500 kW; however, there are no offshore
applications in Malaysia. One of the challenges
of this technology is the unpredictable wind
behavior. An intensive study on wind mapping
for Malaysia is currently being carried out and
is expected to be completed in 2016.
This is important in order to develop
technologies that suit the wind conditions in
Malaysia. Furthermore, local universities have
beenactivelycarryingoutR&Donlowwindspeed turbine, integrated wind augmenter
to increase wind speed 1.5 and applications
for wind-solar hybrid lamp post. Similar to
other new technologies, the capex for wind
technology remains high. Moreover, it is
not included in the FIT mechanism until a
speciiedenergydensity(offshore~500MW,onshore~100 MW) is determined.
Actions and Time Frame
Table 4.8 summaries the proposed action
plan related to technology development and
public policy within a given time frame for wind
energy.
• R&D for next generation, 10 MW generator
• Universities and research
institutions
• Industries
• Design, construction and installation of 105 unit of 5 MW generators
• Industries Installation of a total of 720 MW wave generators
by 2030
• R&D for next generation, 20 MW generators
• Universities and research
institutions
• Industries
• Design, construction and installation of 418 of 10 MW generators
• Industries Installation of a total of 4,900 MW generators by 2040
• R&D for next generation hybrid wave, tidal and wind generators
• Universities and research
institutions
• Industries
• Design, construction and installation of
200 units of 20 MW generators
• Industries Installation of a total of 8,900 MW generators by 2050
Technology Development Roadmap: Action Plan and Time Frame
Wave Energy and Tidal Current Energy
Technology Development Policy/ inance/ public acceptance/
awareness/ collaboration
Time frame
Actions Targeted
Stakeholders
Actions Targeted
Stakeholders
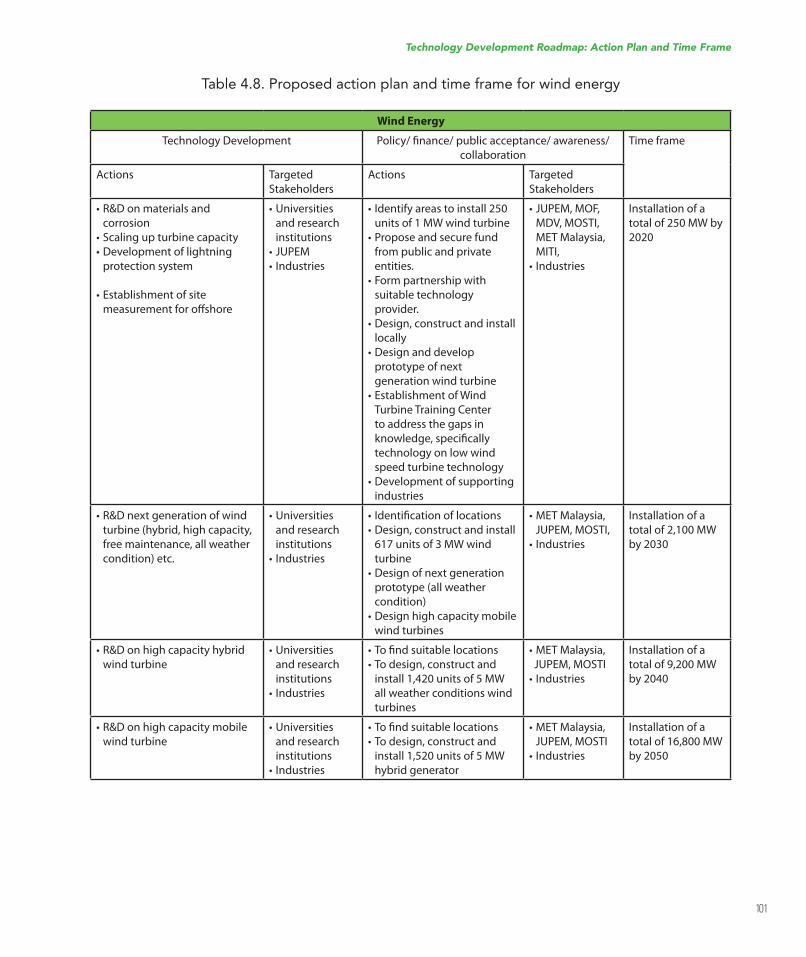
101
Table 4.8. Proposed action plan and time frame for wind energy
Wind Energy
Technology Development Policy/ inance/ public acceptance/ awareness/
collaboration
Time frame
Actions Targeted
Stakeholders
Actions Targeted
Stakeholders
• R&D on materials and corrosion
• Scaling up turbine capacity• Development of lightning
protection system
• Establishment of site measurement for ofshore
• Universities and research
institutions
• JUPEM• Industries
• Identify areas to install 250 units of 1 MW wind turbine
• Propose and secure fund from public and private
entities.• Form partnership with
suitable technology
provider.• Design, construct and install
locally
• Design and develop prototype of next
generation wind turbine
• Establishment of Wind Turbine Training Center to address the gaps in
knowledge, speciically technology on low wind
speed turbine technology
• Development of supporting industries
• JUPEM, MOF, MDV, MOSTI, MET Malaysia, MITI,
• Industries
Installation of a total of 250 MW by 2020
• R&D next generation of wind turbine (hybrid, high capacity, free maintenance, all weather condition) etc.
• Universities and research
institutions
• Industries
• Identiication of locations• Design, construct and install
617 units of 3 MW wind turbine
• Design of next generation prototype (all weather
condition)
• Design high capacity mobile wind turbines
• MET Malaysia, JUPEM, MOSTI,
• Industries
Installation of a total of 2,100 MW by 2030
• R&D on high capacity hybrid wind turbine
• Universities and research
institutions
• Industries
• To ind suitable locations• To design, construct and
install 1,420 units of 5 MW all weather conditions wind
turbines
• MET Malaysia, JUPEM, MOSTI• Industries
Installation of a total of 9,200 MW by 2040
• R&D on high capacity mobile wind turbine
• Universities and research
institutions
• Industries
• To ind suitable locations• To design, construct and
install 1,520 units of 5 MW hybrid generator
• MET Malaysia, JUPEM, MOSTI
• Industries
Installation of a total of 16,800 MW by 2050
Technology Development Roadmap: Action Plan and Time Frame
102
4.9 Fuel Cell and Hydrogen
Energy
The Challenges
Fuel cell and hydrogen technologies are still
mainly at the research and development stage
in Malaysia. A small industry exists to cater
to the needs of research institutions but is
not strong enough to provide a supportive
environment for potential stakeholders, and
investors.
The basic mechanism for deployment of
the fuel cell and hydrogen energy industries
were put in place by the relevant government
agencies but the lack of incentives to attract
businessownersandendusers/customershave prevented a meaningful nationwide
implementation of fuel cell and hydrogen
energy projects. Other challenges include lack
of awareness of the importance of fuel cell and
hydrogen energy, high cost for imported raw
materials, minimal capacity building efforts,
and technological barriers due to intellectual
property constraints.
Actions and Time Frame
Table 4.9 summaries the proposed action plan
related to technology development and public
policy within a given time frame for fuel cell
and hydrogen energy.
Technology Development Roadmap: Action Plan and Time Frame
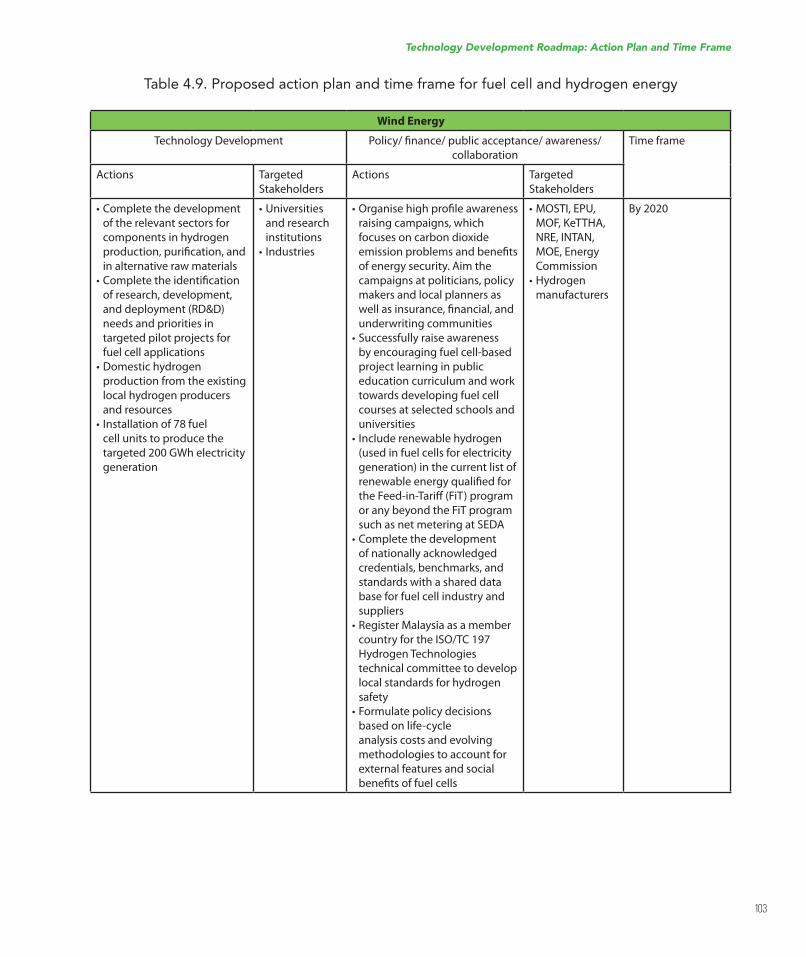
103
Table 4.9. Proposed action plan and time frame for fuel cell and hydrogen energy
Wind Energy
Technology Development Policy/ inance/ public acceptance/ awareness/
collaboration
Time frame
Actions Targeted
Stakeholders
Actions Targeted
Stakeholders
• Complete the development of the relevant sectors for
components in hydrogen
production, puriication, and in alternative raw materials
• Complete the identiication of research, development, and deployment (RD&D) needs and priorities in
targeted pilot projects for fuel cell applications
• Domestic hydrogen production from the existing
local hydrogen producers
and resources
• Installation of 78 fuel cell units to produce the
targeted 200 GWh electricity generation
• Universities and research
institutions
• Industries
• Organise high proile awareness raising campaigns, which focuses on carbon dioxide
emission problems and beneits
of energy security. Aim the campaigns at politicians, policy makers and local planners as
well as insurance, inancial, and underwriting communities
• Successfully raise awareness by encouraging fuel cell-based
project learning in public education curriculum and work
towards developing fuel cell
courses at selected schools and
universities
• Include renewable hydrogen (used in fuel cells for electricity
generation) in the current list of
renewable energy qualiied for the Feed-in-Tarif (FiT) program or any beyond the FiT program such as net metering at SEDA
• Complete the development of nationally acknowledged
credentials, benchmarks, and standards with a shared data
base for fuel cell industry and
suppliers
• Register Malaysia as a member country for the ISO/TC 197 Hydrogen Technologies technical committee to develop
local standards for hydrogen
safety
• Formulate policy decisions based on life-cycle
analysis costs and evolving
methodologies to account for
external features and social
beneits of fuel cells
• MOSTI, EPU, MOF, KeTTHA, NRE, INTAN, MOE, Energy Commission
• Hydrogen manufacturers
By 2020
Technology Development Roadmap: Action Plan and Time Frame
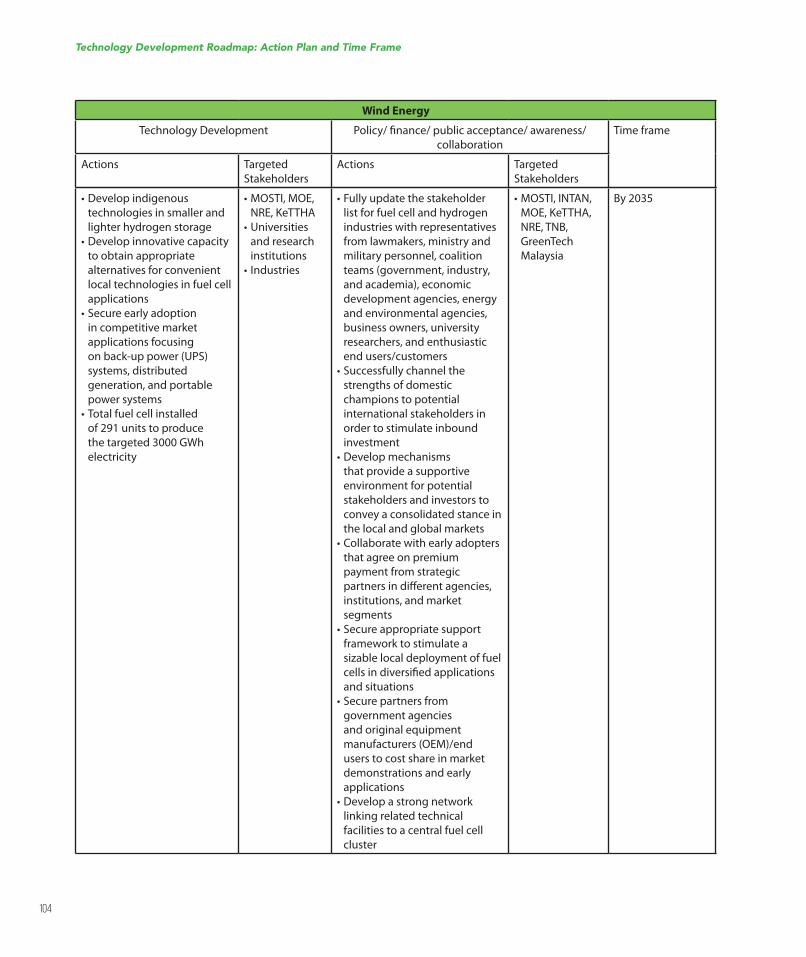
104
• Develop indigenous technologies in smaller and
lighter hydrogen storage
• Develop innovative capacity to obtain appropriate
alternatives for convenient
local technologies in fuel cell
applications
• Secure early adoption in competitive market
applications focusing
on back-up power (UPS) systems, distributed generation, and portable power systems
• Total fuel cell installed of 291 units to produce the targeted 3000 GWh electricity
• MOSTI, MOE, NRE, KeTTHA
• Universities and research
institutions
• Industries
• Fully update the stakeholder list for fuel cell and hydrogen
industries with representatives
from lawmakers, ministry and military personnel, coalition teams (government, industry, and academia), economic development agencies, energy and environmental agencies, business owners, university researchers, and enthusiastic end users/customers
• Successfully channel the strengths of domestic
champions to potential
international stakeholders in
order to stimulate inbound
investment
• Develop mechanisms that provide a supportive
environment for potential
stakeholders and investors to
convey a consolidated stance in
the local and global markets
• Collaborate with early adopters that agree on premium
payment from strategic
partners in diferent agencies, institutions, and market segments
• Secure appropriate support framework to stimulate a
sizable local deployment of fuel cells in diversiied applications
and situations
• Secure partners from government agencies
and original equipment manufacturers (OEM)/end users to cost share in market
demonstrations and early
applications
• Develop a strong network linking related technical
facilities to a central fuel cell
cluster
• MOSTI, INTAN, MOE, KeTTHA, NRE, TNB, GreenTech
Malaysia
By 2035
Technology Development Roadmap: Action Plan and Time Frame
Wind Energy
Technology Development Policy/ inance/ public acceptance/ awareness/
collaboration
Time frame
Actions Targeted
Stakeholders
Actions Targeted
Stakeholders
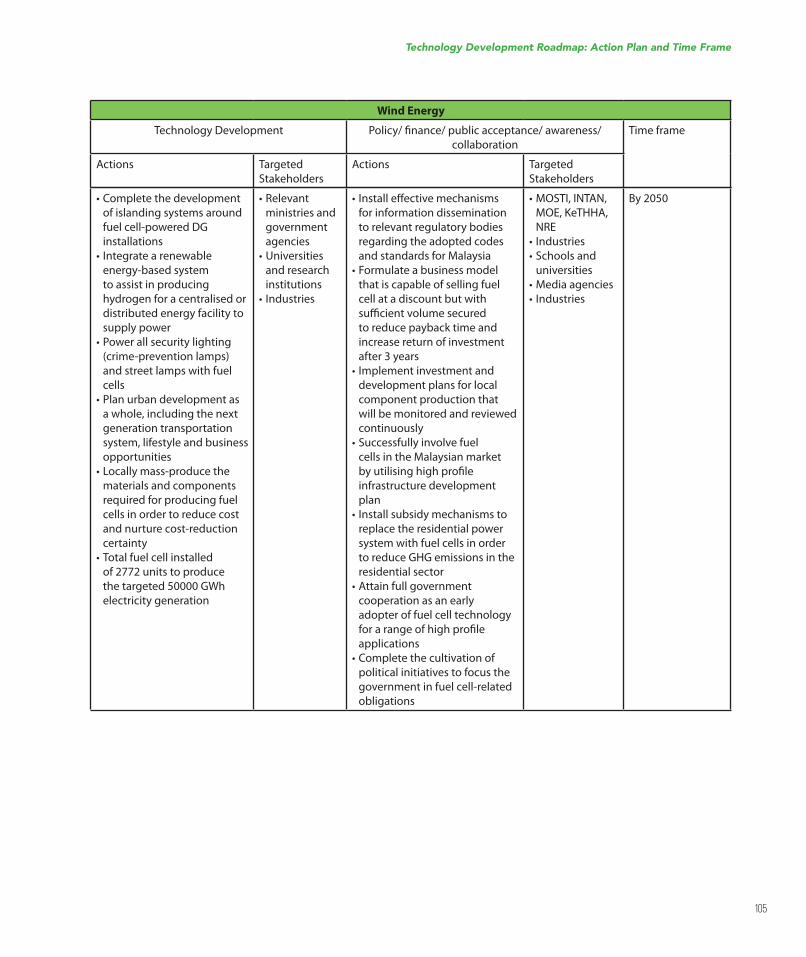
105
• Complete the development of islanding systems around
fuel cell-powered DG
installations
• Integrate a renewable energy-based system
to assist in producing
hydrogen for a centralised or
distributed energy facility to
supply power
• Power all security lighting (crime-prevention lamps)
and street lamps with fuel
cells
• Plan urban development as a whole, including the next generation transportation
system, lifestyle and business opportunities
• Locally mass-produce the materials and components
required for producing fuel cells in order to reduce cost
and nurture cost-reduction
certainty
• Total fuel cell installed of 2772 units to produce the targeted 50000 GWh electricity generation
• Relevant ministries and
government
agencies
• Universities and research
institutions
• Industries
• Install efective mechanisms for information dissemination
to relevant regulatory bodies
regarding the adopted codes
and standards for Malaysia• Formulate a business model
that is capable of selling fuel
cell at a discount but with
suicient volume secured
to reduce payback time and
increase return of investment
after 3 years• Implement investment and
development plans for local
component production that
will be monitored and reviewed
continuously
• Successfully involve fuel cells in the Malaysian market by utilising high proile
infrastructure development
plan
• Install subsidy mechanisms to replace the residential power
system with fuel cells in order
to reduce GHG emissions in the residential sector
• Attain full government cooperation as an early
adopter of fuel cell technology
for a range of high proile
applications
• Complete the cultivation of political initiatives to focus the
government in fuel cell-related
obligations
• MOSTI, INTAN, MOE, KeTHHA, NRE
• Industries• Schools and
universities
• Media agencies• Industries
By 2050
Technology Development Roadmap: Action Plan and Time Frame
Wind Energy
Technology Development Policy/ inance/ public acceptance/ awareness/
collaboration
Time frame
Actions Targeted
Stakeholders
Actions Targeted
Stakeholders

106
Chapter 5
Conclusions and Key Messages to Decision
Makers
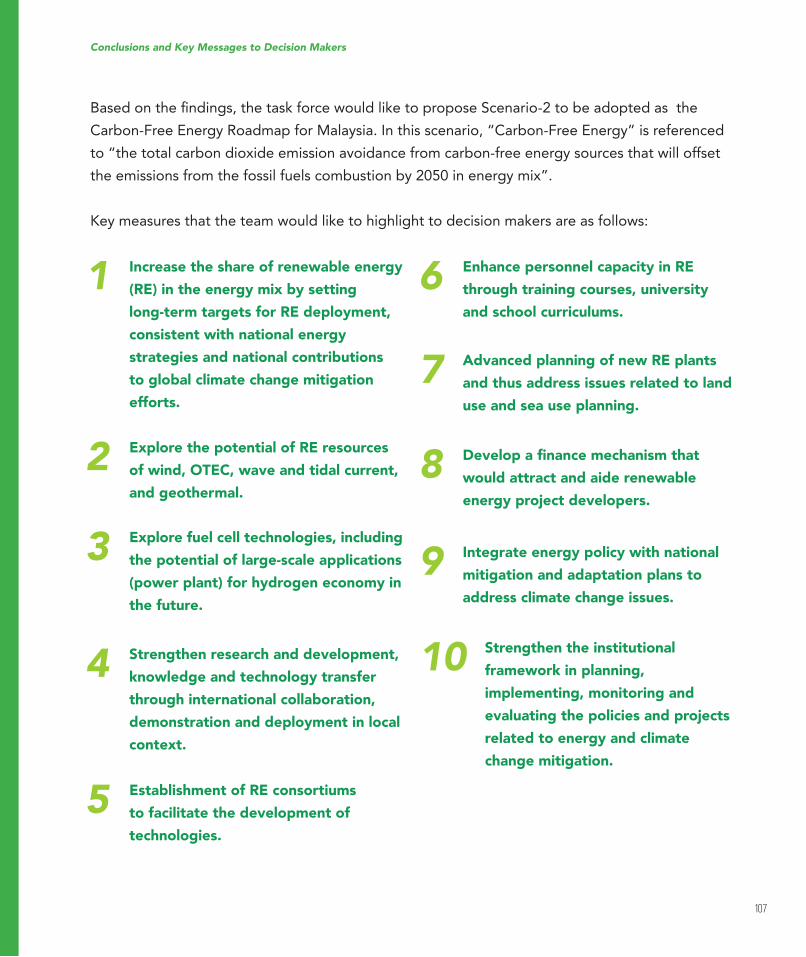
107
Basedontheindings,thetaskforcewouldliketoproposeScenario-2tobeadoptedastheCarbon-Free Energy Roadmap for Malaysia. In this scenario, “Carbon-Free Energy” is referenced
to “the total carbon dioxide emission avoidance from carbon-free energy sources that will offset
the emissions from the fossil fuels combustion by 2050 in energy mix”.
Keymeasuresthattheteamwouldliketohighlighttodecisionmakersareasfollows:
Conclusions and Key Messages to Decision Makers
1 6
7
8
9
10
2
3
4
5
Increase the share of renewable energy
(RE) in the energy mix by setting
long-term targets for RE deployment,
consistent with national energy
strategies and national contributions
to global climate change mitigation
efforts.
Enhance personnel capacity in RE
through training courses, university
and school curriculums.
Advanced planning of new RE plants
and thus address issues related to land
use and sea use planning.
Develop a inance mechanism that would attract and aide renewable
energy project developers.
Integrate energy policy with national
mitigation and adaptation plans to
address climate change issues.
Strengthen the institutional
framework in planning,
implementing, monitoring and
evaluating the policies and projects
related to energy and climate
change mitigation.
Explore the potential of RE resources
of wind, OTEC, wave and tidal current,
and geothermal.
Explore fuel cell technologies, including
the potential of large-scale applications
(power plant) for hydrogen economy in
the future.
Strengthen research and development,
knowledge and technology transfer
through international collaboration,
demonstration and deployment in local
context.
Establishment of RE consortiums
to facilitate the development of
technologies.
108
References
2012, Letter to the Editor. An analysis of wind power
density derived from several wind speed density
functions: the regional assessment on wind power in
Malaysia’, Renewable and Sustainable Energy Reviews,
pp. 6476-6487.
Abe,K.,Nishidab,M.,Sakuraia,A.,Ohya,Y.,Kiharaa,H.,et al. 2005. ‘Experimental and numerical investigations
oflowieldsbehindasmallwindturbinewithalangeddiffuser’, Journal of Wind Engineering and Industria
Aerodynamic, vol. 93, pp. 951-970.
AliashimAlbani,MohdZamriIbrahim,&K.H.Yong2013,‘WindenergyinvestigationinnorthernpartofKudat,Malaysia’, International Journal of Engineering and
Applied Sciences, vol. 2.
AyuWaziraAzhari,KamaruzzamanSopian,AzamiZaharim & Mohamad Al Ghoul 2008, ‘A new approach
for predicting solar radiation in tropical environment
using satellite images - Case study of Malaysia’, WSEAS
Transactions on Environment and Development, vol. 4,
no.4, pp. 373-378.
Energy Commission 2012, National Energy Balance 2012.
EPU 2015, ‘Strategy Paper 17: Sustainable Usage of
Energy to Support Growth’. Economic Planning Unit,
Putrajaya.
Haliza Abdul Rahman 2013, ‘Incinerator In Malaysia:
Reallyneeds?’,InternationalJournalofChemical,Environmental&BiologicalSciences(IJCEBS),vol.1,no.4, pp. 678–681.
Haslenda Hashim & S.W. Ho 2011, ‘Renewable energy
policies and initiatives for a sustainable energy future in
Malaysia’, Renewable and Sustainable Energy Reviews,
vol. 15, pp. 4780-4787.
IbrahimDincer2008,‘Hydrogenandfuelcelltechnologiesfor sustainable future’, Jordan Journal of Mechanical and
Industrial Engineering, vol. 2, no. 1, pp.1-14.
IEA 2011, Technology Roadmap China Wind Energy
Development Roadmap 2050.
IEA 2013, IEA-PVPS Report 2013.
IEA 2013, Southeast Asia Energy Outlook.
109
IEA 2015, ‘World Energy Outlook Special Report: Energy
and Climate Change’. International Energy Agency, Paris.
KamaruzzamanSopian&MohdYusofHj.Othman1992,‘Estimates of daily average global solar radiation in
Malaysia’, Renewable Energy, vol. 2, no. 3, pp. 319-325.
KamaruzzamanSopian&TamerKhatib2013,‘Windenergy potential in nine coastal sites in Malaysia’,
Palestine Technical University Research Journal, vol. 1,
no.1, pp. 10-15.
KamaruzzamanSopian,MohdYusofOthman,&Amiruddin Wirsat 1995, ’The wind energy potential of
Malaysia’, Renewable Energy, vol. 6, no. 8, pp. 1005-16.
KeTTHA2008,NationalRenewableEnergyPolicy&Action Plan.
KeTTHA2008,NationalRenewableEnergyPolicy&Action Plan.
KeTTHA2009,NationalGreenTechnologyPolicy.
KhalidMohamedNor,MohamedShaaban,&HasimahAbdul Rahman 2014, ‘Feasibility assessment of wind
energy resource in Malaysia based on NWP models’,
Renewable Energy, vol. 62, pp. 147-154.
Mohamad Puad Haji Abu 2011, ‘The progress of nuclear
power programme in Malaysia’, In INPRO Dialogue
Forum on Nuclear Energy Innovations: Common User
Consideration for Small and Medium-sized Nuclear PR,
Vienna.
Nurulkamal Masseran, Ahmad Mahir Razali,
KamarulzamanIbrahim,WanZawiahWanZin&Azami Zaharim 2012, ‘On spatial analysis of wind
energy potential in Malaysia’, WSEAS Transactions on
Mathematics., vol. 11, no.6, pp. 451-461.
Ohya,Y.,T.Karasidani,A.Sakurai,K.Abe,&M.Inoue2008,‘Developmentofshroudedwindturbinewithlangeddiffuser’,Wind Engineering and Industrial
Aerodynamics, vol. 96, pp. 524-539.
PEMANDU,P.M.&D.U.2014,Economic Transformation
Programme: 2013 Annual Report.Retrievedfromhttp://etp.pemandu.gov.my/annualreport2013/upload/ENG/ETP2013_ENG_full_version.pdf
KrishnakumarRajagopalan&GerardC.Nihous2013,‘Anassessment of global ocean thermal energy conversion
resources with high-resolution ocean general circulation
model’, Journal of Energy Resources Technology, vol.
135/041.Retrievedfromhttp://hinmrec.hnei.hawaii.edu/wp-content/uploads/2010/01/Global-OTEC-Resources_2013.pdf.
Rajkumar,R.K.,V.K.Ramachandaramurthy,B.L.Yong,&D.B.Chia2011,‘Techno-economicaloptimizationofhybridPV/wind/batterysystemusingNeuro-Fuzzy’,Energy, vol. 36, pp. 5148-5153.
Rozario, M. 2013, National Biomass Strategy 2020: New
wealth creation for Malaysia’s palm oil industry. Agensi
Inovasi,Malaysia,KualaLumpur.Retrievedfromhttp://scholar.google.com/scholar?hl=en&btnG=Search&q=intitle:National+Biomass+Strategy+2020+:+New+wealth+cre
ation+for+Malaysia+’+s+biomass+industry#0
References
110
SEDA.Operational Plants.Retrievedfromhttp://seda.gov.my/?omaneg=00010100000001010101000100001000000000000000000000&s=539
ShainiMohdShaie,T.MIndraMahlia,MasjukiHajiHassan & Andri Andriyana 2011, ‘Current energy usage
and sustainable energy in Malaysia: A review’, Renewable
and Sustainable Energy Reviews, vol. 15, pp. 4370-4377.
SyarifahNorFarihahTuanHabib,&AbdulYaminSaad2009, Environmental Ranking Considerations for Setting
up A Recuperative Energy Incinerator, 5, 64–73.
UniMAP Performance of wind turbine based on wind
speedinKangar,NorthernMalaysia.Retrievedfromhttp://www.unimap.edu.my/index.php/jurnal-artikel-penyelidikan-terpilih/performance-of-wine-turbine-based-on-wind-speed-in-kangar,-northern-malaysia US EPA.
GreenhouseGasEquivalenciesCalculator.http://www.epa.gov/cleanenergy/energy-resources/calculator.html
USEPA.http://www.epa.gov/cleanenergy/energy-resources/calculator.html
USPublicLaw96-310,Section9,17July1980,94Statute946.http://uscode.house.gov/download/pls/42C98.txt.
W.T,Chong,AhmadFazlizan,S.C.Poh,K.C.Pan,&H.W.Ping 2012, ‘Early development of an innovative building
integrated wind, Solar and Rain water harvester for Urban
High Rise Application’, Energy and Building, vol. 47, pp.
201-207.
W.T.Chong,AhmadFazlizan,S.C.Poh,K.C.Pan,W.P.Hew, & F.B. Hsiao 2013a, ‘The design, simulation and
testing of an urban vertical axis wind turbine with the
omni-direction-guide-van’, Applied Energy, vol. 112, pp.
601-609.
W.T.Chong,S.C.Poh,AhmadFazlizan,S.Y.Yip,C.K.Chang, & W.P. Hew 2013c, ‘Early development of an
energy recovery wind turbine for exhaust air system’,
Applied Energy, vol. 112, pp. 568-575.
W.T.Chong,S.C.Poh,AhmadFazlizan,SookYee,Y.,M.H.Koay,&W.P.Hew2013b,‘Exhaustairenergyrecoverysystem for electrical power generation in future green
cities’, International Journal of Precision Engineering and
Manufacturing, vol. 14, no. 6, pp. 1029-1035.
W.T., Chong, M.S. Naghavi, S.C. Poh, T.M.I. Mahilia, &
K.C.Pan2011,‘Techno-economicanalysisofawind-solarhybrid renewable energy system with rainwater collection
feature for urban high-rise application’, Applied Energy,
vol.88,pp.4067-4077.WorldNuclearAssociation,http://www.world-nuclear.org/
References

111

AKADEMI SAINS MALAYSIA
Tingkat 20, Sayap barat, Menara MATRADEJalan Sultan Haji Ahmad Shah of Jalan Tuanku Abdul Halim50480 Kuala Lumpur.Tel: 03-6203 0633 Fax: 03-6203 0634E-mail: [email protected]