Embed Size (px)
Citation preview

OF SUSTA INABLE FOREST MANAGEMENT IN
CANADA
National Status 2000
Canadian Councilof ForestMinisters
Conseil canadiendes ministresdes forêts

ALBERTAThe Honourable Halvar C. Jonson Minister of EnvironmentGovernment of AlbertaRoom 228, Legislature Building10800 - 97 AvenueEdmonton,ABT5K 2B6E-mail: not provided
BRITISH COLUMBIAThe Honourable Jim DoyleMinister of ForestsGovernment of British ColumbiaRoom 128, Parliament Building 1460 Government StreetVictoria, BCV8V 1X4E-mail: [email protected]
MANITOBAThe Honourable Oscar LathlinMinister of ConservationGovernment of Manitoba333 - 450 Legislative Building Winnipeg, MBR3C 0V8E-mail: [email protected]
NEW BRUNSWICKThe Honourable Jeannot VolpéMinister of Natural Resources and EnergyGovernment of New BrunswickHugh John Fleming Forestry ComplexRegent Street Extension P.O. Box 6000Fredericton, NBE3B 5H1E-mail: [email protected]
NEWFOUNDLAND ANDLABRADORThe Honourable Kevin Aylward Minister of Forest Resources and
Agrifoods Government of Newfoundland and
Labrador5th Floor, Natural Resources BuildingP.O. Box 8700, 50 Elizabeth AvenueSt. John's, NFA1B 4J6E-mail: [email protected]
NORTHWEST TERRITORIESThe Honourable Stephen KakfwiMinister of Resources,Wildlife and
Economic DevelopmentGovernment of the Northwest Territories2nd floor, Legislative AssemblyP.O. Box 1320Yellowknife, NTX1A 2L9E-mail: [email protected]
NOVA SCOTIAThe Honourable Ernest FageMinister of Natural ResourcesGovernment of Nova ScotiaFounder's Square 1701 Hollis StreetP.O. Box 698Halifax, NSB3J 2T9E-mail: [email protected]
NUNAVUTThe Honourable Peter KilabukMinister of Sustainable DevelopmentGovernment of NunavutBag 800Iqaluit, NTX0A 0H0E-mail: [email protected]
ONTARIOThe Honourable John C. SnobelenMinister of Natural ResourcesGovernment of OntarioRoom 6630,Whitney Block99 Wellesley Street WestToronto, ONM7A 1W3E-mail: [email protected]
PRINCE EDWARD ISLANDThe Honourable Mitch Murphy Minister of Agriculture and ForestryGovernment of Prince Edward Island5th floor, Jones Building11 Kent StreetP.O. Box 2000Charlottetown, PEC1A 7N8E-mail: [email protected]
QUEBECThe Honourable Jacques BrassardMinistre d’État des
Ressources naturellesGouvernement du QuébecBureau A-308, 5700, 4e avenue ouestCharlesbourg, QCG1H 6R1E-mail: Jacques.Brassard/depute/[email protected]
SASKATCHEWANThe Honourable Buckley BelangerMinister of Environment and Resource
ManagementGovernment of SaskatchewanRoom 43, Legislative BuildingRegina, SKS4S 0B3E-mail: [email protected]
YUKONThe Honourable Eric FaircloughMinister of Renewable ResourcesGovernment of the Yukon Territory2071 2nd AvenueP.O. Box 2703Whitehorse,YKY1A 2C6E-mail: [email protected]
CANADAThe Honourable Ralph E. Goodale Minister of Natural Resources Government of CanadaRoom 322,West BlockHouse of CommonsOttawa, ONK1A 0A6 E-mail: [email protected]
CANADIAN COUNCIL OF FOREST MINISTERS (CCFM)

Canadian Councilof ForestMinisters
Conseil canadiendes ministresdes forêts
OF SUSTA INABLE FOREST MANAGEMENT IN
CANADA
N a t i o n a l S t a t u s 2 0 0 0
© Canadian Council of Forest Ministers 2000
ISBN 0-662-28705-3
Cat. F075-3/6-2000E
Copies of this publication may be obtained free of charge from:
Natural Resources Canada–Canadian Forest Service6th floor, 580 Booth StreetOttawa, ON K1A 0E4Telephone: (613) 947-7341Fax: (613) 947-7396Email: [email protected]
For your convenience, this document is available on the Internet at:
<http://www.ccfm.org/pi/4_e.html>
Issued also in French under the title: Critères et indicateurs de l’aménagement durable des forêts au Canada :Bilan national 2000
Printed on recycled paper Printed in Canada

INTRODUCTION . . . . . . . . . . . . . . . . . . . . . . . . . . . . . . . . . . . . . . . . . . . . . . . . . . . . . . II
OVERVIEW OF CANADA’S MAJOR FORESTED ECOZONES . . . . . . . . . . . . . . . . . . . . . . . . . . . . . . . V
CONSERVATION OF BIOLOGICAL DIVERSITYELEMENT 1.1 ECOSYSTEM DIVERSITY . . . . . . . . . . . . . . . . . . . . . . . . . . . . . . . . . . . . .1
ELEMENT 1.2 SPECIES DIVERSITY . . . . . . . . . . . . . . . . . . . . . . . . . . . . . . . . . . . . . . . .9
MAINTENANCE AND ENHANCEMENT OF FOREST ECOSYSTEM CONDITION AND PRODUCTIVITYELEMENT 2.1 INCIDENCE OF DISTURBANCE AND STRESS . . . . . . . . . . . . . . . . . . . .21
ELEMENT 2.2 ECOSYSTEM RESILIENCE . . . . . . . . . . . . . . . . . . . . . . . . . . . . . . . . . . .31
ELEMENT 2.3 EXTANT BIOMASS . . . . . . . . . . . . . . . . . . . . . . . . . . . . . . . . . . . . . . . .33
CONSERVATION OF SOIL AND WATER RESOURCESELEMENT 3.2 POLICY AND PROTECTION FOREST FACTORS . . . . . . . . . . . . . . . . . . .37
FOREST ECOSYSTEM CONTRIBUTIONS TO GLOBAL ECOLOGICAL CYCLESELEMENT 4.1 CONTRIBUTIONS TO GLOBAL CARBON BUDGET . . . . . . . . . . . . . . . .45
ELEMENT 4.2 FOREST LAND CONVERSION . . . . . . . . . . . . . . . . . . . . . . . . . . . . . . . .49
ELEMENT 4.3 FOREST SECTOR CARBON DIOXIDE CONSERVATION . . . . . . . . . . . . .53
ELEMENT 4.4 FOREST SECTOR POLICY FACTORS . . . . . . . . . . . . . . . . . . . . . . . . . . .57
ELEMENT 4.5 CONTRIBUTIONS TO HYDROLOGICAL CYCLES . . . . . . . . . . . . . . . . .65
MULTIPLE BENEFITS OF FORESTS TO SOCIETYELEMENT 5.1 PRODUCTIVE CAPACITY . . . . . . . . . . . . . . . . . . . . . . . . . . . . . . . . . . .69
ELEMENT 5.2 COMPETITIVENESS OF RESOURCE INDUSTRIES . . . . . . . . . . . . . . . . . .77
ELEMENT 5.3 CONTRIBUTION TO THE NATIONAL ECONOMY . . . . . . . . . . . . . . . . .81
ELEMENT 5.4 NON-TIMBER VALUES . . . . . . . . . . . . . . . . . . . . . . . . . . . . . . . . . . . . . .85
ACCEPTING SOCIETY’S RESPONSIBILITY FOR SUSTAINABLE DEVELOPMENTELEMENT 6.1 ABORIGINAL AND TREATY RIGHTS . . . . . . . . . . . . . . . . . . . . . . . . . . .91
ELEMENT 6.2 PARTICIPATION BY ABORIGINAL COMMUNITIES IN SUSTAINABLE
FOREST MANAGEMENT . . . . . . . . . . . . . . . . . . . . . . . . . . . . . . . . . . . .95
ELEMENT 6.3 SUSTAINABILITY OF FOREST COMMUNITIES . . . . . . . . . . . . . . . . . . . .99
ELEMENT 6.4 FAIR AND EFFECTIVE DECISION-MAKING . . . . . . . . . . . . . . . . . . . . .105
ELEMENT 6.5 INFORMED DECISION-MAKING . . . . . . . . . . . . . . . . . . . . . . . . . . . . .111
CONCLUSIONS . . . . . . . . . . . . . . . . . . . . . . . . . . . . . . . . . . . . . . . . . . . . . . . . . . . . . . . . . . . .115
APPENDICES . . . . . . . . . .. . . . . . . . . . . . . . . . . . . . . . . . . . . . . . . . . . . . . . . . . . . . . . . . . . . .116
ACKNOWLEDGEMENTS . . . . . . . . . . . . . . . . . . . . . . . . . . . . . . . . . . . . . . . . . . . . . . . . . . . . .118
GLOSSARY . . . . . . . . . . . . . . . . . . . . . . . . . . . . . . . . . . . . . . . . . . . . . . . . . . . . .119
TERRESTRIAL ECOZONES MAP (Tear-out insert)
FRAMEWORK (Tear-out insert)
READER FEEDBACK CARD (Tear-out off cover)
6
5
4
3
2
1
TABLE OFCONTENTS

National Status 2000 is a first attempt to report on sustainable forest management using the CanadianCouncil of Forest Ministers’ (CCFM) framework of criteria and indicators (C&I).The publication willfacilitate knowledgeable domestic and international dialogue on sustainable forest management in
Canada. It fulfills national and international commitments to report on the state of Canada’s forests using ascience-based framework of criteria and indicators. The report uses the best available information, whichconsists of limited detailed coverage of all forests in Canada, but represents realistic aggregated informationon timber-related values for forest productive land.Where national coverage is not available, representativecase studies are presented. Data sources includeexisting national data bases and aggregated provincialand territorial data. A total of 62 indicators arediscussed, under 49 indicator reports.
Six chapters address the six criteria that Canadianshave identified as essential components of sustainableforest management. A brief introduction to eachchapter outlines the criterion. It is followed by anoverview of each element, describing its significancefor sustainable forest management plus providinghighlights of the relevant indicator reports. Thenavigation bar at the beginning of each criterion andrepeated at the beginning of each element graphicallydepicts the relationship between the indicators ofeach criterion.
Background
The CCFM was established in 1985 to allow the14 federal, provincial and territorial ministers withresponsibility for forests to cooperate closely innational and international matters (see inside frontcover for current members). The Council sets theoverall direction for forest stewardship and facilitatesthe development of policies and initiatives in theCanadian forest sector.
Early in 1992, a few months before the UnitedNations Conference on Environment andDevelopment (UNCED), and following two years ofnational consultations with the forest community andthe Canadian public, the CCFM released its NationalStrategy, Sustainable forests: A Canadian commitment.The Strategy, endorsed by federal, provincial and
INTRODUCTION
INT
ROD
UC
TIO
N
I1
T H E M O N T R É A L P R O C E S S
Following the United Nations Conferenceon Environment and Development, in
September 1992, the Conference on Securityand Cooperation in Europe sponsored aninternational seminar in Montréal onsustainable development of temperate andboreal forests. This was the first in-depth,multinational discussion of criteria andindicators of sustainable forest managementand it led to subsequent internationalinitiatives, one of which is now referred to asthe Montréal Process. In February 1995, at ameeting in Santiago, Chile, the SantiagoDeclaration was issued. It endorses 7 nationallevel criteria and 67 indicators for the“conservation and sustainable management oftemperate and boreal forests”.
The Montréal Process has a liaison office inCanada and now includes 12 membercountries representing 60% of the world’sforests and accounting for nearly half of theworld trade in forest products. Canadareports on the Montréal Process through theCCFM framework of criteria and indicatorsof sustainable forest management. The twoframeworks are compatible, with approxi-mately 80% equivalence. For moreinformation on the Montréal Process pleaserefer to its Web site (http://www.mpci.org).

territorial governments as well as non-governmentalorganizations and industry representatives describeda common vision and a five-year plan to manageCanada’s forests for timber and non-timber values.One of the Strategy’s 96 commitments was thedevelopment of a set of national indicators tomeasure forest condition and track Canada’sprogress toward sustainable forest management.
In 1993, the CCFM formed a C&I Task Force (seeinside back cover for current members) andlaunched a public process to develop a framework ofscience-based C&I that could be used to define andmeasure Canada’s progress in the sustainablemanagement of forests.These efforts led to the 1995publication of the C&I framework, Definingsustainable forest management: A Canadian approach tocriteria and indicators. This report was followed by acapacity report, Criteria and indicators of sustainableforest management in Canada:Technical report, in 1997,which outlined the data available for reporting onthe framework.
Canada’s commitment to sustainable forestmanagement was renewed with the National ForestStrategy 1998-2003 and through the more than 40signatories to the new Forest Accord. The newStrategy committed to action plans for a C&I reportin 2000 and regular reporting thereafter.
Building upon the knowledge gained from thepreparation of the capacity report in 1997, the CCFMdeveloped an implementation plan for reporting on asub-set of indicators in the C&I framework in 2000.The selection of theses indicators was based on theavailability of information, on retaining thoseindicators that are consistent with other nationalcriteria and indicators processes, on combiningsimilar indicators and on eliminating indicators notapplicable at the national level. This sub-set of 62indicators constitutes the structure of this report.
The C&I Framework
The CCFM C&I framework is composed of criteriathat define a set of values Canadians want to enhance
INT
ROD
UC
TIO
N
I11
MILESTONES
Key milestones and accomplishments in thedevelopment of the CCFM C&I initiative:
1992 Canada commits, in the National Forest Strategy, to develop a set of criteria and indicators for the sustain-able management of its forests;
1993 The Canadian Council of Forest Ministers (CCFM) embarks on a process to develop a Canadian set of C&I;
1995 CCFM agrees to a Canadian frame-work of 6 criteria and 83 indi-cators described in the publication, Defining sustainable forest manage-ment: A Canadian approach to criteria and indicators;
1997 CCFM releases Criteria and indicators of sustainable forest management in Canada: Technical report describing Canada’s capacity to report on the indicators, and the summary report,Criteria and indicators of sustainable forest management in Canada: Progress to date;
The CCFM agrees to an implemen-tation plan to report on a core set ofindicators to be published in the year2000 and to review the 83 indicators inthe CCFM framework;
1998 The National Forest Strategy commits Canada to producing a C&I report in 2000 and on a regular basis thereafter;
2000 Criteria and indicators of sustainable forest management in Canada: National status 2000, reports on 62 indicators in the CCFM framework.

and sustain, while the indicators identify scientific factors to assess the state of the forests and measureprogress over time.
The criteria encompass six areas:
1. Conservation of biological diversity;2. Maintenance and enhancement of forest ecosystem condition and productivity;3. Conservation of soil and water resources;4. Forest ecosystem contributions to global ecological cycles;5. Multiple benefits to society;6. Accepting society's responsibility for sustainable development.
The criteria are subdivided into 22 elements and 83 indicators (see tear-out sheet at back).
Together the criteria and indicators characterize the essential components of sustainable forestmanagement and provide a framework for assessing national progress toward this goal.The C&I frameworkprovides a scientific reference point for the development of policies on the conservation, management andsustainable development of forests. The indicators represent a scientific basis for assessing the state ofCanada’s forests and management practices at the national level.They are not performance standards and arenot designed for use at the stand or forest management unit level. An assessment of progress in achievingsustainable development is based on the combination of all the indicators in the framework rather than onthe measurement of individual indicators.
Implementation of C&I
Various approaches have been followed to implement C&I at sub-national levels. Several provinces haveacknowledged their further commitment to sustainably manage forest resources by adopting their own setsof C&I. Quebec has developed a framework of 60 indicators, based on the CCFM framework, that is expectedto be implemented over a three-year period. Ontario has drafted a comprehensive set of indicators for use inevaluating and reporting on forest sustainability. In both of these provinces, the C&I have been integrated intoforest legislation and policies. Saskatchewan is currently developing indicators for forest ecosystem health.
Other provinces and territories are incorporating C&I into their forest management planning processes. InNewfoundland and Labrador, the government is drafting a 20-year forestry development plan that will containspecific references to a provincial set of C&I, and is considering having the indicators integrated intolegislation. New Brunswick has developed a vision document for its forests that provides a framework forforest management and sets out policy goals and explicit standards and objectives to be used in thedevelopment of forest management plans on Crown Timber Licences.
The CCFM C&I framework is also being adapted for implementation under Canada’s Model ForestProgram. This process involves identification, testing, application and monitoring of indicators at the local(forest management unit) level. Each of the 11 model forests across the country has adopted the definitionof sustainable forest management, as set out in the six criteria of the CCFM framework, in order to establishits own suite of local level indicators. Several industries and provincial governments are drawing upon thisapproach to develop regional or provincial indicators, while others are linking the local level indicators tocertification requirements.
In 1996, The Canadian Standards Association developed a standard for a sustainable forest managementsystem.This standard requires that the six criteria be addressed and specifies 21 critical elements based onthose in the CCFM C&I framework.
INT
ROD
UC
TIO
N
IV

OV
ERV
IEW
OF
CA
NA
DA
’S M
AJO
R F
OR
EST
ED E
CO
ZO
NES
V
Canada is a forest nation. Its forests cover 42% of itsland mass and represent 10% of the world’s forests
and more than 30% of the Boreal Forest. Forests playan important role in the economic, social and spiritualwell-being of Canadians.
Canada is in the unique position of having themajority of its forests (94%) under public ownership.The remaining 6% are owned by more than 425 000private landowners. Most of Canada’s timberproductive forest is managed under provincial orterritorial jurisdiction.
Canada is the largest exporter of forest productsworld wide. The economic health of the forest sector isimportant to the continued prosperity of the nation,generating 30% of all manufacturing investment.
Forests provide wilderness areas for the cultural,spiritual and recreational benefit of all Canadians andfor visitors to Canada, and support an important andgrowing recreation and tourism industry.
Canada is host to a diversity of forest ecosystems andtree species. The 1996 National Ecological Framework(tear-out map at back) divides the country into 15 terrestrial ecozones, 53 ecoprovinces,194 ecoregions and more than 1 000 ecodistricts,(Ecological Stratification Working Group 1996,Marshall and Schut 1999) delineated on the basis ofthe interactions of geological, landscape, soil,vegetation, climate, wildlife, water and human factors.The majority of Canada’s forests lie within the eight
ecozones discussed below (Wiken 1986, Wood andAddison 1997, Urquizo et al. 2000).
The Taiga Plains ecozone is bordered on the west bythe cordillera mountain ranges, to the east by GreatBear Lake and Great Slave Lake, to the north by theMackenzie Delta and to the south by the closed forestsof the Boreal Plains ecozone. Short cool summers andlong cold winters result from the influence of arctic airfor most of the year.
The ecozone is about 80% forested, but has relativelylittle standing timber volume per hectare. Taiga is aRussian word that literally means “the land of littlesticks” and refers to the northern edge of the borealconiferous forest. This ecozone is a transition betweenmixed forest-tundra and dense coniferous forest. Thepredominant tree is black spruce, which generallyoccurs as an open, slow-growing species in the ecozone.Along the nutrient-rich alluvial flats of the larger riverswhite spruce and balsam poplar grow to sizescomparable with the largest in the boreal forest. TheMackenzie River, Canada’s largest river, dominates theecozone and the Mackenzie Valley forms one of NorthAmerica’s most travelled migratory corridors forwaterfowl breeding along the Arctic Coast.
The population of 23 986 (density [persons per squarekilometer] 0.04) is approximately 60% Aboriginal.Mining, oil and gas exploration and some forestry andtourism are the main activities in the ecozone.
The Boreal Cordillera ecozone, covering sectionsof northern British Columbia and the southernYukon, has a Pacific Maritime influence that
OF CANADA’S MAJOR FORESTED ECOZONES
Boreal Cordillera
Taiga Plains
OVERVIEW

moderates temperatures over most of its area. Theclimate is marked by long, cold winters and short,warm summers.
The ecozone is 61% forested. Vegetative cover rangesfrom closed to open canopy forest. Tree species includewhite and black spruces, alpine fir, lodgepole pine,trembling aspen, balsam poplar and white birch. Thetree line ranges from 1 500 metres in the southeast toabout 1 200 metres in the northwest, where the standsare generally open, and there are almost no lodgepolepine or alpine fir. Shrub birch–willow communities arecommon in the subalpine forest and extend into thealpine tundra above the tree line. Permanent ice andsnow fields occur in the mountains along the westernside of the ecozone.
This ecozone is sparsely populated, with themajority of the population of approximately 32 904(density 0.1) residing in the larger communities ofWhitehorse and Dawson. The major economic activityis mining followed by forestry, tourism, andhydroelectric development. Some agriculture isassociated with the large watersheds.
The Boreal Plains, extending from Peace River,British Columbia, in the northwest to the southeasterncorner of Manitoba are part of the Boreal Forest.Unlike the neighbouring Boreal Shield, the BorealPlains ecozone has few bedrock outcrops, fewer lakes,a higher percentage of non-forest land and someprivate lands.
Cold winters and moderately warm summers arecharacteristic of the climate which is stronglyinfluenced by continental climatic conditions. Jackand lodgepole pines, white and black spruces and
tamarack are the main coniferous species with mixedstands of aspen and white spruce occurring onnutrient-rich sites. A two-stage silvicultural system,involving harvest of the aspen canopy while protectingthe valuable white spruce understory, is followed inthese mixedwood stands.
The population of the ecozone is 744 631(density 1.1). Major land uses in the Boreal Plainsinclude agriculture, forestry, oil and gas exploration,mining, hunting and trapping, outdoor recreationand tourism.
The Boreal Shield ecozone stretches from theeastern tip of Newfoundland to the northeastern cornerof Alberta. At 195 million hectares, it is the largestecozone in Canada, encompassing almost 20% ofCanada’s land mass and accounts for 22% of thecountry’s freshwater surface area.
The headwaters of numerous large drainage basinsystems such as the Nelson and Churchill rivers inManitoba, the St. Lawrence river in Ontario, and theEastmain, Rupert, Nottaway and Broadback rivers inQuebec are found in this ecozone. The abundance ofwater attracts hundreds of thousands of migratory birdsand provides important habitats for fish and otheraquatic organisms.
The ecozone has a strongly continental climatecharacterized by long cold winters and short warmsummers except in the coastal margins where it ismoderated by maritime conditions. Vegetation in theBoreal Shield is the result of cool temperatures, a shortgrowing season, frequent forest fires and acidic soils.The ecozone is almost 80% forested and much of itremains in wilderness condition. Closed stands of
OV
ERV
IEW
OF
CA
NA
DA
’S M
AJO
R F
OR
EST
ED E
CO
ZO
NES
VI
Boreal Plains
Boreal Shield

conifers, largely white and black spruce, balsam fir andtamarack are characteristic. Toward the south there is awider distribution of broad-leaved trees such as whitebirch, trembling aspen and balsam poplar and needle-leaf trees such as white, red and jack pine. Tree growthand timber volume are lower than in most of the otherforested ecozones in Canada.
Fire suppression and harvesting have resulted in anincrease in the balsam fir content of stands, usually atthe expense of white spruce. In the eastern portion ofthe ecozone, balsam fir is often the dominant species,but the challenge is to protect it from spruce budworm(a native pest that can be destructive during majoroutbreaks) long enough for the trees to reach rotationage or a size at which they can be harvested. In thecentral and western portions of the ecozone, balsam firis an understory component of boreal mixedwoodstands, but is not as important a commercial species asin the east. On lowland sites in the Boreal Shield, blackspruce occurs in nearly pure stands. Naturalregeneration is emphasized in the ecozone, partly toconserve genetic and structural diversity within stands.Fire suppression and harvesting practices throughoutthe ecozone have also resulted in a shift from conifersto hardwoods, particularly in the boreal mixedwoodsand the red pine and white pine stands in the southernpart of the ecozone.
With a total population of 2 895 437 (density 1.5),the Boreal Shield is home to roughly 11.5% ofCanada’s population. Almost 60% of the populationlives in urban centres, the largest of which is St. John’s,Newfoundland. Many towns have developed aroundthe rich natural resource base. Mining and forestryeach account for 5.4% of the total labour force withfisheries and agriculture contributing 2.5% and 2.2%respectively. Other commercial activities includehydro power, water-oriented recreation and tourismand commercial and subsistence hunting, trappingand fishing.
The Pacific Maritime ecozone extends in a thin zonealong the Pacific Coast. This ecozone has some of thewarmest and wettest climatic conditions in Canada.Relative to the rest of the country, there is littlevariation in mean monthly temperatures.
The ecozone is divided almost evenly between forestedand non-forested land. Mountainous topographydominates the landscape, with numerous fiords andglacial valleys, bordered by coastal plains along thePacific margin. The ecozone is characterized by big trees,steep slopes and old forests with long intervals betweendisturbances such as fire or windstorms.
Forestry is the principal activity. Forest productivityand the cost of harvesting wood are the highest in thecountry. The lowlands of the Fraser Valley and thesoutheastern tip of Vancouver Island possess anexpanse of highly productive agricultural soils andurban lands. Fishing, transportation and tourism areother economic activities. The total population of2 848 289 (density 13.4) is concentrated in Vancouverand the lower mainland and in Victoria.
OV
ERV
IEW
OF
CA
NA
DA
’S M
AJO
R F
OR
EST
ED E
CO
ZO
NES
VII
Pacific Maritime

OV
ERV
IEW
OF
CA
NA
DA
’S M
AJO
R F
OR
EST
ED E
CO
ZO
NES
VIII
The Montane Cordillera ecozone, nestled betweenthe Pacific Maritime, Boreal Plains and the BorealCordillera ecozones, is the most complex of all of theecozones, with an exceptional diversity of topographyand climate. Several mountain ranges run north tosouth and there are a number of interior plains. It isalso home to Canada’s only true desert. Depending onelevation and exposure, vegetation ranges from alpinetundra to dense conifer forest that is almost coastal inappearance, to high elevation subalpine fir andEnglemann spruce to dry sagebrush and grasslands.The ecozone has more than 11 000 lakes and sevenmajor river systems including the headwaters of theFraser and Columbia rivers.
The Montane Cordillera is a fire-dominatedecosystem. Approximately 70% of the area is forested.Fire suppression has resulted in the accumulation oftoo much older age class forest that is becoming moreand more prone to catastrophic wildfire. Withaggressive fire suppression, insects such as bark beetlesare able to have a major impact upon the forest. Afterthe Pacific Maritime, this ecozone has the highestvolume of standing timber.
Forestry is an important economic activity, partic-ularly in the northern interior sections. Mining, gas andoil production and tourism are also significanteconomic activities in the ecozone. A series of nationaland provincial parks have been established in the Rockyand Columbia mountains for recreational use or topreserve wildlife habitat. Although this ecozone ismuch less urbanized than the Pacific Maritime ecozone,more than half of its 851 656 (density 1.7) inhabitantslive in cities and towns such as Prince George,Kelowna, Kamloops, Penticton and Vernon.
The Mixedwood Plains ecozone covers the GreatLakes-St. Lawrence River Valley. The ecozone is thenorthernmost extension of the deciduous forest biomethat extends throughout much of the eastern UnitedStates. The climate is marked by hot humid summersand cool winters. Geographic location, waterways anda combination of gentle topography, fertile soils, awarm growing season and abundant rainfall have madethis the most densely populated and intensely used areain Canada.
Once heavily forested, the Mixedwood Plainssupported a greater diversity of trees and plants thanany other part of Canada. It now has less than 20%forest cover, ranging from the mixeddeciduous–coniferous stands in the northern portionsto the highly diverse deciduous stands of the Carolinianforest in the southwest near Windsor, Ontario. Most ofthe deciduous forest has been cleared away for farms,orchards, highways and cities. In some areas in extremesouthwestern Ontario, forest cover has been reduced toless than 3% of the land base. Over the course of twocenturies of settlement and development, a charac-teristic fragmented landscape mosaic of agriculture,urban development and remnant natural areas hasemerged. Pressures on the remaining woodlands areexpected to increase as the human population withinthe ecozone continues to grow.
Spanning the shorelines of three of the Great Lakes,this ecozone includes important aquatic ecosystems,industrial complexes and recreation areas.Manufacturing and services are the prominenteconomic activities. Approximately 50% of Canada’spopulation, or 14 840 411 people (density 130.2),reside in the ecozone. Almost 85% of the residents live
Mixedwood PlainsMontane Cordillera

in urban centres stretching along the QuebecCity–Windsor corridor, where two of Canada’s largestcities, Montréal and Toronto, are situated.
The Atlantic Maritime ecozone covers all of NovaScotia, New Brunswick, Prince Edward Island and partof Quebec. The Atlantic Ocean creates a cool, moistmaritime climate. The ecozone is heavily forested withmixed stands of conifers and deciduous species. Thereis a long history of European settlement, with most ofthe native forest being burnt or harvested at least oncein the past two centuries. This ecozone has the highestpercentage of private woodlots in Canada.
Natural regeneration following harvesting iscommon in the Atlantic Maritime ecozone. Specializedfill planting or diversity planting may be used tocomplement natural regeneration where necessary.A two-pass harvesting system has been introducedwhereby balsam fir and hardwoods are removed duringthe first pass. The spruce component, retained fordiversity and regeneration, is harvested about twentyyears later.
Agriculture, forestry and mining are the major land-based activities, while in coastal communities, fishinghas traditionally been the most important source ofincome. Tourism also contributes to the economy of theecozone. The majority of the population of 2 549 061(density 12.6) is found in coastal lowland communities.
References
Ecological Stratification Working Group. 1996. Anational ecological framework for Canada. Agricultureand Agri-Food Canada—Research Centre for Land andBiological Resources Research and EnvironmentCanada—State of the Environment Directorate—Ecozone Analysis Branch, Ottawa, ON/Hull, QC.125 p. + map.
Marshall, I.B.; Schut, P.H. 1999. A nationalecological framework for Canada. EnvironmentCanada—Ecosystems Science Directorate andAgriculture and Agri-Food Canada—Research Branch.Ottawa, ON. [online]. http://www3.ec.gc.ca/soer-ree/english/framework/overview.cfm AccessedJune 2000.
Urquizo, N.; Bastedo, J.; Brydges, T.; Shear, H.(editors) 2000. Ecological assessment of the BorealShield ecozone. Environment Canada—EnvironmentalConservation Service—Indicators and AssessmentOffice. Ottawa, ON. 71 p.
Wiken, E.B. (compiler). 1986. Terrestrial ecozonesof Canada. Ecological land classification series,No.19. Environment Canada—ECS-1AO. Hull, QC.26 p. + map.
Wood, J.; Addison, P. (compilers). 1997. Canada’sworking forest. Natural Resources Canada—CanadianForest Service—Effects of Forestry Practices Network.Victoria, BC. [online]. http://www.pfc.cfs.nrcan.gc.ca/cwf/shock_e/preface.html Accessed March 2000.
OV
ERV
IEW
OF
CA
NA
DA
’S M
AJO
R F
OR
EST
ED E
CO
ZO
NES
IX
Atlantic Maritime

CONSERVATION OF BIOLOGICAL DIVERSITY
CRITERION 1
INTRODUCTION
1.1 Ecosystem Diversity
1.1.1
1.1.2
1.1.3
1.2 Species Diversity
1.2.1
1.2.2
1.2.3
Percentage and extent, in area, of forest types relative to historical condition and tototal forest area
Percentage and extent of area by forest type and age class
Area, percentage and representativeness of forest types in protected areas
Number of known forest-dependent species classified as extinct, threatened, endan-gered, rare or vulnerable relative to total number of known forest-dependent species
Population levels and changes over time of selected species and species guilds
Number of known forest-dependent species that occupy only a small portion of theirformer range

ELEMENT OVERVIEW
An ecosystem consists of the plant, animal andmicrobial communities in an area interacting as a
functional unit with their physical and climaticenvironment. Ecosystem diversity refers to thevariation among ecosystems within a landscape andincludes measures that characterize their dimensions,composition and spatial arrangement. Climate, habitattype and disturbance patterns influence speciescomposition within individual forest ecosystems. Eachspecies has particular habitat requirements and
ELEMENT 1.1ECOSYSTEM DIVERSITY
CO
NSE
RVAT
ION
OF
BIO
LOG
ICA
L D
IVER
SIT
Y•
Ecos
yste
m D
iver
sity
1
INTRODUCTION
Biological diversity, or biodiversity, refers to the variability among living organisms andthe ecological complexes of which they are a part. Biodiversity can be measured at theecosystem, species and genetic levels. Ecosystem diversity describes the variety of
ecosystems found in a landscape, while species diversity describes the number and variety ofspecies in those ecosystems. Genetic diversity includes the range of genetic characteristicsfound within a species and among different species.The conservation of biodiversity ensuresthat forest ecosystems maintain their integrity and continue to be productive and to adapt tochanging conditions.
Forest ecosystems are shaped by dynamic processes.The populations, species, forest types andage classes that comprise Canada’s forests are determined through cycles of disturbance andrenewal. Maintaining biodiversity entails examining ecosystems at many levels of organization andat different time and spatial scales. It also involves making land-use and resource managementdecisions that incorporate biodiversity needs, such as limiting the conversion of forests to agriculturaland urban lands, creating protected areas, managing the harvest of forest plants and animals, preventingthe invasion of foreign insects and diseases, and protecting wildlife habitat through well-planned forestmanagement activities.
The diverse ecosystems of Canada’s native forests span a wide range of climates—the lush Carolinian forestsof southern Ontario; the sparse strings of trees along arctic rivers; the rainforests of the west coast; and thedry ponderosa pine forests of interior British Columbia. Canada practises natural management of forests,retaining a large component of native species. The forests are largely dominated by coniferous species, butdeciduous species are frequent. According to a taxonomic census carried out by the Canadian Museum ofNature, Canada is home to approximately 140 000 species, only half of which have been described (Mosquinet al. 1995).Approximately two thirds of these species, most of which are insects or other arthropods, occurin forest ecosystems.
Canada, along with many other nations, signed the United Nations Convention on Biological Diversity. TheConvention has three main objectives: the conservation of biological diversity; the sustainable use of itscomponents; and fair and equitable sharing of the benefits that arise out of the use of genetic resources.Provincial, territorial and other governments are collaborating to implement the Canadian component of theconvention in their own way.
Element 1.1 (Ecosystem Diversity) examines the range and extent of softwood, mixedwood and hardwoodforest cover on public and private lands in Canada. Element 1.2 (Species Diversity) is concerned with the statusof forest-dependent animal and plant species and with determining possible threats to their survival.
EcosystemDiversity
SpeciesDiversity
GeneticDiversity
CONSERVATIONOF BIOLOGICAL
DIVERSITY
1.1.1
1.1.2
1.1.3
CONSERVATION OF BIOLOGICALDIVERSITY

interacts with other species for food, reproduction andother needs. Indirectly, ecosystem diversity ensures theprovision of ecological services such as waste assimi-lation, carbon storage, soil conservation and produc-tivity, nutrient cycling, flood control, water storage andsupply, climate stabilization and oxygen supply.
A characterization of the area and extent of the forestland base and its major forest types (Indicator 1.1.1) isthe foundation upon which allocation and managementof forest lands, and their use and preservation, is based.A diversity of landscapes is essential for maintainingecological integrity. In addition to a variety ofecosystems, conserving biological diversity includesconservation of forest structure (the vertical layering oftrees, shrubs and other plants), and patches (the patternof different forest ecosystems across the landscape).Information on structure is important for the conser-vation of diversity at the ecosystem, species and geneticlevels because it enables timber harvests to be planned soas to maintain a full range of ecosystem types andsuccessional habitats. Groups of native species tend tobe associated with particular successional stages of forest
types. Measurement of forest type and age class distri-bution (Indicators 1.1.1 and 1.1.2) determines theavailability of habitat for these species.
Protected areas (Indicator 1.1.3) can serve asecological benchmarks for comparative research such asassessing the impact of forest management practices onbiodiversity. In addition to the ecological benefits ofmaintaining the ecosystem, species and geneticdiversity of a region, protected areas may also provideeconomic, social, wilderness and other recreationalfunctions and may conserve culturally importantheritage sites.
A number of initiatives since 1992 have led tosignificant progress in the completion of a network ofconservation areas representative of the diversity ofCanada’s forests. The federal, provincial and territorialgovernments, together with their partners under theNational Forest Strategy, remain committed tocompleting the network and to establishinginventories, plans, guidelines and monitoring programsfor maintaining it.
CO
NSE
RVAT
ION
OF
BIO
LOG
ICA
L D
IVER
SIT
Y•
Ecos
yste
m D
iver
sity
2
TABLE 1.1a Area of Canada’s forest by terrestrial ecozone
Ecozone Total area Total % total Productive % total Productive % total (thousand ha) forest area forest on public forest forest on forest
area* and private land area private land area(thousand ha) (thousand ha) (thousand ha)
Arctic Cordillera 25 059 51 0.2 0 0.0 0 0.0
Northern Arctic 151 088 0 0.0 0 0.0 0 0.0
Southern Arctic 83 239 3 235 3.9 9 0.3 0 0.0
Taiga Cordillera 26 484 8 487 32.0 583 6.9 0 0.0
Taiga Plains 64 700 50 020 77.3 17 076 34.1 9 0.0
Taiga Shield 136 640 52 676 38.6 10 215 19.4 2 0.0
Boreal Cordillera 46 460 28 816 62.0 13 914 48.3 3 0.0
Boreal Plains 73 780 49 817 67.5 33 798 67.8 1 906 3.8
Boreal Shield 194 637 151 078 77.6 106 096 70.2 7 633 5.1
Pacific Maritime 21 898 10 057 45.9 8 563 85.1 423 4.2
Montane Cordillera 49 211 34 857 70.8 32 129 92.2 1 348 3.9
Prairies 47 811 2 085 4.4 1 778 85.3 1 093 52.4
Hudson Plains 36 236 6 717 18.5 1 537 22.9 202 3.0
Mixedwood Plains 19 443 3 655 18.8 3 301 90.3 3 121 85.4
Atlantic Maritime 20 375 16 033 78.7 15 571 97.1 8 546 53.3
Canada 997 061 417 584 41.9 244 570 58.6 24 286 5.8
*Detectable water bodies and treeless wetlands are excluded. Source: Lowe et al. 1996

INDICATOR REPORTS
PERCENTAGE AND EXTENT,IN AREA, OF FOREST TYPESRELATIVE TO HISTORICALCONDITION AND TO TOTALFOREST AREA
The data in Table 1.1a and 1.1b are from Canada’sForest Inventory 1994 (Lowe et al. 1996). Theinventory is an aggregation of data fromprovincial/territorial management inventories and isperiodically updated at the national level. Because themanagement inventories are being continuallyupgraded, the national inventory is composed ofinformation gathered at different times, and cannot beused to monitor change relative to historic condition.
The total area of Canada is 997 061 thousandhectares. Nearly 42% of this area is covered by forests.The 1996 National Ecological Framework (Tear-outmap at back) divides Canada into 15 terrestrialecozones. All except the Northern Arctic ecozone havesome forest cover. Eleven of these ecozones have 15%or more forest cover. Nearly 60% of the forest isclassified as productive forest land defined as “capableof producing a harvestable volume of timber within areasonable length of time” (Haddon 1988).
The public forest is owned and managed undereither federal, provincial or territorial governments.
Private forests comprise only 10% of the timberproductive forest land. Differences in managementregimes between public and private lands are reflectedin the characteristics of the forest ecosystems found onthese lands.
Softwoods dominate the forests of the PacificMaritime and Montane Cordillera ecozones in westernCanada. Table 1.1b, which provides data for timberproductive forests only, shows that public forests inthese ecozones have over 90% softwood cover. Publicforests have more than 50% softwood cover in all otherecozones except the Boreal Plains, Taiga Plains andMixedwood Plains.
The Boreal Plains and Taiga Plains ecozones supporta higher percentage of hardwood and mixedhardwood-conifer stands than the Boreal Shieldecozone found immediately to the east. Hardwoods,poplar species in particular, prefer the Boreal Plainsand Taiga Plains ecozones where the soils are deeper,less rocky and less acidic, but more productive, thanthe soils of the Boreal Shield.
The Mixedwood Plains ecozone, located in southernOntario and Quebec in the Great Lakes and St.Lawrence River basins, has the greatest hardwooddominance in Canada. More than 40% of the forestsare dominated by sugar maple and other temperatehardwoods.
In ecozones with significant areas of productive forestland, the proportion of hardwoods is significantly
1.1.1
CO
NSE
RVAT
ION
OF
BIO
LOG
ICA
L D
IVER
SIT
Y•
Ecos
yste
m D
iver
sity
3
TABLE 1.1b Distribution of forest cover types in public and private timber productive forests, by ecozone
ECOZONE FOREST COVER TYPE (%)
PUBLIC PRIVATE
Softwood Mixedwood Hardwood Softwood Mixedwood Hardwood
Taiga Plains 34.4 53.1 12.5 24.8 39.1 36.1
Boreal Cordillera 76.4 20.2 3.4 34.3 38.5 27.2
Boreal Plains 42.2 22.4 35.4 6.0 15.0 79.1
Boreal Shield 68.7 20.2 11.1 31.6 30.2 38.2
Pacific Maritime 95.3 2.9 1.8 71.1 12.5 16.4
Montane Cordillera 91.2 7.3 1.6 61.0 25.7 13.4
Mixedwood Plains 30.2 28.2 41.6 14.2 27.9 57.9
Atlantic Maritime 50.8 27.6 21.6 35.6 32.2 32.2
Source: Lowe et al. 1996

higher in private forests than public forests (Table 1.1b)because hardwoods often dominate regeneration onrecently harvested sites, and harvesting activity isgreater on private lands. Private forests are generallyfound on more productive soils and in warmer areaswithin an ecozone, two factors that also favourhardwood dominance. The southern portion of theBoreal Plains ecozone includes an area of hardwood(aspen) parkland, transitional to the prairies, which ismostly privately owned. It has a much greater diversityof hardwood species than the "true" boreal forest to thenorth, as well as a higher proportion of private lands.The following case study from Ontario illustrates thedominance of certain tree species for this area.
Case Study: Forest types on private land in Ontario
Ontario has a total land area of approximately 106.8million hectares, of which approximately 69.2 millionhectares are forested. Ontario’s forests include a diverserange of ecosystems and associated wildlife species. Treespecies range from boreal species (black spruce and jackpine) in the north to Carolinian species (Kentuckycoffee tree and sassafras) in the extreme south.
Three terrestrial ecozones: Hudson Plains, BorealShield and Mixedwood Plains (Ecological StratificationWorking Group 1996) are found in Ontario. Forestersrecognize an additional area in the southern portion ofthe Boreal Shield known as the Great Lakes-St.Lawrence Forest. A portion of this Ontario ecozoneapproximates a subdivision of the Boreal Shield referredto as ecoregion 98 (Algonquin-Lake Nipissing). Asshown in Figure 1.1a, the forest in this ecoregion has aspecies composition distinct from that of the BorealShield ecozone.
Private forest land is concentrated in the southern,more densely populated portion of the province. Thepercentage of forest that is privately owned is as follows:
• Hudson Plains – 0.1%
• Boreal Shield – 6.1%
• Algonquin-Lake Nipissing – 37.1%
• Mixedwood Plains – 95.2%
PERCENTAGE AND EXTENT OFAREA BY FOREST TYPE ANDAGE CLASS
Canada’s boreal forests are primarily composed ofeven-aged stands. Their composition and age classstructure are dynamic, evolving with major distur-bances such as fires, insect outbreaks and harvesting.Some species have adapted to a fire-dominated naturaldisturbance regime. In these ecosystems, firesuppression may serve to increase stand density andshift species compositions to later successional stages.Forest management has the potential to change ageclass and structural properties of a forested landscape,resulting in changes in biodiversity. Harvesting lowersaverage forest age, reduces woody debris (snags andfallen logs), and alters the size distribution of forestpatches. As a result, species adapted to young succes-sional stages may temporarily increase with the creationof new habitat.
Northern areas are characterized by poorer forestresources with a lower priority for forest management.Most northern inventories do not have age classinformation and in some cases, age class may not becomparable across inventories. This information isreported as missing (Gray and Power 1997). The datashown in Figure 1.1b has been normalized to considermissing information.
Figure 1.1b expands the information presented inTable 1.1b to illustrate age class information for eachof the cover types, in public and private forests, byecozone. It does not include uneven-aged stands thatare being managed through partial harvest treatments.As these treatments are more commonly applied tohardwood stands than conifer, the data probablyunderstate the occurrence of older hardwood forestsin Canada.
Canada's hardwood forests have fewer older-agedstands than do softwood forests. Several factors accountfor this difference: the tendency for hardwoods such asaspen and birch to replace conifers following harvestingin the boreal ecozones; the shorter life-span of mosthardwood species; and the higher proportions ofhardwoods on more productive sites where harvestingpressure is greater.
1.1.2
CO
NSE
RVAT
ION
OF
BIO
LOG
ICA
L D
IVER
SIT
Y•
Ecos
yste
m D
iver
sity
4

Forests more than 160 years old are primarily foundin the Pacific Maritime ecozone of the west coast wheremajor natural disturbances are infrequent. Immediatelyto the east, the Montane Cordillera ecozone also has asignificant but much lower proportion of similar oldforests, occurring in certain climactically favourablelocations. The remaining ecozones typically have much
younger forests, reflecting a higher frequency of insectand fire disturbance and a longer history of forestmanagement.
Figure 1.1b also shows that forests on private landstend to be much younger than those on public lands.This is true for softwood, mixedwood and hardwoodcover types.
CO
NSE
RVAT
ION
OF
BIO
LOG
ICA
L D
IVER
SIT
Y•
Ecos
yste
m D
iver
sity
5
FIGURE 1.1a Terrestrial ecozones and forest types in Ontario
Other
Tolerant Hardwoods
Poplar/Birch
Spruce/Fir/Jack Pine
Red/White Pine
Hudson Plains
Boreal Shield
Mixedwood Plains(Deciduous)
Algonquin-Lake Nipissing
Note: The other species proportions are made up of larch, hemlock, ash and other species. Source: Ontario Ministry of Natural Resources 1996

CO
NSE
RVAT
ION
OF
BIO
LOG
ICA
L D
IVER
SIT
Y•
Ecos
yste
m D
iver
sity
6
FIGURE 1.1b Age class distributions by forest cover type in public and private productive forest land
Source: Lowe et al. 1996
PacificMaritime
MontaneCordillera
BorealCordillera
BorealCordillera
BorealShield
AtlanticMaritime
BorealPlains
TaigaPlains
PacificMaritime
MontaneCordillera
BorealShield
AtlanticMaritime
BorealPlains
TaigaPlains
MixedwoodPlains
0 10 20 30 40 50 60 70 80
161+
121-160
81-120
41-80
0-40
161+
121-160
81-120
41-80
0-40
161+
121-160
81-120
41-80
0-40
161+
121-160
81-120
41-80
0-40
161+
121-160
81-120
41-80
0-40
161+
121-160
81-120
41-80
0-40
161+
121-160
81-120
41-80
0-40
161+
121-160
81-120
41-80
0-40
0 10 20 30 40 50 60 70 80
Hardwood
Mixedwood
Softwood
PUBLIC PRIVATE
Percent Percent
Age
(ye
ars)

AREA, PERCENTAGE AND REP-RESENTATIVENESS OF FORESTTYPES IN PROTECTED AREAS
The World Conservation Union (IUCN) defines aprotected area as “an area of land and/or sea especiallydedicated to the protection of biological diversity, andof natural and associated cultural resources, andmanaged through legal or other effective means”. SixIUCN categories of protected area are designated,depending on their management objectives (see textbox p. 9).
Canada has a long tradition of protecting its naturalheritage, and is internationally recognized for its manyparks. From Canada’s first park, established in 1885,the national network of parks has expanded to include38 National Parks and Reserves, three MarineConservation Areas and 792 Historic Sites. Togetherwith land that has been withdrawn for future nationalparks, this protected area covers 29 583 450 hectares.The 48 National Wildlife Areas, covering 489 330hectares, provide protection for wildlife and theirhabitats under the Canada Wildlife Act.
In addition to National Parks and Reserves, anextensive system of provincial, territorial and municipalparks stretches across the country. Conservation offorest values also occurs outside of formally protectedareas. Nineteen percent of productive forest land isclassified as being under “policy constraint”. This areaincludes land that will not be harvested due to policy orlegislative guidelines: land, for example, that serves asbuffers along watercourses or land that is owned by ormanaged through agreements with conservationagencies. A case study from New Brunswick (Table1.1c) illustrates the various existing categories thatprotect the province’s natural values.
In the past, decisions taken by governments toestablish protected areas were often based on landscapefeatures and natural beauty. In recent years, conser-vation efforts have been directed toward protectingareas that contain representative examples of Canada’sbiodiversity. Government policies are collectivelysupportive of completing a network of protected areas.Most provinces and territories have been involved inextensive consultations to reconcile economic andsocial interests and have made significant progresstoward protecting representative areas.
Canada faces a variety of challenges in meeting itscurrent commitments to establish a network ofrepresentative protected areas. For example, hundredsof different categories of protected areas exist. There isno authoritative and comprehensive nationalmechanism to collect and report on biodiversity data inrelation to protected areas and it is not yet possible todistinguish among forest types or between forest andnon-forest protected areas. In addition there is the issueof overlapping responsibilities and coordination ofefforts among governments.
Using 1995 data from Environment Canada (1997),the previous C&I publication (CCFM 1997) reportedthat 7.6% of Canada’s forest land, or 31.7 millionhectares, were found in protected areas (of which overhalf are strictly protected in IUCN categories I to III).Recent additions that have not yet been compilednationally have significantly increased the area ofprotected forest.
The results of a recently published study (WorldWildlife Fund 1999) suggest that protected forest areasin Canada may now represent approximately 8.4% ofthe total forest area. The gap analysis used for thisreport identified 388 forested natural regions inCanada, of which 32 were described as adequatelyrepresented, 75 as moderately represented and a further122 as partially represented.
New initiatives to legislate or reserve extensive areasfor protection categories, which will further increasethe area of protected forests and the representation offorest types and natural habitats, have been undertakenby several governments.
Under the Ontario Forest Accord, which is anagreement between the Ontario Ministry of NaturalResources and representatives of the forest industry andenvironmental groups, 378 new protected areas are tobe established, totalling 2.4 million hectares. Thisbrings the total protected forest area in Ontario, inIUCN categories I to VI, to 5.1 million hectares. In1998, Nova Scotia legislated 31 new wilderness areas asreserves, totalling 300 000 hectares. The addition ofthese areas to the existing provincial and federal parkswill raise the total protected area in Nova Scotia to7.8% of the land base. Pursuant to the 1998Manitoba–First Nations Memorandum ofUnderstanding, Manitoba gave interim protection to900 000 hectares of forest land. By 1999, Manitoba
1.1.3
CO
NSE
RVAT
ION
OF
BIO
LOG
ICA
L D
IVER
SIT
Y•
Ecos
yste
m D
iver
sity
7

had protected 5.4 million hectares, encompassing 8.3%of the province. Over the last decade, British Columbiahas doubled the area under protection with a current10.8 million hectares (11.4%) of the province inprotected areas.
Since Alberta’s Special Places Program wasannounced in March 1995, 55 sites have beendesignated, adding nearly 728 000 new hectares to theprovince’s network of protected areas. The programaims to complete a network of protected areas that willpreserve representative examples of the province’s sixnatural regions and twenty subregions. During theAlberta Legislative Assembly’s 2000 Spring Session, theWilderness Areas, Ecological Reserves and Natural AreasAmendment Act was passed. This creates a “heritagerangeland” class of protected area which will supportthe completion of the Special Places Program. Theresults of a public consultation process that concluded
in November 1999 are still under consideration todetermine what changes will be included in new parksand protected areas legislation which will consolidate,streamline, update and improve Alberta’s parks andprotected areas legislation, establish a revised system ofclasses of protected areas, and clarify the purpose andmanagement requirements of each class.
Case Study: Protected areas in New Brunswick
New Brunswick is Canada’s most heavily forestedprovince. Eighty-five percent of its 7 108 309 hectaresis covered with forest. Approximately one half ispublicly owned land. Principal land uses areagriculture, forestry, mining, residential, industrial andinstitutional. A growing proportion of the province’sland is being managed for conservation objectives(Table 1.1c).
8
CO
NSE
RVAT
ION
OF
BIO
LOG
ICA
L D
IVER
SIT
Y•
Ecos
yste
m D
iver
sity
TABLE 1.1c Conservation objectives in New Brunswick
Type Area (ha) Objective OwnershipWetland 20 622 Managed as habitat for aquatic plants, Public (38%)
animals and especially migratory birds. Private (62%)
Ecological reserve 1 212 Reserves, ranging from 50 to 20 ha in size, Publicprotect rare and endangered speciesand unique habitat. Public access is limitedand closely supervised.
Conservation area 7 909 Similar to ecological reserves but with Publichunting and fishing permitted.
Deer wintering areas 268 500 Trees are thinned and planted to maintain Publichealthy winter habitat to be usedby deer during periods of deep snow cover.
Mature coniferous 172 000 Land management practices require that Publicforest habitat at least 10% of public coniferous forest
be kept in mature or older condition,in patches mostly greater than 500 ha.
Watercourse buffer zone 284 500 Law dictates that the banks of all Public (87%)watercourses are managed for the Private (13%)protection of these waters.
Migratory bird sanctuary 275 Areas managed as resting areas for Publicmigratory birds. Hunting is prohibitedand access is limited.
Ramsar site 17 484 Conservation and wise use of wetlands. Public(Site classified as wetlandof international importance)
Nature preserves 317 Managed for nature preservation. Private
Provincial Park 23 000 Protection of significant natural, cultural Publicand recreational environments, whileproviding opportunities for visitors toparticipate in recreational activities.
National Park 45 500 Protection of Canada’s natural regions. Public
Stewardship agreements 900 Protection for rare or unique species or Privatehabitat through partnerships with privatelandowners and conservation groups.
Canadian Heritage Rivers — Long-term management and conservation Publicof the natural, cultural, historical andrecreational value of outstanding rivers.
Other protected areas — Sites under conservation management by Publicmunicipalities/conservation groups/industry. Private
Source: LaPierre 1997

ELEMENT OVERVIEW
Species diversity refers to the number and relativeabundance of species found in an area. The impacts ofchange in ecosystems are expressed through shifts inbiodiversity. Loss of species can threaten long-termecosystem productivity and stability. The number ofspecies at risk in Canada can indicate how wellbiodiversity resources are being managed (Indicator1.2.1).
The Committee on the Status of EndangeredWildlife in Canada (COSEWIC) determines thenational status of wild Canadian species suspected ofbeing at risk (Indicator 1.2.1), based on the bestscientific information available. COSEWIC recognizesfive classifications of species at risk. Extinct refers tospecies that no longer exist. Extirpated species are thosethat no longer exist in the wild in Canada. Speciesfacing imminent extirpation or extinction areconsidered to be endangered while threatened speciesare likely to become endangered if limiting factors arenot reversed. Vulnerable species are of special concernbecause of characteristics that make them particularlysensitive to human activities or natural events. Manyprovinces and territories maintain their own lists ofspecies at risk. To complement COSEWIC’s work inlisting species, the Recovery of Nationally EndangeredWildlife Committee (RENEW) prepares recovery plansfor listed species.
The majority of provinces and territorieshave endangered species legislation toprotect species at risk. In 1996, thefederal government signed an Accord forthe Protection of Species at Risk, whichcommitted all of Canada’s jurisdictionsto “establish complementary legis-lation and programs that provide foreffective protection of species at riskthroughout Canada”. Since then, sixprovinces and territories haveintroduced new or improvedendangered species legislation inaddition to the four provinces thatalready had legislation.
The COSEWIC list (1999) ofspecies, subspecies and individualpopulations at risk in Canada includes 116that are forest dependent.
The greatest number of species at risk for specificforest types are found in the coastal forests of BritishColumbia and in the Carolinian forest remnants ofsouthern Ontario. The Carolinian forest is located inthe extreme southwestern region of the MixedwoodPlains ecozone where the Eastern Deciduous Forest ofNorth America has its northernmost limits. It hasexperienced a loss of approximately 80% of its forestcover since European settlement as a result ofagricultural and urban development. Many species thatoccur here do not exist anywhere else in Canada. Morethan half of all forest-dependent species at risk areassociated with the Carolinian forest. Most of thesespecies are not in danger of extinction on a continental
ELEMENT 1.2SPECIES DIVERSITY
CO
NSE
RVAT
ION
OF
BIO
LOG
ICA
L D
IVER
SIT
Y•
Spec
ies
Div
ersi
ty
9
EcosystemDiversity
SpeciesDiversity
GeneticDiversity
CONSERVATIONOF BIOLOGICAL
DIVERSITY
1.2.1
1.2.2
1.2.3
IUCN PROTECTED AREAS CATEGORIES
CATEGORY DEFINITION
I Strict nature reserve/wilderness area Protected area managed mainly for science or wilderness protection
II National park Protected area managed mainly for ecosystem protection and recreation
III Natural monument Protected area managed mainly for conservation of specific natural features
IV Habitat/species management area Protected area managed mainly for conservation through management intervention
V Protected landscape/seascape Protected area managed mainly for landscape/seascape conservation and recreation
VI Managed resource protection area Protected area managed for the sustainable use of natural ecosystems

basis. Their status in Canada results mainly from thenorthern boundary of their ranges extending beyondthe Canada–United States border. Threats to species ofthe temperate rainforests in the Pacific Maritimeecozone include agricultural and urban developmentand conversion of forests to managed forest stands.
A few forest-dependent animals have been moved tolower risk categories or have been delisted in recentyears by COSEWIC. The eastern blue bird, Cooper’shawk and great grey owl have all been removed fromthe COSEWIC list. Conditions for forest-dependentplants have generally deteriorated, however. Fourvascular plants, American ginseng, red mulberry,nodding pogonia and purple twayblade, have changedfrom threatened to endangered status in 1999.
The presence of healthy populations of native forest-dependent animal species is well accepted as anindicator of the functioning of an ecosystem and thesustainability of forest management activities (Indicator1.2.2). The previous C&I report (CCFM 1997)proposed a preliminary list of potential indicatorspecies which could be monitored for differentecozones and stand ages within Canada in order toreport on ecosystem functioning. Population estimatesand trend information are described for selectedmammal species from this list.
Species ranges in Canada have changed over time inresponse to glacial retreats and advances, and over thepast 150 years in response to climate fluctuations.Many forest-dependent species currently occupy asmall portion of their historic range (Indicator 1.2.3).Although hunting and trapping have contributed toreduced distributions of species, most reductions haveresulted from habitat loss.
Indicator species have been used for over 30 years tomonitor change in response to pollution. Morerecently, the monitoring of indicator species has beenextended to determine whether forest managementpractices are having long-term effects on wildlifepopulations and their habitats (McLaren et al. 1998).The presence of a given species indicates that theparticular forest condition needed for that species mustbe available in sufficient amount to maintain theindicator species as well as populations of all speciesnormally found in association with the indicator.
INDICATOR REPORTS
NUMBER OF KNOWN FOREST-DEPENDENT SPECIES CLASSI-FIED AS EXTINCT, THREAT-ENED, ENDANGERED, RARE ORVULNERABLE RELATIVE TOTOTAL NUMBER OF KNOWNFOREST-DEPENDENT SPECIES
It is not yet possible to compare forest-dependentspecies at risk to total forest-dependent species at thenational level because assessments are not complete forall candidate species, particularly butterflies, moths andmollusks. Some provinces have completed this work forcertain taxonomic groups. British Columbia andOntario, for example, have classified most of theirforest-dependent species, including fish, and thefindings have been incorporated into this report.Quebec released its first report on the status of forestbiodiversity in 1996 (Ministère des Ressourcesnaturelles du Québec 1996).
The 1999 COSEWIC status report lists 340 speciessuspected of being at risk in Canada (COSEWIC1999). Because the COSEWIC list includes fullspecies, subspecies and individual populations, the useof “species” in this indicator report refers to all of theabove categories. Most provinces maintain a list ofspecies at risk that includes species not listed byCOSEWIC. This may mean that a species at risk in oneprovince is more common elsewhere in Canada, or thatthe provincial listing process is more advanced than thenational process.
An analysis by the Canadian Forest Service hasassigned the 340 COSEWIC-listed species to fivecategories: 1) forest dependent and forest dwelling, 2)forest dependent but not forest dwelling, 3) forest usingbut not forest dependent, 4) no significant forest useand 5) forest dependence unknown. This analysis isbased on habitat information included in COSEWICreports, supplemented by a review of relevant literature.Table 1.2a describes Canadian species at risk assignedto categories 1 to 3 of forest dependence. At least 116(34%) are category 1 and 2 species, dependent onforests for all or part of their food, shelter orreproductive requirements. Assessing the dependenceof aquatic species (fish, mollusks) requires specialized
1.2.1
CO
NSE
RVAT
ION
OF
BIO
LOG
ICA
L D
IVER
SIT
Y•
Spec
ies
Div
ersi
ty
10

CO
NSE
RVAT
ION
OF
BIO
LOG
ICA
L D
IVER
SIT
Y•
Spec
ies
Div
ersi
ty
11
TABLE 1.2a Canadian species at risk according to degree of forest dependence, November 1999
COSEWIC Forest-dependent, Forest-dependent, Species that may classification forest-dwelling non-forest-dwelling occur in forests but
species species do not depend on them
Endangered plants (41)* American Ginseng Eastern Prickly Pear Bluehearts(vascular and non-vascular) Cucumber Tree Cactus Deltoid Balsamroot
Drooping Trillium Furbish’s Lousewort (2) Englemann’s QuillwortHeart-leaved Plantain Gattinger’s AgalinisLarge Whorled Pogonia Hoary Mountain MintNodding Pogonia Prairie LupinePurple Twayblade Skinner’s AgalinisRed Mulberry Small White Lady’s-slipperSeaside Birds-foot Lotus Water-plantain ButtercupSeaside Centipede Lichen White Prairie Gentian (10)Small Whorled PogoniaSpotted WintergreenWood Poppy (13)
Threatened plants (31) American Chestnut Apple Moss Anticosti Aster(vascular and non-vascular) Blue Ash False Hop Sedge (2) Bird’s-foot Violet
Blunt-lobed Woodsia ColicrootGoldenseal DeerberryKentucky Coffee Tree Goat’s-rueRound-leaved Greenbrier Mosquito Fern
(ON population) White-top Astervan Brunt’s Jacob’s Ladder Yellow MontaneWhite Wood Aster (8) Violet (8)
Vulnerable plants (42) Broad Beech Fern Hill’s Pondweed American Columbo(vascular and non-vascular) Crooked-stemmed Aster New Jersey Rush (2) Branched Bartonia
Cryptic Paw Lichen Bolander’s QuillwortFalse Rue-anemone Coastal Wood FernFew-flowered Club-rush Dense Blazing StarGreen Dragon Dwarf HackberryHop Tree Long’s BulrushOldgrowth Specklebelly Lichen Macoun’s MeadowfoamPhantom Orchid Provancher’s FleabaneSeaside Bone Lichen Swamp Rose MallowShumard Oak Western Silver-leaf Wild Hyacinth (12) Aster (11)
Endangered mammals (12) American Marten Vancouver Island Marmot (1)(NF population)
Wolverine (Eastern population) (2)
Threatened mammals (10) Pacific Water Shrew Townsend's Mole (1)Wood BisonWoodland Caribou
(Gaspé population) (3)
Vulnerable mammals (27) Ermine (Queen Charlotte Pallid Bat (1) Eastern MoleIslands population) Nuttall's Cottontail
Fringed Myotis Bat (BC population)Gaspé Shrew Ord’s Kangaroo RatGrey Fox Western Harvest Mouse Grizzly Bear (BC population) (4)Keen’s Long-eared BatMountain BeaverSouthern Flying SquirrelSpotted BatWolverine
(Western population)Woodland Caribou
(Western population) Woodland Vole (12)
Endangered birds (18) Acadian Flycatcher Harlequin Duck (Eastern population) Barn Owl Kirtland’s Warbler Whooping Crane (2) (Eastern population)Northern Spotted Owl Eskimo CurlewProthonotary Warbler (4) Henslow’s Sparrow
Loggerhead Shrike (Eastern population)
Northern Bobwhite (5)

CO
NSE
RVAT
ION
OF
BIO
LOG
ICA
L D
IVER
SIT
Y•
Spec
ies
Div
ersi
ty
12
TABLE 1.2a Canadian species at risk according to degree of forest dependence, November 1999 (cont’d)
COSEWIC Forest-dependent, Forest-dependent, Species that may classification forest-dwelling non-forest-dwelling occur in forests but
species species do not depend on them
Threatened birds (7) Hooded Warbler Anatum Peregrine Falcon Loggerhead Shrike Marbled Murrelet Yellow-breasted Chat (Prairie population) (1)White-headed Woodpecker (3) (BC population) (2)
Vulnerable birds (22) Ancient Murrelet Peale’s Peregrine Barn Owl (Western Bicknell’s Thrush Falcon (1) population)Cerulean Warbler Ferruginous HawkFlammulated Owl Long-billed CurlewLewis’ Woodpecker Short-eared OwlLouisiana Waterthrush Yellow-breasted ChatPacific Great Blue Heron (Eastern population) (5)Queen Charlotte GoshawkRed-headed WoodpeckerRed-shouldered Hawk (10)
Endangered reptiles Blue Racer Snake (1) Sharp-tailed Snake (1) Lake Erie Water Snake and amphibians (7) Northern Cricket Frog
Northern Leopard Frog (Southern Mountain population) (3)
Threatened reptiles Black Rat Snake Blanding’s Turtle and amphibians (7) Eastern Fox Snake (NS population)
Eastern Massasauga Rattlesnake Queen SnakeFowler’s Toad (4) Spiny Softshell Turtle (3)
Vulnerable reptiles Coeur d’Alène Salamander Spring Salamander (1) Eastern Hognose Snakeand amphibians (17) Five-lined Skink Eastern Yellow-bellied
Mountain Dusky Salamander Racer SnakeNorthern Red-legged Frog Northern Leopard Frog Pacific Giant Salamander (Prairie population)Smallmouth Salamander Spotted Turtle (4)Wood Turtle (7)
Endangered fish (4) Nooksack DaceSalish Sucker (2)
Threatened fish (18) Shorthead Sculpin Copper Redhorse Enos Lake SticklebackMorrison Creek Lamprey (2) Lake Simcoe Whitefish (2) Lake Utopia Dwarf Smelt
Benthic Paxton Lake Stickleback
Limnetic Paxton Lake Stickleback (4)
Vulnerable fish (42) Redside Dace Charlotte Unarmoured Cultus Pygmy SculpinSpeckled Dace Stickleback Giant SticklebackUmatilla Dace (3) Chestnut Lamprey (2) Lake Lamprey
White Sturgeon (4)
Endangered lepidopterans (1) Maritime Ringlet Butterfly(1)
Vulnerable lepidopterans (1) Monarch Butterfly (1)
Endangered mollusks (4) Hotwater Physa (1)
Threatened mollusks (2) Banff Springs Snail (1)
Extinct species (12) Passenger Pigeon Woodland Caribou
(Queen Charlotte Islands population) (2)
Extirpated species (15) Blue-eyed MaryKarner Blue Butterfly Frosted Elfin ButterflyIsland Marble Butterfly (4)
*Numbers in parentheses indicate the total number of species in each classification. Source: COSEWIC Status Reports (COSEWIC 1999)

approaches, and most have been placed in the“unknown” category.
The largest concentrations of forest-dependentspecies at risk are found in the coastal forests of BritishColumbia (Pacific Maritime ecozone) and in theCarolinian forest remnants of southern Ontario(Mixedwood Plains ecozone). Canada’s vast BorealForest contains a much smaller number of species atrisk, but several animal species—grizzly bear, woodlandcaribou, wolverine, Newfoundland pine marten, woodbison—pose particular challenges for public agenciesand industries involved in management activities.These animals are often intolerant of high levels ofhuman intrusion, may have complex habitatrequirements, and need large areas of older forest.
COSEWIC has downlisted two forest-dependentanimal species from endangered to threatened statusin recent years (wood bison, peregrine falcon). Threeothers have been removed from the list (easternbluebird, Cooper’s hawk, great grey owl) as a result ofimprovements in their condition or betterinformation about their populations. However, fourspecies have been classified in more severe categories.The Newfoundland population of the pine martenand the prothonotary warbler are now considered to
be endangered, Fowler’s toad is listed as threatened,and the mountain beaver has moved into thevulnerable category.
Conditions for forest-dependent plants at risk hasnot improved in recent years. No forest-dependentplants have yet been downlisted by COSEWIC, andfour (American ginseng, red mulberry, noddingpogonia, and purple twayblade) were uplisted fromthreatened to endangered status in 1999. The latterthree are all Carolinian forest species, facing threatsfrom habitat loss and alien invasive plants. Americanginseng, whose range extends into the Great Lakes-St.Lawrence forest of Quebec and Ontario, is endangeredprimarily because of over harvesting of the plant.
The list of species that use forests but do not dependon them includes a number of savannah, or openwoodland species (Table 1.2b). Other savannah speciesare included as forest-dependent and forest-dwelling,and the distinction between the two is somewhatartificial. Whether or not the presence of trees isessential for survival of these species, the savannahcommunities in which they occur (including Garry oakwoodlands in British Columbia and black oakwoodlands in southern Ontario) are among the rarestin Canada. Savannahs require periodic ground fires to
CO
NSE
RVAT
ION
OF
BIO
LOG
ICA
L D
IVER
SIT
Y•
Spec
ies
Div
ersi
ty
13
TABLE 1.2b Some Canadian species at risk that use savannah habitats
STATUS PLANTS ANIMALS
Extirpated Karner Blue Butterfly
Endangered Deltoid Balsamroot, Blue Racer Snake,Prairie Lupine, Loggerhead Shrike,Seaside Birds-foot Lotus, Northern BobwhiteWater-plantain Buttercup,White Prairie Gentian
Threatened Apple Moss, Fowler’s ToadBird’s-foot Violet,Blue Ash,Colicroot,Deerberry,Goat’s-rue,White-top Aster,White Wood Aster,Yellow Montane Violet
Vulnerable Coastal Wood Fern, Eastern Hognose Snake,Dense Blazing Star, Eastern Yellow-bellied Racer Snake,Hop Tree, Ord’s Kangaroo Rat,Western Silver-leaf Aster Spotted Turtle
Source: COSEWIC Status Reports (COSEWIC 1999)

limit invasion of native shrubs and alien plant species,but they are often found in developed areas where theuse of prescribed fire as a management tool posesparticular challenges. The rarity of these habitats meansthat extirpation is a risk for some species. The Karnerblue butterfly is a fire-dependent oak savannah speciesthat formerly occurred in southern Ontario but has notbeen sighted in the province since 1991.
POPULATION LEVELS ANDCHANGES OVER TIME OFSELECTED SPECIES ANDSPECIES GUILDS
The previous C&I report (CCFM 1997) suggested that apool of species for three forest stages be chosen andmonitored as indicators of the functioning of forestecosystems in different ecozones. While consensus has yetto be reached on a national list of forest indicator species,provincial agencies have been actively involved inidentifying species that are useful for indicating changesin habitats over time and specific features of forests suchas structure and age class. Several of the 30 proposedmammal indicator species were included in a statusassessment prepared for the Canadian Forest Service, theCanadian Pulp and Paper Association and theBiodiversity Convention Office (Alvo 1998). Table 1.2csummarizes results for the species assessed in Alvo (1998).
Grizzly bear, woodland caribou, and wapiti (elk) havebeen extirpated from eastern portions of their originalranges. Wolf, black bear, fisher, lynx and marten haveall been extirpated from Prince Edward Island,illustrating a trend of species loss observed on smallislands around the world. Moose and snowshoe harewere intentionally introduced and grew rapidly innumbers on insular Newfoundland.
Four of the mammal species in Table 1.2c have beenexamined by COSEWIC. Black bear was reviewed in1999 and judged to be not at risk. Grizzly (or brown)bear was designated not at risk in 1979 and becamevulnerable in 1991. These adjustments reflected thesensitivity of the species to environmental changes andhunting pressure. The Newfoundland population ofthe American (or pine) marten was first listed as not atrisk in 1979, was reclassified as threatened in 1986, andsubsequently became endangered in 1996. Woodlandcaribou (the non-migratory caribou) is native to allCanadian provinces and territories except Prince
Edward Island. It has steadily retreated in the face ofhuman development in the eastern and southernportions of its original range. A small population on theGaspé Peninsula of Quebec is considered to bethreatened, and the population from Ontario westwardis vulnerable. The Labrador-Ungava (Newfoundlandand Labrador and Quebec) and Newfoundlandpopulations were both examined in 1984 and found tobe not at risk.
Information on the 32 bird species suggested asindicators (CCFM 1997) is presented in Table 1.2d. Ofthese, 16 have been reviewed one or more times byCOSEWIC, and 13 have been designated asvulnerable, threatened, or endangered. For several ofthe species not reviewed by COSEWIC, the CanadianWildlife Service provides 30-year population trendsbased on breeding bird survey data (Hyslop andKennedy 1996). The pileated woodpecker showed astatistically significant increase between 1966 and1996, while the boreal chickadee and gray-cheekedthrush declined in numbers. Ruffed grouse declinedsignificantly in British Columbia and Nova Scotia, butshowed no significant trend nationally. In interpretingthese results, it is important to recognize the limitationsof breeding bird survey data. Sampling is done byvolunteers who drive along roads, stop at intervals, andrecord species by their songs. As a result, samples areconcentrated in southern Canada where volunteers aremost available. Data are lacking for more remote areas(including much of the boreal forest), while species thatare naturally rare or are at risk are not sampledfrequently enough to assess trends.
NUMBER OF KNOWN FOREST-DEPENDENT SPECIES THATOCCUPY ONLY A SMALL PORTION OF THEIR FORMERRANGE
Indicator 1.2.3 can be interpreted in two differentways: the current range of a species may be signifi-cantly smaller than its original range, or a species maynow be found in only a small percentage of habitatsformerly occupied within its historic range. Theformer interpretation would more likely be applied tomammals, and the latter to plants. Definingsustainable forest management: A Canadian approach tocriteria and indicators, (CCFM 1995), which outlined
1.2.3
1.2.2
CO
NSE
RVAT
ION
OF
BIO
LOG
ICA
L D
IVER
SIT
Y•
Spec
ies
Div
ersi
ty
14

CO
NSE
RVAT
ION
OF
BIO
LOG
ICA
L D
IVER
SIT
Y•
Spec
ies
Div
ersi
ty
15
TA
BL
E 1
.2c
Popu
latio
n es
timat
es (
thou
sand
s) a
nd t
rend
s,by
pro
vinc
e/te
rrito
ry,f
or m
amm
als
prop
osed
as
indi
cato
r sp
ecie
s
Spe
cies
Eco
zone
sA
geY
KN
TB
CA
BS
KM
BO
NQ
CN
BN
SP
EN
F**
*
Bla
ckM
CY
(10)
*(5
)(1
40)
28.3
**(2
4)(2
9)75
-100
60(1
2)7-
80
6-10
Bea
r(S
)(S
)(S
)S
(S)
(S-I)
S-I
D?
(S-I)
SX
189
4S
Gri
zzly
M
C,B
PP
(5)
(4-5
)(1
0-13
)(1
)0
00
00
00
0B
ear
(S)
(S)
(D)
(I?)
n/o
n/o
n/o
n/o
n/o
n/o
Fis
her
GL-
SLP
(R)
(5)
(1-1
.5)
(9)
(7.5
)(1
0)(1
8.5)
(13.
5)(1
)1-
30
0?
?(D
?)(I)
(S-I?
)(S
)I
(S-I)
(S)
DX
189
0n/
o
Lynx
BP,B
S Y
(7-5
5)(2
-16)
(2-8
0)(6
-60)
(6-4
6)(5
-75)
(15-
114)
(20-
147)
(0.7
-5)
<1
0(6
-43)
MC
,AM
Y(S
?)(S
?)(S
)(S
?)(S
)S
S(S
)?
DX
180
0(I
)
Mar
ten
MC
,BP
M(6
0)(1
78)
(124
)(3
5)(5
1)(8
0)(1
30)
(160
)(3
)<
10
0.3
BS,A
MM
(I)(D
?)(D
)(I)
(S?)
(S-I)
S(S
)(S
)D
X
187
9D
GL-
SLY
Mo
ose
MC
,BP
Y(6
3)(1
37)
(170
)72
.3(4
0)(3
2)12
070
(23)
4.8-
60
115
BS,G
L-SL
Y(S
)?
(S-D
)S-
D(D
)S
SI
(I)S-
DX
?N
187
8
Mul
e M
C
Y(0
.75)
0(3
45)
17(5
0)(0
.4)
00
00
00
Dee
r(I)
n/o
S-D
S(S
)(S
)n/
on/
on/
on/
on/
on/
o
Wap
iti
BP
Y,P
(.09)
?43
13.6
(12)
(9)
0.12
00
00
0(E
lk)
(?)
?S-
DI
(S)
(I)R
e 19
32X
n/o
n/o
n/o
n/o
Whi
te-
GL-
SL,A
MY
(R)
(R)
6443
.2(3
50)
(120
)35
0(3
00)
(69)
670
0ta
iled
Dee
r C
Y,P
(I)(I)
S-D
I(S
)(I)
S(I)
IS
n/o
n/o
Wo
odl
and
MC
P,
M(3
2)(1
3)16
.5(5
)(6
-9)
(2-1
8)20
7-8
00
095
Car
ibo
uBP
,BS
P(I)
?S-
D(S
-D)
(D)
(S-D
)S-
DS
X 1
927
X 1
925
X 1
765
I
Eco
zone
sFo
rest
Age
Cla
ssVa
lues
MC:
Mon
tane
Cor
dille
raY:
Youn
g (s
hrub
,sap
ling)
A:Ab
unda
ntRe
:Re
intro
duce
d af
ter
extir
patio
nBP
:Bo
real
Pla
ins
P:Po
le (
pole
,sm
all t
ree)
C:Co
mm
onR:
Rare
BS:
Bore
al S
hiel
dM
:M
atur
e an
d ol
dS:
Stab
leN
:N
ew in
trodu
ctio
nG
L-SL
:G
reat
Lak
es -
St.L
awre
nce
I:In
crea
sing
n/o:
Nev
er o
ccur
red
C:Ca
rolin
ian
(Mixe
dwoo
d Pl
ains
)D
:Dec
reas
ing
?:U
ncer
tain
AM:
Atla
ntic
Mar
itim
eX
:Ex
tirpa
ted
*Val
ues
with
par
enth
eses
are
from
Alvo
(19
98).
**Va
lues
with
out
pare
nthe
ses
are
from
pro
vincia
l age
ncie
s.**
*New
foun
dlan
d da
ta d
o no
t in
clud
e La
brad
or.
Sour
ce:
Alvo
199
8,Pr
ovin
cial/T
errit
oria
l age
ncie
s,M
cLar
en e
t al
.199
7

the framework, does not offer guidance on whichinterpretation to use. The Montréal Process Criteriaand indicators for the conservation and sustainablemanagement of temperate and boreal forests includes thesame indicator (1.3b), however, and defines it interms of changes in total range: species that are“dependent on forest types that have been signifi-cantly cleared for other purposes” (Montréal ProcessWorking Group in press).
There is no database describing historic and currentranges of species in Canada. Many forest-dependentspecies occupy only small portions of their historicrange. Habitat loss, hunting and trapping, and theintroduction of alien species may all contribute to
range reductions. Table 1.2e lists species not reviewedby COSEWIC that have been affected primarily byhabitat loss, either through clearing of forest lands foragriculture and settlement or by reductions in theamount of forests in the older age classes.
While the original Carolinian forest of southwesternOntario has experienced a high degree of landconversion for agriculture and urban development, theremaining forest is fragmented and much of it has beenrepeatedly harvested and lacks the structural features(e.g., woody debris) of mature forests. This has resultedin significant range contractions for all forest-dependent plant species and a number of amphibianand reptile species. The Jefferson salamander now only
CO
NSE
RVAT
ION
OF
BIO
LOG
ICA
L D
IVER
SIT
Y•
Spec
ies
Div
ersi
ty
16
TABLE 1.2d Status of bird species
FOREST SPECIES CANADA TREND, AREAS OF COSEWIC AGE 1966-1996 CONCERN ACTION
Younga Lewis’ Woodpecker No data BC Listed in 1999 - vulnerableGolden-crowned Sparrow No data N/Ad
Ruffed Grouse - 1.6 % BC, NS N/AHairy Woodpecker + 1.5 % N/AHooded Warbler No data ON Listed in 1994 - threatened
Pole Queen Charlotte Goshawk No data BC Listed in 1995 - vulnerablePeale’s Peregrine Falcon No data BC Listed in 1978 - vulnerableFlammulated Owl No data BC Listed in 1988 - vulnerableMountain Chickadee - 1.1 % N/ABoreal Chickadee - 9.7 % c NB, ON, QC, N/ARed Crossbill - 0.5 % NF Under reviewVaried Thrush + 1.4 % N/ABarred Owl - 2.8 % N/ACooper’s Hawk + 6.0 % Delisted in 1996Ovenbird + 0.0 % N/ARed-shouldered Hawk -13.1 % ON,QC, Listed in 1996 - vulnerablePileated Woodpecker + 1.7 % c N/ARed-bellied Woodpecker No data N/ACerulean Warbler No data ON,QC Listed in 1993 - vulnerableAcadian Flycatcher No data ON Listed in 1994 - endangeredBicknell’s Thrushb No data NB, NS,QC Listed in 1999 - vulnerable
Mature Marbled Murrelet No data BC Listed in 1990 - threatenedWilliamson’s Sapsucker No data N/AWhite-headed Woodpecker No data BC Listed in 1992 - threatenedBlack-backed Woodpecker - 1.0 % N/AThree-toed Woodpecker No data N/ANorthern Spotted Owl No data BC Listed in 1986 - endangeredHammond’s Flycatcher + 0.4 % N/ABoreal Owl No data Not at risk 1995Gray-cheeked Thrush - 8.9 % c Eastern Canada N/AEastern Screech-Owl No data Not at risk 1986Prothonotary Warbler No data ON Uplisted in 1996 - endangered
aYoung: shrub, sapling; Pole: small tree; Mature: mature and old.bBicknell’s Thrush, formerly considered a subspecies of the Gray-cheeked Thrush, was given full species status in 1995.cTrend is statistically significant at the 5% probability level.dN/A: No action. Source: Hyslop and Kennedy 1996

occurs in a few locations in the “Golden Horseshoe”around the western end of Lake Ontario, a highlyurbanized area. The wood turtle, which formerlyoccurred throughout southwestern Ontario, is nowlimited to a few locations further north, such asAlgonquin Park. The black rat snake has alsodisappeared from southwestern Ontario, but persists tothe east in the Rideau Lakes area. The timberrattlesnake was formerly found along the NiagaraEscarpment, but has retreated to the south and is nowlikely extirpated from Canada, although it may stilloccur in the Niagara Gorge.
While forests in eastern Canada still occupy well overhalf their original area, the ranges of many mammalspecies have shrunk in response to regional habitat loss,hunting and trapping, and frequent humandisturbance. The gray wolf, woodland caribou, andwolverine have been extripated from southern Ontario,Quebec, and most eastern provinces (Indicator 1.2.2).The fisher, lynx, marten and moose now occur only ona small portion of their former range in Nova Scotia.Prince Edward Island has experienced the greatest
degree of forest clearing of any Canadian province (justover 50%). European settlement occurred around1700; fisher, lynx, marten, wolf, black bear, caribouand possibly moose were all extirpated before 1900.
There are fewer documented examples of majordeclines in species ranges in western Canada. The grizzlybear once roamed widely throughout the grasslands andaspen parklands in the southern Prairie provinces, butPrairie populations were extirpated in the late 1800s,and the species’ range has been pushed to the west andnorth. The woodland caribou has disappeared fromsouthern portions of its range in western Canada, andfrom some mountainous areas in British Columbia. Therange of wood bison has contracted significantly. Thewood bison is listed by COSEWIC (1999) as threatenedwhile the grizzly bear and western population ofwoodland caribou are vulnerable.
It should be noted that a “range contraction”definition for this indicator is problematic for somegroups—particularly plants and birds. Most individualpopulations of American ginseng have been lost,
CO
NSE
RVAT
ION
OF
BIO
LOG
ICA
L D
IVER
SIT
Y•
Spec
ies
Div
ersi
ty
17
TABLE 1.2e Forest-dependent species, by ecozone, that occupy a small portion of their former range (excluding species listed by COSEWIC)
ECOZONE ANIMALS PLANTS
Pacific Black-tailed Deer, Roosevelt Elk,Townsend’s Chipmunk, Garry Oak,Yellow-cedarMaritime Trowbridge’s Shrew, Sitka Mouse, Pacific Jumping Mouse,
Shrew-mole,Townsend’s Big-eared Bat,Yuma Myotis Bat,Silver-haired Bat, Clouded Salamander,Varied Thrush,Vaux’s Swift
Montane Rocky Mountain Elk, Fisher, Silver-haired Bat,Yuma Myotis Ponderosa PineCordillera Bat,Townsend’s Big-eared Bat, Gopher Snake,Tailed Frog,
Varied Thrush,Three Toed Woodpecker,Williamson’s Sapsucker,Vaux’s Swift, Mountain Chickadee
Great Lakes / Canada Lynx,Wapiti, River Otter, Silver-haired Bat, White Pine, Red Pine, Eastern St. Lawrence* Small-footed Bat, Brown Snake, Pickerel Frog, Bald Eagle, Hemlock,White Spruce, Red Spruce,
Golden Eagle, Peregine Falcon, Cooper’s Hawk, Great Grey Wild Leek,Autumn Coral-rootOwl, Barred Owl, Spruce Grouse, Black-backed Woodpecker
Carolinian** Bobcat, Fisher, Marten, River Otter,Wild Turkey, Screech Owl All forest-dependent species
Boreal Shield Silver-haired Bat, Barred Owl, Boreal Owl, Black-backed White Pine, Black Spruce,White Woodpecker,Three-toed Woodpecker, Grey-cheeked Thrush, SpruceRed Crossbill
Boreal Plains Silver-haired Bat, Barred Owl, Boreal Owl, Black-backed Green Ash,White SpruceWoodpecker,Three-toed Woodpecker,Varied Thrush
Atlantic Fisher, Lynx, Marten, Barred Owl, Black-backed Woodpecker, White Pine, Red Pine, Red Spruce,Maritime Three-toed Woodpecker Eastern Hemlock*The Great Lakes-St. Lawrence forest, which includes the northern portion of the Mixedwood Plains ecozone and the southern portion of
the Boreal Shield ecozone in extreme southeastern Manitoba, Ontario and Quebec, has its own characteristic group of species (see p. 5).
**The Carolinian forest, which is part of the Mixedwood Plains ecozone in extreme southwestern Ontario,has a unique and characteristic group of species. Source: CCFM 1997

primarily because of over harvesting of the plant rootsfor their alleged medicinal properties. The remainingpopulations are widely scattered throughout theiroriginal range in Ontario and Quebec. Similarly, manygreat blue heron rookeries in British Columbia havedisappeared because of human disturbance and habitatloss, but the species can still be seen occasionally overmost of its original range in the province.
References
Alvo, R. 1998. National status of 20 selected animalspecies inhabiting Canada’s forests. Report prepared forthe Canadian Pulp and Paper Association, BiodiversityConvention Office and Natural Resources Canada—Canadian Forest Service. Gavia Biological Services.Hull, QC. 328 p.
Canadian Council of Forest Ministers. 1992.National forest strategy, sustainable forests: A Canadiancommitment. Natural Resources Canada. Ottawa,ON. 51 p.
Canadian Council of Forest Ministers. 1995.Defining sustainable forest management: A Canadianapproach to criteria and indicators. Natural ResourcesCanada. Ottawa, ON. 22 p.
Canadian Council of Forest Ministers. 1997. Criteriaand indicators of sustainable forest management inCanada: Technical report. Natural Resources Canada.Ottawa, ON. 137 p.
Canadian Council of Forest Ministers. 1998.National forest strategy (1998-2003), sustainableforests: A Canadian commitment. Natural ResourcesCanada. Ottawa, ON. 47 p.
COSEWIC. 1999. Canadian species at risk. 1999.Committee on the status of endangered wildlife inCanada. 26 p.
Ecological Stratification Working Group. 1996. Anational ecological framework for Canada. Agricultureand Agri-Food Canada—Centre for Land and BiologicalResources and Environment Canada—State of theEnvironment. Ottawa, ON/Hull, QC. 125 p. + map.
Environment Canada. 1997. Technical supplementto the environmental indicators on sustaining Canada’sforests: Forest biodiversity. State of the environment—Technical supplement No. 97-1.
Gray, S.L.; Power, K. 1997. Canada's ForestInventory 1991: 1994 version. Technical supplement.Information report BC-X-363. Natural ResourcesCanada—Canadian Forest Service—Pacific ForestryCentre. Victoria, BC. 73 p.
Haddon, B.D. (ed.) 1988. Forest inventory terms inCanada. 3rd ed. Canadian Forest InventoryCommittee. Natural Resources Canada. 109 p.
Hyslop, C.F.; Kennedy, J.A. 1996. Canadian BirdTrends Database. Environment Canada—CanadianWildlife Service. [online]. http://www3.ec.gc.ca/Birds/default.cfm Accessed March 2000.
LaPierre, L. 1997. A protected areas strategy for NewBrunswick. [on line]. http://www.gnb.ca/0078/pasnb/strategy/sumpub.htm Accessed February 2000.
Lowe, J.J.; Power, K.; Gray, S.L. 1996. Canada's forestinventory 1991: 1994 version. An addendum toCanada’s Forest Inventory 1991. Information report BC-X-362E. Natural Resources Canada–Canadian ForestService–Pacific Forestry Centre. Victoria, BC. 23 p.
McLaren, M.A.; Thompson I.D.; Baker, J.A. 1998.Selection of vertebrate wildlife indicators formonitoring sustainable forest management in Ontario.The Forestry Chronicle 74: 241-248.
Ministère des Ressources naturelles du Québec.1996. Biodiversité du milieu forestier–Bilan etengagements du ministère des Ressources naturelles.Gouvernement du Québec. Québec, QC. 152 p.
Montréal Process Working Group. In press. Criteriaand indicators for the conservation and sustainablemanagement of temperate and boreal forests. TechnicalNotes. Revised December 1998. 74 p. + 5 appendices.
Mosquin, T.; Whiting, P.G.; McAllister, D.E. 1995.Canada’s biodiversity: The variety of life, its status,economic benefits, conservation costs and unmetneeds. Canadian Museum of Nature. Ottawa, ON.
Ontario Ministry of Natural Resources. 1997. Anassessment of Ontario’s forest resources 1996. Queen’sPrinter for Ontario. Sault Ste. Marie, ON. 133 p.
World Wildlife Fund. 1999. Canada’s commitmentto forest protected areas: Forests for life. WWF Status Report. World Wildlife Fund Canada. Toronto, ON. 17 p.
CO
NSE
RVAT
ION
OF
BIO
LOG
ICA
L D
IVER
SIT
Y•
Spec
ies
Div
ersi
ty
18

CO
NSE
RVAT
ION
OF
BIO
LOG
ICA
L D
IVER
SIT
Y•
Spec
ies
Div
ersi
ty
19

2.1 Incidence of Disturbance and Stress
2.1.1
2.1.3
2.1.4
2.1.5
2.1.8
2.2.2
2.3.1
2.2 Ecosystem Resilience
2.3 Extant Biomass
Area and severity of insect attack
Area and severity of fire damage
Rates of pollutant deposition
Ozone concentrations in forested regions
Climate change as measured by temperature sums
Percentage of area successfully naturally regenerated and artificially regenerated
Mean annual increment by forest type and age class
MAINTENANCE AND ENHANCEMENT OF FORESTECOSYSTEM CONDITION AND PRODUCTIVITY
CRITERION 2
INTRODUCTION

21
ELEMENT OVERVIEW
Ecosystems are constantly changing. Many of thesechanges are adaptations to disturbance. Disturbancesgenerally cause ecosystems to revert to earlier succes-sional stages or divert to new successional patterns.The ability of forest ecosystems to adapt to the variousstresses placed upon them is fundamental to theircontinued health and vitality and, therefore, produc-
tivity. Disturbances may be part of natural ecologicalcycles or the result of human activities. Naturaldisturbance is fundamental to the functioning of forestecosystem processes. Some forests, such as the Boreal,actually depend on these disturbances for theirrenewal. Human-induced stress and disturbanceinclude introduced (alien) insects, diseases, plants andwildlife, fire suppression, air pollution (e.g., acid rain,smog, toxic chemicals) and land-use practices. Some ofthese factors may be linked. Fire, for example, iscommonly correlated with drought, although otherdisturbances that promote ignition conditions, such asinsects, may also be involved. Together, these stressorsform a dynamic complex that may have cumulativeimpacts, both positive and negative, on forest
ELEMENT 2.1INCIDENCE OF DISTURBANCEAND STRESS
ECO
SYST
EM C
ON
DIT
ION
AN
D P
ROD
UC
TIV
ITY
•In
cide
nce
of D
istu
rban
ce a
nd S
tres
s
INTRODUCTION
Forest condition is a measure of relative freedom from stress and the relative level of
physical/biological energy within a forest ecosystem.Together, forest health and vitality
provide an indication of ecosystem condition.
Productivity refers to the rate of production of organic matter within forest ecosystems.
Forest productivity results from interactions between biological components (fauna and
flora) and abiotic factors such as soil, water, and climate. Sustainable productivity is
dependent upon the ability of forest ecosystems to recover from or adapt to disturbances,
whether they be natural or human-induced.A healthy and diverse ecosystem is better able
to respond to and recover from changes in its environment.
Forest productivity gives rise to a supply of products and services. It can be measured by
evaluating the magnitude and impact of various disturbances and determining the forest’s
ability to sustain itself through various renewal processes such as natural regeneration or
management activities.While most disturbance and stress events are fundamental to the recovery
and maintenance of forested ecosystems, others may actually impede resilience, alter ecosystem
patterns and processes, or affect forest health. Measuring disturbance and stress caused by abiotic and
biotic factors provides a basis for improved decision making in managing forests as a renewable resource.
Element 2.1 (Incidence of Disturbance and Stress) examines the frequency and severity of major biotic
(insects, disease, direct human impact) and abiotic (fire, pollution, temperature) stressors affecting forest
ecosystems. Element 2.2 (Ecosystem Resilience) attempts to measure the ability of forest ecosystems to
recover from stress through an examination of regeneration after harvesting. Finally, Element 2.3 (Extant
Biomass) provides some understanding of forest ecosystem conditions in Canada by measuring forest biomass
productivity and accumulation.
Disturbanceand Stress
EcosystemResilience
ExtantBiomass
ECOSYSTEMCONDITION ANDPRODUCTIVITY
2.1.1
2.1.3
2.1.4
2.1.5
2.1.8
MAINTENANCE AND ENHANCE-MENT OF FOREST ECOSYSTEMCONDITION AND PRODUCTIVITY

ECO
SYST
EM C
ON
DIT
ION
AN
D P
ROD
UC
TIV
ITY
•In
cide
nce
of D
istu
rban
ce a
nd S
tres
s
22
conditions over time. Understanding the impact ofdisturbance regimes on ecosystem processes, at theappropriate spatial and temporal scales, is fundamentalto sustainable forest management.
The ability to differentiate between changes in forestecosystems that are caused by human interference andthose caused by natural ecological variability is key tothe maintenance and enhancement of desirable forestecosystem condition and productivity. Tracking theextent and severity of the indicators that characterizethis element provides baseline information from whichto build an understanding of the year-to-yearvariation. As our knowledge base expands, the relativeinfluence of human-induced stressors on ecologicalcycles will be determined.
Although capable of causing extensive timber loss,native insects (Indicator 2.1.1) are an intrinsiccomponent of forest ecosystems, contributing tonutrient cycling and pollination. Along with othernatural influences such as fire, they are the drivers ofdiversity, structure and function in Canada’s forests.Losses due to insects and diseases in Canada have beenestimated to be equivalent to one third of the annualharvest (Hall and Moody 1994). The spruce budwormand forest tent caterpillar are the dominant insectsdamaging conifer and broadleaved trees, respectively.The cyclical nature of native populations of forestinsects is demonstrated through examples of the areadefoliated by these insects over time.
Forest fire (Indicator 2.1.3) has been an integral partof Canada’s landscapes for millennia. It hastraditionally been considered to be a disturbance, and isprobably most widely known and studied in this role.Fire regimes are cyclical and are influenced by severalinterrelated factors, including climate, vegetation type,ignition sources and insects. Fire affects the structure,composition and functions of ecosystems. Wildlandfire threatens forest communities and consumes nearlyas much wood as is harvested. Fire managementaccounts for a significant part of the cost of forestmanagement in Canada. Fire management policiesstrive to balance suppression with allowing fire tomaintain its natural role in managing the landscape.
Fire activity (number of fires and area burned) inCanada over a 25-year period is described in thisreport. Over the period 1974 to 1998, the number offires shows no notable trend. The lowest number of
fires and the lowest levels for area burned since 1974were recorded in 1997. However, the most recent 10-year average area burned showed a significant increasedue to three extreme years.
Many pollutants affect forest ecosystems. Of these,acidic deposition, ozone, nitrates and heavy metals arethe best known. While the effects of pollution damagehave been duplicated under laboratory conditions, themechanism of cause and effect under ambient levels ofpollution is difficult to demonstrate. Pollutants(Indicator 2.1.4) travel globally via the atmosphere,impacting on forest ecosystems through dry and wetdeposition pathways. Dry deposition is difficult andexpensive to measure and is usually calculated fromavailable air concentrations. Wet deposition includesprecipitation in the form of rain, snow and fog.
Two of the most common types of air pollutants inCanada’s forest ecosystems are sulphur dioxide (SO2)and nitrogen oxides (NOx), along with their oxidationproducts, sulphuric acids and nitric acids, respectively.There is increasing evidence linking the long-termeffects of deposition of these acids to the disruption ofbiogeochemical processes and the decline of annualaccumulation of biomass in the forest. Acidicdeposition is a continuing concern for the health ofsensitive forest ecosystems, particularly in south-eastern Canada. A new long-term goal to not exceedcritical loads for acidic deposition has been set toprotect forest ecosystems.
Tropospheric or ground-level ozone (Indicator 2.1.5)is produced in the Earth’s lower atmosphere fromphotochemical reactions involving nitrogen oxides(NOx) and volatile organic compounds (VOC) in thepresence of sunlight. Ozone builds up in the loweratmosphere, especially on hot days in cities, and driftsinto the surrounding areas. It is a regional-scalepollutant subject to long-range transport. Ozone mayadversely affect the metabolic systems of plants andbecome toxic to trees. Decreased photosynthesis,premature defoliation and loss of plant productivitymay result from plant exposure to ozone exceeding twoto three times background levels over a number ofgrowing seasons. Ecosystem structure and functionmay also be altered, depending on the sensitivities ofvarious species. Although time series analysis hasidentified a declining trend in daily maximum ozoneconcentrations in Canada, three areas have beenidentified where the national objectives for hourly

ECO
SYST
EM C
ON
DIT
ION
AN
D P
ROD
UC
TIV
ITY
•In
cide
nce
of D
istu
rban
ce a
nd S
tres
s
23
ground level ozone are exceeded. These areas are: thesouthern Maritimes, the Quebec-Windsor corridor andthe lower Fraser Valley in southern British Columbia.
Climate, particularly temperature (Indicator 2.1.8),is a major factor affecting Canada’s forests. The range oftree species present, the growth rate, and the produc-tivity of the forest are all influenced by temperature,particularly the quantity of heat received during thegrowing season. Temperature also plays direct andindirect roles in natural disturbances such as fire,disease, and insect outbreaks. As a result, changes orincreased variation in temperature can affect thesustainability of forests. Predictions for the effects ofglobal climate change on forest ecosystems (IPCC1998) include increased growth and range extension ofsome forests, but declining health in others in responseto increased biotic and abiotic stresses. Observationsacross Canada over the past 45 years suggest thatannual temperatures have increased in the west andnorth, while little change is evident in the east.
Because of incomplete data and insufficient spatialand temporal coverage, interpolation techniques arerequired to estimate climate in most forested areas, andresults must therefore be interpreted with caution. Theimplications for climate change on the sustainability ofCanada’s forest remain uncertain.
INDICATOR REPORTS
AREA AND SEVERITY OFINSECT ATTACK
Several native North American insect species— sprucebudworm, forest tent caterpillar, hemlock looper andjack pine budworm—annually defoliate areas ofCanada’s forest (Natural Resources Canada 1999). TheCanadian Forest Service and the provinces andterritories collect and compile aerial survey data onnational insect defoliation. Annual regional andprovincial coverages of insect defoliation are combinedto produce a national overview of defoliation for eachinsect by year. Only moderate (defined as 30 to 69%defoliation) and severe damage (defined as 70%defoliation or greater) categories are illustrated inFigures 2.1a, 2.1b and 2.1c. Although every effort hasbeen made to ensure that the figures accuratelyrepresent actual forest conditions, the data must be
treated with caution as varying standards of datacollection and compilation exist across the nation. Inaddition, some non-forested areas such as roads,cultivated land, small lakes and burned areas may beincluded in the areas reported.
The spruce budworm (Choristoneura fumiferana) isconsidered to be the most destructive pest of fir andspruce forests in eastern Canada. It occurs to varyingdegrees within several ecozones, but particularly in theBoreal Shield and Atlantic Maritime ecozones (Figure2.1a). The spruce budworm is reported to attack 25tree species, including fir, spruce, pine, hemlock, larchand juniper. Growth of balsam fir declines once 30% ofthe foliage is destroyed. Mortality results after four tofive years of moderate to severe defoliation (NaturalResources Canada 1999). Large outbreaks of sprucebudworm defoliation follow fluctuations in the insectlife cycle. Changes in the composition of the forestassociated with fire suppression and harvesting arepossible factors influencing the frequency and durationof the attacks (Blais 1983). At its peak in 1975, thespruce budworm defoliated 54 million hectares atmoderate to severe levels. There has been a decline intotal annual area defoliated from 28 million hectares in1980 to 1.8 million hectares in 1996.
The forest tent caterpillar (Malacosoma disstria), adefoliator of hardwood species, is widely distributedacross Canada (Figure 2.1b).The tree species of choicefor this pest is the trembling aspen. To a lesser degree,it attacks other poplars, sugar maple and oak. Althoughthe forest tent caterpillar defoliates trees over large areasand may cause extensive growth losses, it generally doesnot result in mortality or have a long-term impact onforest growth unless prolonged severe defoliation orrepeated defoliation accompanied by severe droughtoccurs. Between 1980 and 1996, there were two cyclesof elevated population numbers and a shift in distri-bution of defoliation from the Boreal Plains to theBoreal Shield.
Figure 2.1c describes the frequency and extent offorest tent caterpillar outbreaks in British Columbia,spanning more than 50 years. The cyclical nature ofinfestation levels has been attributed to land-usechanges, fire suppression and the availability of hostspecies. The higher numbers in recent years may reflectmore dedicated monitoring efforts.
2.1.1

ECO
SYST
EM C
ON
DIT
ION
AN
D P
ROD
UC
TIV
ITY
•In
cide
nce
of D
istu
rban
ce a
nd S
tres
s
24
Prairies
Severe to moderatespruce budworm defoliation
'80 '81 '82 '83 '84 '85 '86 '87 '88 '89 '90 '91 '92 '93 '94 '95 '96
Mill
ion
ha
Year
Atlantic Maritime
0
1
2
3
4
5
6
0
1
2
3
4
5
Taiga Plains
'80 '81 '82 '83 '84 '85 '86 '87 '88 '89 '90 '91 '92 '93 '94 '95 '96
Mill
ion
ha
Year
0
1
2
3
4
5
'80 '81 '82 '83 '84 '85 '86 '87 '88 '89 '90 '91 '92 '93 '94 '95 '96
Year
Mill
ion
ha
Boreal Shield
0
5
10
15
20
25
0
1
2
3
4
5
'80 '81 '82 '83 '84 '85 '86 '87 '88 '89 '90 '91 '92 '93 '94 '95 '96
Year
Mill
ion
ha
'80 '81 '82 '83 '84 '85 '86 '87 '88 '89 '90 '91 '92 '93 '94 '95 '96
Year
Mill
ion
ha
Boreal Plains
FIGURE 2.1a
Source: Simpson and Coy 1999

ECO
SYST
EM C
ON
DIT
ION
AN
D P
ROD
UC
TIV
ITY
•In
cide
nce
of D
istu
rban
ce a
nd S
tres
s
25
Mixedwood Plains
0
1
2
3
4
5
6
'80 '81 '82 '83 '84 '85 '86 '87 '88 '89 '90 '91 '92 '93 '94 '95 '96
Mill
ion
ha
Year
'80 '81 '82 '83 '84 '85 '86 '87 '88 '89 '90 '91 '92 '93 '94 '95 '96
Prairies
0
1
2
3
4
5
6
Year
Mill
ion
ha
'80 '81 '82 '83 '84 '85 '86 '87 '88 '89 '90 '91 '92 '93 '94 '95 '9602468
101214161820
Year
Mill
ion
ha
Boreal Plains
0
1
2
3
4
5
6
'80 '81 '82 '83 '84 '85 '86 '87 '88 '89 '90 '91 '92 '93 '94 '95 '96
Mill
ion
ha
Year
Atlantic Maritime
'80 '81 '82 '83 '84 '85 '86 '87 '88 '89 '90 '91 '92 '93 '94 '95 '9602468
101214161820
Year
Mill
ion
ha
Boreal Shield
Severe to moderateforest tent caterpillardefoliation
FIGURE 2.1b
Source: Simpson and Coy 1999

ECO
SYST
EM C
ON
DIT
ION
AN
D P
ROD
UC
TIV
ITY
•In
cide
nce
of D
istu
rban
ce a
nd S
tres
s
26
Outbreaks of specific insect species have impacts onthe economies of certain regions. The mountain pinebeetle, which attacks lodgepole pine mainly within theMontane Cordillera ecozone, provides an example. Nota true defoliator, the mountain pine beetle is the mostprevalent species of bark beetle. It attacks the treethrough its vascular system (van Sickle 1995). Undernormal conditions, these beetles are beneficial in thatthey help forest regeneration by weakening older trees.However, when beetles reproduce faster than theirnatural predators, serious damage to large tracts ofhealthy forest can result. Mountain pine beetleinfestations can be devastating as tree mortality canoccur within one or two years of infestation. Eggs laid bythe females develop into larvae that feed on the innerbark. In 1998, the mountain pine beetle infested morethan 31 million cubic metres of standing timber spreadover 125 000 hectares. This recent outbreak wasattributed to milder weather which allowed about 85%of beetle larvae to survive successfully the winter months(usually only 15% of the larvae successfully over-winter)(British Columbia Ministry of Forests 1998).
AREA AND SEVERITY OF FIREDAMAGE
On average, 91.5% of all fires in Canada burn less than10 hectares; these fires account for 0.4% of the totalarea burned. Conversely, the 1.4% of all fires thatexceed 1 000 hectares account for 93.1% of the totalarea burned. Fifty-eight percent of all fires in Canadaare started as a result of human carelessness, but thesefires burn only 15% of the total area burned. Lightning,on the other hand, starts 42% of all fires and accountsfor 85% of the total area burned.
Fire activity over the past 25 years is shown in Figure2.1d. Due to considerable interannual variability, 10-year averages are used to estimate long-term trends.From 1988 to 1998, an average of 8 823 fires burned3.2 million hectares annually—0.73% of the totalforest land in Canada. The number of fires per year overthat period ranged from 6 002 to 12 185, while areaburned ranged from 0.6 to 7.5 million hectares. Thearea burned in 1997 amounted to 0.6 million hectares,the lowest level since 1974. The number of fires showsno notable trend over the past 25 years, although anincrease in the frequency of severe fire seasons hasincreased the 10-year average area burned significantly,from 2.1 to 3.2 million hectares.
Wildland fire performs many valuable ecologicalservices in Canada’s forests. Several species are adaptedto and may even require fire for reproduction. Otherspecies, however, are very averse to fire and maydisappear entirely from an area if fire becomes toofrequent or severe. It is therefore important to track notonly the national area burned, but also the regionalbreakdown of fire activity. Furthermore, while firesuppression may allow an increase in the mean standage in an area, it may also allow greater fuel accumu-lation, resulting in more severe fires in the future. Forthis reason, minimizing fire is not necessarily desirable.In fact, long-term forest sustainability requiresrecognizing the role of fire and the range of naturalvariability of fire activity.
Fire regimes are cyclical and are influenced by theinteractions between climate, vegetation type, ignitionsources, etc. Every area has a fire regime which can bepartially characterized by the fire-return interval
FIGURE 2.1d Number of fires and area burned in Canada, 1974-1998
8
7
6
5
4
3
2
1
14
12
10
8
6
4
2
0'76'74 '78 '80 '82 '84 '86
Area of modified suppression
'88 '90 '92 '94 '96e '98e0
Are
a (m
illio
n h
a)
Nu
mb
er (
tho
usa
nd
)
Year
Area of full suppression
Number of fires
Sources: Natural Resources Canada—Canadian Forest Service 1998,Lowe et al. 1996
e=estimates
2.1.3
'44... '52 '54 '57 '59 '61 '63... '72 '74 '76 '78 '82 '84 '86 '88 '90 '92 '94 '96
180
160
140
120
100
80
60
40
20
Year
Def
olia
tio
n (t
hous
and
ha)
FIGURE 2.1c Forest tent caterpillar defoliation in British Columbia, 1944-1996
Source: Allen 1998

ECO
SYST
EM C
ON
DIT
ION
AN
D P
ROD
UC
TIV
ITY
•In
cide
nce
of D
istu
rban
ce a
nd S
tres
s
27
(average time between fires in the same area).Table 2.1a. shows statistics for large fires for all ecozonesexcept agricultural and arctic regions. Estimated fire-return intervals range from 100 to 10 000 years.Canada’s forests will continue to be linked to wild landfire as they have been since the last ice age.
TABLE 2.1a Estimated large-fire return intervals for Canadian ecozones
Interval (years) Ecozone
10 000 Pacific and Atlantic Maritimes, Mixedwood Plains
5 000 Taiga Cordillera
2 500 Montane Cordillera
1 000 Prairies
500 Boreal Cordillera, Hudson Plains
250 Taiga & Boreal Plains,Taiga & Boreal Shields (part)
100 Boreal Shield (part)
Source: Simard 1997
A significant effect of forest fires is the loss of woodfibre (Figure 2.1e). In the past decade, fires have burnedan average of 1.1 million hectares of timber productiveland each year—20% more area than is harvested.However, half of the burned area is in immature forestsand 20% of the wood lost to fire is salvaged. The resultis an average loss of about 130 million cubic metres ofwood, equal to 76% of the volume of wood actuallyharvested and representing an economic loss of justunder $2 billion per year. Three extreme years in thepast decade have resulted in notably higher wood lossesthan in the previous 15 years
RATES OF POLLUTANT DEPOSITION
A continuing concern for the health of sensitive forestecosystems, particularly in southeastern Canada, isacidic deposition. Well-established acid rain programshave set a target of 20 kg/ha/yr of wet sulphatedeposition, based on the sensitivity of water bodies. Thearea in eastern Canada receiving more than the targetobjective of wet sulphate deposition shrank by 46%from the early 1980s to the early 1990s. Modelpredictions indicate that by 2010, all of Canada willreceive less than the target (Acidifying Emissions TaskForce 1997). In contrast, there has been little change inNO3 wet deposition over the same period. Although thedeposition of wet sulphate has been reduced to meet thetarget of 20 kg/ha/yr, there remains concern about theadverse effects of ambient acidic deposition on forestecosystems. The federal, provincial and territorialMinisters of Environment and Energy signed theCanada-Wide Acid Rain Strategy in October 1998. Thisstrategy replaces the old target with the long-term goalof remaining below critical loads.
“Critical load” is defined as the highest deposition ofacidifying compounds that will not cause chemicalchanges leading to long-term harmful effects on theoverall structure or function of an ecosystem. Criticalloads of acid deposition have been developed for certainCanadian forest soils (Arp et al. 1996). They reflect theinherent capacity of soils to buffer incoming acidity.When combined amounts of sulphur and nitrogendeposition are below these loads, forest ecosystems arebuffered against adverse effects. If critical loads areexceeded for long periods, however, essential nutrientsfor tree growth and vigour are leached from the soil.Continued loss of soil nutrients leads to a decline inforest productivity.
An analysis of data from the Acid Rain National EarlyWarning System (ARNEWS), for plots monitored bythe Canadian Forest Service, indicates that critical loadsare consistently exceeded in portions of the easternBoreal Shield, Atlantic Maritime and Mixedwood Plainsecozones (Hall et al. 1998). Preliminary studies indicatethat forest sites with 500 equivalents/(hectare per year)exceedance (Figure 2.1f ) suffer an annual productivityloss of 10% (Moayeri and Arp 1997). In addition, theeffects of runoff from acidic forest soils can negativelyimpact populations of aquatic organisms, particularlyfish, in these areas (Jeffries 1997).
2.1.4
e = estimates
600
500
400
300
200
100
0
Year
Vo
lum
e (m
illio
n m
3 )
6
7
5
4
3
2
1
0
Bill
ion
$ (1
996$
)
FIGURE 2.1e Wood losses from fire in Canada, 1974-1998
VolumeValues (1996$)
'76 '78 '82'80 '84 '86 '88 '90 '92 '94 '96e '98e
Sources: Natural Resources Canada—Canadian Forest Service 1998,Lowe et al. 1996

ECO
SYST
EM C
ON
DIT
ION
AN
D P
ROD
UC
TIV
ITY
•In
cide
nce
of D
istu
rban
ce a
nd S
tres
s
28
A forest mapping program under the auspices of theEastern Premiers/New England Governors Secretariat iscurrently under consideration for Quebec, the Atlanticprovinces, and New England. The intent is to develop,by 2002, estimates of critical loads of acid depositionfor all forest ecosystems within these regions.
OZONE CONCENTRATIONS INFORESTED REGIONS
Ground-level or tropospheric ozone may adversely affectthe metabolic systems of plants and become toxic totrees. Ozone exposures can be especially damaging underconditions of high humidity and high soil moisture.
Tropospheric ozone levels are determined through aseries of atmospheric models that can predict levels ofozone several hundred metres above the forest canopy.The Canadian Forest Service has been monitoring
canopy exposure to ozone using a passive ozonemonitor placed in the canopy of trees in selected foresthealth monitoring plots (Cox and Malcolm 1999).Ozone measures obtained from these simplemonitoring devices are then related to aspects of foresthealth monitored in the same plots and used to validateatmospheric models. In addition, forest canopy ozoneexposure values can indicate if a forest area is depletingozone (taking up ozone) or is aiding its production byproviding volatile organic carbon (VOC) whichcatalyses the production of ozone in polluted air masses.
During July and August (months associated withhigh ozone events) passive ozone monitoring of forestedareas has been carried out for selected sites across thecountry since 1996. Average hourly means (ppm) ofeach year monitored will serve to identify forest sitesthat are chronically exposed to ozone deposition andthose that may be at risk.
2.1.5
Source: Natural Resources Canada—Canadian Forest Service 1999
FIGURE 2.1f Levels of acid deposition exceeding critical loads
Exceedance of critical acid deposition
>0 eq/(ha per year)
>500 eq/(ha per year)

ECO
SYST
EM C
ON
DIT
ION
AN
D P
ROD
UC
TIV
ITY
•In
cide
nce
of D
istu
rban
ce a
nd S
tres
s
29
SUM 06 is the maximum seasonal sum of hourlyground level ozone concentrations at or above0.06 ppm. Ozone injury is expected for sensitivevegetation at levels above this concentration(McLaughlin and Percy 1999). Figure 2.1g shows amapping of ozone ppm-hr using three-year averagedata from ozone monitoring stations supplied byEnvironment Canada for (a) 1994-1996 and (b)percentage change in SUM 06 between 1985-1987 and1994-1996. A decrease of 10 to 15% occurred overmost of the area during this period, with decreases of 0to 10% in the Mixedwood Plains ecozone.
Although a declining trend in daily maximum ozoneconcentrations in Canada has been identified, there arethree regions in Canada where the national objectives forhourly ground level ozone (0.082 ppm, NationalAmbient Air Quality Objectives) are exceeded. These arethe southern Maritimes, the Windsor-Quebec corridorand the lower Fraser Valley in British Columbia.
CLIMATE CHANGE AS MEA-SURED BY TEMPERATURE SUMS
Temperature is one of the many climate parametersthat are routinely measured at weather stations. Meanmonthly temperature observations have been madesince 1895, but the sparseness of data in many areasprevents any assessment of trends or changes over timeacross large geographic areas such as ecozones.
The weather station density required to reasonablycharacterize temperature change over time has onlybeen in place in Canada since 1950. Gaps in Canada’sclimate-observing network exist, particularly in somenorthern and mountainous areas. Given thesedifficulties, interpolation techniques are required toestimate climate in most forested areas and results musttherefore be interpreted with caution.
Mean monthly temperatures were obtained from theMeteorological Services at Environment Canada. Fromthese data, degree-day (DD) totals—the cumulativetemperature above a mean daily temperature of 5˚C(DD>5)—can be estimated and compiled for thegrowing season. Mean minimum and maximummonthly temperature values were estimated over theperiod 1950 to 1995 using a climate interpolationtechnique that included digital elevation models(McKenney et al. 1996, Hutchinson 1995, Mackey etal. 1996). Monthly DD>5 and annual growing seasonDD>5 values were computed to construct a time seriesfor analysis. For most of Canada’s forests, the growingseason typically extends from May through September.The greater the growing season DD>5 value, thewarmer the climate, and typically, the more productivethe region in terms of plant growth.
Table 2.1b illustrates the change in DD>5 sumscompared with the 30-year average for 12 forestedecozones across Canada. The following observationscan be made for the period 1950 to 1995.
2.1.8
a) 1994-1996
5
10
15
25
35
PPM-HRS
10
5
0
-5
-10
PPM-HRS
b) Change between 1985-1987 and 1994-1996
Source: Dann—Environment Canada—EPS 1999 Source: Dann—Environment Canada—EPS 1999
FIGURE 2.1g SUM06 ozone ppm-hrs for (a) three-year average for 1994-1996 and (b) percent change between 1985 and 1987

ECO
SYST
EM C
ON
DIT
ION
AN
D P
ROD
UC
TIV
ITY
•In
cide
nce
of D
istu
rban
ce a
nd S
tres
s
30
• Annual temperatures have increased in Canada’s westand north from 1.6 to 2.5˚C, with the rate ofwarming ranging from 0.37 to 0.55˚C/decade. In theeast, little change is evident.
• Growing season degree-day temperature sum is animportant climatic variable having significantinfluence on the growth and distribution of foresttree species in Canada. Growing season temperatureshave increased by 0.15 to 0.95˚C, with changesranging from 0.04 to 0.21˚C/decade.
• In Canada’s west and north, the increase in growingseason temperatures has been lower than the annualtemperature increase, indicating that much of theannual warming is occurring outside of the growingseason. In the east, the opposite appears to be thecase, with the growing season warming at a greaterrate than the annual temperature.
• Consistent with the increase in growing seasontemperature, growing season DD>5 sums have beenincreasing. There has been less warming in theMixedwood Plains than anywhere else, while thegreatest amount of warming has been in the HudsonPlains, Pacific Maritime and Boreal Shield ecozones.
Increased warming would appear to suggest that,where drought is not a limiting factor, growth andproductivity of much of Canada’s forest should haveincreased over the past 50 years. More research isrequired to understand the implications of climatechange on the sustainability of Canada’s forests.Temperature alone is not sufficient to describe climatechange and variation. Moisture also influences growth,productivity, species range and natural disturbances offorests. Research is underway to permit a combinationof temperature and moisture indices to be used infuture reports in order to describe climate variationsover time in Canada’s forests.
TABLE 2.1b Rate of change in growing season degree day greater than 5˚C,1950-1995
Ecozone Growing Season DD > 5˚C Sums
1961-1990 ∆DD>5Average /Decade
Taiga Cordillera 213 ± 103 +24.8
Taiga Plains 860 ± 112 +21.7
Taiga Shield 409 ± 114 +17.8
Boreal Cordillera 408 ± 96 +19.1
Boreal Plains 1159 ± 98 +23.0
Boreal Shield 1058 ± 90 +27.6
Pacific Maritime 681 ± 101 +30.8
Montane Cordillera 679 ± 97 +20.9
Prairies 1472 ± 105 + 24.4
Hudson Plains 815 ± 105 + 32.4
Mixedwood Plains 1773 ± 74 +7.3
Atlantic Maritime 1352 ± 85 +19.3
Source: McKenney 1999

ECO
SYST
EM C
ON
DIT
ION
AN
D P
ROD
UC
TIV
ITY
•Ec
osys
tem
Res
ilien
ce
31
ELEMENT OVERVIEW
Evolution has provided forest ecosystems with elaboratemechanisms for recovery from disturbances. Thiscapacity for recovery may be described in terms ofresilience (return time) and is a measure of anecosystem’s ability to maintain its integrity despitedisturbances. Resilience reflects the persistence ofecosystems and their capacity to absorb changes anddisturbances while maintaining productivity levels andrelationships among populations of organisms. Thiselement focuses on the potential for populations torecover from very low levels through an adequateregenerative capacity and a balanced distribution offorest types. To date, no common methodology hasbeen developed for determining resilience.Regeneration of timber productive forest landsfollowing human disturbances such as harvesting(Indicator 2.2.2) is an indication of the sustainedproductivity of forest ecosystems.
Prompt regeneration of harvested areas is essential formaintaining a supply of timber for the future.Vegetation of some kind will eventually becomeestablished on all harvested sites, unless the soil tosupport it is lost or dramatically degraded. Productivityof future stands must equal or exceed that of the standsthey replace and is dependent on viable populations ofmany species in addition to the timber species ofeconomic importance. For example, the growth ofmany tree species is enhanced through symbioticrelationships with microorganisms.
Canada’s forests can be divided into two categories—even-aged and uneven-aged. Most Canadian forests areeven-aged. The trees in even-aged forests reach maturityat the same time and the tree species are adapted toregenerate forest lands after major disturbances, such asforest fires. Management of these forests for timberproduction attempts to mimic this natural life cyclethrough clearcut, seed-tree and shelterwood harvesting.Most sites regenerate naturally. Those that do not havean adequate stocking of commercial species are aided byplanting or seeding.
Provincial planting and seedingprograms were intensified in the 1980sunder the federal–provincial forestresource development agreements(FRDAs) and through new provinciallegislation which enforced betterregeneration practices. By the early1990s, planting programs had largelyeliminated the backlog of treatable,understocked sites, and severalprovinces were able to scale back theirplanting programs. In 1997, 434 000hectares were planted across Canada.
Current harvest and regenerationpractices do not appear to be a constraint tosustainable timber supplies at the nationallevel. Using data supplied from provincial andterritorial government agencies, the REGEN modeloutput indicates that the majority of harvested areas areregenerated successfully within 10 years of harvest.
INDICATOR REPORT
PERCENTAGE OF AREA SUCCESSFULLY NATURALLYREGENERATED AND ARTIFI-CIALLY REGENERATED
Reforestation is mandatory on public land in Canada.Since the 1980s, most provinces and territories havepassed legislation or signed agreements requiringlogging companies to ensure regeneration on sites theyharvest. Prior to 1979, the provincial government wasresponsible for the reforestation of all lands harvested inManitoba. Since 1979, Manitoba has ensuredregeneration by making reforestation requirements acondition of all forest licence agreements with forestcompanies. Alberta has had mandatory reforestationrequirements for all tenures since the 1960s. Foresters’options include selection cutting in forest types that aresuited to uneven-aged management, clearcutting andscarifying to promote natural regeneration, or adoptinga modified harvesting method that will protect advanceregeneration. Clearcut areas may also be regenerated byplanting or seeding.
Harvesting techniques are rapidly being improved.New techniques are being applied to protect advance
2.2.2
ELEMENT 2.2ECOSYSTEM RESILIENCE
Disturbanceand Stress
EcosystemResilience
ExtantBiomass
ECOSYSTEMCONDITION ANDPRODUCTIVITY
2.2.2

ECO
SYST
EM C
ON
DIT
ION
AN
D P
ROD
UC
TIV
ITY
•Ec
osys
tem
Res
ilien
ce
32
regeneration, emulate natural disturbances andencourage natural regeneration. In Ontario, forexample, the use of guidelines for the protection ofwildlife habitat and other cultural, ecological andenvironmental values is legally mandated. In Quebec,“cutting with protection of regeneration and soils” wasmandated by the 1987 Forest Act. This techniqueaccounted for 22% of the area harvested under even-aged management when the Act came into force. Tenyears later, it accounted for 93%.
Indicator 2.2.2 reports on the extent of successfulregeneration on over 15 million hectares of publictimber productive forest lands harvested under even-aged management between 1975 and 1997. Thereported information is based on data supplied fromprovincial and territorial government agencies compiledusing the REGEN model. This model links harvestingand silvicultural activities with regeneration status ofharvested lands to report on regeneration in even-agedforests. Regeneration status is based on three factors:stocking of commercial species; crop tree density; andthe competition from non-crop vegetation. Uneven-aged stands are not included in the land base describedin this indicator.
Figure 2.2a shows regeneration on public timberproductive land under even-aged management. The netharvest area is indicated by a line. This is the area that ismanaged for regeneration and does not include harvestedareas that are set aside for permanent roads. The arearegenerated is shown as columns, including naturalregeneration and successful planting and seeding. Areasindicated as “successfully regenerated” include somerecently harvested areas that are expected to become
restocked without further treatment. The areas shown inthis graph are cumulative: the value for each yearrepresents the area harvested or regenerated since 1975,up to and including that year.
Natural regeneration plays a much larger role inCanadian forestry than planting or seeding, accountingfor 70% of the estimated 12.9 million hectares of forestland successfully regenerated in 1997.
In Figure 2.2a, the space between the line and the topof the column represents the area that remainedunderstocked each year. “Understocked” refers to areasthat have not yet regenerated with enough trees ofcommercial species. Most of this land will be regeneratedby planting or seeding as required by law. The remainderdid not regenerate with enough trees of commercialspecies within an acceptable time frame. These areas arenot barren, having regenerated with a variety of woodyand herbaceous plants, but do not contain sufficient treesof commercial species to be considered successfullyregenerated for commercial purposes.
Figure 2.2b shows that the annual change inunderstocked area decreased substantially with improvedregeneration practices and technology, and substantialinvestments in planting the treatable backlog ofpersistently understocked areas. Despite this and largelydue to increasing areas harvested, the cumulativeunderstocked area increased to 2.7 million hectares in1992 (Figure 2.2a). By 1997 it decreased to just under2.4 million hectares, roughly equivalent to the areaharvested over a three-year period.
The REGEN model indicates that the majority ofharvested areas are regenerated successfully. Additionalcomprehensive localized data are required to furthersubstantiate these observations.
0.00
-0.10
0.10
0.20
0.30
'75 '77 '79 '81 '83 '85 '87 '89 '91 '93 '95 '97Year
FIGURE 2.2b Annual change in cumulative total of understocked areas since 1975
Source: National Forestry Database, REGEN
Are
a m
illi
on
ha
FIGURE 2.2a Forest regeneration on public land in Canada
Status year
Source: National Forestry Database, REGEN
Are
a (m
illi
on
s o
f h
ecta
res)
0
5
10
15
20
'97'95'93'91'89'87'85'83'81'79'77'75
Net Harvest Area
Successful Natural Regeneration
Successful Planting and Seeding

ELEMENT OVERVIEW
Extant biomass represents the mass of living organismsinherent in an ecosystem and is a reliable indication ofnet performance. It is an integrating measure of forestecosystem condition (health and vitality of all speciesand types). Evidence that the condition of forests isconstant or improving indicates that they are beingmanaged in a sustainable way.
The biomass production of tree species is oneindicator of the ability of ecosystems to support andmaintain life. The amount of new wood added to a treeover a given period is referred to as the increment. Thiscan be measured on one tree or on a stand of trees as anincrease in diameter, basal area, height, volume, qualityor value.
Mean annual increment (MAI) is the average netannual increase in the yield (expressed in terms ofvolume per unit area) of living trees to a given age, andis calculated by dividing the yield of a stand of trees byits mean age. The MAI of a stand is dependent on anumber of factors, including climate and elevation, soilconditions, forest management practices, and of course,age. MAI can thus only be determined in even-agedstands or for trees of known age. Loss of biomass tomortality, insects and diseases is reflected in MAIvalues; a reduction in these losses results in an increasein MAI.
INDICATOR REPORT
MEAN ANNUAL INCREMENTBY FOREST TYPE AND AGE CLASS
Indicator 2.3.1 presents the MAI values from Canada’sForest Inventory (Lowe et al. 1996). The values werecalculated for groups of comparable stands at maturity.Since MAI to maturity is a long-term average, thevalues presented in this report may not reflect currentgrowth in Canada’s forests. They serve as a general
overview of how growth rates vary inCanada’s ecozones (Element 1.1).
If over time, productivity (as measuredby average MAI to maturity) is notmaintained or enhanced in forest areasfrom which timber is to be harvested,the sustainable harvest from those areaswill be jeopardized, and their ability tosupport and maintain life formsdiminished.
Figure 2.3a shows that the PacificMaritime ecozone on the west coast ofBritish Columbia—an area known for itslong growing season and favourableclimate—has the highest MAI, averaging2.5 m3/ha/yr. The northernmost forestedecozone (Southern Arctic) has the lowest MAI,averaging 0.2 m3/ha/yr.
Ideally, information for this indicator would bederived from tree measurements taken every five to tenyears on permanent sample plots located in the fullvariety of forest types and conditions found in Canada.This type of information would reveal changes overtime in forest ecosystem productivity, health andvitality. An even better indicator would be themonitoring of total forest biomass, not just trees instands of potential commercial interest. At theCanadian Forest Service, a project is underway(Extended Collaboration for Linking Ecophysiologyand Forest Productivity [ECOLEAP]) to develop a
2.3.1
ELEMENT 2.3EXTANT BIOMASS
ECO
SYST
EM C
ON
DIT
ION
AN
D P
ROD
UC
TIV
ITY
•Ex
tant
Bio
mas
s
33
Disturbanceand Stress
EcosystemResilience
ExtantBiomass
ECOSYSTEMCONDITION ANDPRODUCTIVITY
2.3.1
Source: Lowe et al. 1996
Net mean annual increment by ecozone
m3/hectare/year
FIGURE 2.3a
0 0.5 1.0 1.5 2.0 2.5
Southern ArcticTaiga Cordillera
Taiga PlainsTaiga Shield
Boreal CordilleraBoreal PlainsBoreal Shield
Pacific MaritimeMontane Cordillera
PrairiesHudson Plains
Mixedwood PlainsAtlantic Maritime

tool, using remote sensing, that will permit theestimation of forest productivity at the landscape level(Bernier et al. 1999).
References Acidifying Emissions Task Force. 1997. Towards a
national acid rain strategy. Report submitted to theNational Air Issues Coordinating Committee.Environment Canada. Ottawa, ON. 98 p.
Allen, E.A. 1998. Forest tent caterpillardefoliation in British Columbia. [online].http://www.pfc.cfs.nrcan.gc.ca/health/pests/index.html Accessed March 2000.
Arp, P.; Oja, T.; Marsh, M. 1996. Calculating criticalS and N loads and current exceedances for uplandforests in southern Ontario. Canadian Journal of ForestResearch 26: 696-709.
Bernier, P.Y.; Fournier, R.; Ung, C.H.; Robitaille, R.;Larocque, G.; Lavigne, M.B.; Boutin, R.; Raulier, F.;Paré, D.; Beaubien, J.; Delisle, C. 1999. Linkingecophysiology and forest productivity: An overview ofthe ECOLEAP project. Forestry Chronicle Volume75(3).
Blais, J.R. 1983. Trends in frequency, extent andseverity of spruce budworm outbreaks in easternCanada. Canadian Journal of Forest Research 13: 539-547.
British Columbia Ministry of Forests. 1998. A socio-economic analysis of mountain pine beetlemanagement in British Columbia. [online].http://www.for.gov.bc.ca/hfp/ûbs/interst/mpbecon/index.htm Accessed February 2000.
Canadian Council of Forest Ministers. 1998.National Forest Strategy (1998-2003), sustainableforests: A Canadian commitment. Natural ResourcesCanada. Ottawa, ON. 47 p.
Canadian Council of Forest Ministers. Annual.National Forestry Database Program-REGEN model.
Cox, R.M.; Malcolm, J.W. 1999. Passive ozonemonitoring for forest health assessment. Water, Air andSoil Pollution 116: 399-344.
Dann, T. 1999. Canadian (NAPS) and US (AIRS)monitoring data for SUM06 ozone ppm-hrs.Environment Canada-Environment Protection Service.Ottawa, ON.
Hall, P.; Bowers, W.; Hirvonen, H.; Hogan, G.;Foster, N.; Morrison, I.; Percy, K.; Cox, R.; Arp, P.1998. Effects of acidic deposition on Canada’s forests.Natural Resources Canada. Ottawa, ON. 23 p.
Hall, J.P.; Moody, B. 1994. Forest depletions causedby insects and diseases in Canada: 1982-1987.Information report ST-X-8. Natural Resources Canada.Ottawa, ON. 14 p.
Hutchinson, M.F. 1995. Interpolation of meanrainfall using thin plate smoothing splines.International Journal of Geographic InformationSystems 9: 385-403.
Intergovernmental Panel on Climate Change(IPCC). 1998. The regional impacts of climate change:An assessment of vulnerability In Watson, R.T.;Zinyowooa, M.C.; Moss, R.H.; Dokken, D.J. (eds).Cambridge University Press, UK.
Jeffries, D.S. 1997. Canadian Acid Rain Assessment1997, Volume 3: The effects on Canadian lakes, riversand wetlands. Environment Canada. Ottawa, ON.
Lowe, J.J.; Power, K.; Gray, S.L. 1996. Canada'sForest Inventory 1991: 1994 version. An addendum toCanada’s Forest Inventory 1991. Canadian ForestService. Information report BC-X-362E. PacificForestry Centre. Victoria, BC. 23 p.
Mackey, B.G.; McKenney, D.W.; Yang, Y.;McMahon, J.P., Hutchinson, M.F. 1996. Site regionsrevisited: A climatic analysis of Hill’s site regions for theprovince of Ontario using a parametic method.Canadian Journal of Forest Research 26: 333-354.
McKenney, D.W.; Mackey, B.G.; Hutchinson, M.F.;Sims, R.A. 1996 An accuracy assessment of a spatialbioclimatic model In Proc. Second InternationalSymposium on Spatial Accuracy Assessment in Naturaland Environmental Sciences. Gaad, T. (ed.) Technicalreport p-RB6TR-277: 291-300.
McKenney, D.W. 1999. Rate of change in growingseason degree day greater than 5˚C, 1950-1995.(Unpublished data). Natural Resources Canada. SaultSte. Marie, ON.
McLaughlin, S.; Percy, K. 1999. Forest health inNorth America: Some perspectives on actual andpotential roles of climate and air pollution. Water, Airand Soil Pollution 116: 151-197.
ECO
SYST
EM C
ON
DIT
ION
AN
D P
ROD
UC
TIV
ITY
•Ex
tant
Bio
mas
s
34

Moayeri, M.H.; Arp, P.A. 1997. Assessing critical soilacidification load effects for ARNEWS sites,preliminary results. (Internal paper) Faculty of Forestryand Environmental Management, University of NewBrunswick. Fredericton, NB.
Natural Resources Canada—Canadian ForestService. 1998. Selected forestry statistics Canada 1997.(Internal document) Natural Resources Canada.Ottawa, ON.
Natural Resources Canada—Canadian ForestService. 1999. Forest health in Canada: An overview1998. Natural Resources Canada. Ottawa, ON. 60 p.
Simard, A. 1997. National workshop on woodlandfire activity in Canada. Information report ST-X-13.Natural Resources Canada. Ottawa, ON. 38 p.
Simpson, R.A.; Coy, C. 1999. An ecological atlas offorest insect defoliation in Canada 1980-1996.Information report M-X-206E. Natural ResourcesCanada. Fredericton, NB. 40 p.
van Sickle, G.A. 1995. Forest insect pests in thePacific and Yukon Region In Armstrong, J.A., Ives,W.G.H. (eds). Forest insect pests in Canada. NaturalResources Canada—Canadian Forest Service—Science and Sustainable Development Directorate.Ottawa, ON.
ECO
SYST
EM C
ON
DIT
ION
AN
D P
ROD
UC
TIV
ITY
•Ex
tant
Bio
mas
s
35

36
CONSERVATION OF SOIL AND WATER RESOURCES
CRITERION 3
INTRODUCTION
3.2.1
3.2.2
3.2 Policy and Protection Forest Factors
Percentage of forest managed primarily for soil and water protection
Percentage of forest area having road construction and stream crossing guidelines in place

ELEMENT OVERVIEW
Sustainable forest management acknowledges thecritical role of forest ecosystems in regulating the flowof water and in preserving water quality and quantityfor all living creatures. Protection of the soil retains thenutrient capital in the forest, and in turn maintains thequality of aquatic and riparian environments.
Riparian areas, the interfaces between terrestrial andaquatic ecosystems, are often considered the mostvaluable component of a forest landscape because they
are very productive and support a diversity of plantsand animals not found elsewhere. Riparian buffer zonesrepresent the last effective natural buffer after landscapealteration to help mitigate or moderate the impacts offorest harvesting or other land uses.
Sustainable management dictates that particularattention be paid to the maintenance of environ-mentally sensitive forest areas such as streams, riparianzones and steep slopes. Alterations to natural streamflows, whether caused by control structures, such ashydro power dams, or natural catastrophes, such asunusually heavy rainfall, can increase water flows andlead to reduced water quality and aquatic habitats forfish and other organisms, as well as increased turbidityof water due to soil siltation and erosion. Theimplementation of road construction and streamcrossing regulations or guidelines can minimize distur-
ELEMENT 3.2POLICY AND PROTECTION FOREST FACTORS
CO
NSE
RVAT
ION
OF
SOIL
AN
D W
ATER
RES
OU
RC
ES•
Polic
y an
d Pr
otec
tion
Fore
st F
acto
rs
37
INTRODUCTION
Soil and water are essential components of forests, sustaining the functioning and
productive capacity of forest ecosystems. Criterion 3 discusses the conservation of soil
and water resources.The primary reason for soil conservation is the maintenance of the
living substrate for forest stands, whereas water conservation is important for the provision of
potable water for humans and wildlife and the provision of suitable aquatic environments for
plants and animals. Measures that maintain the quantity and quality of soil and water within and
through forested ecosystems are addressed by this Criterion.
The long-term productivity and resilience of the forest are dependent upon the maintenance of
appropriate levels of soil oxygen, nutrients and organic matter, in addition to abundant and clean water.
In order to ensure that terrestrial and aquatic ecosystems are maintained, policies must be enacted to provide
for specific management practices or the protection of sensitive sites. With respect to aquatic systems, policies
that address stream crossings, watershed management and riparian areas will help maintain water flow
patterns, water levels and water quality.
The construction of access roads and other forestry practices may impact on the quantity and quality of soil
and water in a number of ways. These include soil erosion and compaction, siltation of aquatic habitats, flooding
and increased water temperatures. The rapid regeneration of forests following harvesting is essential for
maintaining moisture and nutrient levels in the soil, minimizing disruptions in stream flow rates and timing and
minimizing soil erosion, stream siltation and downstream water quality effects.
Element 3.2 (Policy and Protection Forest Factors) discusses the guidelines and management objectives in place
in Canada for the protection of soil and water resources in forest ecosystems.
PhysicalEnvironmental
Factors
Policy andProtection
Forest Factors
SOIL AND WATERCONSERVATION
3.2.1
3.2.2
CONSERVATION OF SOIL ANDWATER RESOURCES

bances to terrestrial and aquatic ecosystems. In recentyears, provinces and territories have significantlyincreased and upgraded guidelines for both public andprivate lands in order to protect streams, riparian zones,steep slopes and other sensitive forest sites.
It is important that measures be implemented inmanaged forests to protect water courses in order toreduce soil degradation and maintain water quality.The area of land specifically allocated to soil and waterquality protection is an indication of the extent towhich these elements are specifically considered inforest management (Indicator 3.2.1).
The majority of provinces and territories in Canadahave established guidelines for the location, design,construction, maintenance and deactivation of accessroads and stream crossings (Indicator 3.2.2). Theoverarching objective of these guidelines is to protectand maintain the natural conditions where forestprojects are to be implemented by defining appropriatepractices for working in sensitive areas. The environ-mental protection requirements for road constructionare more stringent for sensitive areas in order tominimize impacts.
INDICATOR REPORTS
PERCENTAGE OF FORESTMANAGED PRIMARILY FORSOIL AND WATER PROTECTION
Initiatives such as municipal watersheds and areasmanaged by water conservation authorities areintended to promote soil and water conservation;however, at this time only about 5% of the total forestlandmass of Canada is affected by these measures.Watershed management is a high priority. Protection isachieved through a combination of guidelines,legislation and conservation practices.
The creation of riparian buffer zones is now standardpractice throughout the country. All provinces andmany large forest companies have guidelines thatconstrain activities in riparian areas and around waterbodies. The 20- to 50-metre riparian zones currentlyobserved amount to 4 to 10 hectares of reserve perkilometre of stream. Depending on natural variationsin the number and distribution of water courses, it is
estimated that riparian buffers represent 10 to 20% ofharvested areas.
Because provincial agencies do not gather data onthe amount of land protected specifically for thepurposes of conserving soil and water, it is not possibleat this time to provide a quantitative report on theamount of land managed or removed from productionas a result of soil and water quality protectionpractices. Case studies are provided in order toillustrate the types of guidelines and policies that havebeen put in place in three Canadian provinces tosustainably manage forest ecosystems.
Case Study 1 Newfoundland and Labrador
The Corner Brook Lake Watershed in WesternNewfoundland drains an area of approximately 107square kilometres. It contains vast areas of lakes,marshes, barrens and forest as it stretches nearly 25kilometres from southeast of Corner Brook northwestinto the Bay of Islands. The Western Newfoundlandecoregion where the watershed is located is consideredone of the province’s most favourable sites for forestgrowth. The Corner Brook subregion is characterizedby heavily forested areas with a rugged topography andrich productive soils.
In recent years, increased resource development andrecreation activity in water supply areas have given riseto concern about the safety, cleanliness and abundanceof drinking water. Newfoundland and Labrador’sEnvironment Act provides for the protection of watersupply sources by prohibiting or restrictingdevelopment activities with the potential to impairwater quality in designated areas. In an effort topromote cooperation on this front, the Corner BrookWatershed Monitoring Committee was appointed in1989 by the provincial Minister of Environment andLabour. Membership is composed of provincial andmunicipal officials as well as industry representatives.The purpose of the Committee is to protect andenhance the quality of the Corner Brook water supplyfor current and future generations through wise andefficient management practices. To accomplish this, theCommittee developed guidelines to ensure that timberharvesting activities are not detrimental to the qualityand quantity of the water supply. These guidelines haveresulted in protected water supplies.
3.2.1
CO
NSE
RVAT
ION
OF
SOIL
AN
D W
ATER
RES
OU
RC
ES•
Polic
y an
d Pr
otec
tion
Fore
st F
acto
rs
38

Water samples were collected from the Corner BrookLake Watershed between February 1989 and October1996. Values never exceeded recommended orregulatory limits for nitrogen, chloride, sodium, totaldissolved solids or specific conductance. Phosphorous,total suspended solids and turbidity were occasionallyidentified; however, all were within recommendedregulatory limits. Water colour is the only parameterthat consistently failed to meet the Canadian WaterQuality Guidelines. This is the result of the high naturalorganic content found in Newfoundland’s water.
Case Study 2 Alberta
The Alberta Green Area includes a land surface ofapproximately 350 554 km2 (excluding Wood BuffaloNational Park) set aside for multiple uses other thanagriculture (see p. 50). Watershed protection is a highmanagement priority for the Green Area and isachieved through a combination of policies, legislationand conservation practices. A large portion of theEastern Rocky Mountains is designated as forestreserve. Alberta’s Forest Reserves Act states that: “Allforest reserves within Alberta are set apart andestablished for the conservation of the forests and othervegetation in the forests and for the maintenance ofconditions favourable to an optimum water supply.”
The Alberta government, in conjunction with theCanadian Forest Service, carried out a number of casestudies to measure the effects of forest operations onwater yield and quality, fisheries and fish habitat, andstream flow in several different water basins. The resultsof those studies were used in the development ofprovincial ground rules and environmental protectionmanuals, and the refinement of the United StatesEnvironmental Protection Agency’s Water ResourcesEvaluation of Non-point Silvicultural Sources(WRENSS) water yield assessment procedure. Studyresults have also contributed to the development ofmodels to restrict the increase in annual water yield toless than 20% over undisturbed conditions in somelocations and to assess potential watershed impacts dueto logging.
The provincial Timber Harvest Planning andOperating Ground Rules and Forest Management AreaGround Rules apply to all forestry operations in theGreen Area. They include the following watershedprotection provisions:
• All watercourses are classified. Standards andguidelines for streamside buffers, roads, landings andbared areas, tree felling and equipment operation arebased on these classifications.
• Treed, or otherwise vegetated, buffers are requiredalong most watercourses.
• Guidelines are in place for the planning,construction, maintenance and abandonment ofroads, landings and campsites.
• Guidelines are provided for locating, designing andconstructing watercourse (stream) crossings. The rateof harvest is constrained (2 or more passes) allowingfor some hydrological recovery. Passes are separatedby approximately 20 years.
• Block size is limited; the dimensions and pattern ofthe clearings are significant.
• Forest protection from fire and insect outbreaks isprescribed.
• Harvesting is usually restricted to slopes of less than45 percent.
• Detailed cut block layouts are required on sensitiveor complex sites.
• Pre-disturbance watershed assessments are requiredon designated sites.
A Policy for Resource Management of the Eastern Slopescovers the 90 000 km2 of mountains and foothills alongthe Rocky Mountains. Watershed management is thehighest priority in the overall management of theEastern Slopes. Watershed objectives are:
• To manage and develop natural resources in theregion to maintain or increase the volume of wateryield and the natural timing of surface and sub-surface discharge.
• To manage headwaters in the region to maintainrecharge capabilities and protect critical fisherieshabitat.
• To intensively manage the South Saskatchewan RiverBasin for water supply stability.
• To manage the North Saskatchewan and AthabaskaRiver watersheds to maintain natural flows andprovide the option for future increases in water yieldsthrough intensive management.
CO
NSE
RVAT
ION
OF
SOIL
AN
D W
ATER
RES
OU
RC
ES•
Polic
y an
d Pr
otec
tion
Fore
st F
acto
rs
39

In addition to the guidelines and objectivesmentioned above, foresters and other users of the forestare subject to a variety of federal and provinciallegislation and regulations that serve to protect soil andwater resources. In terms of provincial measures, theseinclude: the Forest Reserves Act; the Soil ConservationAct (which applies particularly to agricultural land use);the Public Lands Act (granting to the government alltitle to water beds and shores and providing penaltiesfor injury and erosion); the Alberta Water Act(requiring qualified professionals to be involved in thedesign of watercourse crossings); and regulationsgoverning pesticide use, pollution and erosion control.Federally, the application of the Canadian Environ-mental Assessment Act, the Fisheries Act, and theNavigable Waters Protection Act also contributes to theprotection of watersheds and soil.
Case Study 3 British ColumbiaBritish Columbia has some of the wettest local climatesand steepest terrains in Canada. To ensure theprotection of soil and water on all provincial publicland and private lands under tenures, the ForestPractices Code of British Columbia Act includes extensiveplanning and practice requirements. Planningrequirements vary with the situation, and may includea number of assessments to identify sensitive areas inwhich more restrictive forest practice requirementsapply. In addition to stream classification, assessmentsmay be required to address cumulative impacts ofresource development in whole watersheds, terrainstability on potentially unstable soil areas, soildegradation hazards and gullies. Detailed practicerequirements address road and stream crossing layoutand design, use of pesticides in watersheds, refuelling ofequipment, and restriction of timber harvesting inriparian management areas. Clearcutting is usually notpermitted on areas with a high likelihood of landslides.
By way of illustration, the requirements forriparian management areas around fish-bearingstreams are described in Table 3.2a. Timberharvesting is not permitted in the riparian reservezone on either side of the stream, and is restricted inthe riparian management zone which extendsbeyond the reserve zone.
TABLE 3.2a Minimum widths of riparian reserve and management zones on either side of streams in British Columbia
Stream Riparian Riparian Riparianwidth (m) Class Reserve Management
Zone (m) Zone (m)
>20 S1 50 20
>5 ≤ 20 S2 30 20
1.5 ≤ 5 S3 20 20
<1.5 S4 0 30
Source: British Columbia Ministry of Environment, Lands and Parks—Resource Stewardship Branch 1999
The requirements for streams without fish are lessstringent, with only a riparian management zone inwhich timber harvesting is restricted, as shown inTable 3.2b.
TABLE 3.2b Minimum width of riparian management zones on either side of streams in British Columbia
Channel Riparian Riparianwidth (m) Class Management
Zone (m)
>3 S5 30
≤3 S6 20
Source: British Columbia Ministry of Environment, Lands and Parks—Resource Stewardship Branch 1999
Similar riparian management requirements apply tovarious classes of lakes and wetlands.
The Forest Practices Code of British Columbia Actprovides special protection for community watersheds,which provide water for human consumption. Morethan 1.5 million hectares of public land are managed as480 community watersheds. Forest operations incommunity watersheds require the joint approval of theMinistry of Environment, Lands and Parks and theMinistry of Forests.
In community watersheds, the riparian reserve zoneand the riparian management zone requirements inTable 3.2a apply to all streams, including streamswithout fish. A watershed assessment procedure isalways required in community watersheds to determinecumulative impacts of resource development. Terrainstability hazard mapping and soil erosion potentialmapping are required before forest development cantake place. A terrain stability field assessment by ageoscientist or other qualified professional is required in
CO
NSE
RVAT
ION
OF
SOIL
AN
D W
ATER
RES
OU
RC
ES•
Polic
y an
d Pr
otec
tion
Fore
st F
acto
rs
40

areas with a risk of landslides. Timber harvesting is notpermitted in areas with a high likelihood of landslides,while clearcutting is restricted where there is moderatelikelihood of landslides. Bladed trails are not permittedin areas with a surface soil erosion hazard or where thereis moderate risk of sediment delivery to streams.Community water supply intakes and infrastructuremust be protected by any forest development.
PERCENTAGE OF FORESTED AREAHAVING ROAD CONSTRUCTIONAND STREAM CROSSING GUIDE-LINES IN PLACE
Road construction may affect water quality in terms ofboth chemistry and turbidity. If roads are constructedon acidic soils, water quality may be affected by theincreased concentrations of dissolved nutrients andorganic chemicals and by decreased pH levels.Guidelines for road construction and stream crossingson public forest lands are in place in the majority ofprovinces and territories in Canada. These guidelineshave improved environmental conditions while mini-mizing the environmental degradation associated withroad construction and use. They have also contributedto a reduction in construction costs and protection ofsensitive aquatic species. Remediation of forest soils,compacted as a result of road construction, has beenachieved in some areas by tilling and planting.
The implementation of guidelines has also helpedlimit the number of stream crossings, thereby reducingthe chances of stream and tributary siltation in poorlydrained areas, decreasing sedimentation in streams anddamage to migrating fish and their spawning areas, andreducing disturbance near streams. Available informa-tion shows that the percentage of forest area that is sub-ject to these guidelines ranges from 57% inNewfoundland and Labrador to 100% in BritishColumbia and Manitoba.
In Ontario, the Crown Forest Sustainability Act, ineffect since 1995, requires that forest managementconsider all forest values. If forest management plansare not complied with, or if damage to water, soil, plantlife or habitat occurs in a public forest, the responsibleparty must repair the damage and prevent furtherdegradation. The application of EnvironmentalGuidelines for Access Roads and Water Crossings is
mandatory for all forest access roads and watercrossings in public forests in Ontario.
Stream crossing guidelines were established inManitoba to ensure free fish passage, protect streambeds and banks from accelerated erosion and preventthe introduction into streams of substances deleteriousto fish or fish habitat. These guidelines also providepractical advice and information on mitigationmeasures to protect fish and fish habitat. Althoughdesigned for application to crossings for temporary andpermanent access roads, the concepts are also relevantfor crossings associated with transmission lines, cablecrossings, pipelines and railroads.
The Forest Practices Code of British Columbia Act,which applies to all provincial public and private landsunder tenures, contains extensive regulations for thelayout, design, construction, maintenance and deacti-vation of roads and stream crossings. A terrain stabilityfield assessment is required on potentially unstableslopes in order to minimize the risk of land slides andother disturbances to the surrounding area.
Road construction and stream crossing guidelines areas comprehensive for private lands as for public land,even if they are not always specifically addressed informal policies.
In Newfoundland and Labrador, approximately 90%of private forest land is affected by either protectiveguidelines or legislation. Landowners adhere toguidelines addressing the preservation of water, fish andtheir habitats, and soil stability.
In Quebec, the approximately 120 000 private forestowners are becoming increasingly sensitized to theimportance of protecting forested land. Thegovernment policy on forest protection to which theyare subject not only defines the principal componentsof natural forests, but also determines minimumstandards of protection for streams, including streamcrossings. Municipalities affected by this policy haveintegrated it into their regulations for forestmanagement plans.
In May 1995, private land owner organizations metat the Quebec Summit on Private Forests to collaborateon a system to protect and develop private forest land.After the Summit, 17 regional development agencieswere created to provide guidance on the implemen-tation of measures to protect soil, water and ecologicalresources located on private forest lands.
3.2.2
CO
NSE
RVAT
ION
OF
SOIL
AN
D W
ATER
RES
OU
RC
ES•
Polic
y an
d Pr
otec
tion
Fore
st F
acto
rs
41

CO
NSE
RVAT
ION
OF
SOIL
AN
D W
ATER
RES
OU
RC
ES•
Polic
y an
d Pr
otec
tion
Fore
st F
acto
rs
42
TABLE 3.2c Road construction and stream crossing guidelines on private lands in Nova Scotia
Target Guideline, regulation, law, etc. General description Impact
Soil stabilization
• Forest Access Roads, Planning and ConstructionManual* (1982/1991)
• Forest Access Roads, Planning and ConstructionManual (1982/1991)
• Environmental Standards for the Construction ofForest Roads and Fire Ponds in Nova Scotia(1983/1985)
• Woodlot Roads, Stream Crossings (1992)
• Environment Act (1994)
• Environmental Standards for the Construction ofForest Roads and Fire Ponds in Nova Scotia(1983/1985)
• Forest Wildlife Guidelines and Standards for NovaScotia (1989)
• Forest Access Roads, Planning and ConstructionManual (1982/1991)
• Woodlot Roads, Stream Crossings (1992)
• Environmental Standards for the Construction ofForest Roads and Fire Ponds in Nova Scotia(1983/1985)
• Forest Wildlife Guidelines and Standards for NovaScotia (1989)
• Woodlot Roads, Stream Crossings (1992)
• Environment Act (1994)
• Locate on high ground with gooddrainage.
• Avoid bogs, swamps, poorly drainedareas and excessive slopes.
• Design roads to minimize the lengthrequired to service the managementarea now and in the future.
• Consider the topography, soilconditions and stream crossings at thedesign stage.
• Construction of stream crossingscarried out only between May 15 andSept 15 without special permissionfrom the Department of Environment.
• Coffer dams and stream diversionpermits required when bridgeabutments are constructed in streambeds with water present.
• Maintain road surface with grading toensure surface runoff to the ditches.
• Inspect and repair ditches anddrainage structures for proper waterremoval.
• During construction, groundvegetation to be left undisturbed inditch areas within 30m of streamcrossing (on slopes > 30%, 40mbuffer).
• Take-off ditches established at thestart of the buffer zone.
• No landings to be constructed within100m of stream crossings.
• Machines excluded from within 10mof stream for forestry operations.
• Machinery with high floatation tiresmay operate to within 5m of stream.
• Riparian zones required on allwatercourses that appear on 1:50 000topographic map.
• During road construction formalapproval from the Department ofEnvironment prior to starting anywork within 30m of a stream.
• Temporary fords may be permittedfrom June 1- Sept 30.
• For forestry operation temporarystructure or portable bridge isrequired to cross all watercoursesappearing on 1:50 000 topographicmaps.
• Reduced erosion andsedimentation.
• Improved road networkwith reduced environ-mental impact.
• Minimal disruption to thenatural drainage patterns.
• Reduced erosion andsedimentation.
• Protection of environ-mentally sensitive areas.
• Maintained grading onroad surface ensuresrunoff to the ditches.
• Maintained ditches anddrainage structuresensures proper waterflow.
*Policy on woodlots receiving assistance from government programs. Encouraged on all private lands.Sources: Braithwaite 1992, Nova Scotia Department of Environment and Department of Fisheries and Oceans Canada 1983,
Nova Scotia Department of Natural Resources 1989, Talbot 1991
Road design,constructionandmaintenance
Riparian zones
Streamcrossings

Case Study Nova ScotiaThe adoption and application of guidelines in NovaScotia has led to the creation of mechanisms thatensure the protection of forested land. The first set ofguidelines, introduced in 1983, was entitledEnvironmental Standards for the Construction of ForestRoads and Fire Ponds in Nova Scotia. Since then,concerns about road construction and stream crossingshave been addressed in the Forest Wildlife Guidelinesand Standards for Nova Scotia (1989), and articulated ina publication entitled Woodlot Roads, Stream Crossingsand in the Environment Act (1994). Pursuant to theEnvironment Act, formal approval is required from theNova Scotia Department of Environment prior toundertaking any work within 30 metres of a stream.Portable bridges are required for all forestry operationscrossing watercourses with a view to reducing sedimen-tation by keeping heavy equipment out of streams.
Nova Scotia’s guidelines for road construction andstream crossings on private forest lands are included inthe policies that provide direction for public land. Table3.2c describes the guidelines in place and their impacts.
References
Alberta Department of Environment. 1931,amended 1994. Forest Reserves Act.
Alberta Department of Environment. 1935,amended 1998. Soil Conservation Act.
Alberta Department of Environment. 1949,amended 1998. Public Lands Act.
Alberta Department of Environment. 1991. Water Act. [online]. http://www.gov.ab.ca/env/water/legislation.html Accessed February 2000.
Braithwaite, G.C. 1992. Woodlot Roads, StreamCrossings. Nova Scotia Department of NaturalResources. 34 p.
British Columbia Ministry of Environment, Landsand Parks—Resource Stewardship Branch. 1999.Percentage of forest managed as communitywatersheds. Victoria, BC.
British Columbia Ministry of Forests. 1999. ForestsPractices Code of British Columbia Act. [online].http://www.for.gov.bc.ca/tasb/legsregs/fpc/fpc.htmAccessed February 2000.
Canadian Environmental Assessment Agency. 1995.Canadian Environmental Assessment Act. [online].http://www.ceaa.gc.ca/act/act_e.htm AccessedFebruary 2000.
Department of Justice Canada. 1986. NavigableWaters Protection Act. [online]. http://canada.justice.gc.ca/FTP/EN/Regs/Chap/N/N-22/ AccessedFebruary 2000.
Department of Justice Canada. 1999. Fisheries Act.[online]. http://canada.justice.gc.ca/FTP/EN/Laws/Chap/F/F-14.txt Accessed February 2000.
Ministère des Ressources naturelles du Québec.1995. Cahier des propositions. Comité directeur duSommet sur la forêt privée. Gouvernement du Québec.Code de diffusion: RN95-3063.
Newfoundland and Labrador Department ofEnvironment and Labour. 1995. Environment Act.
Nova Scotia Department of Environment andDepartment of Fisheries and Oceans Canada. 1983.Environmental standards for the construction of forestroads and fire ponds in Nova Scotia. 28 p.
Nova Scotia Department of Natural Resources.1989. Forest wildlife guidelines and standards for NovaScotia. Halifax, NS. 19 p.
Nova Scotia Department of Natural Resources.1989. Crown Lands Act. [online]. http://www.gov.ns.ca/legi/legc/statutes Accessed February 2000.
Nova Scotia Department of Environment. 1995.Environment Act. [online]. http://www.gov.ns.ca/legi/legc/statutes/environ1.htm Accessed February 2000.
Ontario Ministry of Natural Resources. 1998.Crown Forest Sustainability Act. Toronto, ON.
Talbot, S.D. 1991. Forest access roads, planning andconstruction manual. Nova Scotia Department ofNatural Resources. Halifax, NS. 103 p.
CO
NSE
RVAT
ION
OF
SOIL
AN
D W
ATER
RES
OU
RC
ES•
Polic
y an
d Pr
otec
tion
Fore
st F
acto
rs
43

4.1.1
4.1.2
4.1.3
4.1.4
4.1.5
4.1.6
4.1.7
4.1.8
4.1.9
4.3.2
4.4.1
4.2.1
4.2.2
3.1.2
4.2 Forest Land Conversion
4.3.1
4.3.3
4.3 Forest Sector CO2 Conservation
4.4.2
4.4.4
4.4.5
4.4 Forest Sector Policy Factors
4.5.1
4.5 Contributions to Hydrological Cycles
4.1 Contributions to Global Carbon Budget
44
Tree biomass volumes
Vegetation (non-tree) biomass estimates
Percentage of canopy cover
Percentage of biomass volume by general forest type
Soil carbon pools
Soil carbon pool decay rates
Area of forest depletion
Forest wood product life cycles
Forest sector CO2 emissions
Fossil carbon products emissions
Recycling rate of forest wood products manufactured and used in Canada
Area of forest permanently converted to non-forest land use (for example,urbanization)
Semi-permanent or temporary loss or gain of forest ecosystems (for example,grasslands, agriculture)
Area of forest converted to non-forest land use (for example, urbanization)
Fossil fuel emissions
Percentage of forest sector energy usage from renewable sources relative to total sectorenergy requirement
Participation in the climate change conventions
Existence of forest inventories
Existence of laws and regulations on forest land management
Surface area of water within forested areas
FOREST ECOSYSTEM CONTRIBUTIONS TO GLOBALECOLOGICAL CYCLES
CRITERION 4
INTRODUCTION

ELEMENT OVERVIEW
Forests are extensive, ever-changing pools of carbon.Photosynthesis is the process by which trees absorb
carbon dioxide (CO2) from the atmosphere, convert itto carbohydrates, of which carbon is an essentialingredient, and store it in their roots, leaves, branchesand trunks. Photosynthesis is the principal naturalmechanism for removing greenhouse gases from theatmosphere. A vigorous and growing forest acts as asink, storing carbon as it grows to maturity. Whentrees become diseased, when they decay, or when theyare killed by fire, the stored carbon is released.
ELEMENT 4.1CONTRIBUTIONS TO GLOBALCARBON BUDGET
45
INTRODUCTION
Forests occupy roughly one third of the Earth's land surface, and Canada has approxi-mately 10% of the Earth's forests. Because of their size, forests play a major role in thefunctioning of the biosphere. Global ecological cycles are a complex of self-regulating
processes responsible for recycling the Earth's limited supplies of water, carbon, nitrogenand other life-sustaining elements. Understanding the role forests play in these cycles isessential for the development of sustainable forest practices.
Carbon budgets that estimate the balance between carbon storage and carbon release fromforests and forest products indicate the nation's contribution to atmospheric enrichment.Element 4.1 (Contributions to Global Carbon Budget) examines the role of forests as sinks orsources of atmospheric carbon and describes the impact of disturbances such as insects, fireand harvesting on carbon movement among the atmosphere, trees and soils.
Carbon budgets are sensitive to forest land conversions because temporary orpermanent removal of forest alters the land's capacity to absorb and store carbon.Element 4.2 (Forest Land Conversion) seeks to determine the amount of forest land beingconverted for other uses, such as urbanization or agriculture, as well as land beingconverted back to forest.
Forest industries consume a large amount of energy in harvesting, transporting andconverting timber into products. Element 4.3 (Forest Sector Carbon Dioxide Conservation)discusses the types of fuel used by the forest sector, and their impact on the global carbonbudget. Efforts by the sector to improve energy efficiency through the introduction ofcleaner-burning fuels are also discussed.
The sustainable management of Canada's forests is supported by various policies andpolicy frameworks. Element 4.4 (Forest Sector Policy Factors) examines Canada's internationalforestry commitments, the national policy frameworks that are in place for forestmanagement, and the existence of forest inventories as a means of gauging Canada's capacityfor measuring, monitoring, and implementing sustainable forest management.
Hydrological cycles describe the movement of water from the atmosphere to the soil,vegetation and bodies of water, and back to the atmosphere. Changes in the area of water surfaceswithin forested landscapes can indicate the impact of forest practices on hydrological cycles.Element 4.5 (Contributions to Hydrological Cycles) reviews current information on hydrological cycles.
Global CarbonBudget
Forest LandConversion
Carbon DioxideConservation
PolicyFactors
HydrologicalCycles
GLOBALECOLOGICAL
CYCLES
4.1.1
4.1.2
4.1.3
4.1.4
4.1.5
4.1.6
4.1.7
4.1.8
4.1.9
4.3.2
4.4.1
FOREST ECOSYSTEMCONTRIBUTIONS TO GLOBALECOLOGICAL CYCLES

Through these processes, forests can become a sourceof CO2 to the atmosphere and to the various environ-mental compartments.
Even through fire, only a small portion of the carbonaccumulated in tree biomass is immediately releasedinto the atmosphere. The rest ends up on the forestfloor and in the soils, and subsequently decomposesover a long period of time. The whole process of carbonuptake by the forest, release to the atmosphere, orredistribution in soil and biomass components is calledthe carbon cycle.
The global carbon cycle (Indicators 4.1.1 to 4.1.9,4.3.2, 4.4.1) represents the most important set ofprocesses linking forests with climate change. Therelease or removal of CO2 to and from the atmosphereimpacts on global ecological cycles. Forests can act aseither sinks or sources for atmospheric carbon,depending on whether they are principally storingcarbon or releasing it. Knowledge of the influence ofnatural disturbances and human intervention on thisrole can indicate the type of forest practices required forsustainable management.
The Canadian Forest Service has been leading thedevelopment of a carbon budget model for Canada’sforests. A carbon budget estimates the balance betweencarbon storage and release. Model estimates of thecarbon currently stored in 404 million hectares of bothmanaged and unmanaged Canadian forests, andchanges in the carbon budget over the period 1920-1994, are outlined in this report.
Current estimates suggest that after having acted as asink for atmospheric carbon for much of this century,Canada’s forests became a net source in the mid-1980s.These estimates also indicate that the carbon budget ofCanada’s forests varies from ecosystem to ecosystemand on year to year, decade to decade and century tocentury time scales. The amount of carbon containedin the forest is strongly influenced by age distribution,growth processes and disturbances caused by fire,insects, disease and harvesting. The recent 25-yearperiod of high fire and insect disturbances in the borealforest will likely affect the dynamics of the forest carbonbudget for decades to come.
Development of the carbon budget model forCanadian forests is not yet complete. Research isongoing at the national and provincial levels to improvevarious model components and data quality and to
determine how management activities such asharvesting, silvicultural practices, forest protection, andincreased use of forest products affect the forest’s contri-bution to the carbon cycle. Changes in the carbonbudget estimates can be expected as new data areobtained, improvements to the model are made, and ourunderstanding of forest carbon cycle processes increases.
INDICATOR REPORT
TREE BIOMASS VOLUMES
VEGETATION (NON-TREE) BIOMASS ESTIMATES
PERCENTAGE OF CANOPYCOVER
PERCENTAGE OF BIOMASSVOLUME BY GENERAL FOREST TYPE
SOIL CARBON POOLS
SOIL CARBON POOL DECAYRATES
AREA OF FOREST DEPLETION
FOREST WOOD PRODUCT LIFECYCLES
FOREST SECTOR CO2EMISSIONS
FOSSIL CARBON PRODUCTSEMISSIONS
RECYCLING RATE OF FORESTWOOD PRODUCTS MANUFAC-TURED AND USED IN CANADA
4.4.1
4.3.2
4.1.9
4.1.8
4.1.7
4.1.6
4.1.5
4.1.4
4.1.3
4.1.2
4.1.1
GLO
BA
L EC
OLO
GIC
AL
CY
CLE
S•
Glo
bal C
arbo
n Bu
dget
46

Indicators 4.1.1 to 4.1.9, 4.3.2 and 4.4.1 arecombined and reported as one indicator to address theforest sector carbon budget. This report presentsestimates of the carbon stored in 404 million hectares ofboth managed and unmanaged forests.
Carbon dioxide (CO2) is one of the principalgreenhouse gases in the Earth’s atmosphere. Globalforest ecosystems account for 100 Gt (gigatonne = 109t,t = 1012g) of carbon (C), which is approximately 50% ofthe annual exchange of this gas with the atmosphere.
The forest carbon budget (Kurz and Apps 1999)consists of three major carbon pools or reservoirs:forest biomass; forest soils (which includes litter andcoarse woody debris); and forest products. Forestecosystems worldwide represent huge carbon pools insoil and standing biomass. The total modelled estimatefor the amount of carbon stored in 1994 in allCanadian forests and related resources, excludingpeatlands, is 85.3 Gt C, with 14.3 Gt C in standingvegetation biomass (trunks, branches, roots), 70.1 GtC in forest soils and litter and 0.9 Gt C in forestproducts (the total accumulated from forest harvestingover the last 45 years after accounting for decompo-sition and burning of wastes, and including productexports). The forest products pool is small (0.3% of thetotal forest carbon pool), but it is important in termsof the annual movement of carbon between pools. Theinclusion of peatlands in this reservoir increases thetotal to approximately 225 Gt C (Kurz and Apps 1999,Apps et al. 1999).
On a daily, seasonal and annual basis, carbon movesamong pools and between pools and the atmosphere in
a variety of ways. Figure 4.1a shows the estimated totalcarbon stored in the major carbon pools (rectangles) atthe end of 1994, annual net transfers between pools(arrows) and change in pool storage (∆) for the period1990 to 1994.
14.3BIOMASS∆ = -0.037
0.9PRODUCTS
∆ = +0.020
70.1SOILS
∆ = -0.008
0.0090.043
0.015
0.023
0.017
FIGURE 4.1a Canada's forest carbon pool size and net transfers, 1990-1994 (gigatonnes of carbon [Gt C], gigatonne = 109t)
Source: Kurz and Apps 1999
GLO
BA
L EC
OLO
GIC
AL
CY
CLE
S•
Glo
bal C
arbo
n Bu
dget
47
TABLE 4.1a Estimated total carbon storage and average annual change (∆) in the carbon (C) pools in Canada’s forests, 1990–1994
SOIL BIOMASS ECOSYSTEMEcoclimatic Forest Area Total GtC* ∆C Mt*/yr Total Gt C ∆C Mt/yr Total Gt C ∆C Mt/yrProvince** (million ha)***Arctic 0.6 0.2 0.2 0.0 -0.01 0.2 0.2Subarctic 85.2 20.7 -9.8 1.5 -14.5 22.2 -24.3Boreal West 97.6 13.4 26.8 3.1 -15.6 16.5 11.2Boreal East 120.2 17.0 -46.4 2.3 1.0 19.3 -45.4Temperate Forests 26.0 4.2 -3.6 1.4 -0.1 5.7 -3.7Cordilleran 72.0 14.4 24.4 5.9 -7.6 20.2 16.8Grassland 2.6 0.2 0.7 0.1 -0.04 0.3 0.6Canada 404.2 70.1 -7.8 14.3 -36.8 84.4 -44.6
* Gt C (gigatonne = 109t carbon), Mt C (megatonne = 106t carbon), t = 1012g.** Ecologically based regions in which the plant succession and rate of growth are similar on similar sites are referred to as ecoclimatic
regions. Ecoclimatic regions are grouped into ecoclimatic provinces (Canada Committee on Ecological Land Classification 1989).***Biomass data are available for 404.2 million hectares. Source: Kurz and Apps 1999

Table 4.1a shows the estimated carbon storage in1994 for each of the major ecoclimatic provinces inCanada, and the estimated change in storage in eachover the period 1990 to 1994. There is an overall loss ofcarbon from the forests, primarily from the Boreal East.The Arctic, Boreal West, Cordilleran and Grasslandecoclimatic provinces are sequestering carbon. Variationin carbon fluxes is evident within the Boreal ecoclimaticprovinces, with the Boreal East losing carbon while theBoreal West is accumulating it.
TABLE 4.1b Biomass carbon content of Canada’s forests by age class in 1994
FOREST AREA BIOMASS
Age Class (million ha) % (Mt C) Average(years) (t C/ha)
0-19 89.43 22.1 178.9 2.0
20-39 47.74 11.8 381.9 8.0
40-59 44.01 10.9 1 320.2 30.0
60-79 49.82 12.3 2 740.0 55.0
80-99 51.31 12.7 2 924.9 57.0
100-119 34.66 8.6 2 045.2 59.0
120-139 37.46 9.3 2 322.3 62.0
140-159 16.17 4.0 1 115.6 69.0
160+ 33.63 8.3 1 352.5 40.2
Total 404.23 100.0 14 381.4 35.6
Source: Kurz and Apps 1999
Table 4.1b also shows that the quantity of carbon perunit area in Canada’s forests increases with age class,peaking at 69 t/ha in the 140-159 year age class. The ageclass with the greatest amount of carbon in storage is the80-99 year age class, which after the 0-19 year age class,covers the largest area of forest.
The carbon budget for Canada’s forests has beenmodelled over the period 1920 to 1994 (Figure 4.1b).During this 75-year period, Canada’s forests were asink for atmospheric carbon, averaging 173 Mt C(megatonne = 106 t) per year. However, the magnitudeof the sink has been steadily declining. Carbon lossesbegan to occur in the 1970s in the biomass pool,followed by the soils pool in the 1980s. The rate ofloss peaked at 75 Mt C/yr in the period 1985 to 1989.Estimates for the most recent period, 1990 to 1994,suggest that Canada’s forests are still a net source ofatmospheric carbon of about 44.6 Mt C/yr.
Fire, insects and harvesting played a major part in theabrupt change in the forest’s role from a sink to a source(Figure 4.1c). Fire disturbances (Indicator 2.1.3) inparticular increased an estimated twofold. The potentialimpact of climate change on the frequency and intensityof forest disturbances related to fire and insects is amajor concern with respect to carbon dynamics inCanadian forests (Kurz et al. 1992).
6
5
4
3
2
1
0'20 '30 '40 '50 '60 '70 '80 '90
Year
Total
HarvestFire
Insects
FIGURE 4.1c Forest disturbances—five year averages
Are
a D
istu
rbe
d (
mil
lio
n h
a)
Source: Kurz and Apps 1999
20
18
16
14
12
10
90
85
80
75
70
65
60'20 '30 '40 '50 '60 '70 '80 '90
Year
FIGURE 4.1b Carbon pools in Canadian forests
Bio
mas
s (M
t C
)
Eco
syst
em
an
d s
oil
(G
t C
)BiomassSoil
Ecosystem
Source: Kurz and Apps 1999
GLO
BA
L EC
OLO
GIC
AL
CY
CLE
S•
Glo
bal C
arbo
n Bu
dget
48

ELEMENT OVERVIEW
Carbon budgets are sensitive to forest land con-version because replacement ecosystems usually havehigher carbon turnover rates and lower storagecapacity than forested lands. Irreversible forestremovals have particularly negative and long-termimpacts on carbon budgets.
Land-use change occurs throughout Canada inresponse to population growth, industrial developmentand changes in legislation, regulations and resourcemanagement practices. These changes include both thepermanent (Indicator 4.2.1) and semi-permanent(Indicator 4.2.2) conversion of forest land to other usesand the conversion or reversion of land back to forest.The location, magnitude and extent of semi-permanentand permanent conversion of forest lands to other usesvary widely depending upon many factors. Theseinclude changes in population and associated urbanexpansion (Indicator 3.1.2), infrastructuredevelopment, agricultural product prices, demands forrecreation and wildlife habitat, as well as land tenureand land- and resource-use policies. Reversion to forestland results primarily from the natural encroachmentof trees due to fire suppression or the planting orregeneration of forests on agricultural lands.
A number of provinces and territories have institutedlegal and institutional mechanisms to controlencroachment on forest lands. Research is ongoing intothe development of remote sensing and other datasources to improve our ability to assess changes in theforest land base over time.
INDICATOR REPORT
AREA OF FOREST PERMANENT-LY CONVERTED TO NON-FOR-EST LAND USE (FOR EXAMPLE,URBANIZATION)
SEMI-PERMANENT OR TEMPO-RARY LOSS OR GAIN OF FORESTECOSYSTEMS (FOR EXAMPLE,GRASSLANDS,AGRICULTURE)
AREA OF FORESTCONVERTED TONON-FOREST LANDUSE, (FOR EXAMPLE,URBANIZATION)
Comprehensive time series informationon changes in land cover and use is notavailable for Canada. Variousapproaches have been used to estimatethe permanent and semi-permanentconversion of forest land to other uses.These include forest inventorycomparisons, surveys, estimates ofexpansion of agricultural lands, andtracking of changes in legallydesignated forest lands. The reliabilityof these estimates varies considerablybecause many of the apparent changes inarea can be attributed to new techniques,or changes in definitions, stratificationand classification criteria and inventorystandards and purposes. In addition, somedifferences may reflect changes in land userather than land cover, for example, when areaspreviously available for forestry purposes aredesignated as wildlife reserves.
In order to fully report on forest land-use changes,baseline information is necessary to determine thepotential impact of land withdrawals and to developmitigative strategies. In addition to the geospatiallocation of converted lands and associated informationon the forest resources, land tenure and administrativeboundaries, information is also required on estimatedproductivity losses and the impacts on biodiversity andbiodiversity values, the hydrological cycle, conservationstatus, the carbon budget and overall sustainability.
Results of a recent study (Global Forest Watch 2000)indicated that 26 million hectares of historicallyforested land—six percent of Canada’s forest area—arenow classified as cultivated or built up. The studyshowed that most of the clearing has occurred in theCarolinian and aspen parkland forest regions. The taigaforest has had very little clearing and less than 3% ofthe boreal forest has been cleared.
Indicators 4.2.1, 4.2.2 and 3.1.2 are combined andreported as one indicator through two case studies. Thefirst details changes in forest land use in two provinces
3.1.2
4.2.2
4.2.1
ELEMENT 4.2FOREST LAND CONVERSION
GLO
BA
L EC
OLO
GIC
AL
CY
CLE
S•
Fore
st L
and
Con
vers
ion
49
Global CarbonBudget
Forest LandConversion
Carbon DioxideConservation
PolicyFactors
HydrologicalCycles
GLOBALECOLOGICAL
CYCLES
4.2.1
4.2.2
3.1.2

pursuant to legal and institutional mechanisms tocontrol encroachment on forest lands. The secondexamines changes in land use for Prince Edward Islandbased on forest inventory information.
Case Study 1 Changes in forest land use as governed by legal and institutional mechanisms
AlbertaAlberta’s Green Area was established in 1948 to preventsettlement and indiscriminate squatting on certain areasof provincial lands that had been found unsuitable foragriculture. The lands were withdrawn from settlement,and disposition of surface rights was limited tocommercial and industrial uses and other uses that theMinister of Lands and Mines considered to be in thepublic interest. Although the forestry potential wasacknowledged, the lands were not formally designatedas forest lands.
From 1948 to the mid-1960s, most changes to theGreen Area took place as a result of local pressure toopen additional lands for agricultural development.These alterations to the boundary were generally of apiecemeal nature, but the suitability of land foragricultural purposes was assessed before any new areaswere opened up. In a few instances, boundary changeswere made to consolidate the area to which forest fireprotection was extended or for administrative reasonssuch as conformity with municipal boundaries.
In 1968 the Green Area was redefined as “Forestlands not available for agricultural development otherthan grazing.” The order-in-council went on to statethat “Provincial public lands are managed for multipleuses including forest production, water, recreation, fishand wildlife, grazing and industrial development.” Thearea shown in Figure 4.2a includes Wood BuffaloNational Park. Excluding the Park, there are approxi-mately 350 554 square kilometres in the Green Area.
The data presented in Table 4.2a were drawn fromthe Land Status Automation System (AlbertaDepartment of Environment 1990-1997) by searchingfor those types of activity that led to, or were likely tolead to, withdrawals of forested land from the GreenArea over the period January 1, 1990, to August 1,1999. The activity types were then classified as follows:
• “Industrial” includes all conversions except foragriculture and vegetation control easements. Themajor conversion categories include surface mineralleases, licence of occupation, roadways, easementsand pipeline agreements.
• “Agriculture” includes cultivation permits and farmdevelopment leases and sales.
• “Other” includes vegetation control easements.
• “Changed Land Use” includes areas that aremaintained as forest but that are not available fortimber production, for example, forest research andsample plots and recreational areas.
FIGURE 4.2a Province of Alberta Green Area
Source: Alberta Department of Environment
GLO
BA
L EC
OLO
GIC
AL
CY
CLE
S•
Fore
st L
and
Con
vers
ion
50

TABLE 4.2a Conversion of forest land in AlbertaType of Area converted (ha)Conversion
Permanent Semi- Maintained TotalPermanent as Forest
LandIndustrial 53 094 53 094Agriculture 1 591 1 591Other 1 687 1 687Changed 5 363 5 363Land UseTotal 53 094 3 278 5 363 61 735
Source: Alberta Department of Environment 1990-1999
British ColumbiaBritish Columbia has instituted mechanisms to
control encroachment on forest and agricultural landthrough land reserve legislation and commissions. Forexample, the 1994 Forest Land Reserve Act is aimed atprotecting the commercial forest land base by creatinga forest land reserve. The Act places restrictions on theuse of forest land and serves to minimize the impact ofurban development and rural settlement. Designatedforest reserve land includes approximately 15 millionhectares of public land and 920 000 hectares of privateland. Table 4.2b shows the area of permanentconversion of public forest land by period.
TABLE 4.2b Permanent conversion of forest land inBritish Columbia
Type of HaConversion
1983–1989 1990–1997 TotalUrbanization and 3 214 4 311 7 525settlementTransport and 2 519 2 523 5 042industryAgriculture 12 245 13 094 25 339Total 17 978 19 928 37 906
Source: British Columbia Ministry of Forests 1983-1997
Case Study 2 Changes in forest land use as determined by forest inventories
Table 4.2c provides an example of changes in forestland use as described in forest inventories using datafrom Prince Edward Island.
TABLE 4.2c Permanent conversion of forest land in Prince Edward Island, 1990-1997
Type of Conversion Ha
Urbanization 436Agriculture 4 672
Total 5 108
Source: Prince Edward Island Department of Agriculture and Forestry 1998
GLO
BA
L EC
OLO
GIC
AL
CY
CLE
S•
Fore
st L
and
Con
vers
ion
51

52
GLO
BA
L EC
OLO
GIC
AL
CY
CLE
S•
Fore
st L
and
Con
vers
ion

ELEMENT OVERVIEW
Concentrations of greenhouse gases in the atmosphereare increasing as a result of human activities. While theimpact is not known with certainty, it is believed thathumans are having a discernible influence on theglobal climate, and that future effects will bepotentially more serious. The major source ofemissions is the burning of fossil fuels, and the majorgreenhouse gas in terms of volume emitted is carbondioxide (CO2). Element 4.3 tracks forest sector CO2
conservation by measuring, over time, the industry’srelative dependence on fossil fuels for conversion ofraw materials to manufactured products.
As a signatory to the United Nations FrameworkConvention on Climate Change (UNFCC 1997), andthrough its participation in the negotiations on theKyoto Protocol to that convention (Indicator 4.4.2),Canada has committed to reduce its greenhouse gasemissions. One means of doing so is to improve energyefficiency—using less energy to produce a givenquantity of product. Another way is fuel-switching—using cleaner-burning fuels in place of those that emitlarge amounts of CO2. According to the emissionsmeasurement guidelines of the IntergovernmentalPanel on Climate Change (IPCC), burning biofuelssuch as wood residues (chips, sawdust, bark, etc.) andpulping liquor does not result in net emissions (IPCC1997). This is because, under a sustainable forestmanagement regime, it is expected that biofuel CO2
emissions will be balanced by carbon removalsassociated with forest growth.
Indicator 4.3.3 summarizes energy use in forestharvesting and manufacturing operations. Indicator4.3.1 describes the CO2 emissions associated withthese operations.
Based on the Statistics Canada energy-use data forthe period 1980 to 1997, Environment Canada andNatural Resources Canada estimate total CO2
emissions from the use of fossil fuels by the forest sectorand from the production of the electricity it purchases.The data show that due to the industry’s fuel-switching
efforts and increased energy efficiency, fossilfuels are becoming a less important fuelsource compared with renewable fuels, andthat CO2 emissions have not growndespite significant increases in energy useand production.
INDICATOR REPORT
FOSSIL FUEL EMISSIONS
PERCENTAGE OFFOREST SECTORENERGY USAGEFROM RENEWABLESOURCES RELATIVE TO TOTAL SECTORENERGY REQUIREMENT
Indicators 4.3.1 and 4.3.3 are combined andreported as one indicator. These indicatorssummarize the energy use of the forest sector in itsharvesting and manufacturing operations, and theresulting emissions of CO2.
The forest sector consumes significant quantities ofenergy in harvesting, transporting and convertingtimber into products, particularly pulp and paper. As aresult, the sector emits substantial quantities of CO2
into the atmosphere. Most of these emissions comefrom burning fossil fuels, but certain industrialprocesses, such as lime production in kraft pulp mills,also result in emissions. Harvesting causes emissionsbecause part of the harvested biomass (tree tops,branches, roots) is left to decompose, although much ofthe carbon associated with the harvest is stored in forestproducts. Additional emissions are produced indirectlythrough the sector's purchases of electricity and as aresult of the transportation services it uses. Planting,seeding and natural regeneration processes contributeto carbon storage. Over time—up to 200 years—significant quantities of carbon may be stored.
In addition to emitting CO2, burning fossil fuels andbiomass results in emissions of methane (CH4) andnitrous oxide (N2O), two other greenhouse gases. Thevolume of these gases emitted by the sector is minute
4.3.3
4.3.1
ELEMENT 4.3FOREST SECTOR CO2 CONSERVATION
GLO
BA
L EC
OLO
GIC
AL
CY
CLE
S•
Fore
st S
ecto
r C
O2
Con
serv
atio
n
53
Global CarbonBudget
Forest LandConversion
Carbon DioxideConservation
PolicyFactors
HydrologicalCycles
GLOBALECOLOGICAL
CYCLES
4.3.1
4.3.3

compared with emissions of CO2 and they are notincluded in the estimates shown in this report. Only theCO2 emissions from burning fossil fuels in harvestingand manufacturing operations and from the electricitypurchased by the forest sector are discussed.
Fossil fuels used by the forest sector include coal,refined petroleum products, natural gas and biofuels inthe form of wood residues and spent pulping liquor.Some electricity purchased by the sector is producedusing fossil fuels such as natural gas, coal or coke.While electricity produced by using hydro power maybe a source of methane emissions from large hydroreservoirs, the greenhouse gas emissions producedusing hydro or nuclear power represent a small fractionof the total. In this report these values are assumed tobe negligible.
Detailed data on the energy use of pulp and papermills, lumber and planing mills and forestry operationsare available from Statistics Canada for the period 1980to 1997. The other segments of the forest sector, ofwhich the most important in terms of energy use is thepanelboard industry, account for only about 5% of thetotal energy use of the forest sector. Few data exist onenergy use for other individual segments of the sector.
Figure 4.3a shows the proportion of each majorenergy source in the total energy use of the forest sectorbetween 1980 and 1997. Fossil fuel use, including fossilfuels used in the electricity purchased by the sector,remained relatively constant in the 1990s. In 1997 itwas 17% below 1980 levels. Direct fossil fuel usedecreased even more. Purchases of fossil fuel electricitytripled, although they still accounted for only 20% ofelectricity purchases in 1997. The other 80% of thesector's electricity purchases came from hydro andnuclear power. The use of this emission-free electricityrose by 56% from 1980 to 1997, while biofuel use roseby 51%. As a result, bioenergy's share of total energyuse rose from 47% to 55%, while the share of fossilfuels fell from 39% to 27%. Hydro and nuclear powerrose from 15% to 18%.
Overall, total energy use increased by 29% between1980 and 1997, while fossil fuel CO2 emissions fell by4%, as shown in Figure 4.3b. During the same period,production of pulp, paper and lumber increased bymore than 40%, suggesting significant improvementsin energy efficiency. In addition, the forest sector (andin particular the pulp and paper industry) hasundergone a major change from high carbon fuels (coal,refined petroleum) to low carbon fuels (natural gas) andrenewable biofuels. Because of this, its share of totalCanadian fossil fuel CO2 emissions is now less than5%, although it accounts for approximately 25% ofindustrial energy demand and about 10% of totalCanadian energy demand.
FIGURE 4.3b Carbon dioxide emissions andtotal energy use in the forest sector
1 200
1 100
1 000
900
800
700
600
24
22
20
18
16
14
12'80 '85 '90 '95
Year
Me
gato
nn
es
Pe
tajo
ule
s
CO2 emissions (Megatonnes)Total energy use (Petajoules)
Source: based on data from Natural Resources Canada and Environment Canada 1980-1997
FIGURE 4.3a Forest sector energy sources
500
400
300
200
100
0'80 '82 '84 '86 '88 '90 '92 '94 '96
Year
Pe
tajo
ule
s
Bioenergy Fossil fuels Hydro and nuclear power
Source: based on data from Natural Resources Canada and Environment Canada 1980-1997
GLO
BA
L EC
OLO
GIC
AL
CY
CLE
S•
Fore
st S
ecto
r C
O2
Con
serv
atio
n
54

Figure 4.3c shows forest sector CO2 emissions by fueltype. The fuel-switching effort of the sector is mostclearly seen in the large decline in emissions fromrefined petroleum products and coal. The change fromthese carbon-intensive fuels to biofuels and natural gashas enabled the sector to limit emission increases whileincreasing energy use and output. Some of the declinein emissions from petroleum products and coal hasbeen offset by increases in natural gas and fossil fuelelectricity emissions.
While these trends are representative of the forestsector as a whole, the assessment would be improved byenhanced data on fossil fuel use and emissions of thepanelboard industry and other segments of the forestsector and on emissions associated with thetransportation services used by the sector.
FIGURE 4.3c Forest sector carbon dioxide, direct and indirect emissions
14
12
10
8
6
4
2
0'80 '85 '90 '95
Year
Me
gato
nn
es
CO
2
Refined petroleum productsNatural gas
Fossil fuel electricityCoal and coke
Source: based on data from Natural Resources Canada and Environment Canada 1980-1997
GLO
BA
L EC
OLO
GIC
AL
CY
CLE
S•
Fore
st S
ecto
r C
O2
Con
serv
atio
n
55

GLO
BA
L EC
OLO
GIC
AL
CY
CLE
S•
Fore
st S
ecto
r C
O2
Con
serv
atio
n
56

ELEMENT OVERVIEW
Canada’s progress toward the conservation andsustainable development of its forests can be measuredin part by its involvement in international climatechange activities, as well as domestic initiatives insupport of international efforts and obligations.Equally important are the appropriateness of Canada’scollective policies and the manner in which its legal andregulatory frameworks influence such progress.
Sustainable forest management calls for a flexible andbalanced integration of all factors of which it iscomposed. This approach necessitates that federal andprovincial governments continually re-examine andadjust their policies, legislation, guidelines, standards,rules and manuals for forest managers. Element 4.4provides a measure of governments’ discernablecommitments, through their laws, regulations andinternational activities, to ensuring the sustainability ofthe forest resource.
Canada is a signatory to the United NationsFramework Convention on Climate Change (UNFCC),which was adopted in 1992 at the Rio Earth Summit.Its ultimate objective is the “stabilization of greenhousegas concentrations in the atmosphere at a level thatwould prevent dangerous anthropogenic (human-induced) interference with the climate system.” It alsostates that countries shall seek to protect and enhancetheir greenhouse gas sinks and reservoirs. Canadiandecision-makers and scientists continue to work withstakeholders to ensure that Canada is in a position tomeet its commitments to this convention and thesubsequent Kyoto Protocol (Indicator 4.4.2).
Ensuring that the nation’s forests are managedsustainably requires a collaborative effort. Canada is asignatory to important international conventions onsustainable resource management, and the provinces,territories and federal government are all workingtogether to ensure that national commitments are met.Comprehensive and up-to-date information on forestresources are required to respond to these commitments.
A forest inventory (Indicator 4.4.4) is asurvey of a forested area to determine anumber of its characteristics. Provincialand territorial forest managementagencies employ various inventorysystems in managing their forests.Forest inventories in Canada continueto evolve to address a full range ofvalues related to sustainablemanagement as more non-timberattributes are being added tosuccessive cycles of inventory.Inventories are also beingreformulated in order to providenational data on sustainable forestsand changes to the resource over time.
Across Canada, new forest laws,stricter enforcement of previouslyinformal policies and guidelines, andthe adoption of provincial criteria andindicators demonstrate that efforts arebeing made by the provinces andterritories to achieve sustainable forestmanagement (Indicator 4.4.5). A number ofprovinces have passed legislation based on theprinciples of sustainability, and governmentagencies across the country have adopted a consultativeapproach to forest management and policydevelopment. All levels of government have committedto a national forest strategy and are working toincorporate its goals into their legislation, regulationsand practices. In many cases, this has included thedevelopment of sets of criteria and indicators atprovincial or local levels.
INDICATOR REPORTS
PARTICIPATION IN THE CLIMATE CHANGE CONVENTIONS
In December 1997, the parties to the UNFCC adoptedthe Kyoto Protocol (UNFCC 1997) to limit emissions ofsix greenhouse gases (ghg). Once the Protocol entersinto force, the Annex 1 (industrialized) countries willhave to reduce their average annual ghg emissionsbetween 2008 and 2012 by 5% from the 1990 level.
4.4.2
ELEMENT 4.4FOREST SECTOR POLICYFACTORS
GLO
BA
L EC
OLO
GIC
AL
CY
CLE
S•
Fore
st S
ecto
r Po
licy
Fact
ors
57
Global CarbonBudget
Forest LandConversion
Carbon DioxideConservation
PolicyFactors
HydrologicalCycles
GLOBALECOLOGICAL
CYCLES
4.4.2
4.4.4
4.4.5

Canada accepted a target of 6% below its 1990emissions level. The Protocol will come into force afterit has been ratified by at least 55 parties to theconvention, including developed countriesrepresenting at least 55% of the total 1990 ghgemissions from this group.
In April 1998, the federal and provincial/territorialMinisters of Energy and Environment agreed on aprocess for developing a national implementationstrategy on climate change that would help determinethe costs and impacts of reaching Canada’s KyotoProtocol target. Among the sixteen tables established aspart of this process were the Forest Sector Table and theSinks Table.
The Forest Sector Table comprised experts from adiverse array of stakeholder groups, including
government, the forest industry, environmental groups,organized labour, research organizations, academia,Aboriginal groups and forest-dependent communities.As part of its mandate, it examined the potential for theforest sector to help reduce Canada’s ghg emissionsthrough fuel-switching and energy efficiency(Indicator 4.3.3). Options were analyzed in terms oftheir costs and mitigation potential, as well as otherconsiderations such as implications for competitiveness,environmental and health impacts, and employment.
The Sinks Table included experts in forest,agricultural and wetland carbon sinks and sources. Inconjunction with the Forest Sector Table, it looked atways to enhance forest carbon sinks and reduce forestcarbon sources. The two Tables also consideredadditional activities that could be added to the Protocolto enhance the impact of carbon sinks.
GLO
BA
L EC
OLO
GIC
AL
CY
CLE
S•F
ores
t Se
ctor
Pol
icy
Fact
ors
58
Source: Canadian Council of Forest Ministers 1997
4
8
11
12
3
22
2
2
3
5
5
6 7
6
3
1
1
1
14
15
9
10
6
6
13
Data source Ecozones1- Arctic Cordillera2- Northern Arctic3- Southern Arctic4- Taiga Plains5- Taiga Shield6- Boreal Shield7- Atlantic Maritime8- Mixedwood Plains9- Boreal Plains10- Prairies11- Taiga Cordillera12- Boreal Cordillera13- Pacific Maritime14- Montane Cordillera15- Hudson Plains
Forest inventory coverage by data sourceFIGURE 4.4a
Reconnaissance
Regional
Management
Other
Not included*Ecozone boundaries
Note: Inventories fall into three major categories: reconnaissance (wide area, general information), regional (wide area, detailed information) and management (small area, very detailed information).
*Area not included in Canada’s Forest Inventory.

A series of options was recommended by the Tablesin their final Options Reports. These are currently beingreviewed by federal, provincial and territorialgovernments for inclusion in the NationalImplementation Strategy and considered in relation tooptions suggested by other Tables. Work on theStrategy will continue throughout 2000.
Canada has been actively engaged in meetings tonegotiate the definitions, interpretations and rulesassociated with carbon sequestering, or sinks, in theKyoto Protocol. Resolution of these issues is not expecteduntil the sixth Conference of the Parties, scheduled forlate 2000.
Canada is also involved in the work of theIntergovernmental Panel on Climate Change (IPCC).Canadian scientists are participating in the preparationof the Third Assessment Report, scheduled forcompletion in 2000. As well, Canadian scientistscollaborated on the IPCC Special Report on Land Use,Land Use Change and Forestry, which was released in
May 2000 and was prepared to assist negotiators as theywork to clarify the related sections of the Kyoto Protocol.
EXISTENCE OF FORESTINVENTORIES
A forest inventory may be defined as a survey of an areato determine the volume, location, extent, condition,composition and structure of the forest resource.Provincial and territorial forest management agenciesemploy a number of inventory systems, fromreconnaissance (an exploratory inventory for strategicpurposes) to operational (a detailed inventory of aspecific area for operational harvest planning), to satisfythe needs of forest management (Figure 4.4a).
Covering most of the inventoried area in Canada, themanagement inventory is the most prevalent andimportant inventory system. It consists of completearea coverage, land cover mapping derived from aerialphotography, and estimates of wood volume, biomass
4.4.4
GLO
BA
L EC
OLO
GIC
AL
CY
CLE
S•
Fore
st S
ecto
r Po
licy
Fact
ors
59
TABLE 4.4a Characteristics of provincial/territorial forest management inventories*
Province/ Inventory Inventory Mapping Sample PlotTerritory*** Areas Cycle Cycle
Million hectares Type Number Period Scale Update Temporary Permanent**
Completed (years) Schedule
NF 10.16 Continual 4 10 1:12 500 4 year Y(4)
NS 5.31 Continual 3 10 1:10 000 3 year Y Y(5)
PE 0.58 Periodic 3 10 1:10 000 periodic Y Y(3)
NB 7.11 Continual 5 10 1:12 500 annual Y Y(3&5)
QC Continual 3 10 1:20 000 5 year Y Y
ON 61.45 Continual 3 20 1:10 000 5 year Y
1:20 000
MB 41.98 Continual 3 10-25 1:15 840 Y Y(3&5)
SK 15.88 Continual 4 15 1:12 500
AB 39.00 Periodic 4 15 1:15 000
1:20 000
BC 93.43 Continual 5 10 1:20 000 2 year Y Y
YK
NT 4.90 Continual 1 15-20 1:20 000 Y Y(5)
* Characteristics for MB, SK and BC have been extracted from Leckie and Gillis, 1995.** Numbers in parentheses indicate remeasurement periods in years.***NF: Newfoundland and Labrador, NS: Nova Scotia, PE: Prince Edward Island, NB: New Brunswick, QC: Quebec, ON: Ontario, MB: Manitoba,
SK: Saskatchewan,AB:Alberta,YK:Yukon, NT: Northwest Territories.
Sources: Natural Resources Canada—Canadian Forest Service 1998, Lowe et al. 1996

and other values from field samples. The data are usedto support land-use planning decisions and to addressregional, provincial/territorial and national reportingrequirements. Management inventories are conductedon a cyclical basis, with cycles ranging from 10 to 25years. Most provinces have conducted at least threecycles of inventory. Each successive cycle incorporatesbroader area coverage, improvements in standards andprocedures, and additional attributes to reflectchanging demands for information. Characteristics ofprovincial management inventories are provided inTable 4.4a.
Aerial photography provides forest cover maps thatare updated on a regular basis to capture changes tothe extent, structure, health and productivity of theforests resulting from natural and humanintervention. Ground sampling programs areconducted to provide additional attributes not readilyavailable from aerial photography. Temporary sampleplots are used to report on a wide range of attributesincluding trees, ecology, soils and wildlife. Permanentsample plots, which have remeasurement periodsranging from three to five years, are used to monitorforest growth and yield.
Canada also compiles a national forest inventoryapproximately every five years by aggregating existingmanagement inventories. The national inventory isstored in a relational database management system anda geographic information system (GIS) that permit themapping of the distribution and structure of the majorforested areas. The current version of the national forestinventory does not reflect the present state of theforests. It cannot be used as a satisfactory baseline tomonitor change because it lacks information on thenature and rate of changes to the resource and iscompiled from inventories of different ages.
Forest inventories continue to evolve to address a fullrange of values related to sustainable management.More non-timber attributes are being added tosuccessive cycles of inventory. Terms such as“productive forest” are disappearing in favour of non-cultural descriptions of the land base (e.g., treed versusnon-treed).
EXISTENCE OF LAWS ANDREGULATIONS ON FORESTLAND MANAGEMENT
The Constitution Act of 1867 assigns exclusive respon-sibility for forest resources to provincial governments.Section 92A of the Act states that the provinciallegislature may exclusively make laws in relation to “. . . development, conservation and management ofnon-renewable and forestry resources in the province,including laws in relation to the rate of primaryproduction therefrom.” Provinces and territories nowmanage 71% of Canada’s forests, while 23% is underfederal and territorial jurisdiction and the balance isprivately owned.
The provincial, territorial and federal governmentsshare responsibilities in the areas of science andtechnology, industrial and regional development andthe environment. Responsibility for internationalrelations and trade and federal and Aboriginal landresides with the federal government. There are manycommon interests that are dealt with cooperativelythrough the Canadian Council of Forest Ministers.
The legal framework for forest management inCanada is composed of a series of instruments rangingfrom legislation to informal guidelines. Forestlegislation (statute) defines broad governmentobjectives in forest use and management and prescribesthe manner in which rights to forest resources may betransferred to private parties, the responsibilities ofgovernment officials, and fiscal and managerialarrangements for the forests. Forest acts or statutes canonly be amended by the relevant provincial, territorialor federal legislature. Regulations define statutoryprovisions and provide administrative means forimplementation. Many of the rules of forestmanagement are detailed in regulations, which have thefull force of the law. Common law complements forestlegislation and is based on historical cases and courtdecisions. The rules under which forests are used andmanaged may take the form of guidelines, manuals,standards, etc. which are not enacted as regulations but
4.4.5
GLO
BA
L EC
OLO
GIC
AL
CY
CLE
S•
Fore
st S
ecto
r Po
licy
Fact
ors
60

are administered by the responsible forest authority.Although not having the force of law, these informalrules provide direction to forest managers in their dailyoperations. There has been a recent trend towardformally enacting guidelines as regulations. Onceincorporated into operating permits and certificates ofmanaged land, they are enforced by law.
Forest tenure arrangements are provincial policyframeworks that set out the conditions for privateparties to operate on public lands. A tenure is definedas a right or interest granted by the government toharvest timber on public lands. Tenures can begrouped into three main categories: long-term, area-based tenures; medium-term, volume leases; andshort-term, quota-based tenures (Luckert and Salkie1998, Ross 1995). Tenure conditions specify whattenure holders can and cannot do and are increasinglyadministered within land-use planning frameworks(see text box below).
Forest lands are also subject to environmentalprotection legislation that applies regardless ofownership. Under the federal Fisheries Act and variousprovincial statutes, introduction of any substancedeleterious to fish or fish habitat is prohibited andsubject to prosecution.
The codification in law and the stricter enforcementof forest policies and guidelines are indicative of theresponse of Canadian forest agencies to new social,economic and environmental imperatives. Governmentagencies across Canada have adopted the consultativeapproach to developing forest policy, routinely seekingpublic opinion and working closely with forestindustries, Aboriginal groups and environmentalorganizations to incorporate recreational, social,wildlife and economic values into forest managementplanning and decision making.
New legislation based on the principles of sustain-ability has already been passed by three provinces:British Columbia (1994 Forest Practices Code of BritishColumbia Act); Ontario (1994 Crown ForestSustainability Act); and Saskatchewan (1996 ForestResources Management Act). In 1996, the Province ofQuebec amended its Forest Act to reflect the samecommitment. Currently, in Manitoba, permission isbeing sought to update the Forest Act. Table 4.4boutlines recent provincial and territorial forestlegislation that reflects the principles and objectives ofsustainable forest management.
GLO
BA
L EC
OLO
GIC
AL
CY
CLE
S•
Fore
st S
ecto
r Po
licy
Fact
ors
61
FOREST TENURES IN CANADALong-term area-based tenures, which account for the majority of timber harvesting agreements, allowintegrated forest companies to harvest an annual allowable cut (Indicator 5.1.1) within a defined area ofsufficient size to supply a wood processing facility.Agreements are usually for 20 to 25 years and can berenewed every 5 years provided the terms have been satisfied. The company is responsible for mostaspects of forest management and must follow prescribed standards for harvesting (road construction,fire and pest management), regeneration (silviculture) and non-timber forest values (wildlife and habitatprotection, Aboriginal hunting grounds and burial sites, unique ecological and cultural sites). Thecompany’s plans and field operations are monitored for compliance generally by provincial forest services.
Volume-based tenure agreements, usually for 10 to 15 years, provide rights for a given volume of timberthat may be cut in various places within a forest management unit. Management responsibilities aregenerally less demanding than for long-term tenures.The government is often responsible for calculatingallowable cut and forest renewal. Detailed regulations governing harvesting, regeneration and themaintenance of non-timber values are monitored for compliance.
Short-term tenures are generally for periods of less than five years and are not renewable. Thesetenures are held by small companies or private individuals to harvest various types of timber for purposessuch as fuelwood or Christmas tree operations.There are usually no management responsibilities.Theprovincial government monitors harvesting practices to ensure compliance with regulations.

GLO
BA
L EC
OLO
GIC
AL
CY
CLE
S•
Fore
st S
ecto
r Po
licy
Fact
ors
62
TABLE 4.4b Recent forest legislation supporting sustainable forest management
Province/Territory Year Act Description of Act
Alberta 1999 Water Act, Supports and promotes the conservation and S.A. 1999, c.W-3.5 management of water.
1999 Regulated Forestry Enhances the quality of forest services in the Profession Act, province, by improving the regulation of forestry S.A. 1999, c.R-12.6 professionals.
British Columbia 1997 The Ministry of Forests Act, Establishes a Forest Service to ensure integrated R.S.B.C. 1996, c.300 use of forest and range resources.Consolidated to April 21, 1997
1997 British Columbia Forest Redistributes a portion of stumpage revenues on a Renewal Act, regionally equitable basis for forest improvement R.S.B.C. 1996, c.160 purposes.Consolidated to December 18, 1997
1998 Forest Practices Code of Enshrines principles of sustainable use of the forests;British Columbia Act, sets out principles and objectives for the use and R.S.B.C. 1996, c.159 management of provincial forests and wilderness Consolidated to areas; establishes operational planning requirements;December 18, 1998 and codifies a variety of forest practices and
standards.
1998 Forest Land Reserve Act, Aims at protecting the productive forest land base R.S.B.C. 1996, c.158 by creating a forest land reserve and restricting the Consolidated to uses of that land.September 23, 1998
1998 Forest Act, Provides for disposition of timber on public land by R.S.B.C. 1996, c.157 the government under tenure agreements.The Act Consolidated September requires inventory of forests and assessment of their 23, 1998 ability to grow trees and supply wildlife, recreation
and forage for livestock.The Act accommodates forest uses, such as the manufacture of timber, and contains provisions for administering the harvest.
Manitoba 1990 The Forest Act, Departmental request presented to legislative C.C.S.M. 1965, c.F150 committee (1999) to develop a new and updated
Forest Act and associated regulations. Provincial Forest Practice Committee established to determine minimum provincial operating standards.
New Brunswick 1982 Crown Lands and Provides for the development, utilization,Forests Act, protection and integrated management of the S.N.B. 1980, c.C-38 resources of Crown lands, including access to and
travel on those lands; harvest and renewal of timber resources; habitat for the maintenance of fish and wildlife populations; and forest recreation and rehabilitation.
1998 Conservation Easements Act, Provides for the granting of conservation easements S.N.B. 1998, c.16 for: the conservation of ecologically sensitive land; the
protection, enhancement or restoration of natural ecosystems; the protection or restoration of wildlife habitat or wildlife; the conservation of habitat of rare or endangered plant or animal species; the conser-vation or protection of soil, air, land or water; the conservation of significant biological, morphological,geological or palaeontological features; the conser-vation of culturally, archaeologically or scenically important places; and the protection or use of land for recreational or public education purposes.

GLO
BA
L EC
OLO
GIC
AL
CY
CLE
S•
Fore
st S
ecto
r Po
licy
Fact
ors
63
Newfoundland and 1990 The Forestry Act, Establishes a Forest Service. Requires preparation of Labrador S.N. 1990, c. 58. a timber resource analysis and forest management
strategy and the management of forest management districts in accordance with the principles of sustained yield management. Requires licensees to enter into Forest Management Agreements and prepare a forest management plan.The Act also provides for timber sale agreements and cutting permits, mill licences, forest protection, forest roadsand timber scaling.
1990 Revised Twenty-Year Reflects the comprehensive assessment of the Forestry Development Plan, province’s timber resource completed in 1989 andR.S.N. (1990-2010) includes a detailed analysis of the sustainable timber
supply in relation to the demand. Significant to this plan is the treatment of forest ecosystem management and the need to shift from a single-resource management regime to one that considers all values.
1996 Revised Twenty-Year Addresses more specifically the stages for the Forestry Development Plan, strategic development and protection of natural R.S.N. (1996-2015). ecosystems by ensuring that management activities
are carried out in a sustainable manner through adaptive management.
Northwest 1988 Forest Management Act, Provides control, management and administration Territories R.S.N.W.T. 1988, c. F-9 with respect to research, harvest and management of
forests.
1988 Forest Protection Act, Provides control, management and administration R.S.N.W.T. 1988, c.F-10 with respect to forest fire control.
1990 Forest Management Provide control, management and administration with Regulations respect to research, harvest and management of R.R.N.W.T. 1990, c.F-14 forests.
Nova Scotia 1998 Wilderness Areas Designates and allows for protection of 31 new areasProtection Act, of public land as representative examples of distinct S.N.S.1998, c.11 natural landscapes and ecosystems in Nova Scotia.
Requires public consultation in the preparation of a management plan for each area.
1998 Regulations under the Require that certain buyers and exporters of wood Forests Act, submit statistical returns concerning the origin and S.N.S. 1986, C.10 uses of all wood acquired.
1998 Amendments to the Enable agreements with buyers of forest products for Forests Act, more effective management of forest lands; ensure S.N.S. 1986, c.10 that the principle of sustainable forest management
forms the basis of all forest management programs in the province; introduce mandatory standards to protect wildlife habitats, watercourses, wetlands and other significant resources in both private and public lands; require a person carrying out industrial forest harvesting operations on privately owned lands to provide certain information; regulate wood acquisition; establish a Sustainable Forestry Fund;permit conservation officers to inspect forestry or harvest operations and to issue certain Orders; and expand the enforcement powers of the Department.
Ontario 1994 Crown Forest Replaces the Crown Timber Act. Provides for the Sustainability Act, sustainability of public forests in accordance with S.O. 1994, c.25 the objective to manage the forests to meet the
social, economic, and environmental needs of present and future generations. Sustainability includes the conservation of large, healthy and diverse forests and the maintenance of forest health through practices which emulate natural activities

GLO
BA
L EC
OLO
GIC
AL
CY
CLE
S•
Fore
st S
ecto
r Po
licy
Fact
ors
64
and avoid adverse effects.The Act provides for agreements with First Nations regarding sharing of some Ministerial authority and planning and requires the establishment of local citizens’ committees to advise on management plans. Provides for the establishment of a Forest Renewal Trust fund and a Forestry Futures Trust fund.
1998 Forestry Act, Under Bill 25, the Red Tape Reduction Act became R.R.O. 1990, Reg.458 law. It consolidates all of the following into the
Forestry Act:Trees Act, Forest Tree Pest Control Act, and Woodlands Improvement Act.
Prince Edward Island 1988 Forest Management Act, Requires the preparation of a Forest Policy for public S.P.E.I. 1988, c.27 review and a state of the forest report every ten
years. Includes provisions for management plans for public and private lands.
Quebec 1996 Amendments to the Forest Specify the criteria for sustainable forest Act, S.Q. 1986, c.108 management and create a fund for R&D, plantations
and forest inventories from industry fees.
Saskatchewan 1999 Forest Resources Address conservation, management and Management development. Introduce a new tenure system.Act and Regulations, S.S Require state of the forest reports, the
establishment of a Provincial Forest Policy Advisory Committee as well as local forest management committees, and the preparation of integrated forest land use plans for each management unit. Provide a legal framework for public participation in planning processes and in the development of specific standards and guidelines appropriate to the maintenance of the different forest ecosystem sites.
Yukon 1950 Territorial Lands Act Provides for the federal government to make regulations for managing the harvesting of timber in the Yukon. Major revisions to the Yukon timber regulations are pending OIC approval in 2000.

ELEMENT OVERVIEW
Fresh water is vitally important to all terrestrial plants,animals and microorganisms. Hydrological cycles are acritical component of the functioning of the Earth’sbiosphere. They involve the movement of water: fromthe atmosphere to the Earth’s surface in the form ofprecipitation; from soils to streams to lakes to theocean; and from the soil to plants to the atmosphere inthe form of evapotranspiration. Because of their vastarea, Canada’s forests play a major role in globalhydrological cycles.
The storage of water in the lakes and open waterbodies that occupy almost 80 million hectares ofCanada’s surface area, and represent about 15% of thetotal forest area, comprises an important part of thehydrological cycle. Over half of this water area iscontained within the Boreal Shield and Taiga Shieldecozones, which cover more than half of Canada'sforest area. Canada’s lakes and rivers are believed torepresent one quarter of the world’s freshwater supply.
Changes in forest land cover and managementinfluence the storage and movement of water and thetiming of the various components of the hydrologicalcycle. In addition to regulating the water flow intostreams and the atmosphere, forests also clean and filterthe water.
The forest can regulate the flow of water into lakesand wetlands directly or by influencing stream and riverflows. Consequently, sustainable forest managementplays a crucial role in contributing to the regulation ofthe hydrological cycle. Management practices can havea significant impact on water storage and themagnitude and timing of run-off in forest areas. This inturn has implications for stream bank erosion, siltationand water quality. All of these have effects on wildlifeand aquatic life as well as implications for industry,recreation and tourism, power generation, anddrinking water supply.
INDICATOR REPORT
SURFACE AREA OF WATER WITHINFORESTED AREAS
Canada's Forest Inventory 1994 (Loweet al. 1996) provides data on thesurface area of Canada covered bywater for the treed area of thecountry only, and does not includethe Prairie agricultural zone inSaskatchewan and Alberta, nor theareas north of the tree line in theNorthwest Territories, Manitoba,Ontario, Quebec and Labrador. Theinventory data are collected at a scale of1:10 000 and 1:20 000, allowing for theinclusion of water bodies of 0.01 to 0.02hectare in size. The current report outlinesthe estimated surface area of water in thevarious forested ecozones of Canada based oninformation from Canada's Forest Inventory.
Table 4.5a shows the area of fresh water as comparedwith total area of Canada’s ecozones. Almost 8% of thetotal land area, or some 78.7 million hectares, areoccupied by open freshwater surfaces. The combinedBoreal (Plains, Shield and Cordillera) and Taiga (Plains,Shield and Cordillera) ecozones receive twice as muchprecipitation as they lose through evapotranspirationannually, and contain approximately 83% of the totalsurface fresh water in Canada.
Efforts are ongoing to determine the role andinfluence of forest land cover and management on thehydrological cycle. In western Canada, work isunderway on four components of the hydrological cyclethat would enhance future reports on this indicator:precipitation received; evapotranspiration (the release ofwater by the forest to the atmosphere); snowmelt (howthe forest and forest characteristics affect the magnitudeand timing of run-off in the spring); and total basinrun-off (how forest characteristics and cover affect theannual quantity or yield of water).
4.5.1
ELEMENT 4.5CONTRIBUTIONS TOHYDROLOGICAL CYCLES
GLO
BA
L EC
OLO
GIC
AL
CY
CLE
S•
Con
trib
utio
n to
Hyd
rolo
gica
l Cyc
les
65
Global CarbonBudget
Forest LandConversion
Carbon DioxideConservation
PolicyFactors
HydrologicalCycles
GLOBALECOLOGICAL
CYCLES
4.5.1

GLO
BA
L EC
OLO
GIC
AL
CY
CLE
S•
Con
trib
utio
n to
Hyd
rolo
gica
l Cyc
les
66
References
Alberta Department of Environment. 1999. Albertagreen area map. [online]. http://www.gov.ab.ca/env/forests/fmd/timber/map1.html Accessed February2000.
Alberta Department of Environment. 1990-1997.Land Status Automation System. Conversion offorest land.
Apps, M.J.; Kurz, W.A.; Beukema, S.J.; Bhatti, J.S.1999. Carbon budget of the Canadian forest productsector. Environmental Science and Policy 2: 25-41.
Canadian Committee on Ecological LandClassification—Ecoregions Working Group. 1989.Ecoclimatic regions of Canada: First approximation.Ecological Land Classifications Series, No. 23.Environment Canada—Canadian Wildlife Service.Ottawa, ON. 118 p.
Canadian Council of Forest Ministers. 1997.Criteria and indicators of sustainable forestmanagement: Technical report. Natural ResourcesCanada. Ottawa, ON. 137 p.
Canadian Council of Forest Ministers. 1998.National forest strategy 1998-2003, sustainableforests: A Canadian commitment. Natural ResourcesCanada. Ottawa, ON. 47 p.
Global Forest Watch. 2000. Canada’s forests at acrossroads: An assessment in the year 2000. WorldResources Institute. Washington, DC. 114 p.
Intergovernmental Panel on Climate Change.1997.Revised 1996 IPCC guidelines for nationalgreenhouse gas inventories. Greenhouse GasInventory Reporting Instructions, Vol. 1IPCC/OECD/IEA 1997. IPCC nWG1 TechnicalSupport Unit. Bracknell, UK.
Kurz, W.A.; Apps, M.J. 1999. A 70-yearretrospective analysis of carbon fluxes in theCanadian forest sector. Ecological Applications92(2): 526-541.
Kurz W.A.; Apps, M.J.; Webb, T.M.; McNamee, P.J.1992. The carbon budget of the Canadian forestsector: Phase 1. Information report NOR-X-326.Natural Resources Canada—Canadian Forest Service-Northern Forestry Centre. Edmonton, AB. 93 p.
TABLE 4.5a Surface area of fresh water by ecozoneECOZONE TOTAL AREA FRESH WATER* %
(million ha) (million ha)
Arctic Cordillera 25.06 0.07 0.28
Northern Arctic 151.06 N/A** N/A
Southern Arctic 83.24 1.23 1.48
Taiga Plains 64.70 5.46 8.44
Taiga Sheild 136.64 20.62 15.09
Boreal Shield 194.64 29.38 15.09
Atlantic Maritime 20.38 2.53 12.41
Mixedwood Plains 19.44 6.27 32.25
Boreal Plains 73.78 8.65 11.72
Prairie 47.81 0.84 1.76
Taiga Cordillera 26.48 0.23 0.87
Boreal Cordillera 46.46 0.97 2.09
Pacific Maritime 21.90 0.40 1.83
Montane Cordillera 49.21 1.49 3.03
Hudson Plains 36.24 0.68 1.88
Canada 997.04 78.70 7.89
*The surface area of the Great Lakes is not included.**N/A: Information not available.
Sources: Natural Resources Canada—Canadian Forest Service 1998, Lowe et al. 1996

Leckie, D.G.; Gillis, M.D. 1995. Forest inventoryin Canada with emphasis on map production.Forestry Chronicle 71(1): 74-88.
Lowe, J.J.; Power, K.; Gray, S.L. 1996. Canada'sforest inventory 1991: 1994 version. An addendumto Canada’s Forest Inventory 1991. Informationreport BC-X-362E. Natural Resources Canada—Canadian Forest Service—Pacific Forestry Centre.Victoria, BC. 23 p.
Luckert, M.L.; Salkie, F.J. 1998. Forestry in Canada:Transition and emerging policy issues. CanadianPublic Policy Vol. XXIV, Supplement 2: 1-10.
Natural Resources Canada—Canadian ForestService. 1998. Selected forestry statistics Canada1997. (Internal document). Natural ResourcesCanada. Ottawa, ON.
Prince Edward Island Department of Agricultureand Forestry. 1998. Prince Edward Island forestinventory update: Summary, April 1998. SilvicultureDevelopment Division.
Ross, M. 1995. Forest Management in Canada.Canadian Institute of Resources Law. University ofCalgary. Calgary, AB. 383 p.
United Nations Framework Convention onClimate Change. 1997. Kyoto Protocol to the UnitedNations Framework Convention on Climate Change.Document FCCC/CP (1997.7/Add.). [online].http://www.unfcc.de Accessed February 2000.
GLO
BA
L EC
OLO
GIC
AL
CY
CLE
S•
Con
trib
utio
n to
Hyd
rolo
gica
l Cyc
les
67

5.1 Productive Capacity
5.1.1
5.1.2
5.1.3
5.1.4
5.1.5
5.2 Competitiveness of Resource Industries
5.2.1
5.2.2
5.2.3
6.5.2
5.3 Contribution to the National Economy
5.3.1
5.3.2
5.4 Non-timber Values
5.4.1
5.4.2
MULTIPLE BENEFITS TO SOCIETY
CRITERION 5
Annual removal of forest products relative to the volume of removals determined to be sustainable
Distribution of, and changes in, the land base available for timber production
Animal population trends for selected species of economic importance
Availability of habitat for selected wildlife species of economic importance
Management and development expenditures
Net profitability
Trends in global market share
Trends in research and development expenditures in forest products andprocessing technologies
Investments in forest-based research and development and information
Contribution to gross domestic product (GDP) of timber and non-timbersectors of the forest economy
Total employment in all forest-related sectors
Availability and use of recreational opportunities
Total expenditures by individuals on activities related to non-timber use
INTRODUCTION

ELEMENT OVERVIEW
Productive capacity is the ability of the forest land baseto provide a flow of benefits to society. This abilityapplies to both timber and non-timber resources. Theproductive capacity of resources must be conservedeven as the flow of benefits is maintained. Productivecapacity for timber is a reflection of annual averagegrowth (Indicator 2.3.1) and the forest land availablefor timber harvesting (Indicator 5.1.2).
In addition to timber for wood products and fuel,forests provide habitat for an array of flora and fauna
that are subsequently harvested and used by humans(Indicators 5.1.1 and 5.1.3, 5.1.5). These products maybe food (mushrooms, berries, herbs and edible plants,fish and game), clothing (animal pelts) or botanicalmedicines and craft materials. The supply of forestproducts is influenced by various factors, includingdisturbances such as forest fires, insect defoliation,disease, harvesting, climate change, over-consumptionand unregulated or illegal use. The supply andproduction of timber and non-timber products areinterrelated. For example, timber harvesting andrenewal practices can affect the amount and distri-bution of various elements of moose habitat, includingwinter cover, travel corridors and calving and feedingareas. The design and implementation of thesemanagement practices can have positive or negativeeffects on moose habitat and resulting population
ELEMENT 5.1PRODUCTIVE CAPACITY
MU
LTIP
LE B
ENEF
ITS
OF
FOR
EST
S TO
SO
CIE
TY
•Pr
oduc
tive
Cap
acity
69
INTRODUCTION
Forests provide a multitude of benefits to society, including commercial wood
products, commercial and non-market goods and services, environmental functions
and preservation values. Sustainable development requires that Canada's forests
maintain their ability to provide this array of benefits for future generations. Criterion 5
examines the economic value of a range of goods and services provided by forests and,
where possible, measures the feasibility of their sustained production.
Element 5.1 (Productive Capacity) focuses on the capacity of the forest to support a flow
of timber and non-timber benefits now and in the future by comparing annual rates of
removal with quantities determined to be sustainable.
To ensure a continual flow of economic benefits to Canadians, a fair and competitive
investment climate must be maintained within the forest sector. Element 5.2
(Competitiveness of Resource Industries) considers the ability of forest industries to maintain
or expand the flow of economic benefits.
In addition to maximizing economic development, sustainability addresses the distribution of
wealth. The forest generates wealth which flows to Canadians through the market economy,
quantified in Element 5.3 (Contribution to the National Economy), and through a subsistence economy
which involves in-kind income.
A wide range of non-timber values is associated with forests, including recreation, tourism, and existence and
option values. Element 5.4 (Non-timber Values) considers the importance Canadians place on these non-timber
goods and services and determines their availability.
ProductiveCapacity
Competitiveness
Contributionto Economy
Non-timberValues
MULTIPLEBENEFITS
5.1.1
5.1.2
5.1.3
5.1.4
5.1.5
MULTIPLE BENEFITS OF FORESTSTO SOCIETY

levels. To implement sustainable forest managementpractices, an in-depth understanding of the relationshipbetween timber and non-timber resources is required.
The sustainability of the economic benefits fromforests can be measured by comparing the annualharvested volumes with the permitted rate of harvest setby the appropriate regulatory agency. In the case oftimber, the annual rate at which harvesting is permittedto occur on provincial or territorial public land isknown as the annual allowable cut (AAC). An AAC isdetermined by the provincial forestry service for eachforest management unit over which it exerts regulatorycontrol. A national AAC can be estimated by addingthe harvest potential of federal and private lands tototal provincial and territorial AACs.
Methods for determining AAC are complex and varysignificantly across Canada. Estimates are based on theextent of the forest land base, the growth rate of trees,losses due to fire, insects and diseases, accessibility,economic and environmental considerations,silvicultural investment, degree of protection andmanagement objectives.
Between 1970 and 1997, the total harvest was consis-tently below the estimated national AAC. Both thehardwood and softwood harvests are increasing, butwhile the hardwood harvest remains well below theAAC, some areas have experienced softwood shortages.
Determining sustainable harvest levels for non-timber products is more problematic. There has beenconsiderable progress in managing populations offorest-dependent species of economic importance inCanada (Indicator 5.1.3). This is demonstrated by therecovery of species such as beaver, fisher and elk fromhistoric low numbers in the 20th century. Theserecoveries largely reflect the success of resourcemanagement agencies in regulating hunting andtrapping. An additional factor, which is becomingincreasingly important, is the combination of scientificknowledge of species habitat with landscape approachesto timber management and geographic informationsystems (GIS). This technique allows species habitat tobe monitored, modelled and mapped through time.Some provinces can now provide detailed informationon habitat availability for particular species. Theconservation status, geographical distribution,
abundance, population trends and factors affecting theabundance of selected Canadian mammals of economicimportance are discussed in this element.
The productive capacity of the forest for importantgame and fur-bearing species is more difficult tomeasure, and only limited information is available ontheir population and harvest levels. Information on thenumber and economic value of species harvested forpelts, as well as on the harvesting of game species andthe revenue generated through the sale of licences, isdescribed. National data that measure the value ofother non-timber resources extracted from the forest,such as those used in food, clothing or botanicals, arenot available.
The nature of ownership influences how forestresources will be used and managed. Ninety-fourpercent of Canada’s forest land is under publicownership. Canadians’ increasing demands to conserveforests for non-timber uses are reducing the availabilityof public forest land for timber production (Indicator5.1.2). Governments have set aside large tracts ofmanaged productive forest land for protection as parksor reserves. As well, policies and guidelines have beenestablished to regulate and control timber harvesting,and to ensure that other values are conserved. Forexample, logging is prohibited or restricted on bufferstrips along waterways and on steep slopes. In manyregions, forest cover must also be maintained for scenicvalue and wildlife habitat. The combined effect of thesepolicies has been, and will continue to be, some localreductions in the area of public forest land available formanaged timber production.
Effective forest management requires a sustained andadequate source of funding. Expenditures on forestmanagement and development (Indicator 5.1.4)represent investments with the potential to maintainand increase the productive capacity of the land baseand improve its economic accessibility. Expendituresare incurred in a number of areas, includingsilviculture, resource access, protection and generalstewardship. The recent decrease in expenditures mayin part be explained by lower fire protection costs andby silvicultural practices that emphasize naturalregeneration of harvested areas as part of an ecosystem-based management regime.
MU
LTIP
LE B
ENEF
ITS
OF
FOR
EST
S TO
SO
CIE
TY
•Pr
oduc
tive
Cap
acity
70

INDICATOR REPORTS
ANNUAL REMOVAL OF FORESTPRODUCTS RELATIVE TO THEVOLUME OF REMOVALS DETER-MINED TO BE SUSTAINABLE
The level of harvest set by the provinces and territoriesfor a defined time period is called the annual allowablecut (AAC). The AAC figures for Newfoundland andLabrador, Prince Edward Island, Nova Scotia, NewBrunswick, Quebec and Manitoba include data fromfederal, provincial and private lands. A national AAC isestimated by adding the harvest potential of federal andprivate lands to total provincial and territorial AACs.
Canada’s AAC has remained relatively stable over thepast 27 years (Figure 5.1a). Fluctuations in the nationalAAC are mainly the result of changes in the provincialor territorial AACs rather than in federal or privateharvest potential. A number of factors may influencethe decision to reduce or increase the AAC for aparticular area. For example, AACs may decline inresponse to a regulatory requirement for a reduction inthe size of clearcuts or enlarged buffer strips, or in orderto accommodate other land-use requirements such asprotected areas, wildlife habitat and Aboriginal landclaims. AACs may increase as a result of improvedinventory information (e.g., growth and yield data),utilization (e.g., total tree utilization, sawmill yields) oras a result of silvicultural practices or social values.
Between 1970 and 1997, the total harvest wasconsistently below the national AAC (183 million cubicmetres versus 236 million cubic metres in 1997). Thesoftwood harvest has been increasing since 1970. Whileit is still below the national AAC, some local shortageshave been reported, suggesting that the limits ofsustainability may have been reached in those areas. Thehardwood harvest has also shown a steady upward trendsince the mid-1980s, but remains well below thenational AAC.
DISTRIBUTION OF, ANDCHANGES IN, THE LAND BASEAVAILABLE FOR TIMBER PRODUCTION
Canada’s forest land is primarily under public ownership(provincial 71%, federal and territorial 23%). Fifty-ninepercent of the more than 400 million hectares of forestland in Canada is considered to be capable of producingmerchantable stands of timber within a reasonablelength of time. Approximately half of this area iscurrently managed for timber production (Figure 5.1b).Approximately 1 million hectares are harvested annually(0.4% of Canada’s productive forest).
A number of factors affect the land base available fortimber production (Natural Resources Canada—Canadian Forest Service 1994). Policy changes mayresult in a withdrawal of forested areas for other uses,such as park land, while still maintaining the forestcover. Changes in economic factors, including productprices, advances in harvesting technology, and newhighway construction, can influence whether it iseconomical to harvest a given area, and thus whetherthat area is part of the forest land base for the purposeof determining the allowable cut. Forest land may alsobe converted to non-forest land uses such as agricultureor urbanization, or may become unproductive due tocatastrophic events such as landslides. These changesare discussed in the combined report on Indicators3.1.2, 4.2.1, and 4.2.2.
5.1.2
300
'70
Sources: Natural Resources Canada—Canadian Forest Service1998, Canadian Council of Forest Ministers 1998
'72 '74 '76 '78 '80 '82 '84 '86 '88 '90 '92 '94 '96 '98
250
200
150
100
50
0
Mill
ion
m3
Year
Total AAC
Total harvestSoftwood AAC
Softwood harvestHardwood AACHardwood harvest
FIGURE 5.1a Annual allowable cuts and harvests
5.1.1
MU
LTIP
LE B
ENEF
ITS
OF
FOR
EST
S TO
SO
CIE
TY
•Pr
oduc
tive
Cap
acity
71

The provincial and territorial governments, owningand managing most of the timber productive forestland in Canada, have enacted a range of policies andregulations to restrict the sale of public forest land andits conversion to other uses. For example, Manitobadoes not permit the sale of its designated public forestland except for agricultural purposes. In BritishColumbia, the 1994 Forest Land Reserve Act restricts theremoval of designated land from forest production.Alberta’s Green Area Policy (in effect since 1948) statesthat public forest land will be managed primarily forforest production, watershed protection, recreation andother multiple uses. In Saskatchewan, disposal ofpublic land requires an amendment to the Forest Act,while in Ontario, the Public Lands Act enables theMinistry of Natural Resources to regulate and controlthe sale of public land.
An important factor affecting the availability of publicforest land for timber production is the increasingdemand for non-timber uses. Large areas are being setaside and protected for parks, wilderness areas andreserves. For example, since 1990, close to 400 000hectares formerly available for timber production havebeen placed under protected status in Alberta, increasingprotected forest area in that province to over 1 millionhectares. As of 1999, protected land in Manitobareached 5.4 million hectares, or 8.3% of the province’sarea. Under Ontario’s Forest Accord, which is anagreement among representatives of the forest industry,environmental groups and the Ontario Ministry ofNatural Resources, a total of 378 new parks andprotected areas are to be established. This will enlargeOntario’s protected area system by 2.4 million hectares,
and bring the province’s total protected forest area, inIUCN categories I to VI, to 5.1 million hectares.
ANIMAL POPULATION TRENDSFOR SELECTED SPECIES OFECONOMIC IMPORTANCE
AVAILABILITY OF HABITAT FORSELECTED WILDLIFE SPECIESOF ECONOMIC IMPORTANCE
Indicators 5.1.3 and 5.1.5 are reported together.Indicator 1.2.3 provided trends for selected animalspecies by province/territory. Some of those species(grizzly bear, woodland caribou, cougar) are consideredto be of minor economic importance, and are notdiscussed here. Economically important mammalspecies are placed in two general categories—those thatare primarily trapped for pelts, and those that arehunted for meat—with some overlap between the two.
The discussion that follows on population trends andestimated annual harvests is based on a recent studythat evaluated the conservation status, geographicaldistribution, abundance, population trends and factorsaffecting the abundance of 20 selected animal speciesinhabiting Canada’s forests (Alvo 1998).
Statistics Canada collects data on national sales ofanimal pelts by species. The economic value andnumber of pelts harvested for some of the species in theAlvo (1998) study are presented in Table 5.1a. Totalvalue of pelts from beaver, bear, coyote, fisher, gray wolf,lynx, marten and red squirrel exceeded $20 million in1997-1998. Table 5.1b provides information on theannual harvest of selected game species and the revenuegenerated by the sale of hunting licences. Thisinformation was supplied by Newfoundland andLabrador, Nova Scotia, New Brunswick, Quebec andOntario. The revenue collected from the sale ofcombined hunting licences for moose, deer, bear andsmall game amounted to more than $32 millionannually in the period 1993 to 1998.
Beavers were a mainstay of the fur trade for severalcenturies, and by 1900 were extirpated or vastlyreduced over much of their global range. Since then,management programs have resulted in dramaticrecoveries, and the annual harvest in North America is
5.1.5
5.1.3
Source: Natural Resources Canada—Canadian Forest Service 1999
FIGURE 5.1b Canada's Forests (percent)
Managed ReservedUnmanagedTimber productive forest landNon-productive forest land
41 59
27 29
3
MU
LTIP
LE B
ENEF
ITS
OF
FOR
EST
S TO
SO
CIE
TY
•Pr
oduc
tive
Cap
acity
72

now at an all-time high. Harvest levels are highlysensitive to price fluctuations because skinning beaversis labour-intensive and trappers will switch to otherspecies (or other occupations) when prices fall.
The number of black bears harvested yearly isestimated to be 6% of the total population of approxi-mately 400 000. The highest harvest level reported wasin New Brunswick (11%). Black bear populations arestable in western Canada and stable to increasing ineastern Canada, and neither poaching nor hunting isperceived to be a major threat at this time. The blackbear has been listed in Appendix III of the Conventionon International Trade in Endangered Species of WildFauna and Flora (CITES) (http://www.wcmc.org.uk/CITES/eng/index.shtml), mostly in an effort to reduceillegal trade in the gall bladders of related bear speciesthat are globally at risk. This means that only bearskinscan be legally exported from or imported to Canada.
The coyote, which is more commonly associatedwith grasslands than with forests, increased its rangeand numbers in eastern Canada during the 1900s andhas become an important predator of white-tailed deer.Coyote populations are also on the rise in westernCanada. Approximately 25 000 to 35 000 coyote aretrapped annually in Alberta out of a total population of150 000. In Saskatchewan, an estimated 15 000individuals are taken out of a total population ofroughly 140 000. In 1998, 50 249 coyote pelts wereharvested in Canada, representing a value of$1 525 973.
Although the fisher originally inhabited the forestsof Canada and the northern United States andextended south into the Appalachian, Sierra Nevadaand Rocky mountains, it was extirpated from much ofits historical range during the early 1900s. In additionto having a highly valuable pelt, fishers are easy to baitand trap. Concern that the species might not survive inthe wild led to closed trapping seasons, reintroductionprograms and habitat recovery efforts. A 1998 studyestimated the Canadian fisher population at 66 500individuals, compared with an estimated low of10 000 in the 1930s.
Gray wolf populations in Canada have been stable forat least ten years. Although the wolf has been extirpatedfrom southern and eastern areas, it still occupies 85%of its original range in Canada. In the late 1970s, 5 000to 7 000 wolf pelts were harvested annually, but this fell
to about 4 000 by 1984. Assuming that harvestingremains at this level, it represents less than 10% of theCanadian wolf population, and overall populations aremore likely to be affected by trends in key prey speciessuch as caribou. “Control hunting” to limit predationon livestock continues to reduce wolf populations inthe southern portion of its range and may not beincluded in harvest statistics.
The lynx is highly dependent on the snowshoe harefor food, and the two species are locked in a predator-prey cycle. The overall population of lynx appears to bestable; however, careful regulation of trapping duringlow periods in the cycle is necessary (in order tocounteract the trend of rising prices related to periodicscarcity). In 1997-1998, 6 840 lynx pelts wereharvested, representing a value of $574 697.
The American marten has consistently been amongthe most valuable fur-bearing mammals since thebeginning of the North American fur trade. Itcommands a high price, is easily trapped and pelted, andthe pelts are easy to transport. Although the populationappears to be stable, loss of mature forest habitat as aresult of logging is a concern throughout Canada. Asnoted in Indicator 1.2.2, the Newfoundland populationof martens is endangered and is the subject of intensiveresearch and recovery efforts.
Although red squirrels are not highly valued bytrappers and fur markets, they are harvested for bothpelts and meat. The annual harvest varies widely inresponse to fur prices. In 1998, 146 075 squirrel peltswere harvested representing a value of $179 876.
About 4 000 elk are harvested each year by licensedhunters, and an unrecorded additional number by FirstNations. Management of hunting pressure is importantfor this species. By the early 1900s, the elk populationhad declined to about 1% of its historic NorthAmerican population level of 10 million, but has sincerebounded to almost 1 million individuals (90% ofwhich are found in the US). With hunting regulationsin place, the main factor limiting elk populations inCanada is loss of habitat to agriculture. Forest practiceshave less impact on this species.
Moose are avidly sought by hunters, but populationsof this species are also highly affected by severe winterswith deep snow, predation by bears and wolves,collisions with vehicles, disease where their rangeoverlaps with white tailed deer, and forestry practices.
MU
LTIP
LE B
ENEF
ITS
OF
FOR
EST
S TO
SO
CIE
TY
•Pr
oduc
tive
Cap
acity
73

A 1998 estimate of 960 000 moose in Canada consid-erably exceeds the 1970s estimate of 500 000, but it isnot known whether this reflects a population increaseor better reporting. In Quebec, moose populations arethought to have been as low as 12 000 in the early1950s, but regulatory measures allowed a gradualincrease to about 70 000 individuals in 1998. Annualharvest levels have also risen in that province from7 000 in 1972 to 11 000 in 1996.
There are nearly 1.5 million white-tailed deer inCanada, and their numbers appear to be increasing.Timber harvesting, agricultural development, and mildwinters have allowed this species to expand its rangenorthward, and its popularity with hunters has ledresource agencies to carefully manage hunting quotasand to identify and protect deer yards (winter cover) intimber management plans. National harvest figures arenot available, but the 1996 harvest level in Quebec wasestimated at 38 000, compared with a total populationof 300 000. If numbers are not controlled, browsing bywhite-tailed deer can pose a serious challenge for forestmanagement. As many as 150 000 deer live onAnticosti Island (Quebec) alone. The species wasintroduced there and has caused dramatic reductions innatural regeneration of forest cover since it has nonatural predators and is only lightly hunted.
The Canadian population of mule deer is estimatedat just under 500 000 animals, most of which(345 000) live in British Columbia, where threesubspecies occur. The mule subspecies is the mostwidely distributed throughout the interior of theprovince. The Columbian black tail, or coastsubspecies, is found on Vancouver Island, and theSitka subspecies occurs on the northern coastal islands.Mule deer populations are declining in BritishColumbia and in Manitoba, where they have beendisplaced by white-tailed deer. The species isexpanding northward into the Yukon in response towarmer winters. Unlike white-tailed deer, mule deerdo not respond positively to urban and agriculturaldevelopment, and are more vulnerable to huntingbecause they do not flee as far when disturbed. Becausemule deer do not tolerate deep snow, logging of winterhabitat is a problem for them, and has been associatedwith population declines on Vancouver Island.National harvest statistics are not available, but 17 000individuals were harvested in Alberta in 1989 out of atotal population of around 100 000.
The snowshoe hare is the most abundant forest-dwelling mammal hunted for meat in Canada. It is animportant small game species and source of food inrural areas. It is characterized by cyclical variations inpopulation levels, which may be as high as 50- to 100-fold. These variations are caused by its naturalpredators: red squirrels and arctic ground squirrels onjuveniles; and owls, coyotes and lynx on adults.Harvesting by humans is not a major influence onpopulation levels of this species. Wildlife experts inQuebec estimate that a harvest level of 30 to 40%would be sustainable, but only about 2 millionsnowshoe hares are taken annually in that province outof an average population of about 32 million.
TABLE 5.1a Economic value of harvested pelts for selected mammals in Canada
Mammal Pelts harvested Value ($)1997-1998
Beaver 311 135 9 942 047
Bear* 2 083 140 524
Coyote 50 249 1 525 973
Fisher 20 036 903 789
Gray wolf 2 834 358 780
Lynx 6 840 574 697
Marten 160 700 6 470 915
Red squirrel 146 075 179 876
*Includes both black and brown bear.Source: Statistics Canada 1997-1998
TABLE 5.1b Annual harvest of economically important game species and revenue collected, 1993-1998
Game Hunting Annual Revenue species licences solda, b harvesta collected ($)a
Moose 279 935 42 283 12 161 977Deer 445 287 114 183 12 662 004Bear 43 149 10 823 2 713 041Small game 381 615 435 480 5 083 760aValues are annual means.bResident and non-resident data are combined.
Sources: Ministère de l’Environnement et faune—Direction des affairesinstitutionnels 1999, Newfoundland and Labrador Department of ForestResources and Agrifoods 1998, Provincial records from Nova Scotia and
New Brunswick for various years 1993-1998, Ontario Ministry of NaturalResources 1997
MU
LTIP
LE B
ENEF
ITS
OF
FOR
EST
S TO
SO
CIE
TY
•Pr
oduc
tive
Cap
acity
74

MANAGEMENT AND DEVELOP-MENT EXPENDITURES
Figure 5.1c shows estimated total expenditures on forestmanagement by activity for the period 1990 to 1997.These expenditures represent spending by both publicagencies and the forest industry. In 1997, they totalled$2.3 billion.
Expenditures are incurred in a number of areasincluding silviculture (site preparation, planting,seeding, stand tending), resource access (roadconstruction), protection (fire, pests), and generalstewardship (inventory development, research, timbermanagement, administration, integrated resourcemanagement, public information). The costs incurred
for fire protection show the most discernable decline inrecent years, as fewer forest fires have had to besuppressed. In 1997, there were 6 002 forest fires inCanada, the lowest number on record since theNational Forestry Database started to record thisinformation in 1970 (Indicator 2.1.3). These firesresulted in the destruction of 0.6 million hectares offorest land. Silviculture-related activities are alsoexhibiting a decline as more ecosystem-basedmanagement regimes, with emphasis on naturalregeneration, are adopted. Trend data for wildlife andrecreation management, parks programs, and the costof protected areas were not collected because they areeither not available or are aggregated with generalstewardship data.
5.1.4
MU
LTIP
LE B
ENEF
ITS
OF
FOR
EST
S TO
SO
CIE
TY
•Pr
oduc
tive
Cap
acity
75
1990 1991 1992 1993 1994 1995 1996 1997
3.0
2.5
2.0
1.5
1.0
0.5
0
Year
Bill
ion
dolla
rs
Silviculture
Protection
Resource Access
Other forest management
FIGURE 5.1c Forest management expenditures
Source: Canadian Council of Forest Ministers 1998

MU
LTIP
LE B
ENEF
ITS
OF
FOR
EST
S TO
SO
CIE
TY
•Pr
oduc
tive
Cap
acity
76

ELEMENT OVERVIEW
The competitiveness of an industry reflects its ability toefficiently combine inputs (labour, capital, rawmaterials) to produce and sell goods and services. Afirm’s competitiveness is affected by its productiveefficiency as well as factors such as institutional, social,cultural, and regulatory policies. For example, tax laws,trade policies, social policies (labour force training,education, health, etc.) and environmental regulationsall have an impact on an industry’s competitiveness andoverall performance.
Sustainable development recognizes the direct linkbetween the environment and the economy. The abilityof forest industries to provide jobs and incomes and paycorporate taxes to governments depends on their abilityto earn profits, attract new investment, and accessforeign markets. In addition, the relative efficiency andcompetitiveness of firms affects their ability to absorbthe higher costs that may be associated with moreenvironmentally sensitive resource development andindustrial production.
Monitoring and measuring the profitability of theforest products sector (Indicator 5.2.1) is one means ofassessing structural changes that may be occurring.Canadian firms must compete with foreign firms inexport markets. For example, Canada currentlyaccounts for 50% of the global trade in softwoodlumber. The arrival of new producers of low-costproducts in traditional markets may lower the price offinal products, thereby affecting the profitability ofCanadian firms. Declining profitability in a particularsubsector may therefore be a symptom of structuralchanges occurring in the marketplace. In addition, thehighly cyclical nature of some forestry subsectors mayresult in short-term financial losses or gains in a givenyear. It is the long-term profitability of the forest sectorthat continues to attract investors and entrepreneurs,and allows it to make an important contribution toCanada’s economy.
Trends in the share of global markets (Indicator5.2.2) provide a useful indication of the Canadian
forest industry’s ability to sell its productsabroad. Canada currently accounts formore than 18% of the total value ofglobal forest products trade. Theability to retain markets in othercountries reflects the reputation ofthe Canadian forest sector fordelivering consistently high qualityproducts at competitive prices. Forexample, as a result of new techno-logical advances, Canada hasmaintained a 33% share of theglobal pulp market.
Historically, Canada’s richendowment of natural resources hasprovided the forest sector withrelatively low-cost raw materials, andtherefore, a comparative advantage inthe marketplace. With the increasingglobalization of markets, however,developing countries with high-yieldplantation forests are beginning to threatenCanada’s position. Increasingly, the Canadianforest sector’s ability to compete on the world scenedepends on its ability to maintain low production costsand develop value-added products for specialtymarkets. Technological progress is important forachieving both of these objectives.
Trends in research and development (R&D)expenditures (Indicator 5.2.3) in forestry provide auseful preliminary indication of the ability of firms toinnovate and thus maintain their competitiveness.R&D in forestry may involve scientific research carriedout at universities, cooperative research institutes,private sector research facilities and mills; or forestresource-related science and technology sponsored byprovincial, territorial and federal governments. Forest-based R&D includes applied research such as thedevelopment of improved seedlings or betterproduction processes to reduce costs or meet higherenvironmental standards. Another focus of R&D is thedevelopment of new products and technologicalinnovation, which may open new markets and confercompetitive advantages.
To remain profitable and internationally competitive,the forest industry must position itself on the leadingedge of innovation. In the complex and competitive
ELEMENT 5.2COMPETITIVENESS OFRESOURCE INDUSTRIES
MU
LTIP
LE B
ENEF
ITS
OF
FOR
EST
S TO
SO
CIE
TY
•C
ompe
titiv
enes
s
77
ProductiveCapacity
Competitiveness
Contributionto Economy
Non-timberValues
MULTIPLEBENEFITS
5.2.1
5.2.2
5.2.3
6.5.2
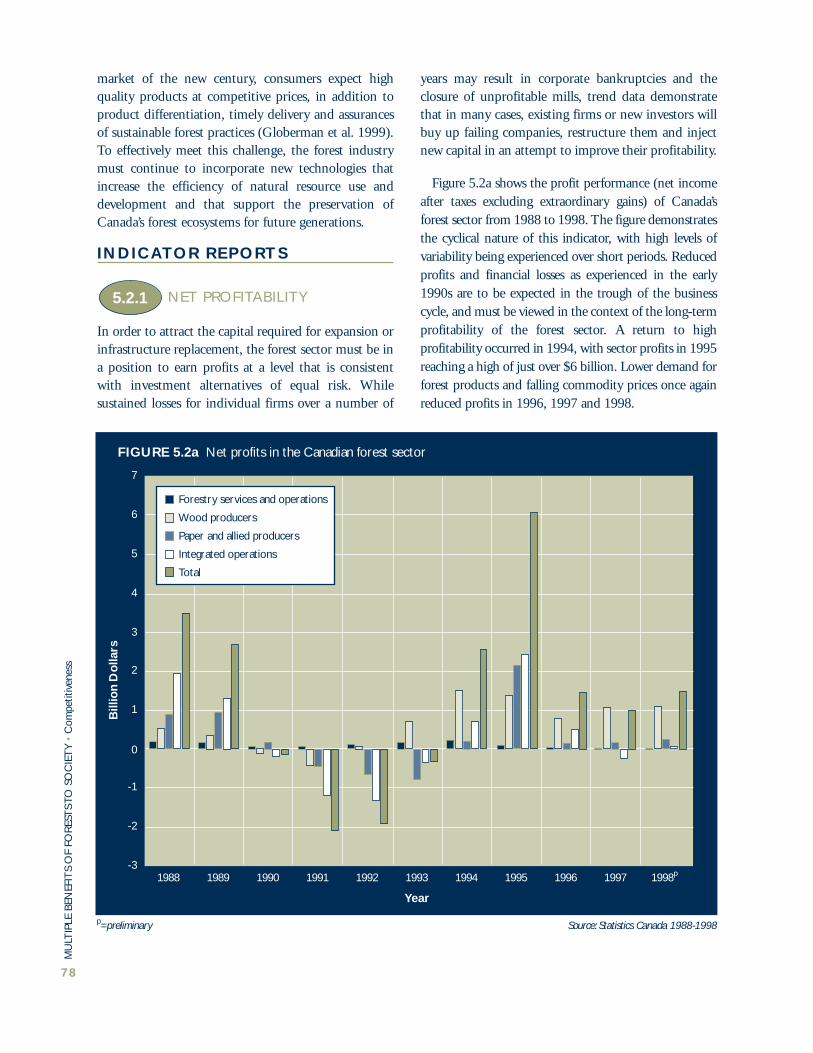
market of the new century, consumers expect highquality products at competitive prices, in addition toproduct differentiation, timely delivery and assurancesof sustainable forest practices (Globerman et al. 1999).To effectively meet this challenge, the forest industrymust continue to incorporate new technologies thatincrease the efficiency of natural resource use anddevelopment and that support the preservation ofCanada’s forest ecosystems for future generations.
INDICATOR REPORTS
NET PROFITABILITY
In order to attract the capital required for expansion orinfrastructure replacement, the forest sector must be ina position to earn profits at a level that is consistentwith investment alternatives of equal risk. Whilesustained losses for individual firms over a number of
years may result in corporate bankruptcies and theclosure of unprofitable mills, trend data demonstratethat in many cases, existing firms or new investors willbuy up failing companies, restructure them and injectnew capital in an attempt to improve their profitability.
Figure 5.2a shows the profit performance (net incomeafter taxes excluding extraordinary gains) of Canada’sforest sector from 1988 to 1998. The figure demonstratesthe cyclical nature of this indicator, with high levels ofvariability being experienced over short periods. Reducedprofits and financial losses as experienced in the early1990s are to be expected in the trough of the businesscycle, and must be viewed in the context of the long-termprofitability of the forest sector. A return to highprofitability occurred in 1994, with sector profits in 1995reaching a high of just over $6 billion. Lower demand forforest products and falling commodity prices once againreduced profits in 1996, 1997 and 1998.
5.2.1
MU
LTIP
LE B
ENEF
ITS
OF
FOR
EST
S TO
SO
CIE
TY
•C
ompe
titiv
enes
s
78
1988 1989 1990 1991 1992 1993 1994 1995 1996 1997 1998p
7
6
5
4
3
2
1
0
-1
-2
-3
Year
Bill
ion
Do
llars
Forestry services and operations
Wood producers
Paper and allied producers
Integrated operations
Total
FIGURE 5.2a Net profits in the Canadian forest sector
Source: Statistics Canada 1988-1998p=preliminary

TRENDS IN GLOBAL MARKETSHARE
Figure 5.2b shows Canada’s share of world exports byvolume for various forest products. Canada currentlyaccounts for 50% of the global trade in softwoodlumber. The majority of Canada’s exports are destinedfor the United States, while Japan and the EuropeanUnion are also important customers.
The Canadian share of panel exports fluctuatedbetween 4% and 9% from 1970 to 1992. Since 1992,Canada’s share has risen steadily, reaching an all-timehigh of 17% in 1997. This can be attributed toincreasing acceptance of products such as orientedstrandboard and medium-density fibreboardmanufactured from chips and other wood residues.Both particleboards and strandboards can be producedusing hardwoods (such as aspen and other poplars) andsecondary fibres from sawmills. The abundance ofthese low-cost raw materials has led to a significantincrease in Canadian capacity for panel production inthe last 20 years.
Although technological advances have enabled othercountries to enter the global wood pulp market,Canada’s share has remained near the 33% level since1970. This is partly attributable to the introduction ofnew technologies and to the high quality of the long-fibre pulp produced from Canada’s softwood trees.
In 1970, the Canadian share of world newsprintexports was 69%. By 1997, it had declined to 49%, dueto increased global production capacity from theaddition of new mills, especially in the US, whichconsumes the majority of Canada’s newsprint exports.
TRENDS IN RESEARCH ANDDEVELOPMENT EXPENDITURESIN FOREST PRODUCTS ANDPROCESSING TECHNOLOGIES
INVESTMENTS IN FOREST-BASED RESEARCH ANDDEVELOPMENT INFORMATION
Indicators 5.2.3 and 6.5.2 are combined and reportedas one indicator.
The information available on forestry R&D activitiesis fragmented. Table 5.2a provides details ongovernments’ forest-based research expenditures for theperiod 1990 to 1997. This includes the research budgetof the Canadian Forest Service and provincial forestagencies, as well as research supported by the federal-provincial agreements in forestry. The informationreveals that since 1994, government expenditures inforest-based research have declined by almost 40%.
Table 5.2b shows the industry-oriented R&Dexpenditures in forest products and processingtechnologies by subsector. Data from Canada’s threeprincipal industrial forest research institutes areincluded in the figures. The Forest Engineering
6.5.2
5.2.380
70
60
50
40
30
20
10
0
Year
Vo
lum
e (%
)
NewsprintWood based panelsSoftwood lumberWood pulp
Source: Food and Agriculture Organization 1999
FIGURE 5.2b Canada's share of global trade in forest products
'70 '72 '74 '76 '78 '80 '82 '84 '86 '88 '90 '92 '94 '96
5.2.2
MU
LTIP
LE B
ENEF
ITS
OF
FOR
EST
S TO
SO
CIE
TY
•C
ompe
titiv
enes
s
79
Table 5.2a Government expenditures in forest-based research
Year 1990 1991 1992 1993 1994 1995 1996 1997
Million 112.8 126.1 137.1 137.3 151.7 102.7 98.9 91.1
dollars
Sources: National Forestry Database 1998, Natural Resources Canada—Canadian Forest Service 1998

Research Institute of Canada (FERIC), ForintekCanada Corp. and the Pulp and Paper ResearchInstitute of Canada (PAPRICAN) conduct researchand development in forest engineering, forest productdevelopment, and pulp and paper technology, respec-tively. In 1997, their combined R&D budgets totalled$65.4 million, or 44% of the total industrial forestryR&D expenditures.
TABLE 5.2b Industrial intramural forestry R&D* (million dollars)
Logging Wood Paper Totalindustry industries and
and forestry alliedservices industries
1988 7 20 145 172
1989 8 18 151 177
1990 11 42 112 165
1991 11 19 98 128
1992 8 20 94 122
1993 9 23 102 134
1994 8 24 98 130
1995 9 24 101 134
1996p 10 25 110 145
1997i 9 26 113 148p: preliminary i: spending intentions
*Includes the total budget of the three principal research institutes: FERIC, Forintek and PAPRICAN.
Source: Statistics Canada 1988-1997
Overall, industrial intramural R&D expenditureshave increased since the early 1990s, but remain wellbelow the level reached in the late 1980s. Expressed asa percentage of sales, R&D expenditures are currentlyat approximately 0.3% for the wood, and paper andallied industries, compared with rates of 0.5% and0.4%, respectively, in 1989.
MU
LTIP
LE B
ENEF
ITS
OF
FOR
EST
S TO
SO
CIE
TY
•C
ompe
titiv
enes
s
80

ELEMENT OVERVIEW
A wide range of goods is derived from forests, thuscreating opportunities for the establishment ofcommercial enterprises. In addition to the traditionalforest products sector, the forest land base supports anumber of smaller industries such as outfitters, mapleproducts producers and Christmas tree growers, as wellas the increasing number of industries that cater totourists. Revenues from forest-based tourism havedoubled in the last 10 years. Revenues from non-timbercommodities have also increased, with sales of mapleproducts almost tripling since 1991.
The combination of all payments by forest-relatedindustries for labour, capital, taxes, and resource rentsrepresents the contribution of the sector to Canada’sgross domestic product (GDP), and thus, the nationaleconomy (Indicator 5.3.1). In 1998, the forestindustry’s contribution to the Canadian GDP was$18.2 billion ($16.6 billion in constant 1992 dollars)representing approximately 2.3% of the total GDP forall industries.
An important dimension of sustainable developmentis the creation and maintenance of jobs and incomes(Indicator 5.3.2). Monitoring the employmentperformance of subsectors involved in both extractiveand non-extractive commercial activities provides anindication of the forest sector’s ability to contribute toCanadians’ standard of living. Employment in theforest sector reached a 10-year high in 1998. Thesustained employment in the industry is attributed tothe growth of the value-added sector.
The wood industries and the paper and alliedindustries belong to the manufacturing sector. Here,higher labour productivity associated with newtechnology has led to increased wages. As a result, averagesalaries in the forest sector are generally higher than theaverage salary in the rest of the manufacturing sector.
INDICATOR REPORTS
CONTRIBUTION TO GROSS DOMESTIC PRODUCT (GDP)OF TIMBER AND NON-TIMBER SECTORS OF THEFOREST ECONOMY
The gross domestic productrepresents the value of goods andservices produced annually within acountry. The real GDP measures thevalue of the GDP in constant dollars topermit trend analysis without theinfluence of inflation. The forest sector iscomposed of three subsectors: logging andforestry services; wood industries; and paperand allied industries. Figure 5.3a shows the forestsector’s contribution to Canadian real GDP between1961 and 1998. These values are expressed in constant1992 dollars. Despite noticeable declines in someyears, each subsector’s contribution has generallyincreased since 1961. In 1998, the Canadian forestsector contributed $16.6 billion (2.3%) to the totalreal GDP of $721 billion for all industries in Canada.Of this, the paper and allied industries made the largestcontribution—$6.5 billion. Wood industries contri-buted $5.9 billion, and logging and forestry services,$4.2 billion.
5.3.1
ELEMENT 5.3CONTRIBUTION TO THENATIONAL ECONOMY
MU
LTIP
LE B
ENEF
ITS
OF
FOR
EST
S TO
SO
CIE
TY
•C
ontr
ibut
ion
to E
cono
my
81
ProductiveCapacity
Competitiveness
Contributionto Economy
Non-timberValues
MULTIPLEBENEFITS
5.3.1
5.3.2
'61 '65 '69 '73 '77 '81 '85 '89 '93 '97
20
18
16
14
12
10
8
6
4
2
0
Year
Bill
ion
dolla
rs (
1992
)
Logging and forestry servicesTotal forest industriesWood industriesPaper and allied industries
FIGURE 5.3a Forest sector's contribution to GDP
Source: Statistics Canada, 1961-1998.

In the wood products industries, lumber remains themost important segment, although production of value-added products such as oriented strandboard,particleboard and fibreboard has increased at a rapidpace in recent years (Figure 5.3b). Similarly, whileproduction of newsprint and market pulp dominates thepaper and allied industries, production of more process-intensive printing and writing papers increased by morethan 43% between 1990 and 1998 (Figure 5.3c).
Although patterns of production are changing, theCanadian forest sector remains heavily skewed towardstraditional products whose prices have remainedrelatively low and cyclical. Therefore, despite the factthat the contribution to GDP by the forest sector hasincreased, the value per cubic metre of wood harvested
has remained relatively constant. In addition, therelative importance of the forest sector tends to beunderstated when its contribution is measured in GDPbecause GDP does not include indirect impacts onother sectors of the economy.
Detailed information on the contribution toCanadian GDP by the non-timber sector is notavailable. Information for the Christmas tree and mapleproducts industry and for campgrounds and outfittersin the recreation sector is also reviewed in this report.Figure 5.3d shows that wholesale values (constant 1992dollars) for maple products have been increasing,reaching $141 million in 1998. The wholesale value ofChristmas trees produced in Canada decreased slightlyfrom $53.5 million in 1990 to $51.5 million in 1997.
Year
FIGURE 5.3c Production of printing and writing papers
Mil
lio
n t
on
ne
s
Source: Canadian Pulp and Paper Association 1999
3
4
5
6
'98'97'96'95'94'93'92'91'90
Production
Year
FIGURE 5.3b Production of wood-based panels
Mil
lio
n m
3
Source: Statistics Canada 1990-1998
0
1
2
3
4
5
6
'98'97'96'95'94'93'92'91'90
Fibreboard
ParticleboardOriented Strandboard
MU
LTIP
LE B
ENEF
ITS
OF
FOR
EST
S TO
SO
CIE
TY
•C
ontr
ibut
ion
to E
cono
my
82
TABLE 5.3a Trends in the number of establishments and in total revenues for service industries dependent on forests, 1986-1996
Year Campgrounds and travel trailer parks Outfitters, recreation and vacation camps
Number of Total revenue Number of Total revenueestablishments (million dollars) establishments (million dollars)
1986 2 003 229.9 1 439 232.01987 2 198 256.3 1 337 277.61988 2 387 279.1 1 618 299.91989 2 405 291.4 1 764 329.81990 2 454 310.1 1 826 347.11991 2 478 316.3 1 862 339.71992 2 573 336.9 1 927 347.51993 2 581 352.4 1 918 373.31994 2 585 370.3 2 050 431.11995 2 679 405.5 2 164 467.71996 2 640 421.2 2 178 488.4
Source: Statistics Canada 1986-1996

Table 5.3a illustrates trends in the number ofestablishments and the total value of receipts for twoservice-oriented sectors that depend on forests:campgrounds and travel trailer parks; and outfitters,recreation camps, and vacation camps. It also shows thattotal revenues increased steadily between 1986 and 1996.
TOTAL EMPLOYMENT IN ALLFOREST-RELATED SECTORS
Figure 5.3e shows that direct employment in theCanadian forest sector reached a record level of 384 000in 1998, an increase of over 18 000 from the previousyear. In 1998, the repercussions of the Asian crisisdecreased employment in British Columbia, whileincreased employment opportunities were experiencedin Ontario and Quebec as a result of economic growthin the United States. The wood industries sector, whichincludes sawmills, oriented strandboard mills andparticleboard mills, accounted for the majority of theemployment gains, adding 57 000 jobs since 1991—15 000 in 1998 alone.
A wide range of capital-intensive productiontechnologies has been adopted by the forest industryover the last 20 years, thereby reducing the number ofjobs created for each cubic metre of timber harvested.In the logging sector, mechanized harvesting machineshave substantially improved labour productivity andreduced the number of individuals required to harvest astand of trees. New highly automated, high-speedprocessing systems with optimal control scanners have
dramatically decreased the number of sawmillemployees required to produce a truckload of lumber.High-speed machines in some paper mills have reducedthe amount of labour required to produce a tonne ofnewsprint. The net effect of these new technologies hasbeen a general increase in the output of production peremployee (Figure 5.3f ).
The adoption of new technologies has allowed theforest sector to remain competitive in global marketsand to increase production in some subsectors. Higherlabour productivity associated with the new technologyhas led to increased wages. In 1997, the average annualincome (in 1992 dollars) of workers in the paper andallied industries was $50 529. Employees in the loggingand wood industries earned $40 311 and $36 152,respectively, while the average income of employees inother Canadian manufacturing industries was $38 599.Figure 5.3g compares the average annual real income offorest sector employees with that of workers in the entiremanufacturing sector over the period 1970 to 1997.
'75 '77 '79 '81 '83 '85 '87 '89 '91 '93 '95 '97
450
400
350
300
250
150
200
100
50
0
Year
Tho
usan
d em
ploy
ees
TotalPaper and allied industries Forestry services
Wood industriesLogging industries
FIGURE 5.3e Direct employment in Canada's forest sector
Sources: Statistics Canada 1975-1998,Natural Resources Canada—Canadian Forest Service 1998
5.3.2
Source: Canadian Council of Forest Ministers 1998
FIGURE 5.3d Wholesale value of maple products and Christmas trees
30
60
90
120
150
'98'97'96'95'94'93'92'91'90'89'88'87'86
Year
Mill
ion
dolla
rs (
1992
) Christmas Trees
Maple Products
MU
LTIP
LE B
ENEF
ITS
OF
FOR
EST
S TO
SO
CIE
TY
•C
ontr
ibut
ion
to E
cono
my
83

MU
LTIP
LE B
ENEF
ITS
OF
FOR
EST
S TO
SO
CIE
TY
•C
ontr
ibut
ion
to E
cono
my
84
FIGURE 5.3f Output of production per employee
Year
Inde
x 19
75 =
100
100
150
200
250
'97'95'93'91'89'87'85'83'81'79'77'75
Output per job in pulp and paperOutput per job in sawmills
Output per job in logging
Sources: Statistics Canada 1975-1998, Canadian Pulp and Paper Association 1998, Canadian Council of Forest Ministers 1998
FIGURE 5.3g Average income
Source: Statistics Canada 1971-1997
0
10
20
30
40
50
60
'97'95'93'91'89'87'85'83'81'79'77'75'73'71
Year
Tho
usan
d do
llars
(19
92)
Manufacturing Industries�
Paper and Allied Industries�
Wood Industries�
Logging�

ELEMENT OVERVIEW
Canadians have indicated that in addition tocommercial wood products, they look to forests for anarray of non-timber benefits, including recreation,tourism and preservation values. The latter may includethe option to visit forests in the future (option value),the knowledge that forests are being protected (existencevalue) and the assurance that future generations will alsohave access to forests (bequest value).
Non-timber values have become important toCanadians and are expected to play an increasing rolein forest use. It is difficult to place a numerical value onnon-timber and recreational values because access tothe natural resource is generally not allocated throughmarkets and is typically available to all free of charge orfor a fee that does not reflect the cost of providing it.Although it is gradually improving, the lack of marketinformation on the social benefits of non-timber valuespresents a challenge for the policy makers, planners andforesters who must make difficult choices regarding thebalancing of benefits.
Canadians’ participation in forest-related recreation ison the rise, and it is clear that non-timber uses of theforest must be considered jointly with all other uses toensure that forests continue to be managed sustainablyand to meet the demands placed on them. Publicownership of the majority of Canada’s forest land allowsaccessibility to forest recreation opportunities. Canada’sforests are a popular recreation destination for bothresidents and non-residents (Indicator 5.4.1). Eachregion of the country has a unique forest landscape thatoffers different recreational possibilities. Forests andnational/provincial/territorial/municipal park systemsprovide individuals with the opportunity to engage inoutdoor activities such as backpacking, climbing,camping, hunting, fishing, swimming, horsebackriding, skiing, snowmobiling, picnicking, birdwatching,sightseeing, and observing wildlife. The availability anduse of these recreational opportunities can be measuredusing information on the frequency of visits torecreational areas or the number of people participatingin various activities such as recreational fishing, huntingor wildlife viewing.
The National Survey on the Importance ofNature to Canadians (Federal-Provincial-Territorial Task Force on the Importanceof Nature to Canadians 1999), whichhas com-piled information for selectedyears between 1981 and 1996,provides one of the most compre-hensive databases on Canadians’activity patterns and expenditures foroutdoor recreation. The Surveyindicates that Canadians arespending more time participating inforest-related activities and may beplacing increasingly higher value onforest visits and activities. Theimportance Canadians place on thenon-timber uses of forests can beobserved in part through theirexpenditures on forest recreation (5.4.2).The survey collected information on nature-related expenditures, many of which involveforests. In 1996, Canadians spent approximately$11 billion on nature-related activities. The billions ofdollars spent by Canadians on these activitiescontribute significantly to national and provincialeconomies in the form of income and jobs.
INDICATOR REPORTS
AVAILABILITY AND USE OF RECREATIONAL OPPORTUNITIES
The results of the National Survey on the Importance ofNature to Canadians (Federal-Provincial-TerritorialTask Force on the Importance of Nature to Canadians.1999) suggest that a large number of Canadiansparticipate in forest-related nature experiences. In1996, 84.6% of the population aged 15 years and overparticipated in one or more nature-based activities.
Table 5.4a describes the number of user-days spentparticipating in nature-based activities in 1996. A user-day is defined as all or any part of a calendar day (24hours or less) spent participating in a given nature-based activity. Canadians spent more than 165 milliondays participating in activities ranging from hiking,camping, canoeing, skiing, birdwatching, fishing,hunting, berry picking, and other activities, in natural
5.4.1
ELEMENT 5.4NON-TIMBER VALUES
MU
LTIP
LE B
ENEF
ITS
OF
FOR
EST
S TO
SO
CIE
TY
•N
on-t
imbe
r Val
ues
85
ProductiveCapacity
Competitiveness
Contributionto Economy
Non-timberValues
MULTIPLEBENEFITS
5.4.1
5.4.2

MU
LTIP
LE B
ENEF
ITS
OF
FOR
EST
S TO
SO
CIE
TY
•N
on-t
imbe
r Val
ues
86
TABLE 5.4a Number of days (million user-days) spent participating in nature-based activities in 1996
All outdoor Wildlife Recreational Huntingactivities* viewing fishing
Forested 14.3 1.1 2.7 1.2Ecoprovinces (86.5%) (77.3%) (87.3%) (87.8%)
Non-forested 2.2 0.3 0.4 0.2Ecoprovinces (13.5%) (22.7%) (12.7%) (12.2%)
Total 16.6 1.4 3.1 1.4(100%) (100%) (100%) (100%)
*Outdoor activities include: sightseeing in natural areas, gathering nuts, berries and firewood, picnicking, camping, swimming, canoeing, power boating,hiking, backpacking, climbing, horseback riding, cycling, off-road vehicle use, downhill skiing, cross country skiing, snowshoeing, snowmobiling, and relaxing inthe outdoors.**Wildlife viewing includes: watching, feeding, photographing or studying wildlife.
Source: Federal-Provincial-Territorial Task Force on the Importance of Nature to Canadians 2000
FIGURE 5.4a: Forested ecoprovinces of Canada
Source: Lowe et al. 1996, Marshall and Schut 1999
**

areas. Destination choices are affected by many factors,including aesthetics, ecosystem health and robustness,vegetative characteristics of the area, presence of lakesand rivers, wildlife population status, wildlife diversityand observation potential, access, degree of congestion,availability of facilities, and topography.
A significant proportion of days spent on trips foroutdoor nature-based activity occurs within forestedareas. Figure 5.4a shows the distribution of forestedecoprovinces in Canada. The 15 terrestrial ecozones ofCanada are subdivided into 53 ecoprovinces. Table 5.4ashows that 86.5% of the total days spent on outdooractivities, wildlife viewing, and fishing and hunting inCanada were spent in forested ecoprovinces. The highlevel of participation in nature-based activity inforested areas is an indicator of the importance andvalue of forests in providing opportunities forCanadians to enjoy nature-based activities. Moreover,these results emphasize the need to ensure that nature-based activities and forest characteristics required forthose activities are considered in forest policy, land-useplanning, and management.
Outdoor nature-based activities are often associatedwith national and provincial parks. Figure 5.4billustrates the number of visits to Canada’s forestednational parks. In 1996-1997 there were close to 14million person-visits to Canada’s forested nationalparks. The majority of these visits took place during theperiod from June to September. Each time a personenters a national park for the purpose of recreation isconsidered a person-visit. Local residents, through-traffic and employees are not included. Between 1990and 1996, the number of visits to Canada’s parksincreased almost 14%, and it is expected that the trendwill continue. This increase suggests that since moreindividuals are spending more of their leisure timeparticipating in forest-related activities, they may alsobe placing higher value on these activities.
However, the results of the national survey indicatethat 52.5% of days are also spent on activities in forestareas outside parks. In the case of recreational fishing,76.4% of user-days occurred outside national andprovincial parks.
MU
LTIP
LE B
ENEF
ITS
OF
FOR
EST
S TO
SO
CIE
TY
•N
on-t
imbe
r Val
ues
87
TABLE 5.4b Expenditures (million dollars) on nature-related activities in Canada in 1996
Outdoor activities Wildlife Recreational Huntingin natural areas viewing fishing
Accommodation 1 133.9 65.7 157.5 39.0(16%) (5%) (8%) (5%)
Transportation 1 884.8 155.6 363.5 166.5(26%) (12%) (19%) (20%)
Food 1 565.9 100.0 244.7 99.4(22%) (8%) (13%) (12%)
Equipment 2 213.5 708.3 932.5 382.9(30%) (54%) (48%) (46%)
Other items 448.6 272.2 236.7 136.1(6%) (21%) (12%) (17%)
Total 7 246.7 1 301.8 1 934.9 823.8
Average yearly 704 297 462 692expenditure perperson (dollars)
Average daily 44 17 27 41expenditure perperson (dollars)
Source: Federal-Provincial-Territorial Task Force on the Importance of Nature to Canadians 2000

TOTAL EXPENDITURES BYINDIVIDUALS ON ACTIVITIESRELATED TO NON-TIMBER USE
Table 5.4b shows the breakdown of expenditures onnature-based activities in Canada in 1996. Totalexpenditures by Canadians on trip-oriented, nature-based activities were over $11 billion. Nature-basedexpenditures involving forests include those fortransportation, accommodation, food, entry fees andequipment and supplies such as camping, hunting andfishing gear, outdoor clothing and cameras. It isimportant to note, however, that expenditures onactivities are generally lower than the actual value of theexperience to individuals. A study by Reid (1998), forexample, showed that the economic value of activitiessuch as watching, feeding, studying, or photographingwildlife in British Columbia (on an average per daybasis) is about twice as high as average dailyexpenditures. The correct interpretation of expendituredata is therefore as a relative measure of the economicor social value of the activity. Information onexpenditures can also be used to assess the localeconomic impact of various nature-based activities.
The importance of ecotourism as a source ofeconomic development is growing as more and moreindividuals travel to natural areas for outdoorexperiences. Expenditures by individuals who travel toremote areas create jobs and contribute to economicdevelopment. The majority of expenditures on nature-based activities are for general outdoor activities such ascamping, hiking, and canoeing. The high percentage of
expenditures in accommodation and transportationsuggests that individuals who participate in generaloutdoor activities are more likely to take overnight tripsto the destination where the activity occurs.
References
Alvo, R. 1998. National status of 20 selected animalspecies inhabiting Canada’s forests. Report prepared forthe Canadian Pulp and Paper Association, BiodiversityConvention Office and Natural Resources Canada—Canadian Forest Service. Gavia Biological Services.Hull, QC. 328 p.
Canadian Council of Forest Ministers. 1997.Compendium of Canadian forestry statistics NationalForestry Database 1996. Natural Resources Canada.Ottawa, ON. 234 p.
Canadian Council of Forest Ministers. 1998.Compendium of Canadian forestry statistics. NationalForestry Database. 1998. [online]. http://nfdp.ccfm.orgAccessed February 2000.
Canadian Heritage—Parks Canada. 1999. State ofthe Parks 1997 Report. Public Works and GovernmentServices. Ottawa, ON. 190 p.
Canadian Pulp and Paper Association. 1998.Reference tables. Ottawa, ON. 54 p.
Canadian Pulp and Paper Association. 1999.Reference tables. Ottawa, ON.
Convention on International Trade in EndangeredSpecies of Wild Fauna and Flora (CITES). [online].http://www.wcmc.org.uk/CITES/eng/index.shtmlAccessed February 2000.
Federal-Provincial-Territorial Task Force on theImportance of Nature to Canadians. 1999. Theimportance of nature to Canadians: Survey highlights.Cat. Nº EN47-311/1999E. Environment Canada.Ottawa, ON. 55 p.
Federal-Provincial-Territorial Task Force on theImportance of Nature to Canadians. 2000. Theimportance of nature to Canadians: The economicsignificance of nature-related activities. Cat. Nº EN47-312/2000E. Ottawa, ON.
Food and Agriculture Organization of the UnitedNations—Forest Department. 1999. Yearbook of forestproducts 1997. Rome, Italy. 245 p.
5.4.2
'90/91 '91/92 '92/93 '93/94 '94/95 '95/96 '96/97
12
14
16
10
Year
Mill
ion
pers
on-
day
visi
ts
FIGURE 5.4b Visits to forests in Canada's national parks
Source: Canadian Heritage—Parks Canada 1999
MU
LTIP
LE B
ENEF
ITS
OF
FOR
EST
S TO
SO
CIE
TY
•N
on-t
imbe
r Val
ues
88

Globerman, S.; Nakamura, M.; Ruckman, K.;Vertinsky, I.; Williamson, T. 1999. Technologicalprogress and competitiveness in the Canadian forestproducts industry. Natural Resources Canada.
Lowe, J.J.; Power, K.; Gray, S.L. 1996. Canada's forestinventory 1991: 1994 version. An addendum toCanada’s Forest Inventory 1991. Information report BC-X-362E. Natural Resources Canada—Canadian ForestService—Pacific Forestry Centre. Victoria, BC. 23 p.
Marshall, I.B.; Schut, P.H. 1999. A national ecologicalframework for Canada. Environment Canada—Ecosystems Science Directorate and Agriculture andAgri-Food Canada—Research Branch. Ottawa, ON.[online]. http://www3.ec.gc.ca/soer-ree/english/framework/overview.cfm Accessed June 2000.
Ministère de l’Environnement et faune—Directiondes affaires institutionnels. 1999. Ventes et revenus despermis de chasse et de pêche ainsi que récolted’animaux prélevés au Québec en 1997. Bob van Dyn(Directeur des affaires institutionnels).Communication personnel.
Natural Resources Canada—Canadian ForestService. 1994. Timber supply in Canada: Challengesand choices. Proc. Conf. Kananaskis, AB Nov. 16–18,1994. Natural Resources Canada. Ottawa, ON. 209 p.+ appendices.
Natural Resources Canada—Canadian ForestService. 1998. Selected forestry statistics Canada 1997.(Internal document). Natural Resources Canada.Ottawa, ON.
Natural Resources Canada—Canadian ForestService. 1999. The state of Canada’s forests 1998-1999.Natural Resources Canada. Ottawa, ON. 112 p.
Newfoundland and Labrador Department of ForestResources and Agrifoods—Inland Fish and WildlifeDivision. 1998. License sales, amount harvested andrevenue collected from license sales. St. John’s, NF.
Ontario Ministry of Natural Resources. 1997.Hunter mail survey. Ontario Ministry of NaturalResources. 2 p.
Reid. R. 1998. The economic value of wildlifeactivities in British Columbia, 1996. British ColumbiaMinistry of Environment Lands and Parks—WildlifeBranch. Victoria, BC.
Statistics Canada. 1961-1998 (Various months).Gross domestic product by industry. Cat. Nº 15 001.
Statistics Canada. 1971-1997. Cat. Nº 31-203 andCat. Nº 25-202 XPB.
Statistics Canada. 1975-1998 (Various months).Labour force survey. Cat. Nº 71 001.
Statistics Canada. 1986-1996. Cat. Nº 63-204(Unpublished).
Statistics Canada. 1988-1996. Paper and alliedproducts industries. Cat. Nº 36 250.
Statistics Canada. 1988-1997. Industrial researchand development statistics. Cat. Nº 88 202.
Statistics Canada. 1988-1998. Financial and taxationstatistics for enterprises. Cat Nº 61-219 XPB.
Statistics Canada. 1990-1991, 1997-1998. Livestockstatistics Cat. Nº 23-603.
Statistics Canada. 1990-1998. Particleboard,oriented strandboard and fibreboard. Cat. No 36-003.
MU
LTIP
LE B
ENEF
ITS
OF
FOR
EST
S TO
SO
CIE
TY
•N
on-t
imbe
r Val
ues
89

90
ACCEPTING SOCIETY’S RESPONSIBILITY FORSUSTAINABLE DEVELOPMENT
CRITERION 6
INTRODUCTION
6.1 Aboriginal and Treaty Rights
6.1.1
6.2 Participation by Aboriginal Communities in Sustainable Forest Management
6.2.1
6.2.2
6.2.3
6.2.4
6.2.5
6.3 Sustainability of Forest Communities
6.3.1
6.3.2
6.3.3
6.4 Fair and Effective Decision-Making
6.4.1
6.4.2
6.4.3
6.5 Informed Decision-Making
6.5.1
6.5.5
Extent to which forest planning and management processes consider and meet legalobligations with respect to duly established Aboriginal and treaty rights
Extent of Aboriginal participation in forest-based economic opportunities
Extent to which forest management planning takes into account the protection ofunique or significant Aboriginal social, cultural or spiritual sites
Number of Aboriginal communities with a significant forestry component in the economic base and the diversity of forest use at the community level
Area of forest land available for subsistence purposes
Area of Indian reserve forest lands under integrated management plans
Number of communities with a significant forestry component in the economic base
Index of the diversity of the local industrial base
Diversity of forest use at the community level
Degree of public participation in the design of decision-making processes
Degree of public participation in decision-making processes
Degree of public participation in implementation of decisions and monitoring ofprogress toward sustainable forest management
Percentage of area covered by multi-attribute resource inventories
Expenditure on international forestry

ELEMENT OVERVIEW
“Aboriginal people”, as defined by the Constitution Act(1982), includes the Indian, Metis and Inuit peoples ofCanada. There is growing awareness of the need for
sustainable forest management to recognize Aboriginalpeople’s rights and to protect their traditional way oflife. Sustainable forest management considersAboriginal use of forest land, whether it be subsistenceor commercial fishing, hunting, trapping or gathering.
Element 6.1 attempts to measure the extent to whichforest planning and management processes throughoutCanada consider and meet legal obligations withrespect to Aboriginal and treaty rights. “Aboriginalrights” refer to general rights, typically defined by the
ELEMENT 6.1ABORIGINAL AND TREATYRIGHTS
SOC
IET
Y’S
RES
PON
SIBI
LIT
Y•
Abo
rigi
nal a
nd T
reat
y R
ight
s
91
INTRODUCTION
Sustainable development extends beyond trees to encompass the people in forest
communities. Criterion 6 is about society's values and the effectiveness with which all
members of society ensure that forest resources are managed in a manner that is in
the best interests of present and future generations.The indicators in Criterion 6 measure
social dimensions of sustainable development.
The Canadian Constitution recognizes and affirms the existence of Aboriginal and treaty
rights. Element 6.1 (Aboriginal and Treaty Rights) reviews the current legislation, policies and
practices to determine the extent to which Aboriginal and treaty rights are considered in
forestry planning and management.
The right of Aboriginal people to strengthen their connections to the land and to the
resource-based economy has been increasingly recognized in recent years.The degree to which
this recognition is being integrated into forest management plans and practices is the focus of
Element 6.2 (Participation by Aboriginal Communities in Sustainable Forest Management).The share of
timber and non-timber benefits from the forest accruing to Aboriginal people, and the consideration
in forest management plans for the protection of their cultural and spiritual heritage are examined.
A prosperous and developed community based on sustainable forest management contributes significantly
to the well-being of all Canadians. Element 6.3 (Sustainability of Forest Communities) examines the number of
forest-dependent communities in Canada, their economic diversity, and the diversity of their forest use.
Canadians have been calling on foresters and policy makers to ensure that forest management reflects changing
social values. Element 6.4 (Fair and Effective Decision Making) reviews the extent to which the public is involved in
charting out a path toward sustainable forest management, the mechanisms used, and their effectiveness.
For the public to be more engaged in decision-making processes regarding forest use and management, an
understanding of forest ecosystems and the relationships between the environment and the economy is necessary.
Element 6.5 (Informed Decision Making) examines our collective understanding of forests and reports on the type
of data currently being maintained in forest inventory databases. It also discusses Canadian contributions to assist
other countries in advancing their understanding and implementation of sustainable forest management.
Aboriginal andTreaty Rights
Participation byAboriginal
Communities
Sustainabilityof Forest
Communities
Fair and EffectiveDecision-Making
InformedDecision-Making
SOCIETY'SRESPONSIBILITY
6.1.1
ACCEPTING SOCIETY’SRESPONSIBILITY FOR SUSTAINABLE DEVELOPMENT

Constitution or federal legislation ascribed to Indianpeoples or First Nations. The term “First Nation” cameinto common usage in the 1970s to replace the word“Indian”. Although the term First Nation is widelyused, no legal definition exists. Among its uses, theterm “First Nations people” refers to the Indian peoplein Canada, both Status and Non-Status. Many Indianpeople have also adopted the term “First Nation” toreplace the word “band” in the name of theircommunity. In some provinces/territories, Aboriginalrights include the right to subsistence or commercialfishing, hunting, trapping, gathering or timberharvesting and may include the right of consultation.Aboriginal rights vary from group to group dependingon the customs, practices and traditions that are part oftheir distinctive cultures.
Clear property rights and use, in conjunction withthe assurance that these rights will be recognizedthrough due process, are important for sustainableforestry. If ownership of the forest or access to itsresources is assured to those who depend on it forsubsistence or other needs, there is a greater probabilitythat these users will take responsibility for sustainableforest management. Land claims and treatyentitlements are on-going processes. Measuring theextent to which forest planning and managementprocesses consider and meet obligations with respect toAboriginal and treaty rights is difficult because ofchanging interpretations of those rights and theevolving forms of co-management between Aboriginalpeople, provincial governments and the forest industry.The extent to which each province and territory istaking action to acknowledge and incorporateAboriginal and treaty rights into forestry planning andmanagement is described (Indicator 6.1.1).
INDICATOR REPORT
EXTENT TO WHICH FORESTPLANNING AND MANAGE-MENT PROCESSES CONSIDERAND MEET LEGAL OBLIGA-TIONS WITH RESPECT TO DULYESTABLISHED ABORIGINALAND TREATY RIGHTS
This indicator is reported through the results of aprovincial/territorial survey (Table 6.1a).
Some provinces have amended or are in the processof amending their forest legislation, regulations,practices and policies to address Aboriginal rights. NewBrunswick, for example, is currently reviewing possibleamendments to its Crown Lands and Forests Act (1982)to affirm the recognition of Aboriginal and treaty rightsin the management of public lands.
The British Columbia Ministry of Forest’s policy onAboriginal Rights and Title (1999) provides guidance tooperational staff in addressing potential Aboriginalrights and title issues arising from resourcedevelopment activities of the government and licensees.The policy and the accompanying detailed ConsultationGuidelines apply to operational forest planning andapproval processes for provincial public land (94% ofthe province). The policy also encourages Aboriginalinvolvement in aspects of strategic or long-termplanning processes in order to increase the effectivenessof all Ministry planning processes. The policy updatedan earlier, similar policy and is consistent with otherprovincial policies regarding Aboriginal issues. TheMinistry of Forests strives to build and maintainworking relationships with First Nations based on trustand respect.
In Ontario, the Crown Forest Sustainability Act(1994) provides the Ministry of Natural Resourceswith the legislative authority for the sustainablemanagement of Ontario’s forest resources. The legallyprescribed forest management planning processprovides for separate and customized participation ofAboriginal communities. The Ministry is presentlyimplementing and complying with Term andCondition 77 of the Class Environmental Assessment forTimber Management on Crown Lands in Ontario(1994), which addresses the need for more equalparticipation by Aboriginal people in forestmanagement and in the sharing of benefits. Term andCondition 77 prescribes the creation of a mechanismthrough which Aboriginal communities can pursueeconomic development; however, it does not recognizeany treaty or Aboriginal right to commercial use offorest resources.
The development of a comprehensive database onprovincial and territorial efforts to incorporateAboriginal and treaty rights into forest planning andmanagement would facilitate future reporting onthis indicator.
6.1.1
SOC
IET
Y’S
RES
PON
SIBI
LIT
Y•
Abo
rigi
nal a
nd T
reat
y R
ight
s
92

SOC
IET
Y’S
RES
PON
SIBI
LIT
Y•
Abo
rigi
nal a
nd T
reat
y R
ight
s
93
TABLE 6.1a Provincial and territorial legislation, regulations and policies acknowledging Aboriginal and treaty rights in forest planning and management
Province/Territory Policy/Process
Alberta Presently undertaking a complete review of existing consultation processes to ensure that the government is meeting its legal responsibilities to Aboriginal and treaty rights.
British Columbia Operational forest planning and approval processes must address Aboriginal and treaty rights, as required by the Ministry of Forests Aboriginal Rights and Title policy and detailed Consultation Guidelines.The policy also encourages Aboriginal involvement in strategic or long-term planning processes.
Manitoba Information not available.
New Brunswick Affirms that its processes will respect Aboriginal and treaty rights as established in law.Amendments to the Crown Lands and Forests Actto affirm the recognition of Aboriginal and treaty rights in the management of public lands are presently under consideration.
Newfoundland and Labrador Principle of Aboriginal participation will be met through negotiation of comprehensive land claims with Aboriginal groups whose claims have beenbeen accepted for negotiation by the government.
Northwest Territories Forest Management Act provides control, management and administration with respect to research, harvest, and management of forests.
Nova Scotia Information not available.
Nunavut Information not available.
Ontario The legally prescribed forest management planning process provides for separate and customized participation of Aboriginal communities.Term and Condition 77 of the Class Environmental Assessment for Timber Management on Crown Lands in Ontario addresses the need for more equal participation in the benefits of forest management by Aboriginal people.Although the government is legally bound to comply with the forest management planning process and the Terms and Conditions of the Class Environmental Assessment,successful implementation of these policies requires the involvement of the Aboriginal community.
Prince Edward Island Information not available.
Quebec Has for some years encouraged the participation of local Aboriginal communities in the management of public forests.The forest industry also hasAboriginal input into the first stages of the planning process.The Forest Act is being amended to include customized participation of Aboriginal communities.
Saskatchewan The Forest Resources Management Act and Regulations proclaimed April 1999 affirm recognition of Aboriginal and treaty rights.The act requires consultation with Aboriginal people by industry when developing forest management and operating plans.Will initiate in 2000 discussions with First Nations about a consultation process for reviewing forest operating plans.
Yukon Territory Legal obligation for consultation on management planning expressed in theUmbrella Final Agreement and individual final land claims (Chapter 17).
Source: Natural Resources Canada—Canadian Forest Service—Industry, Economics and Programs Branch 1999

SOC
IET
Y’S
RES
PON
SIBI
LIT
Y•
Abo
rigi
nal a
nd T
reat
y R
ight
s
94

ELEMENT OVERVIEW
Given Aboriginal people’s ties to the forest, and thetraditional knowledge they have gained through theirspecial relationship with the land, they bring a uniqueperspective to sustainable forest management. There ismuch wisdom in the Aboriginal land ethic which holdsthat land and forests should be viewed as a whole, andthat resources must be protected out of respect for past,present and future generations.
More than 80% of Aboriginal communities liewithin or near productive forest zones of Canada. Theparticipation of these communities in making decisionson sustainable forest management is thereforeimportant (Indicator 6.2.1). Based on informationprovided by provinces and territories as well as recentstudies, it can be concluded that the number ofAboriginal people working in forestry and forestry-related businesses has grown considerably since themid-1990s due to greater employment opportunitiesoffered to them by governments and industry.
The federal government has responsibility for landareas referred to as “Indian reserves”. There are 2 592reserves located across Canada. The total area of thesereserves is 3.2 million hectares, 1.4 million hectares ofwhich are forested. The forest land on Indian reserves isequal to approximately 0.3% of the forest land inCanada. Forest management plans from 286 FirstNations communities were reviewed to determine theextent to which the recognition, location andprotection of important social, cultural and spiritualsites (Indicator 6.2.2) were considered in current plans.
The participation of Aboriginal communities in allstages of sustainable forest management, from planningto economic opportunities, includes diversified use offorest resources (Indicator 6.2.3) to ensure communitysustainability. Less than 1% of communities designatedas Aboriginal, pursuant to the definition developed byAboriginal Business Canada and Statistics Canada, aredependent on the forest sector for a significantproportion of their wages.
Sustainable forest management includesbalancing industrial, recreational, andvarious non-timber and subsistence uses(Indicator 6.2.4) without compro-mising forest integrity and produc-tivity. While subsistence activities arenot exclusive to Aboriginal people inCanada, more than 450 of the 623First Nations communities inCanada are located in forestedecosystems, and many First Nationsfrom across Canada continue topractice subsistence harvesting andgathering in the forests. It is notpossible for this report to providenational information on the area ofland available for subsistencepurposes. Analysis of two casestudies describe how subsistenceuses in two northern communitiesyielded higher economic value thanwas attributed to commercial forestactivities over the past 30 years.
Forest plans provide overalldirection and guidelines for meetingspecific targets for all resource values.Aboriginal communities value forests fortheir economic, spiritual, cultural andtraditional uses. Management plans thatintegrate these traditional uses with timber andnon-timber values (Indicator 6.2.5) are importanttools for ensuring that they are recognized andprotected. The preparation of a plan is the initial step.The plan must then be implemented and updated ona regular basis.
The Canadian Forest Service keeps some informationon forest management plans for Indian reserves. Thereis no information for the Metis or Inuit communities.The forest management plans reviewed for reservelands of 286 First Nations communities cover approxi-mately 0.75 million hectares of forest.
ELEMENT 6.2PARTICIPATION BY ABORIGINALCOMMUNITIES IN SUSTAINABLEFOREST MANAGEMENT
SOC
IET
Y’S
RES
PON
SIBI
LIT
Y•
Part
icip
atio
n by
Abo
rigi
nal C
omm
uniti
es
95
Aboriginal andTreaty Rights
Participation byAboriginal
Communities
Sustainabilityof Forest
Communities
Fair and EffectiveDecision-Making
InformedDecision-Making
SOCIETY'SRESPONSIBILITY
6.2.1
6.2.2
6.2.3
6.2.4
6.2.5

INDICATOR REPORTS
EXTENT OF ABORIGINAL PAR-TICIPATION IN FOREST-BASEDECONOMIC OPPORTUNITIES
Comprehensive national data are not available todetermine the number of Aboriginal people employedin Canada’s forest sector. The only data collection thatdoes take place is on an ad hoc basis. The methodologyfor collecting the information varies between agencies,as do definitions, and no standard conversion factorsare used. Further, employment statistics are notrecorded by ethnic origin. Provinces and territoriesprovided estimates on the number of Aboriginal peopleworking in forestry and the forest-based industries, aswell as information on studies undertaken since 1994describing Aboriginal employment in other areas.
The Aboriginal Affairs Section of the BritishColumbia Ministry of Forests carried out an AboriginalParticipation Survey in 1993, which indicated that thenumber of Aboriginal people employed in the forestindustry was approximately 4.3% of the work force.Most of these jobs were in the labour and machineoperation areas. Approximately 6% of all industrycontracts in the province went to Aboriginal firms. Noactual employment numbers were provided.
The Ontario Ministry of Natural Resources isactively involved with more than 70 First Nationscommunities to facilitate access to economicdevelopment through forest management. A number offorest sector companies are taking a lead role inproviding employment opportunities and access to theforest resource.
In New Brunswick, an estimated 470 jobs, or 4 700work weeks of forestry employment, were generated forAboriginal people through the 1998 interim harvestingagreements between the province and the 15 FirstNations communities.
In the Northwest Territories, it is estimated that3 000 Aboriginal people are engaged in forestry-relatedactivities, including firefighting, and 60 in forest-basedprocessing operations.
EXTENT TO WHICH FORESTMANAGEMENT PLANNINGTAKES INTO ACCOUNT THEPROTECTION OF UNIQUE ORSIGNIFICANT ABORIGINALSOCIAL, CULTURAL OR SPIRITUAL SITES
It is not possible to comprehensively report on therecognition, location and protection of importantsocial, cultural and spiritual sites in current forestmanagement plans for Indian reserves. Littleinformation is available from the provinces andterritories regarding new legislation, policies orprograms affecting important Aboriginal sites. No dataare available for the Metis population. The report forIndicator 6.2.2 is based on available informationregarding forest management plans for Indian reserves.
Many provinces and territories have legislation orprograms that do address this issue. In Ontario, thelegally prescribed forest management planning processprovides for separate and customized participation ofAboriginal communities. In addition, Ontario hasforest management guidelines for the protection ofcultural values that pertain to all public forests. Quebecand British Columbia have heritage conservationlegislation in place to manage Aboriginal archaeologicalsites. Its traditional use study program provides fundsto First Nations to collect, store, maintain and maptraditional use site information. In the NorthwestTerritories and the Yukon Territory, forest managementplans are being developed in conjunction withcommunity protection and municipal plans. Theseplans are in the preliminary stages. All social, culturaland spiritual sites will be considered as mostcommunities are small and have many residents ofAboriginal descent.
Table 6.2a shows the number of Indian bands withforest management plans that address or include theprotection of unique or significant social, cultural orspiritual values. Less than half of the plans reviewedrecognize the social values of the lands undermanagement, while fewer still recognize importantcultural and spiritual sites. Information with respect tohow well the social, cultural and spiritual values of theforests are being protected or how well they arerecognized and acknowledged in forest planning and
6.2.2
6.2.1
SOC
IET
Y’S
RES
PON
SIBI
LIT
Y•
Part
icip
atio
n by
Abo
rigi
nal C
omm
uniti
es
96

management should become available as existing plansare updated or new ones are prepared for reserve lands.
NUMBER OF ABORIGINALCOMMUNITIES WITH A SIGNIFI-CANT FORESTRY COMPONENTIN THE ECONOMIC BASE ANDTHE DIVERSITY OF FOREST USEAT THE COMMUNITY LEVEL
Aboriginal Business Canada and Statistics Canadadeveloped a list of Aboriginal communities from the1996 Canada Census (Statistics Canada 1998). Theirlist included all census subdivisions (CSDs) which hada self-identified population of 20% or more of any oneof the following groups: North American Indian, Metisor Inuit; or that were designated by Statistics Canada asIndian Reserve, Indian Settlement, Indian GovernmentDistrict, Terres reservées or Village Cri. From this list,the economic base method was used to determine howmany of these CSDs have over 50% of their economicbase in the forest sector.
“Census subdivision” is the general term applied tomunicipalities (as determined by provincial legislation)or their equivalent (for example, Indian reserves, Indiansettlements and unorganized territories) (StatisticsCanada 1998). This is the same method used inIndicator 6.3.1.
Of 1 052 Aboriginal CSDs, data are available for 750.Seven of these were found to be forest sector-dependent.Five of the forest-dependent communities are located inBritish Columbia. All of them have populations of lessthan 1 000. The other two are Metis communities inAlberta and Saskatchewan, with populations between2 000 and 5 000. Current research does not measure thenumber of communities dependent on forestsubsistence, however. If a full range of forest values wereincluded (e.g., subsistence, amenity, bequest andexistence values), the number of forest-dependentcommunities would substantially increase.
A case study in Waterhen, Saskatchewan, acommunity of 556 residents, showed that dependenceon the forest is greater than typically captured by forestindustry dependence measures (Korber 1997). Usingtraditional harvest survey data for 1992, an in-kindincome was estimated based on replacement values.Subsistence activities accounted for approximately onequarter of the total community economy. The analysisfrom this study also showed that competition betweenforest uses may arise when subsistence production andindustrial forestry share the same land base. Theseissues are currently being addressed through alternativeforest management regimes.
AREA OF FOREST LAND AVAILABLE FOR SUBSISTENCEPURPOSES
There is insufficient information available to report onthe area of forest available for subsistence purposes.Burkosky and Beckley (1997) have discussed some ofthe issues surrounding the rights of Aboriginal peopleto practise subsistence activities. While subsistence isgenerally interpreted to mean hunting, fishing,trapping and gathering, many of the court rulings onthe subject refer only to fishing and hunting and eitherdo not consider or do not define what may be gathered.
A second complicating factor is that a given tract ofland is rarely either entirely accessible or entirelyinaccessible for Aboriginal subsistence use. This makesit difficult to develop a national picture of the amountof land available. In addition, in any province orterritory there are occasional additions to the landavailable for subsistence and new exclusions. Suchexclusions may occur for purposes of protection(wildlife reserves), for natural resource development(hydro projects, oil sands expansions), or for adminis-trative purposes (government installations). The area ofland that is even hypothetically available for subsistenceuse is constantly changing. To date, no agency orinstitution has systematically tracked this information.
6.2.4
6.2.3
SOC
IET
Y’S
RES
PON
SIBI
LIT
Y•
Part
icip
atio
n by
Abo
rigi
nal C
omm
uniti
es
97
TABLE 6.2a Forest management plans for Indian reserves that consider unique or significant social, cultural or spiritual values
Number of First Nation Number and percent of plans incorporating Aboriginal valuescommunities withforest management plans Social % Cultural % Spiritual %
286 138 48 104 36 40 14
Source: Natural Resources Canada—Canadian Forest Service—Industry, Economics and Programs Branch 1999

There is also the question of who qualifies forsubsistence rights. Access to land for subsistencepurposes differs among First Nations members, Metis,and reserve residents and non-residents.
In case studies in Nahanni Butte and Fort Liard,Northwest Territories, harvests of meat, fish, crafts, pelts,fuel wood and berries were calculated and the potentialvalue of medicine, tourism, spiritual values, buildingmaterials and domestic use of crafts estimated. Theanalysis showed that subsistence and non-industrialforest uses may have more economic value than has beenattributed to commercial forest activities over the past 30years (Beckley and Hirsch 1997).
The Crees of Quebec have estimated that one third oftheir economy is based upon hunting and fishing andthat every Cree is either a direct participant or indirectlybenefits from a subsistence economy (Canada, House ofCommons 1990). Since 1975 the Crees have tracts ofland reserved, under the James Bay Northern QuebecAgreement, exclusively for subsistence and commercialpurposes. The Narkapis have similar arrangements underthe Northeastern Quebec Agreement.
AREA OF INDIAN RESERVEFOREST LANDS UNDER INTE-GRATED MANAGEMENT PLANS
Table 6.2b shows the number of Indian reserves withforest management plans and the forest area that isunder management. It is estimated that 286 FirstNations communities have forest management plans,covering over 50% of the total forest land on reserves.
Most reserve management plans are based on anapproach to forest management planning thatintegrates timber and non-timber values. Those that arenot based on this concept are found primarily inOntario and Nova Scotia. As part of integratedmanagement, the British Columbia Ministry of Forestsand the Manitoba Department of Conservation havean agreement with the federal Department of IndianAffairs and Northern Development to go onto Indianreserves to fight wildfires. There may be similaragreements in other provinces/territories.
6.2.5
SOC
IET
Y’S
RES
PON
SIBI
LIT
Y•
Part
icip
atio
n by
Abo
rigi
nal C
omm
uniti
es
98
TABLE 6.2b Number of Indian reserves with integrated forest management plans, 1999
Province/Territory Number of Number of Number of Number of % inte- Total forestreserves* communities forest manage- integrated grated area under
ment plans forest manage- plans forest manage-ment plans ment plans (ha)
British Columbia 1 654 197 126 126 100 130 594
Alberta 108 43 23 20 87 124 504
Saskatchewan 185 70 N/A** N/A N/A N/A
Manitoba 121 61 24 24 100 34 593
Ontario 193 126 64 24 38 208 116
Quebec 37 39 20 14 70 230 195
New Brunswick 17 15 9 5 56 12 816
Nova Scotia 24 14 18 5 28 5 128
Prince Edward 1 2 1 1 100 278Island
Newfoundland 1 1 1 1 100 294and Labrador
Northwest 2 26 0 0 0 0Territories***
Yukon Territory 23 16 0 0 0 0
Total 2 394 610 286 220 77 746 518
* Department of Indian Affairs and Northern Development—Indian Land Registry System 1999.** N/A: Information not available.***15 of the 26 First Nations are developing forest management plans in conjunction with community protection and municipal plans. All plans are in
the preliminary stages and will involve consultations with communities and various agencies and stakeholders.
Source: Natural Resources Canada—Canadian Forest Service—Industry, Economics and Programs Branch 1999

SOC
IET
Y’S
RES
PON
SIBI
LIT
Y•
Sust
aina
bilit
y of
For
est
Com
mun
ities
99
ELEMENT OVERVIEW
Sustainable forest management is commonly dividedinto three components: environmental sustainability,economic sustainability and social sustainability. Thiselement focuses on the latter two. Because of the highcost of transporting raw materials from the woodlandsto the mill, processing facilities for the forest industryhave traditionally been built in rural areas close to thefibre source. This has meant that many communitieshave a high dependence on the forest sector for theirwell-being and even their survival. Communities with ahigh dependence on a single sector of the economy,whose fortunes are often beyond their control, arevulnerable to sudden economic shocks. Changes in thecommunity’s economic well-being may also influenceits social conditions.
The identification of communities at risk for suddeneconomic shocks because of changes in timber supplyor altered forest conditions is a first step in helpingpolicy makers develop prescriptions to assist thosecommunities in difficult times, and more importantly,to enhance their long term well-being. Indicator 6.3.1describes the national distribution of 298 communitiesin Canada that are dependent on the forest sector for atleast 50% of their economic base.
Because economic diversification can contribute toregional economic stability, it is an importantindicator of the sustainability of forest communities(Indicator 6.3.2). An index of diversity of the localindustrial base can be used to give additionalinformation about the effects of market forces onforest-dependent communities.
Forests have a variety of purposes at the communitylevel (Indicator 6.3.3). In addition to the use of woodas raw material for processing, craft products and othernon-timber products can be harvested by local citizens,as can food for subsistence purposes. The forests can beused for recreation by some people, and as a source ofspiritual strength by others. Three case studies illustratehow some forest communities have diversified.
INDICATOR REPORTS
NUMBER OF COM-MUNITIES WITH ASIGNIFICANTFORESTRY COMPONENT IN THE ECONOMIC BASE
Figure 6.3a describes the number offorest-dependent communities inCanada by province. Censusinformation (Statistics Canada 1998)was used to estimate the number ofcensus subdivisions (CSDs) in Canadawith at least 50% of their economicbase in the forest industry. Theeconomic base can be described as theincome received by employees ofindustries that bring money into theeconomy from outside. For example, asawmill sends most of its product outsidethe community, while the money for thatproduct enters the local economy through themill and its workers. People receiving all of theirincome from government transfers (pension plans,unemployment assistance, welfare) are included in theeconomic base as those funds are generated outside thecommunity. Using this methodology, 298 of the 5 248CSDs in Canada for which data are available were foundto have a forest industry component of 50% or more intheir economic base.
With this level of dependence on the forest sector, theimportance of practising sustainable forestmanagement is evident. While sustainable forestmanagement cannot protect these communities fromdownturns caused by market forces, it can ensure thata steady flow of timber and other products and servicesfrom the forest are available to benefit local citizens.
6.3.1
ELEMENT 6.3SUSTAINABILITY OF FORESTCOMMUNITIES
Aboriginal andTreaty Rights
Participation byAboriginal
Communities
Sustainabilityof Forest
Communities
Fair and EffectiveDecision-Making
InformedDecision-Making
SOCIETY'SRESPONSIBILITY
6.3.2
6.3.1
6.3.3

SOC
IET
Y’S
RES
PON
SIBI
LIT
Y•
Sust
aina
bilit
y of
For
est
Com
mun
ities
100
While the focus of much work on forest dependencyhas been in identifying communities that rely on theforest industry as their primary source of wealth, otherrural and remote communities depend on the forests toattract visitors or for subsistence purposes (Beckley1998, Korber et al. 1998). Although these uses aremore difficult to quantify than industrial dependence,they are a crucial aspect of sustainable forestmanagement. Work is underway to provide details onrecreational- and subsistence-dependent economies.The inclusion of these types of forest dependencewould increase the number of communities in Canadareported as having a significant forestry component intheir economic base.
INDEX OF THE DIVERSITY OFTHE LOCAL INDUSTRIAL BASE
Indicator 6.3.1 and Indicator 6.3.2 are linked. Ratherthan measuring the percentage of the economic baseassociated with forestry, this indicator provides an indexnumber from one of several methods available in theregional science literature. Tracked over time, thismeasure can identify trends that may not be evidentfrom simply determining the number of forest-dependent communities. For example, if the number offorest-dependent communities is constant or increasingwhile the index of diversity is dropping, it could mean
that communities are becoming less diverse andpotentially more vulnerable to market shocks. Likewise,a decline in the number of forest-dependentcommunities accompanied by an increase in the index ofdiversity could signal that although forests are beingsustainably managed, communities are diversifying theireconomies to protect themselves against market changes.
Work is underway to produce an index of diversityfor each forest-dependent census subdivision.
DIVERSITY OF FOREST USE ATTHE COMMUNITY LEVEL
Indicator 6.3.3 is reported through three case studiesof diverse forest use at the community level.
Case Study 1 Wikwemikong Community,Ontario
Wikwemikong Unceded Indian Reserve encompassesapproximately 42 600 hectares on the eastern end ofManitoulin Island (the world's largest freshwaterisland). The population is approximately 2 500, mostof whom reside in the village of Wikwemikong.
By the 1990s, logging had depleted the forests of theWikwemikong Reserve. Timber cutting was largelyuncontrolled and unrecorded. Repeated "high-grading"operations resulted in an immature, low-value forestdominated by poor quality trees. A sawmill operationwas started and failed because the community did notclearly understand the forestry market. A dozenindividuals employed seasonally generated revenues of$250 000 per year by harvesting low quality pulpwood.
In 1989 the Wikwemikong Development Com-mission developed a 20-year forestry managementplan and a complementary 5-year operating plan toprovide a framework for establishing policies andregulations aimed at ending unregulated timberharvesting and encouraging sustainable forestry whileproviding long-term benefits to the community. In1992, the Ontario government chose theWikwemikong Unceded First Nation as one of onlyfour Community Forest Pilot Projects (OntarioRound Table on Environment and Economy 1995,Harvey 1995) because the reserve was committed tocommunity-based and controlled forestry. Three yearsof project funding supported the community's effortsto design a comprehensive new forest management
6.3.3
6.3.2
Source: Natural Resources Canada—Canadian Forest Service 2000
Forest-dependent communities by province
FIGURE 6.3a
Number of communities0 20 40 60 80 100 120
NF
PE
NS
NB
QC
ON
MB
SK
AB
BC

SOC
IET
Y’S
RES
PON
SIBI
LIT
Y•
Sust
aina
bilit
y of
For
est
Com
mun
ities
101
plan. This plan uses silviculture to increase the qualityand quantity of the forest and the timber available forharvest, takes into account wild plants and animals aswell as traditional forest products, and supportsmultiple forest uses including the harvest of naturalmedicinals, forest-based recreation, tourism, naturereserves, wildlife refuge areas and no-cut areas. Atimber resource policy was subsequently approved bythe band in 1993 to monitor and control harvestingpractices on the reserve. A community forest trustfund was established, and an updated forest resourcesinventory was completed in support of implementingsustainable forest management practices. In 1995Wiky Forest Products was established as a centraltimber purchasing, processing and marketing outletfor the Wikwemikong community.
A high level of community involvement has been keyto the overall success of this program. Between 1992and 1996, more than 500 000 trees were planted by theOntario Ministry of Natural Resources on reservelands, with a goal of planting an additional 1 millionover the next 5 years, and of establishing a local treenursery to support the planting program. TheWikwemikong forest is used for many non-commercialpurposes, including the collection of medicinal andceremonial plants, raw materials for crafts, and berrypicking, as well as forest-based recreation, spiritualvalues, hunting and fishing, and fuel wood harvest.Commercial harvest operations on the reserve currentlyproduce pulpwood, small dimension lumber, fencing,pallet and pre-cut material. There are now approxi-mately 150 people employed in Wikwemikong's forestoperations (harvesting, scaling, silviculture andfirefighting), generating approximately $2 million inrevenues annually. A new community-owned companyhas constructed many log homes and buildings, bothinside and outside the Wikwemikong community.Profits from commercial forest operations go back tothe community-owned company to be reinvested onbehalf of Wikwemikong in stand restoration andimprovement of silviculture and in multiple-usecommunity forest development.
Case Study 2 Fort Providence,Northwest Territories
Fort Providence is located on the northeast bank of theMackenzie River approximately 75 kilometres from themouth of Great Slave Lake. Fort Providence is
populated by approximately 600 Dene, Metis and non-Aboriginal people. Dene and Metis residents stillpractise traditional trapping and hunting lifestyles andparticipate in the wage economy. The traditional usearea of the Aboriginal community covers an estimatedarea of 53 000 square kilometres.
In August 1998, the Fort Providence ResourceManagement Board completed the first phase of atraditional land use (TLU) study in which land-usetyping and mapping were conducted. Tables 6.3a-6.3eprovide summaries of residents’ forest use based on thisfirst phase of data gathering (Bonnetrouge andCampbell 1999).
Although the TLU study results show activity typeand average area used, it should be noted that forest-useoverlap occurs (i.e., one area may be used for more thanone forest activity).
TABLE 6.3a Species hunted and trapped in Fort Providence
Species Species hunted for trapped personal usecommercially
Beaver Bison
Ermine Caribou
Red fox Grouse
Lynx Moose
Marten Porcupine
Mink Hare
Muskrat Squirrel
Otter Waterfowl (goose and duck)
Hare
Red squirrel
Wolf
Wolverine
Source: Government of the Northwest Territories 1995-1999
TABLE 6.3b Fishing in Fort Providence
Method Number of peoplewho fish
Ice fishing 26
Setting of nets 50
Fishing by rod 44
Shellfish collecting 5
Source: Government of the Northwest Territories 1995-1999

SOC
IET
Y’S
RES
PON
SIBI
LIT
Y•
Sust
aina
bilit
y of
For
est
Com
mun
ities
102
The Deh Gah Got’ie Betterment Corporation wasformed to address economic development in thecommunity. The Betterment Corporation is directed bythree Dene and three Metis board members and consistsof retail, general contracting, real estate, tourism,natural resources and manufacturing divisions.
Fort Providence is a partner in the InternationalCrown Fire Model Experiment, which also involvesNASA, the Canadian Forest Service, provincialgovernments, international researchers, theGovernment of the Northwest Territories and otherlocal communities. The project investigates variousaspects of forest fires, including crown fire developmentmodelling in black spruce–jack pine stands, carbon andgreenhouse gas cycling in wildfires, equipment researchand structural protection.
The Fort Providence Resource Management Boardsubmits yearly prescribed burn proposals to theDepartment of Resources, Wildlife and EconomicDevelopment. The main objective of the prescribedburn activities is to enhance wood bison habitat. Asecondary objective, where applicable, is to reduce thefire hazard in grasslands as a community protectionstrategy. Prescribed burning supports the vitality ofwood bison populations (currently estimated at 1 900animals), reduces the risks of range deterioration anddensity-dependent disease outbreaks, and produces newfeeding areas. This project was initiated in 1993 with anaverage of 10 000 hectares being burned annually in theMission, Bluefish, Moose and Deep Bay Prairies.
TABLE 6.3c Harvesting and gathering inFort Providence
Type of harvesting Number of Average areaand gathering areas identified utilized (ha)
Cranberries 16 216
Waterfowl egg N/A* 642collecting
Dry wood 60 229
Green wood 21 814
Medicinal plants 11 256
*N/A: Information not available.
Source: Government of the Northwest Territories 1995-1999
TABLE 6.3d Travel and building sites in Fort Providence
Site Number Cabins 16
Camp and tent sites (gathering) 7
Historic trails 28
Travel routes 84
Source: Government of the Northwest Territories 1995-1999
Case Study 3 Geraldton Community Forest, Ontario
Geraldton is a small community in northern Ontariowith a population of approximately 3 000. Originallyestablished as a mining town, the local economy has sinceshifted to a forestry base because of the closure of the localmines. With declining employment in the forest sectorand uncertain economic prospects, the town ofGeraldton began looking for new and innovativesolutions to ensure its long-term economic future.Working with the Conservation Council of Ontario, itundertook a feasibility study for a Geraldton CommunityForest, involving local management of the public-ownedresources in the forest surrounding the town. Theapproaches recommended for this initiative favouredintensive forest management and stand improvementpractices, along with support for tourism and value-addedbusinesses, within a sustainable forest managementcontext. The community forest approach gained widesupport, and in 1992 Geraldton was chosen by theOntario Ministry of Natural Resources as a CommunityForest Pilot Project site (Ontario Round Table onEnvironment and Economy 1995, Harvey 1995).
The Geraldton Community Forest includes sevengeographical townships, with an area of approximately65 000 hectares, and the Town of Geraldton locatedroughly in the centre. The forest is located entirelywithin the Boreal Forest, with black and white spruce,jack pine and balsam fir being the dominant coniferspecies, and trembling aspen and white birch being theprimary hardwood species. The area has a shortgrowing season and harsh continental climate. Soilsconsist primarily of stony but productive sandy till,with depths from no soil on exposed bedrock to fivemetres in less broken topography. Seventy-five percentof the area is productive forest, and 12.5% is classifiedas water and islands.
The Geraldton Community Forest Inc. wasestablished as a non-profit corporation in 1994 with

the goal of creating an "economically sustainablecommunity through community management of allnatural resources using sustainable ecosystemapproaches and environmentally sound practices."Specific objectives include:
1. Demonstrating and evaluating the viability ofintensive forest management in a relatively small,community-centred boreal forest area;
2. Increasing community self-sufficiency throughlocal management of local resources;
3. Demonstrating the value of holistic, integratedforest management practices in producing multipleoutputs;
4. Improving silviculture practices and the quality andyield of timber and wood fibre;
5. Identifying and pursuing forest resource-basedeconomic diversification opportunities;
6. Creating local employment and business opportu-nities;
7. Supporting the development of a biomass-fueleddistrict heating facility;
8. Providing forest ecosystem educational andmanagement training opportunities;
9. Establishing a forestry training centre;
10. Providing community cultural development; and,
11. Establishing Geraldton as a model regional centrefor sustainable development.
Despite such far-ranging objectives, the GeraldtonCommunity Forest initiative seems to have achievedmost of the goals set out for it almost a decade ago(Geraldton Community Forest Inc. 1999). A DistrictHeating Facility to heat the hospital and schools hasbeen constructed, fueled by wood waste from localsawmills. In 1994 Geraldton Community Forest Inc.assumed management responsibility for MacLeodProvincial Park, which had been closed by the provinceas a cost-cutting measure. Local snowmobile trails havebeen developed. The Community Forest organizationhas successfully undertaken, and continues to carry out,a number of intensive forest resource managementprojects, with a current emphasis on forest-fire fighting,tree planting, training, pre-commercial thinning,commercial thinning, slash pile burning, and prescribedburn plan preparation. A number of other projects havealso been successfully implemented within thecommunity forest to look at intensive silviculturaltreatments and to determine the operational costsinvolved. A seven-hectare research site has been set up inthe Geraldton Community Forest to study the long-term nutrient dynamics of full-tree logging practices. Ademonstration forest developed as a local touristattraction includes trails used for cross-country skiing. Alocal eco-trail has also been designed and constructedfor forest interpretive purposes as well as for use as afitness trail by local residents.
SOC
IET
Y’S
RES
PON
SIBI
LIT
Y•
Sust
aina
bilit
y of
For
est
Com
mun
ities
103
TABLE 6.3e Trapping summaries for Fort Providence
Species Number of animals trapped per year
1995-1996 1996-1997 1997-1998 1998-1999
Wolf 14 42 16 6Beaver 132 235 164 47Ermine 13 15 31 20Red fox 13 27 24 7Lynx 71 179 162 140Marten 347 581 526 448Mink 43 55 40 14Otter 0 1 0 1Muskrat 41 44 116 17Black bear 0 1 0 0Red squirrel 38 38 195 13Coyote 0 0 1 0Total animals trapped 712 1 218 1 275 713Number of trappers 62 79 65 53
Source: Government of the Northwest Territories 1995-1999

SOC
IET
Y’S
RES
PON
SIBI
LIT
Y•
Sust
aina
bilit
y of
For
est
Com
mun
ities
104

ELEMENT OVERVIEW
In Canada, public participation in forest managementis increasingly viewed as a critical element of sustain-ability. Canadians continue to demand a greater voicein forest management, particularly on public land.Element 6.4 assesses the degree to which the demandfor greater public input is being met by public andprivate institutions, and the mechanisms that are beingused for public consultation.
Government agencies across Canada have adoptedthe consultative approach to developing forest policyand they routinely seek public opinion and workclosely with forest industries, Aboriginal groups andenvironmental organizations to incorporaterecreational, social, biodiversity and economic valuesinto forest management planning and decision making.
British Columbia’s strategic land use planning andtimber supply reviews during the 1990s involvedsystematic and substantive efforts to engage the public.Nova Scotia recently held a public comment process fortwo sets of regulations under the Nova Scotia Forests Act.New Brunswick witnessed tremendous interest andparticipation in public involvement opportunities on aproposed protected areas strategy in 1999. In Ontario,public participation in land use and forest managementplanning is routine and legally prescribed. All forestmanagement plans require extensive publicinvolvement. The recent Lands for Life land useplanning initiative involved thousands of citizens fromall parts of Ontario. Alberta’s Forest ConservationStrategy and Special Places 2000 programs canvassed thepublic on future land management, while the ForestLegacy initiative reaffirmed Alberta’s commitment toinnovative public involvement practices. In 1998,Quebec undertook a major review of its forestmanagement system, including a public consultationthat resulted in the submission of more than 500 briefsby stakeholder groups. Subsequent amendments toQuebec’s Forest Act (Bill 136) are currently underpublic review. These provincially sponsored effortscontinue across the nation.
While assessments may be made ofindividual processes that provide opportu-nities for public involvement, it is notpossible to provide qualitative measuresof public participation at the nationallevel. A survey was conducted todetermine the types of publicinvolvement mechanisms employed bylarge licence holders on public lands,and who is involved in designingthem. These companies manage thetimber on millions of hectares ofpublicly owned forest and thereforerepresent the frontline of forestmanagement. They are in the bestposition to incorporate public inputinto forest management plans. Theland area under licence to the 63companies that responded to the surveycovers more than 54 million hectares.
Indicator 6.4.1 outlines the role of thepublic in designing public involvementmechanisms in order to ensure thatappropriate mechanisms are used and thatthe public is involved at the proper stages ofthe planning process. The assumption is thatthose participating in consultation processes shouldhave some say in how their opinions are solicited.Survey results indicate that many companies do involvethe public in the design of public involvement processes.
The type of public involvement tool and the nature ofthe information sought is discussed in Indicator 6.4.2.Of the eight consultation mechanisms specified in thesurvey, five are used by more than 50% of respondentsfor their annual operating plans. For long-termplanning, companies tend to use public involvementtools even more. Companies seek input on a wide rangeof issues from the location of harvest blocks to overallmanagement goals. They rarely ask for outrightexpressions of support or opposition to their plans.
Indicator 6.4.3 is reported through a case studydescribing how the management planning process,developed in a model forest, has incorporated partici-pation by the public in forestry issues.
ELEMENT 6.4FAIR AND EFFECTIVE DECISION-MAKING
SOC
IET
Y’S
RES
PON
SIBI
LIT
Y•
Fair
and
Effe
ctiv
e D
ecis
ion-
Mak
ing
105
Aboriginal andTreaty Rights
Participation byAboriginal
Communities
Sustainabilityof Forest
Communities
Fair and EffectiveDecision-Making
InformedDecision-Making
SOCIETY'SRESPONSIBILITY
6.4.1
6.4.2
6.4.3

INDICATOR REPORTS
DEGREE OF PUBLIC PARTI-CIPATION IN THE DESIGN OFDECISION-MAKING PROCESSES
The Canadian Forest Service conducted a survey oflarge licence holders to determine who is involved inthe selection or design of mechanisms for measuringpublic involvement. The intent was to identify the levelto which the public or stakeholder groups influencethese processes relative to other parties such as thecompanies themselves, provincial governments,consulting firms, local government and academics. Inmost cases, the companies surveyed hold an area—rather than a volume-based licence—although there aresome exceptions, notably in British Columbia. In total,138 surveys were distributed and 63 were returned, foran overall response rate of 46%.
The degree to which companies involve the public inthe design of public involvement processes issometimes dictated by the processes themselves. Forexample, solicitation in various media is a requiredpractice of some licence holders. There are usuallyprovincial guidelines on how to solicit stakeholder
input through public registries, and therefore the needfor public involvement in the selection or design ofsuch a process would be expected to be low. On theother hand, public involvement in the design orselection of community or face-to-face meetings withindustry would be expected to be higher.
The column in bold type in Table 6.4a demonstratesthe degree to which the public is involved in the designor selection of the various mechanisms under review.The percentages are calculated based on the number ofrespondents that confirmed use of a given method.Since not all companies use all methods, the number ofresponses varies for each strategy.
The survey results suggest that there is room forimprovement in processes for involving the publicin land management and planning activities.Corporate managers often express frustration withparticipation levels for community meetings oropen houses, and yet only one third of companiesinvolve the public in designing or selecting suchprocesses. Research is currently underway inCanada’s model forests to determine which publicinvolvement mechanisms for forest managementand planning are preferred by Canadians.
6.4.1
SOC
IET
Y’S
RES
PON
SIBI
LIT
Y•
Fair
and
Effe
ctiv
e D
ecis
ion-
Mak
ing
106
TABLE 6.4a Stakeholder involvement in the selection or design of public participation mechanisms
Percent responses to the question “Who is involved in the selection of public involvement tools?”
Tool Company Provincial Stakeholders or Other (paid staff government members of the professionals,
staff public university staff)
Open houses 93 49 29 6
Stakeholder 78 65 67 20advisory groups
Meetings with 9 25 26 7individuals or individualinterest groups
Community meetings 93 39 34 12
Solicitations for 75 55 22 10public comment
Surveys of user groups 63 21 11 37
Focus groups 84 47 47 16
Formal public hearings 67 58 33 8
Source: Beckley et al. 1999

TABLE 6.4b Public involvement methods used in forest management planning by licence holders on public lands
TOOL ANNUAL MID/LONG-OPERATING TERMPLANS PLANS% using method % using method
Meetings with individualsor interest groups 93 88
Stakeholder advisory groups 78 83
Solicitations for public comment 70 78
Open houses 62 75
Community meetings 56 75
Focus groups 20 30
Surveys of user groups 16 23
Formal public hearings 2 12
Source: Beckley et al. 1999
DEGREE OF PUBLIC PARTICIPA-TION IN DECISION-MAKINGPROCESSES
Table 6.4b shows that of the eight mechanismsspecified in the survey, five are employed by more than50% of respondents for annual operating plans(AOPs). By definition, long-term plans are developedless frequently than AOPs, and often involve moreeffort and resources on the part of companies. Thefindings for public involvement methods used for mid-to long-range plans were very similar to the results forAOPs, except that every mechanism but one (meetingswith individuals or individual interest groups) was citedmore frequently for long-term plans. This confirmsthat these involve more comprehensive publicinvolvement efforts.
In addition to asking licence holders to describe theirpublic involvement tools, the survey asked about thetypes of information they solicit from the public for
6.4.2
SOC
IET
Y’S
RES
PON
SIBI
LIT
Y•
Fair
and
Effe
ctiv
e D
ecis
ion-
Mak
ing
107
TABLE 6.4c Type and use of information solicited by large licence holders through public involvement processes
Type of information Annual Operating Plans Mid/Long-Term PlansYes Yes
(% respondents) (% respondents)
Location of harvest blocks 84 74
Location of non-timber 84 86activity areas (ski, snowmobile,all-terrain vehicle trails)
Location of roads for 84 79accessing timber
Size of harvest blocks 73 70
Areas for protection 69 83
General expressions of 53 81public forest values
Overall management 53 90goals or priorities
Mitigation strategies 51 60
Volume of fibre removed 47 47per unit area
Location of non-timber 33 54product areas (berries, medicinals)
Tabulation of those in favour of or 16 17opposed to the plan
Source: Beckley et al. 1999

both short-term and medium- to long-term plans. Theresults are presented in Table 6.4c.
The survey did not attempt to evaluate the quality ofthe information received from the public, nor thedegree to which the licence holders modified theirplans to address public concerns. The results indicate,however, that in addition to harvesting issues, licenceholders solicit the public on a wide range of issues,including protected areas, non-timber products andactivities and overall management activities.
DEGREE OF PUBLIC PARTICIPA-TION IN IMPLEMENTATION OFDECISIONS AND MONITORINGOF PROGRESS TOWARD SUSTAINABLE FOREST MANAGEMENT
As evidenced by the increase in public participation inforest management, many of the major managementissues facing foresters and scientists are largelyinfluenced by socio-economic factors rather than byadministrative and technical aspects (MacLean et al.1999). Information regarding how well managementplans incorporate public input—and actually useinformation provided by the public— to improve forestmanagement practices is not available at the nationallevel. Indicator 6.4.3 is reported through a case studyexamining the development and implementation of asustainable management planning process in the FundyModel Forest (MacLean et al. 1999).
Canada’s Model Forest Program was initiated in 1992to develop approaches to forest management thatintegrate economic, social and environmentalobjectives. There are presently 11 model forests inCanada, representing all of the country’s major forestregions and their unique socio-economic conditions(refer to text box on p. 110).
Case Study Sustainable forest manage-ment planning in the Fundy Model Forest
Fundy Model Forest (FMF) is a 420 000-hectareworking forest located in the Atlantic Maritimeecozone in southeastern New Brunswick. The landownership is diverse: 63% private woodlots; 15%publicly owned land; 17% industrial freehold land and5% national park. In addition to these landowners, theFMF partnership includes the participation of over 25other organizations.
Two of the four original objectives of the FMF relateto the development of a process for producing amanagement plan to achieve the goal set for each forestvalue of interest and to specify the specific treatmentsthat are to be implemented.
The FMF partnership has developed a seven-stepsustainable forest management planning process (Table6.4d). The process used a “what if ” scenario-planningapproach applied to approximately one quarter of theFMF land base (Figure 6.4a). Scenario planning is astructured process for strategic planning that is based
6.4.3
SOC
IET
Y’S
RES
PON
SIBI
LIT
Y•
Fair
and
Effe
ctiv
e D
ecis
ion-
Mak
ing
108
FIGURE 6.4a Scenario-planning approach used in forest management planning in Fundy Model Forest
Source: MacLean et al. 1999
Best ManagementPractices
Criteria andIndicators Process
Case Study Process
Fundy Model ForestManagement Plan
Public InputIssues
ScenarioPlanning
"What If?"
Concerns
Values/Objectives
Measures
Monitoring
114 000 ha
Full land base

on imagining possible futures. It has been particularlyeffective when applied to the evaluation of publicconcerns and contentious issues. A scenario-planningapproach often consists of a series of workshopsinvolving land managers, interest groups, stakeholdersand the public. This approach serves to identify publicand interest group issues and formulate them into aseries of scenarios to be evaluated for the land base inquestion. While scenario planning relies heavily on theexpertise, creativity and insight that individuals bringto the planning table, the process can be enhancedwhen the scenarios are portrayed using a variety ofcomputer models. By consensus, one or a few preferredscenarios are identified through evaluation. Thepreferred management scenarios are conveyed to landmanagers for implementation.
This planning approach was used to define 25scenarios determining effects of alternative means ofriparian strip management, road construction,vegetation and insect control, harvesting, maintenanceof biodiversity and plantation establishment. Througha series of workshops, the FMF partnership wassuccessful in reaching consensus on a set of “preferred”management scenarios.
While the partnership may influence decisions, it isnot a landowner and therefore has no managementauthority. However, the landowners are generallyinvolved and endorse the planning process and apply itto their own holdings. This has indeed happened inFMF, with the industrial owners and the National Parkusing the forest management objectives on their landboth inside and outside of the area in question. Theresult is the FMF’s planning process being applied to anarea three times its size. Ideally this planning processwill be adopted by all landowners.
The FMF process has not yet reached on-the-groundimplementation, which is the next step.Implementation is more readily achieved on privateland because management decisions on publicly ownedland must coincide with iterations in the governmentplanning cycle.
Monitoring and evaluation, the final steps in theplanning process, determine whether the chosenstrategy is being implemented as planned and is havingthe desired effects. Although the FMF has not yetreached this stage, local level criteria and indicators ofsustainable forest management are being developed and
implemented for monitoring, evaluation and reporting.The model forest has adopted the definition ofsustainable forest management endorsed by theCCFM, using the six criteria as the framework fordeveloping its own suite of indicators. Periodicreporting to the FMF partnership on the status ofindicators and planned-versus-actual monitored levelsis envisioned.
Functionally linking indicators to forest structuralcharacteristics allows them to be projected into thefuture as part of the management plan formulation,and to be monitored. A scientific evaluationcomponent to test and improve assumptions and data,and thereby reduce uncertainty in future planningreiterations via adaptive management, is also required.Scenario planning and forecasting of the indicators overtime will enable landowners to evaluate and implementa local indicator set. Through the indicators process,the FMF partnership will have direct input into thevalues and objectives incorporated into landownermanagement plans.
TABLE 6.4d The Fundy Model Forest planning process
STEP PURPOSE
Identify forest Basis for setting objectivesobjectives/values
Identify treatment Define actions to considertactics
Assemble Forecasts of forest changeinformation andmanagement tools
Analysis of Explore options, outcomes,strategies tradeoffs
Decision making Select strategy to implement
Implement on the Talk becomes actionground
Monitor/Evaluate Forest effects as expected?
Source: MacLean et al. 1999
SOC
IET
Y’S
RES
PON
SIBI
LIT
Y•
Fair
and
Effe
ctiv
e D
ecis
ion-
Mak
ing
109

SOC
IET
Y’S
RES
PON
SIBI
LIT
Y•
Fair
and
Effe
ctiv
e D
ecis
ion-
Mak
ing
110
THE ROLE OF CANADA’S MODEL FOREST PROGRAM IN THE DEVELOPMENTOF LOCAL LEVEL INDICATORS OF SUSTAINABLE FOREST MANAGEMENT
The pursuit of sustainable forest management requires the monitoring of effects resulting from
management practices and activities. Criteria and indicators such as the national CCFM C&I and interna-
tional Montréal C&I processes allow for the measurement of progress on a national scale. Local level
indicators, which are developed to suit local and regional conditions, provide the framework for
monitoring on-the-ground changes and assessing their influence on the many components of sustainable
forest management.
A model forest is a place where sustainable forest management practices are developed and tested on
local forest areas and then shared across the country. At the heart of each model forest is a group of
partners having different perspectives on the social, economic and environmental dynamics within their
forest—perspectives that are necessary to make more informed and fair decisions about how to manage
the forest.As a common starting point, each model forest utilized the six criteria for sustainable forest
management defined by the CCFM C&I framework.
From state of the forest reporting to predicting future forest condition through computer
modelling, model forests are putting their local level indicators to work. For more information on
these and other model forest activities, please refer to its Web site (http://www.modelforest.net).
LONG BEACHModel Forest
McGREGORModel Forest
FOOTHILLSModel Forest
PRINCE ALBERT
Model Forest
MANITOBAModel Forest
LAKE ABITIBIModel Forest
WASWANIPI CREEModel Forest
EASTERN ONTARIOModel Forest
NovaForest Alliance
FUNDYModel Forest
BAS-SAINT-LAURENT Model Forest
WESTERNNEWFOUNDLAND
Model Forest
CANADIAN MODEL FOREST NETWORK

ELEMENT OVERVIEW
Informed decision making refers to the quality ofinformation that goes into forest management. Asforest management has undergone transitions fromsingle-species, single-objective management tomultiple-species, multiple-objective management totoday’s complex ecosystem management, theinformation requirements have increased dramatically.Today, in addition to drawing on traditional disciplinessuch as forestry and ecology, forest managementrequires information from such diverse areas asengineering, geomatics, hydrology, genetics, sociologyand economics. Fortunately, personal computers,geographic information systems, global positioningsystems and other technological developments allowforesters to manage the flow of information. Thecollection and assessment of such diverse data providefor greater understanding of forest ecosystems and thecommunication of forest sustainability to the public.
Virtually all public forest land in Canada has beeninventoried for two or more attributes (Indicator4.4.4). The survey discussed in Element 6.4 alsoquestioned large licence holders on public forest landabout the types of information they maintained andcarried in their inventory databases (Indicator 6.5.1)and the extent of coverage for each of 29 attributes.
Given the importance of forests to the health of theentire planet, responsibility for sustainablemanagement must extend beyond Canada’s borders.Expenditures in international forestry (Indicator 6.5.5)is an indicator of informed decision making andsociety’s commitment to sustainability. Canada isworking with other nations to resolve global issues suchas deforestation and to provide for more informeddecision making in the management of all the world’sforests. In addition to funding forest programs indeveloping countries, Canadians are contributing toworldwide efforts to promote a common internationalframework for sustainable forest management.
INDICATOR REPORTS
PERCENTAGE OFAREA COVERED BYMULTI-ATTRIBUTERESOURCE INVENTORIES
Virtually all public forest land has twoor more attributes inventoried(Indicator 4.4.4). The survey of largelicence holders covered an arearepresenting 54 million hectares ofCanada’s productive forest land. Onehundred percent of the area surveyedis covered by multiple attributeresource inventories.
The responses of forestry companiesto survey questions concerning theirinventory databases are described in Table6.5a. Not surprisingly, the most popularinventory attributes are those most closelyconnected with the business of growing andharvesting trees. More than 70% of forestcompanies surveyed said that they maintain data onspecies type, age class, access, volumes per hectare,land cover, and a few other variables (silviculturehistory, topography, location of protected areas, bodiesof water/wetlands) for 100% of the land that theymanage. Between 5% and 20% of respondents saidthat they do not maintain data on those specificattributes, but that such data are available elsewhere.Very few indicated that they had no access to data onthese attributes.
Some of the least common attributes or inventoryitems include wildlife travel corridors, habitat ofthreatened or endangered species, wildlifereproduction areas and feeding or resting sites forwildlife. Although companies may not have much datafor these attributes, other agencies or institutions(usually provincial governments) often do. Among theattributes for which companies do not maintain muchdata and for which few other agencies hold data arevegetation other than trees, oil and gas activity, andsoil productivity.
6.5.1
ELEMENT 6.5INFORMED DECISION-MAKING
SOC
IET
Y’S
RES
PON
SIBI
LIT
Y•
Info
rmed
Dec
isio
n-M
akin
g
111
Aboriginal andTreaty Rights
Participation byAboriginal
Communities
Sustainabilityof Forest
Communities
Fair and EffectiveDecision-Making
InformedDecision-Making
SOCIETY'SRESPONSIBILITY
6.5.1
6.5.5

SOC
IET
Y’S
RES
PON
SIBI
LIT
Y•
Info
rmed
Dec
isio
n-M
akin
g
112
TABLE 6.5a Percentage of area covered by multiple attribute resource inventories maintained by companies surveyed
Percent of area inventoried within the last 15 years
Attributes 100% 75–99.9% 50–74.9% 25–49.9% 1–24.9% 0% Others*
Land cover 80 5 3 0 2 2 9
Forest type 79 7 3 0 0 2 10
Age classes 74 5 1 0 5 3 11
Water bodies/wetlands 74 8 0 2 0 2 15
Timber volume per hectare 73 6 3 2 8 2 6
Logged areas/harvest history 73 13 0 2 2 2 10
Protected areas 72 3 0 0 7 0 18
Silviculture/renewal history 71 11 0 0 6 2 10
Accessibility/road networks 70 15 2 5 3 0 5
Topography 70 5 2 2 2 3 17
Burned areas/fire history 67 10 5 2 2 0 15
Recreational sites 54 5 9 0 5 3 24
Buffers (riparian, roads, etc.) 54 10 2 5 14 7 8
Vegetation type 52 3 2 2 9 14 14
Ecologically significant areas 47 4 7 2 14 2 25
Watershed/hydrology 47 3 3 3 10 13 20
Oil and gas activity 45 6 0 0 4 28 17(seismic, pipelines, wells)
Fragmentation 43 15 2 0 2 21 25
Mines 43 0 4 0 5 18 30
Soil type 42 4 5 4 14 12 19
Riparian areas important 40 3 7 5 8 13 23to wildlife
Range land 40 0 0 2 4 21 33
Soil productivity 39 2 4 7 9 21 18
Recreational use 36 0 10 0 9 14 32
Vegetation other than trees 29 0 2 2 24 30 14
Feeding, resting or watering 22 2 3 7 23 10 33sites important to wildlife
Important reproduction 22 0 0 2 30 7 40areas for wildlife
Habitat of threatened 19 0 7 3 14 14 44or endangered species
Migratory or travel routes 5 4 2 0 18 30 41(birds, fish or animals)
*Inventory data on this attribute are not maintained but access to such data is available through another agency or institution.Source: Beckley et al. 1999

EXPENDITURE ON INTER-NATIONAL FORESTRY
As a leader in the development and application of newapproaches to sustainable forest management, Canadabelieves in the mutual benefits to be gained from thesharing of technology and expertise among the world’sforest nations. Several government agencies providefunding for forest programs in developing countries,promote sustainable forest management, and work tobuild international consensus on global forest issues.
Canada (Natural Resources Canada—CanadianForest Service [NRCan—CFS], the Department ofForeign Affairs and International Trade [DFAIT] andthe Canadian International Development Agency[CIDA]), along with 14 partner countries and withsupport from the Intergovernmental Forum on Forests(IFF) and the Food and Agricultural Organization(FAO), launched the Costa Rica—Canada Initiative toprovide a forum for countries and interested parties toexpress their views on the range of future options forsustainable management of all types of forests and toconsider possible elements of legally bindinginstruments. The findings from the Initiative wereconsolidated in December 1999 at a meeting hosted byCanada. The final decisions on this convention werereleased in a report in January 2000 (http://www.nrcan.gc.ca/cfs/crc).
Table 6.5b shows the expenditures on internationalforestry by three federal governmentdepartments/agencies for the fiscal years 1996-1998.The CIDA funds are spent on managing forests,maximizing the environmental potential for trees toenhance agricultural productivity, protecting soil andwater, providing basic needs, and helping local peopleto sustain their forests. The NRCan—CFSexpenditures include efforts to meet Canada’s interna-tional commitments and obligations with respect toforests, implementation of science projects indeveloping countries, analysis of trends, outlooks anddevelopments in international markets, andmaintaining and enhancing Canada’s trade in forestproducts. While the International DevelopmentResearch Centre (IDRC) does not have a forestryprogram, it provides the Secretariat for theInternational Model Forest Network and supportsprojects on sustainable development, such as land
rehabilitation, property rights and humandevelopment, that impact on forest issues.
In 1992, an international network of model forestswas created to foster cooperation and collaboration inthe advancement of management, conservation and thesustainable development of forest resources. Thenetwork includes several international model forestsestablished or under development in Canada, Mexico,Russia, the United States, Chile, Argentina, Japan andChina. A number of other countries have expressedinterest in developing model forests.
TABLE 6.5b Canadian expenditures on international forestry
Expenditures (million dollars)
1996 1997 1998Natural Resources 1.7 1.3 1.3Canada—CanadianForest Service a
Canadian Inter- 60.0 50.0 50.0national Develop-ment Agency b
International 5.0 5.0 5.0DevelopmentResearch Centre a, c
International 2.0 1.4 1.4Model ForestNetwork d
aInternational Model Forest Network not included.bInternational Model Forest Network included.cIDRC expenditures in natural resource management impacting directlyor indirectly on forestry are reported.dIncludes combined expenditures from CFS, CIDA, IDRC and DFAIT
Source: NRCan—CFS, CIDA, IDRC 1999
ReferencesBeckley, T.M.; Hirsch, B.H. 1997. Subsistence and
non-industrial forest use in the lower Liard Valley.Information report NOR-X-352. Natural ResourcesCanada—Canadian Forest Service—Northern ForestryCentre. Edmonton, AB. 42. p
Beckley, T.M. 1998. The nestedness of forest-dependence: A conceptual framework and empiricalexploration. Society and Natural Resources 11(2):101-120.
Beckley, T.M.; McAfee, B.J.; Barros, M.; Wesche, S.1999. A survey of large licence holders of public forestland in Canada. (Unpublished). Natural ResourcesCanada. 12 p.
6.5.5
SOC
IET
Y’S
RES
PON
SIBI
LIT
Y•
Info
rmed
Dec
isio
n-M
akin
g
113

Bonnetrouge, J.; Campbell, D. 1999. Personalcommunication.
Burkosky, T.M., Beckley, T.M. 1997. Opportunitiesand constraints regarding subsistence harvesting byAboriginal peoples in Canada. (Internal document).Natural Resources Canada.
Canada, House of Commons. 1990. Forests ofCanada: The federal role. Report of the StandingCommittee on Forestry and Fisheries. Queen’s Printer,Ottawa, ON.
Department of Indian Affairs and NorthernDevelopment—Indian Land Registry System. 1999.Number of Indian reserves. Ottawa, ON.
Forest Stewardship Council. 1999. FSC Principlesand Criteria. [online]. http://www.fscoax.org/html/1-2.html Accessed March 2000.
Geraldton Community Forest Inc. 1999. GeraldtonCommunity Forest Inc. [online]. Available:http://www.cancom.net/~comfor/index.html AccessedFebruary 2000.
Government of Canada. 1982. Constitution Act.[online] http://www.solon.org/Constitutions/Canada/English/ca_1982.html Accessed February 2000.
Government of the Northwest Territories. 1995-1999. Diversity of forest use at the community level: Acase study on Fort Providence. Department ofResources, Wildlife and Economic Development.
Harvey, S. 1995. Ontario Community Forest PilotProject Lessons Learned 1991-1994. Ontario Ministryof Natural Resources, Sault Ste. Marie, ON. 71 p. +appendices.
Korber, D. 1997. Measuring forest dependence:Implications for Aboriginal communities. M.Sc.Thesis. Department of Rural Economy. University ofAlberta. Edmonton, AB.
Korber, D.; Beckley, T.M.; Luckert, M.; White, W.1998. Cultural, geographical and sectoral refinementsto measures of forest industry dependence. CanadianJournal of Forestry Research 28: 1380-1387.
MacLean, D.A.; Etheridge, P., Pelham, J.; Emrich, W.1999. Fundy Model Forest: Partners in sustainable forestmanagement. The Forestry Chronicle 75: 219-227.
Natural Resources Canada—Canadian ForestService—Industry, Economics and Programs Branch.1999. Survey. (Unpublished).
Natural Resources Canada—Canadian ForestService, Canadian International Development Agency,International Development Research Centre. 1999.Financial records.
Natural Resources Canada—Canadian Forest Service.2000. Socio-economic Network. (Unpublished).
Ontario Round Table on Environment andEconomy. 1995. Sustainable CommunitiesResource Package. Ontario Ministry ofEnvironment and Energy. Toronto, ON. [online].http://www.web.net/users/ortee/scrp/30/33quads.htm#SUCCGERALD Accessed February 2000.
Statistics Canada. 1998. Canada Census 1996.Ottawa, ON.
SOC
IET
Y’S
RES
PON
SIBI
LIT
Y•
Info
rmed
Dec
isio
n-M
akin
g
114

115
CO
NC
LUSI
ON
S
Canada’s efforts to report on progress toward the sustainable management of forests began in earnest in1995 with the identification of a framework of criteria and indicators (C&I) by the Canadian Council ofForest Ministers (CCFM). In 1997, Criteria and indicators of sustainable forest management in Canada:
Technical report, reviewed the data available and described the capacity to report on the individual criteria andindicators. National Status 2000 represents Canada’s first attempt to report on the sustainability of its forests via62 of the 83 indicators in the CCFMs’ national framework of Criteria and Indicators for Sustainable ForestManagement as outlined under Action 3.10 in the National Forest Strategy 1998-2003.
This report has drawn upon the best available information and the best research and expertise to establish,where possible, a baseline from which progress can be measured in future reports. Measuring the sustainability offorests is a long-term and progressive exercise.The challenges involved in evaluating progress toward sustainabilityinclude linking the indicators under the various criteria to make an overall assessment and defining benchmarks forfuture conditions.The development and use of C&I as an assessment tool is a progressive learning process thatrequires adjustments to be made as new information becomes available and existing knowledge is expanded.Thisprocess involves transparent reporting and timely sharing of information and mutual learning experiences amongall stakeholders and interest groups.
Through the compilation of information for this report and the production of the 1997 capacity report, it hasbecome apparent that the key data and information holdings, covering a variety of data types and formats, aredispersed throughout federal, provincial, territorial and municipal agencies and institutions and that C&I reportingcould be greatly improved with the establishment of some key national initiatives. Foremost among these is anational mechanism to compile and provide timely and coordinated access to accurate forest information.Fostering collaboration between the various data gatherers, information custodians and user groups is critical toimproving the nation’s ability to report on the sustainability of its natural resources. A national, plot-basedinventory, describing all classes of ownership, allowing for spatial and temporal measurements and trend estimatesand including dedicated monitoring of insects and diseases, biodiversity, pollutants and non-timber resources wouldcompliment such an information system and enhance the nation’s capacity to assess the sustainability of its forests.
Because forest ecosystems are complex and highly variable, forest management and policy decisions will alwaysbe accompanied by uncertainty and risk. Our understanding of forest ecosystems and our capacity to predictand set benchmarks for future performance will be improved when ecosystem level models, such as the carbonbudget model are developed to integrate information to predict the impact of changes on the sustainability ofCanada’s forests. Science will play an important role in the validation and interpretation of information for thedevelopment of adaptive management options and in the development of new techniques to measure indicators.For example, remote sensing is currently being tested for monitoring and reporting on 25 of the indicators inthe CCFM framework. The initiatives of the CCFM working groups that are addressing sustainable forestmanagement are described in Appendix 1. Appendix 2 highlights some of the projects being developed by thepartners of the National Forest Strategy to design new methods, models, systems and tools to enhance thecapacity to measure and report on the indicators and should significantly contribute to the advancement of C&Iimplementation in Canada.
The CCFM C & I framework has been in place since 1995. Recognizing that sustainable forest management is anadaptive process and that assessing sustainability is a continuous activity, the CCFM approved a review of the83 indicators in the framework.This review will improve the relevance and efficiency of the indicators for reportingon and assessing progress toward sustainable development.
CONCLUSIONS

APP
END
IX 1
116
APPENDIX 1 Description of the initiatives of CCFM Working Groups that address sustainable forest management
Working Group Description
National Forest Information Responsible for the preparation of a business plan for the development of a System system to integrate data on all aspects of Canada’s forests.
Canadian Criteria and Responsible for the development and periodic evaluation of the CCFM frame-Indicators work of criteria and indicators of sustainable forest management, for reporting
on the indicators and for establishing links to international and sub-national C&I processes.
National Forestry Database Responsible for establishing a comprehensive national database on forest Program management activities in Canada and developing a public information program
based upon the national database to provide timely and credible information to the policy process.
Canadian Forest Inventory Responsible for observing, studying and discussing the continuing state, prac-tice and research in Canada of forest inventory, inventory update, and other forest management statistics and to make recommendations regarding opera-tional procedures; measurement standards; terminology; and, data acquisition,handling and reporting.
Science and Technology Responsible for reviewing S&T data as a component of strategic agendas;developing S&T recommendations on forestry issues, and priorities and opportunities in the forest sector; and identifying new S&T opportunities for cooperation and coordination.
Forests 2020 Responsible for developing a strategy to ensure Canada’s forest industries remain competitive while safeguarding the social and environmental value of Canadian forests.
International Forestry Responsible for communicating Canada’s sustainable forest management Partnerships Program policies and practices to key decision makers and influences in Europe, United
States and Japan, securing a reasonable trade framework through the promo-tion of Canadian sustainable forestry initiatives and ensuring that trade barriers are not erected in export markets.
International Forest Responsible for preparing Canada’s position on a range of legally and non- Convention legally binding approaches for strengthening the international forest regime.
Canadian Interagency Responsible for facilitating interagency cooperation in wildland fire manage-Forest Fire Centre ment, a cooperative venture that comprises federal, provincial and territorial
wildland fire management agencies.
Aboriginal Forestry Aboriginal participation and development of business partnerships and potential joint initiatives.
Private Woodlot Taxation Responsible for reviewing taxation policies related to private woodlots to determine their impact on sustainable management practices and, if appro-priate, recommending ways these tax policies could be improved to encouragesustainable forest management.
Canadian Forestry Responsible for meeting the communication needs of the CCFM.Communicators

APP
END
IX 2
117
APPENDIX 2 Projects in response to National Forest Strategy (1998-2003) action plans that will contribute to the advancement of C&I implementation
Project Description
1. National Forest Ecological A book and a CD-ROM will be produced describing a nationalClassification System for Canada. ecological classification system that eliminates redundancies in
regional systems.The system will be used for standardized reporting,for industrial applications and as a basis for the development of a national strategy for forest ecosystem management.
2. Management strategies to mimic Disturbances such as fire, insects, disease, and harvesting will be the role of disturbance in maintaining studied to determine their impact on forest ecosystems.Where forest ecosystem integrity. possible, models will be developed to analyze adaptive management
response strategies.
3. Network of protected areas A report on the network of protected areas representative of representative of Canada’s forest Canada’s forest ecosystem classification categories will be produced.ecosystem classification categories.
4.Tools to analyze the impact of Using case studies from Armillaria and spruce budworm, costs and management options on multiple benefits of management options will be determined. Non-timber forest values. valuation will be examined in a case study on recreation in Foothills
Model Forest.
5. Predictive models to examine the National climate surfaces databases will be generated and used to impact of climate change on forest design models to simulate effects on climate and climate variabilityecosystems. on forest ecosystems.
6. Review of the national framework The Centre for International Forestry Research (CIFOR) field tested of criteria and indicators of sustainable the CCFM indicators in Boise, Idaho in 1998. Incorporating the forest management. results of this test, a science-policy team will review the framework
with respect to continued relevance and practicality for measuring sustainable forest management. Indicators will be refined as necessary.
7. Forest Stewardship Recognition Through the identification of examples of leadership and innovationProgram. in forest stewardship and forest biodiversity conservation, both public
awareness and on-the-ground forest biodiversity conservation will be encouraged.
8.The inherent value to Canadians Community dependence on the forest sector will be studied to of the social and economic dimensions identify social indicators of community sustainability and improve of forests. understanding as to how Canadians value social and economic
forest values.
9. Forest sector science and A system to compile and track private and public forest sector technology tracking and reporting S&T will be established.The system will provide information on level system. and allocation of Canada’s forest sector and comparisons with other
Canadian sectors and competing nations.

AC
KN
OW
LEG
EMEN
TS
118
This report represents the collaborativeefforts of the individuals from various agenciesacross the nation acknowledged below.
PRODUCTION TEAM
Natural Resources Canada—Canadian Forest Service
Melissa BarrosThomas BeckleyDarcie BoothHélène DrouinAlain GagnéRoberta GalMark GillisBrian HaddonTerry HattonOle HendricksonHarry HirvonenSteve KnightTony LemprièreJulie LepageBrenda McAfeePauline MyreSusan PhelpsRobin QuenetRené SamsonAlbert SimardJack SmythRobert StewartBill WhiteJim Wood
TECHNICAL CONTACTS
Alberta Department of EnvironmentLindsay KerkhoffBarry NortheyDaryl PriceAndy MasiukEvelynne Wrangler
British Columbia Ministry of ForestsAndrew MitchellTom NiemannPaul Rehsler
Canadian International Development Agency
Ralph Roberts
Department of Foreign Affairs and International Trade
Denyse Rousseau
Department of Indian Affairs and NorthernDevelopment
Bill GladstonePat MacDonellJeff MontyDebra WortleyPeter Wyse
International Development Research Centre
Fred Johnson
Manitoba Department of ConservationColleen AndreychukJeff Delaney
New Brunswick Department of NaturalResources and Energy
Bob DickJohn Upshall
Newfoundland Department of Forest Resourcesand Agrifoods
Ivan DowntonWayne KellyLen MooresEric Young
Northwest Territories Department of Resources,Wildlife and Economic Development
Ken CaineBruno CroftBob DeckerLisa GallagherRick LanovilleWilliam Mawdsley
Nova Scotia Department of Natural ResourcesJorg Beyeler Sherman BoatesWalter FanningPeter MacQuarrieKen SnowJulie TowersEric Georgeson Carl WeatherheadBrian White
Ontario Ministry of Natural ResourcesScott JonesRobert MearsRobert MillerBetty vanKerkhof
Prince Edward Island Department of Agricultureand Forestry
William GlenJon Hutchinson
Ministère des Ressources naturelles du QuébecDenis BlanchetAndré BouchardClément BordeleauMichael CampagnaMichel CantinDaniel DemersJulie FortinJean-François GravelPierre-Martin MarotteBlaise ParentDenyse TardifFrançois Trottier
Saskatchewan Ministry of Environment andResource Management
Dave BrewsterDoug CampbellDwayne DyeMark JohnstonKarl LautenSeonaid MacPhersonJim SmithShelly Vandermey
Natural Resources Canada—Canadian Forest Service
Eric AllenMike AppsDave BoulterIan CampbellJanice CampbellNello CataldoRoger CoxJoe DeFranceschiMichael den OtterAlain DuboisRick GreetRandal HoscheitDianne KorberDan McKenneyIan MillarMike NewmanKatja Power Thomas Rosser Ralph SimpsonRichard StedmanThomas SternerIan ThompsonJacques TrenciaScott TweedyTim Williamson
ACKNOWLEDGEMENTS

GLO
SSA
RY
119
ABIOTICPertaining to the non-living compo-nent of the environment (e.g., climate,ice, soil and water).
ABUNDANCEThe number of organisms in a popula-tion, combining density within inhab-ited areas with number and size ofinhabited areas.
ACIDIC DEPOSITIONThe process by which acids aredeposited, either as wet deposition inthe form of rain, snow, sleet, hail, orfog; or as dry deposition in the formof particulates such as fly ash,sulphates, nitrates; or as gases likesulphur dioxide and nitric oxide. Dryparticles and gases, deposited onto oradsorbed into surfaces, can beconverted into acids after depositionor adsorption when they come incontact with water.
ADVANCE REGENERATIONYoung trees under existing stands.Regeneration established beforelogging that has survived the loggingoperation.
AGE CLASSA category into which the average ageor age range of trees or other vegeta-tion is classified.Age class is usuallyused in reference to even-aged standsof trees. It represents the dominantage of the main body of trees in astand. In mixed-aged stands, age classcan be used to describe the averageage of specific cohorts of trees.
ALIEN SPECIESAny species not native to a particularecosystem.
AMBIENTThe quality of physical parameters inthe surrounding, external, or uncon-fined conditions (e.g., air temperatureor air pollution).
BEQUEST VALUEThe external benefit that accrues toindividuals through the assurance thatfuture generations will also haveaccess to forests.
BIOFUELFuels made from cellulosic biomassresources. Biofuels include ethanol,biodiesel and methanol.
BIOGEOCHEMICAL CYCLESThe cycling of elements such ascarbon, nitrogen, oxygen, hydrogen,calcium, sodium, sulphur orphosphorus, between the abiotic andbiotic components of the environment,including the atmosphere, terrestrial,aquatic and vegetative systems, throughthe processes of production, assimila-tion and decomposition.
BIOLOGICAL PRODUCTIVITYThe capacity to produce biomass; theproduction of biomass.
BIOMASSThe mass of organic matter per unitof area or volume of habitat.
BIOSPHEREThat part of the planet that supportslife; consisting of the hydrosphere, thelithosphere, and the lower atmosphere.
BIOTAAll of the living organisms in a givenecosystem, including microorganisms,plants and animals.
BIOTICPertaining to any living aspect of theenvironment, especially population orcommunity characteristics.
BUFFER ZONEA strip of land maintained along astream, lake, road, recreation site ordifferent vegetative zone to mitigatethe impacts of actions on adjacentlands, to enhance aesthetic values, oras a best management practice.
CATALYSTA substance that changes the speedor yield of a chemical reactionwithout being consumed or chemicallychanged by it.
CHLOROFLUOROCARBONS(CFCs)Industrial synthetic chemicals used inair conditioning, foam and cleaningsolvents. CFCs can damage the ozonelayer.
CLEARCUTTINGA silvicultural system in which theentire stand of trees is cleared from anarea at one time. Clearcutting resultsin the establishment of a new even-aged stand of trees and can be imple-mented in blocks, strips or patches.
COARSE WOODY DEBRISTypically, sound or rotting logs,stumps, or large branches that havefallen or been cut and left in thewoods, or trees and branches thathave died but remain standing orleaning.
COMPACTIONA reduction in soil volume leading topoor soil aeration, reduced drainageand root deformation.
CONIFERA wide range of tree species withinthe order Gymnospermae, typicallyevergreen, bearing cones, and havingneedle-shaped or scalelike leaves.Conifer timber is termed softwood.
CONNECTEDNESSThe structural links between habitatpatches in a landscape.
CONVENTION ONBIOLOGICAL DIVERSITYA global agreement to address allaspects of biological diversity: geneticresources, species, and ecosystems.The objectives are "the conservationof biological diversity, the sustainableuse of its components and the fairand equitable sharing of the benefitsarising out of the utilization ofgenetic resources."
GLOSSARY

GLO
SSA
RY
120
COSEWICAn acronym for the Committee onthe Status of Endangered Wildlife inCanada. COSEWIC lists and desig-nates plants and animals in Canadaaccording to their relative abundanceat the national level.
COVER TYPESee Forest Type.
CRITICAL LOADThe highest deposition of acidifying(or other pollutants) compounds thatwill not cause chemical changesleading to long-term harmful effectson the overall structure or function ofan ecosystem.
CROWNThe part of a tree or woody plantbearing live branches and foliage.
CROWN TRANSPARENCYThe amount of skylight visible throughthe foliated portion of a tree crown.
CUTOVERAn area of forest from which some orall of the timber has recently beencut.
DECIDUOUSTrees typically belonging to the orderAngiospermae with broad leaves thatare usually shed annually.
DECOMPOSITIONThe breakdown or decay of organicmaterials by the action of bacteria,fungi and other microorganisms.
DEFOLIATIONAn unseasonable reduction in thefoliage cover of a plant due to attacksby insects or fungal disease, or as aresult of other factors such asdrought, storms, or chemicals in theatmosphere.
DISTURBANCEA significant change in the structureand/or composition of ecosystems,communities or populations throughnatural or human-induced events.
ECOCLIMATIC REGIONSEcologically based regions in whichthe plant succession and rate ofgrowth are similar on similar sites.
ECOSYSTEMA dynamic system of plants, animalsand other organisms, together withthe non- living components of theenvironment, functioning as an inter-dependent unit.
ECOSYSTEM-BASED MANAGEMENTManagement systems that attempt tosimulate ecological processes with thegoal of maintaining a satisfactory levelof diversity in natural landscapes andtheir pattern of distribution in orderto ensure the sustainability of forestecosystem processes.
ECOZONEA broad-scale ecological unit that isbased on patterns that includeclimate, geography and ecologicaldiversity.A framework of 15ecozones, subdivided into 53ecoprovinces, 194 ecoregions and 1 020 ecodistricts is the nationalecological classification of Canada.
ENVIRONMENTAL SERVICEVALUEValues related to the ability of forestecosystems to assimilate waste andrespond to human disturbances whilecontinuing to provide environmentalgoods and services, such as clean airand water, soil retention and wildlifehabitat.
EROSIONThe wearing away of the land surfaceby running water, wind, ice, or gravity.
EXISTENCE VALUEThe external benefit that accrues toindividuals, having no intention of evervisiting or using the site or environ-ment in question, simply throughknowledge that the area, feature, orgoods exist in a particular condition.
EXTINCTIONThe termination of a species causedby failure to reproduce and death ofall the remaining members of thatspecies.
EXTIRPATIONThe elimination of a species orsubspecies from a particular area, butnot from its entire range.
EVEN-AGEDOf a forest stand, or forest type inwhich relatively small age differences(usually less than 10 to 20 years) existbetween individual trees.
FAUNAThe animal community found in oneor more regions.
FIRE ACTIVITYIgnition, flame development, spreadand intensity of a forest or wildlandfire.
FIRE LOADIn Canada, the number and magnitudeof all fires requiring suppressionaction during a given period within aspecified area.
FIRE MANAGEMENTThe activities concerned with theprotection of people, property, andforest areas from wildfire and the useof prescribed burning for the attain-ment of forest management and otherland-use objectives, all conducted in amanner that considers environmental,social, and economic factors.
FIRE REGIMEThe characteristic frequency, extent,intensity, severity, and seasonality offires within an ecosystem.
FIRE SUPPRESSIONAll activities concerned with control-ling and extinguishing a fire followingits detection.
FLORAThe plant species found in one ormore regions, or eras.
FOREST-DEPENDENT COMMUNITYA community that relies on the forestsector for more than 50% of itseconomic base.
FOREST TYPEA group of forested areas or stands ofsimilar composition that can be differ-entiated from other such groups.Forest types are usually separated andidentified by species composition andoften also by height and crownclosure classes.

GLO
SSA
RY
121
FULL SUPPRESSION FIREA forest or wildland fire that iscontrolled as quickly as is reasonablypossible.
GAP ANALYSISAn analytical technique in which theextent of existing protected areas isoverlaid with maps of species andecosystem distribution to identify gapsin the protective network.
GEOGRAPHIC INFORMATIONSYSTEM (GIS)An information system that uses aspatial database to provide answers toqueries of a geographical naturethrough a variety of manipulations,such as sorting, selective retrieval,calculation, spatial analysis and model-ling.
GLOBAL WARMINGA projected increase in atmospherictemperatures caused by release intothe atmosphere of the gaseous by-products (principally carbon dioxide)of fossil-fuel consumption, which traplong-wavelength radiant energy.
GREENHOUSE GASMolecules in the Earth’s atmospheresuch as carbon dioxide (CO2),methane (CH4), nitrous oxide (N2O)and chlorofluorocarbons (CFCs),which warm the atmosphere becausethey absorb some of the thermalradiation from the surface of theEarth.
GREENHOUSE GAS SINKSAny process, activity or mechanismthat removes greenhouse gases ortheir precursors from the atmosphereat a greater rate than they releasethem.The principal natural mechanismis photosynthesis.
GREENHOUSE GAS SOURCEAny process or activity (e.g., forestfires or conversion of forest land toagricultural or urban uses) thatreleases greenhouse gases or precur-sors of those gases into the atmos-phere at a greater rate than theyremove them.As trees and forestproducts decompose or burn, theyrelease carbon in the form of carbondioxide.
HARDWOODTypically refers to the wood of broad-leaved trees, most of which areAngiosperms and deciduous.
HABITAT GENERALISTAny species capable of exploiting abroad range of habitats or niches.
HERITAGE LEGISLATIONLegislation addressing the protectionof sites that have cultural, historical orspiritual significance for present andfuture generations.
HUMUSA brown or black complex materialresulting from the partial decomposi-tion of plant or animal matter andforming the organic portion of thesoil.
INTERGOVERNMENTALPANEL ON CLIMATE CHANGEA panel, open to all members of theUnited Nations EnvironmentProgramme and the WorldMeteorological Organization.TheIPCC assesses the scientific, technicaland socio-economic informationrelevant to the understanding of therisk of human-induced climate change.
INVASIVE SPECIESAny species not native to a particularecosystem whose introduction doesor is likely to cause economic orenvironmental harm or harm tohuman health.
JOULEUnit of energy and work. (A petajouleis 1015 joules).
KYOTO PROTOCOLBinding targets for reduction in green-house gas emissions were agreed tofor the first time by major industrialnations meeting at the United NationsClimate Change Conference in Kyotoin December 1997.
LANDSCAPEA spatial mosaic of several ecosys-tems, landforms and plant communi-ties intermediate between anorganism’s normal home-range, sizeand its regional distribution.
MICROORGANISMAn organism too small to be seenwith the unaided eye (e.g., a virus,bacterium, protozoan, yeast cell, fungalhypha).
MIXEDWOODStands of trees having a well-mixedcomposition of angiosperms(hardwoods) and gymnosperms(softwoods).
MODIFIED FIRE RESPONSEResponse to a forest or wildland fireat less than full suppression; normallyemployed in low-value areas.
MUTUAL LEARNINGA rational and reasonable exchange ofinformation in the spirit of partnership.
MYCORRHIZAThe symbiotic association betweenhigher plant roots and specific fungithat aid plants in the uptake of waterand certain nutrients.
NATIVE SPECIESA species known to have existed on asite prior to the influence of humans.
NITROUS OXIDENitrous oxide (N2O) is a minorgreenhouse gas released whenchemical fertilizer is used and fossilfuels are burned. It occurs naturally inthe environment; however, in recentyears, quantities have increasedbecause of human activities.
NON-MARKET CONSUMPTIVEGOODSProducts (e.g., berries, mushrooms,craft products, firewood, fiddleheads,Christmas and ornamental trees) thatindividuals harvest from forest landsfree of charge.
NUTRIENT CYCLEThe exchange of elements amongliving and nonliving components of anecosystem.
OPTION VALUEThe amount an individual would bewilling to pay (or would have to bepaid to agree to sell) to preserve theoption to participate in some activityor to use some resource at somefuture time, whether or not thatindividual ever actually participates oruses the resource.
OZONEA form of oxygen (O3) formednaturally in the upper atmosphere bya photochemical reaction with solarultraviolet radiation.When formed atground level, it becomes a major agentin the formation of smog.

GLO
SSA
RY
122
PARTICULATEOf or relating to minute separateparticles.
PHOTOSYNTHESISThe process by which plants trans-form carbon dioxide and water intocarbohydrates and other compounds,using solar energy captured by chloro-phyll in the plant. Oxygen is abyproduct of the process.
PHYTOTOXICPoisonous to plants.
PPMParts per million. One million equalsone thousand thousand.
PRESERVATION VALUEThe external benefit derived fromexistence, option and/or bequestvalues.
REFORESTATIONThe natural or artificial restocking ofan area with forest trees.
REMOTE SENSINGThe science and art of obtaining infor-mation about an object, area, orphenomenon through the analysis ofdata acquired by a device that is notin contact with the object and thatuses wavelengths from the ultravioletto radio regions of the spectrum.
RENEWABLE RESOURCEA natural resource that is capable ofregeneration.
RESILIENCEThe capacity of a community orecosystem to maintain or regain thedesired condition of diversity, integrityand ecological processes followingdisturbance.
RESPIRATIONThe physical and chemical processesby which an organism provides itscells and tissues with the oxygenneeded for metabolism and relievesthem of the carbon dioxide formed inenergy-producing reactions.
RIPARIAN ZONEA strip of land of variable widthadjacent to and influenced by a bodyof fresh water.
RUN OFFThat portion of the precipitation on adrainage area that is discharged fromthe area in stream channels.
SAVANNAHA major global biome consisting ofopen grasslands containing scatteredtrees or shrubs.
SCARIFICATIONA method of seedbed preparationwhich consists of removing the forestfloor or mechanically mixing it withthe mineral soil to eliminate orreduce the dead organic material.
SELECTION CUTTINGAlso called partial cutting.An uneven-aged silvicultural system in whichtrees are removed individually or insmall groups continuously at relativelyshort intervals, resulting in a constantrenewal of a forest crop.
SERAL STAGESAlso called successional stages.Theseries of plant community conditionsthat develop during ecological succes-sion from bare ground (or majordisturbances) to the climax stage.
SERAL SPECIESPlant species of early, middle, and latesuccessional plant communities.Theterm is often used in a narrowersense in forest management todescribe the dominant conifer vegeta-tion that follows major disturbanceepisodes.
SHELTERWOOD CUTTINGA silvicultural system used in even-aged stands in which groups of treesare harvested in a design that usesadjacent or overhead large trees forseed or to protect regeneration.
SILTATIONThe filling-in of lakes and streamchannels with soil particles, usually asa result of erosion on adjacent land.
SILVICULTUREThe theory and practice of controllingthe establishment, composition,growth and quality of forest stands;can include basic silviculture (plantingand seeding) and intensive silviculture(site rehabilitation, spacing and fertil-ization).
SMOGAir pollution typically associated withoxidants.
SOFTWOODThe timber of coniferous trees.
STRUCTUREThe distribution of trees in a stand orgroup by age, size or crown class.
SUCCESSIONChanges in the species composition ofan ecosystem over time, often in apredictable order.
TENUREThe act of owning, using or control-ling land or the resources of that landunder certain terms and conditions.
TROPOSPHEREThe lower layer of the Earth’s atmos-phere stretching from the ground tothe upper atmosphere (stratos-phere).
TURBIDITYA measure of water clarity, or thedegree to which water is renderedopaque by the suspended silt or othersediments.
UNEVEN-AGEDOf a forest, stand, or forest type inwhich the intermingled trees differ inage by more than 10 to 20 years.
VALUE-ADDED PRODUCTIONManufacturing that adds value to aprimary product as it passes throughvarious processing stages.
VARIABLE-RETENTION SILVICULTURAL SYSTEMHarvesting method by which someforest cover is retained.

PacificOcean
ArcticOcean
AtlanticOcean
HudsonBay
NewBrunswick
NovaScotia
PrinceEdwardIsland
Labradorand
Newfoundland
Northwest Territories
YukonTerritory
BritishColumbia
Alberta
SaskatchewanManitoba
Ontario Quebec
Arctic CordilleraNorthern ArcticSouthern ArcticTaiga CordilleraTaiga PlainsTaiga Shield
Boreal CordilleraBoreal PlainsBoreal ShieldPacific MaritimeMontane Cordillera
PrairiesHudson PlainsMixedwood PlainsAtlantic Maritime
Nunavut
Terrestrial Ecozones of Canada
Source: Ecological Stratification Working Group, 1995
0 250 500km

EcosystemDiversity
Disturbance and Stress
Global CarbonBudget
ProductiveCapacity
6.15.1
5.2
4.13.12.11.1
SpeciesDiversity
1.2
GeneticDiversity
1.3
Aboriginal and Treaty Rights
PhysicalEnvironmental
Factors
3.2Policy and Protection
Forest Factors
2.2EcosystemResilience
2.3Extant
Biomass
6.1.1
6.2
5.1.14.1.1
5.1.2
5.1.3
6.2.1
Tree biomass volumesPercentage of harvested area having significant soil
compaction, displacement, erosion, puddling, loss of
organic matter, etc.
3.1.2
Area of forest converted to non-forest land use
2.1.1
Area and severity of insect attack
1.1.1
Percentage and extent, in area, of forest types relative to the historical condition
and total forest area
1.1.2
Percentage and extent of area by forest type and age
class
1.1.3
Area, percentage and representativeness of forest
types in protected areas
1.1.4
Level of fragmentation and connectedness of forest ecosystem components
1.2.1
Number of known forest-dependent species classified
as extinct, threatened, endangered, rare or
vulnerable relative to the total number of known
forest-dependent species
1.2.2
Population levels and changes over time of selected species
and species guilds
1.2.3
Number of known forest- dependent species that
occupy only a small portion of their former range
1.3.1
Implementation of an in situ/ex situ genetic
conservation strategy for commercial and endangered
forest vegetation species
2.1.2
Area and severity of disease infestation
2.1.3
Area and severity of fire damage
2.1.4
Rates of pollutant deposition
2.1.5
Ozone concentrations in forested regions
2.1.6
Crown transparency in percentage by class
2.1.7
Area and severity of occurrence of exotic species
detrimental to forest condition
2.1.8
Climate change as measured by temperature sums
2.2.1
Percentage and extent of area by forest type and age
class
2.2.2
Percentage of area successfully naturally
regenerated and artificially regenerated
2.3.1
Mean annual increment by forest type and age class
2.3.2
Frequency of occurrence within selected indicator
species
3.1.3
Water quality as measured by water chemistry, turbidty,
etc.
3.1.4
Trends and timing of events in stream flows from forest
catchments
3.1.5
Changes in distribution and abundance of aquatic fauna
3.2.1
Percentage of forest managed primarily for soil and water
protection
3.2.2
Percentage of forested area having road construction and stream crossing guidelines in
place
3.2.3
Area, percentage and representativeness of forest
types in protected areas
4.1.2
Vegetation (non-tree) biomass estimates
4.1.3
Percentage of canopy cover
4.1.4
Percentage of biomass volume by general forest type
4.1.5
Soil carbon pools
4.1.6
Soil carbon pool decay rates
4.1.7
Area of forest depletion
4.1.8
Forest wood product life cycles
4.1.9
Forest sector carbon dioxide emissions
4.2.1
Area of forest permanently converted to non-forest land
use
4.2.2
Semi-permanent or temporary loss or gain of
forest ecosystems
4.3.1
Fossil fuel emissions
4.3.2
Fossil carbon products emissions
4.4.1
Recycling rate of forest wood products manufactured and
used in Canada
4.4.2
Participation in the climate change conventions
Economic incentives for bioenergy use
4.3.3
Percentage of forest sector energy usage from renewable
sources
4.4.4
Existence of forest inventories
4.4.5
Existence of laws and regulations on forest land
management
4.5.1
Surface area of water within forested areas
Extent to which forest planning and management
processes consider and meet legal obligations with respect
to Aboriginal and treaty rights
Participation byAboriginal
Communities
6.3Sustainability
of ForestCommunities
4.2Forest Land Conversion
4.3Carbon Dioxide Conservation
4.4
Policy Factors
4.5Hydrological
Cycles
Competitiveness
5.3Contributionto Economy
Non-timberValues
5.4
Extent of Aboriginal participation in forest-based
economic opportunities
6.2.2
Extent to which forest management planning takes into account the protection of significant Aboriginal sites
6.2.3
Number of Aboriginal communities with a significant forestry
component in the economic base and the diversity of
forest use
6.2.4
Area of forest land available for subsistence purposes
6.2.5
Area of Indian reserve lands under integrated
management plans
Number of communities with a significant forestry
component in the economic base
6.3.2
Index of the diversity of the local industrial base
6.3.3
Diversity of forest use at the community level
Number of communities with stewardship or co-
management responsibilities
6.4.1
Degree of public participation in the design of decision-making processes
6.5.1
Percentage of area covered by multi-attribute resource
inventories
6.5.2
Investments in forest-based research and development
information
Total effective expenditures on public forestry education
6.5.4
Percent of forest area under management, including public
participation
6.5.5
Expenditure on international forestry
Mutual learning mechanisms and processes
6.4.2
Degree of public participation in decision-
making processes
6.4.3
Degree of public participation in
implementation of decisions and monitoring
6.4Fair and EffectiveDecision Making
6.5Informed
Decision Making
C R I T E R I A A N D I N D I C A T O R S F R A M E W O R K
Annual removal of forest products relative to the
volume of removals determined to be sustainable
Distribution of, and changes in, the landbase available for
timber production
Animal population trends for selected species of economic
importance
5.1.4
Management and development expenditures
5.1.5
Availability of habitat for selected wildlife species of
economic importance
5.2.1
Net profitability
5.2.2
Trends in global market share
5.2.3
Trends in research and development expenditures in
forest products and processing technologies
5.3.1
Contribution of timber and non-timber sectors to gross
domestic product (GDP)
5.3.2
Total employment in all forest-related sectors
5.3.4
Economic value of non-market goods and services
5.3.3
Utilization of forests for non-market goods and services, including forest land use for
subsistence purposes
5.4.1
Availability and use of recreational opportunities
5.4.2
Total expenditures by individuals on activities
related to non-timber use
5.4.3
Memberships and expenditures in forest recreation-oriented
organizations and clubs
5.4.4
Area and percentage of protected forest by degree of
protection
1 2CONSERVATIONOF BIOLOGICAL
DIVERSITY 3SOIL AND WATERCONSERVATION 4GLOBAL
ECOLOGICALCYCLES 5MULTIPLE
BENEFITS 6SOCIETY’SRESPONSIBILITY
3.1.1
6.3.1
6.3.4
4.4.3
6.5.3
6.5.6
*Highlighted indicators represent those reported in the National Status 2000.
*
ECOSYSTEMCONDITION ANDPRODUCTIVITY

ALBERTAMs. Evelynne WranglerSenior ManagerPolicy SecretariatDepartment of Environment9915 - 108 StreetEdmonton,ABT5K 2G8E-mail: [email protected]
BRITISH COLUMBIAMr. Bruce McRaeAssistant Deputy MinisterPolicy and Economic DivisionMinistry of ForestsP.O. Box 9525 Stn Prov GovtVictoria, BCV8W 9C3E-mail: [email protected]
MANITOBAMs. Deirdre ZebrowskiForest EcologistDepartment of Conservation200 Saulteaux CrescentWinnipeg, MBR3C 3W3E-mail: [email protected]
NEW BRUNSWICKMs. Ellen Barry (Co-chair)Assistant Deputy MinisterPolicy, Planning and Federal/Provincial
Relations Department of Natural Resources and
EnergyP.O. Box 6000Fredericton, NBE3C 5H1E-mail: [email protected]
NEWFOUNDLAND ANDLABRADORDr. Muhammad NazirAssistant Deputy Minister of ForestryDepartment of Forest Resources and
Agri-foods50 Elizabeth Avenue5th floor, Natural Resources BuildingSt. John’s, NFA1B 1W5E-mail: [email protected]
NORTHWEST TERRITORIESMs. Beatrice LepineDirector, Forest Management DivisionDepartment of Resources,Wildlife &
Economic DevelopmentBox 7, 149 McDougal Road, 2nd floorFort Smith, NTX0E 0P0E-mail: [email protected]
NOVA SCOTIAMr. Ed MacAulayExecutive Director, Renewable
ResourcesDepartment of Natural
ResourcesP.O. Box 6981701 Hollis Street2nd floor, Founder’s SquareHalifax, NSB3J 2T9E-mail: [email protected]
ONTARIOMr. Dan CooliganNational and International Forestry
AdvisorMinistry of Natural Resources400 - 70 Foster DriveSault Ste. Marie, ONP6A 6V5E-mail: [email protected]
PRINCE EDWARD ISLANDMr. Jerry Gavin Director, Forestry ResourcesDepartment of Agriculture & ForestryP.O. Box 2000J. Frank Gaudet Tree NurseryUpton RoadCharlottetown, PEC1A 7N8E-mail: [email protected]
QUEBECMr. Germain ParéAdjoint au sous-ministre associé
aux ForêtsMinistère des Ressources naturelles 5ième étage, 880, chemin Ste-FoyQuébec, QCG1S 4X4E-mail: [email protected]
SASKATCHEWANMr. Dwayne DyeCoordinator, Forest Ecosystems BranchDepartment of Environment and
Resource ManagementP.O. Box 3003Prince Albert, SKS6V 6G1E-mail: [email protected]
YUKONMr. Jeff MontyRegional Manager, Forest ResourcesDepartment of Indian Affairs and
Northern Development345 - 300 Main StreetWhitehorse,YKY1A 2B5E-mail: [email protected]
CANADIAN COUNCIL OF FOREST MINISTERS CRITERIA & INDICATORS TASK FORCE
CANADAMr. Jacques Carette (Co-chair)Director GeneralPolicy, Planning & International AffairsCanadian Forest Service8th floor, 580 Booth StreetOttawa, ONK1A 0E4E-mail: [email protected]

Canadian Councilof ForestMinisters
Conseil canadiendes ministresdes forêts
READER FEEDBACK
Canadian Councilof ForestMinisters
Conseil canadiendes ministresdes forêts
The Canadian Council of Forest Ministers (CCFM) was established in 1985 to focus on forest issues. CCFM facilitatesthe development of policies and initiatives for strengthening theforest sector, including the forest resource and its use. It pro-vides leadership, addresses national and international issues andsets the overall direction for stewardship and sustainable man-agement of Canada’s forest.
Which category best describes your affiliation?❏ Provincial Government❏ Federal Government❏ Industry❏ Education❏ Other (please describe)__________________________
Additional comments or suggestions:
Please continue to send me reports on Criteria andIndicators of Sustainable Forest Management in Canada.Alternately, please add my name to your publicationsmailing list.❏ Yes ❏ No
Name:
Address:
City:
Province/State:
Country: Postal/Zip code:
E-mail:
Date:
Did the report National Status 2000 increase your under-standing of sustainable forest management in Canada?❏ Yes ❏ No
How would you rate the quality of the report?Please circle the number from 1 to 5 which most closely corresponds toyour views:
Poor Good ExcellentInterest/relevance 1 2 3 4 5
Technical detail 1 2 3 4 5
General information 1 2 3 4 5
Graphics 1 2 3 4 5
Was the report easy to read?❏ Too technical❏ Just right❏ Too simple
Did you like the layout of the report?❏ Well designed❏ Difficult to follow
How much of the report have you read?❏ All of it❏ About half of it❏ Less than a quarter of it