Embed Size (px)
Citation preview
1Q4 2019 OESA AUTOMOTIVE SUPPLIER BAROMETER
OESA AUTOMOTIVE SUPPLIER BAROMETERQ4 2019
HR & TALENT
2Q4 2019 OESA AUTOMOTIVE SUPPLIER BAROMETER
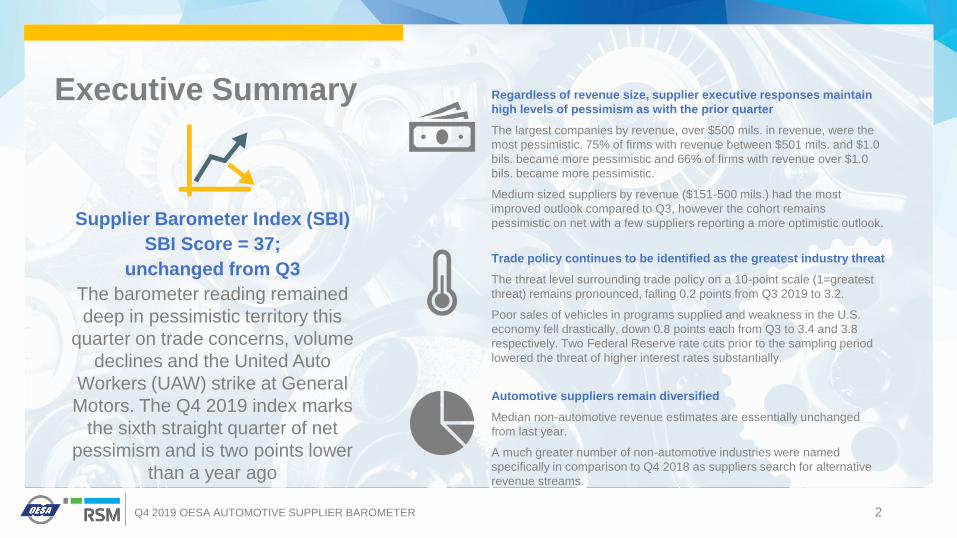
Executive Summary
Supplier Barometer Index (SBI)
SBI Score = 37;
unchanged from Q3
The barometer reading remained
deep in pessimistic territory this
quarter on trade concerns, volume
declines and the United Auto
Workers (UAW) strike at General
Motors. The Q4 2019 index marks
the sixth straight quarter of net
pessimism and is two points lower
than a year ago
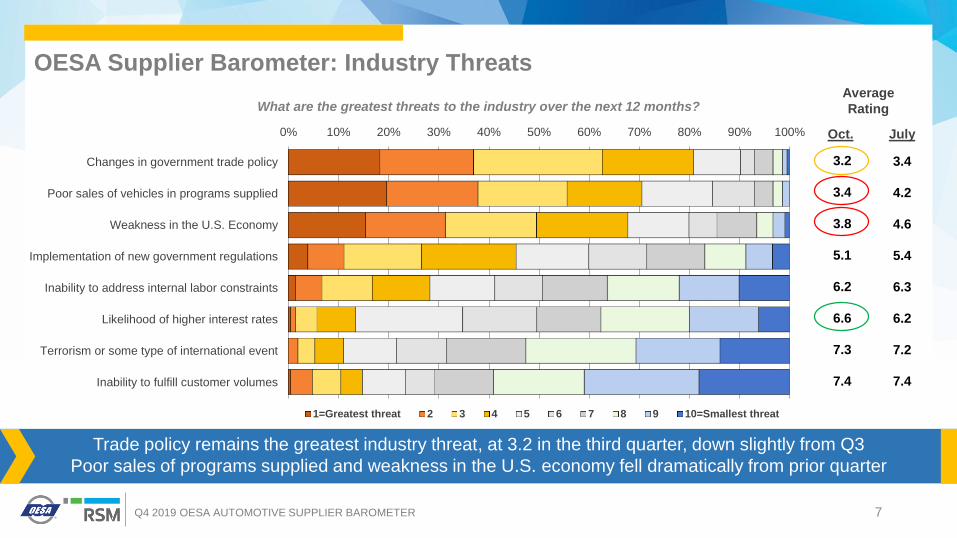
Trade policy continues to be identified as the greatest industry threat
The threat level surrounding trade policy on a 10-point scale (1=greatest
threat) remains pronounced, falling 0.2 points from Q3 2019 to 3.2.
Poor sales of vehicles in programs supplied and weakness in the U.S.
economy fell drastically, down 0.8 points each from Q3 to 3.4 and 3.8
respectively. Two Federal Reserve rate cuts prior to the sampling period
lowered the threat of higher interest rates substantially.
Automotive suppliers remain diversified
Median non-automotive revenue estimates are essentially unchanged
from last year.
A much greater number of non-automotive industries were named
specifically in comparison to Q4 2018 as suppliers search for alternative
revenue streams.
Regardless of revenue size, supplier executive responses maintain
high levels of pessimism as with the prior quarter
The largest companies by revenue, over $500 mils. in revenue, were the
most pessimistic. 75% of firms with revenue between $501 mils. and $1.0
bils. became more pessimistic and 66% of firms with revenue over $1.0
bils. became more pessimistic.
Medium sized suppliers by revenue ($151-500 mils.) had the most
improved outlook compared to Q3, however the cohort remains
pessimistic on net with a few suppliers reporting a more optimistic outlook.
3Q4 2019 OESA AUTOMOTIVE SUPPLIER BAROMETER
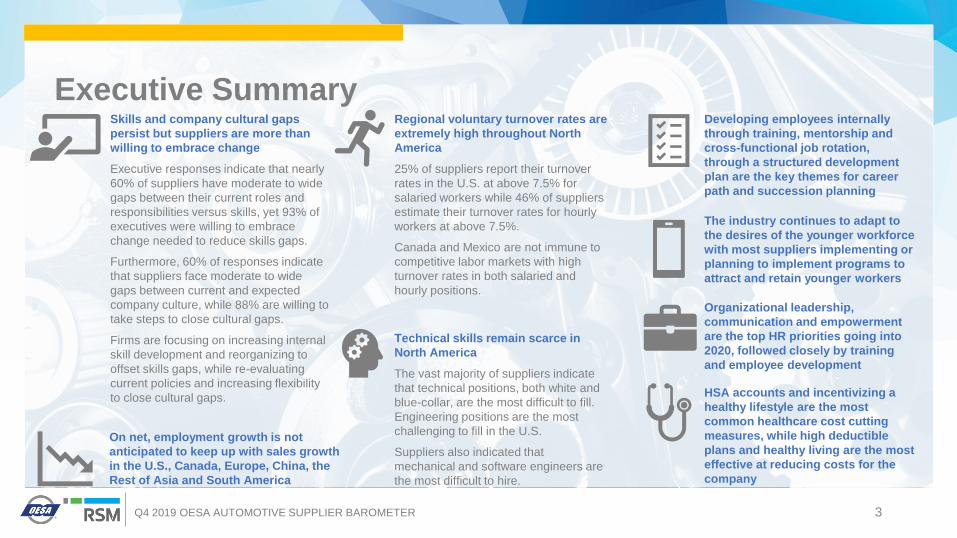
Executive SummarySkills and company cultural gaps
persist but suppliers are more than
willing to embrace change
Executive responses indicate that nearly
60% of suppliers have moderate to wide
gaps between their current roles and
responsibilities versus skills, yet 93% of
executives were willing to embrace
change needed to reduce skills gaps.
Furthermore, 60% of responses indicate
that suppliers face moderate to wide
gaps between current and expected
company culture, while 88% are willing to
take steps to close cultural gaps.
Firms are focusing on increasing internal
skill development and reorganizing to
offset skills gaps, while re-evaluating
current policies and increasing flexibility
to close cultural gaps.
Technical skills remain scarce in
North America
The vast majority of suppliers indicate
that technical positions, both white and
blue-collar, are the most difficult to fill.
Engineering positions are the most
challenging to fill in the U.S.
Suppliers also indicated that
mechanical and software engineers are
the most difficult to hire.
Regional voluntary turnover rates are
extremely high throughout North
America
25% of suppliers report their turnover
rates in the U.S. at above 7.5% for
salaried workers while 46% of suppliers
estimate their turnover rates for hourly
workers at above 7.5%.
Canada and Mexico are not immune to
competitive labor markets with high
turnover rates in both salaried and
hourly positions.
Developing employees internally
through training, mentorship and
cross-functional job rotation,
through a structured development
plan are the key themes for career
path and succession planning
On net, employment growth is not
anticipated to keep up with sales growth
in the U.S., Canada, Europe, China, the
Rest of Asia and South America
The industry continues to adapt to
the desires of the younger workforce
with most suppliers implementing or
planning to implement programs to
attract and retain younger workers
HSA accounts and incentivizing a
healthy lifestyle are the most
common healthcare cost cutting
measures, while high deductible
plans and healthy living are the most
effective at reducing costs for the
company
Organizational leadership,
communication and empowerment
are the top HR priorities going into
2020, followed closely by training
and employee development

4Q4 2019 OESA AUTOMOTIVE SUPPLIER BAROMETER
SUPPLIER OUTLOOK
5Q4 2019 OESA AUTOMOTIVE SUPPLIER BAROMETER
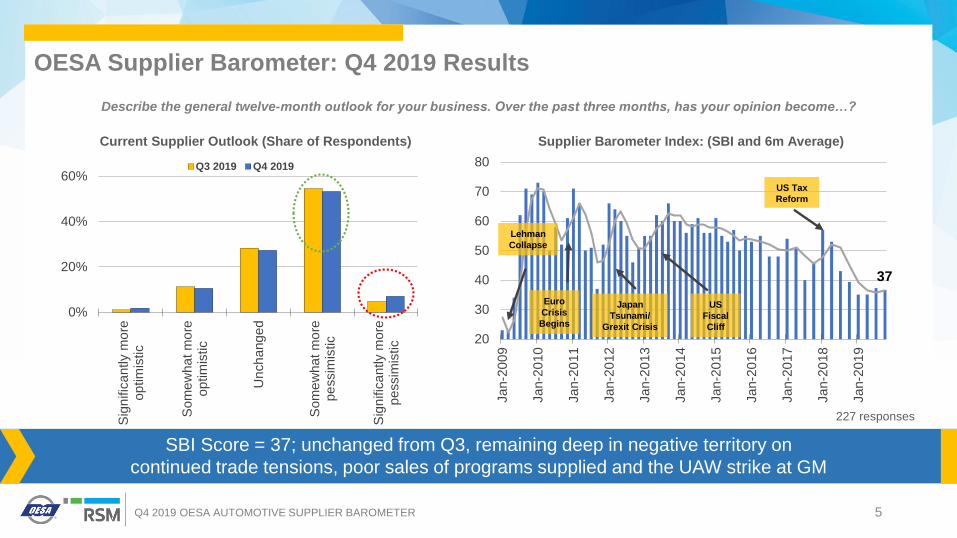
SBI Score = 53; drops 4 points from the Q1 level of 57
Tax reform supports optimism while trade and declining sales drive pessimism
37
20
30
40
50
60
70
80
Jan-2
009
Jan-2
010
Jan-2
011
Jan-2
012
Jan-2
013
Jan-2
014
Jan-2
015
Jan-2
016
Jan-2
017
Jan-2
018
Jan-2
019
Euro
Crisis
Begins
Japan
Tsunami/
Grexit Crisis
US
Fiscal
Cliff
Lehman
Collapse
0%
20%
40%
60%
Sig
nific
antly m
ore
op
tim
istic
Som
ew
ha
t m
ore
op
tim
istic
Un
ch
ang
ed
Som
ew
ha
t m
ore
pe
ssim
istic
Sig
nific
antly m
ore
pe
ssim
istic
Q3 2019 Q4 2019
227 responses
Describe the general twelve-month outlook for your business. Over the past three months, has your opinion become…?
Current Supplier Outlook (Share of Respondents) Supplier Barometer Index: (SBI and 6m Average)
SBI Score = 37; unchanged from Q3, remaining deep in negative territory on
continued trade tensions, poor sales of programs supplied and the UAW strike at GM
OESA Supplier Barometer: Q4 2019 Results
US Tax
Reform
6Q4 2019 OESA AUTOMOTIVE SUPPLIER BAROMETER
SBI Score = 53; drops 4 points from the Q1 level of 57
Tax reform supports optimism while trade and declining sales drive pessimism
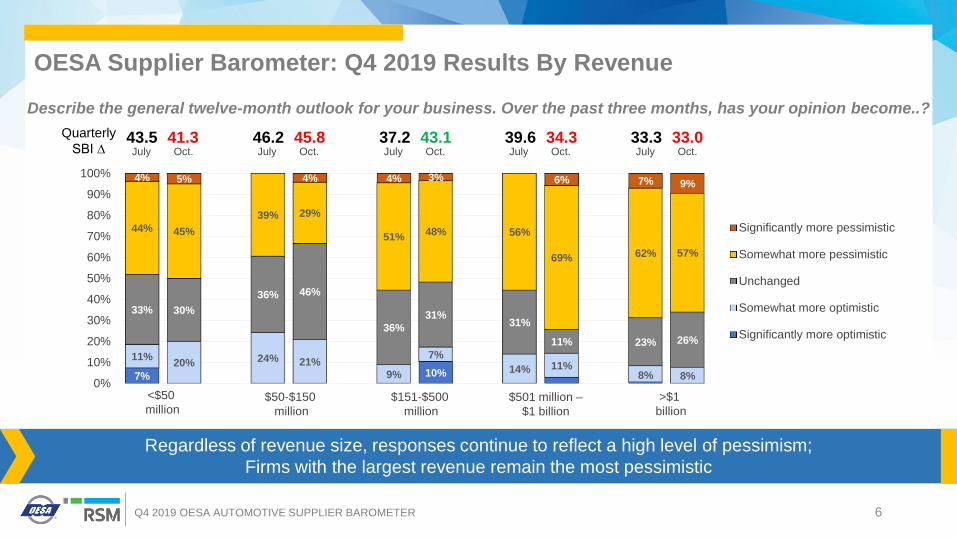
July Oct.
>$1
billion
7% 10%
11%20% 24% 21%
9%
7%
14% 11%8% 8%
33% 30%
36% 46%
36%
31%31%
11% 23% 26%
44% 45%
39% 29%
51%48% 56%
69% 62% 57%
4% 5% 4% 4% 3% 6% 7% 9%
0%
10%
20%
30%
40%
50%
60%
70%
80%
90%
100%
Significantly more pessimistic
Somewhat more pessimistic
Unchanged
Somewhat more optimistic
Significantly more optimistic
43.5 41.3 46.2 45.8 37.2 43.1 39.6 34.3 33.3 33.0
<$50
million$50-$150
million
$501 million –
$1 billion
Quarterly
SBI ∆
$151-$500
million
Regardless of revenue size, responses continue to reflect a high level of pessimism;
Firms with the largest revenue remain the most pessimistic
OESA Supplier Barometer: Q4 2019 Results By Revenue
Describe the general twelve-month outlook for your business. Over the past three months, has your opinion become..?
July Oct. July Oct. July Oct. July Oct.
7Q4 2019 OESA AUTOMOTIVE SUPPLIER BAROMETER
SBI Score = 53; drops 4 points from the Q1 level of 57
Tax reform supports optimism while trade and declining sales drive pessimism
0% 10% 20% 30% 40% 50% 60% 70% 80% 90% 100%
Changes in government trade policy
Poor sales of vehicles in programs supplied
Weakness in the U.S. Economy
Implementation of new government regulations
Inability to address internal labor constraints
Likelihood of higher interest rates
Terrorism or some type of international event
Inability to fulfill customer volumes
1=Greatest threat 2 3 4 5 6 7 8 9 10=Smallest threat
Average
Rating
3.2
3.4
3.8
5.1
6.2
6.6
7.3
7.4
3.4
4.2
4.6
5.4
6.3
6.2
7.2
7.4
JulyOct.
Trade policy remains the greatest industry threat, at 3.2 in the third quarter, down slightly from Q3
Poor sales of programs supplied and weakness in the U.S. economy fell dramatically from prior quarter
OESA Supplier Barometer: Industry Threats
What are the greatest threats to the industry over the next 12 months?
8Q4 2019 OESA AUTOMOTIVE SUPPLIER BAROMETER
SBI Score = 53; drops 4 points from the Q1 level of 57
Tax reform supports optimism while trade and declining sales drive pessimism
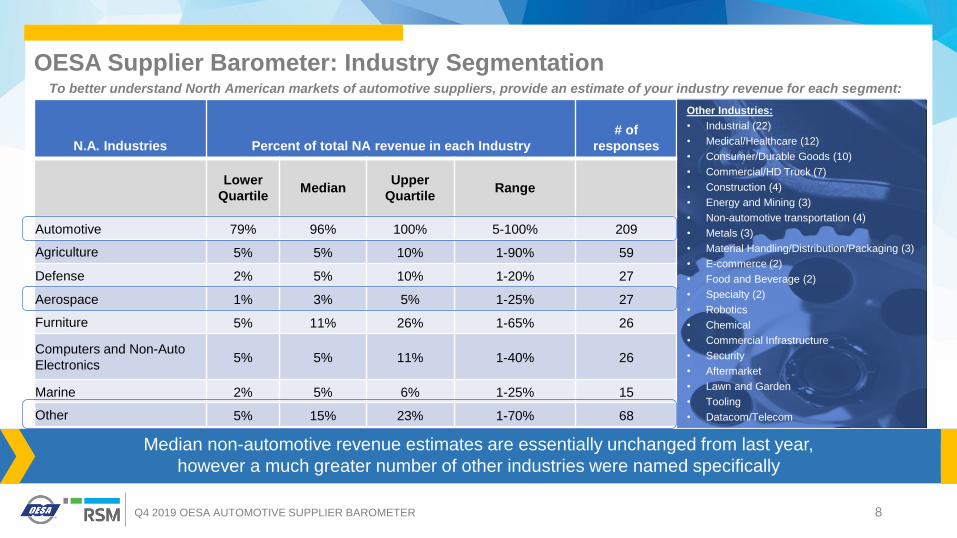
OESA Supplier Barometer: Industry Segmentation
N.A. Industries Percent of total NA revenue in each Industry
# of
responses
Lower
Quartile Median
Upper
QuartileRange
Automotive 79% 96% 100% 5-100% 209
Agriculture 5% 5% 10% 1-90% 59
Defense 2% 5% 10% 1-20% 27
Aerospace 1% 3% 5% 1-25% 27
Furniture 5% 11% 26% 1-65% 26
Computers and Non-Auto
Electronics5% 5% 11% 1-40% 26
Marine 2% 5% 6% 1-25% 15
Other 5% 15% 23% 1-70% 68
To better understand North American markets of automotive suppliers, provide an estimate of your industry revenue for each segment:
Other Industries:
• Industrial (22)
• Medical/Healthcare (12)
• Consumer/Durable Goods (10)
• Commercial/HD Truck (7)
• Construction (4)
• Energy and Mining (3)
• Non-automotive transportation (4)
• Metals (3)
• Material Handling/Distribution/Packaging (3)
• E-commerce (2)
• Food and Beverage (2)
• Specialty (2)
• Robotics
• Chemical
• Commercial Infrastructure
• Security
• Aftermarket
• Lawn and Garden
• Tooling
• Datacom/Telecom
Median non-automotive revenue estimates are essentially unchanged from last year,
however a much greater number of other industries were named specifically

9Q4 2019 OESA AUTOMOTIVE SUPPLIER BAROMETER
Human Resources and Talent
10Q4 2019 OESA AUTOMOTIVE SUPPLIER BAROMETER
SBI Score = 53; drops 4 points from the Q1 level of 57
Tax reform supports optimism while trade and declining sales drive pessimism
Yes14587%
No22
13% No gap/Aligned
21%
Minor gap 67
42%Moderate gap 79
50%
Wide gap 117%
Very willing
7347%
Somewhat willing
7346%
Not willing 7
4%
Not applicable
43%
For those indicating ‘yes’
Given competitive hiring pressures and your effort to retain and capture new talent...
How willing are you to embrace the scope
of change needed to close each gap?
What is the magnitude
of each gap?
Are you evaluating the gaps
between roles/responsibilities
vs. skills in your organization?
OESA Supplier Barometer: Roles/Responsibilities vs. Skills - Understanding the Gaps
Most suppliers are evaluating skills gaps, ~60% have moderate to wide gaps,
nearly all are willing to close gaps.
11Q4 2019 OESA AUTOMOTIVE SUPPLIER BAROMETER
SBI Score = 53; drops 4 points from the Q1 level of 57
Tax reform supports optimism while trade and declining sales drive pessimism
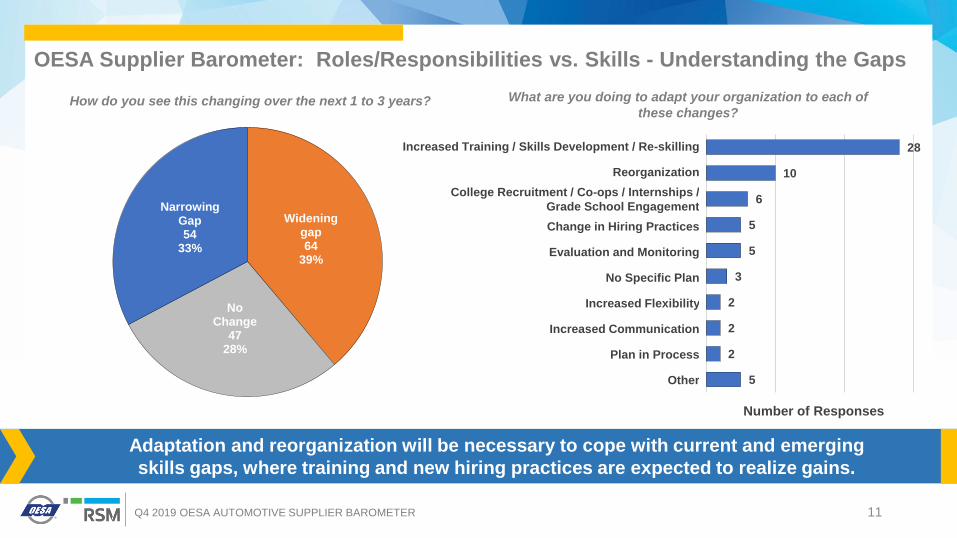
How do you see this changing over the next 1 to 3 years? What are you doing to adapt your organization to each of
these changes?
OESA Supplier Barometer: Roles/Responsibilities vs. Skills - Understanding the Gaps
Widening gap64
39%
No Change
4728%
Narrowing Gap54
33%
28
10
6
5
5
3
2
2
2
5
Increased Training / Skills Development / Re-skilling
Reorganization
College Recruitment / Co-ops / Internships /
Grade School Engagement
Change in Hiring Practices
Evaluation and Monitoring
No Specific Plan
Increased Flexibility
Increased Communication
Plan in Process
Other
Number of Responses
Adaptation and reorganization will be necessary to cope with current and emerging
skills gaps, where training and new hiring practices are expected to realize gains.
12Q4 2019 OESA AUTOMOTIVE SUPPLIER BAROMETER
SBI Score = 53; drops 4 points from the Q1 level of 57
Tax reform supports optimism while trade and declining sales drive pessimism
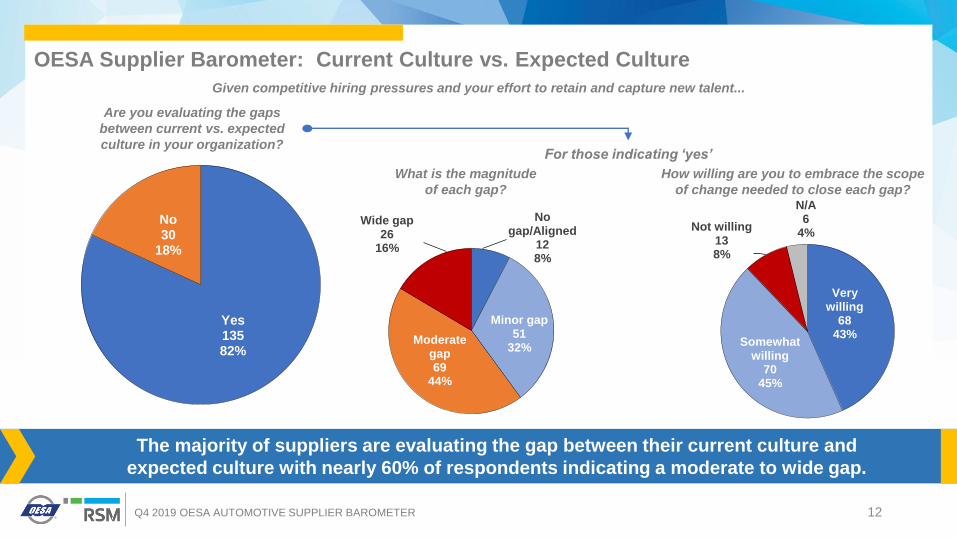
Yes13582%
No30
18%
No gap/Aligned
128%
Minor gap 51
32%Moderate
gap 69
44%
Wide gap 26
16%
Very willing
6843%
Somewhat willing
7045%
Not willing 138%
N/A6
4%
For those indicating ‘yes’
Given competitive hiring pressures and your effort to retain and capture new talent...
How willing are you to embrace the scope
of change needed to close each gap?
What is the magnitude
of each gap?
Are you evaluating the gaps
between current vs. expected
culture in your organization?
OESA Supplier Barometer: Current Culture vs. Expected Culture
The majority of suppliers are evaluating the gap between their current culture and
expected culture with nearly 60% of respondents indicating a moderate to wide gap.
13Q4 2019 OESA AUTOMOTIVE SUPPLIER BAROMETER
SBI Score = 53; drops 4 points from the Q1 level of 57
Tax reform supports optimism while trade and declining sales drive pessimism
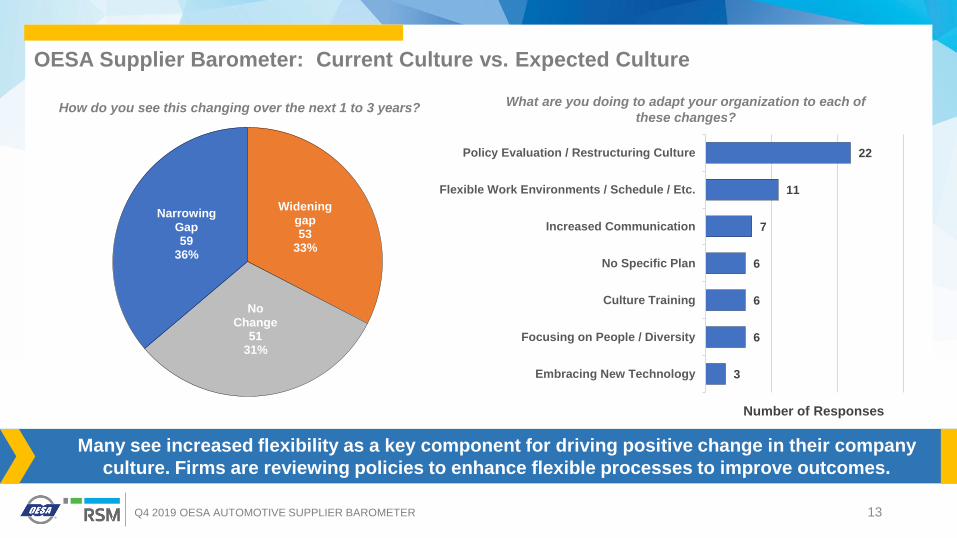
How do you see this changing over the next 1 to 3 years? What are you doing to adapt your organization to each of
these changes?
Many see increased flexibility as a key component for driving positive change in their company
culture. Firms are reviewing policies to enhance flexible processes to improve outcomes.
OESA Supplier Barometer: Current Culture vs. Expected Culture
Widening gap53
33%
No Change
5131%
Narrowing Gap59
36%
22
11
7
6
6
6
3
Policy Evaluation / Restructuring Culture
Flexible Work Environments / Schedule / Etc.
Increased Communication
No Specific Plan
Culture Training
Focusing on People / Diversity
Embracing New Technology
Number of Responses
14Q4 2019 OESA AUTOMOTIVE SUPPLIER BAROMETER
SBI Score = 53; drops 4 points from the Q1 level of 57
Tax reform supports optimism while trade and declining sales drive pessimism
How do you see this changing over the next 1 to 3 years? What are you doing to adapt your organization to each of
these changes?
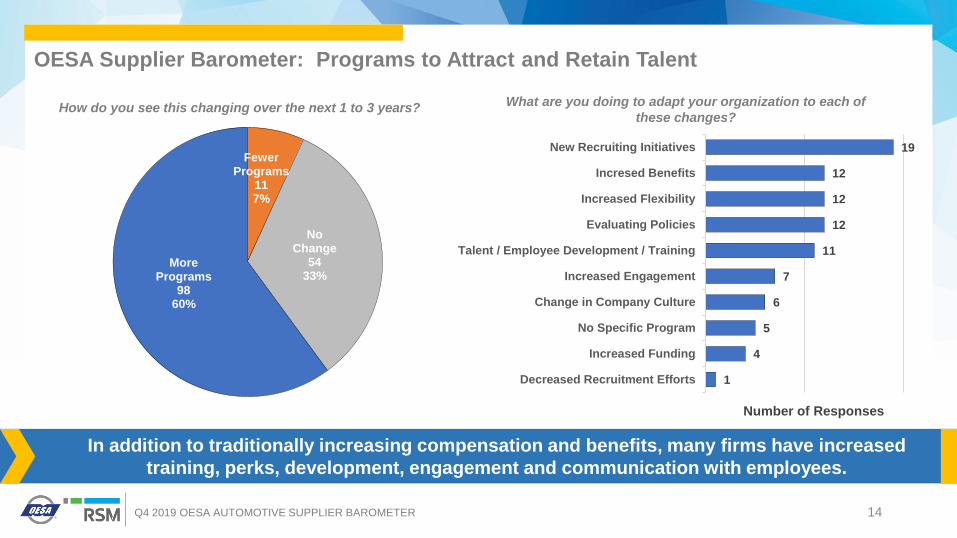
In addition to traditionally increasing compensation and benefits, many firms have increased
training, perks, development, engagement and communication with employees.
OESA Supplier Barometer: Programs to Attract and Retain Talent
Fewer Programs
117%
No Change
5433%
More Programs
9860%
19
12
12
12
11
7
6
5
4
1
New Recruiting Initiatives
Incresed Benefits
Increased Flexibility
Evaluating Policies
Talent / Employee Development / Training
Increased Engagement
Change in Company Culture
No Specific Program
Increased Funding
Decreased Recruitment Efforts
Number of Responses
15Q4 2019 OESA AUTOMOTIVE SUPPLIER BAROMETER
SBI Score = 53; drops 4 points from the Q1 level of 57
Tax reform supports optimism while trade and declining sales drive pessimism
No. of Responses = 149
15%
8%
26%
27%
6%
18%
14%
10%
10%
46%
48%
18%
19%
38%
38%
29%
38%
30%
38%
30%
33%
19%
24%
36%
35%
26%
21%
17%
14%
37%
29%
22%
17%
17%
11%
29%
24%
3%
10%
55%
60%
18%
22%
29%
30%
31%
32%
43%
46%
50%
49%
0% 20% 40% 60% 80% 100%
SalaryHourly
SalaryHourly
SalaryHourly
SalaryHourly
SalaryHourly
SalaryHourly
SalaryHourly
Regional employment willgrow faster than the regionalshare of corporate sales
Regional employment willgrow equal to the regionalshare of corporate sales
Regional employment willgrow slower than the regionalshare of corporate sales
Not applicable
United States
Canada
Mexico
Europe
China
South America
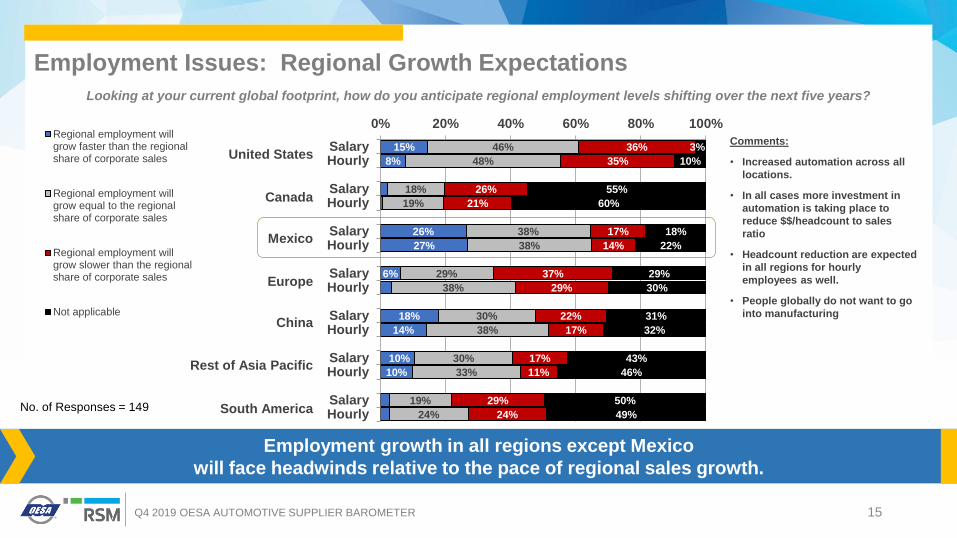
Looking at your current global footprint, how do you anticipate regional employment levels shifting over the next five years?
Employment growth in all regions except Mexico
will face headwinds relative to the pace of regional sales growth.
Employment Issues: Regional Growth Expectations
Rest of Asia Pacific
Comments:
• Increased automation across all
locations.
• In all cases more investment in
automation is taking place to
reduce $$/headcount to sales
ratio
• Headcount reduction are expected
in all regions for hourly
employees as well.
• People globally do not want to go
into manufacturing
16Q4 2019 OESA AUTOMOTIVE SUPPLIER BAROMETER
SBI Score = 53; drops 4 points from the Q1 level of 57
Tax reform supports optimism while trade and declining sales drive pessimism
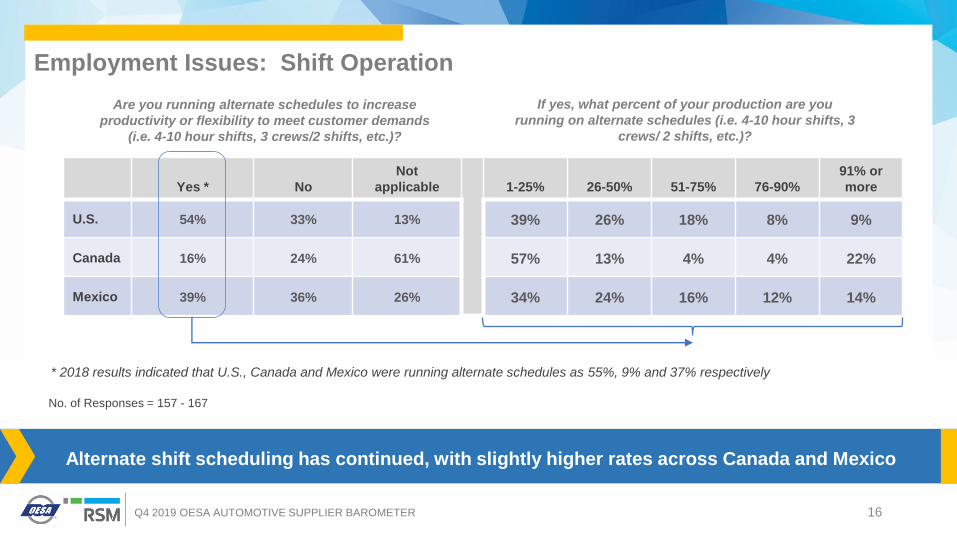
Yes * No
Not
applicable 1-25% 26-50% 51-75% 76-90%
91% or
more
U.S. 54% 33% 13% 39% 26% 18% 8% 9%
Canada 16% 24% 61% 57% 13% 4% 4% 22%
Mexico 39% 36% 26% 34% 24% 16% 12% 14%
* 2018 results indicated that U.S., Canada and Mexico were running alternate schedules as 55%, 9% and 37% respectively
No. of Responses = 157 - 167
Are you running alternate schedules to increase
productivity or flexibility to meet customer demands
(i.e. 4-10 hour shifts, 3 crews/2 shifts, etc.)?
If yes, what percent of your production are you
running on alternate schedules (i.e. 4-10 hour shifts, 3
crews/ 2 shifts, etc.)?
Alternate shift scheduling has continued, with slightly higher rates across Canada and Mexico
Employment Issues: Shift Operation
17Q4 2019 OESA AUTOMOTIVE SUPPLIER BAROMETER
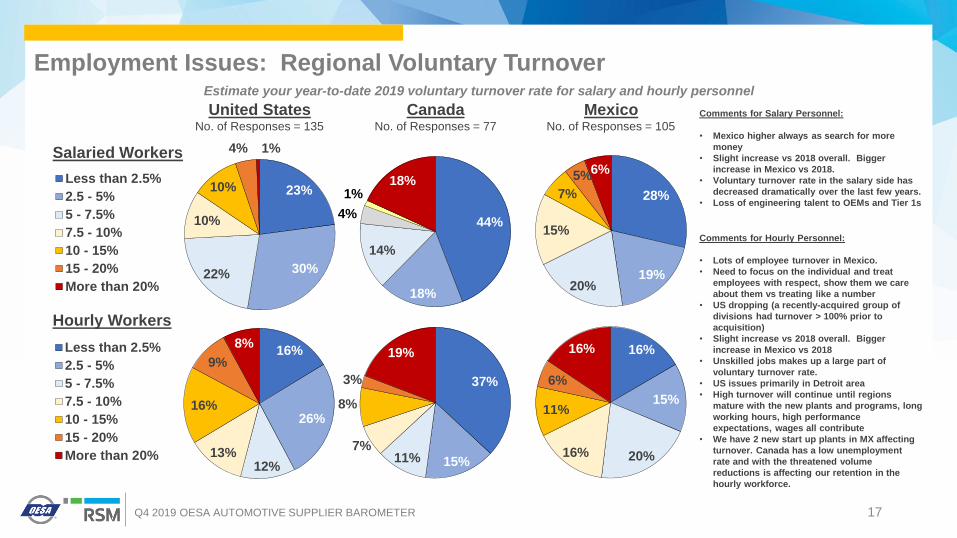
28%
19%20%
15%
7%
5%6%
44%
18%
14%
4%
1%18%
23%
30%22%
10%
10%
4% 1%
Less than 2.5%
2.5 - 5%
5 - 7.5%
7.5 - 10%
10 - 15%
15 - 20%
More than 20%
16%
15%
20%16%
11%
6%
16%
Salaried Workers
Hourly Workers
United States Canada MexicoNo. of Responses = 135 No. of Responses = 77 No. of Responses = 105
Estimate your year-to-date 2019 voluntary turnover rate for salary and hourly personnel
16%
26%
12%13%
16%
9%
8%Less than 2.5%
2.5 - 5%
5 - 7.5%
7.5 - 10%
10 - 15%
15 - 20%
More than 20%
Employment Issues: Regional Voluntary Turnover
37%
15%11%7%
8%
3%
19%
Comments for Salary Personnel:
• Mexico higher always as search for more
money
• Slight increase vs 2018 overall. Bigger
increase in Mexico vs 2018.
• Voluntary turnover rate in the salary side has
decreased dramatically over the last few years.
• Loss of engineering talent to OEMs and Tier 1s
Comments for Hourly Personnel:
• Lots of employee turnover in Mexico.
• Need to focus on the individual and treat
employees with respect, show them we care
about them vs treating like a number
• US dropping (a recently-acquired group of
divisions had turnover > 100% prior to
acquisition)
• Slight increase vs 2018 overall. Bigger
increase in Mexico vs 2018
• Unskilled jobs makes up a large part of
voluntary turnover rate.
• US issues primarily in Detroit area
• High turnover will continue until regions
mature with the new plants and programs, long
working hours, high performance
expectations, wages all contribute
• We have 2 new start up plants in MX affecting
turnover. Canada has a low unemployment
rate and with the threatened volume
reductions is affecting our retention in the
hourly workforce.
18Q4 2019 OESA AUTOMOTIVE SUPPLIER BAROMETER
SBI Score = 53; drops 4 points from the Q1 level of 57
Tax reform supports optimism while trade and declining sales drive pessimism
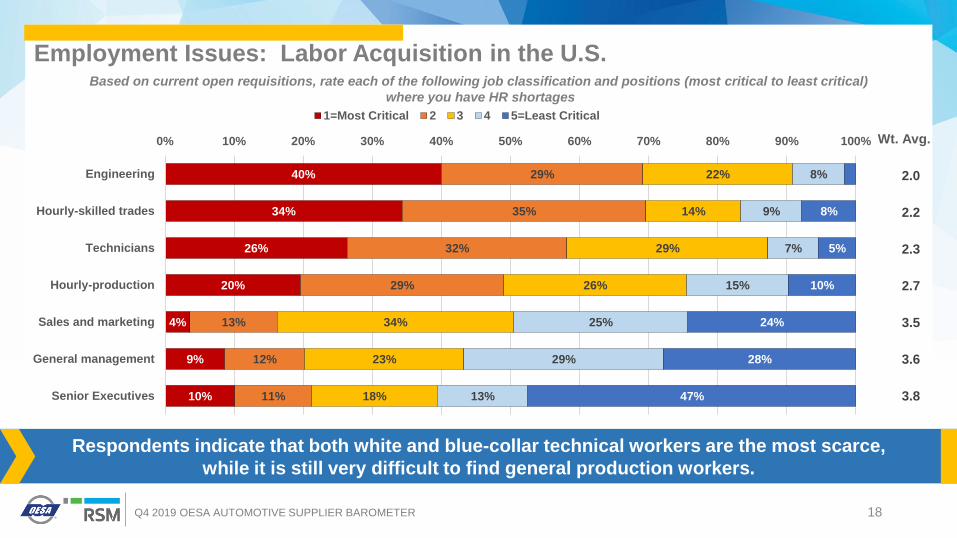
Respondents indicate that both white and blue-collar technical workers are the most scarce,
while it is still very difficult to find general production workers.
Wt. Avg.
Employment Issues: Labor Acquisition in the U.S.Based on current open requisitions, rate each of the following job classification and positions (most critical to least critical)
where you have HR shortages
40%
34%
26%
20%
4%
9%
10%
29%
35%
32%
29%
13%
12%
11%
22%
14%
29%
26%
34%
23%
18%
8%
9%
7%
15%
25%
29%
13%
8%
5%
10%
24%
28%
47%
0% 10% 20% 30% 40% 50% 60% 70% 80% 90% 100%
Engineering
Hourly-skilled trades
Technicians
Hourly-production
Sales and marketing
General management
Senior Executives
1=Most Critical 2 3 4 5=Least Critical
2.0
2.2
2.3
2.7
3.5
3.6
3.8

19Q4 2019 OESA AUTOMOTIVE SUPPLIER BAROMETER
SBI Score = 53; drops 4 points from the Q1 level of 57
Tax reform supports optimism while trade and declining sales drive pessimism
Based on current open requisitions, rate each of the following job classification and positions (most critical to least critical)
where you have HR shortages
Employment Issues: Labor Acquisition in Canada
Technical knowledge shortages are spread throughout Canada as well,
but more so on the shop floor.
Wt. Avg.
23%
29%
24%
17%
11%
45%
25%
28%
17%
7%
15%
9%
19%
29%
31%
38%
18%
30%
17%
6%
11%
10%
21%
25%
19%
4%
6%
7%
7%
7%
39%
37%
70%
0% 10% 20% 30% 40% 50% 60% 70% 80% 90% 100%
Technicians
Hourly-skilled Trades
Engineering
Hourly-production
General Management
Sales and Marketing
Senior Executives
1=Most Critical 2 3 4 5=Least Critical
2.3
2.4
2.5
2.8
3.8
3.8
4.3
20Q4 2019 OESA AUTOMOTIVE SUPPLIER BAROMETER
SBI Score = 53; drops 4 points from the Q1 level of 57
Tax reform supports optimism while trade and declining sales drive pessimism
Based on current open requisitions, rate each of the following job classification and positions (most critical to least critical)
where you have HR shortages
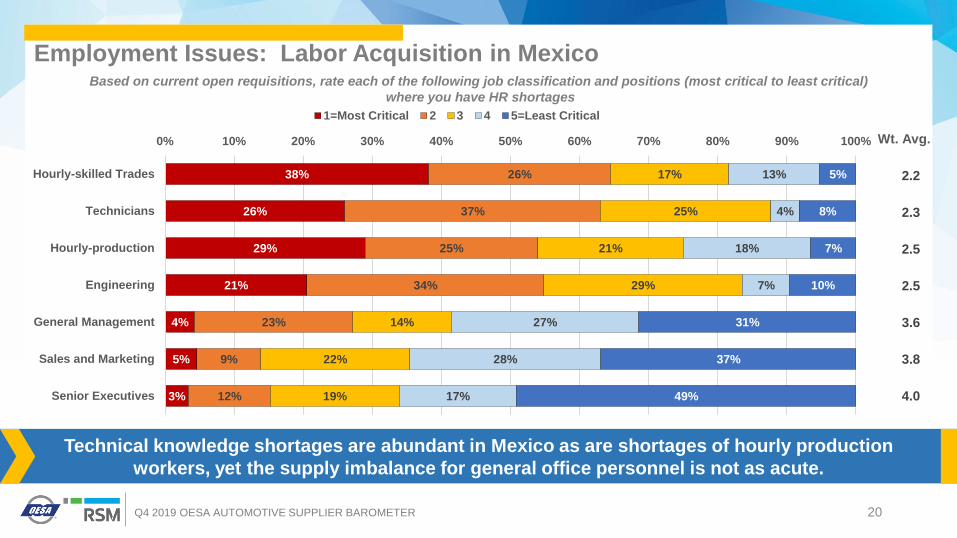
Employment Issues: Labor Acquisition in Mexico
Technical knowledge shortages are abundant in Mexico as are shortages of hourly production
workers, yet the supply imbalance for general office personnel is not as acute.
Wt. Avg.
38%
26%
29%
21%
4%
5%
3%
26%
37%
25%
34%
23%
9%
12%
17%
25%
21%
29%
14%
22%
19%
13%
4%
18%
7%
27%
28%
17%
5%
8%
7%
10%
31%
37%
49%
0% 10% 20% 30% 40% 50% 60% 70% 80% 90% 100%
Hourly-skilled Trades
Technicians
Hourly-production
Engineering
General Management
Sales and Marketing
Senior Executives
1=Most Critical 2 3 4 5=Least Critical
2.2
2.3
2.5
2.5
3.6
3.8
4.0
21Q4 2019 OESA AUTOMOTIVE SUPPLIER BAROMETER
SBI Score = 53; drops 4 points from the Q1 level of 57
Tax reform supports optimism while trade and declining sales drive pessimism
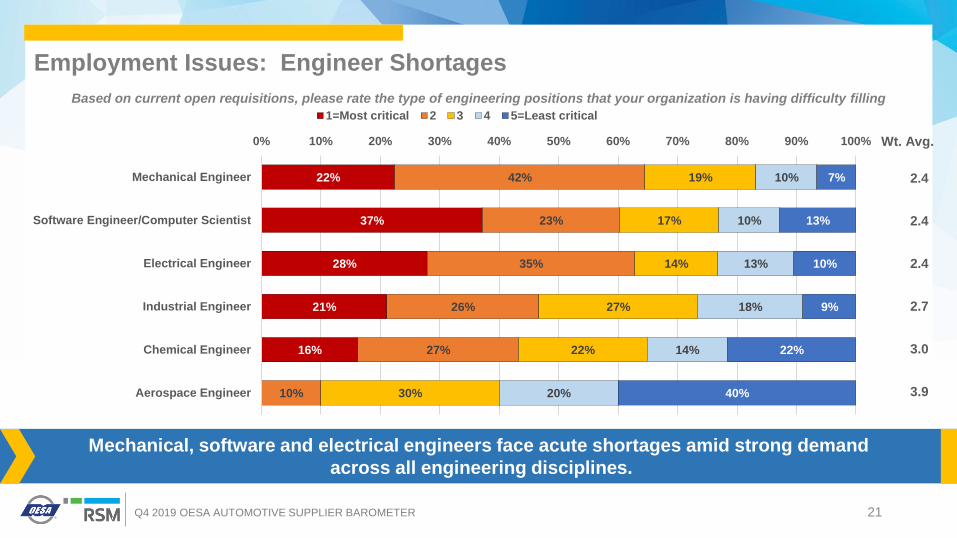
22%
37%
28%
21%
16%
42%
23%
35%
26%
27%
10%
19%
17%
14%
27%
22%
30%
10%
10%
13%
18%
14%
20%
7%
13%
10%
9%
22%
40%
0% 10% 20% 30% 40% 50% 60% 70% 80% 90% 100%
Mechanical Engineer
Software Engineer/Computer Scientist
Electrical Engineer
Industrial Engineer
Chemical Engineer
Aerospace Engineer
1=Most critical 2 3 4 5=Least critical
2.4
2.4
2.4
2.7
3.0
3.9
Based on current open requisitions, please rate the type of engineering positions that your organization is having difficulty filling
Mechanical, software and electrical engineers face acute shortages amid strong demand
across all engineering disciplines.
Wt. Avg.
Employment Issues: Engineer Shortages
22Q4 2019 OESA AUTOMOTIVE SUPPLIER BAROMETER
SBI Score = 53; drops 4 points from the Q1 level of 57
Tax reform supports optimism while trade and declining sales drive pessimism
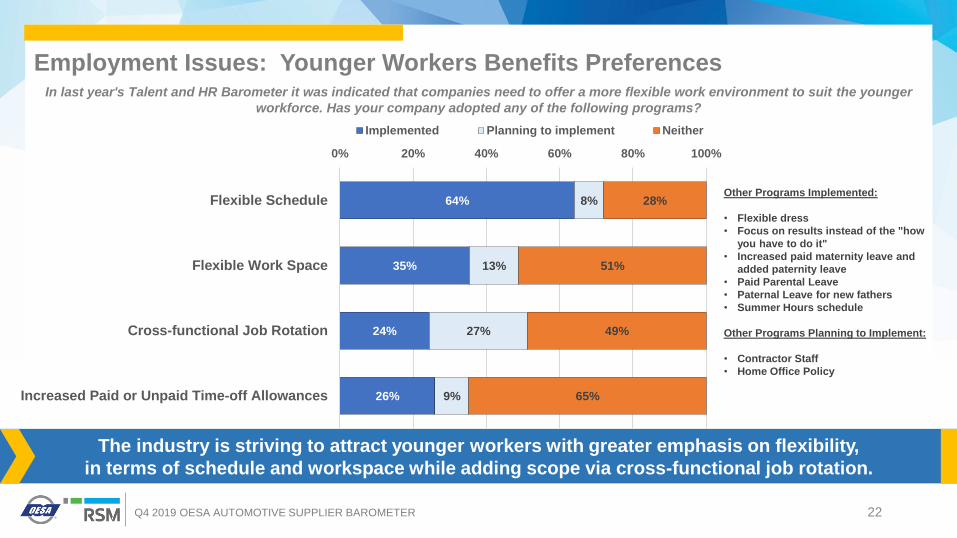
64%
35%
24%
26%
8%
13%
27%
9%
28%
51%
49%
65%
0% 20% 40% 60% 80% 100%
Flexible Schedule
Flexible Work Space
Cross-functional Job Rotation
Increased Paid or Unpaid Time-off Allowances
Implemented Planning to implement Neither
In last year's Talent and HR Barometer it was indicated that companies need to offer a more flexible work environment to suit the younger
workforce. Has your company adopted any of the following programs?
The industry is striving to attract younger workers with greater emphasis on flexibility,
in terms of schedule and workspace while adding scope via cross-functional job rotation.
Employment Issues: Younger Workers Benefits Preferences
Other Programs Implemented:
• Flexible dress
• Focus on results instead of the "how
you have to do it"
• Increased paid maternity leave and
added paternity leave
• Paid Parental Leave
• Paternal Leave for new fathers
• Summer Hours schedule
Other Programs Planning to Implement:
• Contractor Staff
• Home Office Policy
23Q4 2019 OESA AUTOMOTIVE SUPPLIER BAROMETER
SBI Score = 53; drops 4 points from the Q1 level of 57
Tax reform supports optimism while trade and declining sales drive pessimism
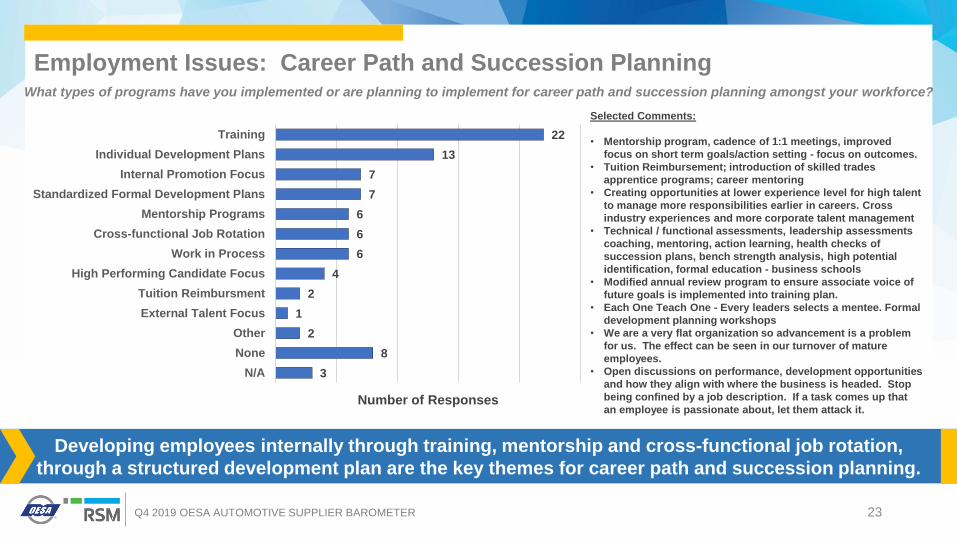
What types of programs have you implemented or are planning to implement for career path and succession planning amongst your workforce?
Developing employees internally through training, mentorship and cross-functional job rotation,
through a structured development plan are the key themes for career path and succession planning.
Employment Issues: Career Path and Succession Planning
22
13
7
7
6
6
6
4
2
1
2
8
3
Training
Individual Development Plans
Internal Promotion Focus
Standardized Formal Development Plans
Mentorship Programs
Cross-functional Job Rotation
Work in Process
High Performing Candidate Focus
Tuition Reimbursment
External Talent Focus
Other
None
N/A
Number of Responses
Selected Comments:
• Mentorship program, cadence of 1:1 meetings, improved
focus on short term goals/action setting - focus on outcomes.
• Tuition Reimbursement; introduction of skilled trades
apprentice programs; career mentoring
• Creating opportunities at lower experience level for high talent
to manage more responsibilities earlier in careers. Cross
industry experiences and more corporate talent management
• Technical / functional assessments, leadership assessments
coaching, mentoring, action learning, health checks of
succession plans, bench strength analysis, high potential
identification, formal education - business schools
• Modified annual review program to ensure associate voice of
future goals is implemented into training plan.
• Each One Teach One - Every leaders selects a mentee. Formal
development planning workshops
• We are a very flat organization so advancement is a problem
for us. The effect can be seen in our turnover of mature
employees.
• Open discussions on performance, development opportunities
and how they align with where the business is headed. Stop
being confined by a job description. If a task comes up that
an employee is passionate about, let them attack it.
24Q4 2019 OESA AUTOMOTIVE SUPPLIER BAROMETER
SBI Score = 53; drops 4 points from the Q1 level of 57
Tax reform supports optimism while trade and declining sales drive pessimism
36%
34%
18%
13%
9%
14%
9%
4%
4%
38%
35%
25%
25%
28%
20%
23%
24%
10%
15%
13%
20%
23%
26%
20%
26%
21%
18%
8%
13%
18%
22%
21%
21%
18%
15%
22%
4%
6%
18%
17%
16%
24%
24%
36%
46%
0% 10% 20% 30% 40% 50% 60% 70% 80% 90% 100%
Lack of qualified candidates
Competition from other industry sectors
Wages and Benefits
Position location
Advancement opportunities
Perceived work/life balance
Company awareness/reputation
Industry reputation
Perceived long-term employment stability
1=Most prevalent 2 3 4 5=Least prevalent
Rate each of the following reasons that you believe prevent you from filling the majority of your open requisitions
2.1
2.2
2.9
3.0
3.1
3.2
3.2
3.5
3.9
Wt. Avg.
Employment Issues: Filling Open Positions
With sub 4% unemployment, a lack of qualified candidates is the most severe hiring constraint.
Higher competition from other industries and few candidates drive wages and benefits higher.
25Q4 2019 OESA AUTOMOTIVE SUPPLIER BAROMETER
SBI Score = 53; drops 4 points from the Q1 level of 57
Tax reform supports optimism while trade and declining sales drive pessimism
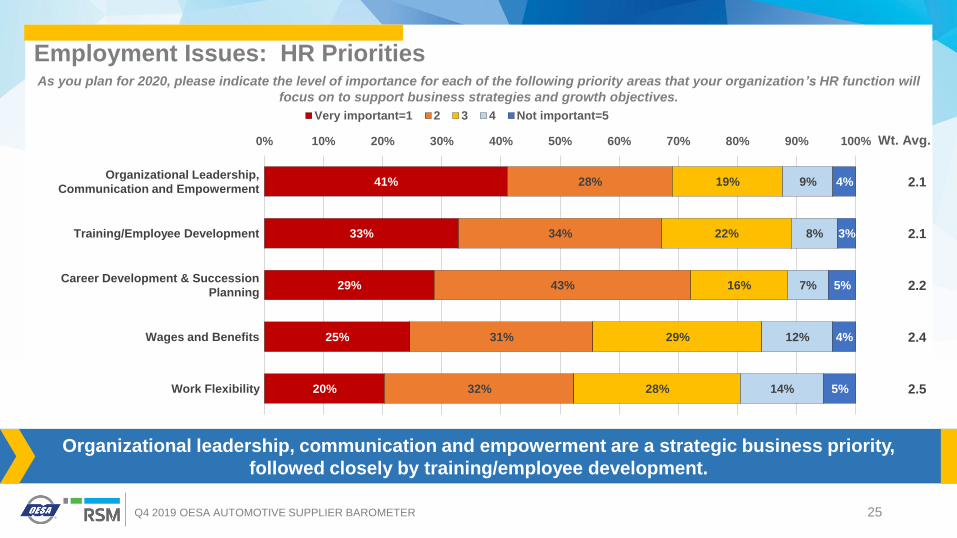
As you plan for 2020, please indicate the level of importance for each of the following priority areas that your organization’s HR function will
focus on to support business strategies and growth objectives.
Wt. Avg.
Employment Issues: HR Priorities
Organizational leadership, communication and empowerment are a strategic business priority,
followed closely by training/employee development.
41%
33%
29%
25%
20%
28%
34%
43%
31%
32%
19%
22%
16%
29%
28%
9%
8%
7%
12%
14%
4%
3%
5%
4%
5%
0% 10% 20% 30% 40% 50% 60% 70% 80% 90% 100%
Very important=1 2 3 4 Not important=5
Organizational Leadership,
Communication and Empowerment
Training/Employee Development
Career Development & Succession
Planning
Wages and Benefits
Work Flexibility
2.1
2.1
2.2
2.4
2.5
26Q4 2019 OESA AUTOMOTIVE SUPPLIER BAROMETER
SBI Score = 53; drops 4 points from the Q1 level of 57
Tax reform supports optimism while trade and declining sales drive pessimism
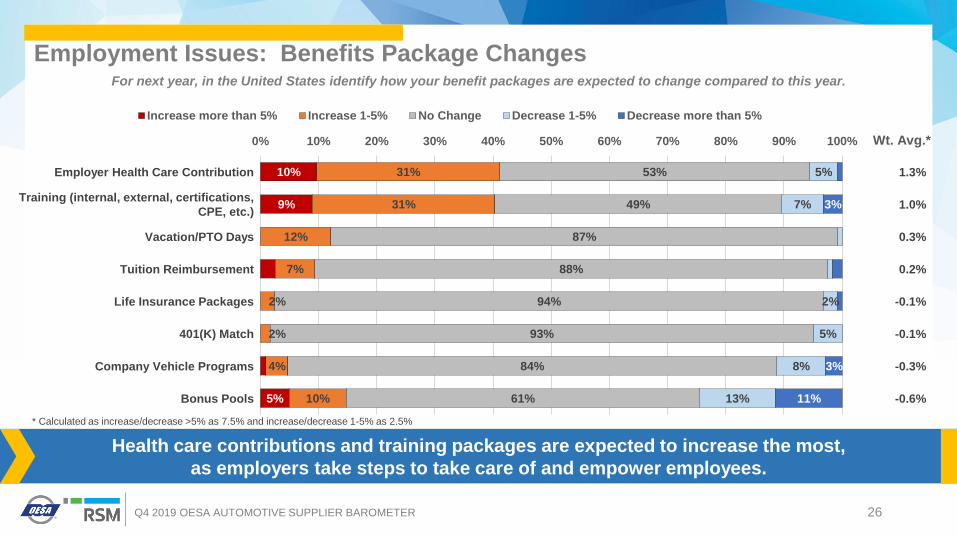
1.3%
1.0%
0.3%
0.2%
-0.1%
-0.1%
-0.3%
-0.6%
10%
9%
5%
31%
31%
12%
7%
2%
2%
4%
10%
53%
49%
87%
88%
94%
93%
84%
61%
5%
7%
2%
5%
8%
13%
3%
3%
11%
0% 10% 20% 30% 40% 50% 60% 70% 80% 90% 100%
Increase more than 5% Increase 1-5% No Change Decrease 1-5% Decrease more than 5%
Employer Health Care Contribution
Training (internal, external, certifications,
CPE, etc.)
Vacation/PTO Days
Tuition Reimbursement
Life Insurance Packages
401(K) Match
Company Vehicle Programs
Bonus Pools
For next year, in the United States identify how your benefit packages are expected to change compared to this year.
Health care contributions and training packages are expected to increase the most,
as employers take steps to take care of and empower employees.
Employment Issues: Benefits Package Changes
Wt. Avg.*
* Calculated as increase/decrease >5% as 7.5% and increase/decrease 1-5% as 2.5%
27Q4 2019 OESA AUTOMOTIVE SUPPLIER BAROMETER
SBI Score = 53; drops 4 points from the Q1 level of 57
Tax reform supports optimism while trade and declining sales drive pessimism
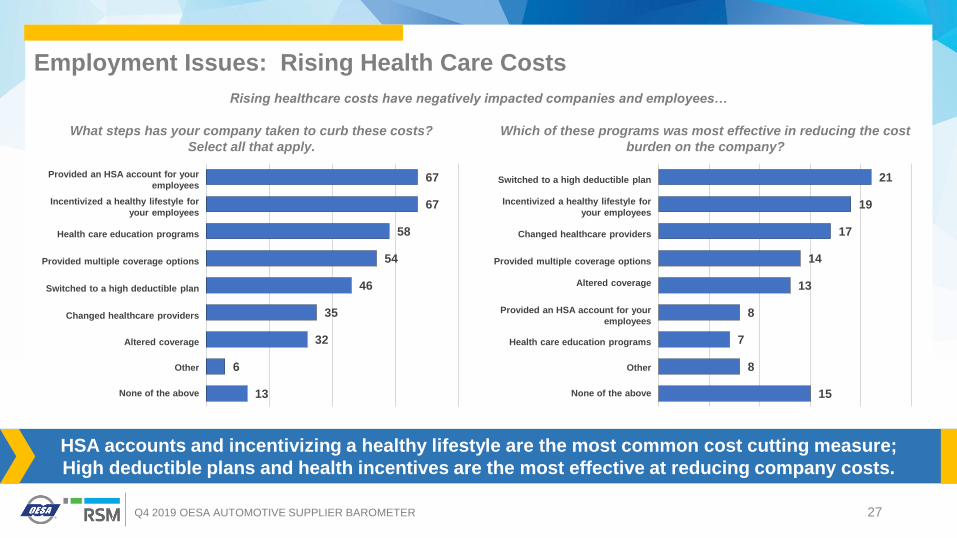
Rising healthcare costs have negatively impacted companies and employees…
HSA accounts and incentivizing a healthy lifestyle are the most common cost cutting measure;
High deductible plans and health incentives are the most effective at reducing company costs.
Employment Issues: Rising Health Care Costs
What steps has your company taken to curb these costs?
Select all that apply.
Which of these programs was most effective in reducing the cost
burden on the company?
67
67
58
54
46
35
32
6
13
21
19
17
14
13
8
7
8
15
Provided an HSA account for your
employees
Incentivized a healthy lifestyle for
your employees
Health care education programs
Provided multiple coverage options
Switched to a high deductible plan
Changed healthcare providers
Altered coverage
Other
None of the above
Switched to a high deductible plan
Incentivized a healthy lifestyle for
your employees
Changed healthcare providers
Provided multiple coverage options
Altered coverage
Provided an HSA account for your
employees
Health care education programs
Other
None of the above
28Q4 2019 OESA AUTOMOTIVE SUPPLIER BAROMETER
OESA Human Resources Council meetings focus on Talent, Success Planning and
other topics included in this quarter’s barometer.
If you are interested in learning more about the council, please contact:
Ginger Juncker, Executive Director, Councils and Member Programs
[email protected] / 248.430.5953
Karen Bohannon, Manager Administration and On-site Facilities
[email protected] / 248.430.5965
OESA Human Resources Council
29Q4 2019 OESA AUTOMOTIVE SUPPLIER BAROMETER
The information and opinions contained in this report are for general information purposes. Comments are edited only for
spelling and may contain grammatical errors due to their verbatim nature. Responses to this survey are confidential.
Therefore, only aggregated results will be reported and individual responses will not be released or shared.
Antitrust Statement:
Respondents/participants should not contact competitors to discuss responses, or to discuss the issues dealt with in the
survey. It is an absolute imperative to consult legal counsel about any contacts with competitors. All pricing and other terms
of sale decisions and negotiating strategies should be handled on an individual company basis.
OESA Automotive Supplier Barometer is a survey of the top
executives of OESA regular member companies. The OESA
Automotive Supplier Barometer takes the pulse of the suppliers'
twelve month business sentiment. In addition, it provides a snapshot
of the industry commercial issues, business environment and
business strategies that influence the supplier industry.
www.oesa.org.
Survey Methodology
• Data collected October 15 – October 26 via invitation to online survey.
• Executives of OESA supplier companies.
• 145 complete survey responses were received, with 227 responses total.
Contacts
Mike Jackson
Executive Director
Strategy and Research
248.430.5954
Joe Zaciek
Manager
Research and Industry Analysis
248.430.5960
Larry Keyler
RSM Detroit Office Managing Partner
317.805.6205
Original Equipment Suppliers Association
25925 Telegraph Road
Suite 350
Southfield, Michigan 48033
RSM US LLP is the leading provider of audit, tax and consulting
services focused on the middle market, with nearly 10,000
professionals nationwide. It is a licensed CPA firm and the U.S.
member of RSM International, a global network of independent audit,
tax and consulting firms with more than 41,000 people in 116
countries. RSM uses its deep understanding of the needs and
aspirations of clients to help them succeed. For more information, visit
rsmus.com, like us on Facebook at RSM US LLP, follow us on Twitter
@RSMUSLLP or connect with us on LinkedIn.