Embed Size (px)
Citation preview

Michiko Masutani
NOAA/NWS/NCEP/EMCWyle Information Systems
Observing System Simulation Experiments (OSSE) to estimate the
potential of future observations

Full OSSEThere are many types of simulation experiments. We have to call our OSSE a ‘Full OSSE’ to avoid confusion.
● A Nature Run (NR, proxy true atmosphere) is produced from a free forecast run using the highest resolution operational model.● Calibration to compare data impacts between real and simulated data will be performed.●Data impact on analysis and forecast will be evaluated.● A Full OSSE can provide detailed quantitative evaluations of the configuration of observing systems.● A Full OSSE can use an existing operational system and help the development of an operational system
Full OSSEs at NCEP and Internationally collaborative Joint OSSEs

Full OSSE at NCEPMain Contributors
Michiko Masutani[1#], John S. Woollen[1+], Stephen J. Lord[1],G. David Emmitt[3], Thomas J. Kleespies[2], Sidney A. Wood[3],
Steven Greco[3], Haibing Sun[2%], Joseph Terry[4+], Russ Treadon[1], Kenneth A. Campana[1],
Yucheng Song[$1], Zoltan Toth[1]
[1]NOAA/NWS/NCEP/EMC, [2]NOAA/NESDIS, [3]Simpson Weather Associates,
[4]NASA/GSFC, [#]Wyle Information Systems, [+]SAIC[%]QSS Group, Inc., [$]IMSG
Plus many people in NOAA/NWS/NCEP, NASA/GSFC, NOAA/NESDIS and ECMWF. Forward program for LOS was prepared by J. Derber. We would like to acknowledge contributions from W. Yang, W. Baker of NCEP, R. Atlas, G. Brin, S. Bloom of NASA/GSFC, and V. Kapoor, P. Li, W. Wolf, J. Yoe, M. Goldberg of NOAA/NESDIS. We would like to thank Anthony Hollingsworth, Roger Saunder and the ECMWF data support section for the T213 Nature Run.
Main components of NCEP OSSE with ECMWF T213 Nature Run
at NCEP
Nature Run (Becker et al. 1996)• Wintertime Nature run (1 month, Feb5-Mar.7,1993)• Produced by ECMWF model T213 (~0.5 deg)• 1993 data distribution for calibrationData Assimilation System• NCEP DA (SSI) withT62 ~ 2.5 deg, 300km and T170 ~1 deg, 110km• Simulate and assimilate level1B radiance
– Different method than using interpolated temperature as retrieval• Use line-of- sight (LOS) wind for DWL
– not u and v components• Calibration performed• Effects of observational error tested• Nature Run clouds are evaluated and adjusted

OSSE Calibration• Real data sensitivity compared to sensitivity with
simulated dataIm
pact
of w
ithdr
awin
g R
AO
B w
inds
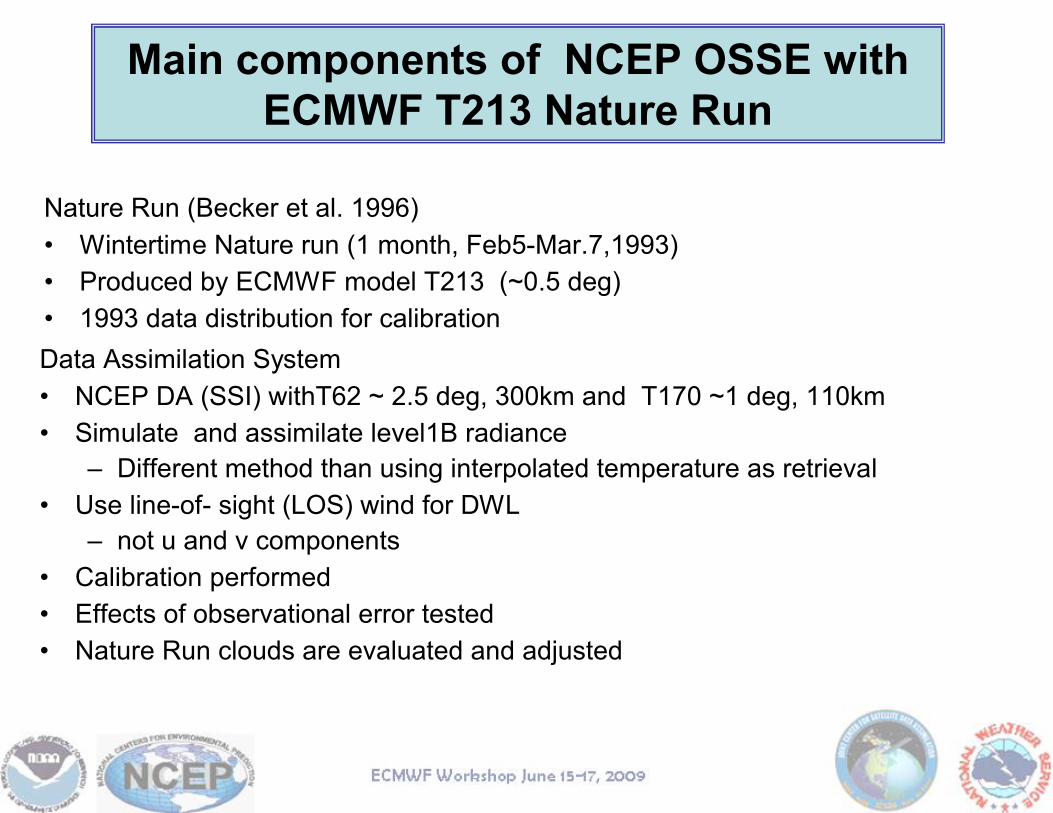
Results from OSSEs forDoppler Wind Lidar (DWL)
Hybrid-DWL: Ultimate DWL that provides full tropospheric LOS soundings, clouds permitting.
Upper-DWL: An instrument that provides mid- and upper-tropospheric winds down only to the levels of significant cloud coverage.
Lower-DWL: An instrument that provides wind observations only from clouds and the PBL.
Non-Scan DWL : A non-scanning instrument that provides full tropospheric LOS soundings, clouds permitting, along a single line that parallels the ground track. (ADM-Aeolus like DWL)
Zonally and time averaged number of DWL measurements in a 2.5 degree grid box with 50km thickness for 6 hours. Numbers are divided by 1000. Note that the 2.5 degree boxes are smaller in size at higher latitudes. Estimate impact of real DWL from
combination.

Difference in RMSE from the Nature Run for 200hPa meridional wind. Analysis using 2004 NCEP DAS with T62 model. Top: reduction in RMSE from the inclusion of TOVS data. Bottom: reduction in RMSE from the addition of Hybrid_DWL to the CTL run. Averaged between Feb13 and Feb28, with twice daily sampling.
Impact of Radiance
V 200hPa Analysis
Impact of Hybrid DWLCTL including Radiance
Maximum over tropics
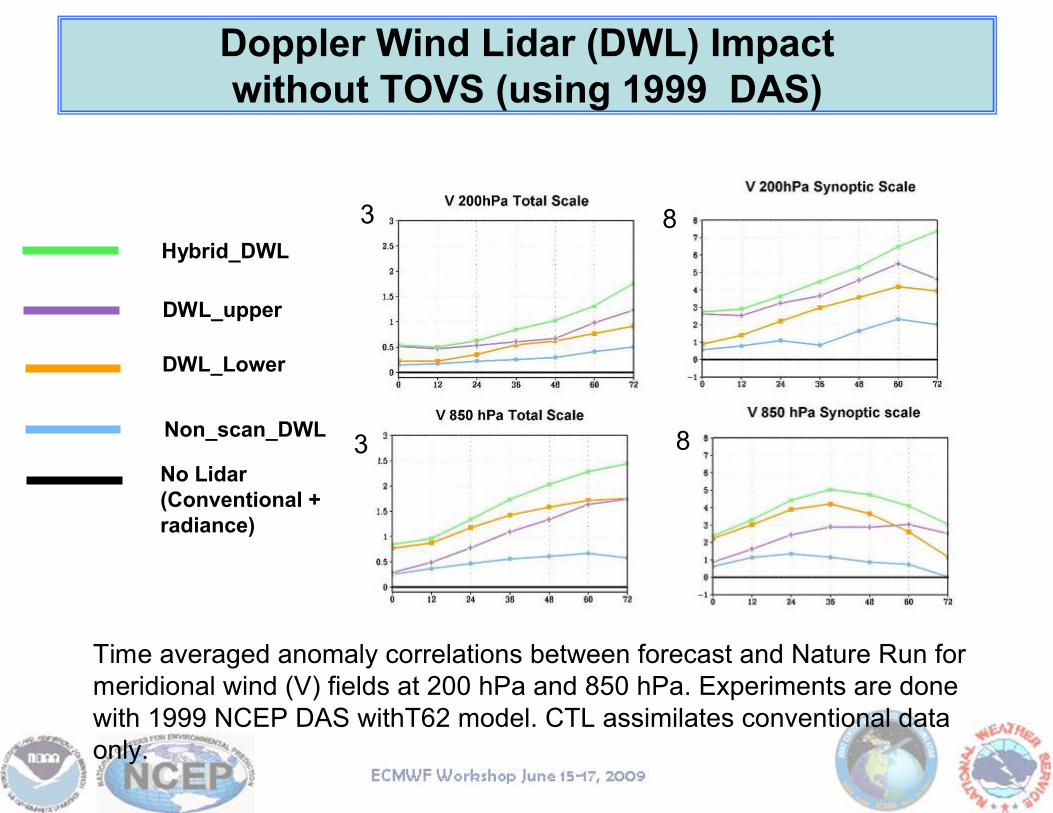
Doppler Wind Lidar (DWL) Impactwithout TOVS (using 1999 DAS)
Time averaged anomaly correlations between forecast and Nature Run for meridional wind (V) fields at 200 hPa and 850 hPa. Experiments are done with 1999 NCEP DAS withT62 model. CTL assimilates conventional data only.
3
3
8
8No Lidar (Conventional + radiance)
DWL_Lower
DWL_upper
Non_scan_DWL
Hybrid_DWL

Forecast hour
Doppler Wind Lidar (DWL) ImpactWith TOVS (using 2004 DAS)
3
31.2
1.2
Dashed green line is for scan DWL with 20 times less data to make the observation counts similar to non-scan DWL. This experiment is done with 2004 NCEP DAS with T62 model.
No Lidar (Conventional + NOAA11 and NOAA12 TOVS)
Scan DWL_Lower
Hybrid DWL Uniformly thinned to 5%
Scan DWL_upper
Non-scan_DWL
Hybrid_DWL

2004 DAS Hybrid DWL- CTL (99)
1999 DAS Hybrid DWL- CTL (99)
2004 DAS CTL - 1999 DAS CTL(Conventional + TOVS)
Data Impact of scan DWL1999 DAS vs. 2004 DAS
1999 DAS CTL - CTL (99)
Differences in anomaly correlation
Synoptic ScaleTotal scale200 mb V
Impact of 2004 DAS
Impact of DWLImpact of DWL + better DASThese experiments are done with T62 model with SSI.

T62 CTL (reference)(Conventional data only)
Data Impact of scan DWL vs. Model Resolution
T62 CTL with Hybrid DWL- CTL (T62)
T170 CTL - CTL (T62)
T170 CTL with Hybrid DWL- CTL (T62)
◊ CTL
X CTL+Hybrid DWL
Differences in anomaly correlation for 200hPa V
Synoptic ScaleTotal scale
105
Impact of DWL
Impact of DWL + T170
Impact of T170 model
Adding Hybrid lidar has large impact on analysis but increasing the resolution has more impact on forecast after one or two days.
These experiments are done with 2004 T62 DAS with SSI.
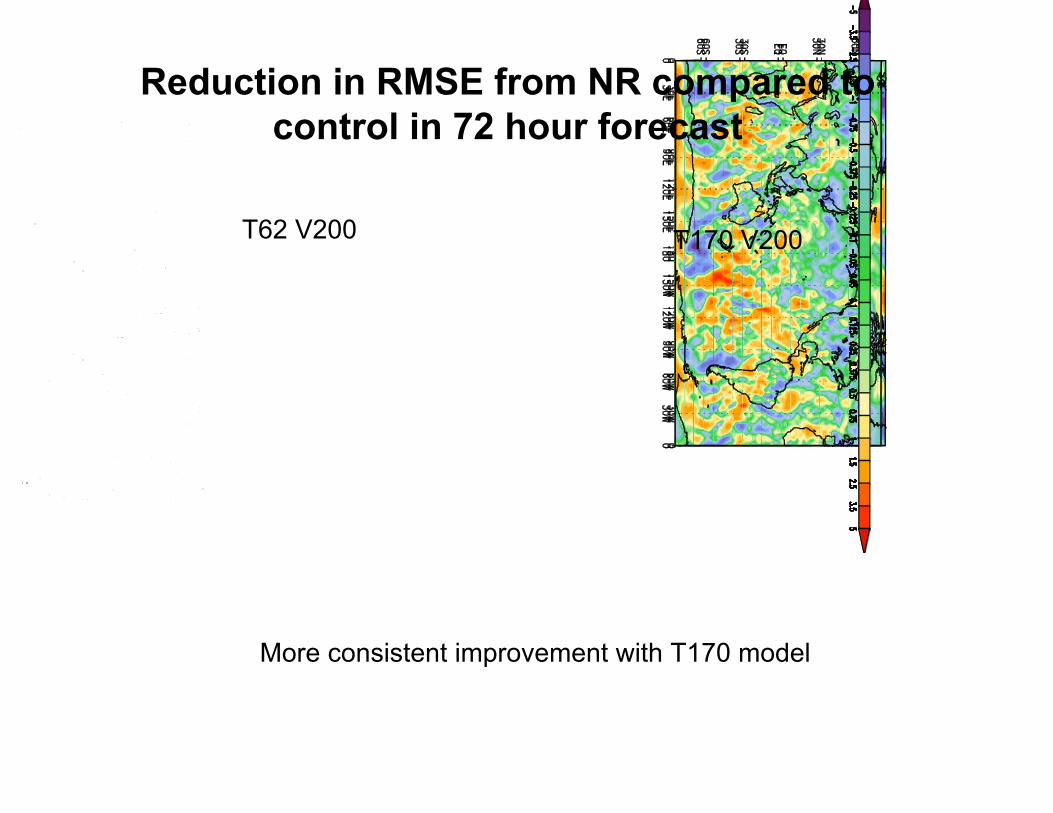
Reduction in RMSE from NR compared to control in 72 hour forecast
T62 V200 T170 V200
More consistent improvement with T170 model
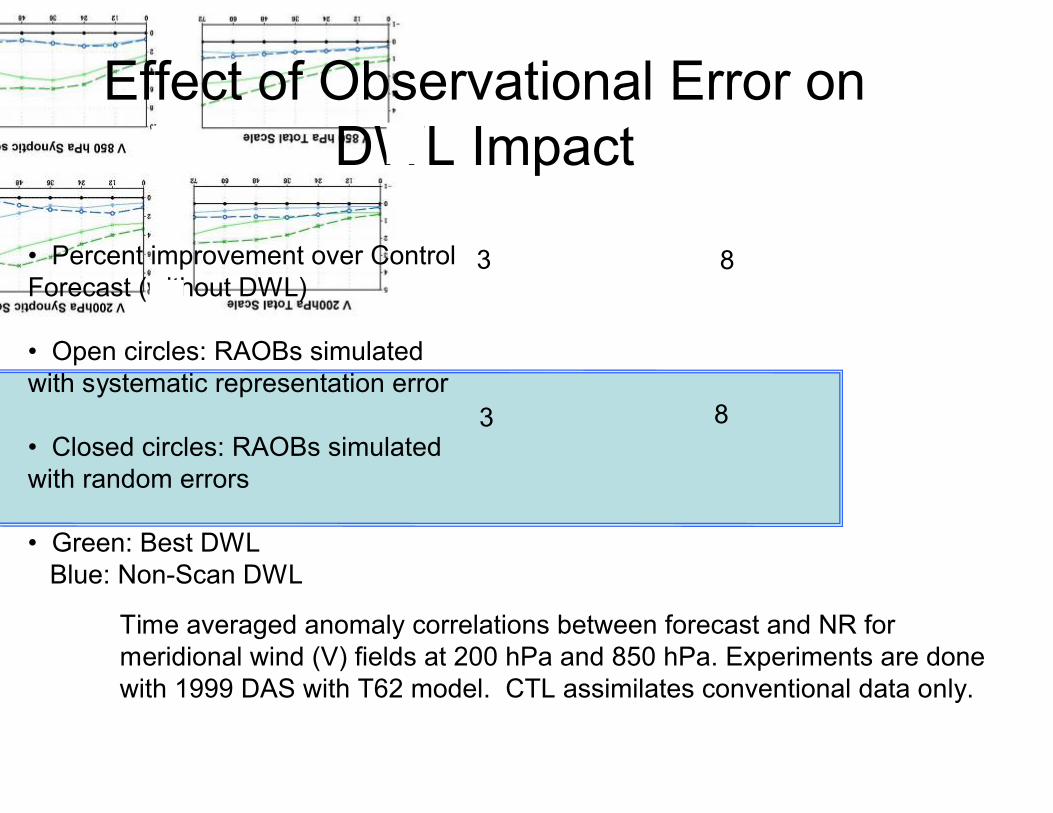
Effect of Observational Error on DWL Impact
• Percent improvement over Control Forecast (without DWL)
• Open circles: RAOBs simulated with systematic representation error
• Closed circles: RAOBs simulated with random errors
• Green: Best DWL Blue: Non-Scan DWL
3 8
3 8
Time averaged anomaly correlations between forecast and NR for meridional wind (V) fields at 200 hPa and 850 hPa. Experiments are done with 1999 DAS with T62 model. CTL assimilates conventional data only.
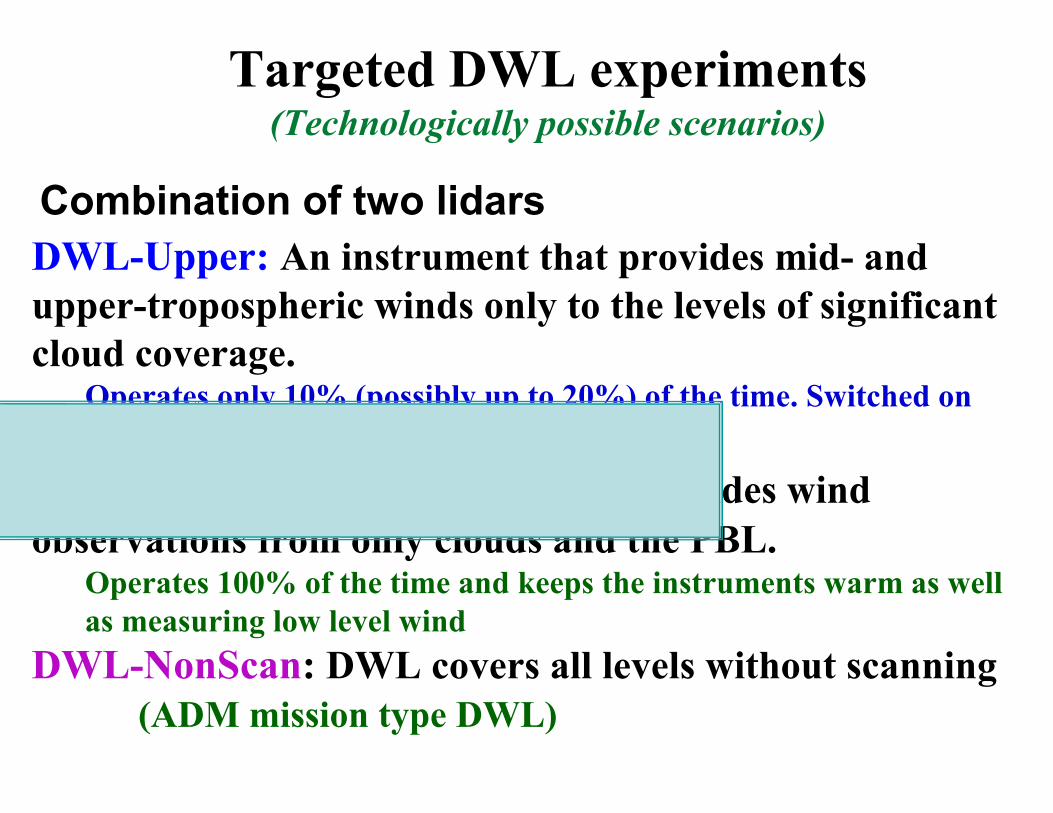
DWL-Upper: An instrument that provides mid- and upper-tropospheric winds only to the levels of significant cloud coverage.
Operates only 10% (possibly up to 20%) of the time. Switched on for 10 min at a time. Used with DWL-Lower.
DWL-Lower: An instrument that provides wind observations from only clouds and the PBL.
Operates 100% of the time and keeps the instruments warm as well as measuring low level wind
DWL-NonScan: DWL covers all levels without scanning(ADM mission type DWL)
Targeted DWL experiments(Technologically possible scenarios)
Combination of two lidars
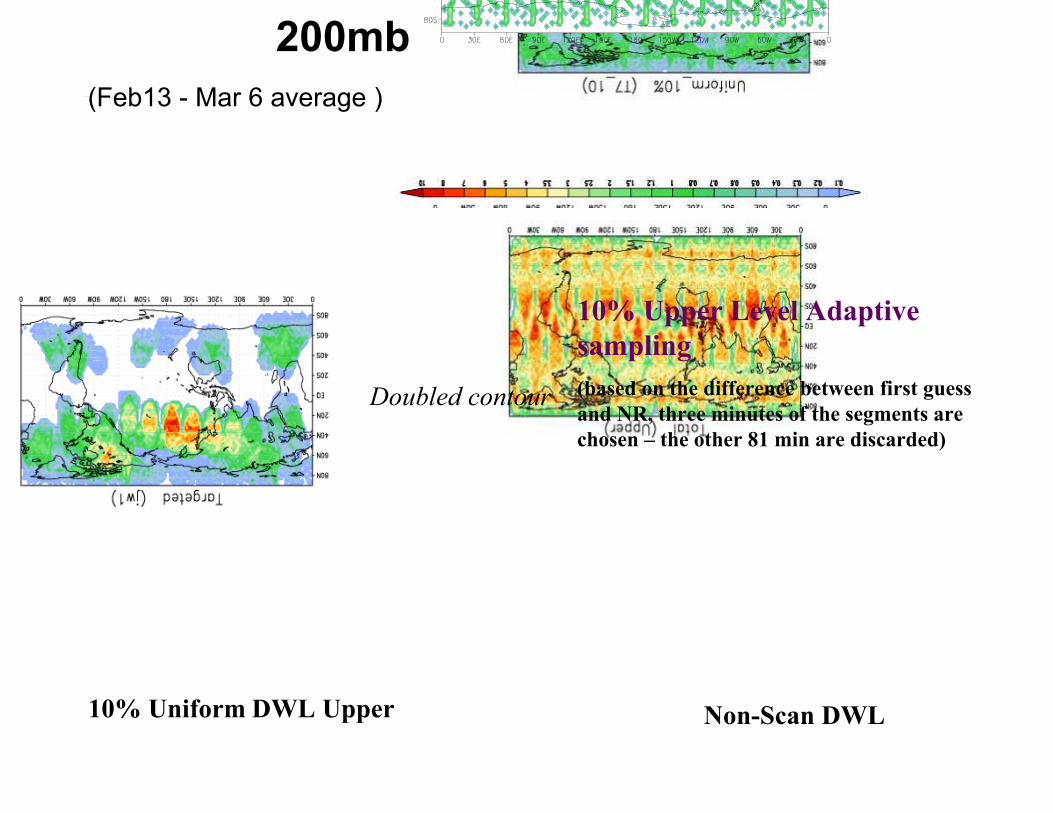
200mb
100% Upper Level
10% Uniform DWL Upper
10% Upper Level Adaptive sampling(based on the difference between first guess and NR, three minutes of the segments are chosen – the other 81 min are discarded)
Doubled contour
(Feb13 - Mar 6 average )
Non-Scan DWL
CTLNo Lidar (Conventional + NOAA11 and NOAA12 TOVS)No Lidar (Conventional + NOAA11 and NOAA12 TOVS)
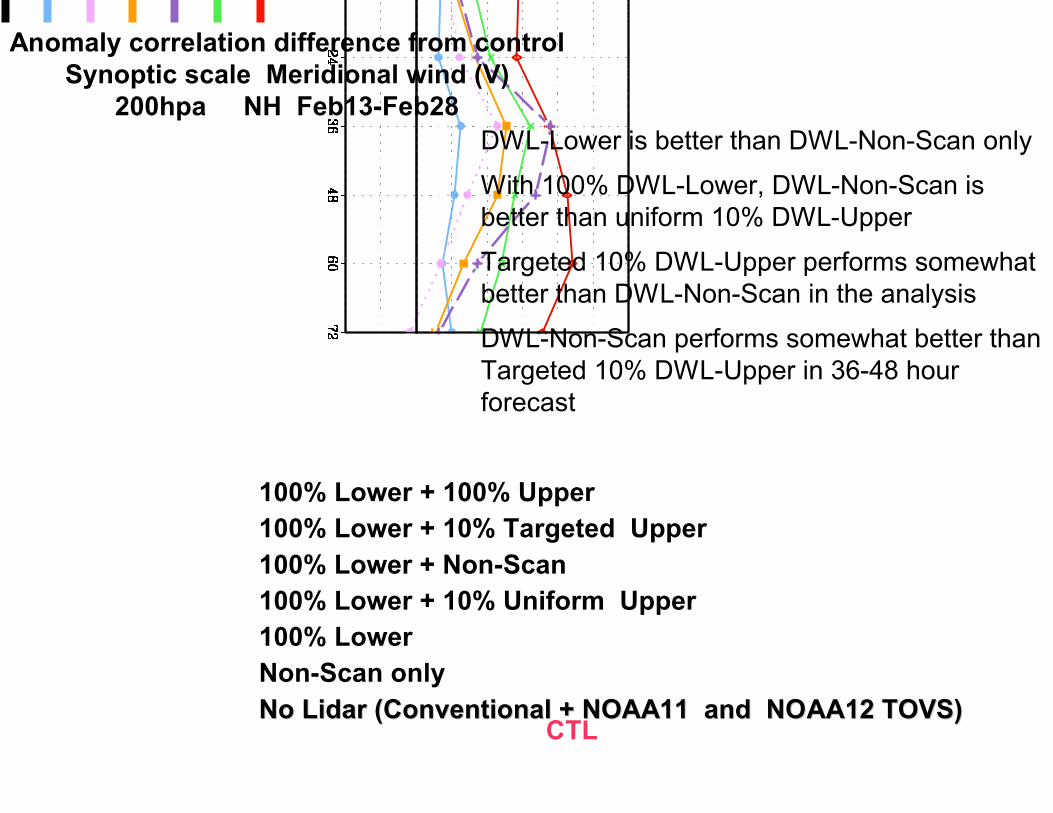
100% Lower + 10% Uniform Upper
100% Lower + 100% Upper100% Lower + 10% Targeted Upper100% Lower + Non-Scan
Non-Scan only100% Lower
Anomaly correlation difference from controlSynoptic scale Meridional wind (V)
200hpa NH Feb13-Feb28DWL-Lower is better than DWL-Non-Scan only
With 100% DWL-Lower, DWL-Non-Scan is better than uniform 10% DWL-Upper
Targeted 10% DWL-Upper performs somewhat better than DWL-Non-Scan in the analysis
DWL-Non-Scan performs somewhat better than Targeted 10% DWL-Upper in 36-48 hour forecast
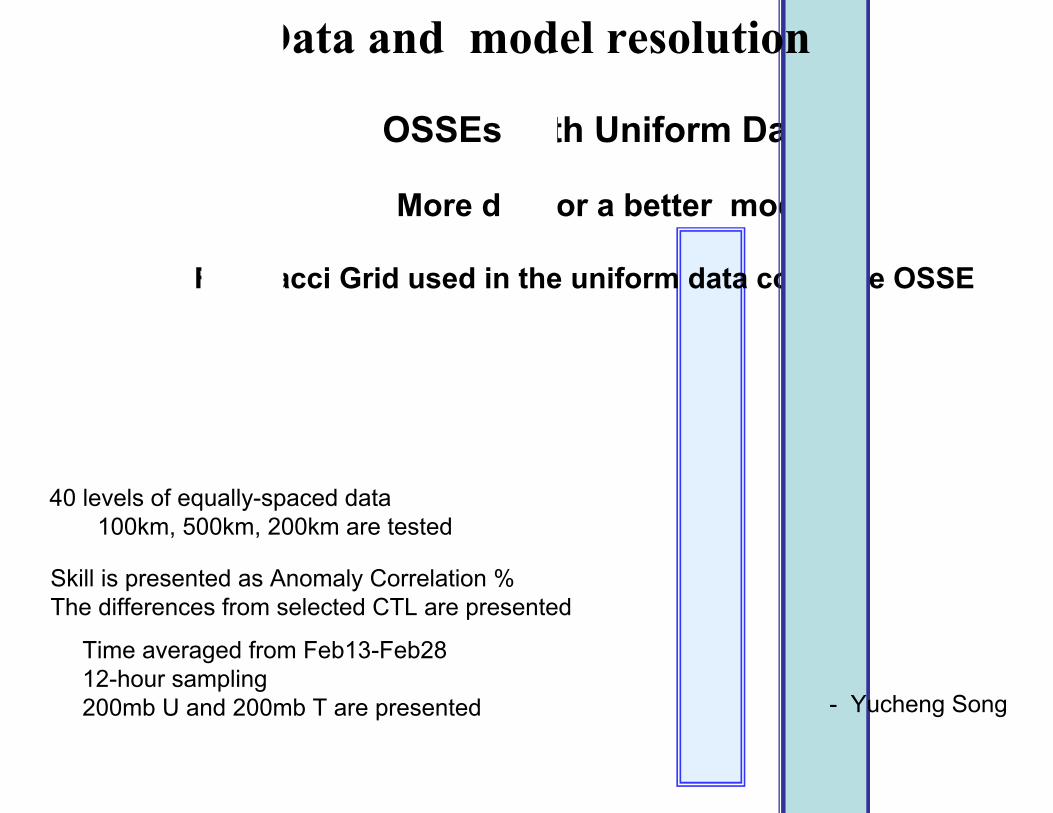
OSSEs with Uniform Data
More data or a better model?
Fibonacci Grid used in the uniform data coverage OSSE
Data and model resolution
- Yucheng Song
Time averaged from Feb13-Feb2812-hour sampling200mb U and 200mb T are presented
Skill is presented as Anomaly Correlation %The differences from selected CTL are presented
40 levels of equally-spaced data 100km, 500km, 200km are tested
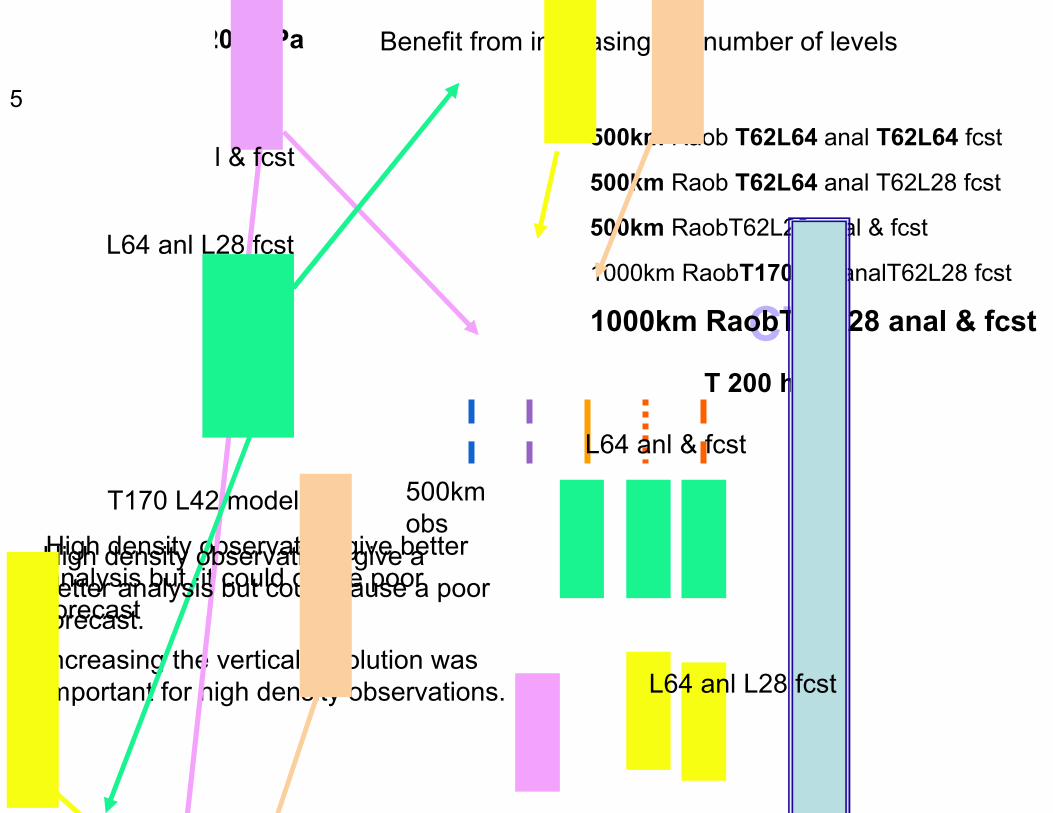
1000km RaobT170L42 analT62L28 fcst
CTL1000km RaobT62L28 anal & fcst
U 200 hPa
500km RaobT62L28 anal & fcst
500km Raob T62L64 anal T62L64 fcst
500km Raob T62L64 anal T62L28 fcst
T 200 hPa
Benefit from increasing the number of levels
Increasing the vertical resolution was important for high density observations.
High density observation give better analysis but it could cause poor forecast
T170 L42 model
L64 anl & fcst
High density observations give a better analysis but could cause a poor forecast.
L64 anl & fcst
L64 anl L28 fcst
L64 anl L28 fcst
5
500km obs
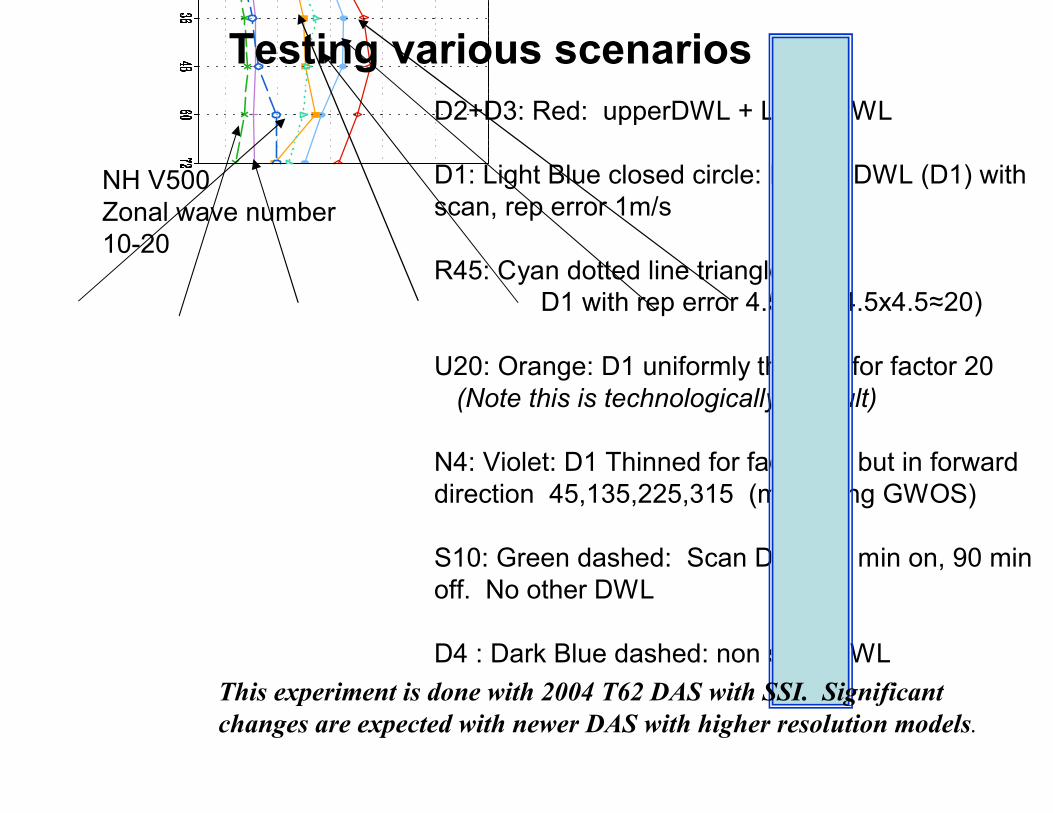
D2+D3: Red: upperDWL + LowerDWL
D1: Light Blue closed circle: Hybrid DWL (D1) with scan, rep error 1m/s
R45: Cyan dotted line triangle:D1 with rep error 4.5m/s (4.5x4.5≈20)
U20: Orange: D1 uniformly thinned for factor 20(Note this is technologically difficult)
N4: Violet: D1 Thinned for factor 20 but in forward direction 45,135,225,315 (mimicking GWOS)
S10: Green dashed: Scan DWL 10 min on, 90 min off. No other DWL
D4 : Dark Blue dashed: non scan DWL
Testing various scenarios
NH V500Zonal wave number10-20
This experiment is done with 2004 T62 DAS with SSI. Significantchanges are expected with newer DAS with higher resolution models.

Four lidars is significantly better than one lidar in the SH, zonal waves 1-3
TW
GWOSLike lidar
ADM like lidar
U V
D2+D3: Red: Scan upper+scan LowerD1: Light Blue closed circle:scal-DWL repE1m/sR45: Cyan dotted line triangle: repE 4.5m/sU20: Orange: uniformly thinned to 5%N4: Violet:Four direction S10: Green dashed:Scan DWL 10min on 90 min off. D4: Dark Blue dashed: non scan DWL
Hybrid-DWL has much more impact compared to non-scan-DWL with the same amount of data.
If the data is thinned uniformly, 20 times thinned data (U20) produces 50%-90% of impact.
20 times less weighted 100% data (R45) is generally slightly better than U20 (5% of data)
Four lidars directed 90 deg apart (N4) showed significant improvement to D4 only at large scales over SH but is not much better over NH and at synoptic scales.
Without additional scan-DWL,10min on 90 off (S10)sampling is much worse than U20 (5% uniform thinning) with twice as much as data.
The results will be very different with newer assimilation systems and higher resolution model.

OSSE with one month long T213 Nature Run is limited. Better Nature Runs are needed.
The results from the NCEP OSSE have to be confirmed by Joint OSSEs with Joint OSSE NRs
NCEP OSSE demonstrated that when using Full OSSE, various experiments can be performed and compared.
Internationally collaborative Joint OSSE which shares same Nature Runs has emerged.
Need one good new Nature Run which will be used bymany OSSEs, including regional data assimilation.
Share the simulated data to compare the OSSE resultsfrom various DA systems and gain confidence in results.
OSSEs require many experts and a wide range of resources.
Extensive international collaboration within the MeteorologicalCommunity is essential for timely and reliable OSSEs toinfluence decisions.
Need for collaboration
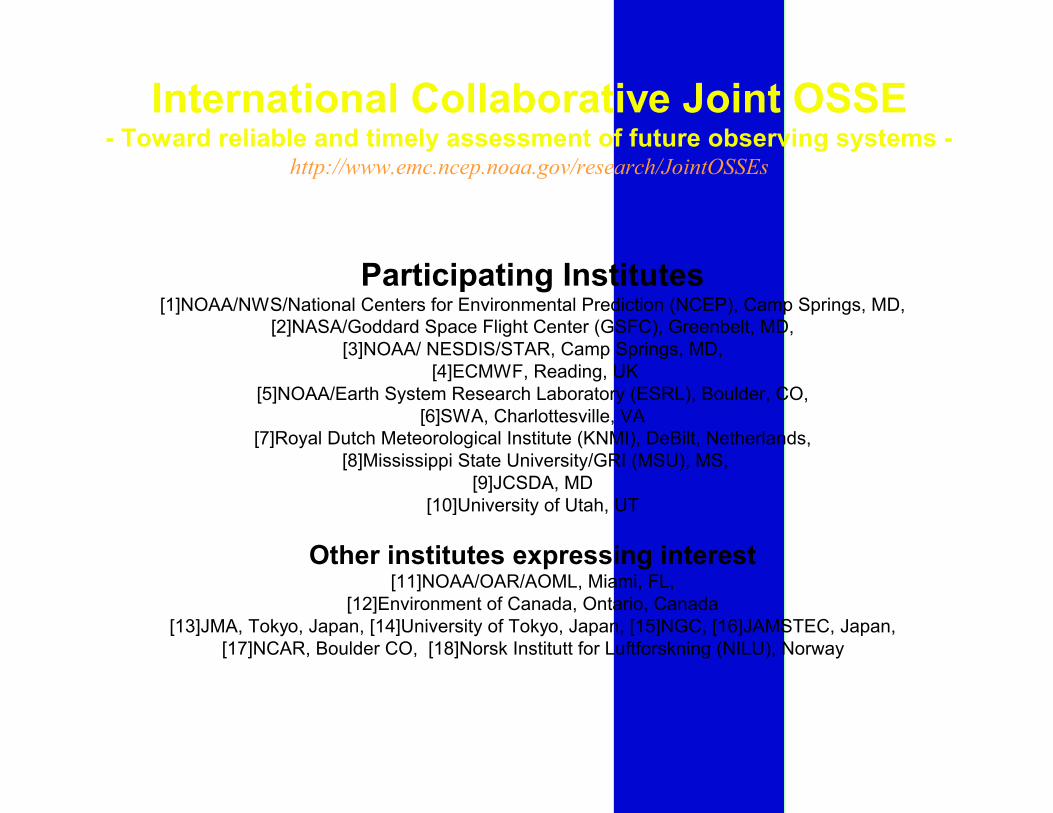
International Collaborative Joint OSSE- Toward reliable and timely assessment of future observing systems -
http://www.emc.ncep.noaa.gov/research/JointOSSEs
Participating Institutes[1]NOAA/NWS/National Centers for Environmental Prediction (NCEP), Camp Springs, MD,
[2]NASA/Goddard Space Flight Center (GSFC), Greenbelt, MD, [3]NOAA/ NESDIS/STAR, Camp Springs, MD,
[4]ECMWF, Reading, UK[5]NOAA/Earth System Research Laboratory (ESRL), Boulder, CO,
[6]SWA, Charlottesville, VA[7]Royal Dutch Meteorological Institute (KNMI), DeBilt, Netherlands,
[8]Mississippi State University/GRI (MSU), MS, [9]JCSDA, MD
[10]University of Utah, UT
Other institutes expressing interest[11]NOAA/OAR/AOML, Miami, FL,
[12]Environment of Canada, Ontario, Canada[13]JMA, Tokyo, Japan, [14]University of Tokyo, Japan, [15]NGC, [16]JAMSTEC, Japan,
[17]NCAR, Boulder CO, [18]Norsk Institutt for Luftforskning (NILU), Norway

Core members who have been involved from the early stageL.-P. Riishojgaard[10,2], M. Masutani[1,10],
J. S. Woollen[1], Y. Xie[5] N. Prive[5], T. Zhu[3], R. Errico[2], R. Yang[2],
A.Stoffelen[7], G.-J. Marseille[7], E. Andersson[4], G. D. Emmitt[6], S. Greco[6], S. A. Wood[6],
F. Weng[3], H. Son[3,], T. J. Kleespies[3,10], Y. Song[1,]O. Reale[2,], T. W. Schlatter[5], S. J. Lord[1],
http://www.emc.ncep.noaa.gov/research/JointOSSEsMeeting summary, Discussion forums, References, FAQ for OSSE, GSI, and CRTM
Note: This data must not be used for commercial purposes and re-distribution rights are not given. User lists are maintained by Michiko Masutani and ECMWF
New Nature Run by ECMWFBased on discussion with
JCSDA, NCEP, GMAO, GLA, SIVO, SWA, NESDIS, ESRL, and ECMWF
Low Resolution Nature Run Spectral resolution : T511 , Vertical levels: L91, 3 hourly dumpInitial conditions: 12Z May 1st, 2005 , Ends at: 0Z Jun 1,2006
Daily SST and ICE: provided by NCEPModel: Version cy31r1
Two High Resolution Nature Runs35 days long
Hurricane season: Starting at 12z September 27,2005, Convective precipitation over US: starting at 12Z April 10, 2006
T799 resolution, 91 levels, one hourly dumpGet initial conditions from T511 NR
To be archived in the MARS system at ECMWFTo access T511 NR, set expver = etwu
Copies are available to designated users for research purposes & users known to ECMWF
Saved at NCEP, ESRL, and NASA/GSFCComplete data available from portal at NASA/GSFC
Conctact: Michiko Masutani ([email protected]), Harper Pryor ([email protected] )
Gradsdods access is available for T511 NR. The data can be downloaded in grib1, NetCDF, or binary. The data can be retrieved globally or for selected
regions. Provide IP number to: Arlindo da Silva ([email protected])
Archive and Distribution
Pressure level data: 31 levels, Potential temperature level data: 315,330,350,370,530K
Selected surface data for T511 NR: Convective precip, Large scale precip,
MSLP,T2m,TD2m, U10,V10, HCC, LCC, MCC, TCC, Sfc Skin Temp
T511 verification data is posted from NCAR CISL Research Data Archive. Data set ID ds621.0. Currently NCAR account is required for access.
(Contact [email protected])(Also available from NCEP HPSS, ESRL, NCAR/MMM, NRL/MRY, Univ. of Utah, JMA, Mississippi State Univ.)
Supplemental low resolution regular lat lon data 1deg x 1deg for T511 NR
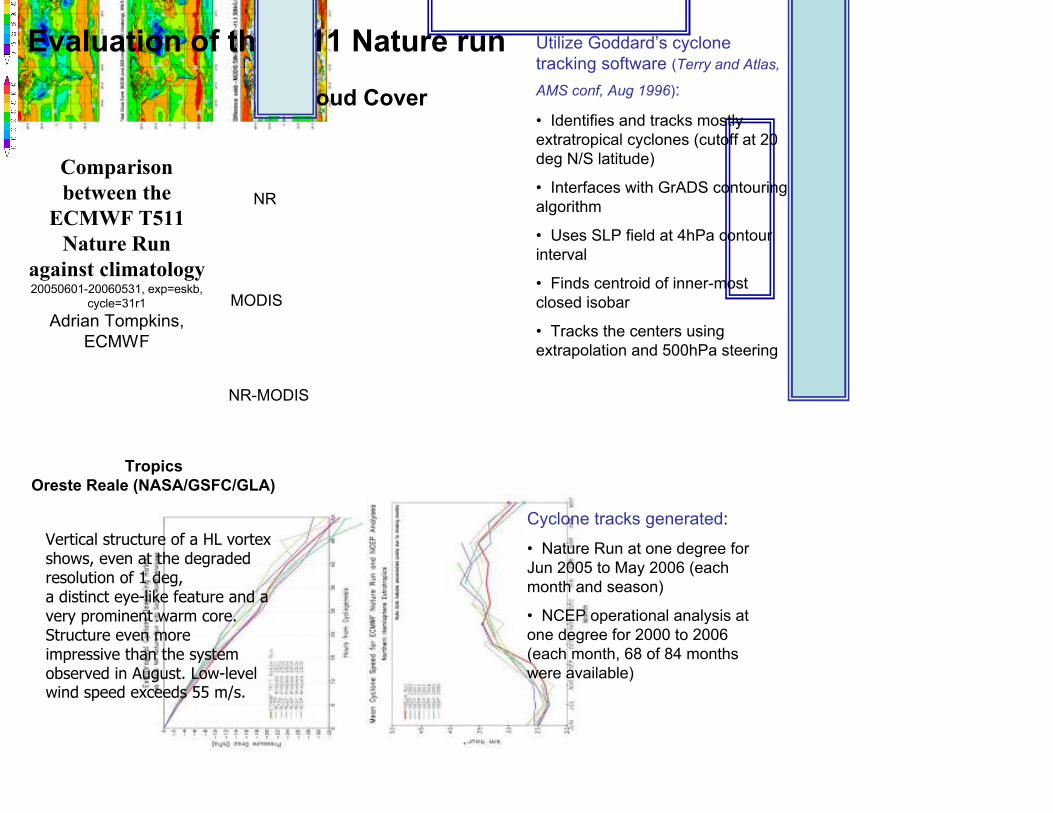
Comparison between the
ECMWF T511 Nature Run
against climatology20050601-20060531, exp=eskb,
cycle=31r1Adrian Tompkins,
ECMWF
Cloud Cover
NR
MODIS
NR-MODIS
Utilize Goddard’s cyclone tracking software (Terry and Atlas,
AMS conf, Aug 1996):
• Identifies and tracks mostly extratropical cyclones (cutoff at 20 deg N/S latitude)
• Interfaces with GrADS contouring algorithm
• Uses SLP field at 4hPa contour interval
• Finds centroid of inner-most closed isobar
• Tracks the centers using extrapolation and 500hPa steering
Cyclone tracks generated:
• Nature Run at one degree for Jun 2005 to May 2006 (each month and season)
• NCEP operational analysis at one degree for 2000 to 2006 (each month, 68 of 84 months were available)
Evaluation of theT511 Nature run
Vertical structure of a HL vortex shows, even at the degraded resolution of 1 deg, a distinct eye-like feature and a very prominent warm core. Structure even more impressive than the system observed in August. Low-level wind speed exceeds 55 m/s.
TropicsOreste Reale (NASA/GSFC/GLA)

T511 Nature Run is found to be representative of the real atmosphere and suitable for conducting reliable OSSEs for midlatitude systems and tropical cyclones. (Note: MJO in T511 Nature Run is still weak.)
There are significant developments in high resolution forecast models at ECMWF since 2006 and a more realistic tropics for T799Nature Run is expected with a newer version of ECMWF model.
ECMWF agreed to generate a new T799 NR, when the Joint OSSE team has gained enough experience in OSSEs with T511NR and is ready to make the best use of the high resolution Nature Run.
For the time being, the Joint OSSE team will concentrate on OSSEs using T511 Nature Run.

The output data is saved in BUFR format which can be read by theGridpoint Statistical Interpolation (GSI). GSI is a DAS used at NCEP, GMAO and ESRL. The codes are flexible and include many tunable parameters.
Initially observational error will not be added.
GMAO will provide software to add random error.
Simulated observations will be posted from NASA/NCCS portal.
GMAO will provide calibrated simulated observations.
NCEP-NESDIS will provide additional data which are not simulated by GMAO.
Some calibration will be performed but users are expected toperform their own calibrations. Some simulation by GMAO may berepeated for the complete period.
Each group will make separate directories for simulated observations at the NASA portal.
Simulation of Observations for calibration
GMAO Observation Simulator for Joint OSSE
• Software for generating conventional obs (observation type included in NCEP prepbufr file). Surface data are simulated at NR surface height.
• Software for simulating radiances: Code to simulate HIRS2/3, AMSUA/B, AIRS, MSU has been set up. Community Radiative Transfer Model (CRTM) is used for forward model. Random sampling-based uses High, Mid, Low level cloud cover, precipitation to produce a realistic distribution of cloud clear radiance.
• Software for generating random error.
• Calibration is performed using Adjoint technique.
DistributionSimulated observations will be calibrated by GMAO before becoming available.Limited data are now available for people who contribute to validation and calibration.
Contact: Ron Errico: [email protected]
Simulation of radiance data at NCEP and NESDIS
For development purposes, 91-level ML variables are processed at NCEP and interpolated to observational locations with all the information need to simulate radiance data (DBL91). DWL91 will be posted from NASA portal.
The DBL91 are for quick work and also used for development of CRTM.
GOES and SBUV are simulated as they are missing from GMAO dataset.
AMSUA, AMSUB, GOES data have been simulated for entire T511 NR period. DBL91 for HIRS2, HIRS3 are also prepared, saved and will be posted. DBL91 for AIRS will not be saved.
Step 1. Thinning of radiance data based on real use
Step 2. Simulation of radiance data using cloudy radiance
Cloudy radiance is still under development. Accuracy of GMAO data will be between Step1 and Step2.
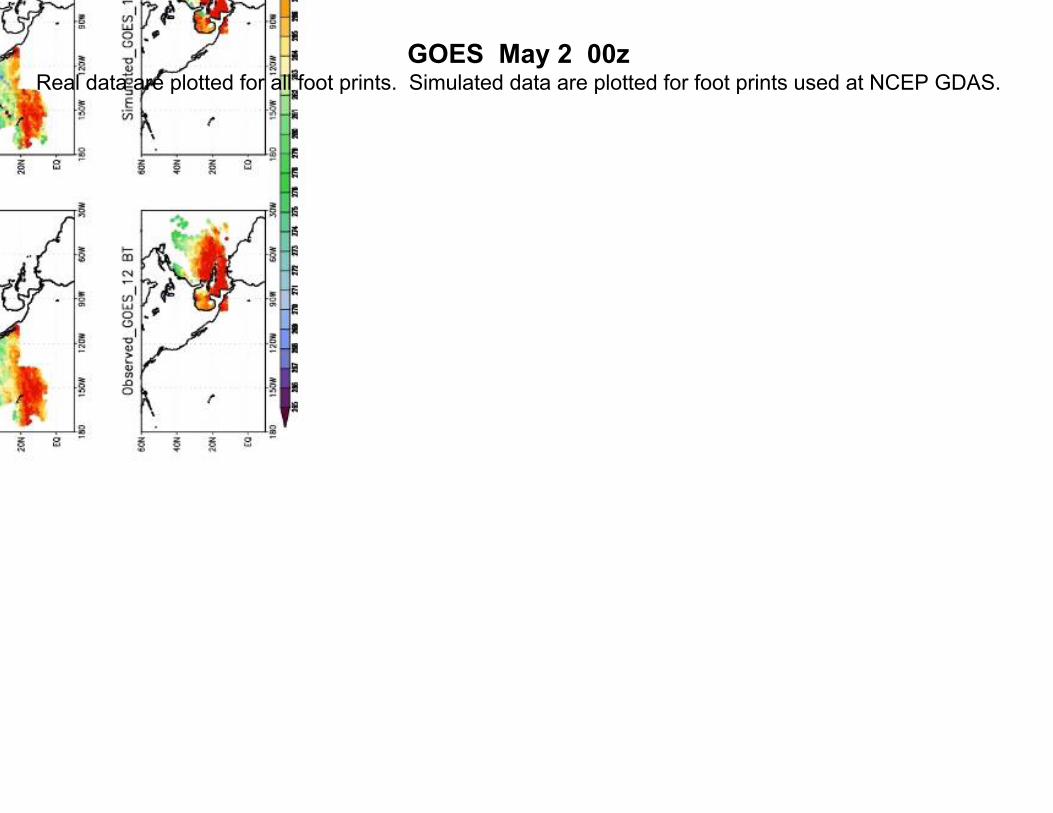
GOES May 2 00zReal data are plotted for all foot prints. Simulated data are plotted for foot prints used at NCEP GDAS.
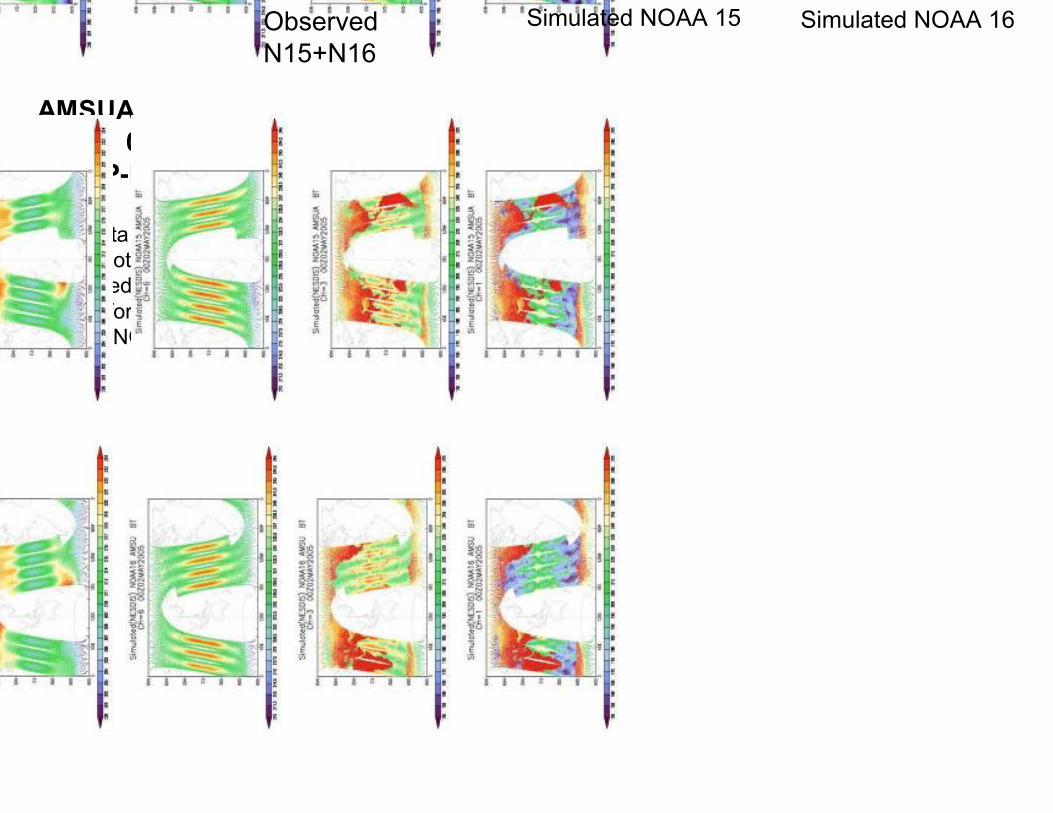
AMSUA May 2 00z(NCEP-NESDIS)
Real data are plotted for all foot prints.Simulated data are plotted for foot prints used at NCEP GDAS.
Observed N15+N16
Simulated NOAA 15 Simulated NOAA 16
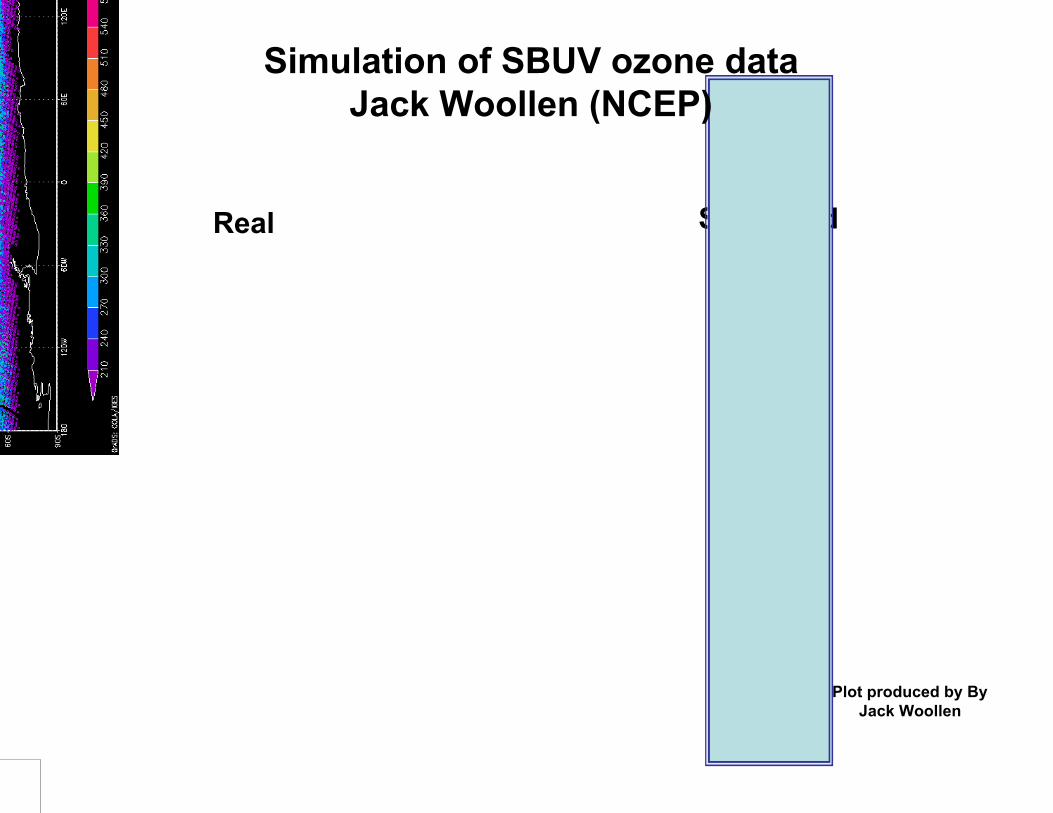
Plot produced by By Jack Woollen
Real Simulated
Simulation of SBUV ozone dataJack Woollen (NCEP)

Further Considerations
Data distribution depends on atmospheric conditions.
Aircraft data are heavily affected by Jet Stream location. Location of Jet in NR must be considered.Scale of RAOB drift becomes larger than model resolution.Cloud Motion Vector is based on Nature Run Cloud.
Microwave Radiative Transfer at the Sub-Field-of-View Resolution (Tom Kleespies and George Gyno)
The ability to integrate high resolution databases within a given field-of-view, and perform multiple radiative transfers within the field of view, weight according to the antenna beam power, and integrate.
Calibration
GMAO is conducting calibration using adjoint method.Focused on July August 2006 and December 2005-January 2006.
ESRL and NCEP are working on calibration using data denial method. Using simulated data by GMAO and additional data from NCEP.Focused on July-August 2005.GSI version May 2007.
NCEP is working on upgrading OSSE system to newer GSI to accommodate DWL and flow dependent error covariances. Some calibrations will be repeated.

By Jack Woollen
By Jack Woollen

OSSE for GNSS Radio-Occultation (RO) observations
Lidia Cucurull (JCSDA)
• Several options for a future operational GPS Radio Occultation system (COSMIC follow-on) regarding orbit configurations, number of satellites, secondary payload vs. dedicated system, etc.
• What is the optimal choice?• CEOS action WE-07-03 on ‘evaluation of the requirements to conduct RO
OSSEs’ given to NOAA/NESDIS.• These actions have recently been completed:
– International Joint OSSE project set up;– 2-yr full time post-doctoral scientist will conduct.
• Funding made available by NOAA/NESDIS; hire in progress.
Planned experiments

Simulation of GOES-12 Sounder
Nature Run hurricane generated on September 27. At 1200 UTC October 1, it is located at about 43 W, 20N. The high moisture air mass associated with the hurricane is shown clearly.
Observed GOES-12 18 bands on 0230 UTC October 01, 2005 for North Atlantic Ocean section.
OSSEs to investigate GOES data usageand prepare for GOES-R
Tong Zhu (CIRA/CSU), Fuzhong Weng (NOAA/NESDIS), Jack Woollen (NOAA/EMC), Michiko Masutani (NOAA/EMC), Thomas J. Kleespies(NOAA/NESDIS),
Yong Han(NOAA/NESDIS), Quanhua, Liu (QSS), Sid Boukabara (NOAA/NESDIS),Steve Load (NOAA/EMC),
Observed GOES-12 Sounder
by Tong Zhu
This project involves OSSE to evaluate current usage of GOES data
OSSEs for THORPEX T-PARCEvaluation and development of targeted
observationZ. Toth, Yucheng Song (NCEP) and other
THORPEX team members
Regional OSSEs to Evaluate ATMS and CrIS ObservationsCris M. Hill, Pat. J. Fitzpatrick, Val. G. AnantharajCris M. Hill, Pat. J. Fitzpatrick, Val. G. Anantharaj GRIGRI-- Mississippi State University (MSS)Mississippi State University (MSS)
LarsLars--Peter Riishojgaard (JCSDA)Peter Riishojgaard (JCSDA)
OSSE to evaluate UASN. Prive(ESRL), Y. Xie(ESRL), et al.
Planned experiments (cont.)
OSSE to evaluate DWLM.Masutani(NCEP), L. P Riishojgaard
(JCSDA), NOAA/ESRL, Met Office?
Regional DWL OSSEs at the University of Utah
Zhaoxia Pu, University of Utah
ADM-Aeolus simulation for J-OSSEG.J. Marseille and Ad Stoffelen (KNMI)
Simulation of DWL at SWAG. David Emmitt, Steve Greco, Sid A. Wood,

• OSSEs are a cost-effective way to optimize investment in future observing systems
• OSSE capability should be broadly based (multi-agency)– Credibility– Cost savings
• Joint OSSE collaboration remains only partially funded but appears to be headed in right direction– GMAO software to calibrate basic data is ready for release– Additional software being developed at NCEP, NESDIS, ESRL and
GMAO– Database and computing resources have been set up for DWL
simulation and SWA, KNMI receiving ESA funding for DWL simulations– Preliminary versions of some basic datasets have been simulated for
entire T511NR period
Summary
Using Full OSSE, various experiments can be performed and various verification metrics can be tested to evaluate data impact from future instruments and data distributions.
It was noted that that while OSSEs can be overly optimistic about the impacts of new observations evaluated in the current data assimilation system, advances in data assimilation skill usually allow us to make better use of observations over time. These advances may, to some extent, be an offsetting factor in that they can help achieve greater impact from new observations in the long run. (From Workshop summary)
Theoretical predictions have to be confirmed by full OSSEs. The results are often unexpected. OSSE results also require theoretical back ups.
OSSE capability should be broadly based (multi-agency) to enhance credibility and to save costs.
End