Embed Size (px)
Citation preview

Available online at www.sciencedirect.com
s 71 (2008) 195–220www.elsevier.com/locate/jmarsys
Journal of Marine System
Observations of the Mediterranean Undercurrent and eddiesin the Gulf of Cadiz during 2001
I. Ambar ⁎, N. Serra 1, F. Neves, T. Ferreira
Instituto de Oceanografia, Faculdade de Ciências da Universidade de Lisboa, 1749-016 Lisboa, Portugal
Received 3 May 2007; received in revised form 5 July 2007; accepted 12 July 2007Available online 2 August 2007
Abstract
The North Atlantic is strongly influenced by the presence of a high salinity and temperature water mass – the MediterraneanWater (MW) – lying at intermediate levels. A detailed field survey in the region around the Portimão Canyon, which constitutes thefirst large canyon that the Mediterranean Undercurrent encounters downstream of the Strait of Gibraltar, has been repeated in threedifferent seasonal conditions (winter, spring and summer) of the year 2001, in the frame of Project MEDTOP. This paper is basedon the observations undertaken during MEDTOP and focus on relevant aspects of the thermohaline and velocity fields associatedwith the Mediterranean Undercurrent and the associated eddies, bringing further evidence of hypotheses presented in previouswork on the dynamical behaviour of the Mediterranean Outflow and its intra-annual variability, and describing new observations ofmeddy formation and subsequent evolution in the centre of the Gulf of Cadiz.
The analysis of the CTD data at the MW levels has shown the presence of four MW cores: the Upper and Lower Cores (centredat about 800 and 1200 m), the Shallow Core (between 400 and 600 m) and, in the region close to the Portimão Canyon, a core withhigher density than the classical Lower Core at depths between 1300 and 1600 m. The analysis of the RAFOS floats trajectories hasshown the Upper and Lower Cores flowing independently along the continental slope, the Upper Core reaching systematicallyhigher velocities than the Lower Core. Within the meddies, there was evidence of a weak vertical coherence of the Cores in theearly stages of the eddy life, and a tendency for acquiring a solid-body rotation as they evolve away from their source.
The RAFOS floats evidenced the formation of MWeddies at three sites off the Portuguese coast: in Portimão Canyon, off CapeSt. Vincent and in the Estremadura Promontory. The period of eddy generation could be quantified within the range 45–60 days.
The comparison between the winter and summer cruises has confirmed some aspects of the Mediterranean outflow which hadbeen identified in previous data sets, namely the higher temperature and salinity values, the broader lateral extension and the highervelocities of the outflow in winter relative to summer values.© 2007 Elsevier B.V. All rights reserved.
Keywords: Mediterranean outflow; Undercurrents; Eddies; Seasonal variations; Oceanographic surveys; Lagrangian current measurements; NEAtlantic; Gulf of Cadiz
⁎ Corresponding author. Tel.: +351 2175000 80; fax: +351217500009.
E-mail address: [email protected] (I. Ambar).1 Present address: Institut für Meereskunde, Universität Hamburg,
Bundesstr. 53, D-20146 Hamburg, Germany.
0924-7963/$ - see front matter © 2007 Elsevier B.V. All rights reserved.doi:10.1016/j.jmarsys.2007.07.003
1. Introduction
The North Atlantic is strongly influenced by the pre-sence of a high salinity and temperature water mass – theMediterranean Water (MW) – lying at intermediate lev-els. This influence is both hydrographical and dynamical
196 I. Ambar et al. / Journal of Marine Systems 71 (2008) 195–220
and has been well documented in many works (e.g.,Reid, 1978; Baringer and Price, 1997; Iorga and Lozier,1999a,b). The presence of the MW not only plays animportant role in the pattern of the thermohaline field ofthe North Atlantic intermediate layers, but also in thetransport of suspended material (Thorpe and White,1988; Freitas and Abrantes, 2002; McCave and Hall,2002; Ambar et al., 2002) and live organisms of Medi-terranean origin (Ambar et al., 2002). The outlet of thiswater mass from the Mediterranean basin into theAtlantic is the Strait of Gibraltar. At the first stagesafter leaving the Strait, the dense MW constitutes abottom current that flows along the continental slope inthe Gulf of Cadiz subject to the deflecting effect of theearth rotation, which maintains it in the northern side ofthe Gulf. As the MWadvances through the layers of theAtlantic Water, its thermohaline characteristics are gra-dually modified by entrainment and its density progres-sively decreases until it reaches the equilibrium level.Downstream from about 8°W and away from the upperslope, in the offshore side of the Undercurrent, the MWcorresponds already to an intermediate layer. One of theinteresting aspects of the MW intrusion into the Atlanticis the fact that it presents two vertically separated maincores (e.g. Siedler, 1968; Madelain, 1970; Zenk, 1970;Ambar and Howe, 1979a,b; Zenk and Armi, 1990;Borenäs et al., 2002), which, not very far away from theStrait of Gibraltar, are easily detectable in the temper-ature and salinity profiles as two maxima, respectivelycentred at about 800 m – the Upper Core – and 1200 m –the Lower Core. As these two main cores proceedwestwards along the continental slope and leave the Gulfof Cadiz, they follow slightly different routes, the lowerone spreading mainly west and southwestwards fromCape St. Vincent (the SW corner of the Iberian Penin-sula) and the upper one bending northward and stayingcloser to the continental slope (Zenk and Armi, 1990;Daniault et al., 1994; Bower et al., 2002).
In addition to these two “classical” cores, a shallowercore of MW – which will be referred as Shallow Core –characterized by comparatively higher temperatures hasbeen identified close to the upper continental slope offthe southern coast of Iberia (Zenk, 1975; Ambar, 1983)and also off the southwestern coast of Portugal (Ambar,1983; Hinrichsen et al., 1993), centred at depths around600 m.
Observational results seem to indicate an intra-annualvariability of the Mediterranean Outflow with highervalues of temperature and salinity in winter as comparedwith those in summer (Ambar et al., 1999). The compa-rison of several thermohaline data sets collected duringdifferent surveys in the Gulf of Cadiz for a period of
about 20 years (December 1982–September 2001) hasconfirmed this result (Ferreira, 2004).
The spreading of MW in the Atlantic is reinforced bythe activity of submesoscale vortices (i.e., with dia-meters of the order of or less than 100 km) which detachfrom the Mediterranean Undercurrent and, being inrotation, tend to conserve for long periods (order ofyears) their original thermohaline characteristics (Armiet al., 1989; Pingree and Le Cann, 1993; Pingree, 1995).Although the existence of the MW in the Atlantic hasbeen known for a long time, the discovery of the exis-tence of these meddies (MW eddies) is relatively recent(late seventies). The first meddy identified as such(McDowell and Rossby, 1978) was found off Bahamas,at more than 6000-km distance from its origin (Gulfof Cadiz), conserving its thermohaline characteristics.Although nowadays there are some doubts about thatstructure being a meddy (Prater and Rossby, 1999), thisstarted a new “age” in what concerns the understandingof the MW spreading in the Atlantic. Since then, thistype of vortices was identified in many observationalworks in the eastern basin of the North Atlantic, espe-cially off the southwest coast of the Iberian Peninsula(e.g., Käse et al., 1989; Bower et al., 1995) and in theregion of the Canary Basin (Richardson et al., 1989).
In general, meddies are lens-like structures, in solid-body anticyclonic rotation, with typical diameters ofabout 50–100 km and vertical extents of about 700 m(i.e., between depths of 600 and 1300 m), periods ofrotation of about 6 to 8 days and azimuthal velocities ofabout 30 cm s−1 (e.g., Armi and Zenk, 1984; Armi et al.,1988, 1989; Richardson et al., 2000). Cape St. Vincentwas identified as a site for meddy formation in the frameof the AMUSE project (Bower et al., 1995, 1997). Thereis also some evidence that their generation can beassociated with other bathymetric features such as thesubmarine canyons off the Iberian coast (Pingree and LeCann, 1993; Prater and Sanford, 1994; Serra and Ambar,2002) or with the Gorringe Bank (Serra and Ambar,2002).
The dynamical field associated with the meddiesseems to extend vertically much farther than the depthrange where the thermohaline anomaly is detected, andmay reach levels down to 3000 m (Pingree, 1995) or upto the sea surface where meddies signatures have beendetected using satellite data (Stammer et al., 1991;Pingree, 1995; Oliveira et al., 2000).
In the last decade, field observations off the southerncoast of Iberia (Carton et al., 2002; Serra et al., 2002)were able to detect the presence of cyclones associatedwith meddies to form vortex pairs at the level of theMW. The existence of these cyclones was predicted by
197I. Ambar et al. / Journal of Marine Systems 71 (2008) 195–220
potential vorticity considerations (Käse and Zenk, 1996)and is fundamental for the understanding of the trans-lation of meddies away from the generation zone. Alsosome evidence was found that cyclones play a role onthe detachment of the meddies from the MW Under-current (Serra et al., 2002).
Although much progress has been accomplished inthe last decade, there is still need for a better under-standing of the dynamical aspects of eddies associatedwith the Mediterranean Undercurrent off south Portugal,namely of the role played by submarine canyons andcapes in the flow instabilities and eddy generation.These were the main objectives of the MEDTOP (Medi-terranean Undercurrent — eddies and topographic ef-fects) Project which took place between 2000 and 2003.
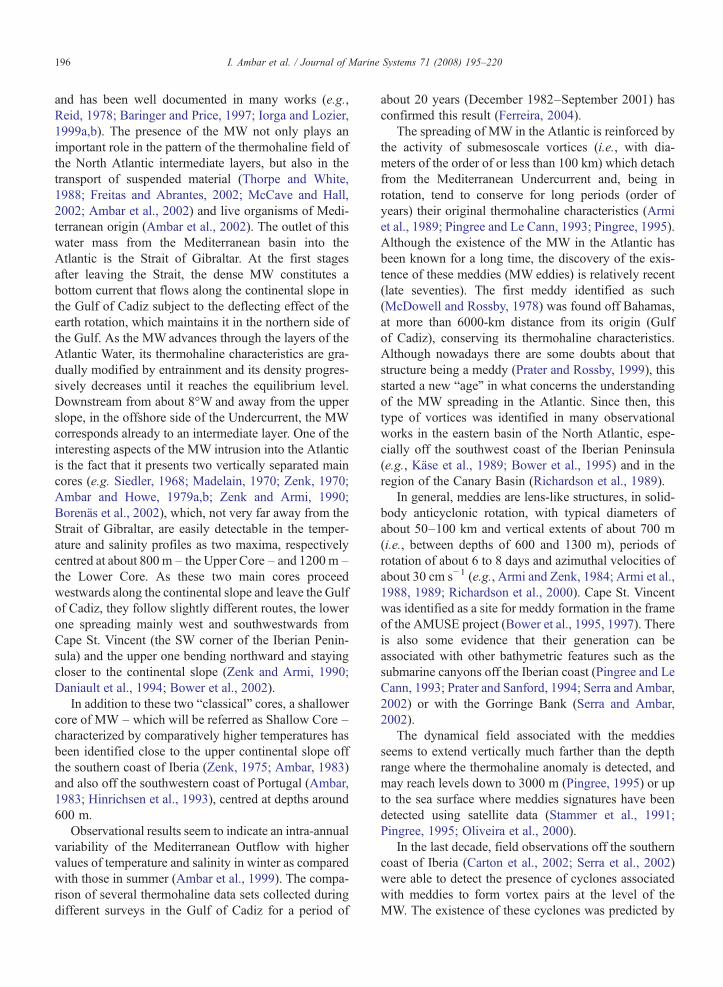
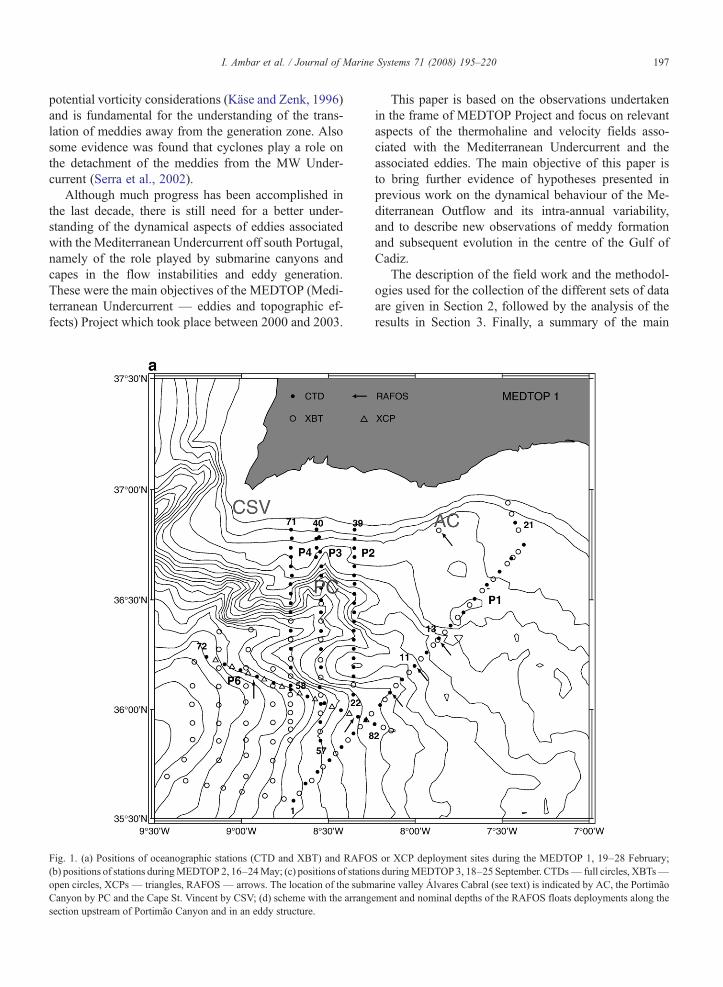
Fig. 1. (a) Positions of oceanographic stations (CTD and XBT) and RAFO(b) positions of stations duringMEDTOP 2, 16–24May; (c) positions of stationopen circles, XCPs— triangles, RAFOS— arrows. The location of the submCanyon by PC and the Cape St. Vincent by CSV; (d) scheme with the arrangsection upstream of Portimão Canyon and in an eddy structure.
This paper is based on the observations undertakenin the frame of MEDTOP Project and focus on relevantaspects of the thermohaline and velocity fields asso-ciated with the Mediterranean Undercurrent and theassociated eddies. The main objective of this paper isto bring further evidence of hypotheses presented inprevious work on the dynamical behaviour of the Me-diterranean Outflow and its intra-annual variability,and to describe new observations of meddy formationand subsequent evolution in the centre of the Gulf ofCadiz.
The description of the field work and the methodol-ogies used for the collection of the different sets of dataare given in Section 2, followed by the analysis of theresults in Section 3. Finally, a summary of the main
S or XCP deployment sites during the MEDTOP 1, 19–28 February;s duringMEDTOP 3, 18–25 September. CTDs— full circles, XBTs—arine valley Álvares Cabral (see text) is indicated by AC, the Portimãoement and nominal depths of the RAFOS floats deployments along the
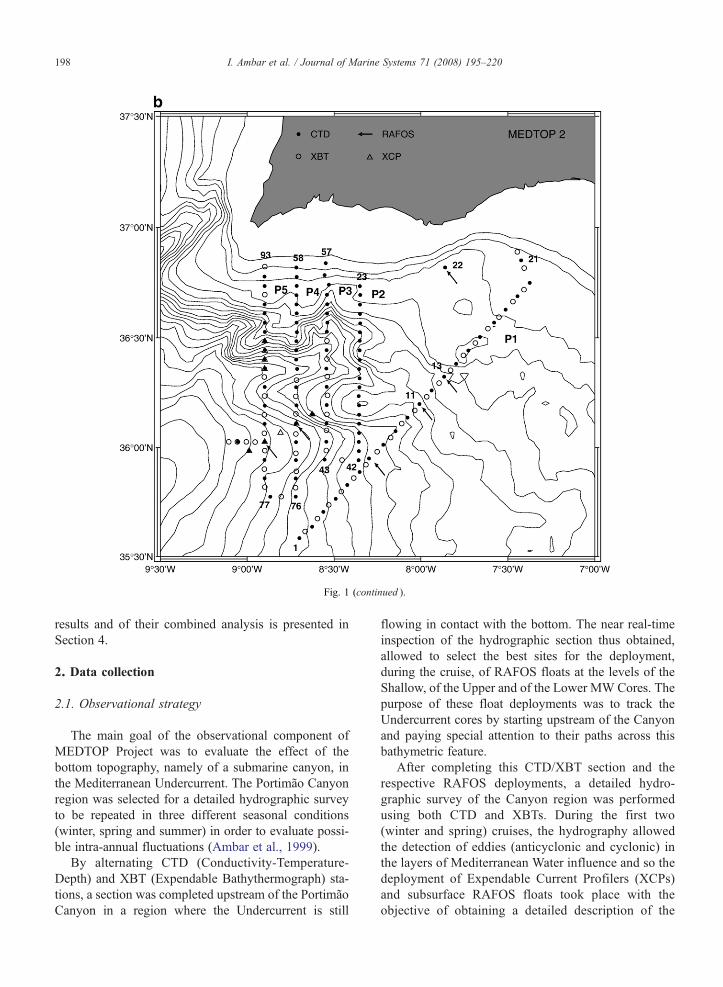
Fig. 1 (continued ).
198 I. Ambar et al. / Journal of Marine Systems 71 (2008) 195–220
results and of their combined analysis is presented inSection 4.
2. Data collection
2.1. Observational strategy
The main goal of the observational component ofMEDTOP Project was to evaluate the effect of thebottom topography, namely of a submarine canyon, inthe Mediterranean Undercurrent. The Portimão Canyonregion was selected for a detailed hydrographic surveyto be repeated in three different seasonal conditions(winter, spring and summer) in order to evaluate possi-ble intra-annual fluctuations (Ambar et al., 1999).
By alternating CTD (Conductivity-Temperature-Depth) and XBT (Expendable Bathythermograph) sta-tions, a section was completed upstream of the PortimãoCanyon in a region where the Undercurrent is still
flowing in contact with the bottom. The near real-timeinspection of the hydrographic section thus obtained,allowed to select the best sites for the deployment,during the cruise, of RAFOS floats at the levels of theShallow, of the Upper and of the Lower MW Cores. Thepurpose of these float deployments was to track theUndercurrent cores by starting upstream of the Canyonand paying special attention to their paths across thisbathymetric feature.
After completing this CTD/XBT section and therespective RAFOS deployments, a detailed hydro-graphic survey of the Canyon region was performedusing both CTD and XBTs. During the first two(winter and spring) cruises, the hydrography allowedthe detection of eddies (anticyclonic and cyclonic) inthe layers of Mediterranean Water influence and so thedeployment of Expendable Current Profilers (XCPs)and subsurface RAFOS floats took place with theobjective of obtaining a detailed description of the
Fig. 1 (continued ).
199I. Ambar et al. / Journal of Marine Systems 71 (2008) 195–220
velocity structure in the water column associated withthese eddies.
2.2. Detailed CTD/XBT surveys
The three high-resolution CTD campaigns were lo-cated in the northern slope of the Gulf of Cadiz, acrossthe Mediterranean Undercurrent, from about 7.4°W to9.0°W and from 35.5°N to 36.8°N (Fig. 1a,b and c).They took place from aboard “NRP D. Carlos I” inFebruary 2001 (MEDTOP 1, 19–28 February), in May
2001 (MEDTOP 2, 16–24 May) and in September2001 (MEDTOP 3, 18–25 September). They included aSW–NE section (P1) upstream of the Portimão Canyonand three or four meridional sections (three duringMEDTOP 1 and four during MEDTOP 2 and 3) in theCanyon region. The distances between CTD stations alongthese sections varied from around 5 km (in section P2 andin the segment closer to the upper slope of the sections P3–P5) to 10 km (in section P1 and in the offshore segment ofsections P3–P5). Besides the grid stations, a fewmoreCTDprofiles were obtained during the eddy intensive surveys.
200 I. Ambar et al. / Journal of Marine Systems 71 (2008) 195–220
The CTD stations extended from the surface to amaximum depth of 2000 m or, in case of shallowerstations, to about 10m from the bottom. The total numberof CTD stations in each of the three cruises was,respectively, 82, 96 and 92.
In order to complement the information on the ther-mal field obtained with the CTD, XBT probes weredropped at intermediate positions between the CTD
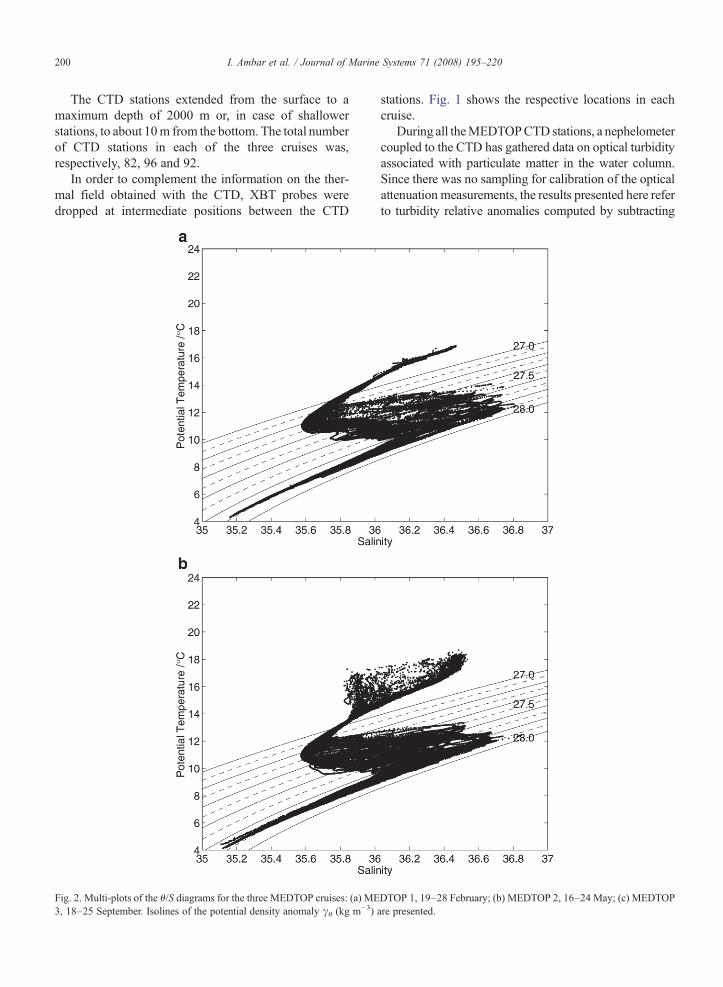
Fig. 2. Multi-plots of the θ/S diagrams for the three MEDTOP cruises: (a) ME3, 18–25 September. Isolines of the potential density anomaly γθ (kg m−3)
stations. Fig. 1 shows the respective locations in eachcruise.
During all theMEDTOPCTD stations, a nephelometercoupled to the CTD has gathered data on optical turbidityassociated with particulate matter in the water column.Since there was no sampling for calibration of the opticalattenuation measurements, the results presented here referto turbidity relative anomalies computed by subtracting
DTOP 1, 19–28 February; (b) MEDTOP 2, 16–24 May; (c) MEDTOPare presented.
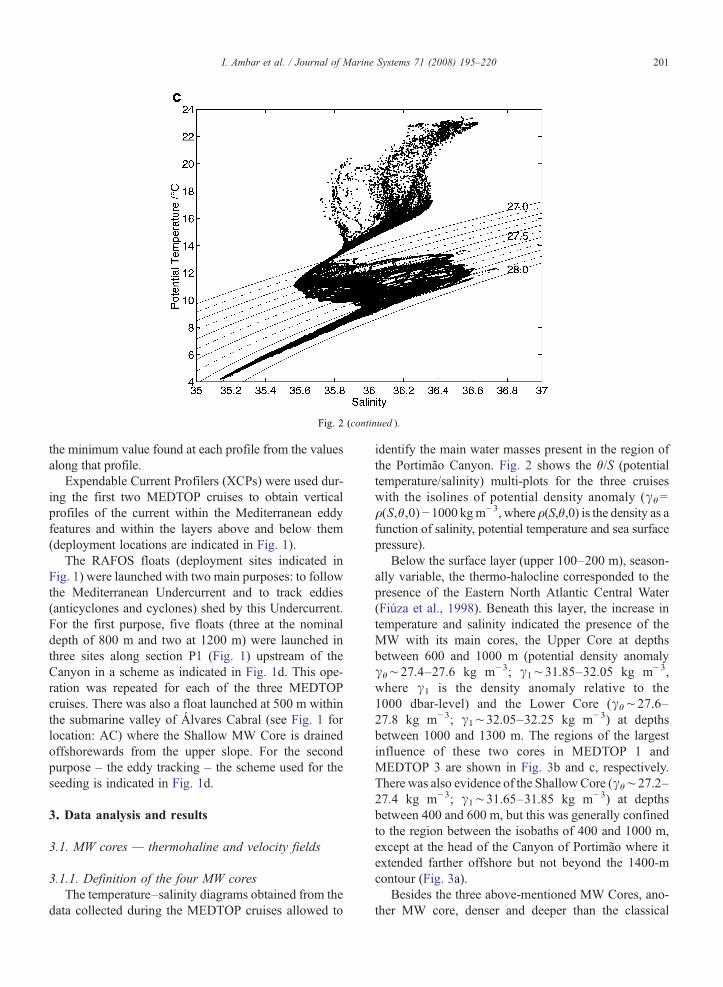
Fig. 2 (continued ).
201I. Ambar et al. / Journal of Marine Systems 71 (2008) 195–220
the minimum value found at each profile from the valuesalong that profile.
Expendable Current Profilers (XCPs) were used dur-ing the first two MEDTOP cruises to obtain verticalprofiles of the current within the Mediterranean eddyfeatures and within the layers above and below them(deployment locations are indicated in Fig. 1).
The RAFOS floats (deployment sites indicated inFig. 1) were launched with two main purposes: to followthe Mediterranean Undercurrent and to track eddies(anticyclones and cyclones) shed by this Undercurrent.For the first purpose, five floats (three at the nominaldepth of 800 m and two at 1200 m) were launched inthree sites along section P1 (Fig. 1) upstream of theCanyon in a scheme as indicated in Fig. 1d. This ope-ration was repeated for each of the three MEDTOPcruises. There was also a float launched at 500 m withinthe submarine valley of Álvares Cabral (see Fig. 1 forlocation: AC) where the Shallow MW Core is drainedoffshorewards from the upper slope. For the secondpurpose – the eddy tracking – the scheme used for theseeding is indicated in Fig. 1d.
3. Data analysis and results
3.1. MW cores — thermohaline and velocity fields
3.1.1. Definition of the four MW coresThe temperature–salinity diagrams obtained from the
data collected during the MEDTOP cruises allowed to
identify the main water masses present in the region ofthe Portimão Canyon. Fig. 2 shows the θ/S (potentialtemperature/salinity) multi-plots for the three cruiseswith the isolines of potential density anomaly (γθ=ρ(S,θ,0)−1000 kgm−3, where ρ(S,θ,0) is the density as afunction of salinity, potential temperature and sea surfacepressure).
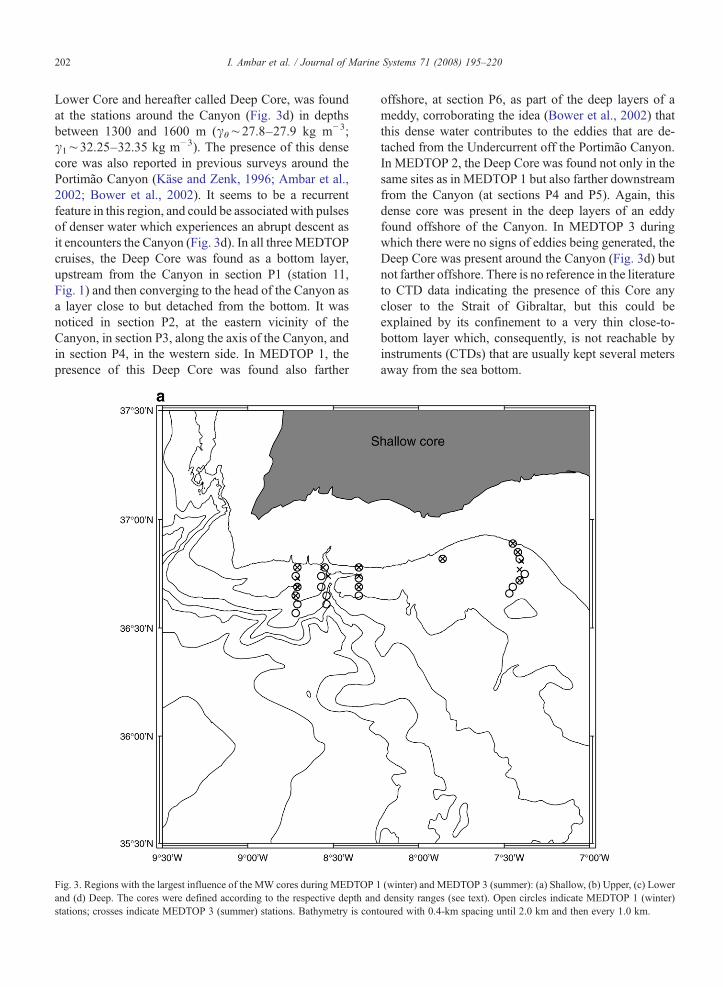
Below the surface layer (upper 100–200 m), season-ally variable, the thermo-halocline corresponded to thepresence of the Eastern North Atlantic Central Water(Fiúza et al., 1998). Beneath this layer, the increase intemperature and salinity indicated the presence of theMW with its main cores, the Upper Core at depthsbetween 600 and 1000 m (potential density anomalyγθ∼27.4–27.6 kg m−3; γ1∼31.85–32.05 kg m−3,where γ1 is the density anomaly relative to the1000 dbar-level) and the Lower Core (γθ∼27.6–27.8 kg m−3; γ1∼32.05–32.25 kg m−3) at depthsbetween 1000 and 1300 m. The regions of the largestinfluence of these two cores in MEDTOP 1 andMEDTOP 3 are shown in Fig. 3b and c, respectively.There was also evidence of the ShallowCore (γθ∼27.2–27.4 kg m−3; γ1∼31.65–31.85 kg m−3) at depthsbetween 400 and 600 m, but this was generally confinedto the region between the isobaths of 400 and 1000 m,except at the head of the Canyon of Portimão where itextended farther offshore but not beyond the 1400-mcontour (Fig. 3a).
Besides the three above-mentioned MW Cores, ano-ther MW core, denser and deeper than the classical
202 I. Ambar et al. / Journal of Marine Systems 71 (2008) 195–220
Lower Core and hereafter called Deep Core, was foundat the stations around the Canyon (Fig. 3d) in depthsbetween 1300 and 1600 m (γθ∼27.8–27.9 kg m−3;γ1∼32.25–32.35 kg m−3). The presence of this densecore was also reported in previous surveys around thePortimão Canyon (Käse and Zenk, 1996; Ambar et al.,2002; Bower et al., 2002). It seems to be a recurrentfeature in this region, and could be associated with pulsesof denser water which experiences an abrupt descent asit encounters the Canyon (Fig. 3d). In all three MEDTOPcruises, the Deep Core was found as a bottom layer,upstream from the Canyon in section P1 (station 11,Fig. 1) and then converging to the head of the Canyon asa layer close to but detached from the bottom. It wasnoticed in section P2, at the eastern vicinity of theCanyon, in section P3, along the axis of the Canyon, andin section P4, in the western side. In MEDTOP 1, thepresence of this Deep Core was found also farther
Fig. 3. Regions with the largest influence of the MW cores during MEDTOP 1and (d) Deep. The cores were defined according to the respective depth andstations; crosses indicate MEDTOP 3 (summer) stations. Bathymetry is con
offshore, at section P6, as part of the deep layers of ameddy, corroborating the idea (Bower et al., 2002) thatthis dense water contributes to the eddies that are de-tached from the Undercurrent off the Portimão Canyon.In MEDTOP 2, the Deep Core was found not only in thesame sites as in MEDTOP 1 but also farther downstreamfrom the Canyon (at sections P4 and P5). Again, thisdense core was present in the deep layers of an eddyfound offshore of the Canyon. In MEDTOP 3 duringwhich there were no signs of eddies being generated, theDeep Core was present around the Canyon (Fig. 3d) butnot farther offshore. There is no reference in the literatureto CTD data indicating the presence of this Core anycloser to the Strait of Gibraltar, but this could beexplained by its confinement to a very thin close-to-bottom layer which, consequently, is not reachable byinstruments (CTDs) that are usually kept several metersaway from the sea bottom.
(winter) and MEDTOP 3 (summer): (a) Shallow, (b) Upper, (c) Lowerdensity ranges (see text). Open circles indicate MEDTOP 1 (winter)
toured with 0.4-km spacing until 2.0 km and then every 1.0 km.
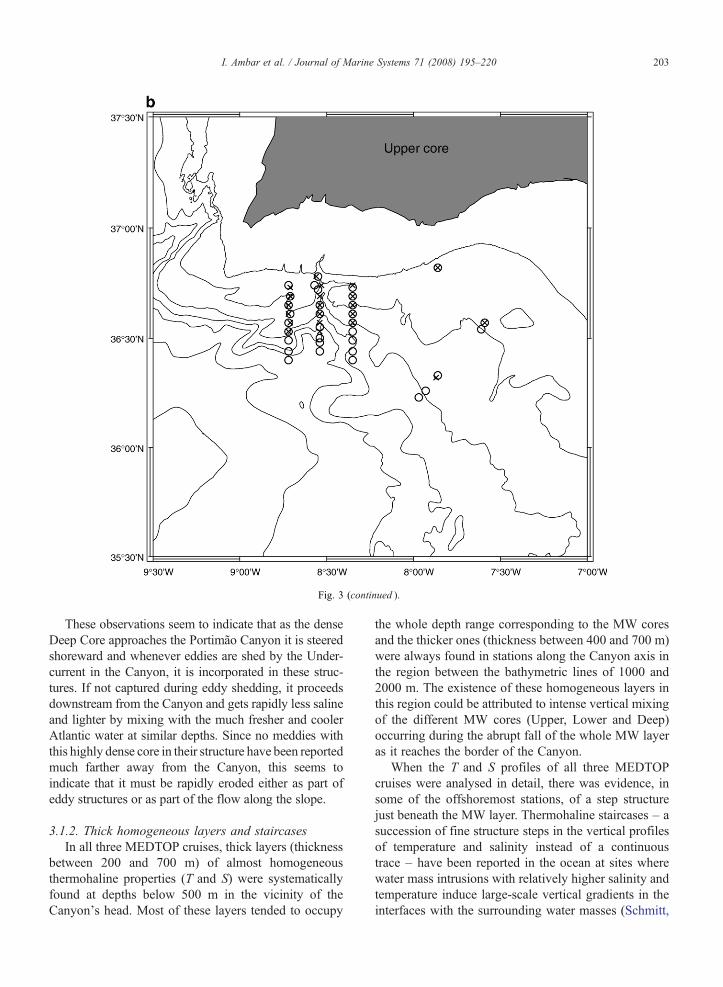
Fig. 3 (continued ).
203I. Ambar et al. / Journal of Marine Systems 71 (2008) 195–220
These observations seem to indicate that as the denseDeep Core approaches the Portimão Canyon it is steeredshoreward and whenever eddies are shed by the Under-current in the Canyon, it is incorporated in these struc-tures. If not captured during eddy shedding, it proceedsdownstream from the Canyon and gets rapidly less salineand lighter by mixing with the much fresher and coolerAtlantic water at similar depths. Since no meddies withthis highly dense core in their structure have been reportedmuch farther away from the Canyon, this seems toindicate that it must be rapidly eroded either as part ofeddy structures or as part of the flow along the slope.
3.1.2. Thick homogeneous layers and staircasesIn all three MEDTOP cruises, thick layers (thickness
between 200 and 700 m) of almost homogeneousthermohaline properties (T and S) were systematicallyfound at depths below 500 m in the vicinity of theCanyon's head. Most of these layers tended to occupy
the whole depth range corresponding to the MW coresand the thicker ones (thickness between 400 and 700 m)were always found in stations along the Canyon axis inthe region between the bathymetric lines of 1000 and2000 m. The existence of these homogeneous layers inthis region could be attributed to intense vertical mixingof the different MW cores (Upper, Lower and Deep)occurring during the abrupt fall of the whole MW layeras it reaches the border of the Canyon.
When the T and S profiles of all three MEDTOPcruises were analysed in detail, there was evidence, insome of the offshoremost stations, of a step structurejust beneath the MW layer. Thermohaline staircases – asuccession of fine structure steps in the vertical profilesof temperature and salinity instead of a continuoustrace – have been reported in the ocean at sites wherewater mass intrusions with relatively higher salinity andtemperature induce large-scale vertical gradients in theinterfaces with the surrounding water masses (Schmitt,
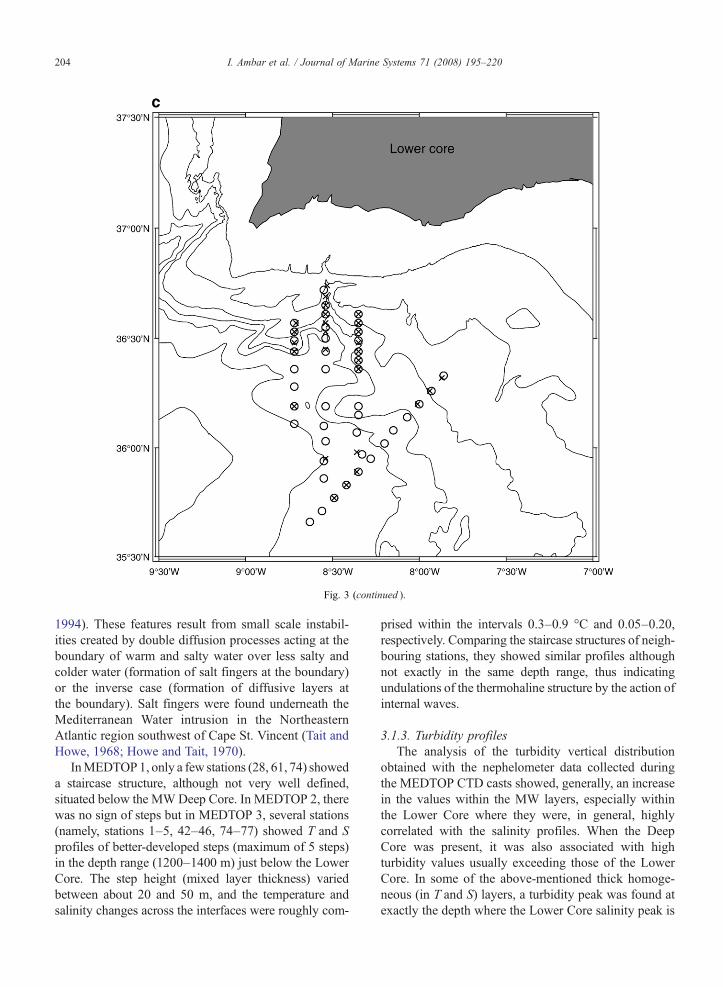
Fig. 3 (continued ).
204 I. Ambar et al. / Journal of Marine Systems 71 (2008) 195–220
1994). These features result from small scale instabil-ities created by double diffusion processes acting at theboundary of warm and salty water over less salty andcolder water (formation of salt fingers at the boundary)or the inverse case (formation of diffusive layers atthe boundary). Salt fingers were found underneath theMediterranean Water intrusion in the NortheasternAtlantic region southwest of Cape St. Vincent (Tait andHowe, 1968; Howe and Tait, 1970).
InMEDTOP1, only a few stations (28, 61, 74) showeda staircase structure, although not very well defined,situated below the MWDeep Core. In MEDTOP 2, therewas no sign of steps but in MEDTOP 3, several stations(namely, stations 1–5, 42–46, 74–77) showed T and Sprofiles of better-developed steps (maximum of 5 steps)in the depth range (1200–1400 m) just below the LowerCore. The step height (mixed layer thickness) variedbetween about 20 and 50 m, and the temperature andsalinity changes across the interfaces were roughly com-
prised within the intervals 0.3–0.9 °C and 0.05–0.20,respectively. Comparing the staircase structures of neigh-bouring stations, they showed similar profiles althoughnot exactly in the same depth range, thus indicatingundulations of the thermohaline structure by the action ofinternal waves.
3.1.3. Turbidity profilesThe analysis of the turbidity vertical distribution
obtained with the nephelometer data collected duringthe MEDTOP CTD casts showed, generally, an increasein the values within the MW layers, especially withinthe Lower Core where they were, in general, highlycorrelated with the salinity profiles. When the DeepCore was present, it was also associated with highturbidity values usually exceeding those of the LowerCore. In some of the above-mentioned thick homoge-neous (in T and S) layers, a turbidity peak was found atexactly the depth where the Lower Core salinity peak is
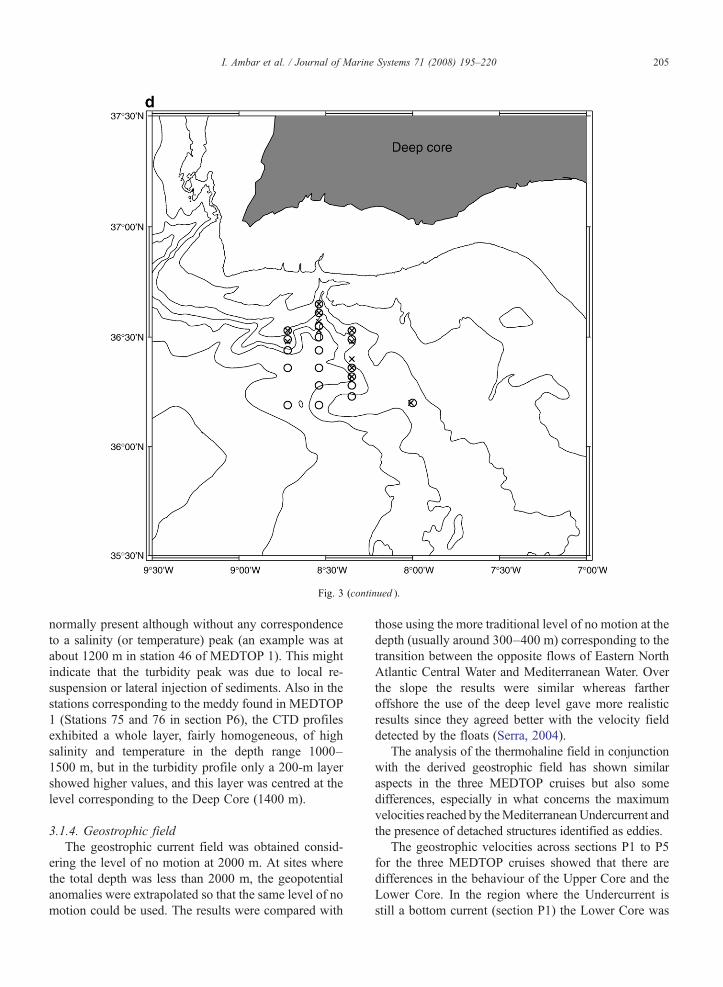
Fig. 3 (continued ).
205I. Ambar et al. / Journal of Marine Systems 71 (2008) 195–220
normally present although without any correspondenceto a salinity (or temperature) peak (an example was atabout 1200 m in station 46 of MEDTOP 1). This mightindicate that the turbidity peak was due to local re-suspension or lateral injection of sediments. Also in thestations corresponding to the meddy found in MEDTOP1 (Stations 75 and 76 in section P6), the CTD profilesexhibited a whole layer, fairly homogeneous, of highsalinity and temperature in the depth range 1000–1500 m, but in the turbidity profile only a 200-m layershowed higher values, and this layer was centred at thelevel corresponding to the Deep Core (1400 m).
3.1.4. Geostrophic fieldThe geostrophic current field was obtained consid-
ering the level of no motion at 2000 m. At sites wherethe total depth was less than 2000 m, the geopotentialanomalies were extrapolated so that the same level of nomotion could be used. The results were compared with
those using the more traditional level of no motion at thedepth (usually around 300–400 m) corresponding to thetransition between the opposite flows of Eastern NorthAtlantic Central Water and Mediterranean Water. Overthe slope the results were similar whereas fartheroffshore the use of the deep level gave more realisticresults since they agreed better with the velocity fielddetected by the floats (Serra, 2004).
The analysis of the thermohaline field in conjunctionwith the derived geostrophic field has shown similaraspects in the three MEDTOP cruises but also somedifferences, especially in what concerns the maximumvelocities reached by theMediterraneanUndercurrent andthe presence of detached structures identified as eddies.
The geostrophic velocities across sections P1 to P5for the three MEDTOP cruises showed that there aredifferences in the behaviour of the Upper Core and theLower Core. In the region where the Undercurrent isstill a bottom current (section P1) the Lower Core was
206 I. Ambar et al. / Journal of Marine Systems 71 (2008) 195–220
faster than the Upper Core, but farther downstream(section P2) the Upper Core accelerated whereas theLower Core decelerated (except during MEDTOP 3).Even farther downstream (sections P3 to P5) there wasnot a regular trend of the cores velocity although theUpper Core velocity maximum (Table 1) was system-atically higher (two- or threefold) than the Lower Corevelocity maximum.
3.1.5. MW cores followed by RAFOS floatsConcerning the RAFOS floats, those that were
deployed at 500 m in the Álvares Cabral submarinevalley with the specific objective of following the MWShallow Core, showed similar behaviours in all the threeMEDTOP cruises: they followed an offshoreward trackalong that valley until the 800–900-m bathymetric lineregion and then crossed the head of the PortimãoCanyon in an almost undisturbed zonal line until theyreached the region off Cape St. Vincent where theyturned northward.
The RAFOS floats deployed at the levels of theShallow Core (500 m) and of the Upper Core (800 m)reached, in general, higher latitudes (not beyond 42°N)than the floats at the levels of the Lower Core (1000 and1200 m) which, with two exceptions, did not overpass37.5°N.
There are some aspects concerning the relationshipbetween the MW main cores which can be evaluated bycomparing the RAFOS float trajectories at the level ofthe Upper and Lower cores. For instance, we know fromhistorical CTD data collected in the NE Atlantic thatmost of the reported meddies have a double verticalstructure, with one core centred at about 800 m (UpperCore) and another at 1200 m (Lower Core). Is this theresult of the merging of two eddies formed at differentdepths and times, or of the whole structure being shed atone time? The latter hypothesis raised the question of
Table 1Maximum geostrophic velocity (m s−1) within the MediterraneanUndercurrent, at the Upper and Lower Core levels
Section MWcore
MEDTOP 1 MEDTOP 2 MEDTOP 3
Feb 2001 May 2001 Sept 2001
P1 Upper 0.24 0.17 0.11Lower 0.36 0.49 0.31
P2 Upper 0.63 0.62 0.94Lower 0.22 0.17 0.48
P3 Upper 0.33 0.39 0.61Lower 0.16 0.17 0.32
P4 Upper 0.23 0.62 0.62Lower 0.07 0.29 0.33
P5 Upper – 0.29 0.60Lower – 0.13 0.42
whether or not a dynamical link exists between theUpper and the Lower Cores when they are found alignedin the vertical. In order to investigate this issue, the floattracks for the first 30 days after their deployment, whichcorrespond to the float's paths still in the region of thePortimão Canyon, were analysed. We start with thosefloats that were deployed in section P1 (within the levelsof the Upper and Lower Cores) at the stations closest tothe continental slope (corresponding to positions E andD in the scheme of Fig. 1d). These locations correspondto station 13 (position E) for the Upper Core and tostation 11 (position D) for the Lower Core, in the threeMEDTOP cruises (see Fig. 1 for locations). Fig. 4 showsthe trajectories (coloured according to the float velocity)followed by these RAFOS floats during the initial30 days after being launched. In all cases, the UpperCore floats (floats at 800 m) crossed the PortimãoCanyon along a path generally closer to the shore andwith higher velocities (reaching 0.3–0.4 m s−1) whencompared with the Lower Core floats (floats at 1200 m).The floats in the Lower Core did not exceed 0.3 m s−1
excepting float 202 launched in MEDTOP 2, whichaccelerated from around 0.1 m s−1 to values reachingabout 0.4 m s−1 after crossing the Canyon. It is inte-resting to note that the velocity values obtained from thefloats progression were comparable to those obtainedwith the geostrophic calculations. In what concerns thetemperatures recorded by the floats, those within theLower Core kept values around 11.5 °C whereas thosein the Upper Core were within the interval 12.0bTb13.0 °C. These values are compatible with those mea-sured in the same CTD stations (13 and 11) and samelevels where the floats were launched.
Also with the purpose of comparing the dynamicalbehaviour of the Upper and Lower Cores and verifyingany dynamical link between them, the trajectories of theRAFOS floats launched in the same vertical in sectionP1, at respectively the levels of the Upper and of theLower Core (float pairs A–B and C–D, see scheme ofFig. 1d), were examined (Fig. 5). Although each pair offloats had been deployed in the same geographicalposition, in general the path of the float at 800 m (upperfloat) was not coincident with that at 1200 m (lowerfloat). In the case of MEDTOP 1 (float pair 191–205,deployed at CTD station 9, and float pair 192–206,deployed at CTD station 11) upper and lower floats werealmost parallel for the first few (5–10) days but thendiverged (Fig. 5a), with the upper floats (191 and 192)crossing the Canyon and following westwards along theisobaths and the lower floats diverging offshorewardsstill upstream (float 205) or only downstream (float 206)from the Canyon. In the case of MEDTOP 2 (pair of
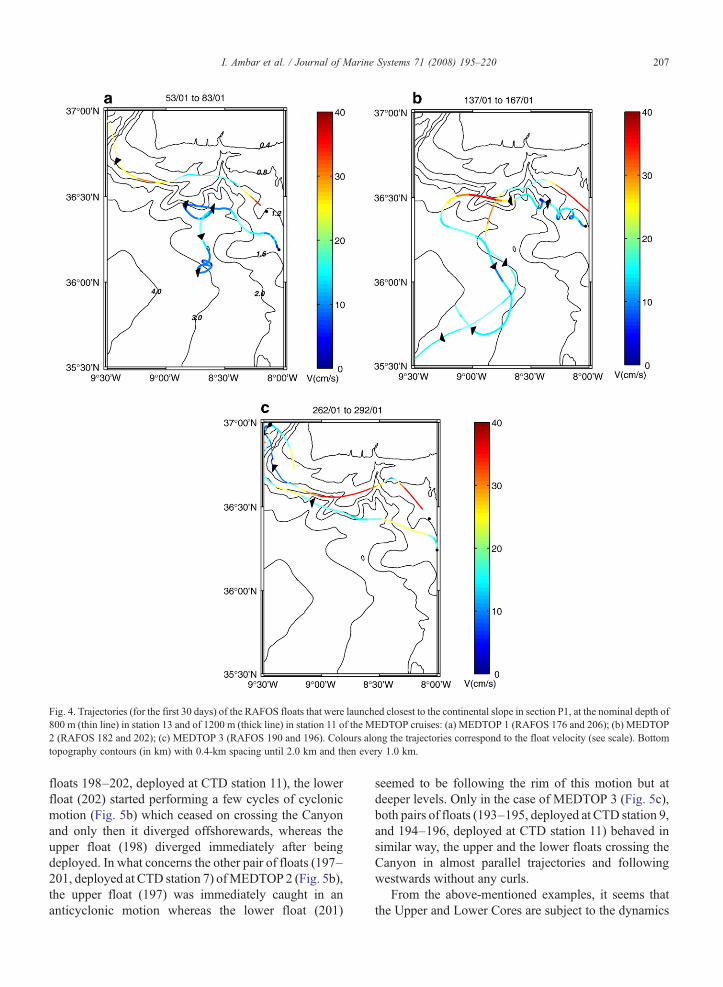
Fig. 4. Trajectories (for the first 30 days) of the RAFOS floats that were launched closest to the continental slope in section P1, at the nominal depth of800 m (thin line) in station 13 and of 1200 m (thick line) in station 11 of the MEDTOP cruises: (a) MEDTOP 1 (RAFOS 176 and 206); (b) MEDTOP2 (RAFOS 182 and 202); (c) MEDTOP 3 (RAFOS 190 and 196). Colours along the trajectories correspond to the float velocity (see scale). Bottomtopography contours (in km) with 0.4-km spacing until 2.0 km and then every 1.0 km.
207I. Ambar et al. / Journal of Marine Systems 71 (2008) 195–220
floats 198–202, deployed at CTD station 11), the lowerfloat (202) started performing a few cycles of cyclonicmotion (Fig. 5b) which ceased on crossing the Canyonand only then it diverged offshorewards, whereas theupper float (198) diverged immediately after beingdeployed. In what concerns the other pair of floats (197–201, deployed at CTD station 7) ofMEDTOP 2 (Fig. 5b),the upper float (197) was immediately caught in ananticyclonic motion whereas the lower float (201)
seemed to be following the rim of this motion but atdeeper levels. Only in the case of MEDTOP 3 (Fig. 5c),both pairs of floats (193–195, deployed at CTD station 9,and 194–196, deployed at CTD station 11) behaved insimilar way, the upper and the lower floats crossing theCanyon in almost parallel trajectories and followingwestwards without any curls.
From the above-mentioned examples, it seems thatthe Upper and Lower Cores are subject to the dynamics
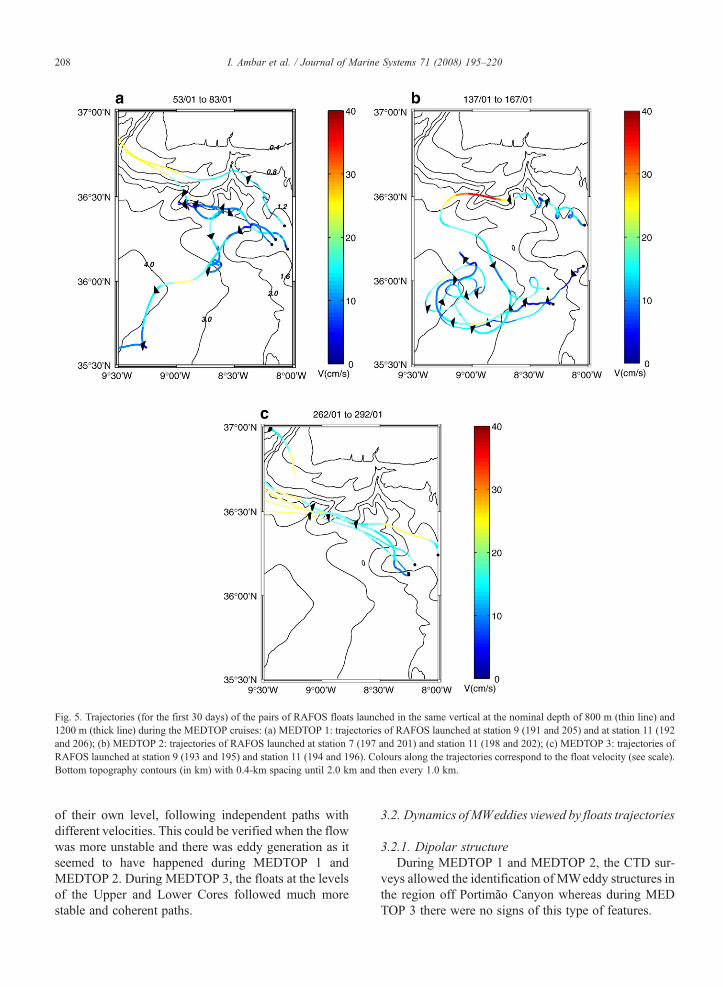
Fig. 5. Trajectories (for the first 30 days) of the pairs of RAFOS floats launched in the same vertical at the nominal depth of 800 m (thin line) and1200 m (thick line) during the MEDTOP cruises: (a) MEDTOP 1: trajectories of RAFOS launched at station 9 (191 and 205) and at station 11 (192and 206); (b) MEDTOP 2: trajectories of RAFOS launched at station 7 (197 and 201) and station 11 (198 and 202); (c) MEDTOP 3: trajectories ofRAFOS launched at station 9 (193 and 195) and station 11 (194 and 196). Colours along the trajectories correspond to the float velocity (see scale).Bottom topography contours (in km) with 0.4-km spacing until 2.0 km and then every 1.0 km.
208 I. Ambar et al. / Journal of Marine Systems 71 (2008) 195–220
of their own level, following independent paths withdifferent velocities. This could be verified when the flowwas more unstable and there was eddy generation as itseemed to have happened during MEDTOP 1 andMEDTOP 2. During MEDTOP 3, the floats at the levelsof the Upper and Lower Cores followed much morestable and coherent paths.
3.2. Dynamics ofMWeddies viewed by floats trajectories
3.2.1. Dipolar structureDuring MEDTOP 1 and MEDTOP 2, the CTD sur-
veys allowed the identification of MWeddy structures inthe region off Portimão Canyon whereas during MEDTOP 3 there were no signs of this type of features.
209I. Ambar et al. / Journal of Marine Systems 71 (2008) 195–220
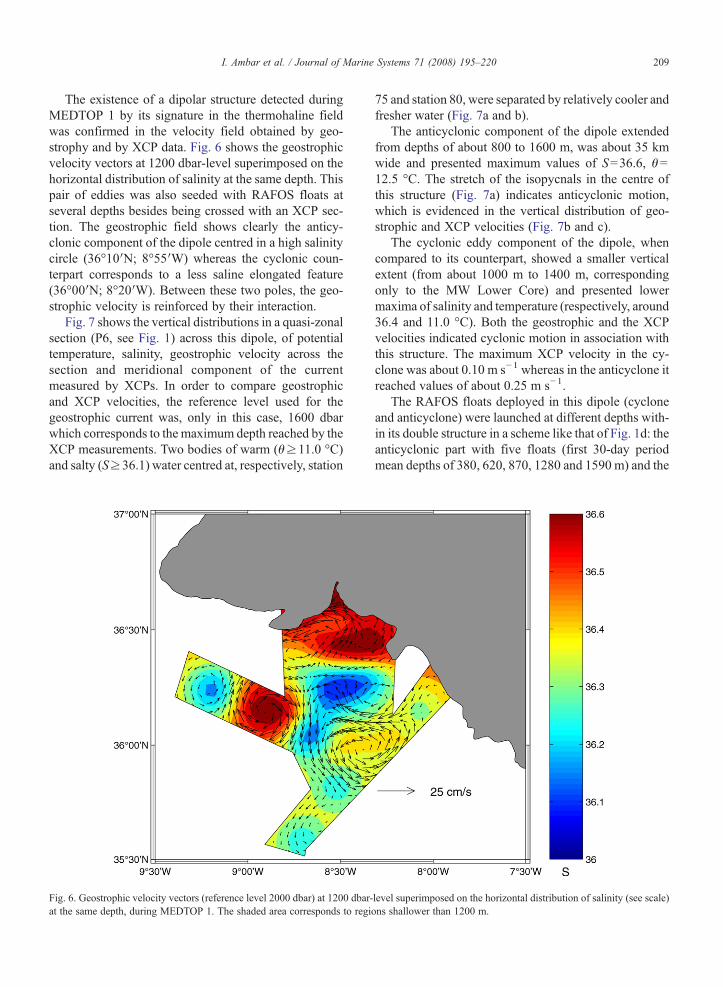
The existence of a dipolar structure detected duringMEDTOP 1 by its signature in the thermohaline fieldwas confirmed in the velocity field obtained by geo-strophy and by XCP data. Fig. 6 shows the geostrophicvelocity vectors at 1200 dbar-level superimposed on thehorizontal distribution of salinity at the same depth. Thispair of eddies was also seeded with RAFOS floats atseveral depths besides being crossed with an XCP sec-tion. The geostrophic field shows clearly the anticy-clonic component of the dipole centred in a high salinitycircle (36°10′N; 8°55′W) whereas the cyclonic coun-terpart corresponds to a less saline elongated feature(36°00′N; 8°20′W). Between these two poles, the geo-strophic velocity is reinforced by their interaction.
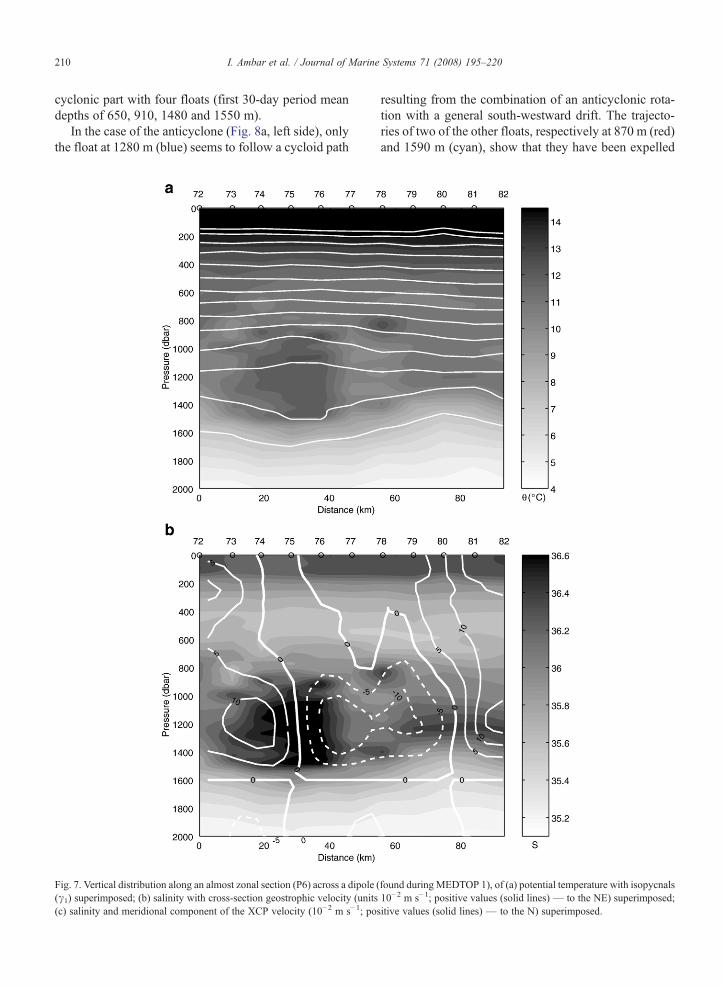
Fig. 7 shows the vertical distributions in a quasi-zonalsection (P6, see Fig. 1) across this dipole, of potentialtemperature, salinity, geostrophic velocity across thesection and meridional component of the currentmeasured by XCPs. In order to compare geostrophicand XCP velocities, the reference level used for thegeostrophic current was, only in this case, 1600 dbarwhich corresponds to the maximum depth reached by theXCP measurements. Two bodies of warm (θ≥11.0 °C)and salty (S≥36.1) water centred at, respectively, station
Fig. 6. Geostrophic velocity vectors (reference level 2000 dbar) at 1200 dbar-at the same depth, during MEDTOP 1. The shaded area corresponds to regio
75 and station 80, were separated by relatively cooler andfresher water (Fig. 7a and b).
The anticyclonic component of the dipole extendedfrom depths of about 800 to 1600 m, was about 35 kmwide and presented maximum values of S=36.6, θ=12.5 °C. The stretch of the isopycnals in the centre ofthis structure (Fig. 7a) indicates anticyclonic motion,which is evidenced in the vertical distribution of geo-strophic and XCP velocities (Fig. 7b and c).
The cyclonic eddy component of the dipole, whencompared to its counterpart, showed a smaller verticalextent (from about 1000 m to 1400 m, correspondingonly to the MW Lower Core) and presented lowermaxima of salinity and temperature (respectively, around36.4 and 11.0 °C). Both the geostrophic and the XCPvelocities indicated cyclonic motion in association withthis structure. The maximum XCP velocity in the cy-clone was about 0.10 m s−1 whereas in the anticyclone itreached values of about 0.25 m s−1.
The RAFOS floats deployed in this dipole (cycloneand anticyclone) were launched at different depths with-in its double structure in a scheme like that of Fig. 1d: theanticyclonic part with five floats (first 30-day periodmean depths of 380, 620, 870, 1280 and 1590 m) and the
level superimposed on the horizontal distribution of salinity (see scale)ns shallower than 1200 m.
210 I. Ambar et al. / Journal of Marine Systems 71 (2008) 195–220
cyclonic part with four floats (first 30-day period meandepths of 650, 910, 1480 and 1550 m).
In the case of the anticyclone (Fig. 8a, left side), onlythe float at 1280 m (blue) seems to follow a cycloid path
Fig. 7. Vertical distribution along an almost zonal section (P6) across a dipole ((γ1) superimposed; (b) salinity with cross-section geostrophic velocity (units(c) salinity and meridional component of the XCP velocity (10−2 m s−1; po
resulting from the combination of an anticyclonic rota-tion with a general south-westward drift. The trajecto-ries of two of the other floats, respectively at 870 m (red)and 1590 m (cyan), show that they have been expelled
found duringMEDTOP 1), of (a) potential temperature with isopycnals10−2 m s−1; positive values (solid lines) — to the NE) superimposed;sitive values (solid lines) — to the N) superimposed.
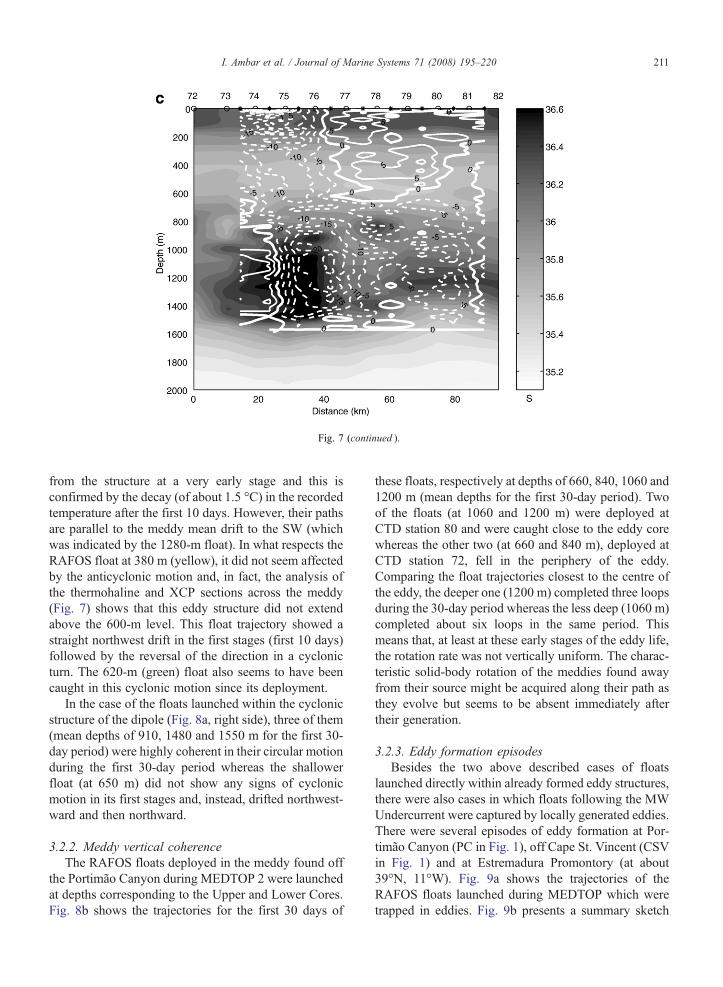
Fig. 7 (continued ).
211I. Ambar et al. / Journal of Marine Systems 71 (2008) 195–220
from the structure at a very early stage and this isconfirmed by the decay (of about 1.5 °C) in the recordedtemperature after the first 10 days. However, their pathsare parallel to the meddy mean drift to the SW (whichwas indicated by the 1280-m float). In what respects theRAFOS float at 380 m (yellow), it did not seem affectedby the anticyclonic motion and, in fact, the analysis ofthe thermohaline and XCP sections across the meddy(Fig. 7) shows that this eddy structure did not extendabove the 600-m level. This float trajectory showed astraight northwest drift in the first stages (first 10 days)followed by the reversal of the direction in a cyclonicturn. The 620-m (green) float also seems to have beencaught in this cyclonic motion since its deployment.
In the case of the floats launched within the cyclonicstructure of the dipole (Fig. 8a, right side), three of them(mean depths of 910, 1480 and 1550 m for the first 30-day period) were highly coherent in their circular motionduring the first 30-day period whereas the shallowerfloat (at 650 m) did not show any signs of cyclonicmotion in its first stages and, instead, drifted northwest-ward and then northward.
3.2.2. Meddy vertical coherenceThe RAFOS floats deployed in the meddy found off
the Portimão Canyon during MEDTOP 2 were launchedat depths corresponding to the Upper and Lower Cores.Fig. 8b shows the trajectories for the first 30 days of
these floats, respectively at depths of 660, 840, 1060 and1200 m (mean depths for the first 30-day period). Twoof the floats (at 1060 and 1200 m) were deployed atCTD station 80 and were caught close to the eddy corewhereas the other two (at 660 and 840 m), deployed atCTD station 72, fell in the periphery of the eddy.Comparing the float trajectories closest to the centre ofthe eddy, the deeper one (1200 m) completed three loopsduring the 30-day period whereas the less deep (1060 m)completed about six loops in the same period. Thismeans that, at least at these early stages of the eddy life,the rotation rate was not vertically uniform. The charac-teristic solid-body rotation of the meddies found awayfrom their source might be acquired along their path asthey evolve but seems to be absent immediately aftertheir generation.
3.2.3. Eddy formation episodesBesides the two above described cases of floats
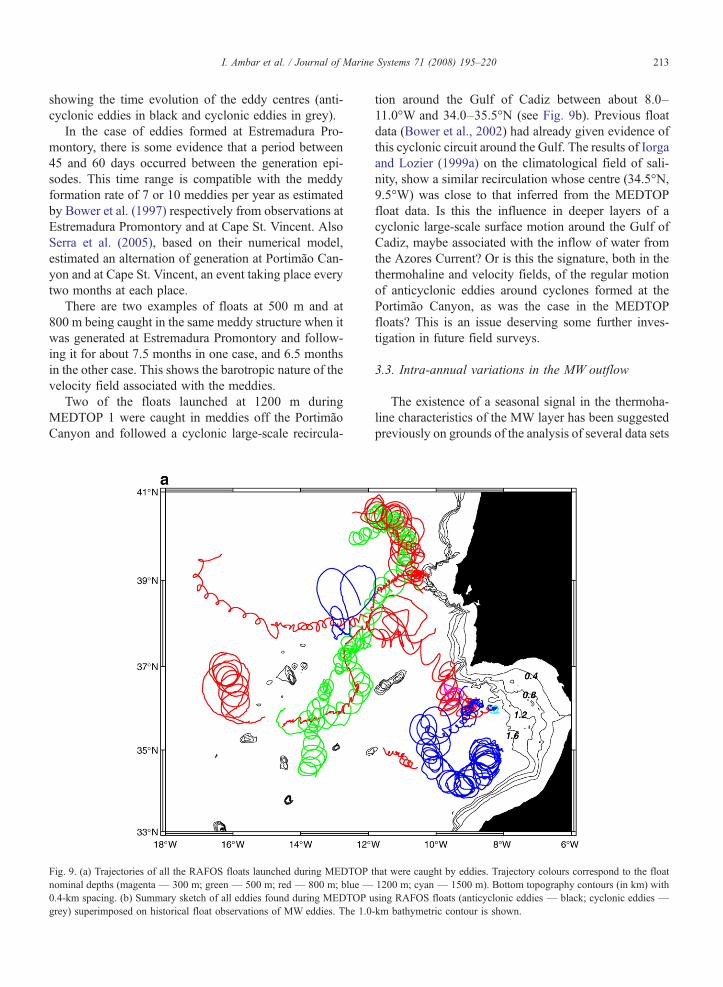
launched directly within already formed eddy structures,there were also cases in which floats following the MWUndercurrent were captured by locally generated eddies.There were several episodes of eddy formation at Por-timão Canyon (PC in Fig. 1), off Cape St. Vincent (CSVin Fig. 1) and at Estremadura Promontory (at about39°N, 11°W). Fig. 9a shows the trajectories of theRAFOS floats launched during MEDTOP which weretrapped in eddies. Fig. 9b presents a summary sketch

Fig. 8. Trajectories (first 30 days) of the RAFOS floats that were launched simultaneously in the same eddy-like structure during (a) MEDTOP 1anticyclone (left side): trajectory colours correspond to the first 30-day mean depths (380 m— magenta; 620 m— green; 870 m— red; 1280 m—blue; 1590 m— cyan) and MEDTOP 1 cyclone (right side): trajectory colours correspond to the first 30-day mean depths (650 m— green; 910 m—red; 1480 m— blue; 1550 m— cyan); (b) MEDTOP 2 anticyclone: trajectory colours correspond to the first 30-day mean depths (660 m— green;840 m — red; 1060 m — black; 1200 m — blue). Bottom topography contours (in km) with 0.4-km spacing until 2.0 km and then every 1.0 km.
212 I. Ambar et al. / Journal of Marine Systems 71 (2008) 195–220
213I. Ambar et al. / Journal of Marine Systems 71 (2008) 195–220
showing the time evolution of the eddy centres (anti-cyclonic eddies in black and cyclonic eddies in grey).
In the case of eddies formed at Estremadura Pro-montory, there is some evidence that a period between45 and 60 days occurred between the generation epi-sodes. This time range is compatible with the meddyformation rate of 7 or 10 meddies per year as estimatedby Bower et al. (1997) respectively from observations atEstremadura Promontory and at Cape St. Vincent. AlsoSerra et al. (2005), based on their numerical model,estimated an alternation of generation at Portimão Can-yon and at Cape St. Vincent, an event taking place everytwo months at each place.
There are two examples of floats at 500 m and at800 m being caught in the same meddy structure when itwas generated at Estremadura Promontory and follow-ing it for about 7.5 months in one case, and 6.5 monthsin the other case. This shows the barotropic nature of thevelocity field associated with the meddies.
Two of the floats launched at 1200 m duringMEDTOP 1 were caught in meddies off the PortimãoCanyon and followed a cyclonic large-scale recircula-
Fig. 9. (a) Trajectories of all the RAFOS floats launched during MEDTOPnominal depths (magenta — 300 m; green — 500 m; red — 800 m; blue —0.4-km spacing. (b) Summary sketch of all eddies found during MEDTOP ugrey) superimposed on historical float observations of MW eddies. The 1.0
tion around the Gulf of Cadiz between about 8.0–11.0°W and 34.0–35.5°N (see Fig. 9b). Previous floatdata (Bower et al., 2002) had already given evidence ofthis cyclonic circuit around the Gulf. The results of Iorgaand Lozier (1999a) on the climatological field of sali-nity, show a similar recirculation whose centre (34.5°N,9.5°W) was close to that inferred from the MEDTOPfloat data. Is this the influence in deeper layers of acyclonic large-scale surface motion around the Gulf ofCadiz, maybe associated with the inflow of water fromthe Azores Current? Or is this the signature, both in thethermohaline and velocity fields, of the regular motionof anticyclonic eddies around cyclones formed at thePortimão Canyon, as was the case in the MEDTOPfloats? This is an issue deserving some further inves-tigation in future field surveys.
3.3. Intra-annual variations in the MW outflow
The existence of a seasonal signal in the thermoha-line characteristics of the MW layer has been suggestedpreviously on grounds of the analysis of several data sets
that were caught by eddies. Trajectory colours correspond to the float1200 m; cyan — 1500 m). Bottom topography contours (in km) withsing RAFOS floats (anticyclonic eddies — black; cyclonic eddies —-km bathymetric contour is shown.
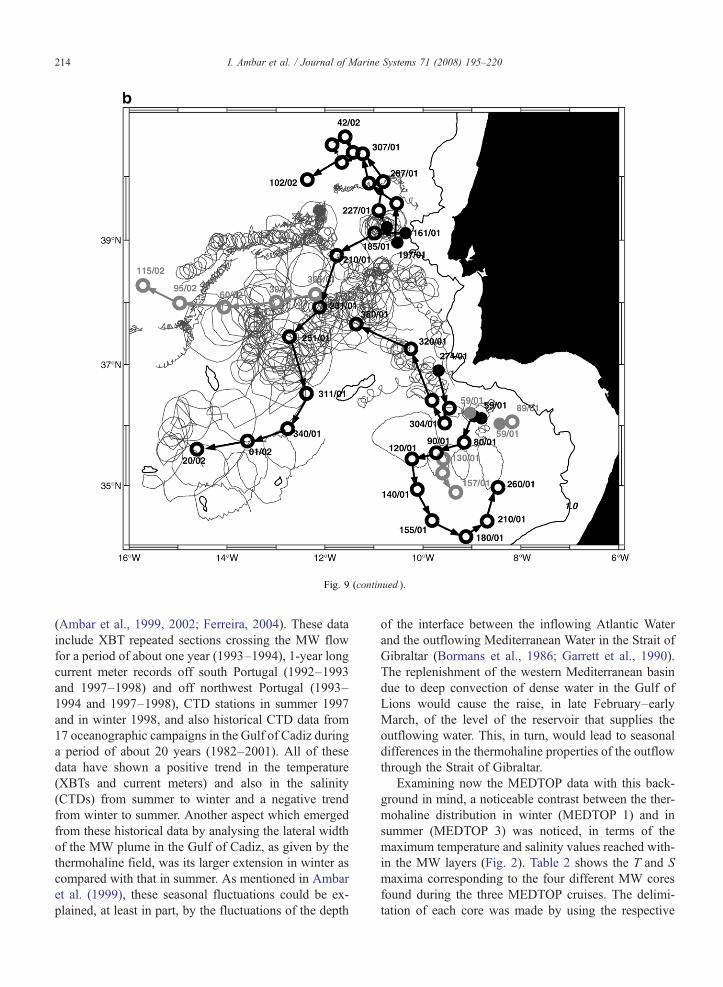
Fig. 9 (continued ).
214 I. Ambar et al. / Journal of Marine Systems 71 (2008) 195–220
(Ambar et al., 1999, 2002; Ferreira, 2004). These datainclude XBT repeated sections crossing the MW flowfor a period of about one year (1993–1994), 1-year longcurrent meter records off south Portugal (1992–1993and 1997–1998) and off northwest Portugal (1993–1994 and 1997–1998), CTD stations in summer 1997and in winter 1998, and also historical CTD data from17 oceanographic campaigns in the Gulf of Cadiz duringa period of about 20 years (1982–2001). All of thesedata have shown a positive trend in the temperature(XBTs and current meters) and also in the salinity(CTDs) from summer to winter and a negative trendfrom winter to summer. Another aspect which emergedfrom these historical data by analysing the lateral widthof the MW plume in the Gulf of Cadiz, as given by thethermohaline field, was its larger extension in winter ascompared with that in summer. As mentioned in Ambaret al. (1999), these seasonal fluctuations could be ex-plained, at least in part, by the fluctuations of the depth
of the interface between the inflowing Atlantic Waterand the outflowing Mediterranean Water in the Strait ofGibraltar (Bormans et al., 1986; Garrett et al., 1990).The replenishment of the western Mediterranean basindue to deep convection of dense water in the Gulf ofLions would cause the raise, in late February–earlyMarch, of the level of the reservoir that supplies theoutflowing water. This, in turn, would lead to seasonaldifferences in the thermohaline properties of the outflowthrough the Strait of Gibraltar.
Examining now the MEDTOP data with this back-ground in mind, a noticeable contrast between the ther-mohaline distribution in winter (MEDTOP 1) and insummer (MEDTOP 3) was noticed, in terms of themaximum temperature and salinity values reached with-in the MW layers (Fig. 2). Table 2 shows the T and Smaxima corresponding to the four different MW coresfound during the three MEDTOP cruises. The delimi-tation of each core was made by using the respective
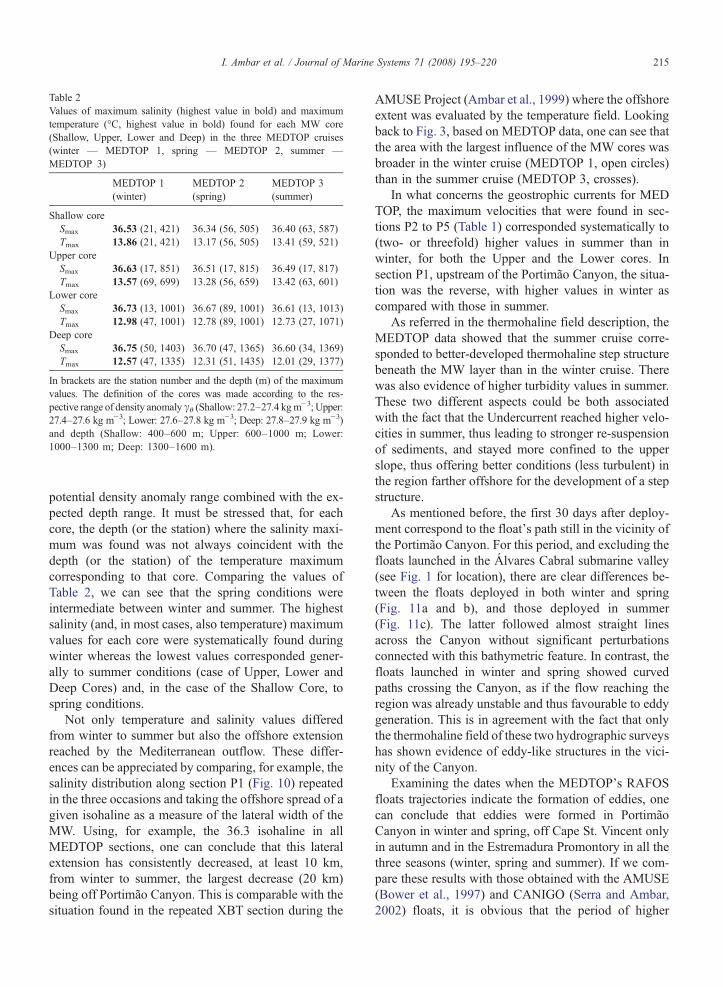
Table 2Values of maximum salinity (highest value in bold) and maximumtemperature (°C, highest value in bold) found for each MW core(Shallow, Upper, Lower and Deep) in the three MEDTOP cruises(winter — MEDTOP 1, spring — MEDTOP 2, summer —MEDTOP 3)
MEDTOP 1(winter)
MEDTOP 2(spring)
MEDTOP 3(summer)
Shallow coreSmax 36.53 (21, 421) 36.34 (56, 505) 36.40 (63, 587)Tmax 13.86 (21, 421) 13.17 (56, 505) 13.41 (59, 521)
Upper coreSmax 36.63 (17, 851) 36.51 (17, 815) 36.49 (17, 817)Tmax 13.57 (69, 699) 13.28 (56, 659) 13.42 (63, 601)
Lower coreSmax 36.73 (13, 1001) 36.67 (89, 1001) 36.61 (13, 1013)Tmax 12.98 (47, 1001) 12.78 (89, 1001) 12.73 (27, 1071)
Deep coreSmax 36.75 (50, 1403) 36.70 (47, 1365) 36.60 (34, 1369)Tmax 12.57 (47, 1335) 12.31 (51, 1435) 12.01 (29, 1377)
In brackets are the station number and the depth (m) of the maximumvalues. The definition of the cores was made according to the res-pective range of density anomalyγθ (Shallow: 27.2–27.4 kgm
−3; Upper:27.4–27.6 kg m−3; Lower: 27.6–27.8 kg m−3; Deep: 27.8–27.9 kg m−3)and depth (Shallow: 400–600 m; Upper: 600–1000 m; Lower:1000–1300 m; Deep: 1300–1600 m).
215I. Ambar et al. / Journal of Marine Systems 71 (2008) 195–220
potential density anomaly range combined with the ex-pected depth range. It must be stressed that, for eachcore, the depth (or the station) where the salinity maxi-mum was found was not always coincident with thedepth (or the station) of the temperature maximumcorresponding to that core. Comparing the values ofTable 2, we can see that the spring conditions wereintermediate between winter and summer. The highestsalinity (and, in most cases, also temperature) maximumvalues for each core were systematically found duringwinter whereas the lowest values corresponded gener-ally to summer conditions (case of Upper, Lower andDeep Cores) and, in the case of the Shallow Core, tospring conditions.
Not only temperature and salinity values differedfrom winter to summer but also the offshore extensionreached by the Mediterranean outflow. These differ-ences can be appreciated by comparing, for example, thesalinity distribution along section P1 (Fig. 10) repeatedin the three occasions and taking the offshore spread of agiven isohaline as a measure of the lateral width of theMW. Using, for example, the 36.3 isohaline in allMEDTOP sections, one can conclude that this lateralextension has consistently decreased, at least 10 km,from winter to summer, the largest decrease (20 km)being off Portimão Canyon. This is comparable with thesituation found in the repeated XBT section during the
AMUSE Project (Ambar et al., 1999) where the offshoreextent was evaluated by the temperature field. Lookingback to Fig. 3, based on MEDTOP data, one can see thatthe area with the largest influence of the MW cores wasbroader in the winter cruise (MEDTOP 1, open circles)than in the summer cruise (MEDTOP 3, crosses).
In what concerns the geostrophic currents for MEDTOP, the maximum velocities that were found in sec-tions P2 to P5 (Table 1) corresponded systematically to(two- or threefold) higher values in summer than inwinter, for both the Upper and the Lower cores. Insection P1, upstream of the Portimão Canyon, the situa-tion was the reverse, with higher values in winter ascompared with those in summer.
As referred in the thermohaline field description, theMEDTOP data showed that the summer cruise corre-sponded to better-developed thermohaline step structurebeneath the MW layer than in the winter cruise. Therewas also evidence of higher turbidity values in summer.These two different aspects could be both associatedwith the fact that the Undercurrent reached higher velo-cities in summer, thus leading to stronger re-suspensionof sediments, and stayed more confined to the upperslope, thus offering better conditions (less turbulent) inthe region farther offshore for the development of a stepstructure.
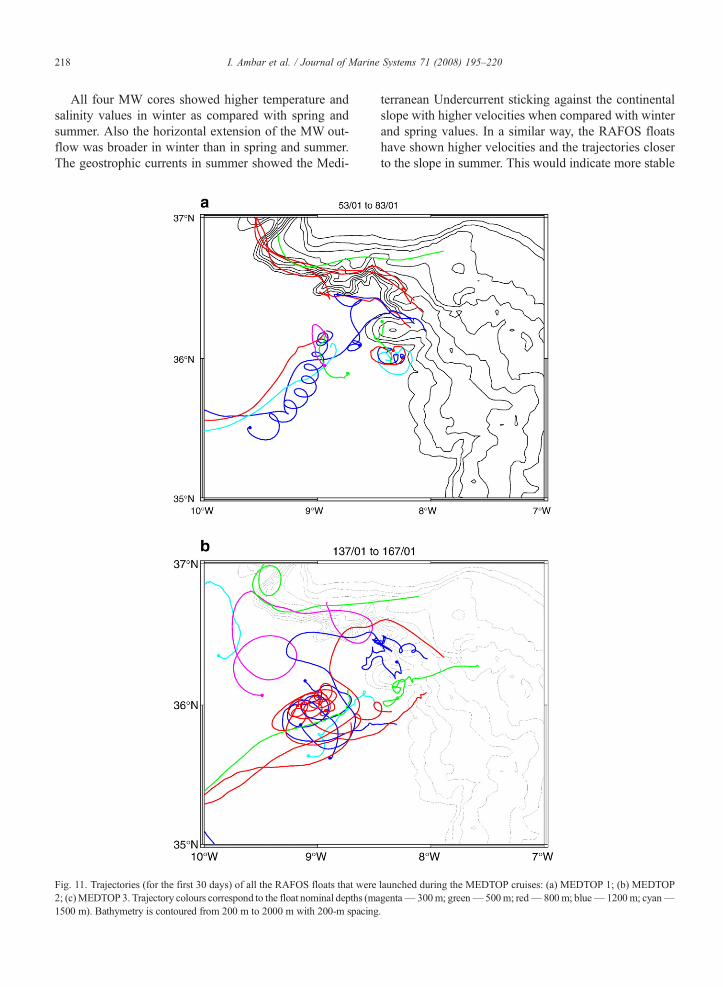
As mentioned before, the first 30 days after deploy-ment correspond to the float's path still in the vicinity ofthe Portimão Canyon. For this period, and excluding thefloats launched in the Álvares Cabral submarine valley(see Fig. 1 for location), there are clear differences be-tween the floats deployed in both winter and spring(Fig. 11a and b), and those deployed in summer(Fig. 11c). The latter followed almost straight linesacross the Canyon without significant perturbationsconnected with this bathymetric feature. In contrast, thefloats launched in winter and spring showed curvedpaths crossing the Canyon, as if the flow reaching theregion was already unstable and thus favourable to eddygeneration. This is in agreement with the fact that onlythe thermohaline field of these two hydrographic surveyshas shown evidence of eddy-like structures in the vici-nity of the Canyon.
Examining the dates when the MEDTOP's RAFOSfloats trajectories indicate the formation of eddies, onecan conclude that eddies were formed in PortimãoCanyon in winter and spring, off Cape St. Vincent onlyin autumn and in the Estremadura Promontory in all thethree seasons (winter, spring and summer). If we com-pare these results with those obtained with the AMUSE(Bower et al., 1997) and CANIGO (Serra and Ambar,2002) floats, it is obvious that the period of higher
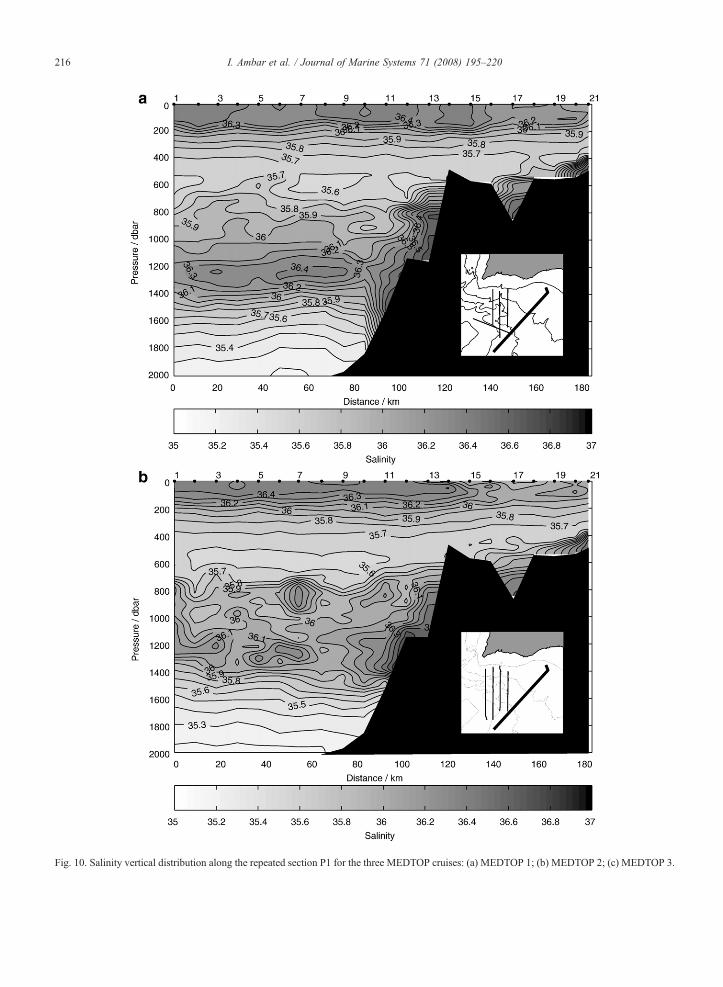
Fig. 10. Salinity vertical distribution along the repeated section P1 for the three MEDTOP cruises: (a) MEDTOP 1; (b) MEDTOP 2; (c) MEDTOP 3.
216 I. Ambar et al. / Journal of Marine Systems 71 (2008) 195–220
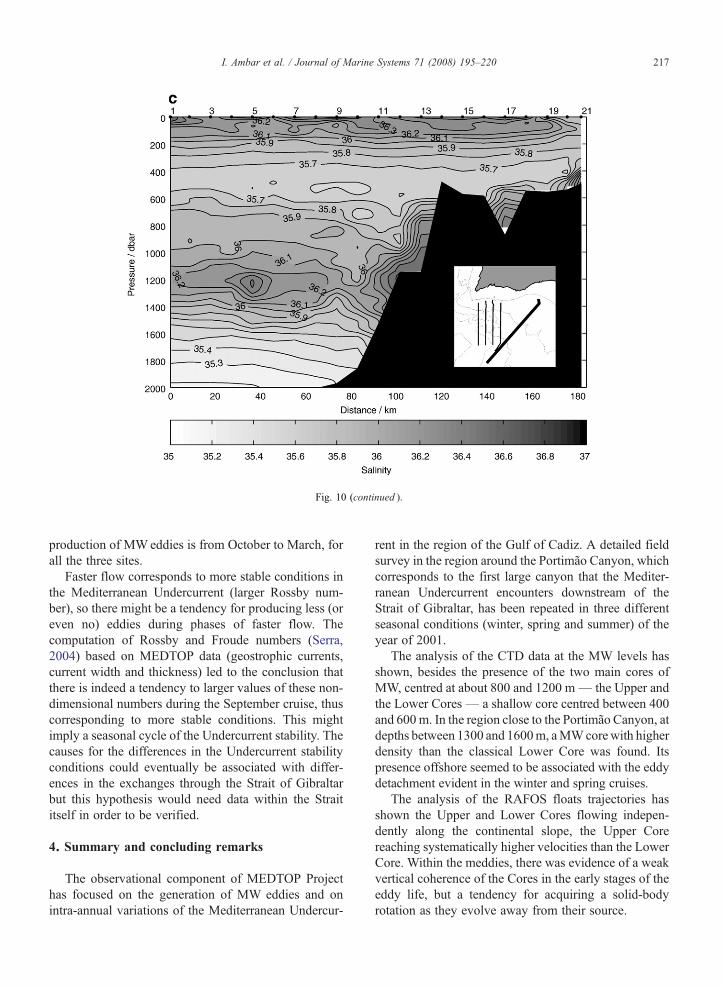
Fig. 10 (continued ).
217I. Ambar et al. / Journal of Marine Systems 71 (2008) 195–220
production of MWeddies is from October to March, forall the three sites.
Faster flow corresponds to more stable conditions inthe Mediterranean Undercurrent (larger Rossby num-ber), so there might be a tendency for producing less (oreven no) eddies during phases of faster flow. Thecomputation of Rossby and Froude numbers (Serra,2004) based on MEDTOP data (geostrophic currents,current width and thickness) led to the conclusion thatthere is indeed a tendency to larger values of these non-dimensional numbers during the September cruise, thuscorresponding to more stable conditions. This mightimply a seasonal cycle of the Undercurrent stability. Thecauses for the differences in the Undercurrent stabilityconditions could eventually be associated with differ-ences in the exchanges through the Strait of Gibraltarbut this hypothesis would need data within the Straititself in order to be verified.
4. Summary and concluding remarks
The observational component of MEDTOP Projecthas focused on the generation of MW eddies and onintra-annual variations of the Mediterranean Undercur-
rent in the region of the Gulf of Cadiz. A detailed fieldsurvey in the region around the Portimão Canyon, whichcorresponds to the first large canyon that the Mediter-ranean Undercurrent encounters downstream of theStrait of Gibraltar, has been repeated in three differentseasonal conditions (winter, spring and summer) of theyear of 2001.
The analysis of the CTD data at the MW levels hasshown, besides the presence of the two main cores ofMW, centred at about 800 and 1200 m— the Upper andthe Lower Cores— a shallow core centred between 400and 600m. In the region close to the Portimão Canyon, atdepths between 1300 and 1600m, aMWcorewith higherdensity than the classical Lower Core was found. Itspresence offshore seemed to be associated with the eddydetachment evident in the winter and spring cruises.
The analysis of the RAFOS floats trajectories hasshown the Upper and Lower Cores flowing indepen-dently along the continental slope, the Upper Corereaching systematically higher velocities than the LowerCore. Within the meddies, there was evidence of a weakvertical coherence of the Cores in the early stages of theeddy life, but a tendency for acquiring a solid-bodyrotation as they evolve away from their source.
218 I. Ambar et al. / Journal of Marine Systems 71 (2008) 195–220
All four MW cores showed higher temperature andsalinity values in winter as compared with spring andsummer. Also the horizontal extension of the MW out-flow was broader in winter than in spring and summer.The geostrophic currents in summer showed the Medi-
Fig. 11. Trajectories (for the first 30 days) of all the RAFOS floats that were2; (c)MEDTOP 3. Trajectory colours correspond to the float nominal depths (ma1500 m). Bathymetry is contoured from 200 m to 2000 m with 200-m spacing
terranean Undercurrent sticking against the continentalslope with higher velocities when compared with winterand spring values. In a similar way, the RAFOS floatshave shown higher velocities and the trajectories closerto the slope in summer. This would indicate more stable
launched during the MEDTOP cruises: (a) MEDTOP 1; (b) MEDTOPgenta— 300m; green— 500m; red— 800m; blue— 1200m; cyan—.
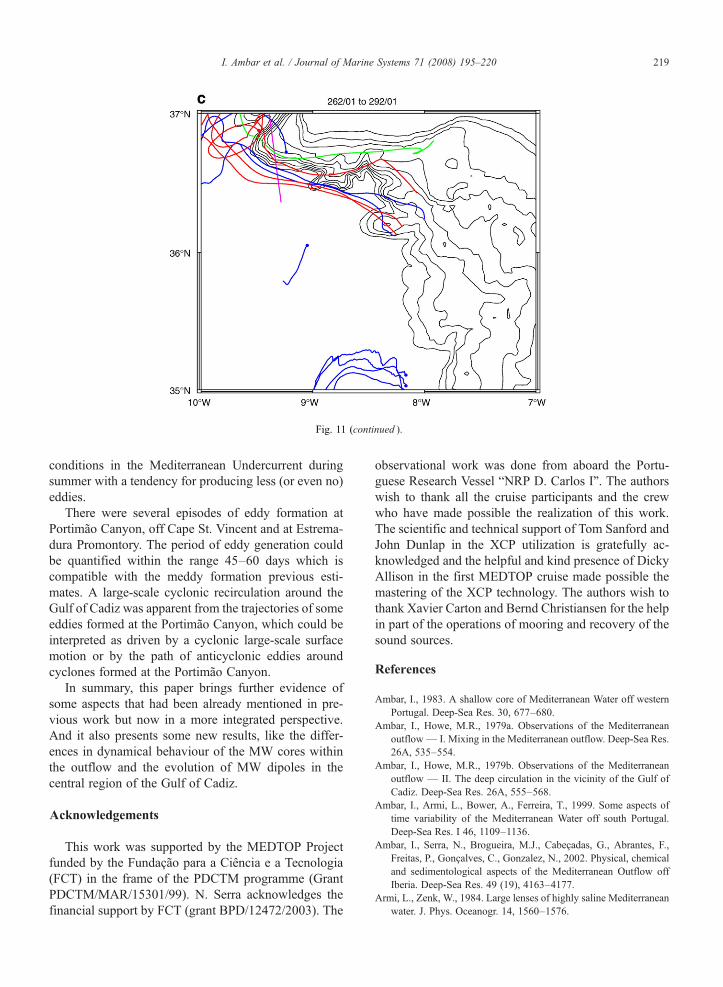
Fig. 11 (continued ).
219I. Ambar et al. / Journal of Marine Systems 71 (2008) 195–220
conditions in the Mediterranean Undercurrent duringsummer with a tendency for producing less (or even no)eddies.
There were several episodes of eddy formation atPortimão Canyon, off Cape St. Vincent and at Estrema-dura Promontory. The period of eddy generation couldbe quantified within the range 45–60 days which iscompatible with the meddy formation previous esti-mates. A large-scale cyclonic recirculation around theGulf of Cadiz was apparent from the trajectories of someeddies formed at the Portimão Canyon, which could beinterpreted as driven by a cyclonic large-scale surfacemotion or by the path of anticyclonic eddies aroundcyclones formed at the Portimão Canyon.
In summary, this paper brings further evidence ofsome aspects that had been already mentioned in pre-vious work but now in a more integrated perspective.And it also presents some new results, like the differ-ences in dynamical behaviour of the MW cores withinthe outflow and the evolution of MW dipoles in thecentral region of the Gulf of Cadiz.
Acknowledgements
This work was supported by the MEDTOP Projectfunded by the Fundação para a Ciência e a Tecnologia(FCT) in the frame of the PDCTM programme (GrantPDCTM/MAR/15301/99). N. Serra acknowledges thefinancial support by FCT (grant BPD/12472/2003). The
observational work was done from aboard the Portu-guese Research Vessel “NRP D. Carlos I”. The authorswish to thank all the cruise participants and the crewwho have made possible the realization of this work.The scientific and technical support of Tom Sanford andJohn Dunlap in the XCP utilization is gratefully ac-knowledged and the helpful and kind presence of DickyAllison in the first MEDTOP cruise made possible themastering of the XCP technology. The authors wish tothank Xavier Carton and Bernd Christiansen for the helpin part of the operations of mooring and recovery of thesound sources.
References
Ambar, I., 1983. A shallow core of Mediterranean Water off westernPortugal. Deep-Sea Res. 30, 677–680.
Ambar, I., Howe, M.R., 1979a. Observations of the Mediterraneanoutflow— I. Mixing in the Mediterranean outflow. Deep-Sea Res.26A, 535–554.
Ambar, I., Howe, M.R., 1979b. Observations of the Mediterraneanoutflow — II. The deep circulation in the vicinity of the Gulf ofCadiz. Deep-Sea Res. 26A, 555–568.
Ambar, I., Armi, L., Bower, A., Ferreira, T., 1999. Some aspects oftime variability of the Mediterranean Water off south Portugal.Deep-Sea Res. I 46, 1109–1136.
Ambar, I., Serra, N., Brogueira, M.J., Cabeçadas, G., Abrantes, F.,Freitas, P., Gonçalves, C., Gonzalez, N., 2002. Physical, chemicaland sedimentological aspects of the Mediterranean Outflow offIberia. Deep-Sea Res. 49 (19), 4163–4177.
Armi, L., Zenk, W., 1984. Large lenses of highly saline Mediterraneanwater. J. Phys. Oceanogr. 14, 1560–1576.
220 I. Ambar et al. / Journal of Marine Systems 71 (2008) 195–220
Armi, L., Hebert, D., Oakey, N., Price, J.F., Richardson, P.L., Rossby,H.T., Ruddick, B., 1988. The history and decay of a Mediterraneansalt lens. Nature 333 (6174), 649–651.
Armi, L., Hebert, D., Oakey, N., Price, J.F., Richardson, P.L., Rossby,H.T., Ruddick, B., 1989. Two years of the life of a Mediterraneansalt lens. J. Phys. Oceanogr. 19, 354–370.
Baringer, M.O., Price, J.F., 1997. Mixing and spreading of the Medi-terranean Outflow. J. Phys. Oceanogr. 27, 1654–1677.
Borenäs, K., Wahlin, A., Ambar, I., Serra, N., 2002. The Mediterra-nean outflow splitting— a comparison between theoretical modelsand CANIGO data. Deep-Sea Res. 49 (19), 4195–4205.
Bormans, M., Garrett, C., Thompson, K.R., 1986. Seasonal variabilityof the surface inflow through the Strait of Gibraltar. Oceanol. Acta9 (4), 403–414.
Bower, A., Armi, L., Ambar, I., 1995. Direct evidence of meddyformation off the southwestern coast of Portugal. Deep-Sea Res. 42(9), 1621–1630.
Bower, A., Armi, L., Ambar, I., 1997. Lagrangian observations ofmeddy formation during a Mediterranean undercurrent seedingexperiment. J. Phys. Oceanogr. 27, 2545–2575.
Bower, A., Serra, N., Ambar, I., 2002. Structure of the Mediterraneanundercurrent and Mediterranean water spreading around the south-western Iberian Peninsula. J. Geophys. Res. 107 (C10), 3161.doi:10.1029/2001JC001007.
Carton, X., Cherubin, L., Paillet, J., Morel, Y., Serpette, A., Le Cann,B., 2002. meddy coupling with a deep cyclone in the Gulf ofCadiz. J. Mar. Syst. 32, 13–42.
Daniault, N., Mazé, J.P., Arhan, M., 1994. Circulation and mixing ofMediterranean water west of the Iberian Peninsula. Deep-Sea Res.41 (11/12), 1685–1714.
Fiúza, A.F.G., Hamann, M., Ambar, I., Díaz del Rio, G., González, N.,Cabanas, J., 1998. Water masses and their circulation off WesternIberia during May 1993. Deep-Sea Res. I 45, 1127–1160.
Ferreira, T., 2004. Variabilidade espaço-temporal da camada de ÁguaMediterrânica no Golfo de Cádiz. M. Sc. Thesis, University ofLisbon, Portugal, unpublished.
Freitas, P., Abrantes, F., 2002. Suspended particulate matter in theMediterranean water at the Gulf of Cadiz and off the southwestcoast of the Iberian Peninsula. Deep-Sea Res. II 49, 4245–4261.
Garrett, C., Bormans, M., Thompson, K., 1990. Is the exchangethrough the Strait of Gibraltar maximal or submaximal? In: Pratt,L.J. (Ed.), The Physical Oceanography of Sea Straits. NATO ASISeries C, vol. 318, pp. 271–294.
Hinrichsen, H.-H., Rhein, M., Käse, R.H., Zenk, W., 1993. TheMediterranean Water tongue and its chlorofluoromethane signal inthe Iberian basin in early summer 1989. J. Geophys. Res. 98 (C5),8405–8412.
Howe, M., Tait, R., 1970. Further observations of thermohaline stra-tification in the deep ocean. Deep-Sea Res. 17, 963–972.
Iorga, M., Lozier, M.S., 1999a. Signatures of the Mediterranean out-flow from a North Atlantic climatology. 1. Salinity and densityfields. J. Geophys. Res. 104 (C11), 25985–26009.
Iorga, M., Lozier, M.S., 1999b. Signatures of the Mediterranean out-flow from a North Atlantic climatology. 2. Diagnostic velocityfields. J. Geophys. Res. 104 (C11), 26011–26029.
Käse, R.H., Zenk, W., 1996. Structure of the Mediterranean water andmeddy characteristics in the northeastern Atlantic. In: Kraus (Ed.),Warmwatersphere of the North Atlantic Ocean. Gebrüder Born-traeger, Berlin, pp. 365–395.
Käse, R.H., Beckmann, A., Hinrichsen, H.-H., 1989. Observationalevidence of salt lens formation in the Iberian Basin. J. Geophys.Res. 94 (C4), 4905–4912.
Madelain, F., 1970. Influence de la topographie du fond sur l'écoule-ment Mediterranéen entre le Détroit de Gibraltar et le Cap Saint-Vincent. Cah. Océanogr. 22, 43–61.
McCave, I.N., Hall, I.R., 2002. Turbidity of waters over the NorwegianIberian continental margin. Prog. Oceanogr. 52, 299–313.
McDowell, S.E., Rossby, H.T., 1978. Mediterranean water: an intensemesoscale eddy off the Bahamas. Science 202, 1085–1087.
Oliveira, P.B., Serra, N., Fiúza, A.F.G., Ambar, I., 2000. A study ofmeddies using simultaneous in-situ and satellite observations. In:Halpern, D. (Ed.), Satellites, Oceanography and Society. ElsevierOceanography Series, vol. 63, pp. 125–148.
Pingree, R.D., 1995. The droguing of meddy Pinball and seeding withalace floats. J. Mar. Biol. Assoc. UK 75, 235–252.
Pingree, R.D., Le Cann, B., 1993. A shallow meddy (a smeddy) fromthe secondary Mediterranean salinity maximum. J. Geophys. Res.98 (C11), 20169–20185.
Prater, M.D., Rossby, T., 1999. An alternative hypothesis for the originof the “Mediterranean” salt lens observed off the Bahamas in theFall of 1976. J. Phys. Oceanogr. 29, 2103–2109.
Prater, M.D., Sanford, T.B., 1994. A meddy off Cape St. Vincent. 1.Description. J. Phys. Oceanogr. 24, 1572–1586.
Reid, J.L., 1978. On the mid-depth circulation and salinity field in theNorth Atlantic Ocean. J. Geophys. Res. 83 (C10), 5063–5067.
Richardson, P.L., Walsh, D., Armi, L., Schroder, M., Price, J.F., 1989.Tracking three meddies with SOFAR floats. J. Phys. Oceanogr. 19,371–383.
Richardson, P.L., Bower, A., Zenk, W., 2000. A census of meddiestracked by floats. Prog. Oceanogr. 45, 209–250.
Schmitt, R.W., 1994. Double diffusion in oceanography. Annu. Rev.Fluid Mech. 26, 255–285.
Serra, N., 2004. Observations and numerical modelling of the Medi-terranean outflow. Ph. D. Thesis, University of Lisbon, Portugal,unpublished.
Serra, N., Ambar, I., 2002. Eddy generation in the Mediterraneanundercurrent. Deep-Sea Res. 49 (19), 4225–4243.
Serra, N., Sadoux, S., Ambar, I., Renouard, D., 2002. Observationsand laboratory modeling of meddy generation at Cape St. Vincent.J. Phys. Oceanogr. 32 (1), 3–25.
Serra, N., Ambar, I., Käse, R., 2005. Observations and numericalmodelling of the Mediterranean outflow splitting and eddy gene-ration. Deep-Sea Res. II 52, 383–408.
Siedler, G., 1968. The frequency distribution of water types in theoutflow region of Straits. Kiel. Meeresforschu. 24, 59–65.
Stammer, D., Hinrichsen, H.-H., Käse, R.H., 1991. Can meddies bedetected by satellite altimetry? J.Geophys. Res. 96 (C4), 7005–7014.
Tait, R., Howe, M., 1968. Some observations of thermohaline strati-fication in the deep ocean. Deep-Sea Res. 15, 275–280.
Thorpe, S.A.,White, M., 1988. An intermediate nepheloid layer. Deep-Sea Res. 35, 1655–1671.
Zenk, W., 1970. On the temperature and salinity structure of theMediterranean water in the Northeast Atlantic. Deep-Sea Res. 17,627–631.
Zenk, W., 1975. On the origin of the intermediate double-maxima in T/Sprofiles from the North Atlantic. Meteor-Forschungsergeb. A 16,35–43.
Zenk, W., Armi, L., 1990. The complex spreading pattern ofMediterranean Water off the Portuguese continental slope. Deep-Sea Res. 37, 1805–1823.