Embed Size (px)
Citation preview

1
The Impact of an Unexpected Wage Cut on
Corruption: Evidence from a “Xeroxed” Exam
Oana Borcan Mikael Lindahl Andreea Mitrut
University of Gothenburg Uppsala University, Uppsala University,
CESifo, IFAU, IZA, UCLS, University
UCLS of Gothenburg
--Preliminary and incomplete--
Abstract
This paper aims to understand how corruption responds to financial incentives. In
particular, we attempt to identify the effect of a wage loss on corruption in the education
sector. Exploiting an unexpected wage cut that affected all Romanian public sector
employees, including the public education staff, we examine its effect on students’ exam
scores. Using a difference-in-difference strategy, we find that the wage loss led the public
schools to have better exam outcomes than the private schools (which were unaffected by
the wage cut). We attribute this to an increased involvement in bribes and corrupt
activities by public school staff.
Keywords: School principals, Bribes, High-stakes tests
JEL codes: I2, H7, J3
‡ E-mail: [email protected], [email protected] and [email protected]
(corresponding author), respectively. All errors are our own. Andreea Mitrut gratefully acknowledges support
from Jan Wallanders and Tom Hedelius Fond. Mikael Lindahl is a Royal Swedish Academy of Sciences
Research Fellow supported by a grant from the Torsten and Ragnar Söderberg Foundation, and also
acknowledges financial support from the Scientific Council of Sweden and the European Research Council
[ERC starting grant 241161].
*We are grateful to Per Johansson, Ola Olsson, Sonja Opper, Amrish Patel and Olof Johansson-Stenman as
well as seminar participants at the 2012 NCDE conference for helpful discussions and suggestions. We also
thank Diana Coman for excellent help with the data.
2
1. Introduction
More than two decades of political and academic efforts to break down the
phenomenon of corruption into causes and effects have produced a solid
consensus: corruption is inimical to economic prosperity. Aside from
understanding that dishonest behavior reacts to monitoring and punishment, many
puzzles remain regarding the key causes and determinants of corruption (see
Olken and Pande, 2012 for a recent review of developments in this area). Among
these, the degree to which corruption responds to financial incentives is an
underexplored topic of particular interest to policy makers. This paper attempts to
shed light on the effects of wages on corruption in the public sector, exploring a
quasi-natural experiment generated by an unexpected 25% wage cut incurred by
the public sector employees in Romania in 2010. Understanding the ramifications
of a wage loss, especially for corruption, is particularly relevant in the context of
the recent waves of austerity measures that have swept over other EU countries.1
To our knowledge, this is the first paper that identifies a causal relationship
between depressed financial incentives in the public sector and corruption
activities.
The idea that financial compensation is a crucial factor in the decision of whether
to engage in fraudulent action was first formalized in 1974 with Becker and
Stigler’s seminal work. The key prediction from their model was that increasing
the remuneration of public servants above the market-clearing wage can reduce
bribery, and thus reduce the prevalence of corruption. Subsequently, this
hypothesis has been empirically tested, initially using macro-level data. For
example, exploring a cross-section of developing countries, Van Rijkenghem and
Weder (2001) show a negative, but rather small, association between civil service
1 Similar measures regarding cuts in public sector wages have been proposed in other EU countries later on,
such as Greece in 2011, and Spain in 2012.

3
compensation and corruption measured by the ICRG index, while Rauch and
Evans (2000) find no significant relationship between bureaucrats’ wages and
corruption, but show that salaries correlate negatively with the bureaucratic delay.
To date, few studies have used micro-level data to identify the deterrent effect that
wages have on corruption. Di Tella and Schargrodsky (2003) exploit a crackdown
on corruption in the procurement departments of Buenos Aires hospitals and
reveal that increased staff wages are effective in reducing the prices of hospital
inputs when there is an intermediate level of monitoring. Niehaus and Sukhtankar
(2010) also find empirical support for the capacity of projected gains to reduce
fraud. In this setting, however, the prospective rents are obtained from future
opportunities to collect bribes that rely strictly on keeping the job, which leads to
an inter-temporal substitution of fraud today for rent-extraction in the future. 2
While these studies are centered on the effect of an increase in remuneration on
dishonesty, it is not obvious that a negative change in wages would have a
symmetric impact on corruption, i.e., that reduced financial compensation would
necessarily spur corruption, as in the object of our study.3 Gorodnichenko and
Sabirianova Peter (2007), to our knowledge, is the only study that has analyzed
corruption in direct relation to low wages. Using micro data from Ukraine, these
authors show that the wage differential between the private and (the much lower-
paid) public sector does not translate into a difference in consumption, and they
conclude that bribery must account for the observed wage gap. In doing so, they
2 Armantier and Boly (2011) carry out a controlled field experiment on the receptiveness of exam graders to
bribe-offering. The effect of higher wages on corruption tested in their experiment is ambiguous. This paper
belongs to a fast growing experimental literature on corruption using controlled field experiments (see Olken,
2007, Bertrand et al., 2006), as well as lab experiments (see Frank and Schulze, 2000; Abbink, 2002;
Schulze and Frank, 2003; Barr et al., 2009; Barr and Serra, 2009). The latter category also yields mixed
evidence on the impact of a wage increase on corruption. 3 From the standpoint of the wage-corruption relationship, our study is akin to the theoretical underpinnings
of Becker and Stigler (1974). However, whereas the bribe in their model is exogenous, our analysis inquiries
into how wages can alter corruption intensity. In this respect, our findings relate more closely to the
theoretical framework of Shleifer and Vishny (1993) who take bribes to be endogenous and analyze how they
respond to the market structure of corruption.

4
document the role of corruption in explaining the prevalence of low-paid public
jobs, rather than the reverse. Thus, the impact of a decrease in wages on the
prevalence of corruption remains an open empirical question.
In the spirit of the shirking model proposed by Shapiro and Stiglitz (1984), lower
wages could trigger a switchover to rents from corrupt activities, as the civil
servant attempts to compensate for his lost income. At the same time, a different
mechanism, working in the opposite direction, holds the prospect of
unemployment as a deterrent for shirking or, as applied to our case, corruption
(Shapiro and Stiglitz, 1984). Thus, particularly in a depressed economic time, as
in 2010, an income loss may potentially prompt more risk-averse public
employees to refrain from corruption because they fear losing their job and their
only source of income when the market cannot accommodate them. Yet, there is
another possibility that supports this mechanism: when wages are lower, civil
servants might be more reliant on future rents from corruption, which they might
lose together with the job if they are caught, making them forego corruption today
to preserve the potential for corruption in the future (see Niehaus and Sukhtankar,
2010). Overall, these mechanisms convey an ambiguous effect of lower wages on
corruption, and identifying their impact is essentially an empirical exercise.
In this paper we show that a sufficiently large reduction in the wages of civil
servants—in this case public school principals (together with teachers, the
administration personnel, or both groups)4
—can increase the incidence of
corruption. Specifically, our study attempts to measure the effect of an exogenous
25% reduction in wages on corruption in the education sector in Romania. As part
of an austerity plan, the Romanian public sector was hit by an unexpected wage
cut announced on May 7th
2010, scheduled to take effect starting July 1st 2010. In
4 In this paper we will refer to principals’ corruption, even though this will encompass principals together
with teachers or administration personnel.

5
between the announcement of the cut and its actual implementation (June, 2010),
the annual national high school-leaving exam—the Baccalaureate—took place in
the usual manner, testing approximately 200,000 students. The prevalence of
corruption at the Baccalaureate exams was notorious and was attributed to the
high-stakes character of the exam (it accounts for up to 100% of the criteria for
university/college admission) and the poor remuneration of teachers in general.
As it happened, the 2010 exam signaled an unprecedentedly high number of
allegations of fraud and bribery by school principals connected with the
Baccalaureate. The sudden buildup of court investigations earned the 2010
national exam a special title - The Xeroxed Baccalaureate.5
Since we do not observe bribery and fraud directly, our strategy for understanding
the impact of the wage cut on corruption is to compare the change in exam
outcomes - the standardized Romanian language exam grades and school-level
average passing rates at the Baccalaureate exam - from 2009 to 2010 between
public and private schools, as the latter category was not affected by the policy
(see Figure 1).6 The arguments in favor of interpreting the resulting change in
exam scores as being due to changes in corruption are the following: 1) the timing
between the announcement of the wage cut and the exam is far too short for other
responses (for example, a change in the in-class teachers’ effort); 2) we do not
expect in-class cheating (if any) to differ between public and private students
because the same surveillance applies to all students, who are randomly mixed in
the exam rooms. This is also supported in additional analyses, where we are able
5 This title ironically given by the media refers to the fact that many students were found to have identical test
answers (including in essay type exams), which is unlikely to happen without special interventions of the
school principals, given the complexity of the subjects. Anecdotal evidence suggests that indeed batches of
identical answers had been allotted to the students by the school principals during or after the exam. We will
return to the mechanisms of corruption later in the paper. 6
Because corruption is notoriously difficult to measure, many researchers resort to some indirect
assessments, such as evaluating corruption through changes in the outcome of interest when moving into a
treatment where corruption is more likely. A similar strategy has been, for example, employed in Olken
(2007) or Bertrand et al. (2006).

6
to test for and rule out differential cheating behavior among public and private
students during the exams (see Section 5.1); and 3) we also show that despite the
wage cut, household expenditures did not decrease more for public teachers’
households, relative to the households of private teachers (see Section 5.2). These
results indeed seem to indicate the presence of non-reported compensation in the
public sector.
Our results show a positive and significant change in the exam outcomes between
public and private schools, which we attribute to an increase in incentives to
engage in corrupt activities in 2010 relative to 2009. In particular, our results for
the standardized Romanian written test, which remained fairly similar across
years and is taken by all students, regardless of their track, indicate a wage cut-
driven effect equivalent to about one-fourth SD increase in scores on the
Romanian exam relative to the mean in 2010 (a 4.4% increase). Additionally, the
overall pass rates at the school level have increased by up to 12 percentage points
in public relative to the private schools following the 2010 wage cut. Furthermore,
we employ a falsification exercise and show that there was no change in exam
outcomes between public and private schools between 2008 and 2009, i.e., before
the public sector wage cut took place. This lends further credibility to our results.
While this study adds to the developing pool of knowledge about corruption in the
education sector (see, for example, Duflo et al., 2010; Reinikka and Svensson,
2004, 2005; Ferraz et al., 2011; Muralidharan and Sundaraman, 2011; Glewwe et
al., 2010), it also complements the findings in a related literature that investigates
incentives for teachers cheating. A leading example in this literature, Jacob and
Levitt (2003) ingeniously show teacher cheating behavior in Chicago public
schools and argue that this fraud is a by-product of the high-powered incentive
schemes implemented in that system. The Romanian Baccalaureate exam is a
high-stakes exam for students because it determines admission to college

7
education and further professional training, or secures qualified-labor
participation for students from the technological and vocational tracks. However,
we show that having high-stakes exams is enough to increase (and generate)
corruption among the educational staff (for more explanations on the corruption
environment in Romanian education system see Section 2.3). In this respect, our
paper also relates to the debate about high-stakes evaluation systems in education
sparked by the legislation No child left behind, which was implemented in the US
in 2001. Nichols and Berliner (2007) provide a critical discussion about the
distorting effect this policy has on the quality of education.7
The paper is structured as follows: Section 2 presents an overview of the
Romanian context, explaining the wage cut policy, the educational system and the
implications for corruption. Section 3 provides the details of our data and our
empirical strategy. Section 4 outlines our main empirical findings. Section 5
provides additional tests as to whether changes in exam scores following the wage
cut can be interpreted as changes in corruption, while our conclusions are
presented in Section 6.
2. Background
2.1 The 2010 Unexpected Public Sector Wage Cut
The threat of recession posed by the unfolding international financial crisis in the
fall of 2008 was largely overlooked by Romanian politicians, who confidently
conveyed a disjunction between Romania and the world economy. Despite the
IMF’s prompting for moderation, the presidential electoral campaign in
7 Their counterarguments to this educational model are based in a simple reflection known as Campbell’s
Law, which stipulates that decision-making that is heavily reliant on quantifiable social outcomes generates
scope for manipulation of those outcomes; therefore, it corrupts the underlying social processes (Campbell,
1976).

8
December, 2009 called for a sizeable 1.2 billion RON (1RON≈0.34USD)
expansion in government spending. After winning the elections, the incumbent
president remained optimistic: "Romania has been affected by the crisis but it is
over now; we expect significant growth in the first part of 2010".8 This was
reasserted by the Prime-Minister in March, 2010, while proposing an anti-crisis
plan targeting the business environment and the problem of tax evasion:
“Romania is on the right track of exiting the economic crisis (...). In 2010 we will
exit the economic recession”.9
In this context, the austerity measure announced by the President on May 7th
,
2010 involving a 25% cut in wages for all public sector employees, the abrogation
of some of their financial and in-kind incentives, and a 15% reduction in pensions
and unemployment benefits was completely unexpected, generating social
instability and political divergence. The austerity measure was introduced in an
attempt to reach the 6.8% budget deficit target agreed upon with the IMF (for a
detailed discussion about the unexpected announcement and the political situation
in Romania in 2010, see also Bejenariu and Mitrut, 2011). Soon after, the Finance
Minister’s declaration, which was intended to assume responsibility, resulted in
the unraveling of the government’s previous, albeit deluded, optimism concerning
the country’s economic status: “As a Finance Minister I am telling you that we
could have lied six more months, (...) we could have arranged an accord with the
IMF to give us six months and could have waited six months to see what happens.
The fact that what we are doing entails a political risk that nobody imagined a
month and a half ago shows a complete responsibility of this Government towards
the Romanian citizens”.10
It was not long before he was dismissed.
8 http://www.evz.ro/detalii/stiri/basescu-romania-nu-va-fi-afectata-de-criza-837030.html (in Romanian). 9 http://www.cdep.ro/pls/steno/steno.stenograma?ids=6780&idl=1 (in Romanian). 10 http://www.hotnews.ro/stiri-politic-7350294-sebastian-vladescu-era-foarte-usor-mintim-continuare-mai-
imprumutam-vreo-sase-luni.htm (in Romanian)
9
Thus, following the May 7th
announcement, on June 30th
, the President
promulgated the austerity law, which came in effect July 1st, with an initial
duration of 6 months, i.e., until December 31st, 2010.
11 To date, the public sector
wages have not been restored to their initial level.
2.2 The Structure of education and the high school exam in Romania
The standard design of the educational system in Romania is based on a division
of three cycles, each containing four years: primary school (grades 1 to 4), middle
school or gymnasium (grades 5 to 8), followed by a national exam which insures
the admission into high schools (lyceums) on a: i) theoretical (or general) track -
including the humanities and sciences profiles, ii) technological track - providing
a technical profile, services profile and natural resources and environmental
protection profile, iii) vocational track - including the arts, military, theology,
sports and teacher training profiles (see NASFA Romanian Educational System,
2011 and Pop-Eleches and Urquiola, 2011 for comprehensive discussions about
the Romanian education system). Upon completion of high school, students take
the school-leaving exam, which is known as the Baccalaureate exam, following
the French model of national evaluation. This nationwide standardized test is a
mandatory condition to obtain the certificate of graduation from secondary
school. Importantly, passing the Baccalaureate exam is a strict requirement for
enrolling in tertiary education or for pursuing further professional training. At the
very least, the degree obtained by passing this exam offers a basic qualification
with the potential to earn the student a better placement in the labor market.
11 The final provisions of the austerity law were as follows: (1) the gross quantum of wages, allowances and
indemnities, including financial benefits and other income rights of all public sector employees were
diminished by 25%; (2) unemployment benefits were diminished by 15%; (3) the possibility of registration
for early retirement or partial early retirement was suspended; (4) maternity leave benefits, in pay or
forthcoming, were diminished by 15%.

10
Furthermore, the student’s average grade on this exam plays a sizeable role in
determining their chances of being admitted to a good university (up to 100%),
and above all, in being granted exemption from tuition fees (each public
university offers a limited number of tuition-free seats that are typically based on
this admission score). Thus, passing this national examination is crucially
important, and it is preferable to do so with high grades.
The Baccalaureate consists of several standardized tests taken in oral and written
form. The two oral exams assess the student’s level of comprehension and spoken
interaction in Romanian and in a foreign language. A second part consists of a
series of written tests on different subjects, which are a combination of simple or
multiple choice questions and tasks that require the student to write in elaborate
answers and essays. First in this series is the Romanian language and literature
exam, followed on specific days by track-specific and elective subject tests.12
These are graded on a scale from 1 to 10, and to pass the exam, a student should
obtain a minimum score of 5 on each test and a minimum overall average score of
6.13
The tests are held in examination centers, where more high schools from the
same locality are (randomly) concentrated. The organization of the exam in every
center is the responsibility of the exam committee, which consists of a chairman
(typically a university professor), one or two deputy-chairmen (typically public
high school principals), a person specialized in IT management (for technical
support), and a number of public school teachers whose duty is to invigilate the
exam. These teachers are unrelated to the subject under evaluation or to the
students, and are randomly assigned in pairs of two in each classroom by the
exam committee. The format of the Baccalaureate has been standard for the last
12 The students belonging to the different ethnic minorities are required to take two additional tests, the oral
and the written exam in their maternal language, if it was included in their high school curriculum. 13 A brief overview of the exam format before 2010 is found in English at
http://www.romanianeducation.com/romanian-baccalaureate-exam. Information about the exam structure
beginning with 2010 can be found in English at http://en.wikipedia.org/wiki/Romanian_Baccalaureate

11
ten years with the two oral exams and four written tests, which take place over the
course of two consecutive weeks toward the end of June every year.14
However, a
few changes to the exam schedule and format were applied in 2010. First, the oral
exams were pushed ahead of the written ones, to February, and they were
rendered irrelevant to the calculation of the overall exam grade.15
Additionally, a
new examination of digital competencies was added to the oral section of the
exam, and one track-specific written test was completely eliminated. Before 2009,
in preparation for the exam, the students had access to 100 written exam variants
with full answers for each discipline, which would have been published online by
the Romanian Ministry of Education three months in advance. For each test, one
of those variants would be randomly drawn on the morning of the exam. In 2009,
however, it was decided that each question of the test would be drawn from
different variants, and in 2010, the variants were replaced by test models, which
would resemble very closely, but would not perfectly match the questions in the
exam.
The tests within each discipline and difficulty category are standardized for all
students ascribed to each education profile and track. However, the one test that is
unique to all students regardless of profile and track is the written Romanian
language exam. As the conditions for this test have remained fairly similar for all
years, it makes it an ideal basis for comparison of student outcomes on the
exam.16
Additionally, we argue that the high degree of standardization of the
overall exam format makes the final exam grade and the passing rate outcomes
amenable to comparison for our period of interest.
14 This summer session is followed by the re-take session in late August, for those students who failed the
summer exam. 15 Additionally, the assessment became qualitative, categorizing the students into experienced, advanced or
average users. 16
We also claim that for this exam it is more difficult to cheat in class, since students need to develop ideas
and write essay-like questions as part of the examination.

12
2.3. The corruption environment
The endemic post-communist corruption in the public sector has become
proverbial among Romanians: a 2003 World Bank Report about corruption in
Romania reveals that more than 67% of the respondents alleged that all or almost
all public officials in Romania are corrupt, while more than 50% of the
respondents believed that bribery is part of the everyday life in Romania. This is
particularly true in the education and health systems, where up to 66% of the
respondents confirmed that they were paying the so-called atentie (i.e., unofficial
payments or bribes).17
Among the most commonly invoked causes for
dysfunctions in the educational system are: i) the poor remuneration of teachers in
the public sector18
and ii) the high-stakes of this exam, particularly starting with
the year 2002 when increasing numbers of universities included the Baccalaureate
exam score as part of the admission process (from 20% to 100%).19
There is an
overall consensus among the Romanian public that the passing rates (anchored at
approximately 80%, which is just slightly below the EU mean of approximately
82%) and the grades they rest on are artificially inflated and that what they reflect
is not as much performance as it is corruption. The relatively high national
17 Paying the so-called atentie (unofficial payments or gifts) is very common. Up to 66% of the respondents
have paid an atentie during a hospital stay, while 27% of the respondents have given atentii to vocational
school (teachers), 25% to the primary school (teachers), 21% in the high-school system and 17% in the
University (see the 2003 World Bank Diagnostic Survey of Corruption in Romania). 18 While there are no official statistics, it is the case that public teachers earn, on average, slightly less than
their private counterparts. Using the 2009 Romanian Household Budget Survey we find that households
where at least one member works in the education sector in the public sector have, on average, about 20%
less income than their private counterpart households. It is also important to mention that, in Romania,
similar to other transition countries, wages of the educational staff in the public sector are highly centralized
and there is little variation across teachers. 19 This practice has become increasingly common because the number of places in private universities, which
charge tuition fees, has risen steadily from 2002 until 2009. According to the “Report on the state of
Education” published by the Ministry of Education in 2010, the total number of students in private
universities had increased by a factor of three in 2009 relative to 2002, whereas the participation of students
in public universities had been roughly constant throughout this period
(http://www.edu.ro/index.php/articles/15128, in Romanian).

13
average passing rates that exceeded other European countries show large
discrepancies with other international tests (for example, PISA), where Romanian
students earn (among) the lowest scores on all assessments.20
This inconsistency
is shown in Figure 2 where, for a sample of European countries, we plot the
difference in ranking between the upper secondary graduation rate and the
country rank for PISA tests. Among the listed countries, Romania stands out, with
the greatest (negative) ranking difference. Moreover, the introduction of video
surveillance in 2011 coincided with a drop in average pass rates to a staggering
44%, further confirming that the exam had for years been corrupt.21
The inflation of the Baccalaureate grades may take many forms from a)
innocuous copy aids that students use during the exam, or invigilators turning a
blind eye to cheating in the exam room, to b) serious fraud involving large
amounts of money in bribes to school principals, exam committee members and
evaluators for higher marks or even the outright falsification of papers. In this
paper, we cannot directly distinguish among these activities. Importantly,
however, we are able to test for and rule out differential cheating behavior among
public and private students during the exams (i.e., point a above) in 2010 vs. 2009
to have an impact on our main results (see Section 5.1). This supports the
interpretation that exam scores are inflated because of bribes (point b above),
which is in accordance with the allegations of fraud and bribery by school
principals in the 2010 exam.22
20 See, for example, the 2009 PISA Executive Report: http://www.oecd.org/dataoecd/34/60/46619703.pdf
and the 2009 OECD report Education at a Glance http://www.oecd.org/dataoecd/41/25/43636332.pdf. 21
See http://www.economist.com/blogs/easternapproaches/2011/07/corruption-romania (In English) 22 These and other instances of corruption are discussed at length in Hallak and Poisson (2007), who provide
a comprehensive taxonomy of corruption in education. Note that the forms of fraud tackled in this paper are
by no means restricted to the Romanian educational system. Many countries struggle with the informal
payments and illegal actions connected with the assignment of grades in exams at various levels in the
education cycle. Some examples regarding the secondary school in particular, come from Russia, Ukraine
and Uzbekistan (Silova and Bray, 2006), where the sale of grades is common, and from India (Uttar
Pradesh), where the high school exam annual pass rates dropped from 61% to 17% in 1992, when police

14
The 2010 exam earned a special reputation and the suggestive title “The Xeroxed
Baccalaureate” after a large number of cases (at least 150, compared to
essentially none previously) of corrupt school principals caused a media storm.23
Without precedent, school principals were investigated for having taken large
amounts of money from students who had no chance of passing or had simply
wanted their grades raised.24
In particular, the principals would arrange with
committee members for the selected papers corresponding to those students to be
graded higher, partly changed or entirely replaced (Xeroxed) with correct
answers. Some of these cases went to court and were finalized in 2011 and 2012
with prison sentences.25
This evidence suggests that the exam in 2010 was marked
by an unusually high level of corrupt activity, which we attribute to the additional
incentives for fraud borne by the wage cut.26
The private schools, however, were not afflicted by any financial or other shock.
Apart from this, during the Baccalaureate exam, the private high school students
are randomly mixed with public students in exam rooms, are subject to the same
examination rules, at the same time, and are under the same surveillance by public
teachers. For these reasons, we are able to infer the change in corruption from the
observed difference between public and private school performance in 2010
forces were stationed at the examinations centers (Kingdon and Muzammil, 2009). For more illustrations
regarding the fraud with admissions and grades, see Lewis and Pettersson (2009: 45). 23 The Romanian National Anticorruption Directorate (DNA) ordered, in connection with the 2010
Baccalaureate exam, the prosecution of an unprecedented 150 defendants, most of them school principals.
http://www.pna.ro/faces/index.xhtml. 24 http://www.ziare.com/stiri/arestare/directori-de-liceu-arestati-pentru-fraude-la-bacalaureat-1029179;
http://www.adevarul.ro/scoala_educatie/liceu/150-000_de_lei-frauda
record_la_Bacalaureat_0_292771226.html http://www.ziare.com/scoala/bacalaureat/zeci-de-profesori-din-
botosani-sunt-cercetati-pentru-frauda-la-bac-1031591 (in Romanian) 25 Retrieved from www.desteptarea.ro/zeci-de-condamnari-in-dosarul-spaga-la-bac.html (in Romanian) 26 To our knowledge, no changes/policies took place in 2010 that would lead to a more efficient corruption
monitoring of the 2010 exam as compared to the previous years. Additionally, one could think that the fear of
losing the job would make the private principals less corrupt as compared to the previous year, while the
level of corruption among the public school teachers would stay constant. However, Figure 3 shows that the
average grades are very similar in 2010 and 2009 for the private school students, while we notice an increase
in grades for their public school peers.

15
relative to 2009. Section 3.2 provides further information concerning our
identification strategy.
2.3.1. Possible mechanisms of corruption
In what follows we hold the public school principals (who are also affected by the
wage cut) to be the central players in the increase in corruption in 2010, as
illustrated in the examples above. This is aligned with their great degree of
connection with examination committee members, school inspectors and,
teachers, who are all affected by the 25% wage decrease. Every year, the final
year students collect the so-called protocol contributions, which are informal
funds for “organizing” the Baccalaureate exam.27
The funds, which are collected
shortly before the end of the school year (usually the end of May), reach each
school principal, whose strategy it is to contact the examination committee and
make arrangements for the students who contributed. Additionally, some students
may give extra protocol to the principals for extra favors during or after the exam.
According to the Romanian Baccalaureate Exam Methodology (2009, 2010), the
composition of the exam committees is made public 48 hours before the exam,
whereas the chairman of the examination committee and the IT people are known
months in advance.
As stated before, in 2010, the wage cut news arrived on May 7th
, three weeks
before the end of the school year. For the 12th
graders, these final weeks are
mainly dedicated to the graduation ceremonies, and different aspects regarding
27
Although raising these funds is completely illegal, it has become an institutionalized practice over the
years.
16
the organization of the Baccalaureate exam are typically discussed.28
This close
timing between the unexpected news and the exam reduces the possibility that the
wage cut would have changed the test outcomes to a minimum via: i) a change in
the effort of the students—because they do not have enough time to substantially
increase their effort (as a possible reaction to the cut), since they are tested on all
of the material studied over the last 4 years;29
ii) a change in the effort of the
teachers—because the courses are already finished.
One question remains about the fraud opportunities of the private schools. Given
that private students take the exam together with public students, cheating and
consulting among students in the exam room with the permission of the
invigilators would level the field for both types of students. However, one might
still argue that what we capture would not be the effect of corruption but of
cheating (due to, for example, lower effort from the invigilators). While this
channel is theoretically possible, it does not seem to be supported by the data (see
Section 5.1). Thus, we believe that any changes in the 2009 to 2010 exam
outcomes between the public and the private schools are largely attributable to the
supplementary intervention that public students receive in 2010 via the public
school principals, who have more incentive to engage in corrupt activity. These
important actors could offer their support exclusively to their own clientele
28 For example, as stated above, during these weeks the teachers collect from the students the protocol funds.
Thus, in our setting, these funds were most likely collected after the announcement of the wage cut in the
beginning of May. 29 One reason for the student effort to evolve differently between the public and private school students is if
the parents of these students are affected differently by the wage cut. This would be the case of public school
students are more likely to have parents employed in the public sector. However, even if this is the case, it is
not obvious in what direction this would affect our estimates. On the one hand, parents affected by the wage
cut might be more willing to pay bribes in order to avoid future university fees for their children (which are
lower for students with higher exam scores). On the other hand, lower incomes means there are less available
resources to be spent on bribes. Because we are lacking data on the occupations of the parents, we are not
able to investigate this issue empirically.
In addition to the issue about student effort, if, for example, students fear that the evaluators will be more
demanding in 2010 as a behavioral reaction to the wage cut because both public and private students are
graded by public teachers, their level of awareness should be the same. Thus, their incentives to invest in
marginally more preparation, either individual or through potential private tutoring, should not differ.

17
through: a) sending them the correct solutions during the exam; b) bribing the
evaluators to score the selected or marked papers higher; c) cooperating with the
exam committee to separate the marked papers and improve them or completely
replace them with correct ones before sending them to the evaluation center. In
what follows, we cannot differentiate among these anecdotal possibilities.
Overall, our prior is that any differences in the evolution of exam grades between
public and private schools are likely to arise through an increase in corruption in
2010 relative to 2009 in public schools, whereas corruption remains constant in
private schools.30
3. Data and methodology
3.1. Working sample
In our empirical exercise we use two main sources of data. First, we use
administrative data for 2010 and 2009 (our main comparison years) and 2008 (our
placebo year), essentially covering the universe of students enrolled in the final
(standardized) exam at the end of high-school, with individual information about
the following: their school, their personal specialization track (theoretical/general,
technological or vocational), and their scores on the exams. For each student, we
know whether they have passed the exam, what final grade they earned, and what
scores they received on all written and oral tests. From these scores we will
construct our main outcomes of interest. Additionally, we also know whether the
30 At the same time, it may also be possible that corruption decreases in both public schools and in private
school, but the reduction in fraud is smaller for the public than for private schools, being anchored by
amplified financial incentives, which are characteristic of the public sector. Despite the difficulty in
disentangling these two channels, they both support our hypothesized causal relationship between the wage
cut and the intensification of corruption.

18
student was present at the exam, and whether the student followed normal, low
frequency or evening courses.31
Our second source of data is the 2010 Study Performance in High School (SPHS)
data, which is collected by Statistics Romania twice a year: at the beginning and
at the end of the academic year. The SPHS records information on a broad set of
high school characteristics for essentially all high schools in the country.32
Specifically, the SPHS data include the following: the high school name and a
unique identification code; the address of the school (locality and county); the
type of school (whether private or public); and detailed information about the
number of students by gender and ethnicity, the number of teachers and school
principals by gender and type of employment contract, and other information. We
can thus match these data with the administrative students’ records at the final
exam by the school’s unique identification code to construct our working sample.
A key variable for our empirical strategy is whether the student comes from a
private or a public school. Overall, among the 1,198 Romanian high schools, only
approximately 3.35% are private. In what follows we only consider counties that
have both private and public schools (19 out of a total of 42 counties). Thus, for
the main analysis we are left with a balanced panel of 825 schools for each
academic year; among them 48 (or approximately 6%) are private schools. 33
Summary statistics for our main variables of interest, separately for 2009 and
2010 (our comparison years) and for 2008 (our placebo year) are found in Table
1. For our main working sample, the overall distribution of schools is as follows:
26% (or 440) are theoretical or general schools, 7.8% (or 130) are vocational
31 With our data, we only observe students that have been registered for the Baccalaureate. However, we can
check for the year 2010 using our second set of data and we observe no significant differences between the
number of children in grade 12 and those enrolled for the final exam. 32 In particular, each school is required to send a special form before October 1st to the Regional Statistics
Department (or to the Directorate of Statistics Bucharest). 33 Our results when using the whole sample (available upon request) are overall similar to those in the main
analysis but less precisely estimated.

19
schools, and the rest of 66.2% (or 255) are technological or mixed schools (i.e.,
technological with some theoretical classes). Table 1 further shows descriptive
statistics for exam scores and pass rates at the school level, where we have
weighted each school by the number of students taking the exam. Table 1 shows
an increase of the written Romanian test in 2010 relative to the previous years,
while there is no significant difference between 2009 and 2008. This test is
directly comparable across years as its format has remain similar in 2010 relative
to earlier years and all students, regardless of their profile, track or ethnicity, need
to pass this standardized exam. This makes it an ideal basis for comparison of
student outcomes across years. Thus, in what follows, the school-level average
grade for the written Romanian exam is our main outcome of interest. Our second
outcome of interest is the passing rate (school-level average). Interestingly, while
the written Romanian exam shows a significant increase in 2010, the overall
passing rate is dropping from a fairly high and stable 81% average (80% in 2008
and 82% in 2009, respectively), to 72% in 2010. The main explanation for this
drop is the overall change in the Baccalaureate exam in 2010 (see Section 2). We
will provide further discussions and explanations in our results section below.
Finally, it is important to note that private and public schools differ substantially
in the levels of our key outcomes. Throughout the entire period, private schools
consistently exhibit average passing rates and average Romanian grades below
those of public schools. This indicates an overall lower performance of private
schools relative to public schools, which is related to the selection of lower
achieving students into private high schools in the 9th
grade, a common
occurrence in Romania.34
34 This is true on average, as a small number of private high schools select and train top students. For a
description of the selection of Romanian students into the 9th grade see also Pop-Eleches and Urquiola
(2011).

20
3.2. Identification strategy
We attempt to understand whether an income loss would lead to changes in
corruption behavior, as manifested through a change in exam outcomes.
Specifically, the policy we evaluate is the May 7th
, 2010 unexpected wage cut for
all public sector employees, affecting more than 90% of the Romanian education
staff. The intuition is as follows. Before the 2010 exam, we assume exam
outcomes to be inflated, for both public and private schools.35
We have argued in
Section 2 that a change in financial incentives among the public staff in the form
of substantial wage loss would create additional incentives for fraud which, in
turn, should materialize as an increase in the prevalence of corruption for the
public school staff.36
However because private schools did not incur any
(financial) shocks in 2009 or 2010, it is reasonable to further assume that the
incentives and level of corruption intensity for these schools should stay constant.
Additionally, because private and public students are alphabetically mixed in
exams rooms and subject to the same examinations, the private school students
constitute a natural control group.
Thus, our main empirical strategy to assess the impact of a change in corruption
incentives caused by an unexpected wage cut is a simple difference-in-difference
(DD) specification. In particular, we will compare school-level exam outcomes
for the public and private schools in 2010 and 2009. If the wage cut has caused an
increase in corrupt behavior of the school principals in the public schools, we
expect to see an increase in exam scores in public school, relative to private
schools.
35 A natural test of the validity of this assumption is actually the Baccalaureate exam in 2011. Following
different anti-cheating initiatives and threats (for example, installing video cameras in schools during the
exam, threatening the staff with dismissal), over half of the students taking the exam failed. This policy
would be the subject of another paper. 36 In this paper we cannot disentangle the mechanisms through which financial incentives may impact corrupt
behavior: it may be because a higher number of school principals will be willing to cheat and/or it may be
because the “protocol” gifts/bribes are higher.

21
Our richest specification is the following equation:
where s indexes a school in county c at year t. is one of our outcomes of
interest: 1) the school-level average grade for the standardized written Romanian
language exam and 2) the school-level share of students passing the Baccalaureate
exam; is an indicator that equals 1 if school s is a public school and 0 if it
is a private school; is an indicator that equals 1 if it is for the 2010 final
exam and 0 if it is for the 2009 final exam. includes two indicators for the
track of the school: theoretical and technological (the base is vocational) and an
indicator for whether the school is located in a decentralized county.37
includes
19 county dummies. Our key coefficient is , the DD-estimand, which measures
the change in outcomes in 2010, after the abrupt wage cut, relative to 2009, for
public relative to private schools. We weight all of the regressions with the
number of (per school) students taking the exam.38
Further, in all of the
regressions, we cluster the standard errors at the school level.39
37 We don’t include other school related characteristics such as ethical or gender composition since we only
have this information for the year 2010. We will, however, perform some tests using this information in
Section 4.3. 38 The estimates are very similar if we estimate un-weighted regressions. 39 The difficulty in estimating correct standard errors in DD models where a policy changes only for a small
number of groups is discussed in Conley & Taber (2011). Their argument is that unless the number of treated
groups is large, standard methods for inference are inappropriate. With geographical clusters as units of
treatment, their critique is not relevant for this study, as we have treated and control units represented in all
the 21 counties. Of course, in principle, one can also think of their critique as being relevant for non-
geographical dimensions (such as all public schools being one unit of treatment and all private schools being
one unit of control). However, we think it is very unlikely that there are important specific shocks (unrelated
to the 25% wage cut) that affects public schools but not private schools. This assertion get additional support
from the facts that a) we get similar sized standard errors whether or not we cluster the standard errors at the
school, the locality or at the county level, something which can be reconciled with the Conley & Taber
argument being valid here only in the unlikely case of shocks hitting public and private schools differently
between but not within counties, and b) we do not find that exam scores evolve differently in public and
private school prior to the wage cut, hence supporting the claim that observed differences in outcomes
between public and private schools are not due to group-specific shocks. For these reasons, we argue that our
standard errors reported in this paper are correctly estimated.

22
These results, for all schools and also separately, by school tracks are presented in
Section 4.1. In Section 4.2, we perform a falsification exercise comparing test
scores in 2009 and 2008. Finally, in Section 4.3, we use the 2010 SPHS data in an
attempt to understand whether incentives for corruption are changing differently
in the following: i) schools with a majority of boys vs. schools with a majority of
girls; ii) schools that are ethnically homogenous vs. ethnically heterogeneous
schools; iii) schools with a high share of teachers with a temporary contract vs.
schools with teachers with a permanent contract; iv) schools in counties where the
education system was decentralized in 2005 vs. schools in non-decentralized
counties.
4. Results
4.1. Baseline estimation
4.1.1. The average grades in the Romanian written exam
In this section, we present the basic findings from the estimation of equation (1).
Table 2 displays the DD estimation results from our chosen baseline specification
featuring the average grade on the written Romanian exam as our main outcome
of interest. We report separately on the estimates for the full sample of schools
(Panel A), for theoretical schools (Panel B) and for non-theoretical schools, which
include the technological, vocational and mixed schools (Panel C). Pooling these
non-theoretical schools is necessary because there are too few vocational/mixed
schools to enable a precise estimation. Column (1) presents the unconditional DD
estimates in all panels, while columns (2), (3) and (4) add control variables and
county fixed effects, with slight variations in each panel, contingent on the sample
specificity.

23
In Panel A, we note that already from specification (1) the unconditional DD
estimate of the wage cut is positive and statistically significant at the 1% level.
When we add additional explanatory variables, the coefficient drops in
magnitude, but the result is robust to controlling for school specialization in
column (2) to the inclusion of county fixed effects in specification (3) and of the
decentralization status of the school in specification (4). We, therefore, infer that
the 25% wage cut caused an expansion in the average grades in the public schools
relative to the private schools. The effect size is equivalent to about one-fourth SD
increase in scores on the Romanian exam relative to the mean in 2010 (a 4.4%
increase).40
The estimates in Panels B and C lend further support to our hypothesis. In Panel
B, we look at theoretical high schools, which are the first choice for skilled
students in the admission to secondary education, and in Panel C we look at non-
theoretical schools. The magnitudes of the DD estimates are very similar for both
tracks, although the DD estimate remains statistically significant only for non-
theoretical schools.
4.1.2. The average passing rates
While passing the Romanian written exam is a necessary condition for qualifying
for an overall exam pass, it represents only one third of the total grade. Hence, the
outcome that holds the highest stake in future studies or employment is the overall
exam pass. This ought to give rise to further incentives to enhance the outcome,
thereby increasing the demand for fraudulent grades. Therefore, finding a
40
If we replace by fixed effects for each school, the standard error for typically
becomes slightly smaller.

24
significant impact of the wage cut on the average pass rates would lend further
credence to our hypothesis.
Table 3 outlines the baseline results for the regressions with the high school
average pass rate as the dependent variable. The results are structured in a similar
manner as previously described, with the full sample estimates placed in Panel A,
the theoretical high schools sample placed in Panel B, and the non-theoretical
schools sample placed in Panel C. Here, we notice an overall negative trend in the
average pass rates from 2009 to 2010, which is mainly due to changes in the
conditions for passing rates; we also notice the expected positive difference
between public and private schools. In the first column, we see that the DD
estimate of the impact of the wage cut is significant at the 5% level when no
controls are included. When controls are added, the magnitude of the effect
decreases slightly, but the coefficient remains significant at conventional
significance levels. In a similar fashion to the analysis of written exam grades, the
theoretical and non-theoretical high schools have a similar-sized contribution to
the wage cut effect, even though the effects for theoretical schools are imprecisely
estimated. It is noteworthy that, on average, the wage cut causes an additional 9.5
to 12 % of students to pass the exam, indicating that, for example, in an average
public high school with 300 12th
-graders, approximately 30 of these students
would find support with their principal in exchange for bribes, and in this illicit
manner, would pass an exam that they would otherwise have failed. In SD units,
the effects for the pass rate are slightly higher than for the exam scores, i.e.,
approximately one-third SD from the 25% wage cut, relative to the average pass
rate in 2010.
Of potential concern in Tables 2 and 3 is the relatively small sample of private
schools. We address this issue by considering only Bucharest and Suceava
counties for which the share of private schools is about 10%, and the results are

25
similar, both in terms of magnitude as well as significance (results available upon
request). 41
Another potential concern surrounds the fact that there are no private
schools in rural areas, which raises the question of whether the effects are driven
by public rural schools that could have a distinctly corrupt behavior. To rule out
this possibility, we have removed rural schools from the sample, and the results
were not sensitive to their exclusion (these results are also available upon
request).
4.2. Falsification tests
Identifying a causal effect of the wage cut on corruption through the DD estimate
hinges crucially on the parallel trend assumption. If exam scores would have
increased more in public schools than in private schools, even in the absence of
the wage cut, our DD estimates would be too high. To insure that this assumption
holds in our case, we perform a falsification exercise, whereby we assume that the
wage cut took place in 2009. Hence, we effectively compare the change in high
school outcomes in 2009, before the abrupt wage cut, relative to 2008, for public
schools relative to private schools. The estimation results for an average grade in
the Romanian written exam are displayed in Table 4, and those for average
passing rates are outlined in Table 5.42
From these Tables we notice that the false DD estimates are insignificant in all
panels and in all specifications. This lends the most support to our prediction that
the change in grades in public schools relative to private schools in 2010 relative
to 2009 is a circumstantial event, one not driven by different trends in the
41 Note that the share of private schools in total schools, per county, varies from a minimum of 0.02 to a
maximum of 0.12. We have tried different alternatives starting with the median (0.06) up to the highest
deciles and our results are robust to these specifications. 42 The number of schools used in the falsification tests is somewhat smaller compared to the baseline
estimations, because outcomes are not available for all schools in 2008.

26
performance of the two types of schools, and it is exclusively related to the wage
cut through the increased incidence of corruption.
4.3. Heterogeneous effects
In this section, we explore whether corruption responds to the wage cut in distinct
ways across high schools with different characteristics. In particular, we look at
DD estimates of the wage cut effect in schools with different proportions of
female students (Panel A of Table 7), different ethnic compositions (Panel B),
varying shares of teachers paid by the hour (Panel C) and, in terms of educational
organization, decentralized versus non-decentralized counties (Panel D). The
results are divided in the usual manner, by full sample and separate high school
specializations.
The most interesting findings are the following:
a) The DD estimates are significant only for high schools with a minority
population of female students, suggesting that male dominated schools are more
prone to appeal to corruption especially when the financial incentives are
accentuated. While this does not exclude milder forms of fraud, such as increased
male to female student cheating in the exam rooms, this finding is also consistent
with an outward shift in demand for illegal grades meeting the increased supply
by didactic staff, where male students are dominant.
b) The impact of the wage cut is significant in ethnically mixed high schools
(defined as having the share of Romanians less than 1), which is true both for the
average pass and for the Romanian written exam grade.

27
c) Schools with a higher prevalence of teachers working part time (i.e., the share
of teachers paid by the hour is larger than the mean=11%) are more responsive to
monetary incentives. This indicates that less organized schools or teachers who
have loose ties to the teacher labor market (by being hired on a temporary
contract), are more easily influenced by principals to be involved in corruptive
behavior.
d) The DD estimates are insignificant for decentralized counties and statistically
significantly positive for non-decentralized counties. Although estimates are not
statistically distinguishable, it is in line with studies finding that fiscal
decentralization in government expenditure is associated with lower corruption
(Fisman and Gatti, 2002).
5. Can we really interpret the change in exam scores as being caused by
increased corruption?
We have, so far, convincingly showed evidence indicating that the unexpected
25% public sector wage cut generated an increase in corruption, most likely
through public school principals reacting to the cut by taking more bribes to
influence students’ exam scores. As previously mentioned, the time frame from
the announcement of the wage cut to the exam period is too short for other
changes (such as pupil and teacher effort) to change. However, given the non-
experimental nature of our data, in this section we further investigate additional
issues related to our interpretation that increasing exams scores, as a response to
the wage cut, are actually caused by higher corruption and bribes. Thus, we first
look at the behavior of students and evaluators during the exams (section 5.1) and
then we compare the consumption behavior of households with public and private
sector educators, respectively (section 5.2).

28
5.1 Confounders: corruption vs. cheating
One potential confounding mechanism in disentangling (teachers) corruption from
(students) cheating is if, for example, the invigilators, as a result of the wage cut,
decreased their effort, resulting in more students cheating during the exam in
2010 when compared to 2009. However, since students from public and private
schools take the exam at the same time, in the same building, randomly mixed in
class (in alphabetic order), then we expect them to be affected, on average, in a
similar manner. Yet, students from private and public schools might differ in
some unobservable characteristics, such as cheating norms, and thus, if the
invigilators decrease their effort, it may have more effect, on average, on the
public students, if they are more predisposed to cheating.
To shed light on this issue, we employ our main strategy on a measure of the
share of students caught cheating (in class) and expelled from the exam, from the
total number of students taking the exam (at the school level). The interaction
term between the public and the year indicators is never significant in Table 6 in
Panel A for all schools and in Panel C for the technological, vocational and mixed
schools, which seems to support that, indeed, what we measure is a change in
corruption and not a change in in-class cheating.43
However, for the theoretical
schools, we observe a positive change in the number of students expelled in the
total number of students, per school.
In the same line, another potential confounder concerns the evaluators, who could
arguably have also decreased their assessment effort in 2010 in response to the
wage cut. One could reason that if there were proportionally more students on the
verge of passing in public schools relative to private schools, a generally less
43 We find very similar results when we compare the same outcome for 2009 and 2008.

29
stringent assessment could favor the public students, driving them to the observed
average difference in outcomes. We address this concern by showing the
distribution of individual grades in the Romanian written exam in 2009 and 2010
separately for public and private students in Figure 3. The figure displays a lower
spike at the threshold mark 5 for the public relative to private students in both
years, suggesting an opposite situation to the one claimed above. Moreover, we
note that the private students’ grade distribution remains virtually unchanged from
2009 to 2010, while the grade distribution of public students visibly shifts to the
right, lending further support to the corruption-inflated grades hypothesis. It is
interesting to note that there is a relative increase in public student shares that
attain grades between 6 and 8 in 2010 relative to 2009. Furthermore, while the
spike at grade 5 decreases for public students, a new spike at 6 arises in 2010 for
these students, which is concomitant with a decrease in the share of students
situated just below 6 (i.e., the percentage gap between students just below and just
above 6 increases). This is well in line with the requirement that students attain a
minimum average grade of 6, which in 2010 is more pressing, given the reduced
number of opportunities to score high marks (oral exams no longer count, and the
students have fewer written tests).
5.2 The expenditures of households with private and public educators
If the 25% wage cut translate into a decrease of household expenditures for the
public school staff, but not for their private counterparts, then bribes is probably
not the main explanation for our results.44
However, if despite the wage cut, we
find household expenditures to evolve similarly for the public and the private
school staff, we may infer that this is because of more and/or higher bribes
44 This approach of inferring corruption from data on household expenditures is related to Gorodnichenko
and Sabirianova Peter (2007).

30
received by the public education staff. This finding would support our
interpretation that the increased exam scores, because of the wage cut, is being
due to higher corruption. We are able to investigate this issue in some detail using
the 2008-2010 Romanian Household Budget Survey data, which contains detailed
socio-economic information for about 30,000 households each year and is the
main tool of assessing population consumption and expenditures in Romania.45
In particular, our approach here is to compare changes in yearly expenditures
between 2009 and 2010 for households where at least one member is employed in
the public or the private education sector.46
We do this in a DD empirical strategy,
similar to the one where we analyze the exam scores. More specifically, we
estimate the following equation:
(2)
where h indexes a household at year t. is the expenditure outcome of interest,
which either are total expenditures, consumption expenditures or investment
expenditures; is an indicator that equals 1 if household h contains a
public school teacher and 0 if it contains a private school teacher; is an
indicator that equals 1 if responses are from the 2010 survey and 0 if it is for the
2009 survey. includes a set of demographic and socio-economic background
variables (see note to Table 8). Our key coefficient is , the DD estimand, which
measures the change in household expenditures in 2010, after the abrupt wage cut,
relative to 2009, for public relative to private education staff. In all our
regressions, we report heteroscedasticity robust standard errors.
45 Household expenditures are registered on a monthly base. 46 In particular, we restrict our sample to households where at least one member is employed in education and
has the occupation status category 1 and 2 according to the Romanian Occupation Classification (COR),
since we want to exclude the administration personnel and other employees. However, we cannot distinguish
here between primary, secondary, tertiary level teachers and other consultants in education (specialisti in
invatamant).

31
We present these findings in Table 8. In Panel A we show the main results for
2009 and 2010 and in Panel B we show results from a falsification exercise, using
the 2008-2009 period. The results, without and with additional control variables,
are reported as follows: total expenditures in columns 1-2, consumption
expenditures in columns 3-4, and investment expenditures in columns 5-6. In
Panel A we observe that for all our expenditure measures, and regardless of
whether we add control variables, the DD estimates are always statistically
insignificant. From these results we may infer that the 25% wage cut caused no
differential response in household expenditures for private and public educators.
If we relate the interaction estimates to the means (approximately 3,000 for total
expenditure) we can infer that the coefficient estimates are small in size: the
conditional estimate in column 2 is interpreted as a 3 percent increase in total
consumption for public educators (relative to private educators). Admittedly, the
estimates are also fairly imprecisely estimated.
6. Discussion and conclusions
This study responds to the imperative call for diagnosing the causes of corruption,
which is a pandemic disorder particularly in developing and transition countries.
Despite the advances and innovations of recent research in measuring and
understanding the determinants and consequences of this phenomenon, little is
known about the effects of civil servants’ financial incentives on their proclivity
to engage in corrupt practices.
We exploit an unexpected wage cut of 25%, which occurred in 2010 in Romania
and affected the entire public sector, to investigate the causal relationship between
wage loss and the intensity of corruption. We base our analysis in the educational
system, which was largely affected by the reduction in wages. Using data from

32
the national Romanian Baccalaureate exam, we implement a DD estimation of the
effect of the wage cut on exam outcomes in the public schools, by a comparison
with private schools, which did not experience any wage shock. Our estimates
show that the wage cut caused a disproportionate change in average grades and
passing rates in public high schools relative to private ones between 2010 and
2009. We attribute the estimated positive difference in exam outcomes between
public and private schools to an intensification of corrupt activity by public school
staff that is strictly related to the wage loss.
Our conclusion is also supported by placebo tests where we find no impact on
exam scores between 2008 and 2009. We argue that this effect cannot stem
entirely from petty cheating in the exam rooms. Hence, the effect we witness
reflects a rather more serious use of contacts and bribery of school principals and
teachers, which in 2010 become more prevalent in the public schools than in the
private ones due to the enhanced financial incentives that made the public
education staff more predisposed to fraud. These results are further supported by
the finding that household expenditures for private and public educators,
respectively, did not have a differentiated evolution between 2009 and 2010.
These findings provide a snapshot of the undesired impact the policies of budget
contraction had on the illicit behavior of affected agents, which is of particular
relevance in the context of the recent adoption of austerity measures by post-crisis
financially distressed EU members. Such drastic types of reductions in public
spending are particularly dangerous in vulnerable environments that are already
predisposed to corruption.

33
References
Armantier, O. and Boly, A. (2011). “A controlled field experiment on corruption”,
European Economic Review¸55, 1072-1082.
Abbink, K. (2002). "Fair Salaries and the Moral Costs of Corruption", Working Paper
2002-05, University of Bonn, Germany.
Barr, A. and Serra, D. (2009). “The effects of externalities and framing on bribery in a
petty corruption experiment”, Experimental Economics, 12(4), 488-503.
Barr, A., Lindelow, M. and Serneels, P. (2009). “Corruption in public service delivery:
An experimental analysis” Journal of Economic Behavior & Organization, 72(1),
225-239.
Becker, G. and Stigler, G. (1974). “Law Enforcement, Malfeasance, and the
Compensation of Enforcers”, Journal of Legal Studies 3, 1-19.
Bejenariu, S. and Mitrut, A. (2012). “Save Some, Lose Some: Biological Consequences
of an Unexpected Wage Cut”. Working paper 2012:4, Uppsala University,
February.
Bertrand, M., Djankov, S., Hanna, R. and Mullainathan, S. (2006). ”Obtaining a Driving
License in India: An Experimental Approach to Studying Corruption”, Quarterly
Journal of Economics, 122(4), 1639-1676.
Campbell, D.T. (1976). “Assessing the Impact of Planned Social Change”. The Public
Affairs Center, Dartmouth College, Hanover New Hampshire, USA, December.
Conley, T. G. and Taber, C. R. (2011). ”Inference with “Difference in Differences” with
a Small Number of Policy Changes”, The Review of Economics and Statistics,
93(1), 113-125.
Di Tella, R. and Schargrodsky, E. (2003). “The Role of Wages and Auditing during a
Crackdown on Corruption in the City of Buenos Aires”, Journal of Law and
Economics, 46(1), 269-292.
Duflo, E., Hanna, R. and Ryan, S. (2010). “Incentives Works: Getting Teachers to Come
to School”, American Economic Review, forthcoming.
Ferraz, C., Finan, F. and Moreira, D.B. (2011). “Corrupting Learning: Evidence from
Missing Federal Education Funds in Brazil”, Journal of Public Economics,
forthcoming.

34
Fisman, R., and Gatti, R. (2002). “Decentralization and corruption: evidence across
countries.” Journal of Public Economics, 83(3), 325–345.
Frank, B. and Schulze, G. G. (2000). “Does Economics Make Citizens Corrupt? “,
Journal of Economic Behavior & Organization, 43(1), 101-113.
Glewwe, P., Nauman, I. and Kremer, M. (2010). “Teacher Incentives”, American
Economic Journal: Applied Economics, 2(3), 205-27.
Gorodnichenko, Y. and Sabirianova Peter, K. (2007). “Public Sector Pay and Corruption:
Measuring Bribery from Micro Data”, Journal of Public Economics, 91(5-6),
963-991.
Hallak, J. and Poisson, M. (2007). “Corrupt Schools, Corrupt Universities: What Can Be
Done?”, Paris, France: UNESCO, Institute for Educational Planning.
Jacob, B. and Levitt, S.D. (2003). “Rotten Apples: An Investigation of the Prevalence
and Predictors of Teacher Cheating.” Quarterly Journal of Economics. 118(3),
843–77.
Kingdon, G. and Muzammil, M. (2009). “A Political Economy of Education in India: The
Case of Uttar Pradesh", Oxford Development Studies, Taylor and Francis
Journals, 37(2), 123-144.
Lewis, M. and Pettersson, G. (2009). “Governance in Education: Raising Performance”,
World Bank Human Development Network Working Paper, December.
Muralidharan, K. and Sundararaman, V. (2011). “Teacher Performance Pay:
Experimental Evidence from India”, Journal of Political Economy, 119(1), 39-
77.
Nichols, S. L., and Berliner, D. C. (2007). “Collateral damage: How high stakes testing
corrupts America’s schools”, Cambridge, MA: Harvard Education Press.
Niehaus, P and Sukhtankar, S. (2010). “Corruption Dynamics: The Golden Goose
Effect.” BREAD Working Paper 223.
Olken, B. (2007). “Monitoring Corruption: Evidence from a Field Experiment in
Indonesia”, Journal of Political Economy, 115 (2), 200-249, April.
Olken, B. and Pande, R. (2012).”Corruption in Developing Countries”, NBER Working
Paper Series, Vol. w17398.

35
Pop-Eleches, C., and Urquiola, M. (2011): “Going to a Better School: Effects and
Behavioral Responses” NBER Working Papers 16886, National Bureau of
Economic Research, Inc.
Rauch, J.E. and Evans, P.B. (2000). "Bureaucratic Structure and Bureaucratic
Performance In Less Developed Countries”, Journal of Public Economics,
75(1), 49-71.
Reinikka, R. and Svensson, J. (2004). “Local Capture: Evidence From a Central
Government Transfer Program in Uganda”, The Quarterly Journal of
Economics, 119(2), 678-70.
Reinikka, R. and Svensson, J. (2005). ”Fighting Corruption to Improve Schooling:
Evidence from a Newspaper Campaign in Uganda”, Journal of the European
Economic Association, 3(2-3), 259-267.
Schulze, G. G., and Frank, B. (2003). “Deterrence versus Intrinsic Motivation:
Experimental Evidence on the Determinants of Corruptibility” Economic
Governance, 4(2), 143-160.
Shapiro, C. and Stiglitz, J.E. (1984). “Equilibrium Unemployment as a Worker discipline
device”, The American Economic Review, 74(3), 433-444, June.
Shleifer, A. and Vishny, R. (1993). ”Corruption”, The Quarterly Journal of Economics,
108(3), 599-617.
Silova, I. and Bray, M. (Eds) (2006). “Education in the hidden market place: monitoring
of private tutoring”, New York, Open Society Institute.
Van Rijckeghem, C. and Weder, B. (2001). “Bureaucratic Corruption and The Rate of
Temptation: Do Wages in the Civil Service Affect Corruption, and by how
Much?” Journal of Development Economics, 65(2), 307-331.
World Bank Report (WBR), (2003). “Diagnostic Survey of Corruption in Romania”
http://www1.worldbank.org/publicsector/anticorrupt/romenglish.pdf

36
800
900
1000
1100
1200
1300
1400
1500
1600
1700
RO
N
PUBLIC AJUST PRIVATE AJUST
Figure 1. Average Monthly Net Real Wages by Sector, 2008-2010
Source: Authors’ calculations using 2008-2010 Romanian Labor Cost Survey data. 1 RON=0.3
USD

37
Figure 2. Country rank: the difference of upper secondary school graduation ranking vs.
PISA tests ranking
Notes: We consider a sample of European countries and compute their ranking based on:
(1) the 2009 percent of students graduating from upper secondary education (separately
for the general and vocational tracks) and (2) the 2009 PISA test scores in reading and the
social scale performance. The figure shows that difference in these rankings: (1)-(2).
Source: Authors’ calculations using and
http://www.oecd.org/dataoecd/62/3/48630687.pdf.
-20
-15
-10
-5
0
5
10
15
Vocational tracks upper secondary graduation vs. PISA reading performanceGeneral programmes uppersecondary education vs. PISA performance on the social scaleVocational tracks upper secondary graduation vs. PISA performance on the social scaleGeneral programmes upper secondary graduation vs. PISA reading performance

38
Figure 3. Distributions of average grades in the Romanian written exam, public vs. private
school students 2009-2010
05
10
15
05
10
15
0 5 10 0 5 10
Public students, 2009 Public students, 2010
Private students, 2009 Private students, 2010
Perc
ent
Grade Romanian written exam
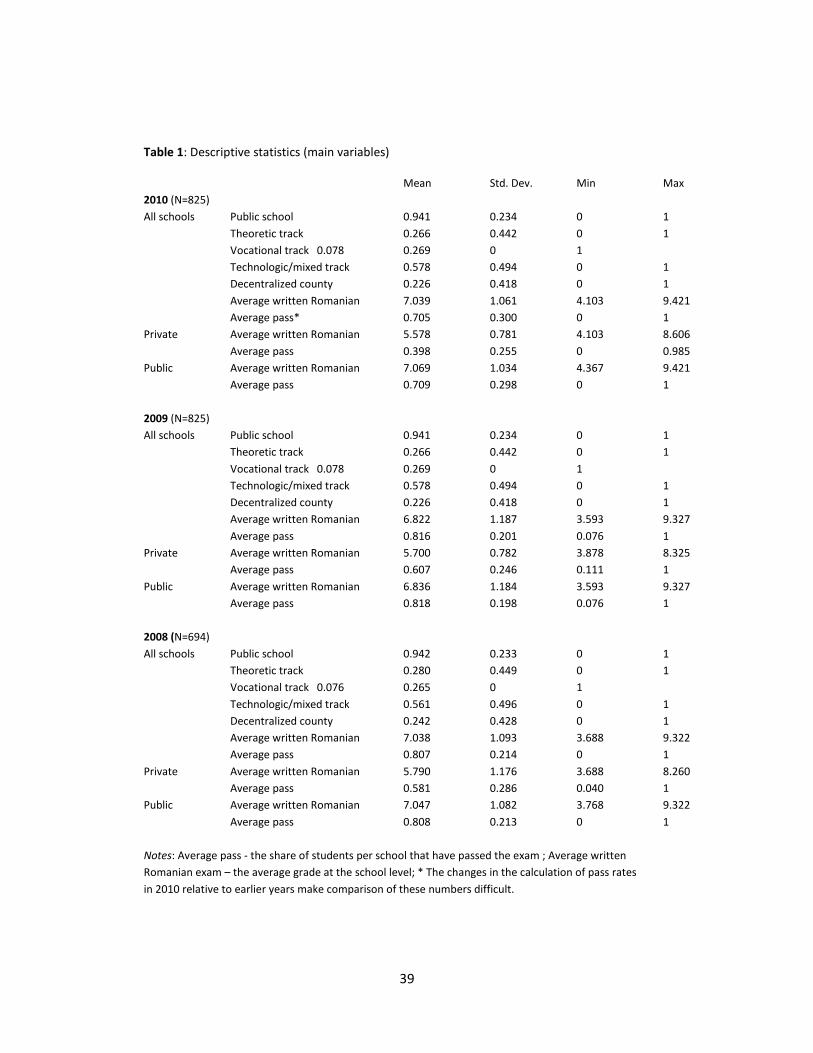
39
Table 1: Descriptive statistics (main variables)
Mean Std. Dev. Min Max
2010 (N=825)
All schools Public school 0.941 0.234 0 1
Theoretic track 0.266 0.442 0 1
Vocational track 0.078 0.269 0 1
Technologic/mixed track 0.578 0.494 0 1
Decentralized county 0.226 0.418 0 1
Average written Romanian 7.039 1.061 4.103 9.421
Average pass* 0.705 0.300 0 1
Private Average written Romanian 5.578 0.781 4.103 8.606
Average pass 0.398 0.255 0 0.985
Public Average written Romanian 7.069 1.034 4.367 9.421
Average pass 0.709 0.298 0 1
2009 (N=825)
All schools Public school 0.941 0.234 0 1
Theoretic track 0.266 0.442 0 1
Vocational track 0.078 0.269 0 1
Technologic/mixed track 0.578 0.494 0 1
Decentralized county 0.226 0.418 0 1
Average written Romanian 6.822 1.187 3.593 9.327
Average pass 0.816 0.201 0.076 1
Private Average written Romanian 5.700 0.782 3.878 8.325
Average pass 0.607 0.246 0.111 1
Public Average written Romanian 6.836 1.184 3.593 9.327
Average pass 0.818 0.198 0.076 1
2008 (N=694)
All schools Public school 0.942 0.233 0 1
Theoretic track 0.280 0.449 0 1
Vocational track 0.076 0.265 0 1
Technologic/mixed track 0.561 0.496 0 1
Decentralized county 0.242 0.428 0 1
Average written Romanian 7.038 1.093 3.688 9.322
Average pass 0.807 0.214 0 1
Private Average written Romanian 5.790 1.176 3.688 8.260
Average pass 0.581 0.286 0.040 1
Public Average written Romanian 7.047 1.082 3.768 9.322
Average pass 0.808 0.213 0 1
Notes: Average pass - the share of students per school that have passed the exam ; Average written
Romanian exam – the average grade at the school level; * The changes in the calculation of pass rates
in 2010 relative to earlier years make comparison of these numbers difficult.

40
Table 2:Average grade for the standardized written Romanian exam, 2010 vs. 2009 academic year
Panel A: All schools (1) (2) (3) (4)
public 1.107*** 1.111*** 1.068*** 1.068*** (0.144) (0.219) (0.188) (0.188) yr10 -0.140 -0.0952 -0.0442 -0.0442 (0.122) (0.131) (0.116) (0.116) public x yr10 0.381*** 0.338** 0.276** 0.276** (0.125) (0.133) (0.118) (0.118) theoretic 1.229*** 1.310*** 1.310*** (0.0910) (0.0790) (0.0790) technologic -0.455*** -0.449*** -0.449*** (0.0858) (0.0817) (0.0817) decentralized county 0.109 (0.195) County FE NO NO YES YES Observations 1,650 1,650 1,650 1,650 R-squared 0.053 0.381 0.486 0.486 Panel B: Theoretic schools
public 2.046*** 2.011*** 2.011*** (0.312) (0.247) (0.247) yr10 -0.133 -0.103 -0.103 (0.203) (0.195) (0.195) public x yr10 0.314 0.283 0.283 (0.207) (0.199) (0.199) decentralized county 0.539** (0.234) County FE NO YES YES Observations 440 440 440 R-squared 0.229 0.347 0.347 Panel C: Technologic and vocational schools
public 0.804*** 0.772*** 0.739*** 0.739***
(0.144) (0.145) (0.134) (0.134)
yr10 -0.134 -0.134 -0.0638 -0.0638
(0.151) (0.151) (0.143) (0.143)
public x yr10 0.398*** 0.395** 0.307** 0.307**
(0.154) (0.154) (0.145) (0.145)
vocational 0.706*** 0.734*** 0.734***
(0.0963) (0.0953) (0.0953)
decentralized county -1.068***
(0.257)
County FE NO NO YES YES
Observations 1,210 1,210 1,210 1,210
R-squared 0.051 0.074 0.266 0.266
Notes: All regressions are weighted with the number of (per school) students taking the exam and the
standard errors, shown in parentheses, are clustered at the school level. *** p<0.01, ** p<0.05, * p<0.1.

41
Table 3:Average pass rate, 2010 vs. 2009 academic year Panel A: All schools (1) (2) (3) (4)
public 0.197*** 0.187*** 0.180*** 0.180*** (0.0457) (0.0585) (0.0457) (0.0457) yr10 -0.220*** -0.212*** -0.199*** -0.199*** (0.0558) (0.0567) (0.0529) (0.0529) public x yr10 0.115** 0.108* 0.0907* 0.0907* (0.0563) (0.0573) (0.0535) (0.0535) theoretic 0.164*** 0.187*** 0.187*** (0.0182) (0.0166) (0.0166) technologic -0.103*** -0.0990*** -0.0990*** (0.0235) (0.0205) (0.0205) decentralized county 0.0822** (0.0389) County FE NO NO YES YES Observations 1,650 1,650 1,650 1,650 R-squared 0.079 0.226 0.406 0.406 Panel B: Theoretic schools
public 0.352*** 0.340*** 0.340*** (0.0864) (0.0811) (0.0811) yr10 -0.156 -0.154 -0.154 (0.119) (0.121) (0.121) public x yr10 0.127 0.124 0.124 (0.119) (0.121) (0.121) decentralized county -0.0109 (0.0133) County FE NO YES YES Observations 440 440 440 R-squared 0.288 0.378 0.378 Panel C: Non-theoretic (technologic and vocational) schools
public 0.134*** 0.123** 0.120*** 0.120***
(0.0491) (0.0492) (0.0412) (0.0412)
yr10 -0.254*** -0.254*** -0.232*** -0.232***
(0.0568) (0.0568) (0.0535) (0.0535)
public x yr10 0.122** 0.121** 0.0941* 0.0941*
(0.0577) (0.0577) (0.0545) (0.0545)
vocational 0.248*** 0.253*** 0.253***
(0.0131) (0.0199) (0.0199)
decentralized county -0.310***
(0.0492)
County FE NO NO YES YES
Observations 1,210 1,210 1,210 1,210
R-squared 0.083 0.120 0.381 0.381
Notes:All regressions are weighted with the number of (per school) students taking the exam and the
standard errors, shown in parentheses, are clustered at the school level. *** p<0.01, ** p<0.05, * p<0.1.

42
Table 4:Average grade for the standardized written Romanian exam, 2009 vs. 2008 academic year
Panel A: All schools (1) (2) (3) (4)
public 1.204*** 1.130*** 1.127*** 1.127*** (0.229) (0.284) (0.229) (0.229) yr09 -0.0854 -0.126 -0.192 -0.192 (0.111) (0.111) (0.126) (0.126) public x yr09 -0.0982 -0.0691 -0.00723 -0.00723 (0.114) (0.114) (0.128) (0.128) theoretic 1.220*** 1.325*** 1.325*** (0.0996) (0.0840) (0.0840) technologic -0.416*** -0.402*** -0.402*** (0.1000) (0.0898) (0.0898) decentralized county 0.331 (0.229) County FE NO NO YES YES Observations 1,388 1,388 1,388 1,388 R-squared 0.031 0.348 0.511 0.511 Panel B: Theoretic schools
public 2.024*** 2.117*** 2.117*** (0.472) (0.353) (0.353) yr09 0.0544 -0.00630 -0.00630 (0.173) (0.190) (0.190) public x yr09 -0.163 -0.109 -0.109 (0.181) (0.196) (0.196) decentralized county 0.537 (0.499) County FE NO YES YES Observations 390 390 390 R-squared 0.136 0.318 0.318 Panel C: Non-theoretic (technologic and vocational) schools
public 0.915*** 0.885*** 0.838*** 0.838***
(0.254) (0.255) (0.182) (0.182)
yr09 -0.168 -0.168 -0.239 -0.239
(0.133) (0.133) (0.159) (0.159)
public x yr09 -0.0615 -0.0571 0.0156 0.0156
(0.136) (0.136) (0.161) (0.161)
vocational 0.542*** 0.639*** 0.639***
(0.113) (0.101) (0.101)
decentralized county -0.296
(0.254)
County FE NO YES YES YES
Observations 998 998 998 998
R-squared 0.032 0.046 0.329 0.329
Notes: All regressions are weighted with the number of (per school) students taking the exam and the
standard errors, shown in parentheses, are clustered at the school level. *** p<0.01, ** p<0.05, * p<0.1.

43
Table 5:Average pass rate, 2009 vs. 2008 academic year Panel A: All schools (1) (2) (3) (4) public 0.213*** 0.197*** 0.192*** 0.192*** (0.0601) (0.0656) (0.0465) (0.0465) yr09 0.0336 0.0284 0.0175 0.0175 (0.0276) (0.0283) (0.0292) (0.0292) public x yr09 -0.0201 -0.0161 -0.00517 -0.00517 (0.0281) (0.0288) (0.0297) (0.0297) theoretic 0.133*** 0.146*** 0.146*** (0.0161) (0.0147) (0.0147) technologic -0.0692*** -0.0720*** -0.0720*** (0.0227) (0.0191) (0.0191) decentralized county 0.0108 (0.0440) County FE NO NO YES YES Observations 1,388 1,388 1,388 1,388 R-squared 0.024 0.162 0.425 0.425 Panel B: Theoretic schools
public 0.333*** 0.336*** 0.336*** (0.116) (0.0890) (0.0890) yr09 0.0336 0.0279 0.0279 (0.0266) (0.0275) (0.0275) public x yr09 -0.0332 -0.0282 -0.0282 (0.0275) (0.0285) (0.0285) decentralized county 0.0249 (0.0462) County FE NO YES YES Observations 390 390 390 R-squared 0.185 0.341 0.341 Panel C: Non-theoretic (technologic and vocational) schools
public 0.168** 0.159** 0.156*** 0.156***
(0.0695) (0.0696) (0.0495) (0.0495)
yr09 0.0334 0.0334 0.0183 0.0183
(0.0390) (0.0390) (0.0407) (0.0407)
public x yr09 -0.0168 -0.0153 0.000488 0.000488
(0.0397) (0.0397) (0.0414) (0.0414)
vocational 0.176*** 0.186*** 0.186***
(0.0135) (0.0189) (0.0189)
decentralized county -0.123**
(0.0559)
County FE NO NO YES YES
Observations 998 998 998 998
R-squared 0.013 0.045 0.400 0.400
Notes:All regressions are weighted with the number of (per school) students taking the exam and the
standard errors, shown in parentheses, are clustered at the school level. *** p<0.01, ** p<0.05, * p<0.1.

44
Table 6: Share of expelled students (caught cheating) from the exam, 2010 vs. 2009 academic year
Panel A: All schools public -0.00379* -0.00369* -0.00350* -0.00350* (0.00195) (0.00202) (0.00199) (0.00199) year10 0.00342 0.00339 0.00331 0.00331 (0.00563) (0.00563) (0.00563) (0.00563) public x yr10 -0.00387 -0.00384 -0.00373 -0.00373 (0.00563) (0.00564) (0.00563) (0.00563) theoretic -0.000632** -0.000987*** -0.000987*** (0.000294) (0.000317) (0.000317) technologic 0.000611 0.000326 0.000326 (0.000420) (0.000366) (0.000366) decentralized county -0.000713 (0.000435) County FE NO NO YES YES Observations 1,650 1,650 1,650 1,650 R-squared 0.028 0.037 0.061 0.061 Panel B: Theoretic schools
public -0.00705* -0.00696* -0.00696* (0.00391) (0.00399) (0.00399) yr10 -0.00780** -0.00784* -0.00784* (0.00390) (0.00398) (0.00398) public x yr10 0.00798** 0.00802** 0.00802** 0.00393) (0.00401) (0.00401) decentralized county -0.00205 (0.00163) County FE NO YES YES Observations 440 440 440 R-squared 0.014 0.052 0.052 Panel C: Technologic and vocational schools
public -0.00211 -0.00170 -0.00168 -0.00168
(0.00176) (0.00181) (0.00181) (0.00181)
yr10 0.00922 0.00915 0.00915 0.00915
(0.00781) (0.00782) (0.00783) (0.00783)
public x yr10 -0.00990 -0.00977 -0.00977 -0.00977
(0.00782) (0.00783) (0.00783) (0.00783)
vocational -0.000418 -0.000418
(0.000605) (0.000605)
decentralized county 0.00568**
(0.00278)
County FE NO YES YES YES
Observations 1,210 1,210 1,210 1,210
R-squared 0.044 0.073 0.073 0.073
Notes: All regressions are weighted with the number of (per school) students taking the exam and the
standard errors, shown in parentheses, are clustered at the school level.*** p<0.01,** p<0.05,* p<0.1.

45
Table 7. Average pass rate Average written Romanian exam (1) (2) (3) (4) (5) (6) (7) (8)
Panel A: I. Female share (<0.5) II. Female share (>0.5) III.Female share (<0.5) IV. Female share (>0.5)
public 0.0542 0.0856** 0.403*** 0.369*** 0.286* 0.508*** 1.971*** 1.921***
(0.0457) (0.0430) (0.0831) (0.0840) (0.171) (0.174) (0.211) (0.318)
yr10 -0.281*** -0.257*** -0.0815 -0.0677 -0.256* -0.153 0.0720 0.0678
(0.0579) (0.0533) (0.117) (0.120) (0.136) (0.119) (0.278) (0.313)
public x yr10 0.116* 0.0860 0.0213 0.00556 0.534*** 0.418*** 0.143 0.142
(0.0597) (0.0552) (0.117) (0.120) (0.141) (0.125) (0.280) (0.314)
Observations 752 752 898 898 752 752 898 898
R-squared 0.108 0.468 0.079 0.335 0.041 0.474 0.069 0.422
Panel B: I. Romanians (=1) II. Romanians (<1 ) III. Romanians (=1) IV. Romanians (<1) public 0.257*** 0.151* 0.118* 0.152*** 1.301*** 0.789*** 0.836*** 0.982***
(0.0564) (0.0801) (0.0618) (0.0583) (0.176) (0.293) (0.197) (0.255)
yr10 -0.125** -0.111* -0.305*** -0.285*** 0.0638 0.108 -0.304* -0.186
(0.0608) (0.0624) (0.0826) (0.0782) (0.153) (0.159) (0.165) (0.154)
public x yr10 -0.0192 -0.0394 0.211** 0.188** 0.175 0.104 0.546*** 0.423***
(0.0637) (0.0654) (0.0830) (0.0787) (0.163) (0.168) (0.168) (0.156)
Observations 406 406 1,244 1,244 406 406 1,244 1,244
R-squared 0.121 0.452 0.061 0.404 0.104 0.531 0.033 0.48
Panel C: I. Teachers (<0.11) II. Teachers (>0.11) III.Teachers (<0.11) IV. Teachers (>0.11) public 0.253*** 0.213* 0.152*** 0.160*** 1.324*** 1.224*** 0.886*** 0.996***
(0.0620) (0.111) (0.0577) (0.0524) (0.205) (0.447) (0.185) (0.203)
yr10 -0.0979* -0.0780 -0.266*** -0.243*** 0.0245 0.146* -0.205 -0.0956
(0.0514) (0.0481) (0.0722) (0.0695) (0.104) (0.0868) (0.162) (0.151)
public x yr10 -0.000955 -0.0239 0.151** 0.123* 0.205* 0.0809 0.470*** 0.339**
(0.0521) (0.0490) (0.0739) (0.0715) (0.108) (0.0915) (0.167) (0.156)
Observations 1,036 1,036 614 614 1,036 1,036 614 614
R-squared 0.054 0.424 0.109 0.387 0.033 0.502 0.077 0.493
Panel D: I. Decentralized II. Non-decentralized III.Decentralized IV. Non-decentralized pub 0.389*** 0.240*** 0.175*** 0.173*** 1.536*** 0.911*** 1.059*** 1.101*** (0.0889) (0.0699) (0.0491) (0.0475) (0.295) (0.229) (0.158) (0.199)
yr10 -0.0832 -0.0587 -0.238*** -0.218*** 0.283 0.409 -0.198* -0.106
(0.180) (0.177) (0.0565) (0.0531) (0.484) (0.468) (0.116) (0.109)
public x yr10 -0.0394 -0.0677 0.138** 0.114** 0.108 -0.0261 0.400*** 0.298***
(0.181) (0.178) (0.0572) (0.0539) (0.485) (0.470) (0.120) (0.113)
Observations 374 374 1,276 1,276 374 374 1,276 1,276
R-squared 0.083 0.503 0.081 0.397 0.056 0.609 0.054 0.462
Controls NO ALL NO ALL NO ALL NO ALL
Notes: All regressions are weighted with the number of (per school) students taking the exam and the standard errors, shown in parentheses, are clustered at the school level. Our controls
include the usual characteristics. We show: in Panel A - schools with different share of female in total students; in Panel B - ethnically homogenous schools; Panel C – teachers paid by
hour contract (0.11=mean); panel D – decentralized vs. non-decentralized counties *** p<0.01, ** p<0.05, * p<0.1

46
Table 8: Total household expenditures
Panel A: 2009 vs. 2010
(1) (2) (3) (4) (5) (6) total expenditures consumption expenditures investment expenditures public -479.8** -241.1 -249.7 -37.43 -3.132 -20.89 (222.0) (211.8) (156.5) (161.9) (48.06) (46.85) yr10 -593.2* -417.3 -326.2 -235.6 -44.76 -26.36 (306.4) (267.4) (216.1) (196.2) (44.22) (42.13) public x yr10 370.3 154.6 128.6 16.71 60.13 48.90 (325.5) (285.3) (232.3) (211.6) (53.46) (51.01) Controls NO YES NO YES NO YES Observations 1,015 1,015 1,015 1,015 1,015 1,015 R-squared 0.008 0.146 0.008 0.118 0.001 0.010
Panel B: 2008 vs. 2009
(1) (2) (3) (4) (5) (6) total expenditures consumption expenditures investment expenditures public -526.5* -359.0 -313.9 -110.0 37.60 10.29 (316.6) (285.3) (205.7) (201.1) (69.86) (59.07) yr09 -82.99 -80.48 9.497 7.208 -24.75 -39.98 (360.6) (317.0) (236.1) (218.0) (66.15) (68.97) public x yr09 46.74 100.5 64.18 98.43 -40.73 -26.82 (386.7) (344.2) (258.5) (243.0) (84.79) (80.54) Controls NO YES NO YES NO YES Observations 1,049 1,049 1,049 1,049 1,049 1,049 R-squared 0.003 0.113 0.002 0.096 0.002 0.012
Notes: Total household expenditures include (deflated) consumption expenditures, investment expenditures,
production and other expenditures for all households who have at least one member employed in the education
system, whether public or private. Furthermore, we restrict the sample to households where the occupation status
is category 1 and 2 according to the Romanian Occupation Classification (COR). Thus, we only include primary,
secondary and tertiary level teachers and professors, but also e.g., other consultants in education (specialisti in
invatamant). Since we only have a one digit code of the occupation we cannot distinguish between these.
Background controls include: gender, age and age square, two education dummies, a dummy for Romanian
ethnicity, marital status dummy, household size, urban area dummy and a set of regional dummies.
Heteroscedasticity robust standard errors are shown in parentheses. * p<0.1. The means (S.D:s) of the dependent
variables in panel A are: 3,002 (1,678) for total expenditures, 2,018 (1,301) for consumption expenditures, and
47 (446) for investment expenditures. Source: Authors’ calculations using the 2008-2010 Romanian Household
Budget Survey data. 1RON=0.3USD.