Embed Size (px)
DESCRIPTION
V.5. By: Business and Operations Wednesday, April 6, 2011. Oakland Unified School District Special Board of Education Meeting 2011-2012 Budget. Table of Contents. Review Meeting Objectives Major Planning Assumptions for 2011-2012 OUSD Budget Budget Priority #1 - Increase Teacher Retention - PowerPoint PPT Presentation
Citation preview

By: Business and OperationsWednesday, April 6, 2011

2
Review Meeting ObjectivesMajor Planning Assumptions for 2011-2012
OUSD BudgetBudget Priority #1 - Increase Teacher RetentionBudget Priority #2 - Eliminate Structural Budget
DeficitBudget Priority #3 - Increase Employee
CompensationPublic CommentBoard’s Sense on Budget Priorities
2
Table of Contents
3
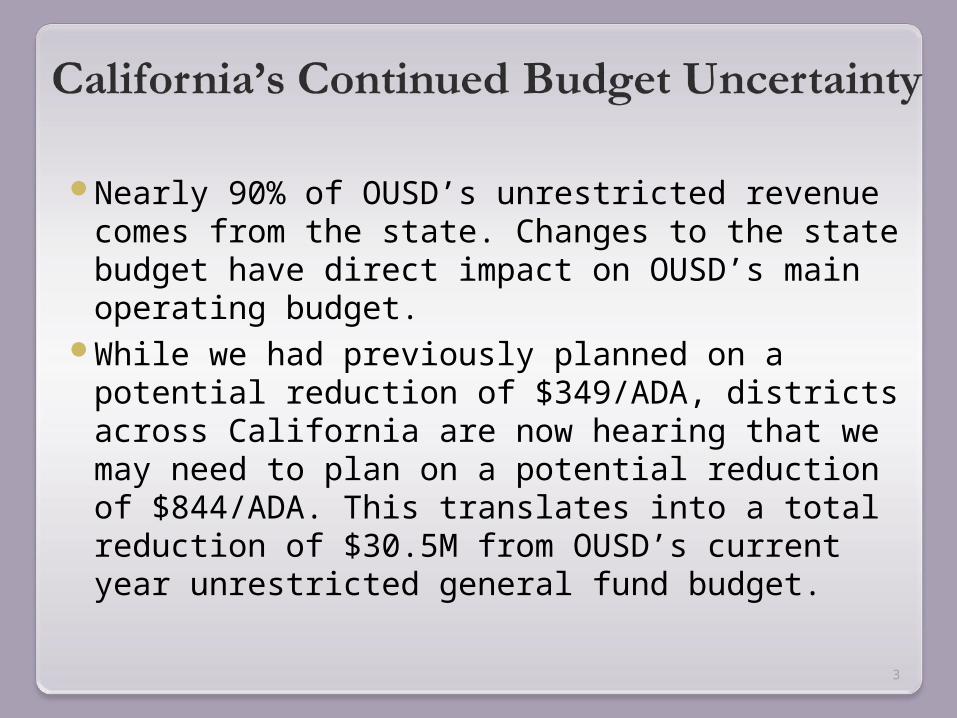
Nearly 90% of OUSD’s unrestricted revenue comes from the state. Changes to the state budget have direct impact on OUSD’s main operating budget.
While we had previously planned on a potential reduction of $349/ADA, districts across California are now hearing that we may need to plan on a potential reduction of $844/ADA. This translates into a total reduction of $30.5M from OUSD’s current year unrestricted general fund budget.
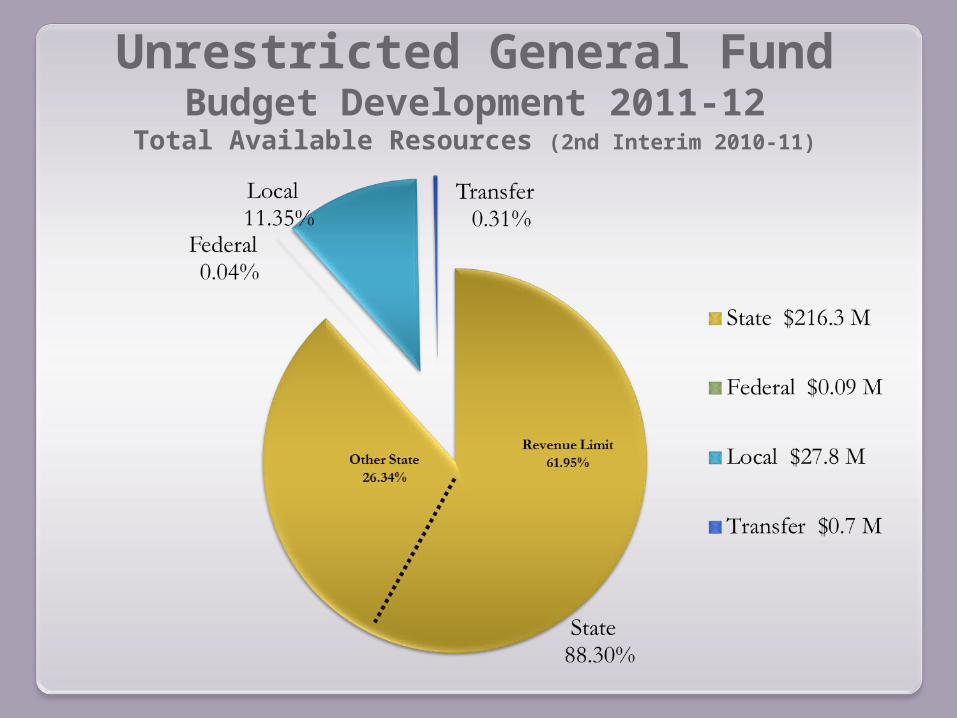
Unrestricted General FundBudget Development 2011-12
Total Available Resources (2nd Interim 2010-11)

5$4395
How State Funding Has Changed

6
13th Largest School District in California (2009-10)
Number of Schools: 97 (excluding Street Academy, Gateway, and Advanced Path)
Student Enrollment: 38,414 (excluding Gateway, including 1,347 SDC students)
Average Student/Teacher Ratio: 22.7 (excluding Prep Teachers)
Average School Size:378 Students per School:
13 schools - 500 or more students 46 schools - between 300-499 students 38 schools - 299 or less students
Snapshot of OUSD Schools2010-11
7
7
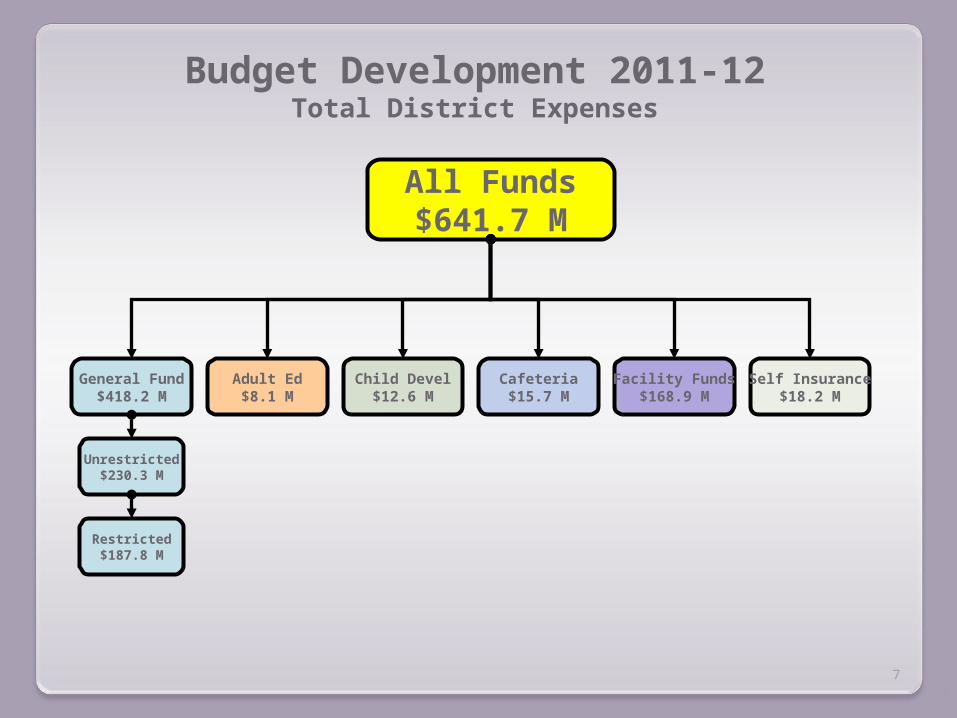
All Funds$641.7 M
Budget Development 2011-12Total District Expenses
General Fund$418.2 M
Unrestricted$230.3 M
Restricted$187.8 M
Adult Ed$8.1 M
Child Devel$12.6 M
Cafeteria$15.7 M
Facility Funds$168.9 M
Self Insurance$18.2 M
8
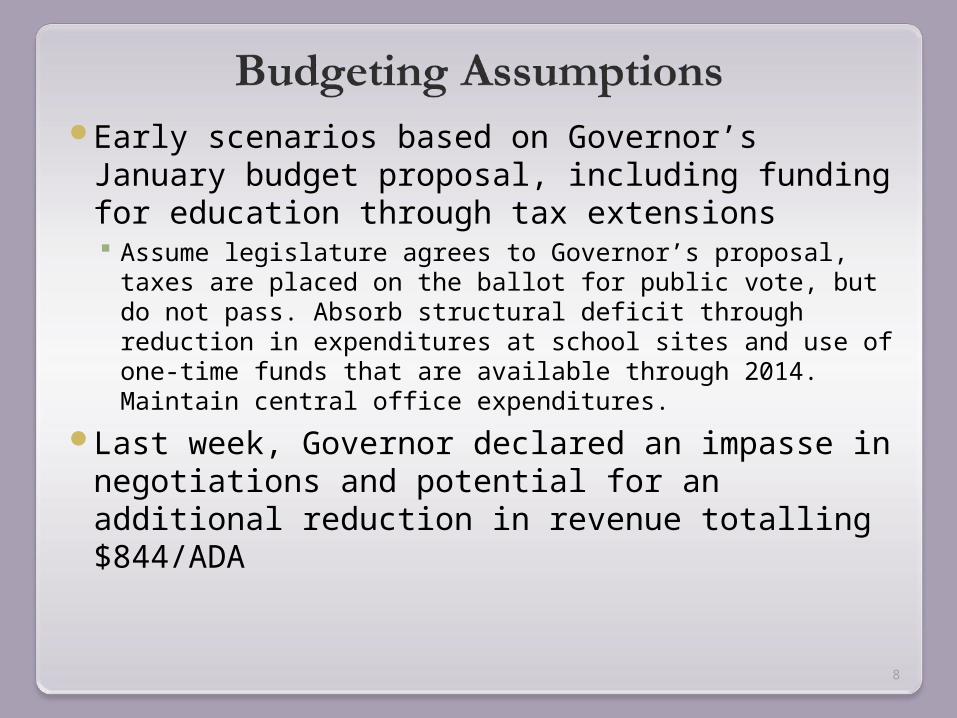
Early scenarios based on Governor’s January budget proposal, including funding for education through tax extensions Assume legislature agrees to Governor’s proposal,
taxes are placed on the ballot for public vote, but do not pass. Absorb structural deficit through reduction in expenditures at school sites and use of one-time funds that are available through 2014. Maintain central office expenditures.
Last week, Governor declared an impasse in negotiations and potential for an additional reduction in revenue totalling $844/ADA

9
2011-12 2011-12Scenario 1 Scenario 2
2nd Interim Diff (1) $349/ADA Less Diff (2) $844/ADA LessRevenue &Other Resources 283,980,459$ (19,108,496) 264,871,964$ (17,928,078) 246,943,886$ Other Outgo & Contrib (49,153,539) (3,045,000) (52,198,539) - (52,198,539) Net Avail. for Expenses a 234,826,920 (22,153,496) 212,673,425 (17,928,078) 194,745,347
Expenses 2010-11 223,334,987 - 223,334,987 - 223,334,987 Add back SFSF reduction 1,741,186 1,741,186 - 1,741,186 Incr exps in 2010-11 after 2nd Interim 167,000 167,000 Net 2010-11 Budgeted Expenses b 223,334,987 1,741,186 225,243,173 - 225,243,173
Revenue over (Under) Exps a-b=c 11,491,933$ (24,061,682)$ (12,569,748)$ (17,928,078)$ (30,497,827)$
(1) Revenue Diff - ($12.6M) $349/ADA low er; ($1.7M) Mandated Cost Rev & ($.9M) low er K-3 CSR est.; ($2.1M) Elim Transfer in from State Loan fund
to help pay state loan: ($1.8M) Eliminate one-time E-Rate reimb rev
"Other Outgo" Diff - ($3.0M) Increase transfer out of Adult Ed f lex resources
(2) Revenue Diff - $495/ADA low er
2010-11
Unrestricted General Fund Bgt Dev 2011-12

10
Incr/(Decr) Fund Bal
Revenue Enhancements1 Flex all of Adult Ed funds except $1M OT 6,274,367$
2 Flex Adult Ed Fund's Unallocated Fund Balance OT 2,500,000
3 State Loan Transfer from Fund 17 to Pay portion of State Loan OT 2,094,903 Total Revenue Enhancements a 10,869,270$
Expense Decreases4 Reductions to Schl site bgts after adding "Balancing Pool" - $3.1M (RBB Results) OG 14,634,339$
5 Use $2M of the $6.4M of Fed Jobs Bill to Reduce exps (Bal for Early Retirement) OT 2,000,000
6 Eliminate 4 of 20 Centrally Funded Music Teacher Positions OG 320,000
7 Reduce Elem Site Bgts Based on Unrest Class Size Maximums (Approx 90FTE's) OG 6,570,000 Total Expense Decreases b 23,524,339$
Fund Balance8 Unrestr Beginning Fund Balance not allocated to 2% required reserve & cash OT 19,079,869$
Total Beginning FB c 19,079,869
TOTAL AVAILABLE FOR DEFICIT a+b+c=d 53,473,478$
Proposed Expense Increases9 Cost of 2% mid-year salary increase for all employees OG (2,000,000)$
10 Use of Add'l Adult Ed Flex for High School A-G offerings and family literacy programs OT (3,000,000)
11 Add'l bgt for Summer School Costs Needed OG (543,171) TOTAL ADDITIONAL UNRESTRICTED EXPENSES PROPOSED e (5,543,171)$
NET AVAILABLE FOR DEFICIT d+e=f 47,930,307$
TOTAL DEFICIT FOR SCENARIO 2 - ($844/ADA LESS) g (30,497,827)$
DIFFERENCE OVER (UNDER) DEFICIT f+g=h 17,432,480$
OT "One-Time" funding or costOG "On Going" funding or cost
Options for Meeting Reduction in Revenue
11
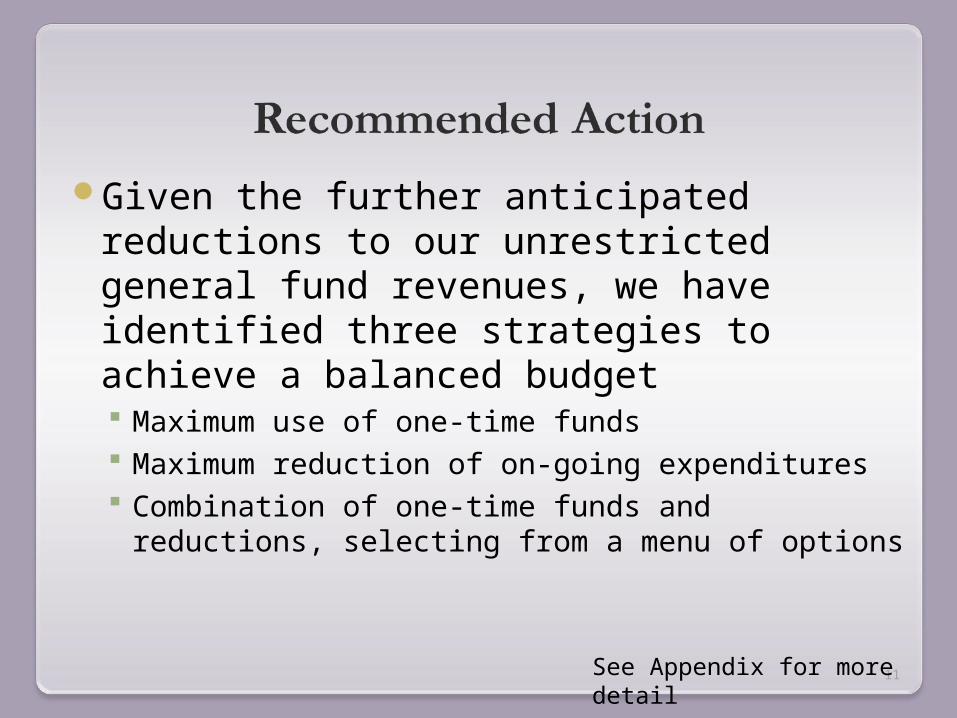
Given the further anticipated reductions to our unrestricted general fund revenues, we have identified three strategies to achieve a balanced budget Maximum use of one-time funds Maximum reduction of on-going expenditures Combination of one-time funds and reductions,
selecting from a menu of options
See Appendix for more detail
12
Increase Teacher Retention Teacher Turnover Measure G Revenues Reducing Non-instructional Workdays Strategies to Mitigate Disproportionate Impact of
Teacher Layoffs

13
20 sites have 2009-10 turnover rates greater than 25%
See Appendix for more detail
14
Calculated based on Number of positions budgeted in RBB; Early Retirement; Non-Re-Elects; and Temp Releases.
Does not include voluntary separations, still unknown.
15
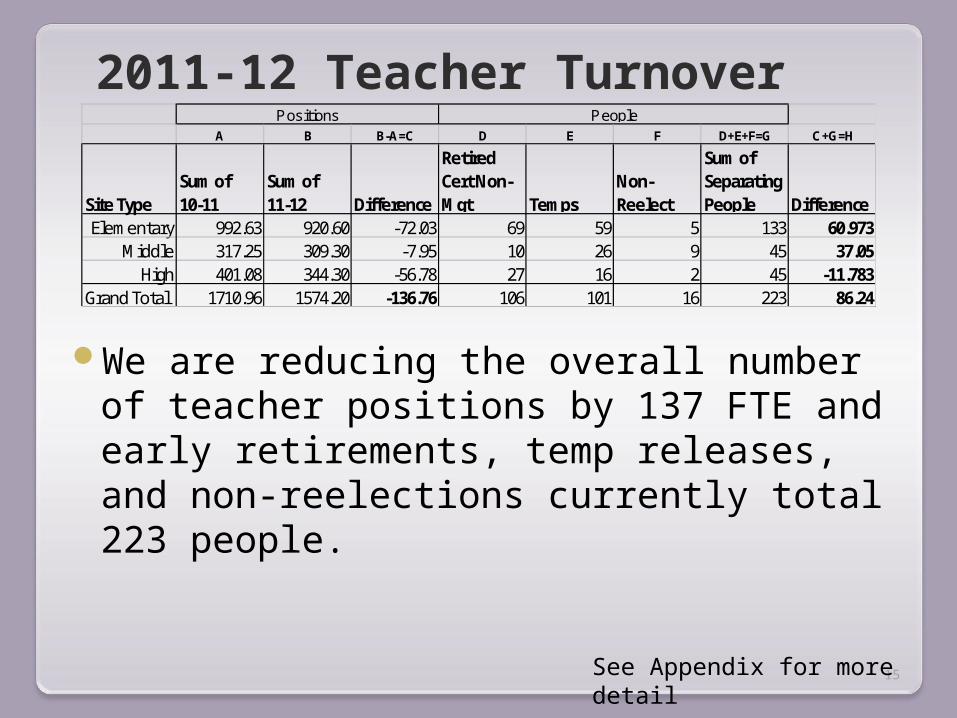
2011-12 Teacher Turnover
We are reducing the overall number of teacher positions by 137 FTE and early retirements, temp releases, and non-reelections currently total 223 people.
See Appendix for more detail
A B B-A=C D E F D+E+F=G C+G=H
Site TypeSum of 10-11
Sum of 11-12 Difference
Retired Cert Non-Mgt Temps
Non-Reelect
Sum of Separating People Difference
Elementary 992.63 920.60 -72.03 69 59 5 133 60.973Middle 317.25 309.30 -7.95 10 26 9 45 37.05
High 401.08 344.30 -56.78 27 16 2 45 -11.783Grand Total 1710.96 1574.20 -136.76 106 101 16 223 86.24
Positions People
16
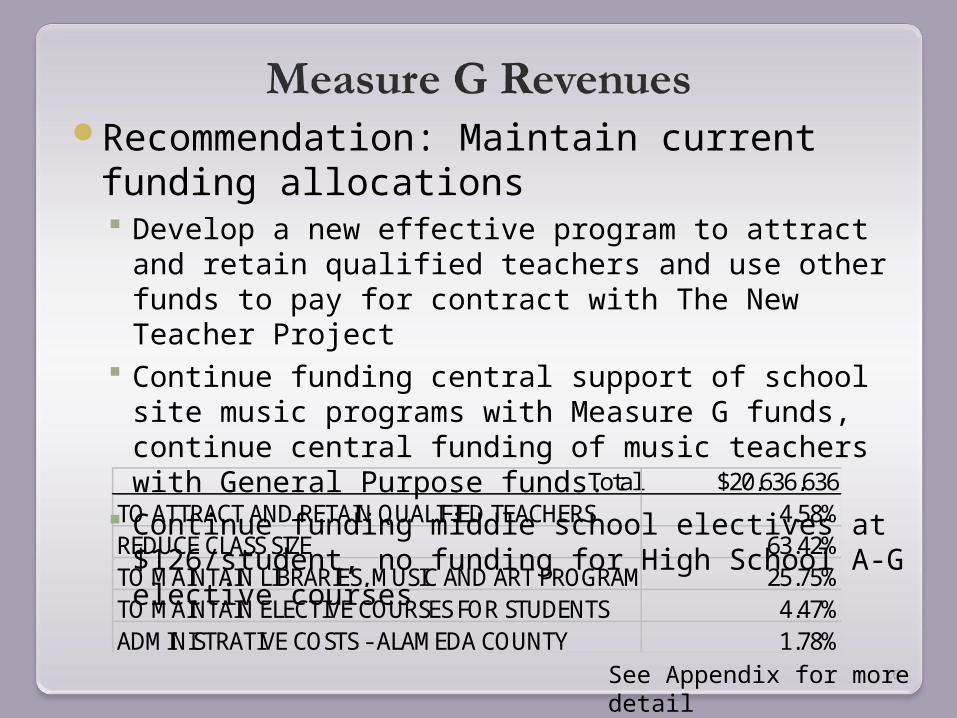
Total $20,636,636TO ATTRACT AND RETAIN QUALIFIED TEACHERS 4.58%REDUCE CLASS SIZE 63.42%TO MAINTAIN LIBRARIES, MUSIC AND ART PROGRAMS 25.75%TO MAINTAIN ELECTIVE COURSES FOR STUDENTS 4.47%ADMINISTRATIVE COSTS - ALAMEDA COUNTY 1.78%
Recommendation: Maintain current funding allocations Develop a new effective program to attract and
retain qualified teachers and use other funds to pay for contract with The New Teacher Project
Continue funding central support of school site music programs with Measure G funds, continue central funding of music teachers with General Purpose funds.
Continue funding middle school electives at $126/student, no funding for High School A-G elective courses.
See Appendix for more detail

17
Estimated savings from one district-wide non-instructional workday is $1.28M.
Bargaining UnitAnnual Sal & Driven Costs
Per Day Costs
AFSCME 17,434,120$ 76,304$ BLDGCONS 6,372,544 24,416 CONFID 9,602,666 37,680 CSEA 957,681 3,669 IND CONT 1,369,223 5,246 OEA 156,819,572 834,350 SEIU 37,470,013 162,994 TRUCK DR 544,614 2,087 UAOS 29,822,386 129,090 WAREHSE 507,962 1,946 TOTAL 260,900,782$ 1,277,782$
# of Non-instructional
Days Savings
1 1,277,782$ 2 2,555,563 3 3,833,345 4 5,111,126 5 6,388,908 6 7,666,689
18See Appendix for more detail
Working on a call-back strategy to prioritize returning teachers to the schools they are currently in.
Working with school communities to plan for successful transition into next year.
Working with OEA to implement additional strategies as appropriate.
19
Eliminate Structural Budget Deficit OUSD’s Structural Budget Deficit 2011-12 Proposed Central Office Budgets by
Department Contracted Services 2010-11 Use of Tier III Flexible Funds Audit Findings Reserves

20
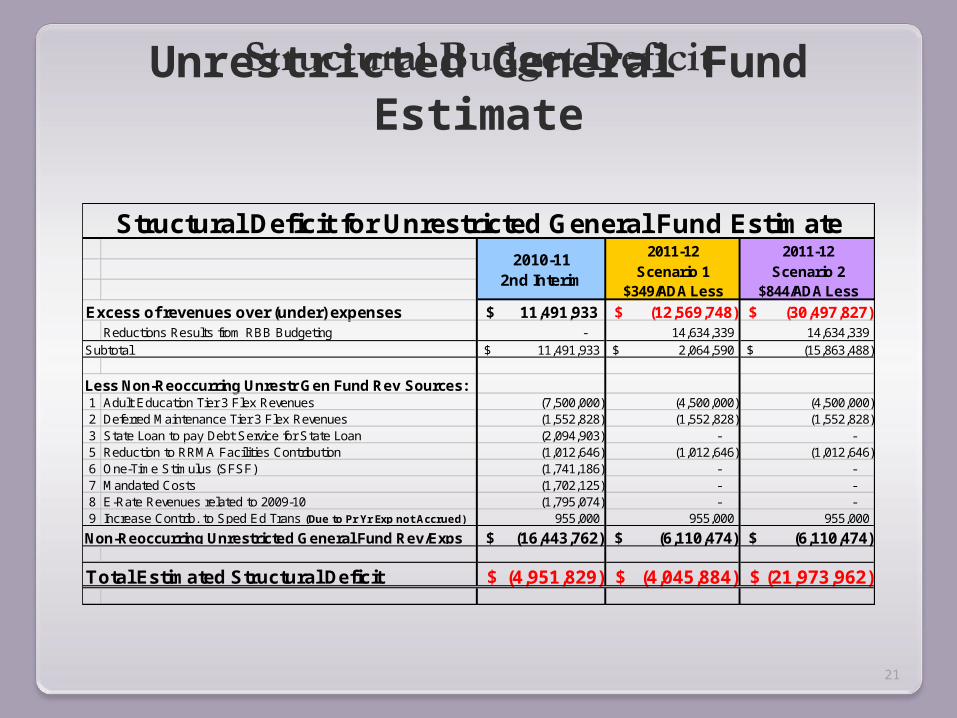
Based on the 2nd Interim report, the 2010-11 structural budget deficit for the unrestricted general fund is estimated at $4.95M
For 2011-12, through reduction of on-going expenses and use of one-time revenues, the structural budget deficit is estimated at $4.04M or $21.97M, depending on state revenue.
21
Unrestricted General Fund Estimate
2011-12 2011-12
Scenario 1 Scenario 2$349/ADA Less $844/ADA Less
Excess of revenues over (under) expenses 11,491,933$ (12,569,748)$ (30,497,827)$ Reductions Results from RBB Budgeting - 14,634,339 14,634,339
Subtotal 11,491,933$ 2,064,590$ (15,863,488)$
Less Non-Reoccurring Unrestr Gen Fund Rev Sources:1 Adult Education Tier 3 Flex Revenues (7,500,000) (4,500,000) (4,500,000) 2 Deferred Maintenance Tier 3 Flex Revenues (1,552,828) (1,552,828) (1,552,828) 3 State Loan to pay Debt Service for State Loan (2,094,903) - - 5 Reduction to RRMA Facilities Contribution (1,012,646) (1,012,646) (1,012,646) 6 One-Time Stimulus (SFSF) (1,741,186) - - 7 Mandated Costs (1,702,125) - - 8 E-Rate Revenues related to 2009-10 (1,795,074) - - 9 Increase Contrib. to Sped Ed Trans (Due to Pr Yr Exp not Accrued) 955,000 955,000 955,000
(16,443,762)$ (6,110,474)$ (6,110,474)$
Total Estimated Structural Deficit (4,951,829)$ (4,045,884)$ (21,973,962)$
Structural Deficit for Unrestricted General Fund Estimate2010-11
2nd Interim
Non-Reoccurring Unrestricted General Fund Rev/Exps
22
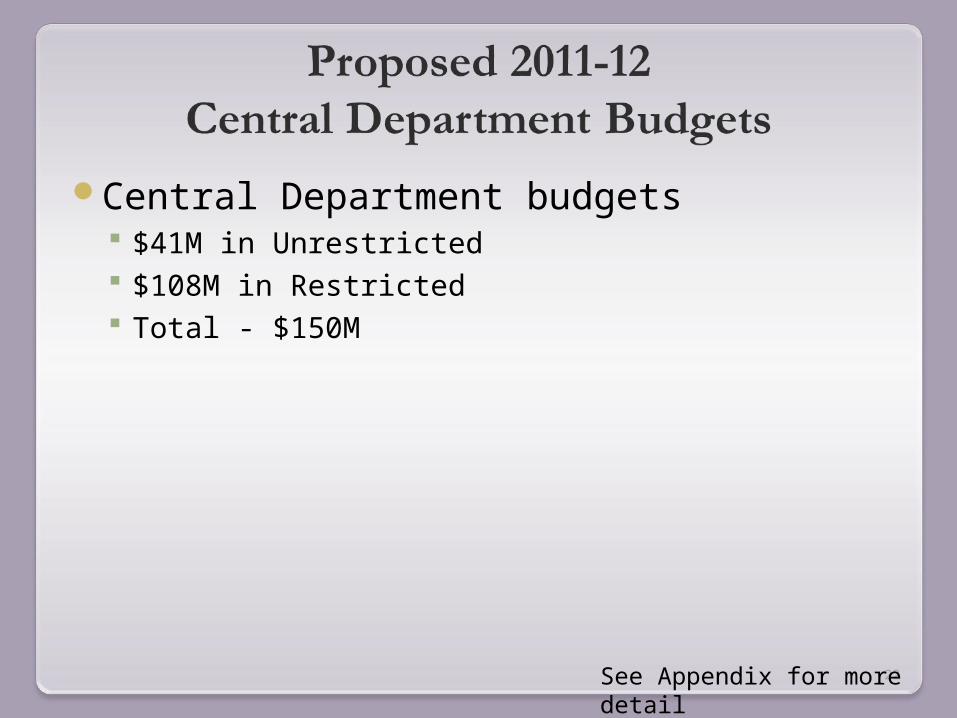
Central Department budgets $41M in Unrestricted $108M in Restricted Total - $150M
See Appendix for more detail

23
As of April 3, a total of $28.3M have been spent on consultants and contracted services.
Unrestr Restr TotalSchools 2,208,903$ 8,015,983$ 10,224,886$ Central 2,786,714 13,877,083 16,663,797 District Wide 1,443,456 - 1,443,456
6,439,073$ 21,893,065$ 28,332,138$ % of Prior Yr 69% 53% 56%
Consultants 5825,5826,5827, 5830 YTD 4-3-2011
OUSD Summary of Consultant Exps
Between 2008-09 and 2009-10, the dollars spent on consultants and contracted resources decreased by $6.8M, or 12%.
See Appendix for more detail
2424
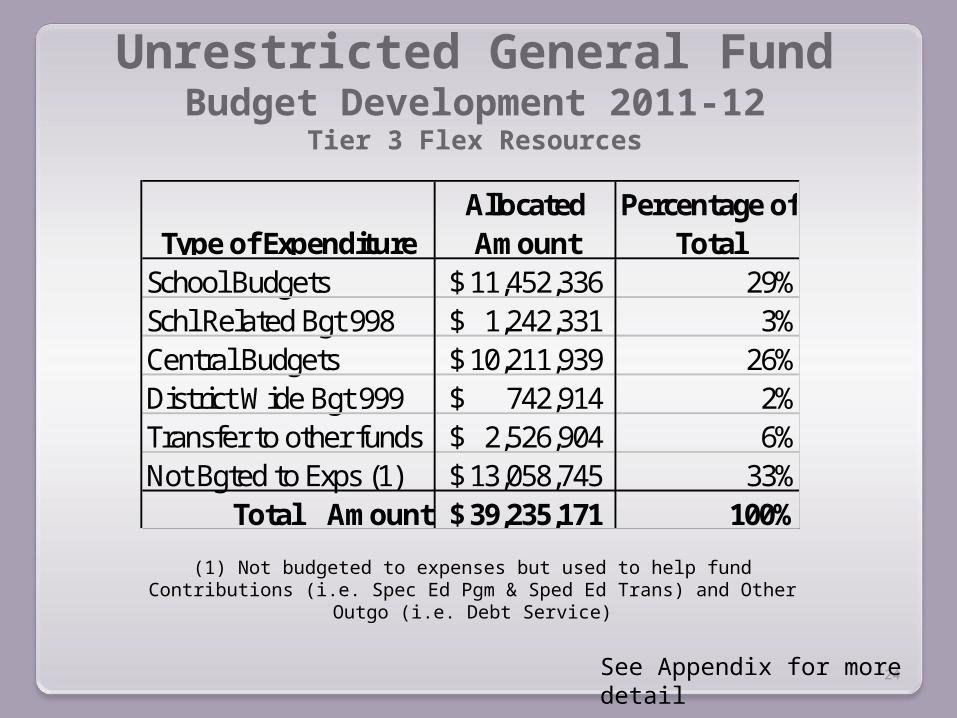
Unrestricted General FundBudget Development 2011-12
Tier 3 Flex Resources
See Appendix for more detail
(1) Not budgeted to expenses but used to help fund Contributions (i.e. Spec Ed Pgm & Sped Ed Trans) and Other Outgo (i.e. Debt Service)
Type of ExpenditureAllocated Amount
Percentage of Total
School Budgets 11,452,336$ 29%Schl Related Bgt 998 1,242,331$ 3%Central Budgets 10,211,939$ 26%District Wide Bgt 999 742,914$ 2%Transfer to other funds 2,526,904$ 6%Not Bgted to Exps (1) 13,058,745$ 33%
Total Amount 39,235,171$ 100%

25
Since 2002-03, our external auditors have identified findings totaling $23.93M. An additional $1.3M has been spent in fees to defend audits.
We are currently in the Education Audit Appeals Panel process to appeal a $1.3M finding from 2006-07 for administrator-teacher ratio. The remaining $2.1M is in federal findings.
The 2007-08 Audit is being finalized.See Appendix for more detail

2626
Unrestricted General FundBudget Development 2011-12
Ending Fund Balance
Ending Fund Balance 27,962,560$
Components of the Ending Fund Balance:Reserve for Economic Uncertainty 8,732,691$ Revolving Cash 150,000 Audit Findings & One-time Items 8,461,463 Designated for Deferred Pmts from The State 10,618,406
Total Ending Fund Balance 27,962,560$
Reserve for Economic Uncertainty is the 2% minimum required for OUSD
Unrestricted General Fund2010-11
2nd Interim

27
Increase Employee Compensation

2828

2929
Budget Development AssumptionsAchieving A Balanced Budget: Menu of Options2009-10 Teacher Turnover2011-12 Teacher Turnover: Changes in teacher FTE
and staff by siteMeasure G Revenues: Allocations MatrixImpact of Teacher LayoffsProposed Central Office Budgets: Allocations Matrix2010-11 Consultants/Contracted Services:
Historical comparison dataTier III Categorical Flexible Fund Allocations MatrixAudit Findings Overview


![OAKLAND UNIFIED SCHOOL DISTRICT (OUSD) Solar Master Plan · and KyotoUSA/HELiOS (2009) November 2011 OAKLAND UNIFIED SCHOOL DISTRICT (OUSD) Acknowledgements November 2011 [ 1 ] ACKNOWLEDGMENTS](https://img.dokumen.tips/doc/110x75/5fc024ce7d640e7e59179944/oakland-unified-school-district-ousd-solar-master-plan-and-kyotousahelios-2009.jpg)