Embed Size (px)
Citation preview
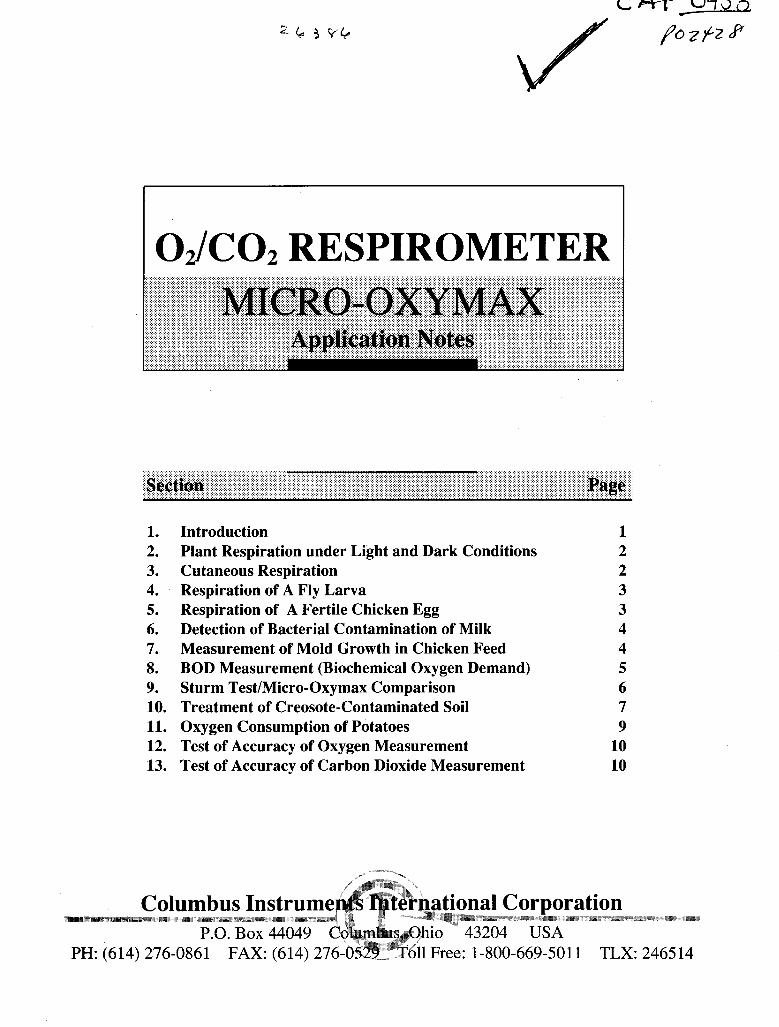
02/C02 RESPIROMETER
1. 2. 3. 4. 5. 6. 7. 8. 9. 10. 11. 12. 13.
Introduction Plant Respiration under Light and Dark Conditions Cutaneous Respiration Respiration of A Fly Larva Respiration of A Fertile Chicken Egg Detection of Bacterial Contamination of Milk Measurement of Mold Growth in Chicken Feed BOD Measurement (Biochemical Oxygen Demand) Sturm TestlMicro-Oxymax Comparison Treatment of Creosote-Contaminated Soil Oxygen Consumption of Potatoes Test of Accuracy of Oxygen Measurement Test of Accuracy of Carbon Dioxide Measurement
1 2 2 3 3 4 4 5 6 7 9
10 10
PH: (614) 276-0861 FAX: (614) 276- 1 Free: 1-800-669-50 1 1 TLX: 2465 14
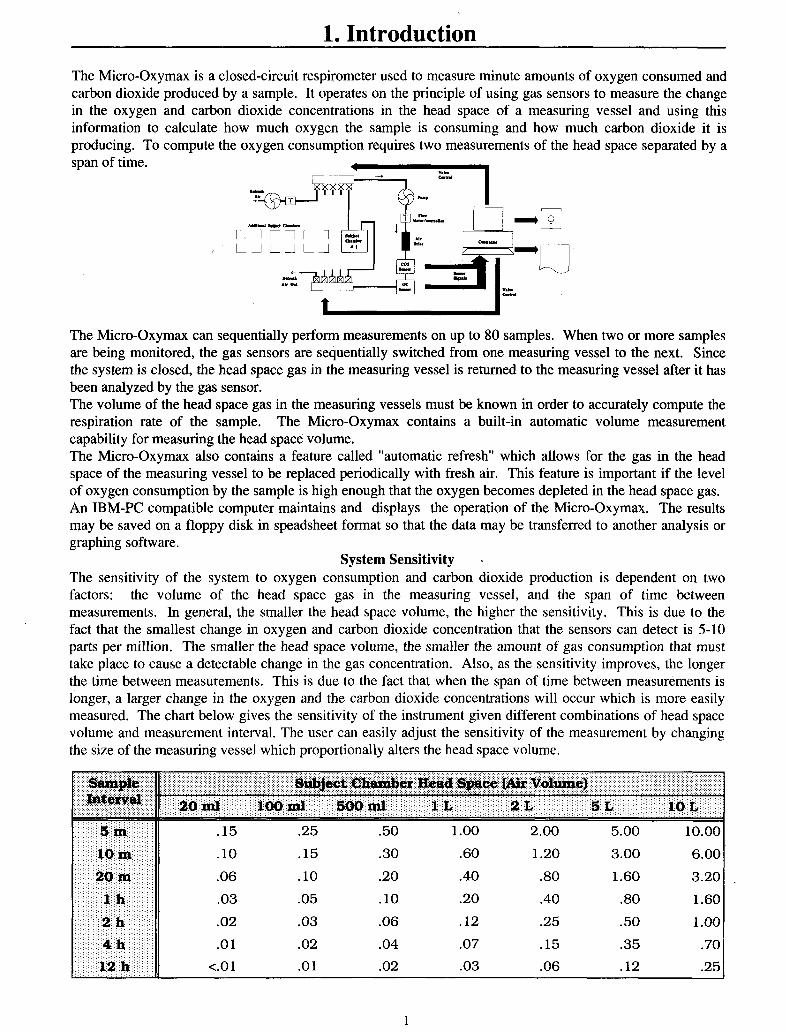
1. Introduction The Micro-Oxymax is a closed-circuit respirometer used to measure minute amounts of oxygen consumed and carbon dioxide produced by a sample. It operates on the principle of using gas sensors to measure the change in the oxygen and carbon dioxide concentrations in the head space of a measuring vessel and using this information to calculate how much oxygen the sample is consuming and how much carbon dioxide it is producing. To compute the oxygen consumption requires two measurements of the head space separated by a span of time.
The Micro-Oxymax can sequentially perform measurements on up to 80 samples. When two or more samples are being monitored, the gas sensors are sequentially switched from one measuring vessel to the next. Since the system is closed, the head space gas in the measuring vessel is returned to the measuring vessel after it has been analyzed by the gas sensor. The volume of the head space gas in the measuring vessels must be known in order to accurately compute the respiration rate of the sample. The Micro-Oxymax contains a built-in automatic volume measurement capability for measuring the head space volume. The Micro-Oxymax also contains a feature called "automatic refresh" which allows for the gas in the head space of the measuring vessel to be replaced periodically with fresh air. This feature is important if the level of oxygen consumption by the sample is high enough that the oxygen becomes depleted in the head space gas. An IBM-PC compatible computer maintains and displays the operation of the Micro-Oxymax. The results may be saved on a floppy disk in speadsheet format so that the data may be transferred to another analysis or graphing software.
The sensitivity of the system to oxygen consumption and carbon dioxide production is dependent on two factors: the volume of the head space gas in the measuring vessel, and the span of time between measurements. In general, the smaller the head space volume, the higher the sensitivity. This is due to the fact that the smallest change in oxygen and carbon dioxide concentration that the sensors can detect is 5-10 parts per million. The smaller the head space volume, the smaller the amount of gas consumption that must take place to cause a detectable change in the gas concentration. Also, as the sensitivity improves, the longer the time between measurements. This is due to the fact that when the span of time between measurements is longer, a larger change in the oxygen and the carbon dioxide concentrations will occur which is more easily measured. The chart below gives the sensitivity of the instrument given different combinations of head space volume and measurement interval. The user can easily adjust the sensitivity of the measurement by changing the size of the measuring vessel which proportionally alters the head space volume.
System Sensitivity .
1
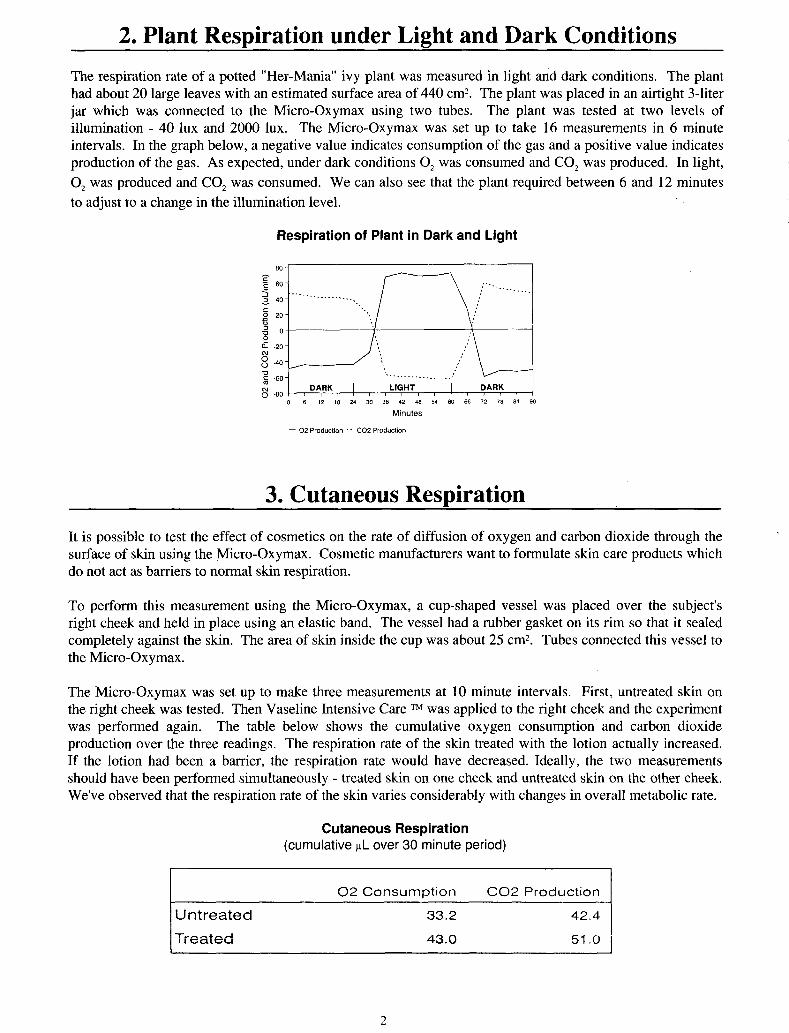
2. Plant Respiration under Light and Dark Conditions The respiration rate of a potted "Her-Mania" ivy plant was measured in light and dark conditions. The plant had about 20 large leaves with an estimated surface area of 440 cm2. The plant was placed in an airtight 3-liter jar which was connected to the Micro-Oxymax using two tubes. The plant was tested at two levels of illumination - 40 lux and 2000 lux. The Micro-Oxymax was set up to take 16 measurements in 6 minute intervals. In the graph below, a negative value indicates consumption of the gas and a positive value indicates production of the gas. As expected, under dark conditions 0, was consumed and CO, was produced. In light, 0, was produced and CO, was consumed. We can also see that the plant required between 6 and 12 minutes to adjust to a change in the illumination level.
Respiration of Plant in Dark and Light
Minutes
- 02 Production .. CO2 Production
3. Cutaneous Respiration It is possible to test the effect of cosmetics on the rate of diffusion of oxygen and carbon dioxide through the surface of skin using the Micro-Oxymax. Cosmetic manufacturers want to formulate skin care products which do not act as barriers to normal skin respiration.
To perform this measurement using the Micro-Oxymax, a cup-shaped vessel was placed over the subject's right cheek and held in place using an elastic band. The vessel had a rubber gasket on its rim so that it sealed completely against the skin. The area of skin inside the cup was about 25 cm2. Tubes connected this vessel to the Micro-Oxymax.
The Micro-Oxymax was set up to make three measurements at 10 minute intervals. First, untreated skin on the right cheek was tested. Then Vaseline Intensive Care TM was applied to the right cheek and the experiment was performed again. The table below shows the cumulative oxygen consumption and carbon dioxide production over the three readings. The respiration rate of the skin treated with the lotion actually increased. If the lotion had been a barrier, the respiration rate would have decreased. Ideally, the two measurements should have been performed simultaneously - treated skin on one cheek and untreated skin on the other cheek. We've observed that the respiration rate of the skin varies considerably with changes in overall metabolic rate.
Cutaneous Respiration (cumulative 1L over 30 minute period)
I 0 2 Consumption C 0 2 Production
33.2
43.0
42.4
s i .O
2

4. Respiration of A Fly Larva A study of the fly larva, Sarcophaga Crassipalpis, during diapause was performed to detect the periodic changes in 0, consumption which are characteristic of the larva. During diapause, the larva exhibits high rates of 0, consumption on some days, and on other days 0, consumption drops to very low levels (according to Denlinger et al., 1983). The periodicity is approximately 4 days.
This phenomenon was originally demonstrated using a Scholander respirometer which permitted measurements to be made only once per day due to its lower sensitivity. Also, the Scholander respirometer is not able to measure CO, production -- only 0, consumption. When the experiment was repeated using the Micro-Oxymax, measurements were made 6 times per day rather than once per day. The measurements continued to five days and the graph below shows the results.
Fly Larva Respiration I" I - 0 2 Consumption '. CO2 Production
3 2 3 4 5
Days during diapause.
The graph shows the end of one peak consumption period and another peak occurring about 4 days later. The results show that the swing in the CO, production rate is not as large as the swing in the 0, consumption rate. The average respiratory quotient during one full cycle was found to be 0.89.
5. Respiration of A Fertile Chicken Egg
The Micro-Oxymax may be used to monitor the development of chicken embryos, or to determine whether a particular embryo is alive, A fertile egg was tested throughout its 21 day gestation period for its level of 0, consumption and CO, production. The age of the egg at the start of the experiment was approximately 2 days. The egg was placed in a 1 liter jar. The jar was placed in an incubator set to 37.5"C. Each measurement consisted of two readings taken one half hour apart. The egg was tested at irregular intervals during the gestation period.
The table below shows the increase in respiration rate during the test period. 0, consumption was 2.2 pL/min and CO, production was 3.7 pL/min three days after the egg was laid. After 17 days, 0, consumption increased to 203.0 pL/min and CO, production increased to 209.8 pL/min. During the last few days of gestation, the respiration rate remained fairly constant.
Respiration of Chicken Embryo
I 02 ConsumDtion C02 Production
Day 3 5 11
12 i i
18 I 19
2.2 3.7
5.7 8.9
38.5 38.3
56.6 55.6
203.0 209.8
205.0 21 5.0
192.7 203.8
3
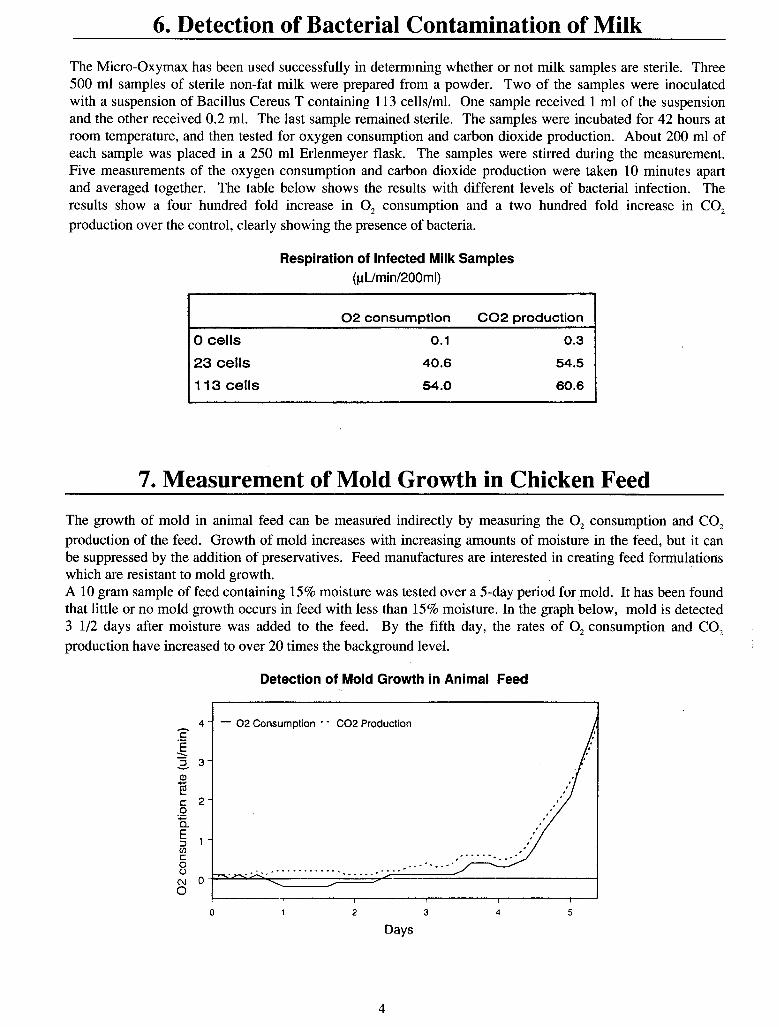
6. Detection of Bacterial Contamination of Milk
J
0 2 consumption C02 production
0 cells 0.1 0.3
23 cells 40.6 54.5
113 cells 54.0 60.6
The Micro-Oxymax has been used successfully in determining whether or not milk samples are sterile. Three 500 ml samples of sterile non-fat milk were prepared from a powder. Two of the samples were inoculated with a suspension of Bacillus Cereus T containing 113 cells/ml. One sample received 1 ml of the suspension and the other received 0.2 ml. The last sample remained sterile. The samples were incubated for 42 hours at room temperature, and then tested for oxygen consumption and carbon dioxide production. About 200 ml of each sample was placed in a 250 ml Erlenmeyer flask. The samples were stirred during the measurement. Five measurements of the oxygen consumption and carbon dioxide production were taken 10 minutes apart and averaged together. The table below shows the results with different levels of bacterial infection. The results show a four hundred fold increase in 0, consumption and a two hundred fold increase in CO, production over the control, clearly showing the presence of bacteria.
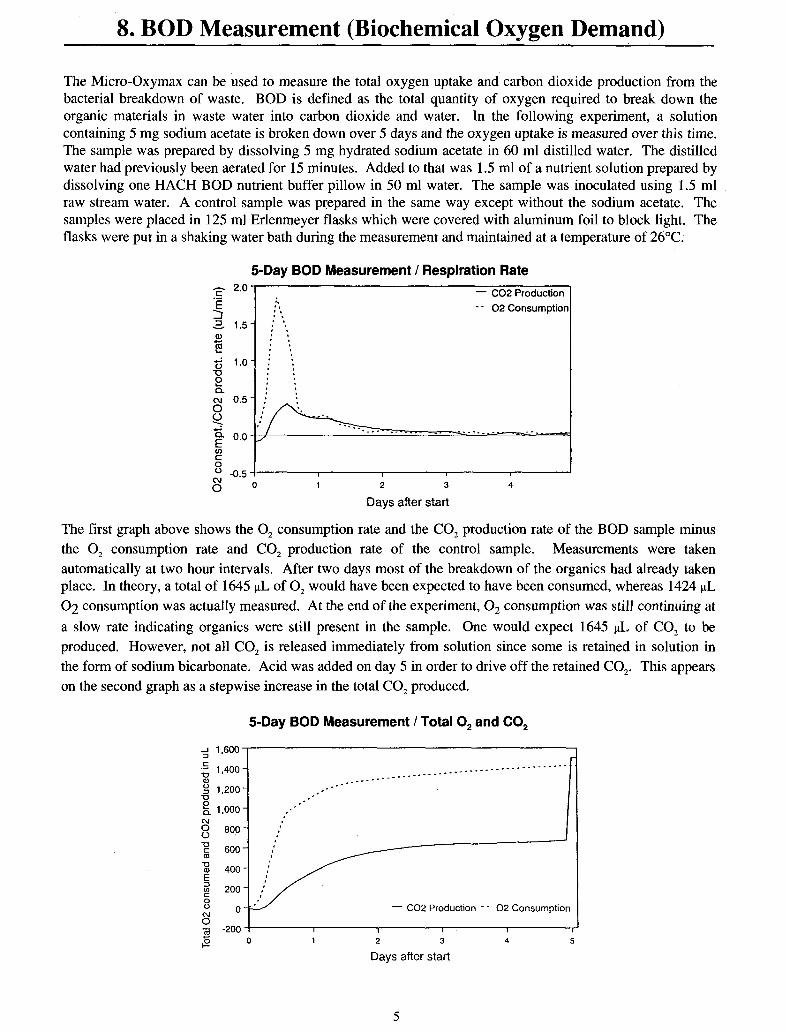
7. Measurement of Mold Growth in Chicken Feed The growth of mold in animal feed can be measured indirectly by measuring the 0, consumption and CO, production of the feed. Growth of mold increases with increasing amounts of moisture in the feed, but it can be suppressed by the addition of preservatives. Feed manufactures are interested in creating feed formulations which are resistant to mold growth. A 10 gram sample of feed containing 15% moisture was tested over a 5-day period for mold. It has been found that little or no mold growth occurs in feed with less than 15% moisture. In the graph below, mold is detected 3 1/2 days after moisture was added to the feed. By the fifth day, the rates of 0, consumption and CO, production have increased to over 20 times the background level.
Detection of Mold Growth in Animal Feed
- 0 2 Consumption - - C02 Production
0 1 2 3 4 5
Days
4
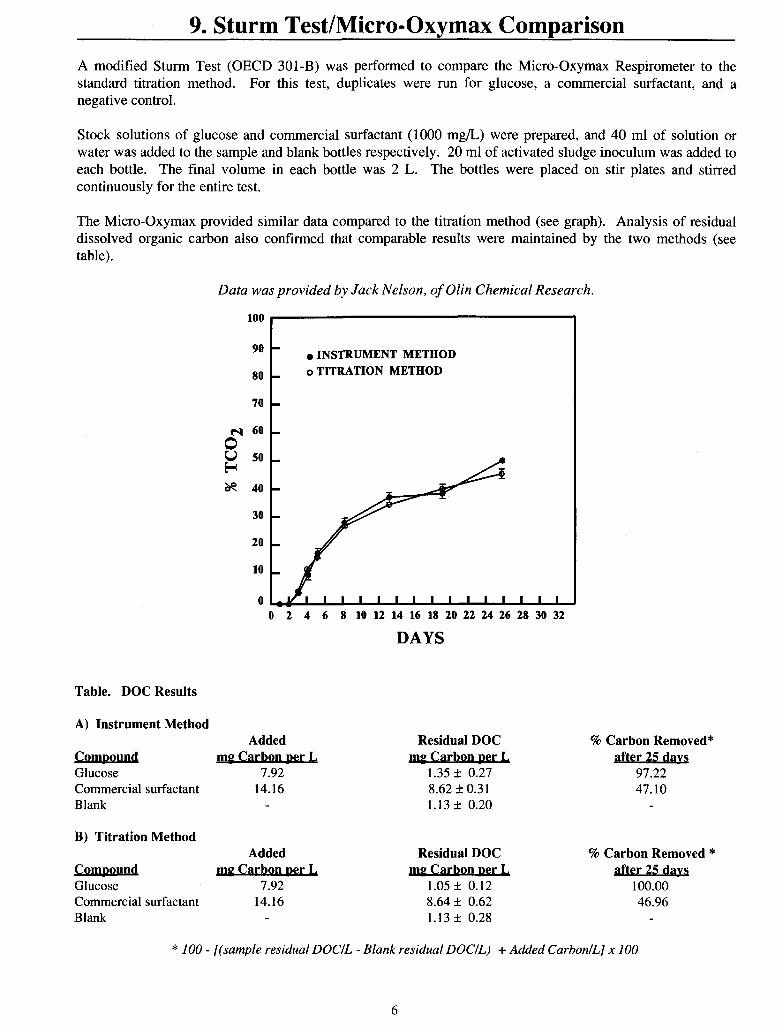
8. BOD Measurement (Biochemical Oxygen Demand)
The Micro-Oxymax can be used to measure the total oxygen uptake and carbon dioxide production from the bacterial breakdown of waste. BOD is defined as the total quantity of oxygen required to break down the organic materials in waste water into carbon dioxide and water. In the following experiment, a solution containing 5 mg sodium acetate is broken down over 5 days and the oxygen uptake is measured over this time. The sample was prepared by dissolving 5 mg hydrated sodium acetate in 60 ml distilled water. The distilled water had previously been aerated for 15 minutes. Added to that was 1.5 ml of a nutrient solution prepared by dissolving one HACH BOD nutrient buffer pillow in 50 ml water. The sample was inoculated using 1.5 ml raw stream water. A control sample was prepared in the same way except without the sodium acetate. The samples were placed in 125 ml Erlenmeyer flasks which were covered with aluminum foil to block light. The flasks were put in a shaking water bath during the measurement and maintained at a temperature of 26°C.
5-Day BOD Measurement / Respiration Rate - C02 Production - - 0 2 Consumptioi
2 1.5 a, c
' -0.5 I I , I g o 1 2 3 4
Days after start
The first graph above shows the 0, consumption rate and the CO, production rate of the BOD sample minus the 0, consumption rate and CO, production rate of the control sample. Measurements were taken automatically at two hour intervals. After two days most of the breakdown of the organics had already taken place. In theory, a total of 1645 pL of 0, would have been expected to have been consumed, whereas 1424 pL
0 2 consumption was actually measured. At the end of the experiment, 0, consumption was still continuing at a slow rate indicating organics were still present in the sample. One would expect 1645 pL of CO, to be produced. However, not all CO, is released immediately from solution since some is retained in solution in the form of sodium bicarbonate. Acid was added on day 5 in order to drive off the retained CO,. This appears on the second graph as a stepwise increase in the total CO, produced.
5-Day BOD Measurement I Total 0, and CO,
0 1 2 3 4 S ;r: @
Days after start
5
9. Sturm Test/Micro-Oxymax Comparison
90
80
70
crl 60 0
A modified Sturm Test (OECD 301-B) was performed to compare the Micro-Oxymax Respirometer to the standard titration method. For this test, duplicates were run for glucose, a commercial surfactant, and a negative control.
- - - -
Stock solutions of glucose and commercial surfactant (1000 mg/L) were prepared, and 40 ml of solution or water was added to the sample and blank bottles respectively. 20 ml of activated sludge inoculum was added to each bottle. The final volume in each bottle was 2 L. The bottles were placed on stir plates and stirred continuously for the entire test.
The Micro-Oxymax provided similar data compared to the titration method (see graph). Analysis of residual dissolved organic carbon also confirmed that comparable results were maintained by the two methods (see table).
-
-
Data was provided by Jack Nelson, of Olin Chemical Research.
loo I
Table. DOC Results
t
0 INSTRUMENT METHOD o TITRATION METHOD
0 2 4 6 8 10 12 14 16 18 20 22 24 26 28 30 32
DAYS
A) Instrument Method Added Residual DOC ?6 Carbon Removed*
m g Ca rbon Der L d b o n DerL after 25 Glucose 7.92 1.35 f 0.27 97.22 Commercial surfactant 14.16 8.62 f 0.31 47.10 Blank 1.13 f 0.20
B) Titration Method Added
ComDou nd mp C m De r L Glucose 7.92 Commercial surfactant 14.16 Blank
Residual DOC % Carbon Removed * mp Carbon Der L afkL2"
1.05 f 0.12 100.00 8.64 f 0.62 46.96 1.13 f 0.28
* 100 - [(sample residual DOCIL - Blank residual DOCIL) + Added CarbonlL] x 100
6

10. Treatment of Creosote-Contaminated Soil by Soil Washing and Slurry-Phase Bioreactors
Data was provided by J.D. Berg, T.E. Bennett, B.S. Nesgard of Aquateam - Norwegian Water Technology Centre and J.G. Mueller of SBP Technologies, Inc.
Abstracts Biological treatment of creosote contaminated soil and groundwater has been demonstrated previously. A pilot feasibility study to evaluate slurry treatment preceded by soil washing was initiated by the Norwegian State Railways (NSB). The preliminary bench scale degradation studies reported herein consisted of respirometric and soil slurry tests and microbial characterizations. Additions of nitrogen and phosphorus, and acclimated indigenous populations were sufficient to substantially enhance degradation of polycyclic aromatic hydrocarbons (PAH). PAH mineralization of >90% was achievable in 7 days at 20°C. The PAH-degrading cultures were closely related phylogenetically to organisms previously isolated in the U.S.A. The next phase of the study is a pilot scale soil washing (1000 kg/h) and bioslurry reactor test to be completed in 1993.
Introduction Creosote, derived from coal tar, has been used extensively on an industrial scale for over a century. Routine operations at older facilities, spillage, and improper disposal of creosote have resulted in the contamination of surface and subsurface soils and groundwater. Remediation is often required owing to the persistant, toxic, and carcinogenic nature of the components of creosote [I]. Biological degradation of creosote has recently been shown to be an effective means of treatment [2-61. Soils can be treated in solid phase or slurry phase aerobic reactors. Biological treatment has the advantages of producing no excessive residuals requiring downstream treatment and retaing a biologically active soil or sludge that can be disposed of at the site. The major disadvantage over other forms of treatment; such as incineration, is a generally longer treatment time. Soil washing is also a viable pre-treatment option for bioremediation for two reasons; first, the volume of material requiring treatment can be reduced by 80 - 90%, depending on the type of soil and contamination; second, in the case of slurry phase treatment, the washing step can function as the prerequisite mixing operation for microorganisms, nutrients, and contaminants.
Study Description The NSB owns several properties on which wood impregnation facilities were previously operated. Site characterization studies are underway. Preliminary results show that the primary contaminants in these soils are PAHs. No PCP or metals had been used at the wood impregnation facilities. In anticipation of a requirement of clean up, NSB, cooperating with Norwegian State Pollution Control Authorities (SFT), has initiated this study to evaluate soil washing plus bioremediation as a candidiate technology. The study consists of two phases. The first phase was the bench scale biotreatability studies entailed in this report, which also included microbial characteristics conducted by SBP Technologies, Inc. and the U.S. EPA at Gulf Breeze, Florida. The second phase is a pilot scale soil washing (1000 kg/h) and slurry reactor study which is underway, and is to be completed in 1993.
Methods The bench scale treatability tests included two steps. The first step was a series of screening tests using a Micro-Oxymax respirometer (Columbus Instruments, Columbus, Ohio, USA) in which head space levels of carbon dioxide (CO,) and oxygen (0,) were continuously monitored. Five percent solids in 100 ml of pH 7 buffered dilution water were used. Samples were mixed by moderate magnetic stirring. The purpose of these tests was to screen for inhibition, capability for degradation of contaminant by native organisms, and nutrient requirements. The second step employed bench scale, aerated slurry reactors (2 L) with pH control where operational parameters could be evaluated. A total of five soils were tested. Twenty percent soil slurries in 1 L of pH buffered dilution water were used. All test were conducted at 20°C . Soil samples were seived to 2 mm and stored at 4°C . PAH was extracted from the soil by four serial extractions using boiling cyclohexane. The total PAH values reported herein may be 2 - 5 times greater than those derived from the 16 component standard used by U.S. EPA (Method 8100). Work is underway to calibrate the two procedures so that the values can be compared.
7

The compounds were placed into four groups according to the number of aromatic rings, which also corresponds well with biodegradability: that is, as the group number increases, the biodegradability decreases [7]. In this study, Group 1 has 2 rings, Group 2 has 3 rings, Group 3 has 4 rings, and Group 4 has - > 5 rings. An example result from the respirometric screening tests is shown in Figure 1. In this experiment, the effect of added nitrogen and phosphorus at different concentrations is significantly different than the control.
60
50
40
30
20
10
200 250 300 350
- - - - -
0 . L
TIME (HOURS) - FLASK#l (CONTROL) - FLASK#3 (lox) -...=.* FLASK#2 (5X) 1"."-11.119 FLASK#4 (20X)
Figure 1. Cumulative respiration curves to evaluate effect of three different nutrient concentrations (5x, lox, 20x) in soil slurries containing 5 percent solids.
Results from another test in which the optimal nutrient concentration (5 x) plus addition of an acclimated culture are shown in Figure 2. In this case, over 94 percent degradation of the PAHs was attained with nutrient and inocula additions within 7 days, compared with approximately 20 percent in the control. Studies on the microbial ecology of the soils, especially regarding isolation of enhanced PAH degraders were done by SBP Technologies, Inc. and the U.S. EPA. The results showed that all five soils contained phenanthrene and fluoranthene degraders, and that the isolated PAH degraders were closely related phylogenetically to organisms that had been isolated earlier in the U.S.A.[8,9]
TIME (HOURS)
-FLASK#l (CONTROL) -cFLASK#Z (TREATED) -FLASKXI (CONTROL) -FLASK#t (TREATED)
Figure 2. Cumulative respiration (left panel) and PAH removal (right panel). Treated samples
8
References Mueller J.G., Chapman P.J., Pritchard P.H.: Creosote-contaminated sites, Environ. Sci. Technol., Edition number 10. Vol. 23, pp. 1197-1201 (1989). Blais L.: Pilot-scale biological treatment of contaminated groundwater at an abandoned wood treatment plant, Environmental Biotechnology: Reducing the risk from Environmental Chemicals through biotechnology. Ed. Omenn, G.S., New York, pp. 445-446 (1987). Bartha R.: Biotechnology of petroleum pollutant biodegradation, Microbial Ecology, Vol. 12, pp. 155-1 72 (1986). Mattews J.E.: Evaluation of full-scale in situ and ex situ bioremediation of creosote wastes, Symposium on Bioremediation of Hazardous Wastes, EPAs Biosystems Technology Development Program, Chicago, IL, May 5-6 (1 992). Stroo H.F., Smith J.R., Coover M.P., Kabrich R.A.: Bioremediation of hydrocarbon-contaminated solids using liquid/solids contact reactors, Remediation Technologies, Inc., 2241 9-72nd Avenue, Kent, WA 98032. Reineman J.A.: Field demonstration of the effectiveness of land application for the treatment of creosote- contaminated wastes, Environmental Biotechnology: Reducing the risk from Environmental Chemicals through biotechnology, Ed. Omenn, G.S., New York, pp. 459-460 (1 987). Mueller J.G., Chapman P. J., Pritchard P.H.: Biodegradation of creosote and pentachlorophenol in contaminated groundwater: Chemical and biological assessment, Appl. Environ. Microbiol., Edition number: 5. Vol. 57, pp.1277-1285 (1991). Mueller J.G., Chapman P.J., Pritchard P.H.: Action of a Fluoranthene-utilizing bacterial community on polycyclic aromatic hydrocarbon components of creosote, Appl. Environ. Microbiol., Edition number: 12.
Mueller J.G., Chapman P.J., Pritchard P.H.: Isolation and characterization of Fluoranthene-utilizing strain of Psuedomonas paucimobilis, Appl. Environ. Microbiol., Edition number: 4. Vol. 56, pp. 1079-1 086
Vol. 55, pp. 3085-3090 (1989).
(1990).
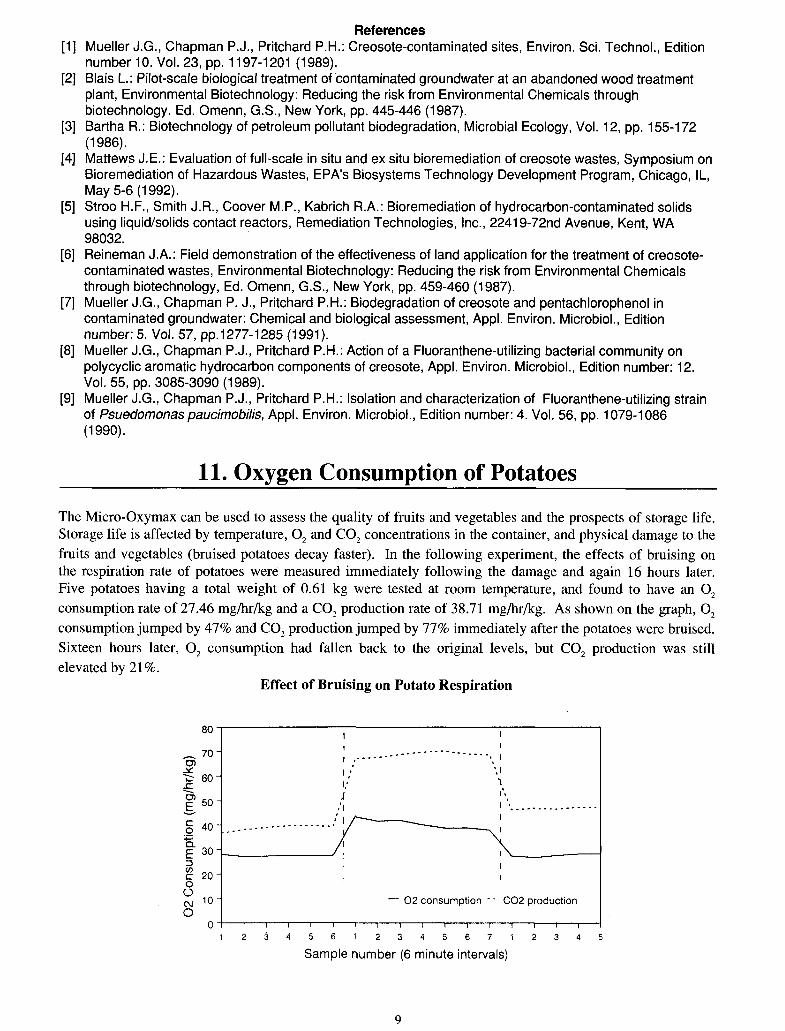
The Micro-Oxymax can be used to assess the quality of fruits and vegetables and the prospects of storage life. Storage life is affected by temperature, 0, and CO, concentrations in the container, and physical damage to the fruits and vegetables (bruised potatoes decay faster). In the following experiment, the effects of bruising on the respiration rate of potatoes were measured immediately following the damage and again 16 hours later. Five potatoes having a total weight of 0.61 kg were tested at room temperature, and found to have an 0, consumption rate of 27.46 mg/hr/kg and a CO, production rate of 38.71 mg/hr/kg. As shown on the graph, 0, consumption jumped by 47% and CO, production jumped by 77% immediately after the potatoes were bruised. Sixteen hours later, 0, consumption had fallen back to the original levels, but CO, production was still elevated by 2 1 %.
Effect of Bruising on Potato Respiration
I I
1 I
- 02 consumption - - C02 production
1 2 3 4 5 6 1 2 5 4 5 6 i i 2 3 4 5
Sample number (6 minute intervals)
9
12. Test of Accuracy of Oxygen Measurement The accuracy with which the Micro-Oxymax measures oxygen consumption was checked using a fuel cell which consumed oxygen at a precisely known rate. It is known that the reaction which takes place in the cell produces four electrons for every oxygen molecule consumed. By measuring the electric current generated by the cell, the rate of oxygen consumption can be precisely calculated.
A fuel cell was placed in a 250 ml flask which was connected to the Micro-Oxymax system. The fuel cell was connected to an electronic galvanometer outside the flask using two wires passed through an airtight connection on the stopper. The flask was sealed except for two tubes leading to the Micro-Oxymax. The system was set up to take 5 readings at 15 minute intervals. The current produced by the fuel cell was recorded by the operator at the time of the oxygen measurement. The table below shows the results.
Accuracy of Oxygen Measurement (0, Consumption of Fuel Cell in plfmin)
Current (mA) Expected 0 2 Actual 0 2 Error (%)
1 1.103 3.844 3.853 0.2
2 1.096 3.820 4.032 5.5
3 1.104 3.847 3.870 0.6
4
5 0.3
1 .lo4 3.847 3.930
1 .lo3 3.844 3.857
The largest error seen in this experiment is 5.5% and the average error is 1.8%. The expected noise in the readings given the size of the measuring vessel and the sampling time interval is +/-0.15 lL/min. (+/- 3.9%). In addition, the system has a maximum span error of +/- 2%. The sum of these two types of error is +/- 5.9%. All the readings had errors less than this value. The accuracy of this measurement could have been improved by using a longer sample interval or a smaller measuring vessel.
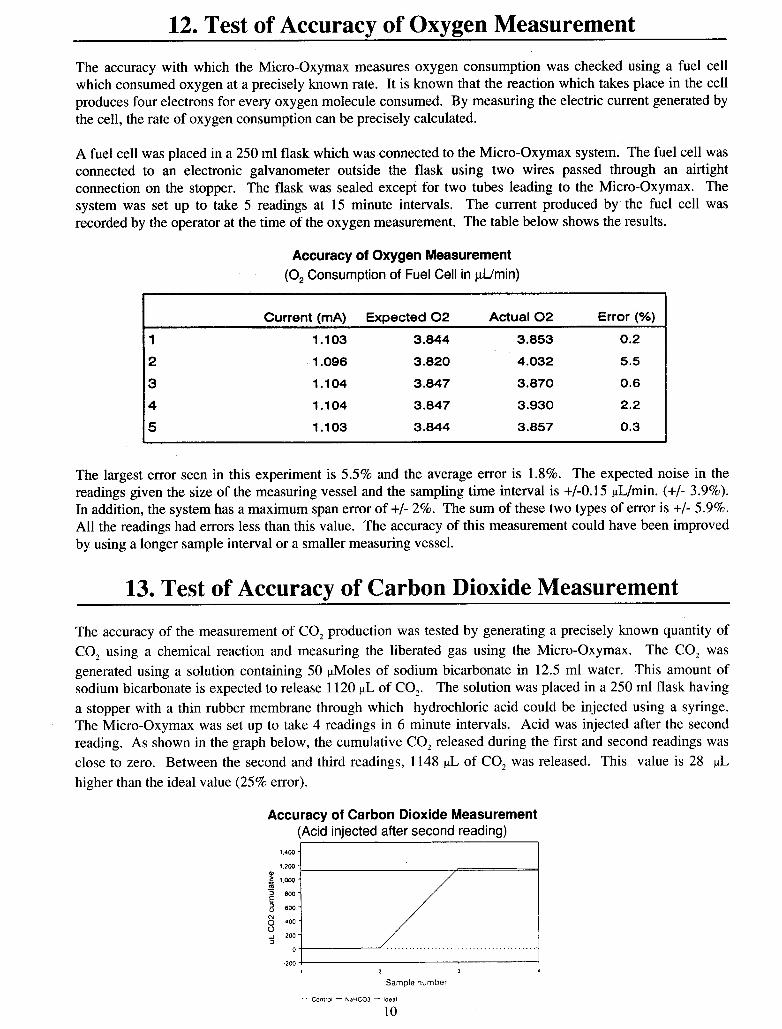
13. Test of Accuracy of Carbon Dioxide Measurement
The accuracy of the measurement of CO, production was tested by generating a precisely known quantity of CO, using a chemical reaction and measuring the liberated gas using the Micro-Oxymax. The CO, was generated using a solution containing 50 pMoles of sodium bicarbonate in 12.5 ml water. This amount of sodium bicarbonate is expected to release 1120 FL of CO,. The solution was placed in a 250 ml flask having a stopper with a thin rubber membrane through which hydrochloric acid could be injected using a syringe. The Micro-Oxymax was set up to take 4 readings in 6 minute intervals. Acid was injected after the second reading. As shown in the graph below, the cumulative CO, released during the first and second readings was close to zero. Between the second and third readings, 1148 pL of CO, was released. This value is 28 pL higher than the ideal value (25% error).
Accuracy of Carbon Dioxide Measurement (Acid injected after second reading)
m
$ 600
- a 800
.I"" I
2 I
Sample number
.. cantroi - N ~ H C O J - ideal
10
THE MICRO-OXYMAX 02/C02 RESPIROMETER IS NOW PATENTED
On August 7, 1990 inventors Leif Nennerfelt and Jan Czekajewski were granted a U.S. patent (No. 4,947,339) extending patent protection for the Micro-Oxymax O,/CO, Respirometer manufactured on license by Columbus Instruments International Corporation.
European and Japanese patents are pending.
The Commissioner of Patents and Trademarks
Bulk Rate US Postage
PAID Columbus, Ohio
Permit No. NM467
TO: