Embed Size (px)
Citation preview

Investor Roadshow 2018Mark Peterson, CEOGraham Law, CFO
Forward-Looking Statement This presentation contains forward-looking statements, which often include words such as expects, anticipates, believes, intends, plan,
continue or other similar words in discussion of future operating or
financial performance. These forward-looking statements are based on the Board and managements’ present expectations, estimates
and assumptions regarding its business, performance and the current state of the markets in which it operates. As with any
forecast or projection, forward-looking statements are inherently
subject to risks, uncertainties and changes in circumstances. NZX’s actual results may vary materially from what is expressed or implied
in its forward-looking statements. Any forward looking statements contained in this presentation are relevant as at the date of this
presentation. Except as required by law, NZX assumes no obligation
to update or revise the content to reflect any changes in circumstances.

Benefits of Investing in New Zealand
• Trusted business environment – 1st of 190 economics for ease of doing business
• Sound macro base – low inflation, strong banking sector, flexible exchange rate
• Simple tax structure
• Priority investment sectors – primary, tourism, infrastructure, manufacturing
• Exchange connected across multiple asset classes
• 1st exchange in the world to open
• 2nd highest P/E ratio in Asia pacific
• 22% S&P/NZX 50 return in 2017
3

ü Dairy Derivatives
ü Debt
ü Environmental & Energy
ü SuperLife
ü Smartshares
ü Wealth Technologies
ü Efficiencies
ü CAPEX
ü Dividend
New Zealand’s Exchange
Core Market Growth Opportunities Maximise Options Get Fit
More Investable Product Deeper Liquidity Levels Greater Participation Rates Global Presence
Our Refreshed Strategy
ü Equity, Debt & Funds listings
ü Energy Market
ü Fonterra Shareholders’ Market
Our Vision
4

Strategy Resulted in Fundamental Reset of NZX • Rigorous review of business by board and
management, market consultation with more than 200 stakeholders, global analysis of peers
• Refreshed leadership team to ensure right skill set, team now in place
• Organisational principles aligned to the customer
• Resources reallocated to high value areas
• KPIs, remuneration, reward and recognition programme aligned to delivery
• Culture shift evident in improved employee engagement survey
5

Full Year 2017 Results Highlights
* Excluding impact of 2016 Agri disposals** Operating earnings are before net finance expense, income tax, depreciation, amortisation and impairment, adjustment to
provision for earnout, gain and loss on disposal of business and property, plant and equipment
NPAT
$14.8
61.6%million
Operating earnings**
$29.0
31.3%*
million
Funds under management
$2.7
25.8 %billion
Dairy derivatives
311,675
57.2%
Lots traded
Revenue
1.1%*
Expenses
11.6%*
Dividend
6.1Cents per share
2018 Guidance
$28 – $31 million
6
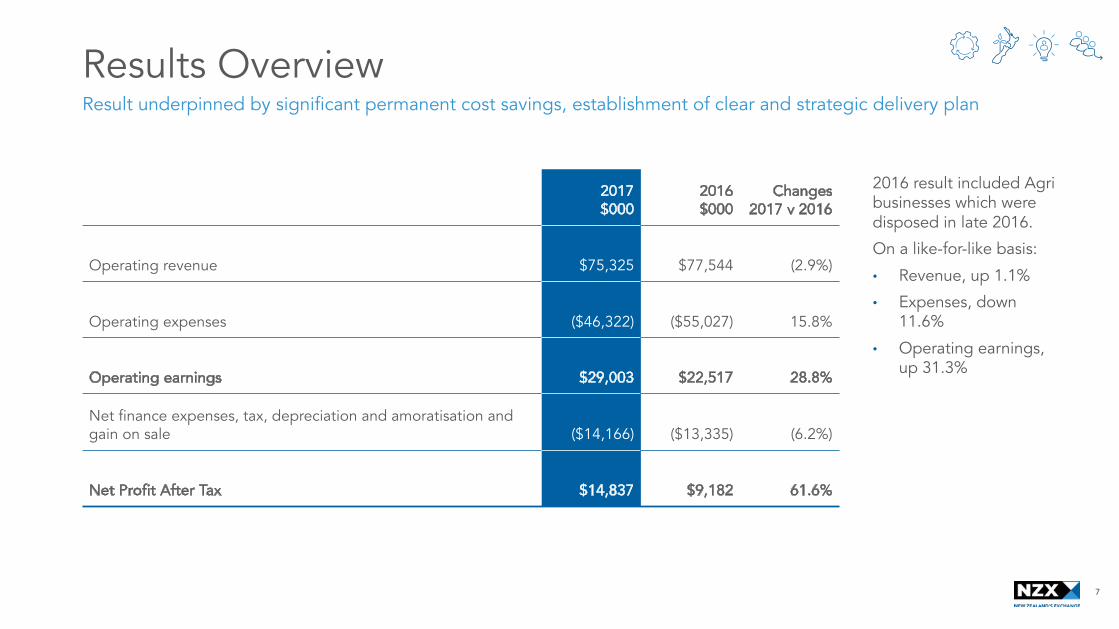
Results Overview
2016 result included Agri businesses which were disposed in late 2016.
On a like-for-like basis:
• Revenue, up 1.1%
• Expenses, down 11.6%
• Operating earnings, up 31.3%
Result underpinned by significant permanent cost savings, establishment of clear and strategic delivery plan
2017$000
2016$000
Changes2017 v 2016
Operating revenue $75,325 $77,544 (2.9%)
Operating expenses ($46,322) ($55,027) 15.8%
Operating earnings $29,003 $22,517 28.8%
Net finance expenses, tax, depreciation and amoratisation and gain on sale ($14,166) ($13,335) (6.2%)
Net Profit After Tax $14,837 $9,182 61.6%
7

8
2017 Revenue Overview NZX has a diversified revenue base
Annual Listing Fees 14%
Initial Listing Fees 1%
Secondary and Issuer Services 4%
Other Issuer Services 1%
Contractual and Development 13%
Participant Services 5%
Securities Trading 8%
Securities Clearing 8%Dairy Derivatives 2%
Terminal Royalties 8%
Subscriptions and Licences 5%
Dairy Data Subscriptions and Other 1%
SuperLife 10%
Smartshares 7%
Wealth Technologies 2%
Publishing Revenue 7%Agri Data (Non-Dairy) 4%
Issuer Relationships
33%
Secondary Markets
23%
Data & Insights
14%
Funds Services
19%
Agri 11%
8
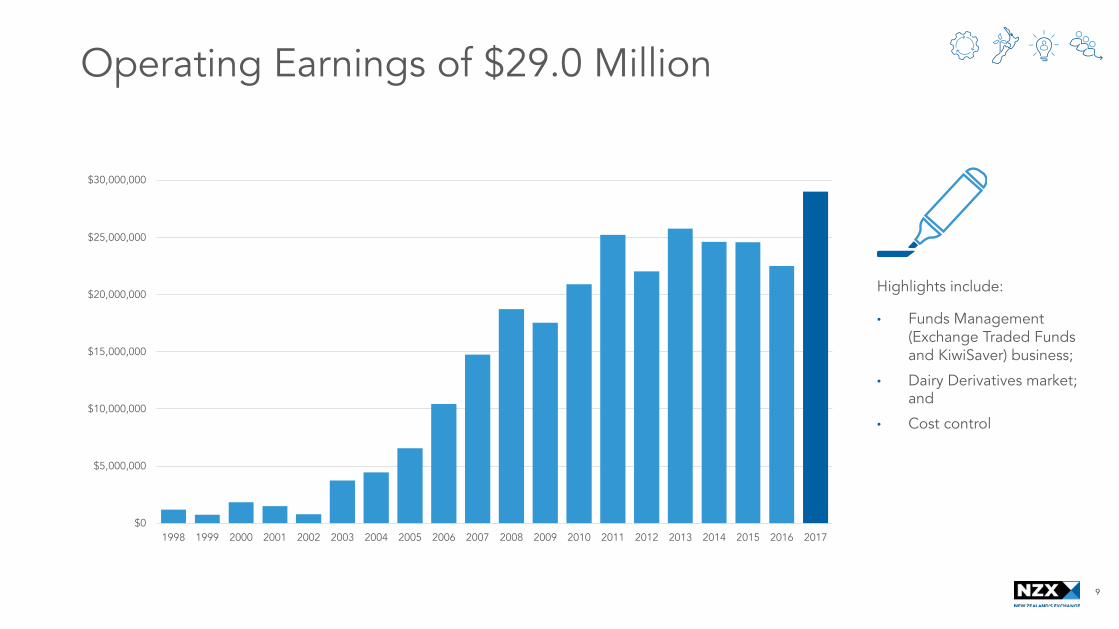
Operating Earnings of $29.0 Million
Highlights include:
• Funds Management (Exchange Traded Funds and KiwiSaver) business;
• Dairy Derivatives market; and
• Cost control
$0
$5,000,000
$10,000,000
$15,000,000
$20,000,000
$25,000,000
$30,000,000
1998 1999 2000 2001 2002 2003 2004 2005 2006 2007 2008 2009 2010 2011 2012 2013 2014 2015 2016 2017
9

Operating Earnings Waterfall
19,000
21,000
23,000
25,000
27,000
29,000
31,000
FY20
16 O
perati
ng Earn
ings
Annua
l List
ing Fe
es
IPOs a
nd Se
cond
ary Li
sting
s
Regula
tory
Servi
ces
EA (Dev
elopmen
t) Rev
enue
Parti
cipan
t Ser
vices
Trad
ing an
d Clea
ring
Dairy D
eriva
tives
Term
inals
Reven
ue
Data an
d Subsc
riptio
ns (in
cluding
Dair
y Data
)
Fund
s Man
agem
ent G
rowth
FMCA C
omplia
nce C
ost Sa
vings
Wea
lth Te
chno
logies FU
A and d
eferre
d Go-Li
ve Agri
Cost Sa
vings (
includ
ing Rale
c and
CEO Tr
ansit
ion Cos
ts)
Cost Inc
reas
es (in
cluding
one
off ite
ms)
FY20
17 O
perati
ng Earn
ings
$000
Corporate
Issuer Relationships
Secondary Markets Data & Insights
Fund Services
10

Operating Earnings – Divisional Results (from EBITDA)
Core Markets:• Issuer Relationships operating earnings $17.7
million (2016: $19.8 million) reduced due to lower initial listing and secondary issuance fees
• Secondary Markets operating earnings $12.3 million (2016: $11.4 million) increase driven by dairy derivatives
• Data & Insights operating earnings $10.0 million (2016: $9.9 million), increased subscription and license revenue offset by increased personnel costs which are no longer being shared with Agri
Funds Services:
• Funds Management operating earnings $4.4 million (2016: $1.1 million) reflects growth in FUM and completion in 2016 of FMCA compliance project
• NZX Wealth Technologies (NZX WT) operating earnings $(1.7) million (2016: $(1.4) million). Core platform development expected to complete Q2 2018. Large client to go-live Q3 2018
Agri:• Operating earnings improved due to 2016
disposals and the improved performance of Farmers Weekly
Year ended 31 December 2017Core
Markets$000
Agri$000
Funds Services
$000Corporate
$000Total$000
Operating revenue 52,350 8,184 14,791 - 75,325
Operating expenses (12,317) (6,427) (12,066) (15,512) (46,322)
Operating earnings 40,033 1,757 2,725 (15,512) 29,003
Year ended 31 December 2016Core
Markets$000
Agri$000
Funds Services
$000Corporate
$000Total$000
Operating revenue 53,574 10,938 13,032 - 77,544
Operating expenses (12,442) (10,148) (13,348) (19,089) (55,027)
Operating earnings 41,132 790 (316) (19,089) 22,517
11

Executing the Strategy
Reshaping our business
• Full strategy reset – focus back on core markets business, divestment of non-core components, maximising value of options businesses (SuperLife, Smartshares and Wealth Technologies)
• Relentless focus on costs, efficiency improvement
• Re-orientation of culture to the customer, creation of sales and growth focused team
Advancing the market structure
• New Zealand market structure and rule set must promote integrity assist in delivering more investable product, deeper liquidity levels and greater participation rates
• Imperative that NZX progress initiatives to grow the market
Global exchange partnerships
• Step change for NZX
• Shift focus away from regional stock exchange model to global exchange partnerships
• Offering value to current and prospective issuers, increased access for investors
12

Executing the Strategy for Growth Rebuilding a strong foundation in the Core Market
Core Market
Issuer Relationships
Secondary Market
Data & Insights
Customer engagement Relationship managers appointed, more than 170 customers meetings completed, 100% issuer contact on target for end of Q1 2018
Framework More than 70 listing review rules submissions received
Product suite Engagement, consultation and marketing collateral in progress
Sales Engagement underway, first new participant on target for Q2 2018
Increase on-market liquidity
Revised trading and clearing pricing structure will be implemented alongside rule changes to be consulted on in Q2 2018. NZX remains commitment to delivering a pricing and rule structure that promotes on-market liquidity
On-market average daily value traded 50.4% in January 2018
Additional electronic trading clients added
FunctionalityDairy derivatives functionality on track for March 2018
Consultation underway for 2019 system upgrade
Post trade Default fund consultation complete
Internal Internal data process in place, data being delivered
B2B Account planning underway
End user Scoping of PRA complete, moving into development phase
Capability Scoping for capability requirements underway
13

Executing the Strategy for Growth Growing opportunities and maximising options that will continue to drive growth
Growth opportunities
Spotlight on Dairy Derivatives
Maximiseoptions
2018 volume target range400,000 – 500,000 lots
Smartshares & SuperLife
Wealth Technologies
2018 target FUM growth plus 7%
Expand global accessNew calendar spread functionality March 2018, extended trading hours July 2018, options enhancements on track for second half of 2018
Boost sales and marketing
Additional New Zealand based FTE almost finalised, Asia office on target for second half of 2018, new website on target mid-2018
Extend product set Skim Milk Powder Options launched December 2017, US Lactose consultation underway
Grow end users
Engaging with third party distributors, retail investor portal launched December 2017, SuperLife website launched February 2018
Smartshares direct applications up 84%, unitholders up 37.6%
Cross-sell Ongoing discussion with third party distributors
Go-live Core platform development expected to be completed Q2 2018. Large customer to go-live Q3 2018
14

• Create scale via global exchanges alliance model
• Major step change for NZX, shift focus away from regional stock exchange model to create partnerships with global exchanges who are committed to promoting confidence and co-operation in their respective markets
• Already executing on this vision:
• Memorandum of Understanding signed with Hong Kong Exchanges and Clearing Limited (HKEX) in January
• Memorandum of Understanding signed with Singapore Exchanges Limited (SGX) in March
• Further Memorandum of Understandings to follow
• Under the terms, NZX will promote market development initiatives across a range of areas, share relevant information, and partner on green finance and sustainability initiatives
• Customers will benefit from the increased international presence of our exchange, including access into new markets for issuers, better connection points and capital flows for participants, and a broader product offering for investors
• Additionally, it provides NZX with opportunities to promote Smartshares exchange traded funds and the dairy derivatives market
• Next steps are a Stock Connect Agreement to operationalise the strategy
Global exchange partnershipsBreaking away from the regional exchange model
15

Core Market
16
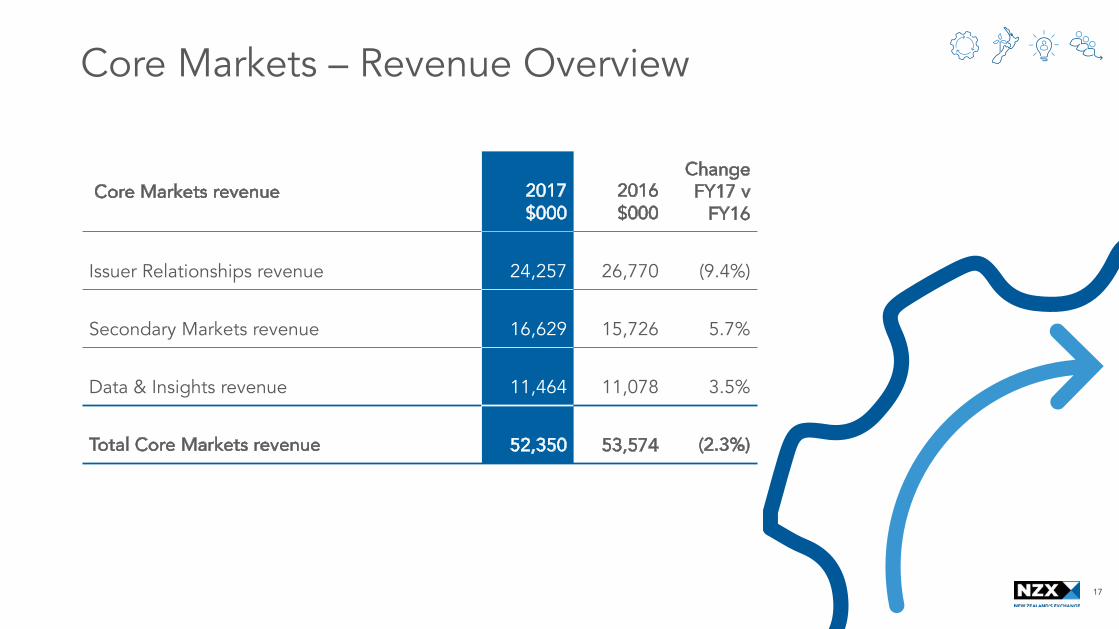
Core Markets – Revenue Overview
Core Markets revenue 2017$000
2016$000
Change FY17 v
FY16
Issuer Relationships revenue 24,257 26,770 (9.4%)
Secondary Markets revenue 16,629 15,726 5.7%
Data & Insights revenue 11,464 11,078 3.5%
Total Core Markets revenue 52,350 53,574 (2.3%)
Core Markets – Revenue Overview
Core Markets revenue 2017$000
2016$000
Change FY17 v
FY16
Issuer Relationships revenue 24,257 26,770 (9.4%)
Secondary Markets revenue 16,629 15,726 5.7%
Data & Insights revenue 11,464 11,078 3.5%
Total Core Markets revenue 52,350 53,574 (2.3%)
17

Issuer Relationships Create a compelling and attractive proposition for our issuing customers
Revenue 2017$000
2016$000
Change FY17 v FY16
Issuer Relationships
Annual listing fees 10,280 9,226 11.4%
Initial listing fees 931 2,330 (60.0%)
Secondary issuance fees 2,696 3,341 (19.3%)
Other issuer services 586 1,144 (48.8%)
Development revenue 428 1,493 (71.3%)
Contractual revenue 9,336 9,236 1.1%
Total Issuer Relationships revenue 24,257 26,770 (9.4%)
Strategic metricsNumber of listed issuers 223 232 (3.9%)
Equity market capitalisation 135.2 billion 115.5 billion 17.1%
Debt market capitalisation 26.4 billion 25.7 billion 2.7%
Number of new equity listings 1 7 (85.7%)
Number of new debt listings 20 37 (45.9%)
Value of new equity listed 0.48 billion 2.1 billion (77.1%)
Value of new debt listed 3.2 billion 6.4 billion (50.0%)
Total secondary capital raised 4.4 billion 4.6 billion (4.3%)
Issuer Fees
$-
$2,000
$4,000
$6,000
$8,000
$10,000
$12,000
$14,000
$16,000
Annual Initial Secondary
Notes
• Annual listing fee growth from increase in number and value of listed debt instruments and equity market capitalisation
• Substantial listing of new debt in 2016 not fully replicated in 2017
• Other issuer services revenue relates to activities undertaken by NZX Regulation
• Contractual and development revenue relates to the operation of electricity market (under contract from Electricity Authority) and Fonterra Shareholders' Market (under contract from Fonterra)
18

Secondary Markets
Notes
• Impact of pricing trial (aimed at increasing electronic trading flow) is reflected in 2017, number of trades out pace actual value traded
• Trial did not include a fixed per trade fee component, increase in number of trades does not reflect revenue collected
*Please note Dairy Derivatives revenue and trading lots are included in Growth Opportunities on page 18
Revenue 2017$000
2016$000
Change FY17 v FY16
Secondary Markets
Participant services revenue 3,768 3,592 4.9%
Securities trading revenue 5,817 5,765 0.9%
Securities clearing revenue 5,911 5,663 4.4%
Dairy derivatives revenue 1,133 706 60.5%
Total Secondary Markets revenue 16,629 15,726 5.7% Strategic metrics
Number of trades 2.05 million 1.75 million 17.1%
Total value traded 44.0 billion 44.0 billion -
Dairy lots traded 311,675 198, 303 57.2%
Number of participants 36 35 2.9%
RevenueValue and Volume Traded
$-
$5.00
$10.00
$15.00
$20.00
$25.00
$30.00
$35.00
$40.00
$45.00
$50.00
0
500,000
1,000,000
1,500,000
2,000,000
2,500,000
2008 2009 2010 2011 2012 2013 2014 2015 2016 2017
Valu
e Tr
aded
($bi
llion
)
Num
ber o
f Tra
des
on S
X, A
X, D
X, N
XT
Number of Trades on SX, AX, DX, NXT Value Traded ($billion) SX, AX, DX, NXT
19
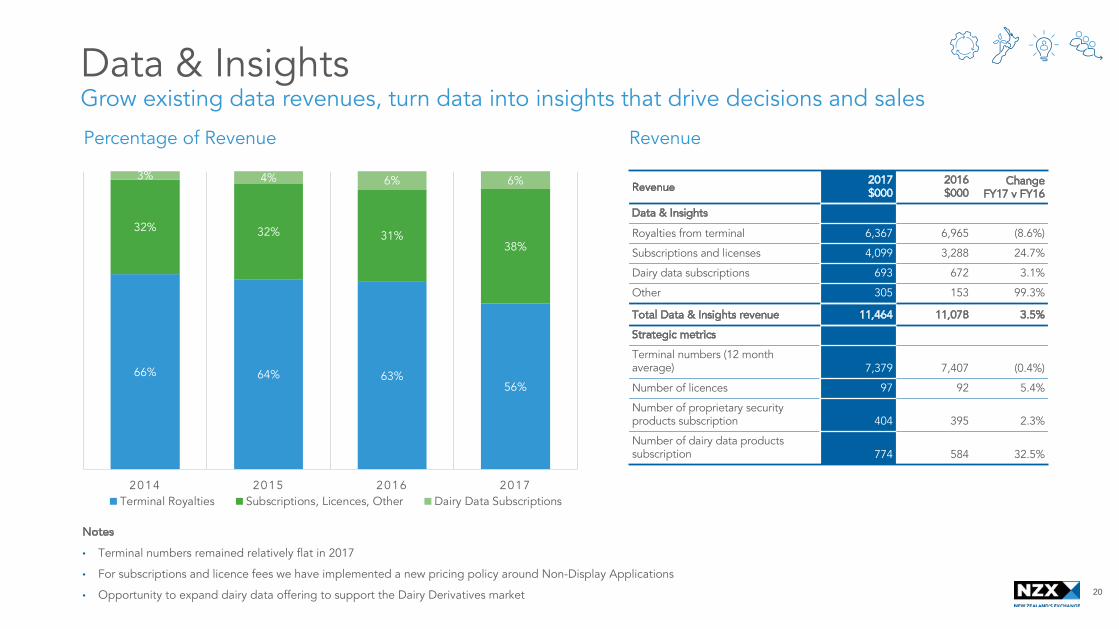
Notes
• Terminal numbers remained relatively flat in 2017
• For subscriptions and licence fees we have implemented a new pricing policy around Non-Display Applications
• Opportunity to expand dairy data offering to support the Dairy Derivatives market
Revenue 2017$000
2016$000
Change FY17 v FY16
Data & Insights
Royalties from terminal 6,367 6,965 (8.6%)
Subscriptions and licenses 4,099 3,288 24.7%
Dairy data subscriptions 693 672 3.1%
Other 305 153 99.3%
Total Data & Insights revenue 11,464 11,078 3.5% Strategic metrics
Terminal numbers (12 month average) 7,379 7,407 (0.4%)
Number of licences 97 92 5.4%
Number of proprietary security products subscription 404 395 2.3%
Number of dairy data products subscription 774 584 32.5%
RevenuePercentage of Revenue
66% 64% 63%56%
32% 32% 31%38%
3% 4% 6% 6%
2014 2015 2016 2017Terminal Royalties Subscriptions, Licences, Other Dairy Data Subscriptions
Data & InsightsGrow existing data revenues, turn data into insights that drive decisions and sales
20

Grow opportunities aligned to New Zealand
21

Dairy Derivatives
• Record volume traded up 57.2% on 2016, directly translated into revenue growth of 60.5% to $1.13 million
• Number of active traders up 60% on prior year (note this excludes the additional users from the 15 omnibus accounts)
• Executing on our final initiatives will accurate market to scale
• Expand global access
• Bolster sales and marketing
• Extend product set
• Capital efficiency
• Already delivering – product suite extended, announced trading hours extension and further trading functionality
NZX Dairy Derivatives Yearly Volumes Traded and Revenue
$-
$200
$400
$600
$800
$1,000
$1,200
-
50,000
100,000
150,000
200,000
250,000
300,000
350,000
2010 2011 2012 2013 2014 2015 2016 2017
Reve
nue
$000
Lots
Tra
ded
Volume traded Revenue
Accelerate our dairy derivatives market to scale, support New Zealand’s position as a global leader
22

0.2 million 0.3 million 0.45 million0.67 million
1.01 million1.5 million
2.25 million*
~14 million
~28 million
~43 million
FY2016 FY2017 FY2018 FY2019 FY2020 FY2021 FY2022
Rapid growth towards significant end game
Source: Euronext; Bursa Malaysia; NZX Data; AgirHQ* Excluding cheese and whey
50% CAGR
1xNew Zealand physical trade
Lots traded per annum
Hypothetical growth scenario: growth in the next five years continues at 50% rate which is a mid-point between Bursa Malaysia and Euronext peak five year growth CAGR
5xNew Zealand physical trade
5xNew Zealand and European physical trade
5x the world’s
physical trade
23

24
Maximising options
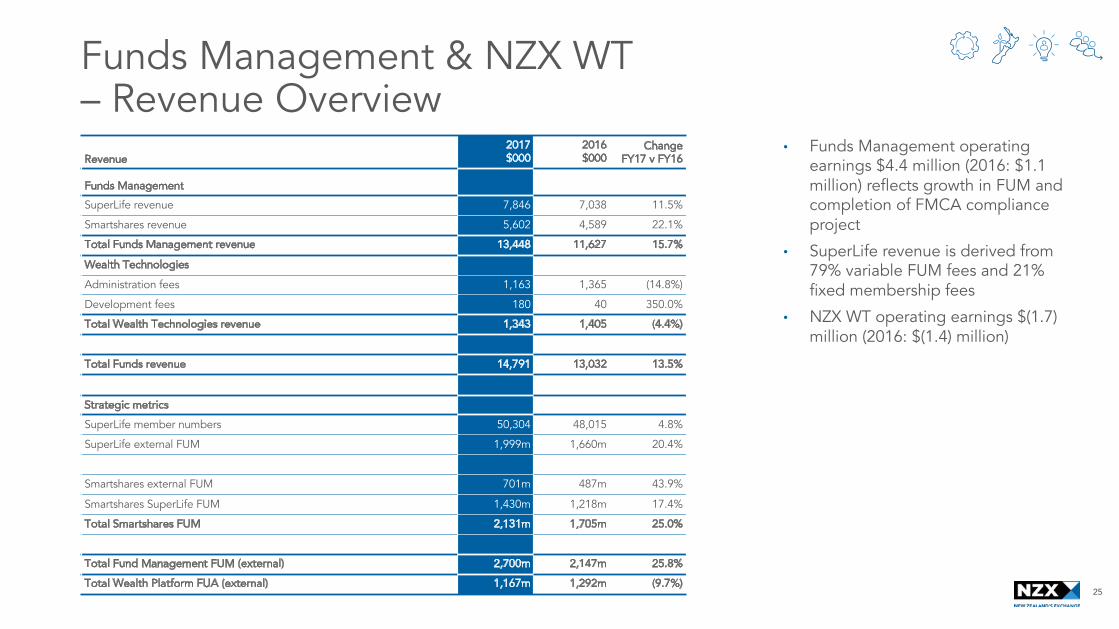
Funds Management & NZX WT – Revenue Overview
• Funds Management operating earnings $4.4 million (2016: $1.1 million) reflects growth in FUM and completion of FMCA compliance project
• SuperLife revenue is derived from 79% variable FUM fees and 21% fixed membership fees
• NZX WT operating earnings $(1.7) million (2016: $(1.4) million)
Revenue2017$000
2016$000
Change FY17 v FY16
Funds ManagementSuperLife revenue 7,846 7,038 11.5%
Smartshares revenue 5,602 4,589 22.1%
Total Funds Management revenue 13,448 11,627 15.7%
Wealth Technologies
Administration fees 1,163 1,365 (14.8%)
Development fees 180 40 350.0%
Total Wealth Technologies revenue 1,343 1,405 (4.4%)
Total Funds revenue 14,791 13,032 13.5%
Strategic metricsSuperLife member numbers 50,304 48,015 4.8%
SuperLife external FUM 1,999m 1,660m 20.4%
Smartshares external FUM 701m 487m 43.9%
Smartshares SuperLife FUM 1,430m 1,218m 17.4%
Total Smartshares FUM 2,131m 1,705m 25.0%
Total Fund Management FUM (external) 2,700m 2,147m 25.8% Total Wealth Platform FUA (external) 1,167m 1,292m (9.7%)
25

Funds Management
• Strong growth in funds management continued on back of increased retail and adviser investment
• SuperLife member numbers up 4.8%
• Smartshares unitholders (the number of investors in each ETF) up 37.6%
• Smartshares ETF direct applications up 84%
• Fresh leadership in place - Hugh Stevens joined in February 2018
Funds under management growth
0
500
1,000
1,500
2,000
2,500
3,000
December 2014 June 2015 December 2015 June 2016 December 2016 June 2017 December 2017
KiwiSaver SuperLife Smartshares external Total
26

Balance Sheet• Cash includes $20 million Clearing
House risk capital which is not available for general use
• Additionally the Clearing House complies with International Organisation of Securities Commissions principles requiring retention of sufficient working capital (including cash of approximately $3.9 million)
• Similarly Funds Management maintains sufficient net tangible assets (including cash of approximately $1.6 million)
• Focused on receivables collection
• Other current liabilities includes SuperLife $9.97 million paid 1 February 2018 (2016 classified as non-current liability $9.09 million)
• Term loan expires January 2020, ratios comfortably met
2017$000
2016$000
ChangeFY17 v FY16
Current assets
Cash and cash equivalents 34,881 30,804 13.2%
Receivables and prepayments 10,940 15,923 (31.3%)
Funds held on behalf of third parties 58,890 70,847 (16.9%)
Total current assets 104,711 117,574 (10.9%)
Total non-current assets 75,078 76,390 (1.7%)
Current liabilities
Trade payables 3,810 5,632 32.4%
Other current liabilities 24,246 14,394 (68.4%)
Funds held on behalf of third parties 58,890 70,847 16.9%
Total current assets 86,946 90,873 4.3%
Non-current liabilities
Term loan 20,000 20,000 -
Other non-current liabilities 4,120 13,416 69.3%
Total non-current liabilities 24,120 33,416 27.8%
Net assets/equity 68,723 69,675 (1.4%)
27

Capital Structure
• Board completed capital structure review
• Consultation on a mutualised default fund underway to advance Clearing House’s risk model to meet global standards. This is important to ensure we have an appropriate Clearing House risk structure to meet anticipated dairy derivatives market growth
• The board will explore use of a capital note to ensure NZX has a more robust balance sheet to protect the business in the unlikely case of a major market event
28
Dividend
Dividend
• Final fully imputed dividend of 3.1 cents per share for the 2017 financial year (2016: 3.0 cents per share). Total fully imputed dividends for the 2017 financial year are 6.1 cents per share (2016: 6.0 cents per share)
Reinvestment plan
• Board to implement reinvestment plan for 2018 interim dividend in response to shareholder feedback. Further details, including the offer document to follow
Policy
• Previous dividend policy was based on a target payout ratio of 80% of free cash flow (defined as operating cash flow less purchase of property, plant and equipment and intangible assets)
• New policy will come into effect for the 2018 financial year onwards and pay between 80% to 110% of adjusted Net Profit After Tax, subject to maintaining a prudent level of capital to meet regulatory requirements
• Board considers that a policy based on Net Profit After Tax is comparable with peers, and provides sufficient headroom to manage the ongoing capital structure requirements of the exchange, and pursue future relevant opportunities should they arise 29

2018 Earnings Guidance
• Refreshed strategy marked fundamental reset of NZX –completion of final reset initiatives in 2018 will set business up to deliver long term returns
• Divestment of non core assets in 2018 (including rural newspaper Farmers Weekly) and changes to the clearing and trading pricing structure (effective in the second half of 2018) will rebase the operating result
• NZX expects full year 2018 operating result to be in the range of $28.0 million to $31.0 million
• This is subject to market outcomes, particularly with respect to initial public offerings, secondary capital raising, equity trading and derivatives trading volumes. This guidance assumes no material adverse events, significant one-off expenses or major accounting adjustments. It also assumes no further acquisitions or divestments
30

Summary2017 operating earnings of $29.0 million, up 31.3%
Result underpinned by performance of Funds Management and Dairy Derivatives businesses, disciplined cost control and efficiency improvements
Refreshed strategy marked fundamental reset of NZX – completion of final reset initiatives in 2018 will set business up to deliver long term returns
Core market must deliver more investableproduct, deeper liquidity levels, greater participationrates, and achieve a global presence. Strong focus on these elements
2018 operating earnings expected to be in the range of $28.0 million to $31.0 million
31

Mark PetersonChief Executive Officer
+64 21 390 636
Graham LawChief Financial Officer
+64 21 276 7359
Contacts