Embed Size (px)
Citation preview

This work is licensed under a Creative Commons Attribution-NonCommercial-ShareAlike 3.0 Unported License.
Lesson 1: Generate and organize data.
Date: 12/6/13 6.A.12
© 2013 Common Core, Inc. Some rights reserved. commoncore.org
Lesson 1 Homework NYS COMMON CORE MATHEMATICS CURRICULUM 3 6
Name Date
1. The tally chart below shows a survey of students’ favorite pets. Each tally mark represents 1 student.
The chart shows a total of ________________ students.
2. Use the tally chart in Problem 1 to complete the picture graph below. The first one has been done for
you.
Favorite Pets
Cats Turtles Fish Dogs Lizards
Each represents 1 student.
a. The same number of students picked __________ and __________ as their favorite pet.
b. How many students picked dogs as their favorite pet?
c. How many more students chose cats than turtles as their favorite pet?
Favorite Pets Number of Students
Cats //// /
Turtles ////
Fish //
Dogs //// ///
Lizards //
This work is licensed under a Creative Commons Attribution-NonCommercial-ShareAlike 3.0 Unported License.
Lesson 1: Generate and organize data.
Date: 12/6/13 6.A.13
© 2013 Common Core, Inc. Some rights reserved. commoncore.org
Lesson 1 Homework NYS COMMON CORE MATHEMATICS CURRICULUM 3 6
3. Use the tally chart in Problem 1 to complete the picture graph below.
Favorite Pets
Cats
Turtles
Fish
Dogs
Lizards
Each represents 2 students.
a. What does each represent?
b. How many does represent? Write a number sentence to show how you know.
c. How many more did you draw for dogs than for fish? Write a number sentence to show how many more students chose dogs over fish.
Lesson 2: Rotate tape diagrams vertically.
Date: 12/6/13 6.A.23
© 2012 Common Core, Inc. All rights reserved. commoncore.org This work is licensed under a Creative Commons Attribution-NonCommercial-ShareAlike 3.0 Unported License.
Lesson 2 Homework NYS COMMON CORE MATHEMATICS CURRICULUM 3 6
Name Date
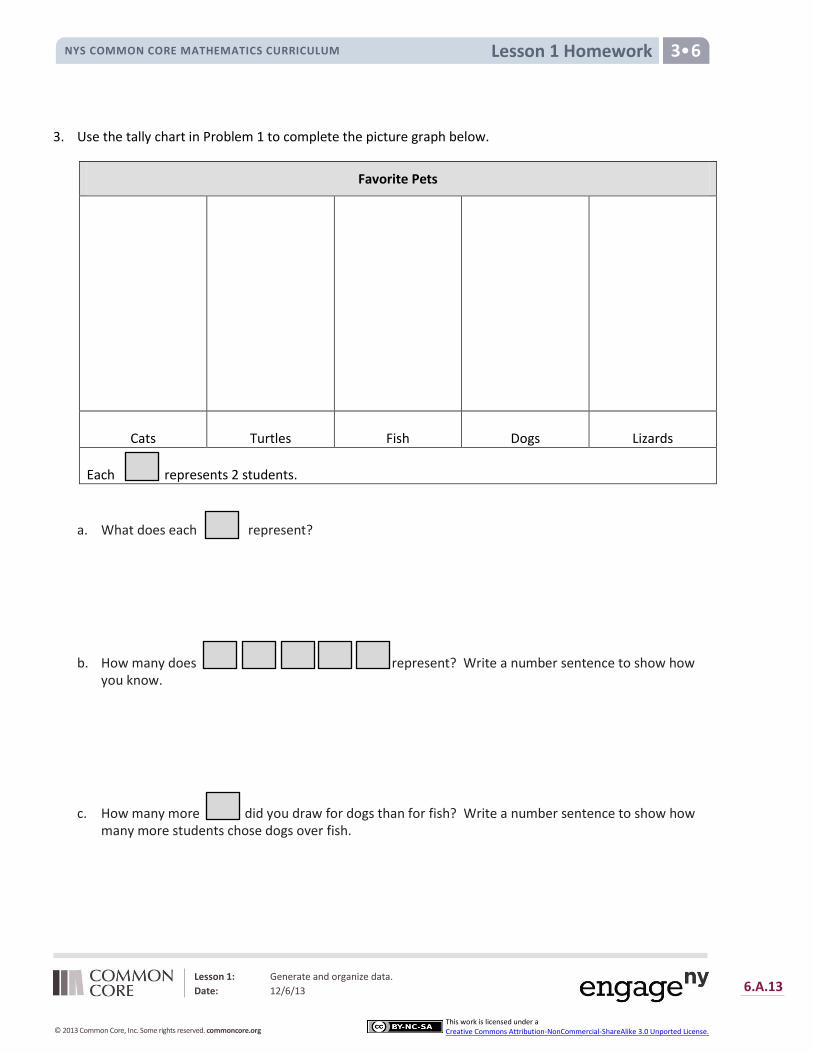
1. Adi surveys third-graders to find out what their favorite fruits are. The results are in the table below.
2. Explain how you can create a vertical tape diagram to show this data.
Favorite Fruits of Third-Graders
Fruit Number of Student Votes
Banana 8
Apple 16
Strawberry 12
Peach 4
Draw units of 2 to complete the tape diagrams to show the total votes for each fruit. The first one has
been done for you.
Apple:
Strawberry:
Peach:
Banana: 2 2 2 2
Lesson 2: Rotate tape diagrams vertically.
Date: 12/6/13 6.A.24
© 2012 Common Core, Inc. All rights reserved. commoncore.org This work is licensed under a Creative Commons Attribution-NonCommercial-ShareAlike 3.0 Unported License.
Lesson 2 Homework NYS COMMON CORE MATHEMATICS CURRICULUM 3 6
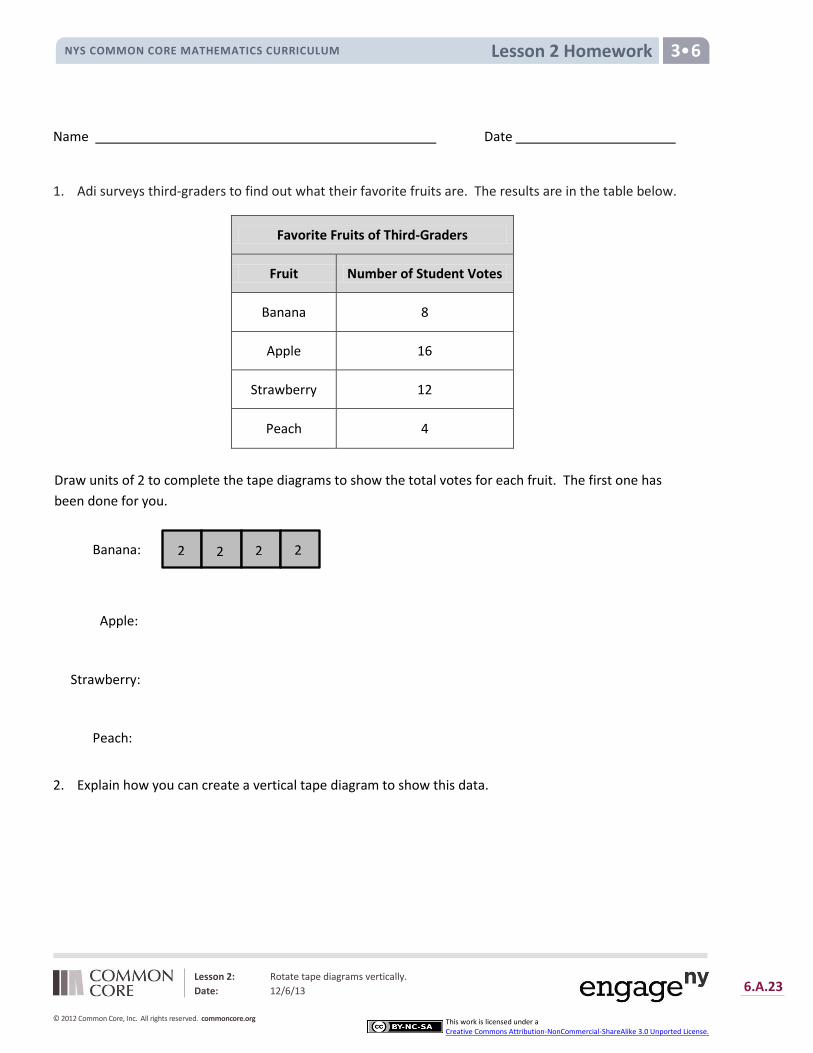
3. Complete the vertical tape diagrams below using the data from Problem 1.
c. What is a good title for the vertical tape diagrams?
d. Compare the number of units used in each vertical tape diagram. Why does the number of units
change?
e. Write a multiplication number sentence to show the total number of votes for strawberry in the
vertical tape diagram in Problem 3(a).
f. Write a multiplication number sentence to show the total number of votes for strawberry in the
vertical tape diagram in Problem 3(b).
g. What changes in your multiplication number sentences in (e) and (f)? Why?
Apple Strawberry Peach Banana
2
2
2
2
a. b.
Apple Strawberry Peach Banana
4
4
Lesson 3: Create scaled bar graphs.
Date: 12/6/13 6.A.37
© 2013 Common Core, Inc. Some rights reserved. commoncore.org
This work is licensed under a Creative Commons Attribution-NonCommercial-ShareAlike 3.0 Unported License.
Lesson 3 Homework NYS COMMON CORE MATHEMATICS CURRICULUM 3 6
Name Date
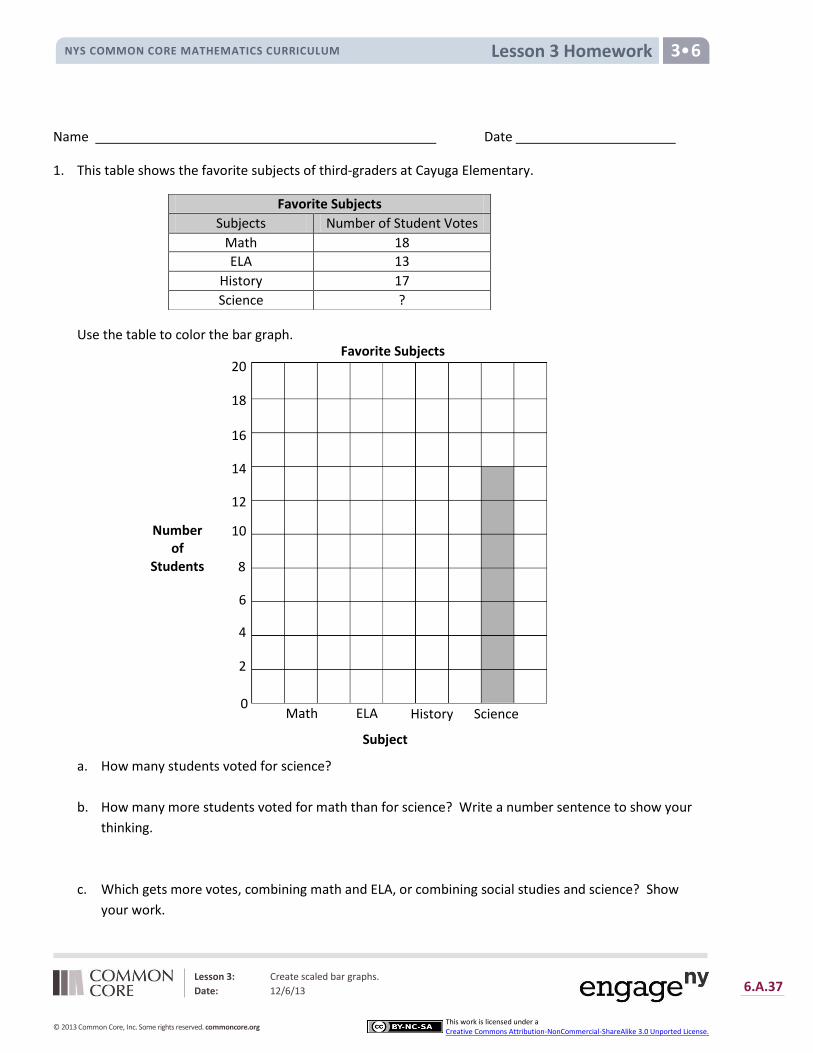
1. This table shows the favorite subjects of third-graders at Cayuga Elementary.
Use the table to color the bar graph.
a. How many students voted for science?
b. How many more students voted for math than for science? Write a number sentence to show your
thinking.
c. Which gets more votes, combining math and ELA, or combining social studies and science? Show
your work.
Favorite Subjects
Subjects Number of Student Votes
Math 18
ELA 13
History 17
Science ?
Math ELA History Science
2
4
6
8
10
12
14
16
18
20 Favorite Subjects
Number of
Students
Subject
0

Lesson 3: Create scaled bar graphs.
Date: 12/6/13 6.A.38
© 2013 Common Core, Inc. Some rights reserved. commoncore.org
This work is licensed under a Creative Commons Attribution-NonCommercial-ShareAlike 3.0 Unported License.
Lesson 3 Homework NYS COMMON CORE MATHEMATICS CURRICULUM 3 6
2. This bar graph shows the number of liters of water Skyler drinks this month.
a. During which week does Skyler drink the most water? __________________
The least? ___________________
b. How many more liters does Skyler drink in Week 4 than Week 2?
c. Write a number sentence to show how many liters of water Skyler drinks during Weeks 2 and 3
combined.
d. How many liters does Skyler drink in total?
e. If Skyler drinks 60 liters each week next month, will she drink more or less than she drinks this
month? Show your work.
Week 4
Week 3
Week 2
Week 1
10 20 30 40 50 60 70
Number of Liters
Week
Liters of Water Skyler Drinks
0

Lesson 3: Create scaled bar graphs.
Date: 12/6/13 6.A.39
© 2013 Common Core, Inc. Some rights reserved. commoncore.org
This work is licensed under a Creative Commons Attribution-NonCommercial-ShareAlike 3.0 Unported License.
Lesson 3 Homework NYS COMMON CORE MATHEMATICS CURRICULUM 3 6
Liters of Water Skyler Drinks
Week Liters of Water
3. Complete the table below to show the data given in the bar graph in Problem 2.
Lesson 4 Homework NYS COMMON CORE MATHEMATICS CURRICULUM 3 6
Lesson 4: Solve one- and two-step problems involving graphs.
Date: 12/6/13 6.A.51
© 2013 Common Core, Inc. Some rights reserved. commoncore.org
This work is licensed under a Creative Commons Attribution-NonCommercial-ShareAlike 3.0 Unported License.
Name Date
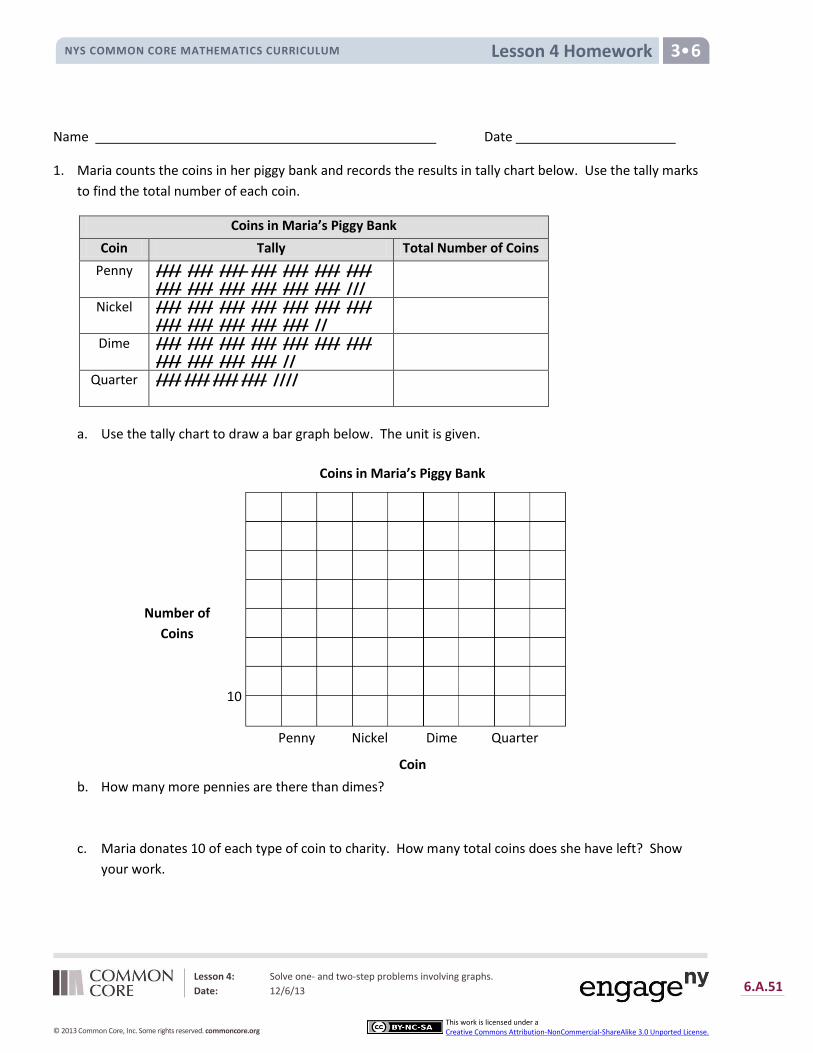
1. Maria counts the coins in her piggy bank and records the results in tally chart below. Use the tally marks
to find the total number of each coin.
Coins in Maria’s Piggy Bank
Coin Tally Total Number of Coins
Penny //// //// //// //// //// //// //// //// //// //// //// //// //// ///
Nickel //// //// //// //// //// //// //// //// //// //// //// //// //
Dime //// //// //// //// //// //// //// //// //// //// //// //
Quarter //// //// //// //// ////
a. Use the tally chart to draw a bar graph below. The unit is given.
b. How many more pennies are there than dimes?
c. Maria donates 10 of each type of coin to charity. How many total coins does she have left? Show
your work.
Number of
Coins
Coin
Penny Nickel Dime Quarter
10
Coins in Maria’s Piggy Bank
Lesson 4 Homework NYS COMMON CORE MATHEMATICS CURRICULUM 3 6
Lesson 4: Solve one- and two-step problems involving graphs.
Date: 12/6/13 6.A.52
© 2013 Common Core, Inc. Some rights reserved. commoncore.org
This work is licensed under a Creative Commons Attribution-NonCommercial-ShareAlike 3.0 Unported License.
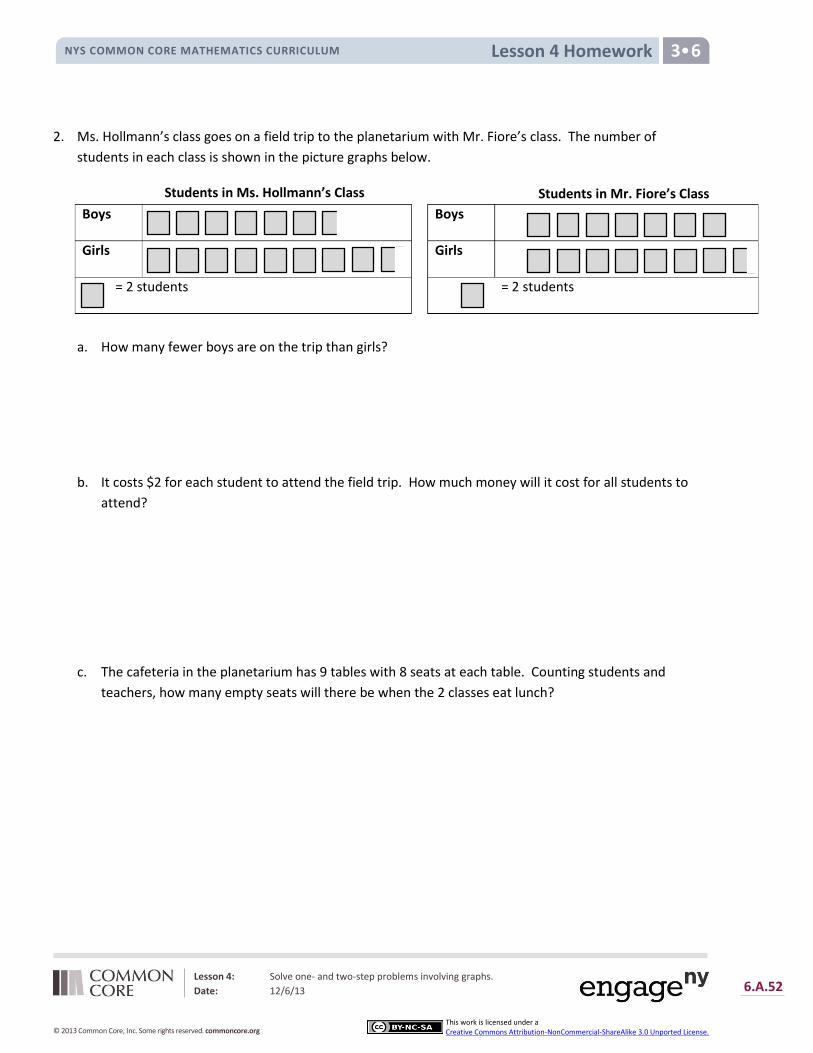
2. Ms. Hollmann’s class goes on a field trip to the planetarium with Mr. Fiore’s class. The number of
students in each class is shown in the picture graphs below.
a. How many fewer boys are on the trip than girls?
b. It costs $2 for each student to attend the field trip. How much money will it cost for all students to
attend?
c. The cafeteria in the planetarium has 9 tables with 8 seats at each table. Counting students and
teachers, how many empty seats will there be when the 2 classes eat lunch?
Students in Ms. Hollmann’s Class Students in Mr. Fiore’s Class
Boys
Girls
= 2 students
Boys
Girls
= 2 students
Lesson 5 Homework NYS COMMON CORE MATHEMATICS CURRICULUM 3 6
Lesson 5: Create ruler with 1-inch, 1/2-inch, and 1/4-inch intervals and generate measurement data.
Date: 12/6/13 6.B.12
© 2013 Common Core, Inc. Some rights reserved. commoncore.org
This work is licensed under a Creative Commons Attribution-NonCommercial-ShareAlike 3.0 Unported License.
Name Date
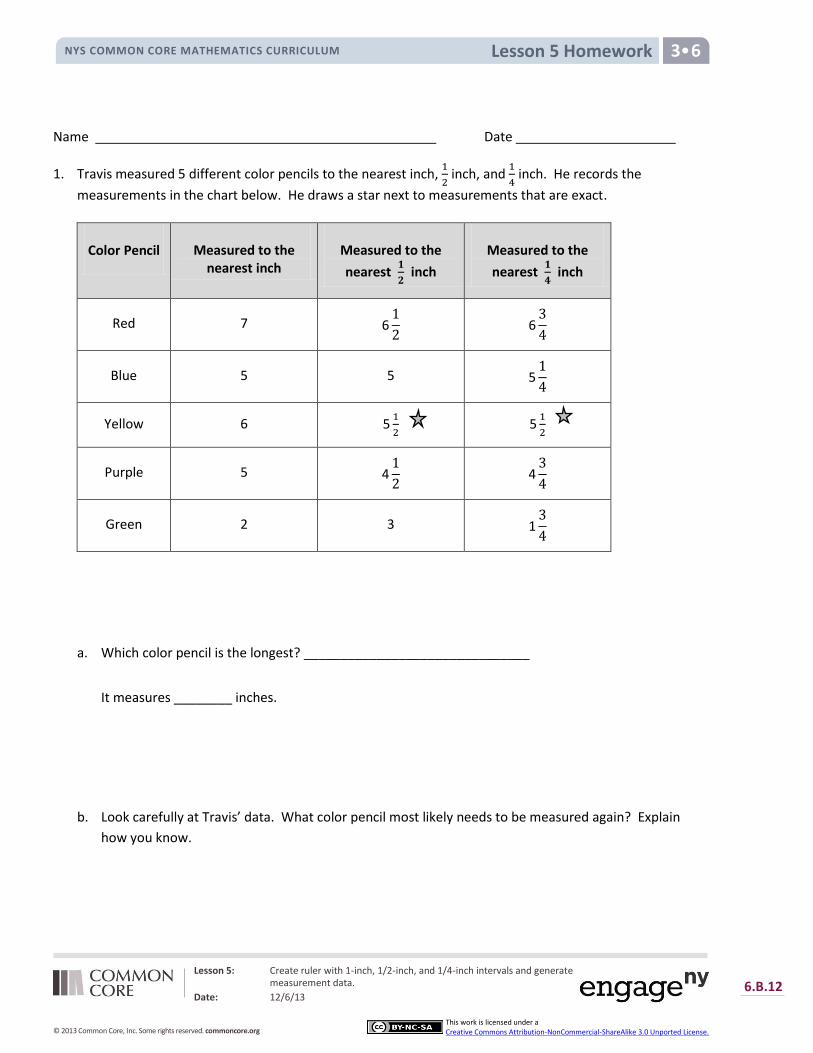
1. Travis measured 5 different color pencils to the nearest inch,
inch, and
inch. He records the
measurements in the chart below. He draws a star next to measurements that are exact.
Color Pencil
Measured to the
nearest inch
Measured to the
nearest
inch
Measured to the
nearest
inch
Red 7 6
6
Blue 5 5
Yellow 6
Purple 5 4
4
Green 2 3 1
a. Which color pencil is the longest? _______________________________
It measures ________ inches.
b. Look carefully at Travis’ data. What color pencil most likely needs to be measured again? Explain
how you know.
Lesson 5 Homework NYS COMMON CORE MATHEMATICS CURRICULUM 3 6
Lesson 5: Create ruler with 1-inch, 1/2-inch, and 1/4-inch intervals and generate measurement data.
Date: 12/6/13 6.B.13
© 2013 Common Core, Inc. Some rights reserved. commoncore.org
This work is licensed under a Creative Commons Attribution-NonCommercial-ShareAlike 3.0 Unported License.
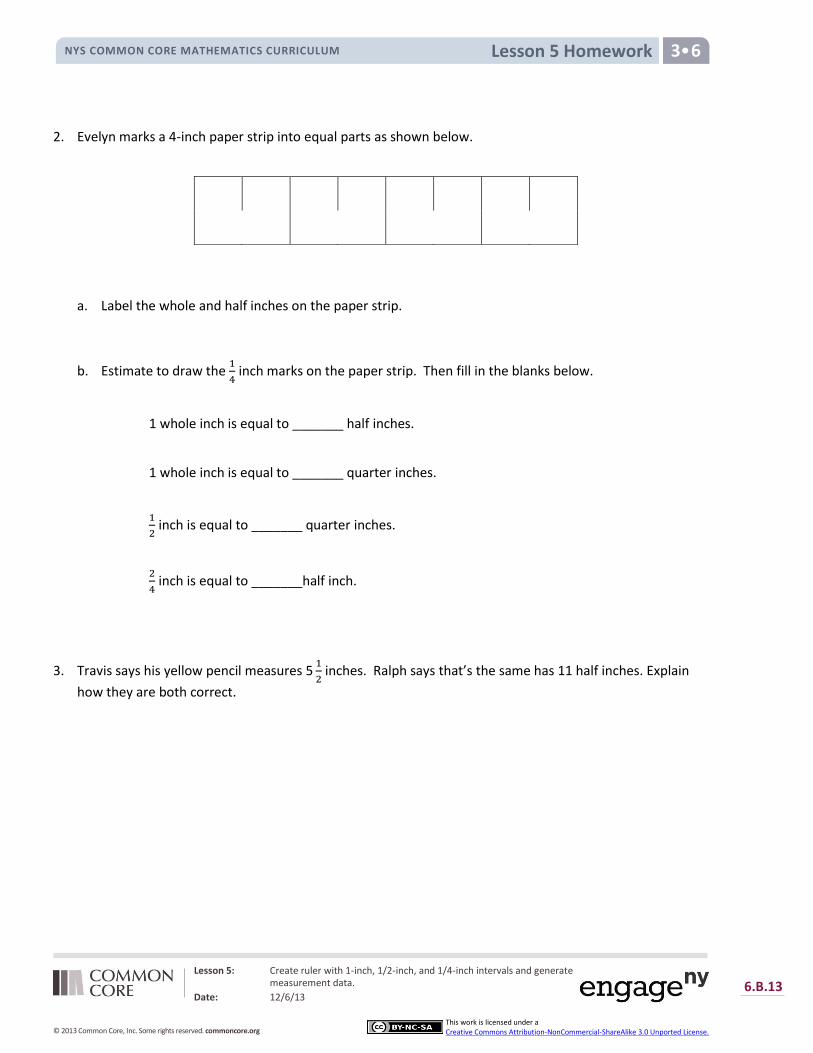
2. Evelyn marks a 4-inch paper strip into equal parts as shown below.
a. Label the whole and half inches on the paper strip.
b. Estimate to draw the
inch marks on the paper strip. Then fill in the blanks below.
1 whole inch is equal to _______ half inches.
1 whole inch is equal to _______ quarter inches.
inch is equal to _______ quarter inches.
inch is equal to _______half inch.
3. Travis says his yellow pencil measures
inches. Ralph says that’s the same has 11 half inches. Explain
how they are both correct.
Lesson 6: Interpret measurement data from various line plots.
Date: 11/19/13 6.B.26
© 2013 Common Core, Inc. Some rights reserved. commoncore.org
This work is licensed under a Creative Commons Attribution-NonCommercial-ShareAlike 3.0 Unported License.
Lesson 6 Homework NYS COMMON CORE MATHEMATICS CURRICULUM 3•6
Name Date
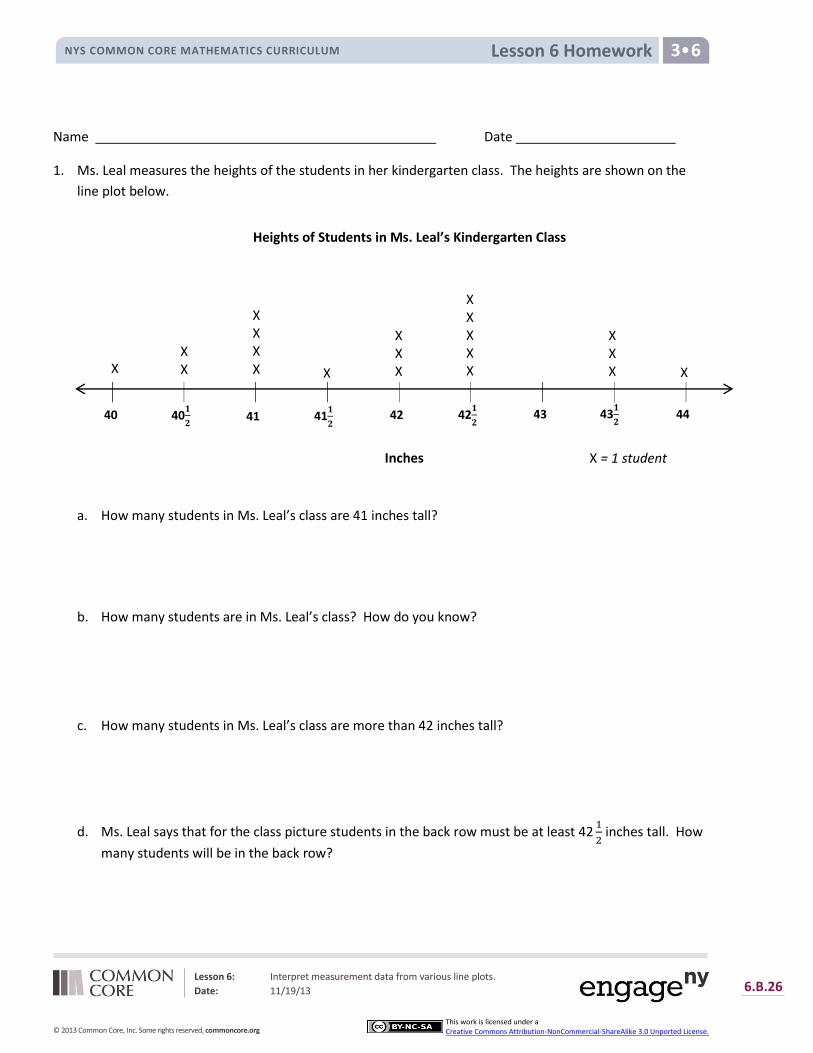
1. Ms. Leal measures the heights of the students in her kindergarten class. The heights are shown on the
line plot below.
a. How many students in Ms. Leal’s class are inches tall?
b. How many students are in Ms. Leal’s class? How do you know?
c. How many students in Ms. Leal’s class are more than inches tall?
d. Ms. Leal says that for the class picture students in the back row must be at least
inches tall. How
many students will be in the back row?
Heights of Students in Ms. Leal’s Kindergarten Class
40 40𝟏
𝟐 41
𝟏
𝟐 42
𝟏
𝟐 43
𝟏
𝟐 41 42 43 44
Inches
X X
X X X X X
X X X X
X
X X X
X X X X X
X = 1 student
Lesson 6: Interpret measurement data from various line plots.
Date: 11/19/13 6.B.27
© 2013 Common Core, Inc. Some rights reserved. commoncore.org
This work is licensed under a Creative Commons Attribution-NonCommercial-ShareAlike 3.0 Unported License.
Lesson 6 Homework NYS COMMON CORE MATHEMATICS CURRICULUM 3•6
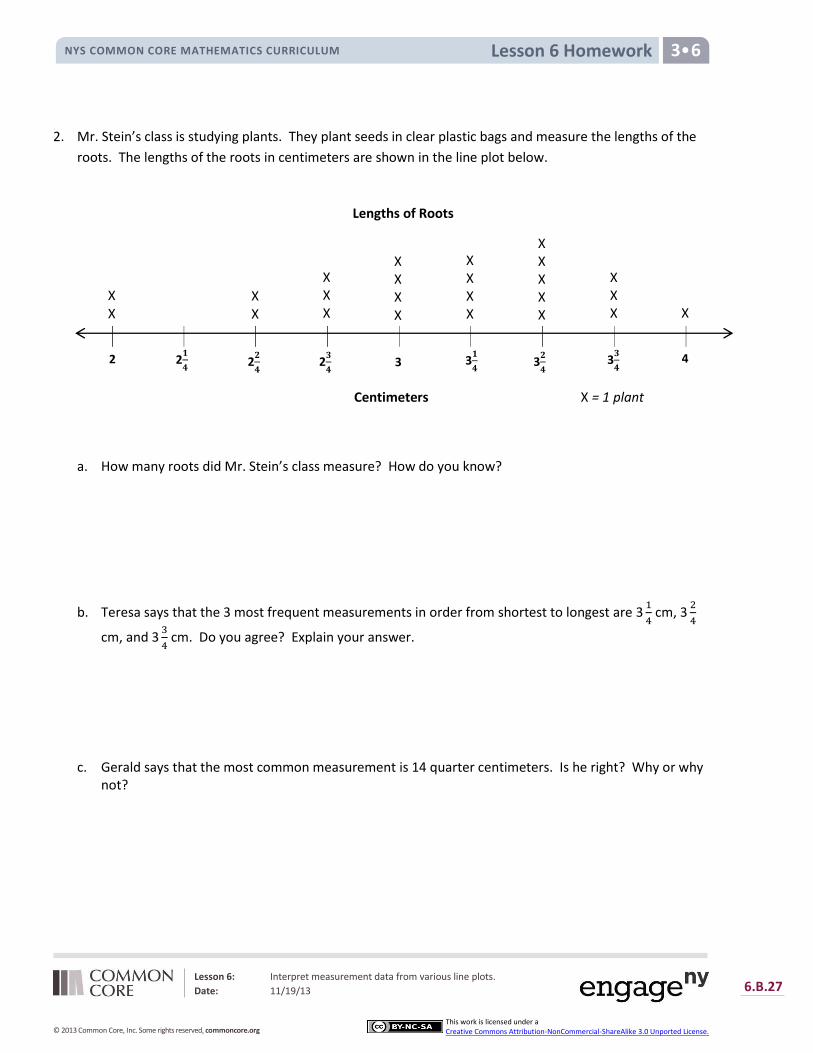
2. Mr. Stein’s class is studying plants. They plant seeds in clear plastic bags and measure the lengths of the
roots. The lengths of the roots in centimeters are shown in the line plot below.
a. How many roots did Mr. Stein’s class measure? How do you know?
b. Teresa says that the 3 most frequent measurements in order from shortest to longest are 3
cm, 3
cm, and 3
cm. Do you agree? Explain your answer.
c. Gerald says that the most common measurement is 14 quarter centimeters. Is he right? Why or why not?
Lengths of Roots
2 2𝟏
𝟒 2
𝟑
𝟒 3
𝟏
𝟒 3
𝟑
𝟒 2
𝟐
𝟒 3 3
𝟐
𝟒 4
Centimeters
X X X X
X X
X X X
X X
X
X X X X X
X X X
X X X X
X = 1 plant
Lesson 7: Represent measurement data with line plots.
Date: 11/19/13 6.B.41
© 2013 Common Core, Inc. Some rights reserved. commoncore.org
This work is licensed under a Creative Commons Attribution-NonCommercial-ShareAlike 3.0 Unported License.
Lesson 7 Homework NYS COMMON CORE MATHEMATICS CURRICULUM 3•6
Name Date
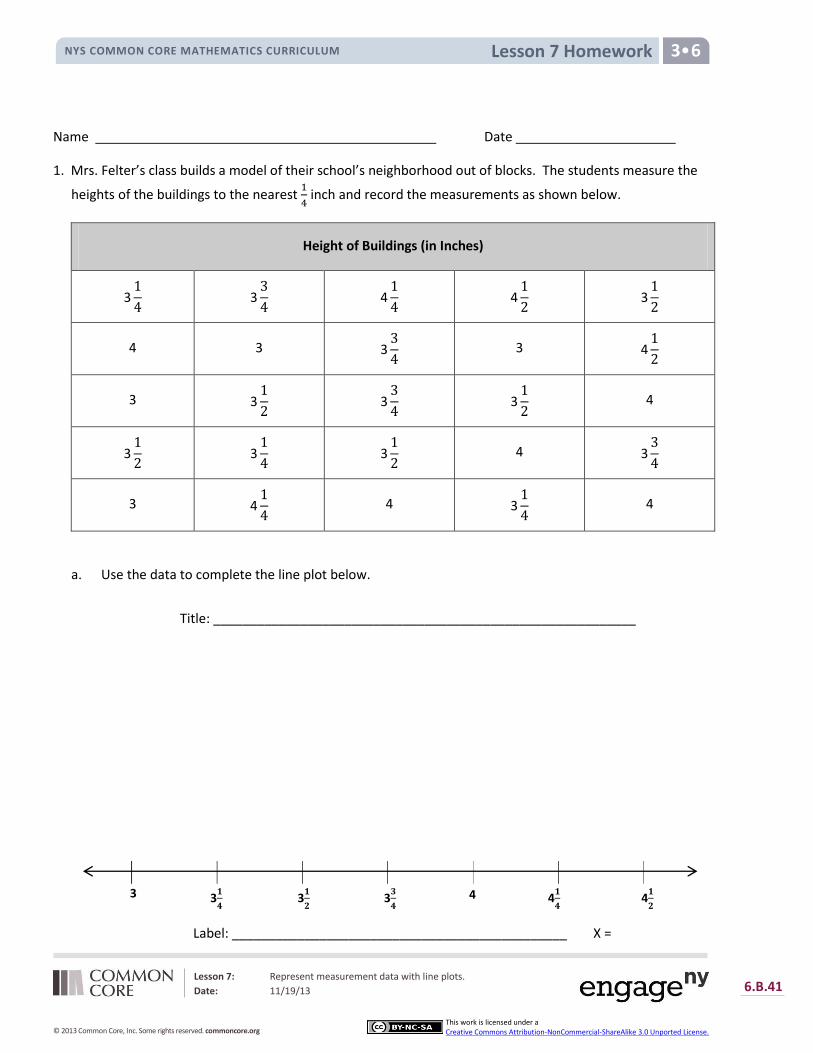
1. Mrs. Felter’s class builds a model of their school’s neighborhood out of blocks. The students measure the
heights of the buildings to the nearest
inch and record the measurements as shown below.
Height of Buildings (in Inches)
31
4 3
3
4 4
1
4 4
1
2 3
1
2
4 3 33
4 3 4
1
2
3 31
2 3
3
4 3
1
2 4
31
2 3
1
4 3
1
2 4 3
3
4
3 41
4 4 3
1
4 4
a. Use the data to complete the line plot below.
Title: __________________________________________________________
4 4𝟏
𝟒 4
𝟏
𝟐 3
𝟑
𝟒 3
𝟏
𝟐 3
𝟏
𝟒 3
Label: ______________________________________________ X =
Lesson 7: Represent measurement data with line plots.
Date: 11/19/13 6.B.42
© 2013 Common Core, Inc. Some rights reserved. commoncore.org
This work is licensed under a Creative Commons Attribution-NonCommercial-ShareAlike 3.0 Unported License.
Lesson 7 Homework NYS COMMON CORE MATHEMATICS CURRICULUM 3•6
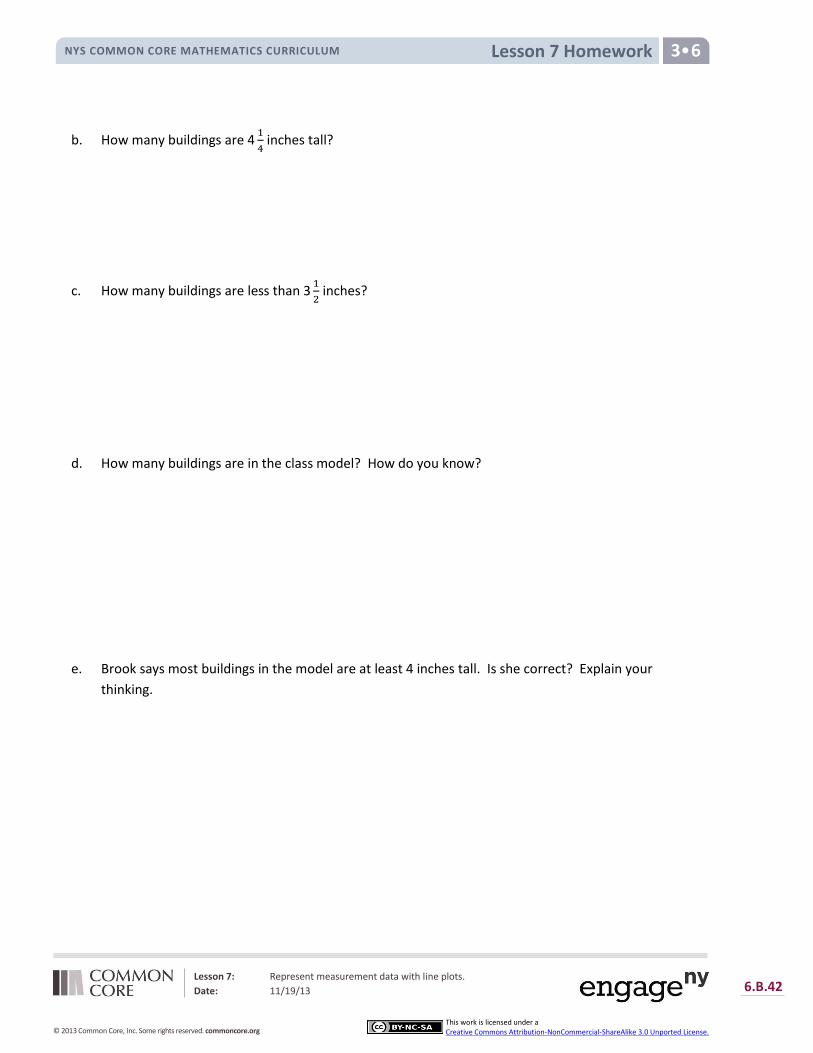
b. How many buildings are 4
inches tall?
c. How many buildings are less than 3
inches?
d. How many buildings are in the class model? How do you know?
e. Brook says most buildings in the model are at least 4 inches tall. Is she correct? Explain your
thinking.
Lesson 8: Represent measurement data with line plots.
Date: 11/19/13 6.B.55
© 2013 Common Core, Inc. Some rights reserved. commoncore.org
This work is licensed under a Creative Commons Attribution-NonCommercial-ShareAlike 3.0 Unported License.
Lesson 8 Homework NYS COMMON CORE MATHEMATICS CURRICULUM 3 6
Name Date
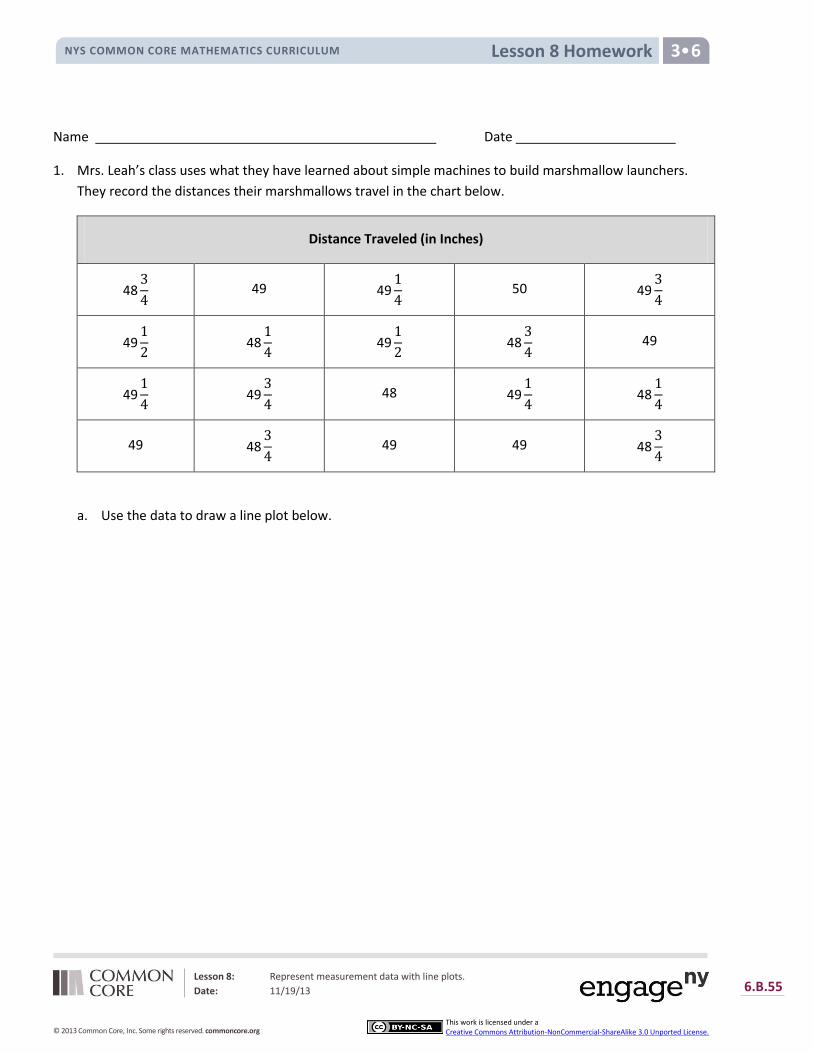
1. Mrs. Leah’s class uses what they have learned about simple machines to build marshmallow launchers.
They record the distances their marshmallows travel in the chart below.
Distance Traveled (in Inches)
48
49 49
50 49
49
48
49
48
49
49
49
48 49
48
49 48
49 49 48
a. Use the data to draw a line plot below.
Lesson 8: Represent measurement data with line plots.
Date: 11/19/13 6.B.56
© 2013 Common Core, Inc. Some rights reserved. commoncore.org
This work is licensed under a Creative Commons Attribution-NonCommercial-ShareAlike 3.0 Unported License.
Lesson 8 Homework NYS COMMON CORE MATHEMATICS CURRICULUM 3 6
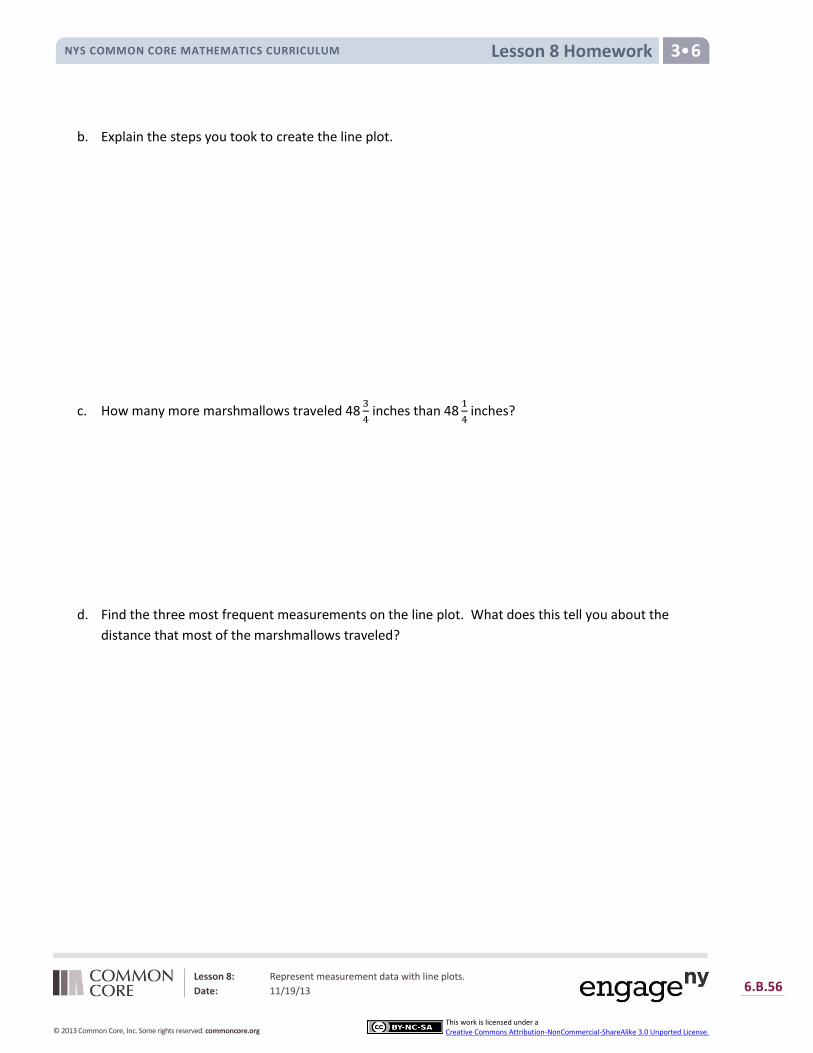
b. Explain the steps you took to create the line plot.
c. How many more marshmallows traveled 48
inches than 48
inches?
d. Find the three most frequent measurements on the line plot. What does this tell you about the
distance that most of the marshmallows traveled?
Lesson 9: Analyze data to problem solve.
Date: 12/6/13 6.B.71
© 2013 Common Core, Inc. Some rights reserved. commoncore.org
This work is licensed under a Creative Commons Attribution-NonCommercial-ShareAlike 3.0 Unported License.
Lesson 9 Homework NYS COMMON CORE MATHEMATICS CURRICULUM 3 6
Name Date
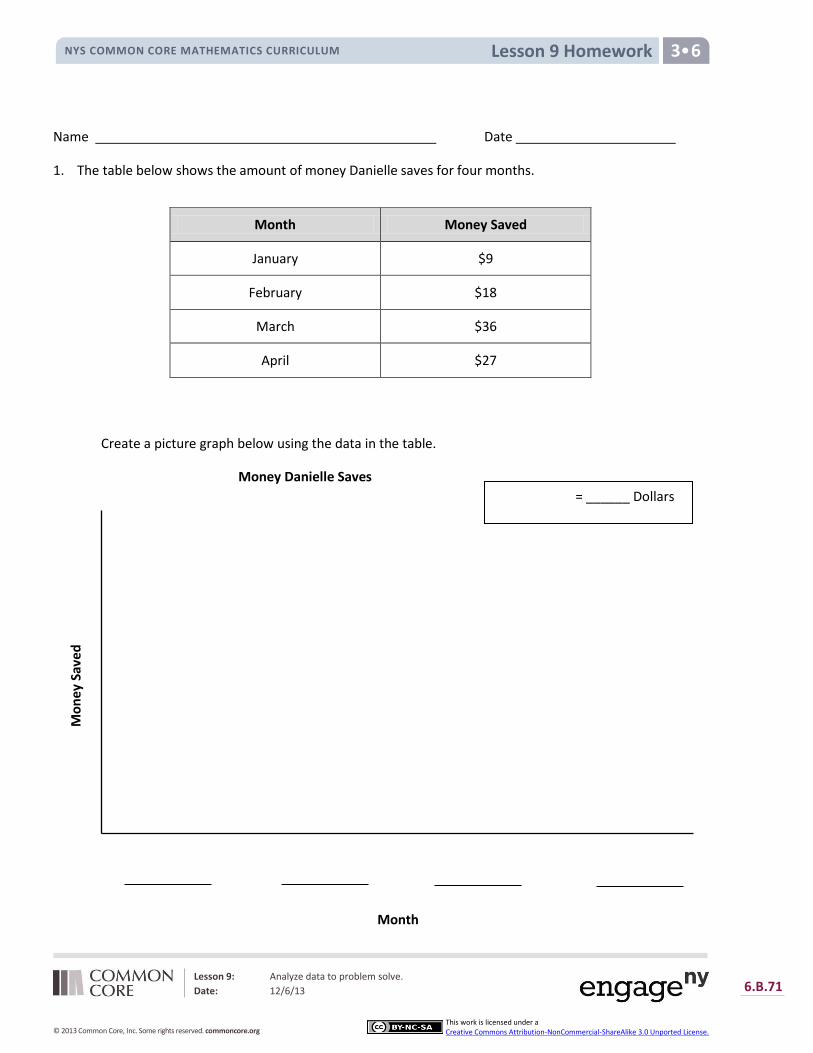
1. The table below shows the amount of money Danielle saves for four months.
Create a picture graph below using the data in the table.
Month Money Saved
January $9
February $18
March $36
April $27
= ______ Dollars
Mo
ney
Sav
ed
Money Danielle Saves
Month
Lesson 9: Analyze data to problem solve.
Date: 12/6/13 6.B.72
© 2013 Common Core, Inc. Some rights reserved. commoncore.org
This work is licensed under a Creative Commons Attribution-NonCommercial-ShareAlike 3.0 Unported License.
Lesson 9 Homework NYS COMMON CORE MATHEMATICS CURRICULUM 3 6
2. Use the table or graph to answer the following questions.
a. How much money does Danielle save in four months?
b. How much more money does Danielle save in March and April than in January and February?
c. Danielle combines her savings from March and April to buy books for her friends. Each book costs $9.
How many books can she buy?
d. Danielle earns $33 in January. She buys a necklace for $8 and a birthday present for her brother. She
saves the rest of her money. How much does the birthday present cost?