Embed Size (px)
Citation preview
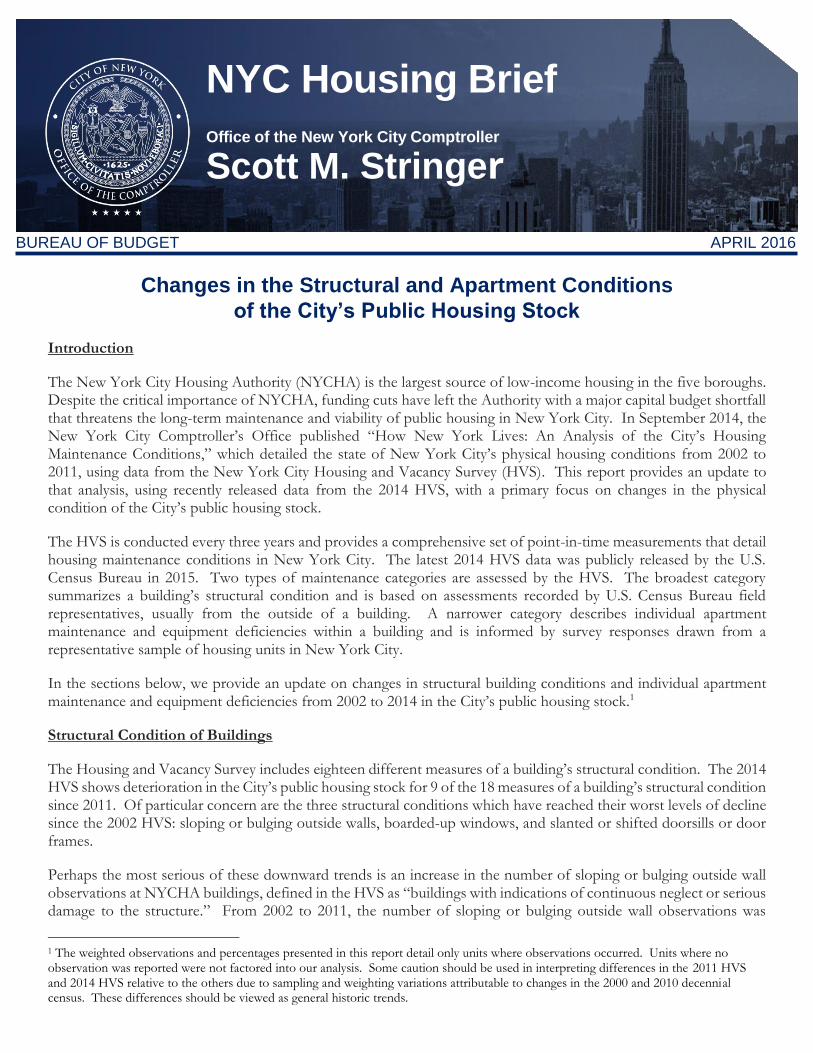
Changes in the Structural and Apartment Conditions
of the City’s Public Housing Stock
Introduction
The New York City Housing Authority (NYCHA) is the largest source of low-income housing in the five boroughs. Despite the critical importance of NYCHA, funding cuts have left the Authority with a major capital budget shortfall that threatens the long-term maintenance and viability of public housing in New York City. In September 2014, the New York City Comptroller’s Office published “How New York Lives: An Analysis of the City’s Housing Maintenance Conditions,” which detailed the state of New York City’s physical housing conditions from 2002 to 2011, using data from the New York City Housing and Vacancy Survey (HVS). This report provides an update to that analysis, using recently released data from the 2014 HVS, with a primary focus on changes in the physical condition of the City’s public housing stock.
The HVS is conducted every three years and provides a comprehensive set of point-in-time measurements that detail housing maintenance conditions in New York City. The latest 2014 HVS data was publicly released by the U.S. Census Bureau in 2015. Two types of maintenance categories are assessed by the HVS. The broadest category summarizes a building’s structural condition and is based on assessments recorded by U.S. Census Bureau field representatives, usually from the outside of a building. A narrower category describes individual apartment maintenance and equipment deficiencies within a building and is informed by survey responses drawn from a representative sample of housing units in New York City.
In the sections below, we provide an update on changes in structural building conditions and individual apartment maintenance and equipment deficiencies from 2002 to 2014 in the City’s public housing stock.1
Structural Condition of Buildings
The Housing and Vacancy Survey includes eighteen different measures of a building’s structural condition. The 2014 HVS shows deterioration in the City’s public housing stock for 9 of the 18 measures of a building’s structural condition since 2011. Of particular concern are the three structural conditions which have reached their worst levels of decline since the 2002 HVS: sloping or bulging outside walls, boarded-up windows, and slanted or shifted doorsills or door frames.
Perhaps the most serious of these downward trends is an increase in the number of sloping or bulging outside wall observations at NYCHA buildings, defined in the HVS as “buildings with indications of continuous neglect or serious damage to the structure.” From 2002 to 2011, the number of sloping or bulging outside wall observations was
1 The weighted observations and percentages presented in this report detail only units where observations occurred. Units where no observation was reported were not factored into our analysis. Some caution should be used in interpreting differences in the 2011 HVS and 2014 HVS relative to the others due to sampling and weighting variations attributable to changes in the 2000 and 2010 decennial census. These differences should be viewed as general historic trends.
BUREAU OF BUDGET APRIL 2016
NYC Housing Brief Office of the New York City Comptroller
Scott M. Stringer
2
NYC Housing Brief www.comptroller.nyc.gov
Office of the New York City Comptroller
relatively modest, with zero observations recorded in the 2002 and 2011 HVS data and 468 and 365 observations in 2005 and 2008 respectively.2 However, in 2014, these observations increased substantially, rising to 1,164 observations.
NYCHA buildings have also exhibited substantial increases in boarded-up window observations. According to the HVS glossary, “boarded-up windows include units in buildings with windows covered with wood, metal, etc. to protect against weather or entry,” which suggests that residents may be proactively fortifying window spaces for heating or security purposes. Additional data on heating deficiencies is provided in subsequent sections of this report. There were zero boarded-up window observations recorded for the City’s public housing stock in the 2002 and 2005 HVS data, however there have been steady increases in boarded-up window observations since then, with 1,372 observations in 2008, 1,916 observations in 2011 and 2,003 observations in 2014.
A final area of continued decline in the structural condition of the City’s public housing buildings were observations of slanted or shifted doorsills or door frames – a measurement of doorsills or door frames that may be separated from floors. Similar to the two structural condition categories above, this condition yielded zero observations in the 2002, 2008 and 2011 HVS. However, after reaching a previous high of 1,179 observations in the 2005 HVS, observations in this category surged to 1,983 in 2014.
In addition to the three categories discussed above, there were several other areas of structural decline in the public housing stock that, while not reaching a peak number of observations since the 2002 HVS, nonetheless worsened from 2011 to 2014. These include observations of:
Major cracks in outside walls – 371.8% increase;
Holes or missing flooring – 72.6% increase;
Sagging or sloping floors – 38.1% increase;
Loose, broken or missing steps – 23.0% increase;
Deep wear in floors causing depressions – 7.6% increase; and
Loose, broken or missing stair railings – surged from zero observations to 1,990 observations. Areas where the number of structural condition observations improved from 2011 to 2014 include:
Loose or hanging cornice, roofing or other material – 72.7% decrease;
Rotten/loose window frames/sashes – 48.1% decrease;
Broken or missing windows – 44.0% decrease;
Wheelchair inaccessible elevator – 38.1% decrease;
Wheelchair inaccessible residential unit entrance – 35.0% decrease
Dilapidated building – 35.0% decrease;
Missing bricks, siding or other outside wall material – 23.3% decrease;
Wheelchair inaccessible street and inner lobby entry – 10.2% decrease; and
Deteriorating building – 1.8% decrease.
2 The 2011 HVS report addressed circumstances in which there are wide fluctuations in certain HVS measurements with the following
disclaimer: “Conceptually, research on the measurement of the structural adequacy of housing conditions has advanced. However, in
practice it is still very difficult to collect data on these conditions. This is mainly because many aspects of structural condition can
only be assessed objectively and accurately by engineers, architects, and/or other well-trained technicians and because, in general
surveys with large samples, assessments often involve non-professional interviewers’ and respondents’ subjective judgments and the
application of their limited professional knowledge and experience and their individual values, preferences, tastes, images of social
status, and other socio-economic characteristics.”
3
NYC Housing Brief www.comptroller.nyc.gov
Office of the New York City Comptroller
In addition, to the Housing Authority’s credit, there has been consistent improvement since 2002 in the three measures of wheelchair accessibility that are gauged by the HVS. However, with approximately 13 percent of buildings still recorded as inaccessible in the 2014 HVS, there remains much work to be done in order to achieve universal wheelchair accessibility in the City’s public housing stock.
Maintenance Deficiencies in Housing Units
The Housing and Vacancy Survey also includes numerous measures of maintenance conditions and equipment functionality in individual housing units. By their nature, the variables discussed in this section are of a narrower scope than in the previous section.
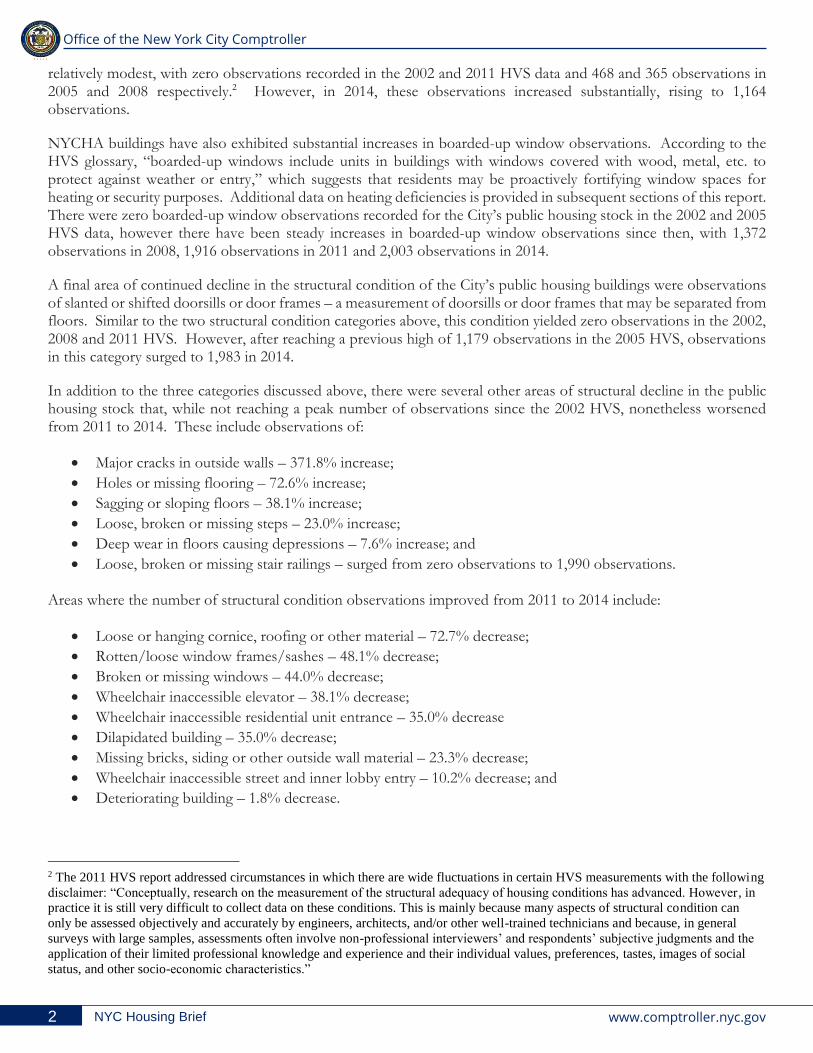
One new variable that was introduced in the 2014 HVS was the presence of musty or moldy smells. HVS respondents were asked to indicate how often they noticed musty or moldy smells while inside of their apartments. The rate of musty or moldy smell observations were substantially higher in public housing units compared to other major housing types.
As figure 1 illustrates, nearly a quarter of public housing residents reported some musty or moldy smells and over 7 percent reported that they are a daily occurrence. To put that daily percentage in perspective, residents in more than 12,600 public housing units must contend with musty or moldy smells every day.
Figure 1 – The rate of musty or moldy smells reported in major New York City housing types
Source: NYC Comptroller’s Office from 2014 New York City Housing and Vacancy Survey microdata
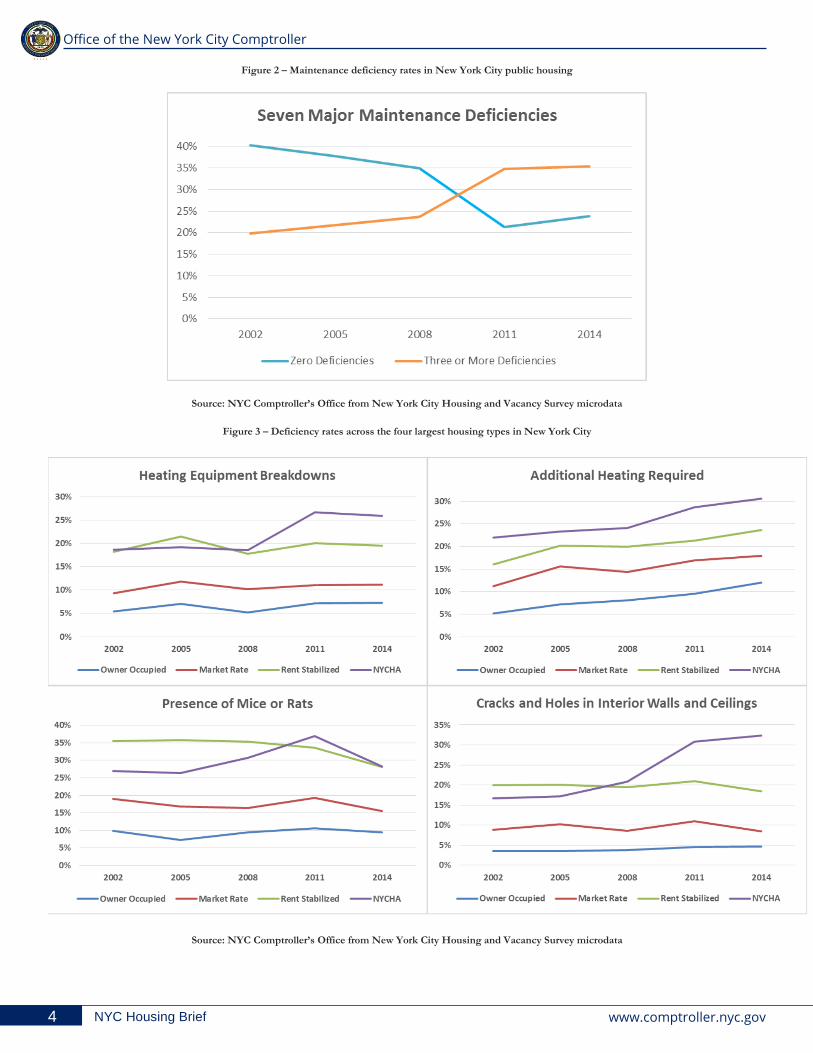
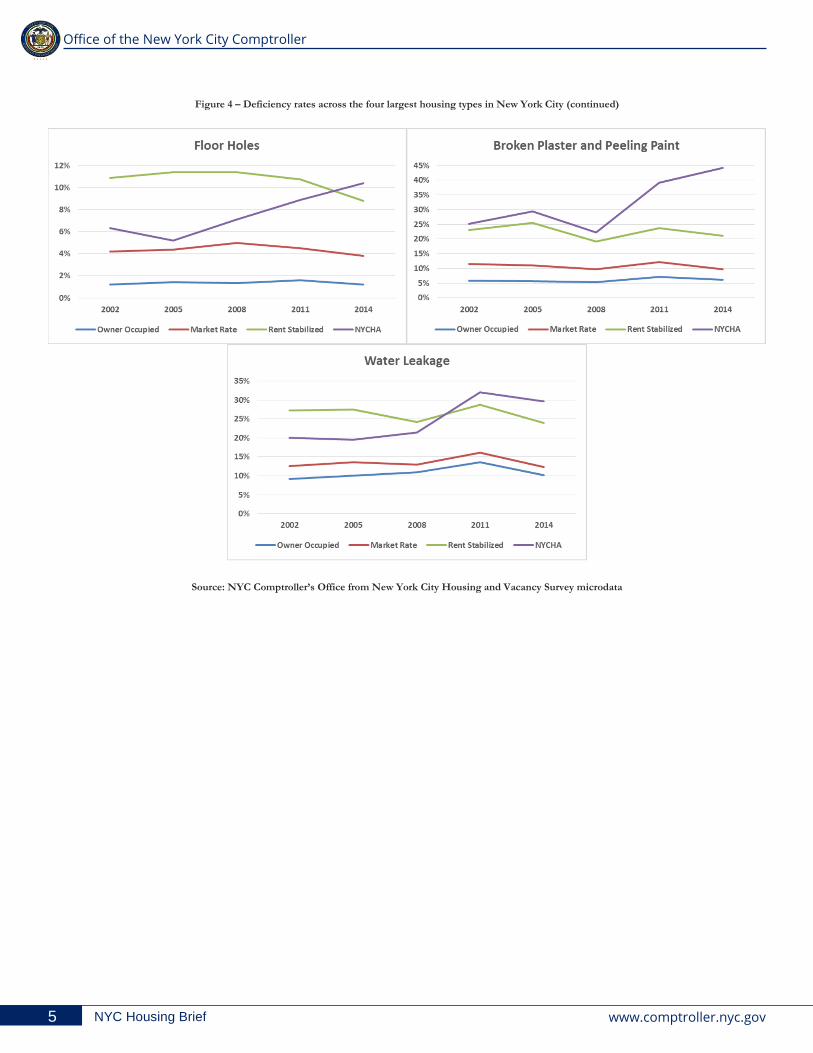
The HVS identifies seven major maintenance deficiencies which are bundled into a variable titled “number of 2014 maintenance deficiencies.” The seven deficiencies that are included in this bundle by the U.S. Census Bureau are: heating equipment breakdowns, additional heating required, presence of mice or rats, cracks and holes in interior walls and ceilings, floor holes, broken plaster and peeling paint and water leakage. These seven deficiencies were selected to include three measures of a housing unit’s maintenance deficiencies, three measures of a housing unit’s equipment deficiencies, and one measure focused on public health.
According to the most recent data from the 2014 HVS, four of the seven key deficiency rates worsened in the City’s public housing stock since 2011: additional heating required, cracks and holes in interior walls and ceilings, floor holes, and broken plaster and peeling paint. Two other notable maintenance deficiency rates in the City’s public housing stock that worsened from 2011 to 2014 include toilet breakdowns (6.2 percent increase) and kitchen facilities not working (7.0 percent increase).
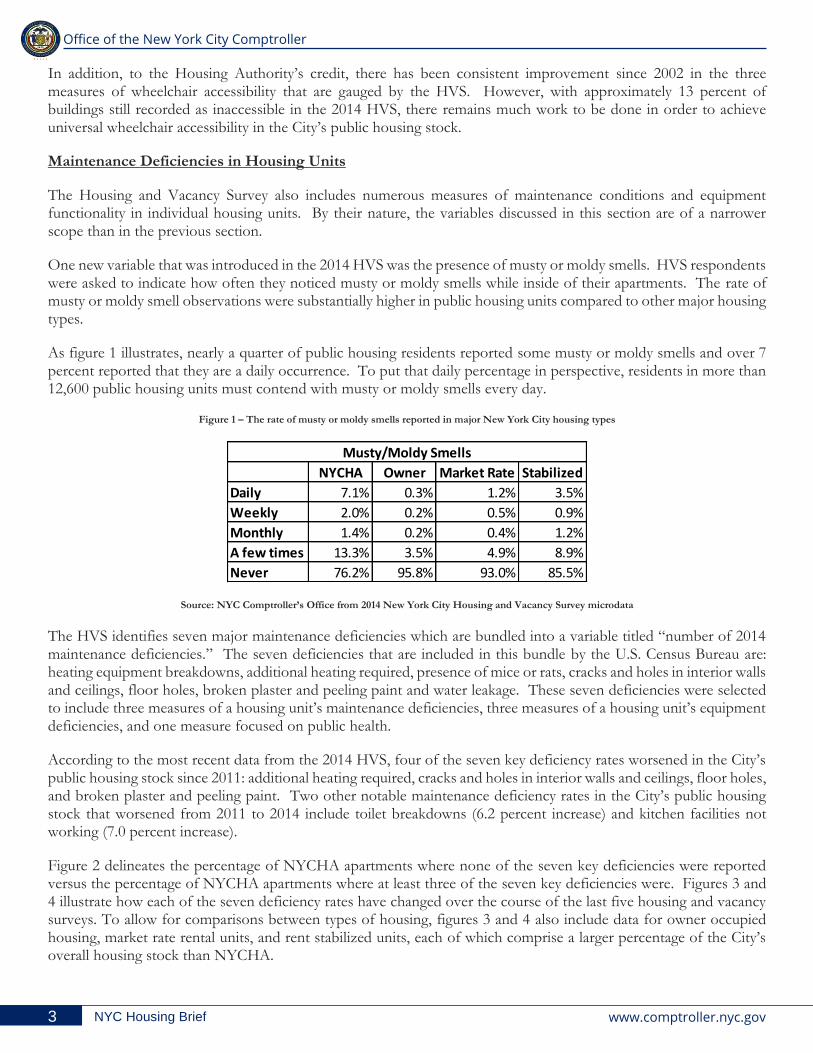
Figure 2 delineates the percentage of NYCHA apartments where none of the seven key deficiencies were reported versus the percentage of NYCHA apartments where at least three of the seven key deficiencies were. Figures 3 and 4 illustrate how each of the seven deficiency rates have changed over the course of the last five housing and vacancy surveys. To allow for comparisons between types of housing, figures 3 and 4 also include data for owner occupied housing, market rate rental units, and rent stabilized units, each of which comprise a larger percentage of the City’s overall housing stock than NYCHA.
NYCHA Owner Market Rate Stabilized
Daily 7.1% 0.3% 1.2% 3.5%
Weekly 2.0% 0.2% 0.5% 0.9%
Monthly 1.4% 0.2% 0.4% 1.2%
A few times 13.3% 3.5% 4.9% 8.9%
Never 76.2% 95.8% 93.0% 85.5%
Musty/Moldy Smells
4
NYC Housing Brief www.comptroller.nyc.gov
Office of the New York City Comptroller
Figure 2 – Maintenance deficiency rates in New York City public housing
Source: NYC Comptroller’s Office from New York City Housing and Vacancy Survey microdata
Figure 3 – Deficiency rates across the four largest housing types in New York City
Source: NYC Comptroller’s Office from New York City Housing and Vacancy Survey microdata
5
NYC Housing Brief www.comptroller.nyc.gov
Office of the New York City Comptroller
Figure 4 – Deficiency rates across the four largest housing types in New York City (continued)
Source: NYC Comptroller’s Office from New York City Housing and Vacancy Survey microdata
0
0
NYC Housing Brief www.comptroller.nyc.gov
@scottmstringer facebook.com/scottstringernyc @scottmstringer stringertheory
New York City Comptroller
Scott M. Stringer
Municipal Building · 1 Centre Street, 5th Floor · New York, NY 10007 Phone (212) 669-3500 · Fax (212) 669-8878
www.comptroller.nyc.gov