Embed Size (px)
Citation preview
nVent Investor Presentation
April 2018
Forward Looking Statement
2
CAUTION CONCERNING FORWARD-LOOKING STATEMENTS
This presentation contains statements that we believe to be "forward-looking statements" within the meaning of the Private Securities Litigation Reform Act of 1995. All statements, other than statements of historical fact are forward-looking statements. Without limitation, any statements preceded or followed by or that include the words "targets," "plans," "believes," "expects," "intends," "will," "likely," "may," "anticipates," "estimates," "projects," "should," "would," "positioned," "strategy," "future" or words, phrases or terms of similar substance or the negative thereof, are forward-looking statements. All projections in this presentation are also forward-looking statements. These forward-looking statements are not guarantees of future performance and are subject to risks, uncertainties, assumptions and other factors, some of which are beyond our control, which could cause actual results to differ materially from those expressed or implied by such forward-looking statements. These factors include the ability to satisfy the necessary conditions to consummate the planned separation of our Electrical business and the Water business of Pentair plc into two independent, publicly-traded companies (the "Separation") on a timely basis or at all; the ability to successfully separate our business and realize the anticipated benefits from the Separation; adverse effects on our business operations or financial results as a result of the announcement or consummation of the Separation; unanticipated transaction expenses, such as litigation or legal settlement expenses; changes in tax laws; the impact of the Separation on our employees, customers and suppliers; overall global economic and business conditions impacting our businesses; the ability of our business to operate independently following the Separation; the ability to achieve the benefits of our restructuring plans; the ability to successfully identify, finance, complete and integrate acquisitions; competition and pricing pressures in the markets we serve; the strength of housing and related markets; volatility in currency exchange rates and commodity prices; inability to generate savings from excellence in operations initiatives consisting of lean enterprise, supply management and cash flow practices; increased risks associated with operating foreign businesses; the ability to deliver backlog and win future project work; failure of markets to accept new product introductions and enhancements; the impact of changes in laws and regulations, including those that limit U.S. tax benefits; the outcome of litigation and governmental proceedings; and the ability to achieve our long-term strategic operating goals. Additional information concerning these and other factors is contained in our filings with the SEC, including our Registration Statement on Form 10. All forward-looking statements speak only as of the date of this presentation. nVent Electric plc assumes no obligation, and disclaims any obligation, to update the information contained in this presentation.
The officer titles for individual speakers set forth in this presentation are the titles such persons are expected to have at nVent Electric plc after the completion of the Separation.

Key Definitions
3
Except as Otherwise Noted, All References to nVent and All Amounts Included Herein Represent the Pentair Electrical Business Excluding the Pentair Water Business, Presented on an Adjusted Basis
“Organic Sales" Refers to GAAP Revenue Excluding (1) the Impact of Currency Translation and (2) the Impact of Revenue from Acquired Businesses Recorded Prior to the First Anniversary of the Acquisition Less the Amount of Sales Attributable to Divested Product Lines Not Considered Discontinued Operations
Segment Income (Adjusted EBITA) Represents Operating Income Exclusive of Non-Cash
Intangible Amortization, Certain Acquisition Related Expenses, Costs of Restructuring Activities, Impairments, and Other Unusual Non-Operating Items
Return on Sales ("ROS") Equals Segment Income Divided by Sales
The 2018 Full Year and Q2 Outlook Included Herein Reflects the Anticipated Separation of nVent from Pentair on April 30, 2018
See Appendix for GAAP to Non-GAAP Reconciliations
4
nVent Presenters
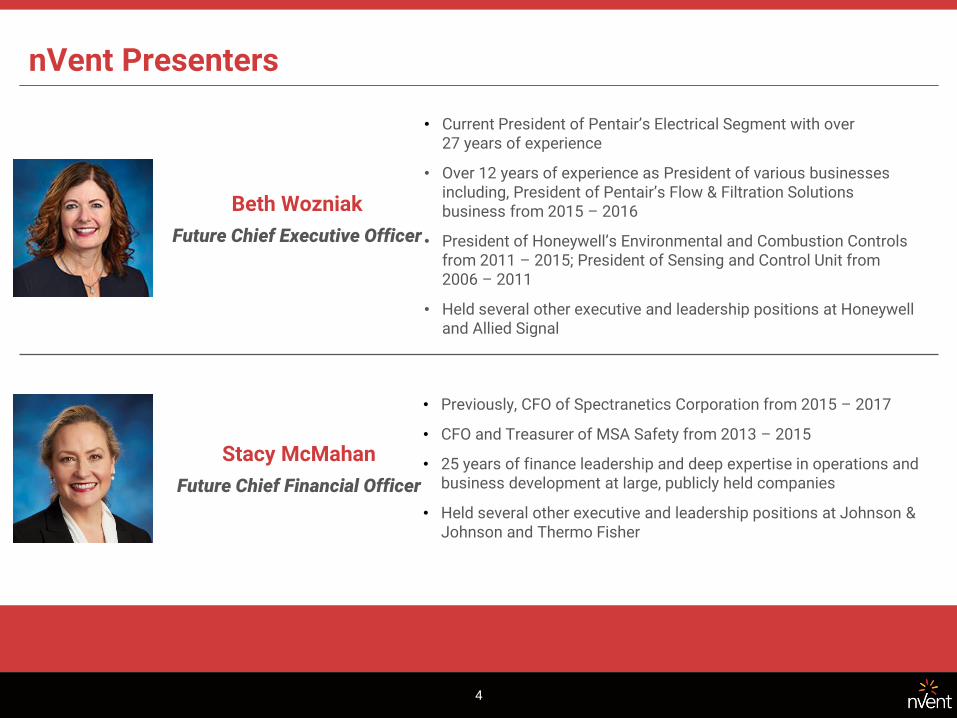
Beth Wozniak
Future Chief Executive Officer
Stacy McMahan
Future Chief Financial Officer
• Current President of Pentair’s Electrical Segment with over 27 years of experience
• Over 12 years of experience as President of various businesses including, President of Pentair’s Flow & Filtration Solutions business from 2015 – 2016
• President of Honeywell’s Environmental and Combustion Controls from 2011 – 2015; President of Sensing and Control Unit from 2006 – 2011
• Held several other executive and leadership positions at Honeywell and Allied Signal
• Previously, CFO of Spectranetics Corporation from 2015 – 2017
• CFO and Treasurer of MSA Safety from 2013 – 2015
• 25 years of finance leadership and deep expertise in operations and business development at large, publicly held companies
• Held several other executive and leadership positions at Johnson & Johnson and Thermo Fisher
Confidential & Proprietary
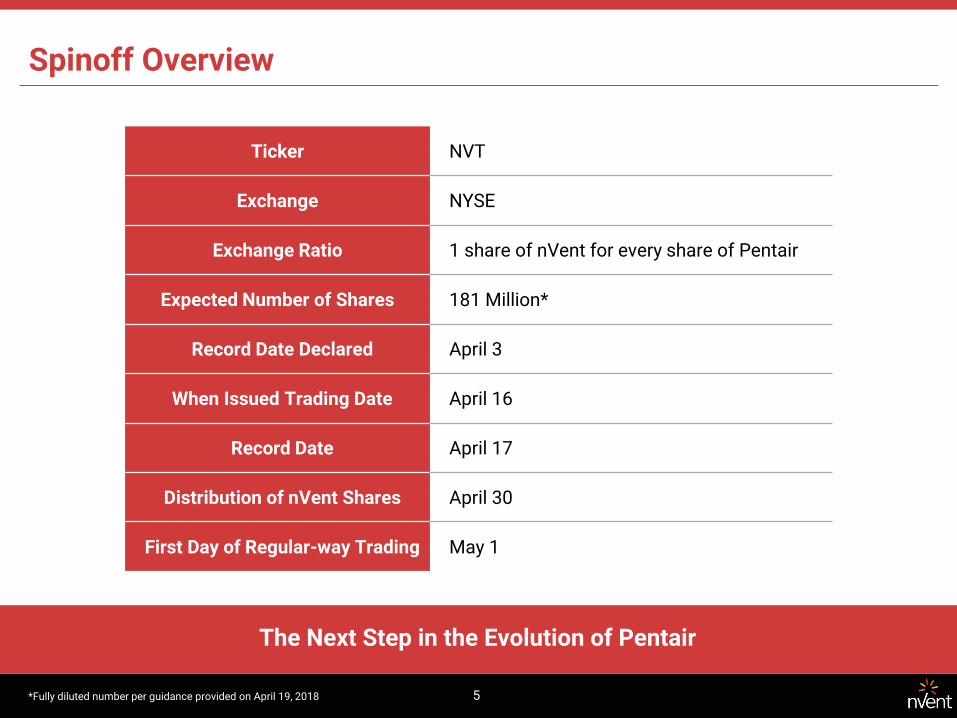
5 *Fully diluted number per guidance provided on April 19, 2018
Spinoff Overview
The Next Step in the Evolution of Pentair
Ticker NVT
Exchange NYSE
Exchange Ratio 1 share of nVent for every share of Pentair
Expected Number of Shares 181 Million*
Record Date Declared April 3
When Issued Trading Date April 16
Record Date April 17
Distribution of nVent Shares April 30
First Day of Regular-way Trading May 1
Confidential & Proprietary
6
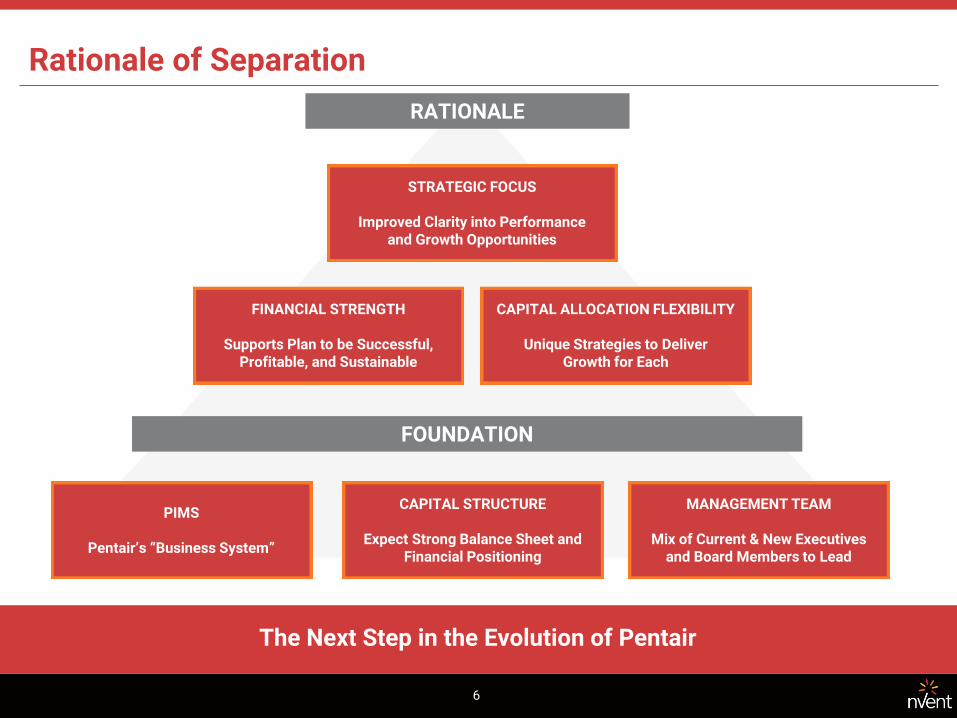
Rationale of Separation
The Next Step in the Evolution of Pentair
RATIONALE
FOUNDATION
STRATEGIC FOCUS
Improved Clarity into Performance and Growth Opportunities
CAPITAL ALLOCATION FLEXIBILITY
Unique Strategies to Deliver Growth for Each
FINANCIAL STRENGTH
Supports Plan to be Successful, Profitable, and Sustainable
PIMS
Pentair’s “Business System”
MANAGEMENT TEAM
Mix of Current & New Executives and Board Members to Lead
CAPITAL STRUCTURE
Expect Strong Balance Sheet and Financial Positioning
7
Agenda
1. Introduction to nVent
2. Strategic Priorities
3. Financial Overview
Appendix: Supplementary Information

1. Introduction to nVent
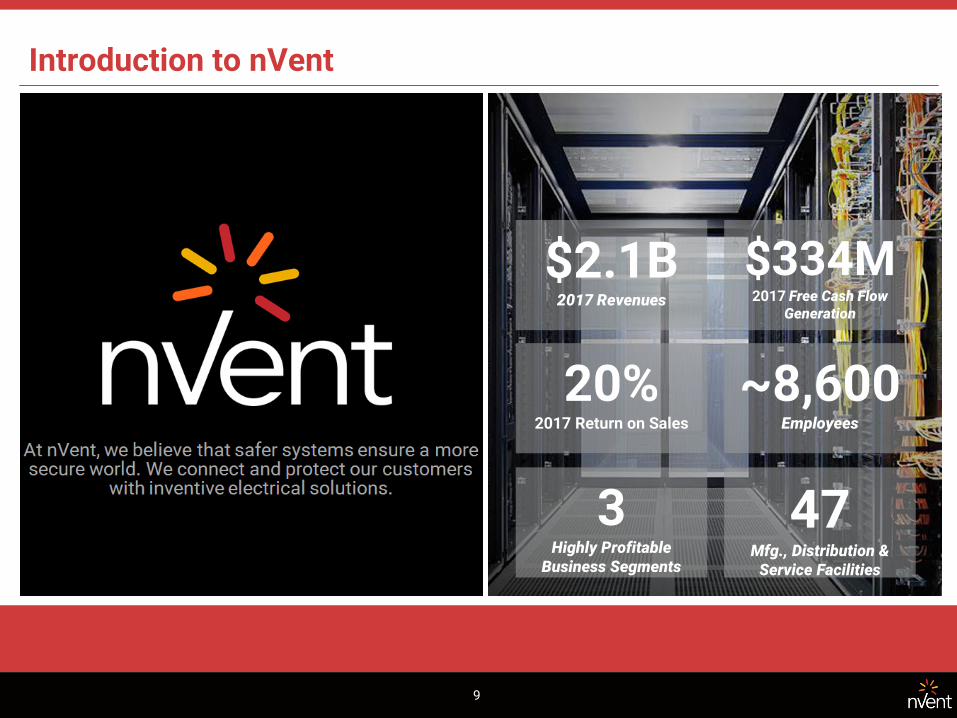
Introduction to nVent
3 Highly Profitable
Business Segments
47 Mfg., Distribution &
Service Facilities
~8,600 Employees
20% 2017 Return on Sales
$334M 2017 Free Cash Flow
Generation
$2.1B 2017 Revenues
9
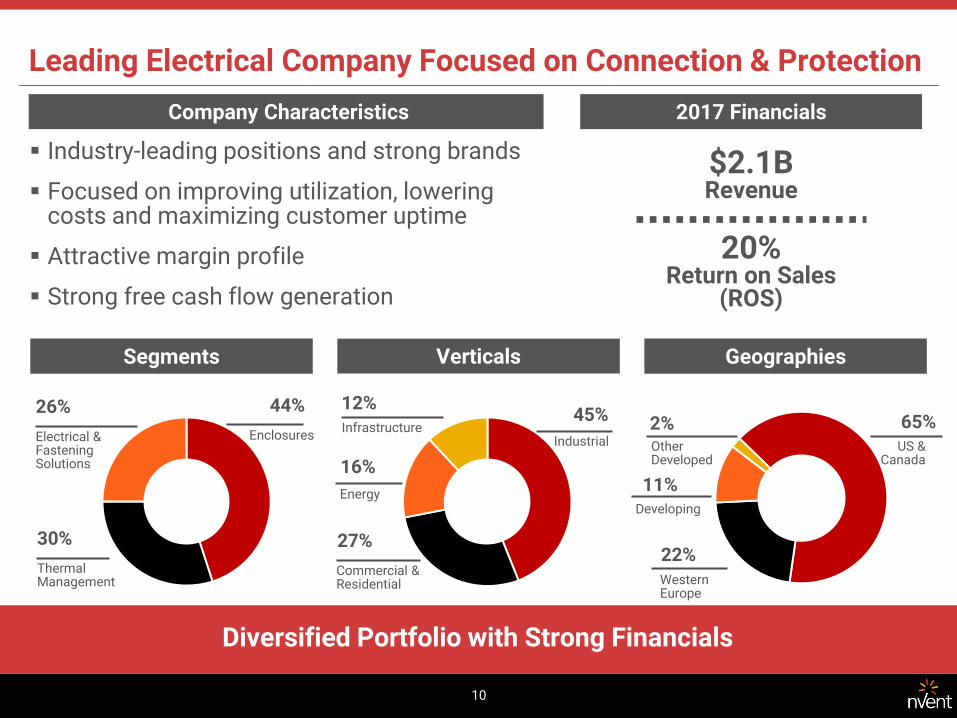
Leading Electrical Company Focused on Connection & Protection
Diversified Portfolio with Strong Financials
Industrial
Company Characteristics
Verticals Segments Geographies
US & Canada
65%
Western Europe
22%
Developing
11%
Other Developed
2% 45% Infrastructure
12%
Enclosures
44%
Thermal Management
30%
Electrical & Fastening Solutions
26%
Commercial & Residential
27%
Energy
16%
Industry-leading positions and strong brands
Focused on improving utilization, lowering costs and maximizing customer uptime
Attractive margin profile
Strong free cash flow generation
2017 Financials
20% Return on Sales
(ROS)
$2.1B Revenue
10
11
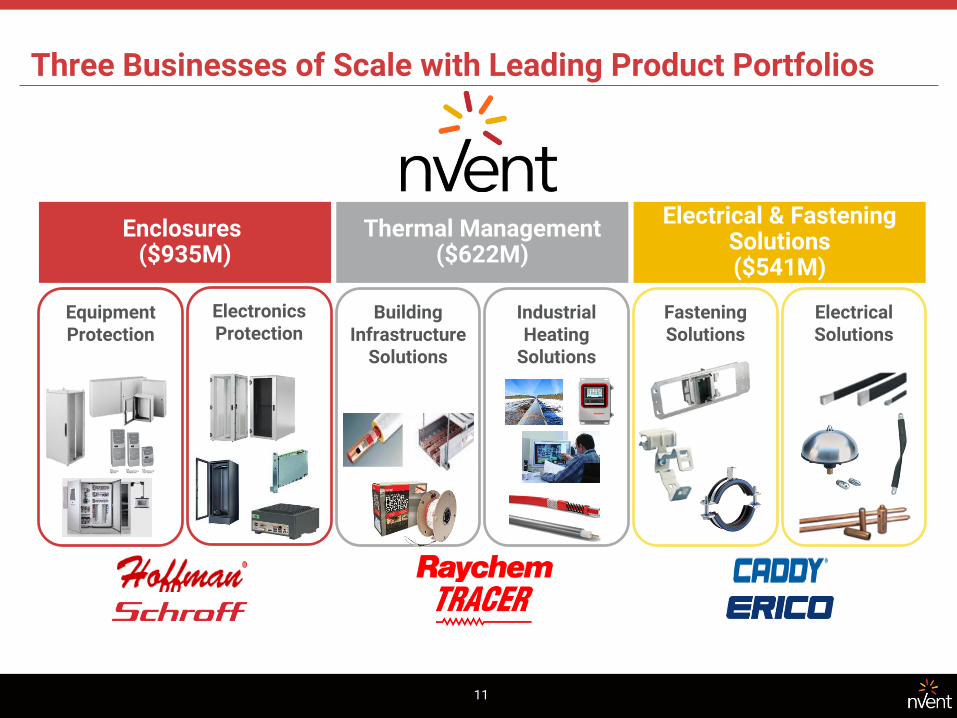
Three Businesses of Scale with Leading Product Portfolios
Thermal Management ($622M)
Enclosures ($935M)
Electrical & Fastening Solutions ($541M)
Equipment Protection
Building Infrastructure
Solutions
Industrial Heating
Solutions
Electronics Protection
Fastening Solutions
Electrical Solutions
Our Value and Differentiation Drive Customer Loyalty
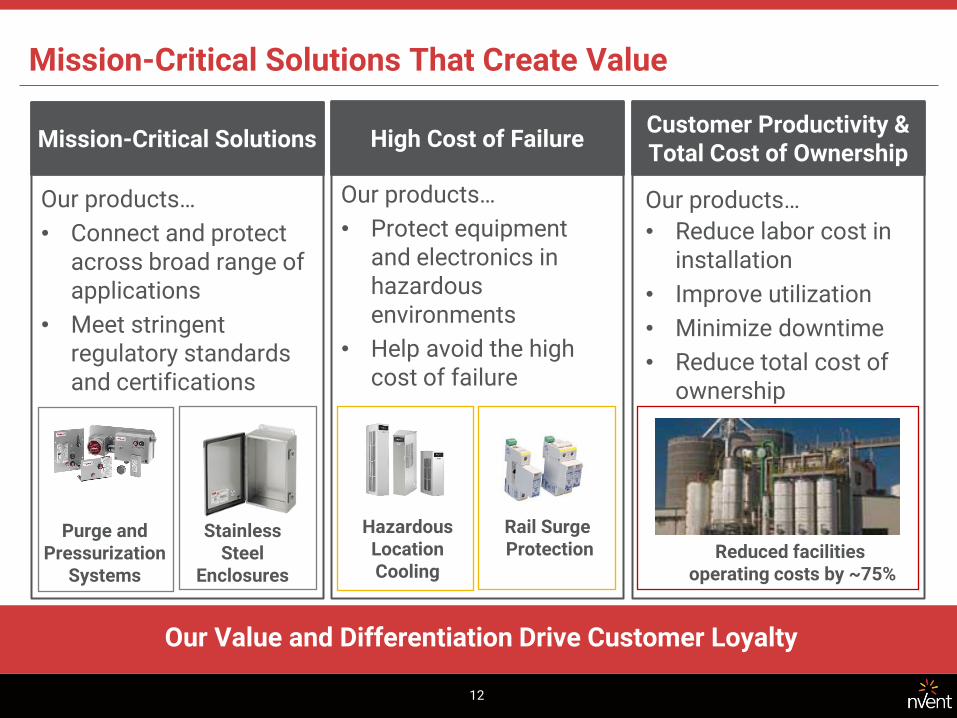
Our products…
• Connect and protect across broad range of applications
• Meet stringent regulatory standards and certifications
Our products…
• Protect equipment and electronics in hazardous environments
• Help avoid the high cost of failure
Hazardous Location Cooling
Reduced facilities operating costs by ~75%
Our products…
• Reduce labor cost in installation
• Improve utilization
• Minimize downtime
• Reduce total cost of ownership
Rail Surge Protection
Mission-Critical Solutions High Cost of Failure Customer Productivity & Total Cost of Ownership
Stainless Steel
Enclosures
Purge and Pressurization
Systems
Mission-Critical Solutions That Create Value
12
13
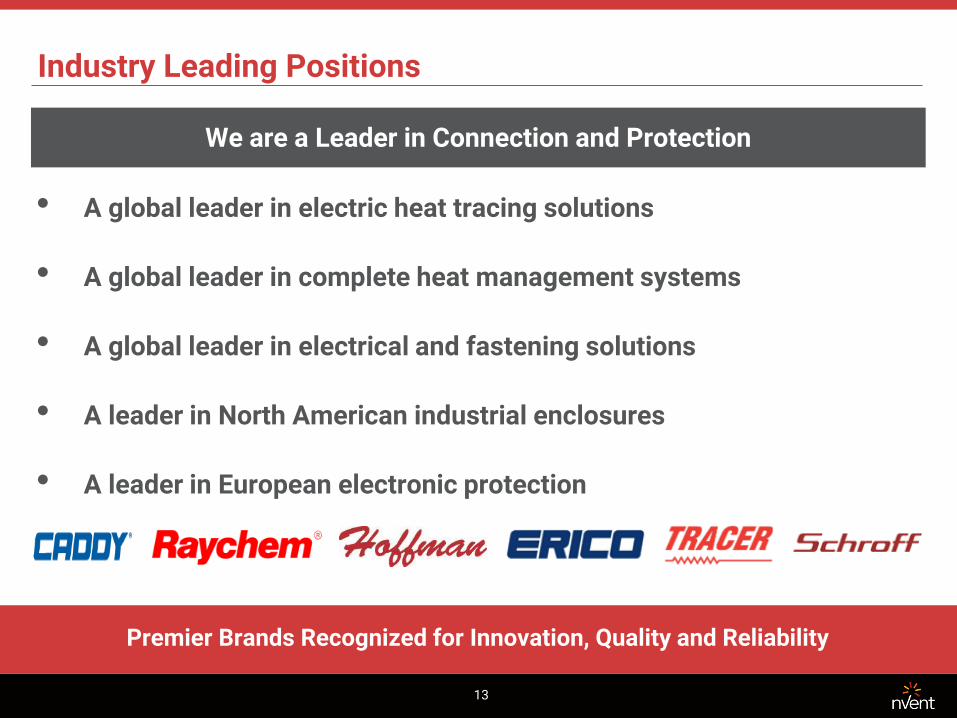
Industry Leading Positions
Premier Brands Recognized for Innovation, Quality and Reliability
• A global leader in electric heat tracing solutions
• A global leader in complete heat management systems
• A global leader in electrical and fastening solutions
• A leader in North American industrial enclosures
• A leader in European electronic protection
We are a Leader in Connection and Protection
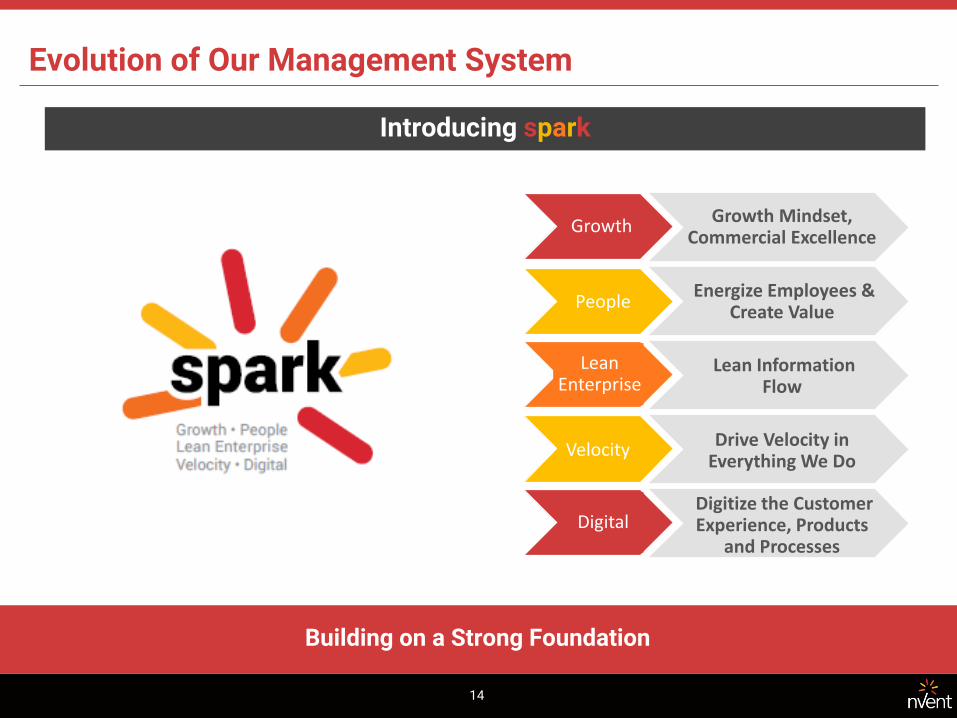
Evolution of Our Management System
Building on a Strong Foundation
Introducing spark
14
Growth
People
Lean Enterprise
Velocity
Digital
Growth Mindset, Commercial Excellence
Energize Employees & Create Value
Lean Information Flow
Drive Velocity in Everything We Do
Digitize the Customer Experience, Products
and Processes

2. Strategic Priorities
Drive Productivity & Velocity
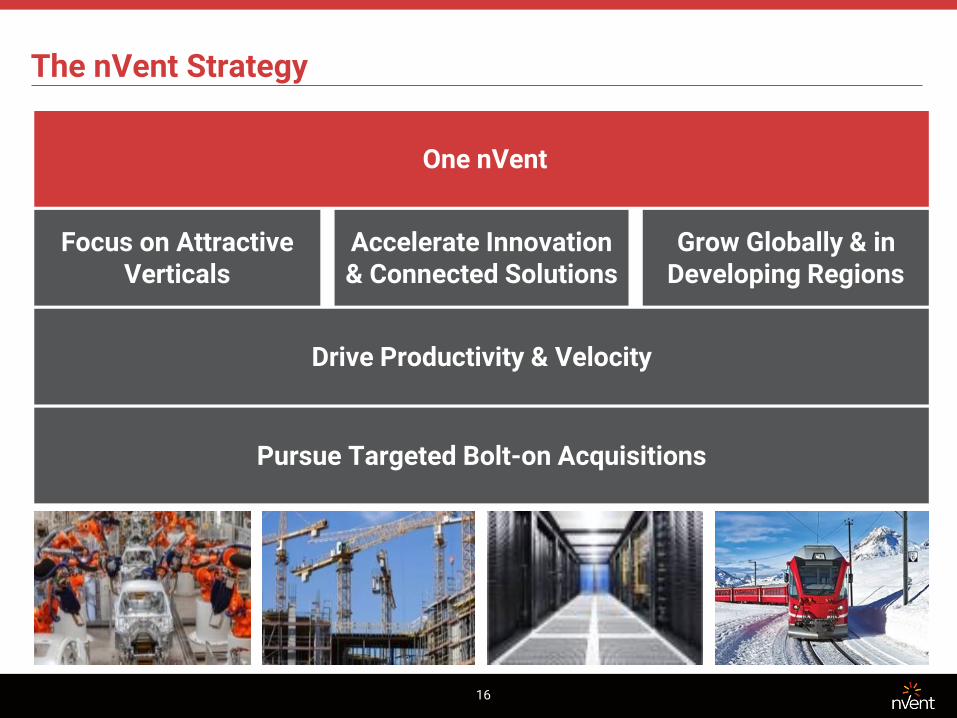
The nVent Strategy
16
One nVent
Focus on Attractive Verticals
Accelerate Innovation & Connected Solutions
Grow Globally & in Developing Regions
Pursue Targeted Bolt-on Acquisitions
17
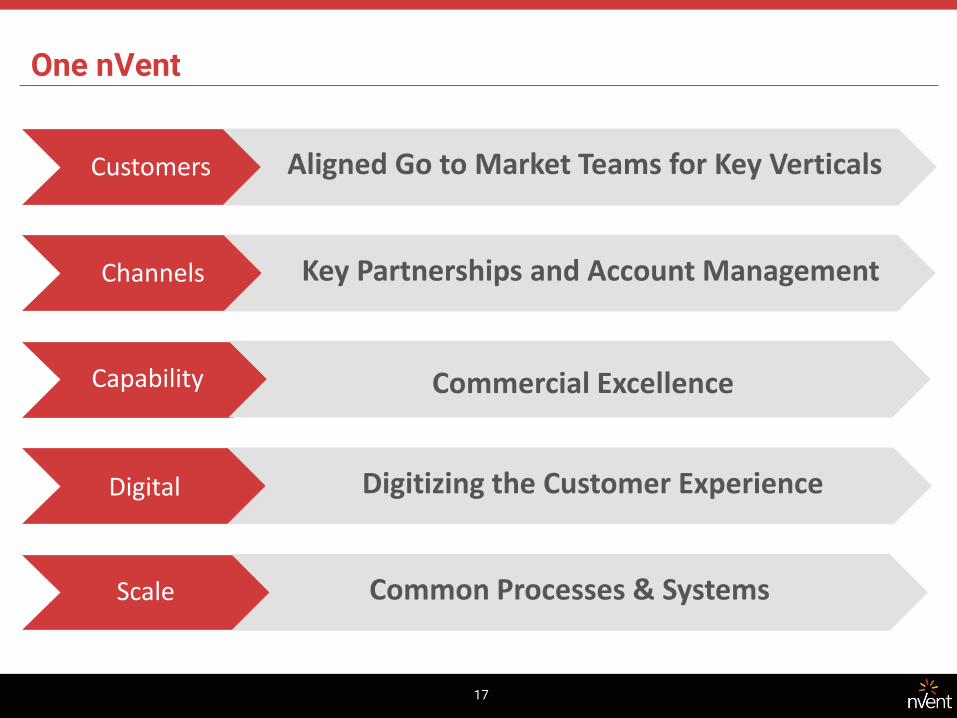
One nVent
Customers Aligned Go to Market Teams for Key Verticals
Channels Key Partnerships and Account Management
Capability Commercial Excellence
Digital Digitizing the Customer Experience
Scale Common Processes & Systems
18
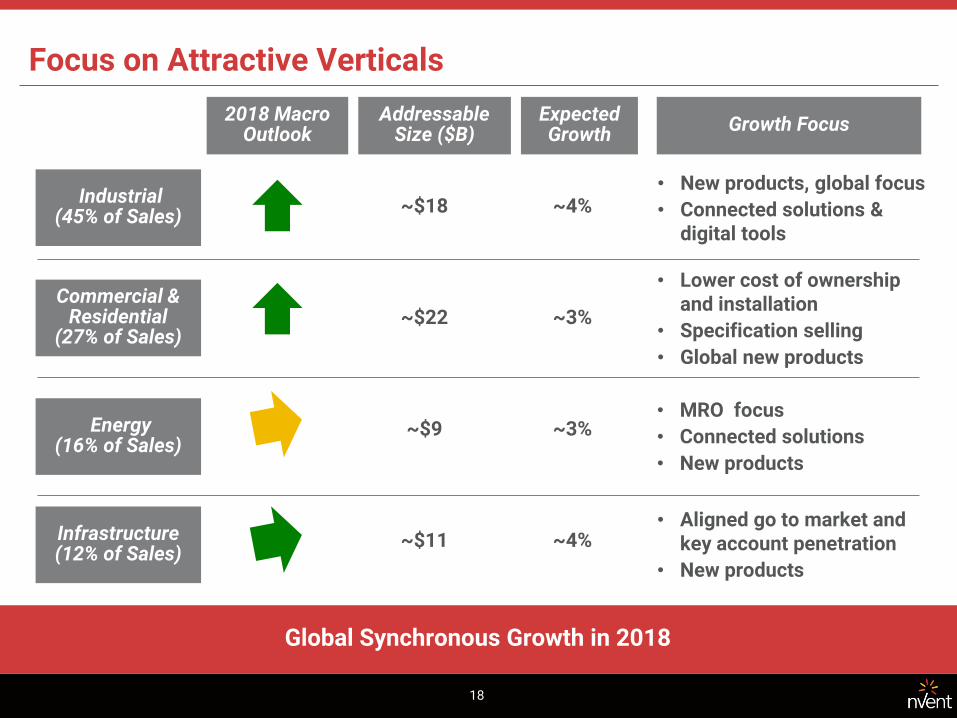
Focus on Attractive Verticals
Global Synchronous Growth in 2018
2018 Macro Outlook
Commercial & Residential
(27% of Sales)
Industrial (45% of Sales)
Energy (16% of Sales)
Infrastructure (12% of Sales)
Growth Focus
• Lower cost of ownership and installation
• Specification selling
• Global new products
• New products, global focus
• Connected solutions & digital tools
• MRO focus
• Connected solutions
• New products
• Aligned go to market and key account penetration
• New products
Addressable Size ($B)
Expected Growth
~$18
~$22
~$9
~$11
~4%
~3%
~3%
~4%

19
Accelerate Innovation and Connected Solutions
Innovative and Connected Solutions Addressing Unmet Needs
• Unique low-smoke, halogen-free, and flame-retardant insulation
• Reduces Total Installed Cost
• Improves safety and reliability
Thermal Commercial Controller
Advanced Flexible Busbar Thermal Industrial Controller
Integrated Liquid Cooling Solutions
• Safe and reliable temperature control
• Connected controls and monitoring solutions
• Advanced connected controls platform for heat tracing and leak detection
• Building Management System connectivity
• Differentiated air to water and water to water high density heat exchangers
• Critical need in datacenters for high density heat loads
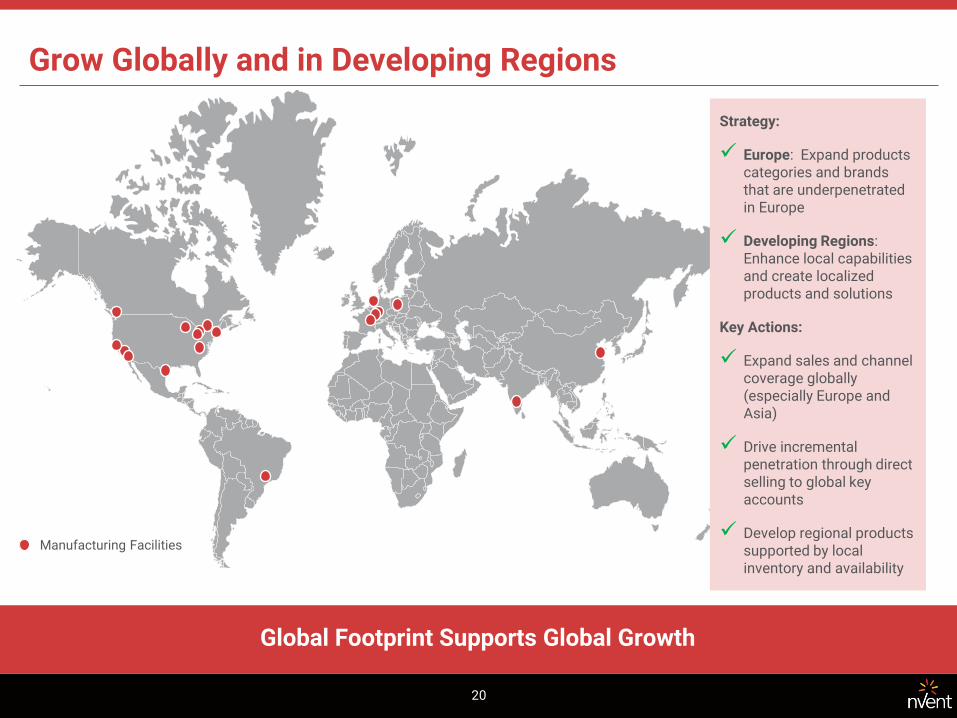
Grow Globally and in Developing Regions
Global Footprint Supports Global Growth
Manufacturing Facilities
Strategy:
Europe: Expand products categories and brands that are underpenetrated in Europe
Developing Regions: Enhance local capabilities and create localized products and solutions
Key Actions:
Expand sales and channel coverage globally (especially Europe and Asia)
Drive incremental penetration through direct selling to global key accounts
Develop regional products supported by local inventory and availability
20
21
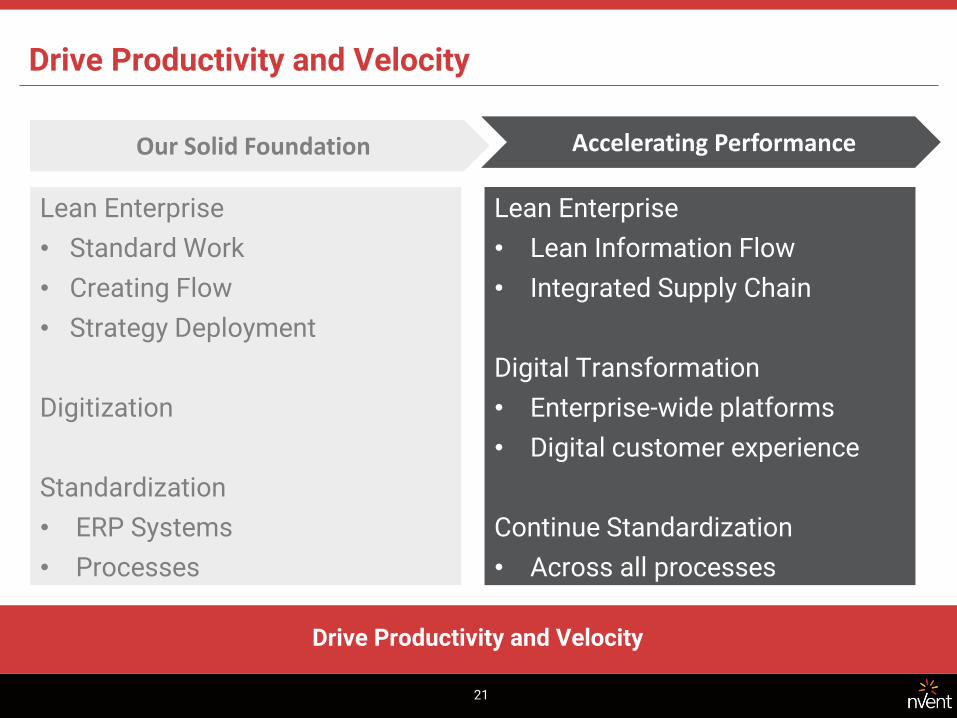
Drive Productivity and Velocity
Drive Productivity and Velocity
Our Solid Foundation
Lean Enterprise
• Standard Work
• Creating Flow
• Strategy Deployment
Digitization
Standardization
• ERP Systems
• Processes
Lean Enterprise
• Lean Information Flow
• Integrated Supply Chain
Digital Transformation
• Enterprise-wide platforms
• Digital customer experience
Continue Standardization
• Across all processes
Accelerating Performance
22
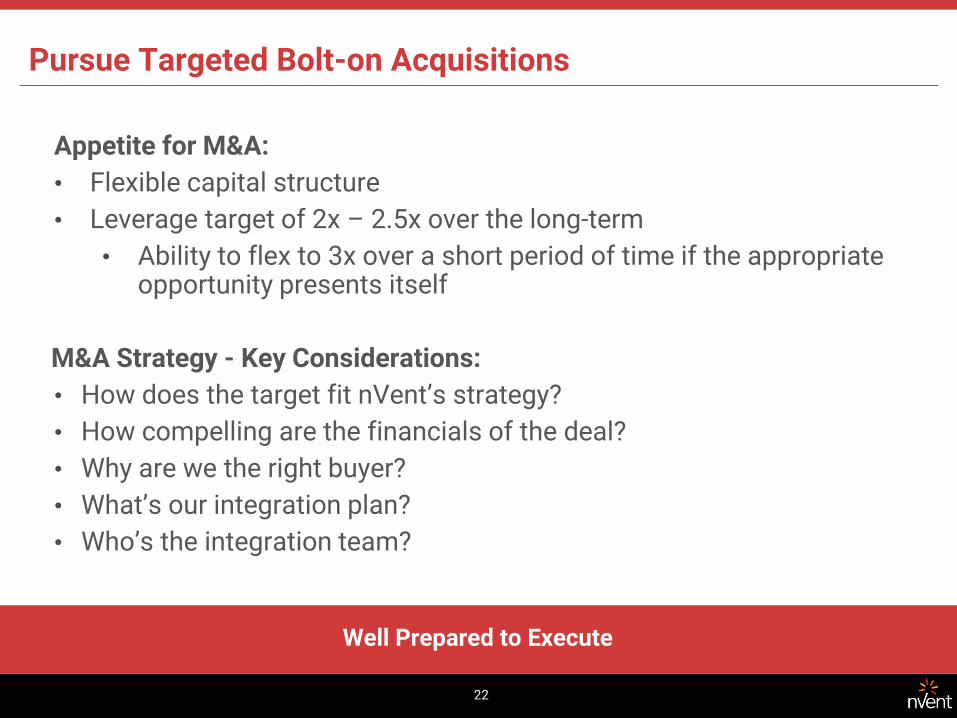
Pursue Targeted Bolt-on Acquisitions
Well Prepared to Execute
Appetite for M&A:
• Flexible capital structure
• Leverage target of 2x – 2.5x over the long-term
• Ability to flex to 3x over a short period of time if the appropriate opportunity presents itself
M&A Strategy - Key Considerations:
• How does the target fit nVent’s strategy?
• How compelling are the financials of the deal?
• Why are we the right buyer?
• What’s our integration plan?
• Who’s the integration team?
3. Financial Overview
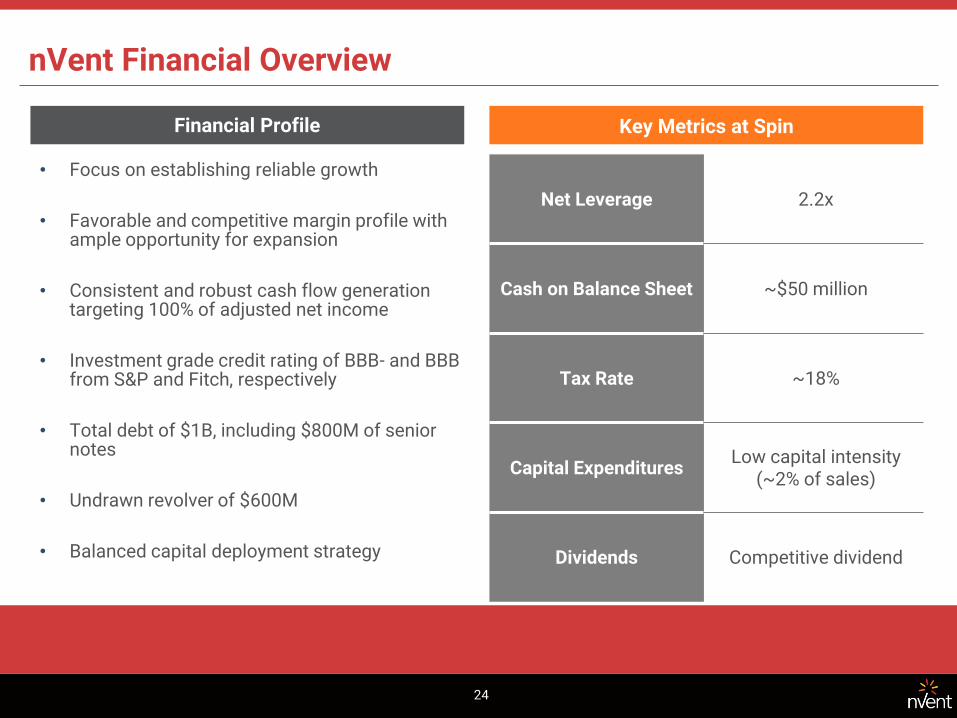
nVent Financial Overview
24
Key Metrics at Spin
Net Leverage 2.2x
Cash on Balance Sheet ~$50 million
Tax Rate ~18%
Capital Expenditures Low capital intensity
(~2% of sales)
Dividends Competitive dividend
• Focus on establishing reliable growth
• Favorable and competitive margin profile with ample opportunity for expansion
• Consistent and robust cash flow generation targeting 100% of adjusted net income
• Investment grade credit rating of BBB- and BBB from S&P and Fitch, respectively
• Total debt of $1B, including $800M of senior notes
• Undrawn revolver of $600M
• Balanced capital deployment strategy
Financial Profile
$344 $407 $410
2015 2016 2017 2018 Outlook
25
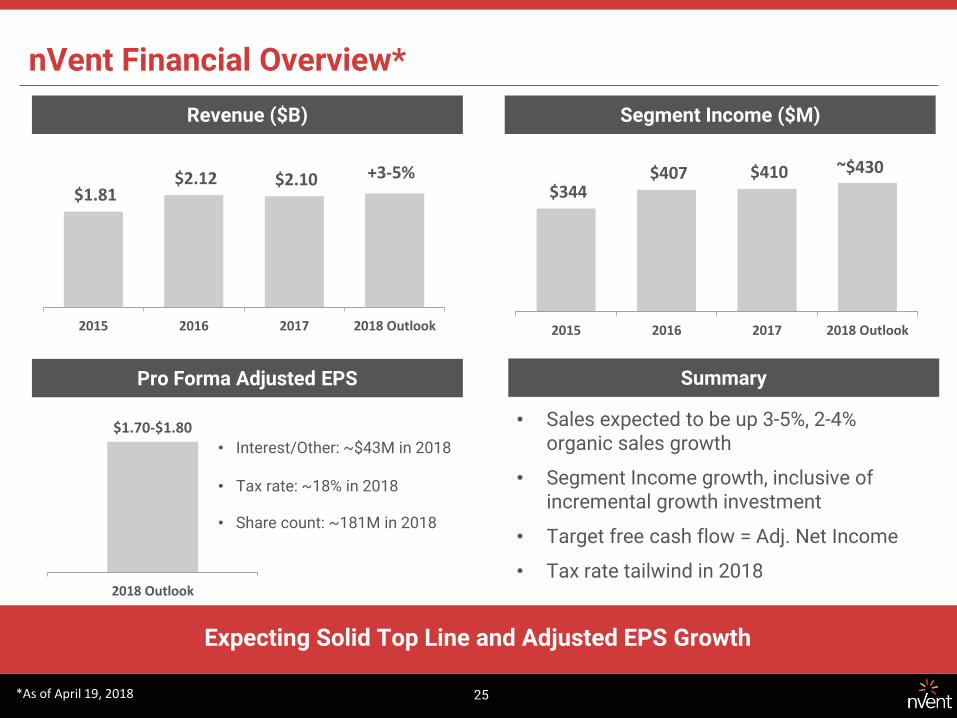
nVent Financial Overview*
Expecting Solid Top Line and Adjusted EPS Growth
Revenue ($B) Segment Income ($M)
Pro Forma Adjusted EPS
$1.81 $2.12 $2.10
2015 2016 2017 2018 Outlook
2018 Outlook
$1.70-$1.80
• Interest/Other: ~$43M in 2018 • Tax rate: ~18% in 2018
• Share count: ~181M in 2018
Summary
• Sales expected to be up 3-5%, 2-4% organic sales growth
• Segment Income growth, inclusive of incremental growth investment
• Target free cash flow = Adj. Net Income
• Tax rate tailwind in 2018
+3-5% ~$430
*As of April 19, 2018

Drive profitable growth
• Commercial excellence
• Pricing optimization
• Product vitality acceleration
Expand lean enterprise
• Lean information flow
• Integrated supply chain
Driving common processes and systems
¹ Selected Electrical Peers include ABB, Acuity, Eaton, Hubbell, Rockwell Automation, Schneider Electric, and Thermon. Peer 2018E EBITA margins based on IBES median estimates as of 13-Apr-2018 and reported amortization projections from latest filings.
Favorable Margin Profile with Opportunities for Expansion
26
Opportunity to Drive Margin Expansion
$1,809 $2,116 $2,098
19% 20% 20%
2015 2016 2017
Sales ROS
Competitive Margin vs Peers1
Current Margin Profile
Sales ($ in millions) & ROS
Established margin performance via:
• Diversification
• Growth in new regions and new products
• MRO business mix
• Lean enterprise
2018E Adj. EBITA Margin¹ (ROS) of Selected Electrical Peers
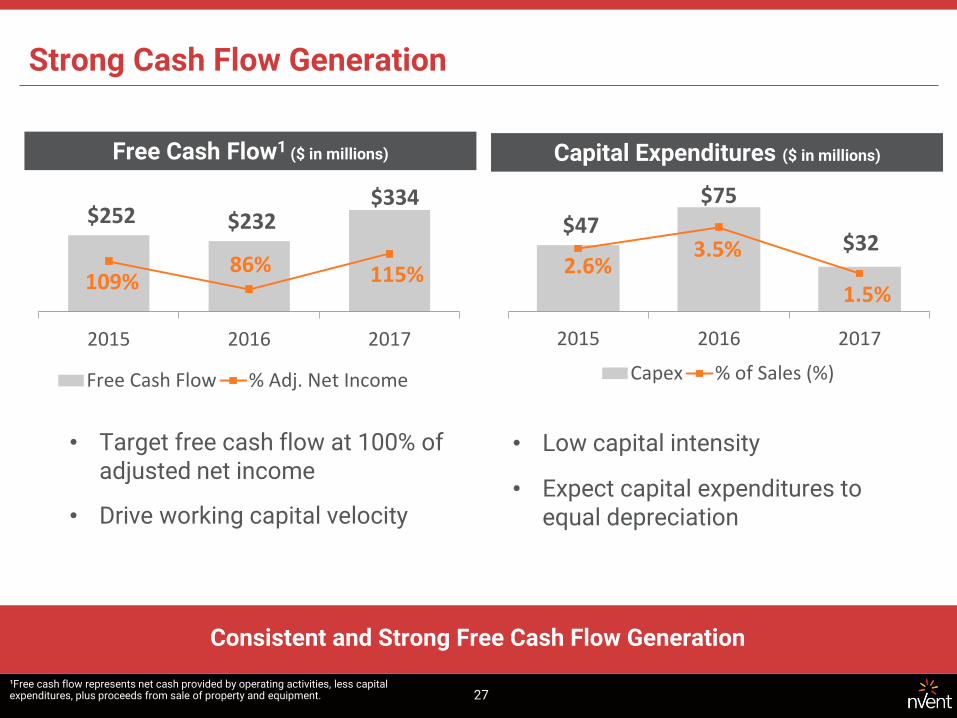
Strong Cash Flow Generation
Consistent and Strong Free Cash Flow Generation
• Target free cash flow at 100% of adjusted net income
• Drive working capital velocity
Free Cash Flow1 ($ in millions) Capital Expenditures ($ in millions)
$47 $75
$32 2.6%
3.5%
1.5%
2015 2016 2017
Capex % of Sales (%)
$252 $232 $334
109% 86% 115%
2015 2016 2017
Free Cash Flow % Adj. Net Income
¹Free cash flow represents net cash provided by operating activities, less capital expenditures, plus proceeds from sale of property and equipment.
• Low capital intensity
• Expect capital expenditures to equal depreciation
27

28
Conservative Capital Structure and Allocation Philosophy
Committed and Disciplined
• Target investment grade metrics
• Balanced capital deployment strategy
• Competitive dividend policy
• Share repurchases to offset dilution at a minimum
• Bolt-on acquisitions targeting focused growth areas
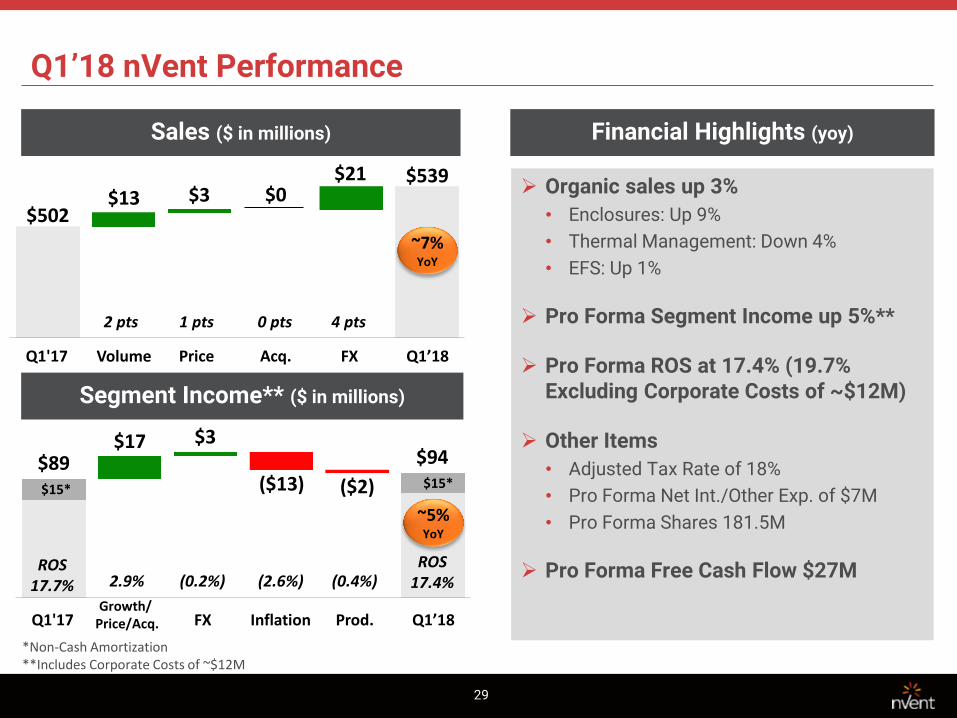
Q1’18 nVent Performance
29
Sales ($ in millions) Financial Highlights (yoy)
Segment Income** ($ in millions)
Organic sales up 3%
• Enclosures: Up 9%
• Thermal Management: Down 4%
• EFS: Up 1%
Pro Forma Segment Income up 5%**
Pro Forma ROS at 17.4% (19.7% Excluding Corporate Costs of ~$12M)
Other Items
• Adjusted Tax Rate of 18%
• Pro Forma Net Int./Other Exp. of $7M
• Pro Forma Shares 181.5M
Pro Forma Free Cash Flow $27M
$13 $502
$3 $0 $21 $539
Q1'17 FX Q1’18 Price Volume Acq.
2 pts 1 pts 0 pts 4 pts
~7% YoY
$15*
$17 $89
$3
($13) ($2)
$94
$15*
ROS 17.7%
ROS 17.4%
Q1'17 Q1’18 Prod. Inflation Growth/
Price/Acq. FX
~5% YoY
2.9% (0.2%) (2.6%) (0.4%)
*Non-Cash Amortization **Includes Corporate Costs of ~$12M
30
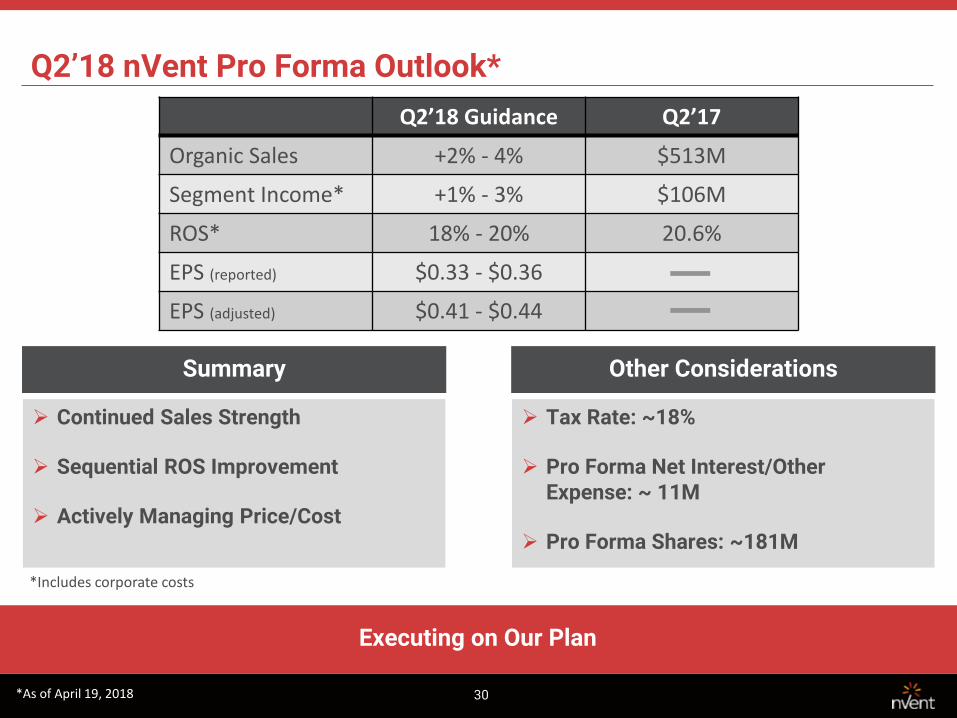
Q2’18 nVent Pro Forma Outlook*
Executing on Our Plan
Summary Other Considerations
Continued Sales Strength
Sequential ROS Improvement
Actively Managing Price/Cost
Tax Rate: ~18%
Pro Forma Net Interest/Other Expense: ~ 11M
Pro Forma Shares: ~181M
Q2’18 Guidance Q2’17
Organic Sales +2% - 4% $513M
Segment Income* +1% - 3% $106M
ROS* 18% - 20% 20.6%
EPS (reported) $0.33 - $0.36
EPS (adjusted) $0.41 - $0.44
*Includes corporate costs
*As of April 19, 2018

31
Full Year 2018 nVent Pro Forma Outlook*
On Track to Deliver 2018
Enclosures Thermal Mgmt. EFS Total
Organic Sales Up 3-5% Up 0-2% Up 2-4% Up 2-4%
ROS ~Flat +50-70bps +30-50bps ~Flat
Corporate Expenses ~$45M
Int. Exp./Other ~$43M
Tax Rate ~18%
Reported EPS $1.38 - $1.48
Adjusted EPS $1.70 - $1.80
Shares ~181M
Key Considerations
• FX Sales Benefit of ~1% • ROS Inclusive of Growth Investments • Total D&A of ~$100M + ~$13M of Non-Cash
Stock Compensation
• Strong Q1 Operating Performance and Lower Share Count Largely Offset Higher Int. Exp.
• Target Free Cash Flow at 100% of Adjusted Net Income
*As of April 19, 2018
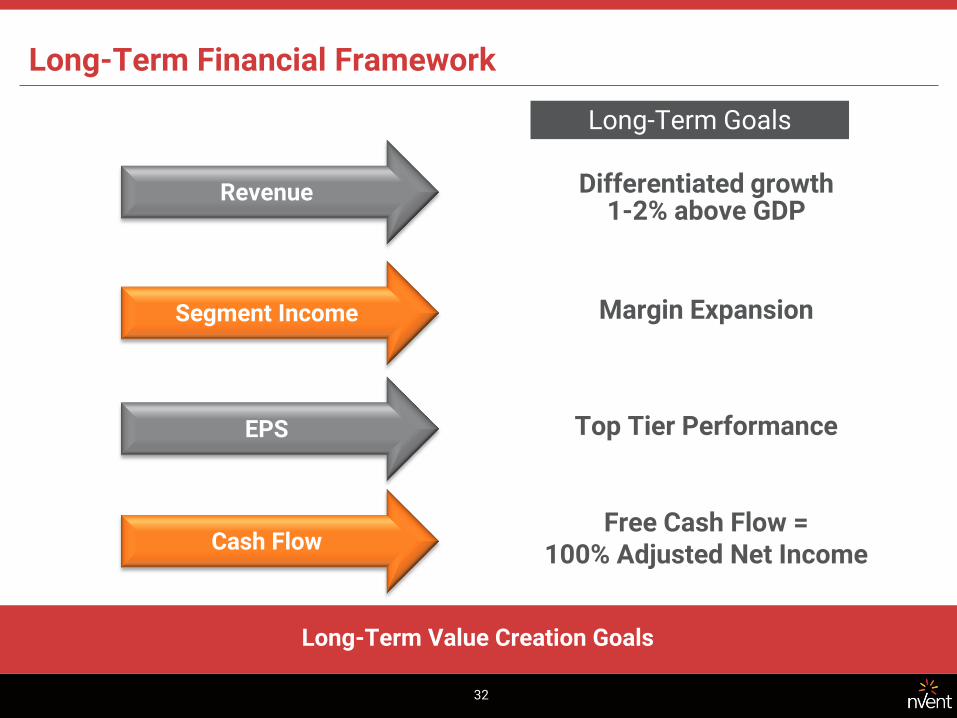
Long-Term Financial Framework
Long-Term Value Creation Goals
Differentiated growth 1-2% above GDP
Margin Expansion
Top Tier Performance
Free Cash Flow = 100% Adjusted Net Income
Long-Term Goals
32
Revenue
Segment Income
EPS
Cash Flow
33
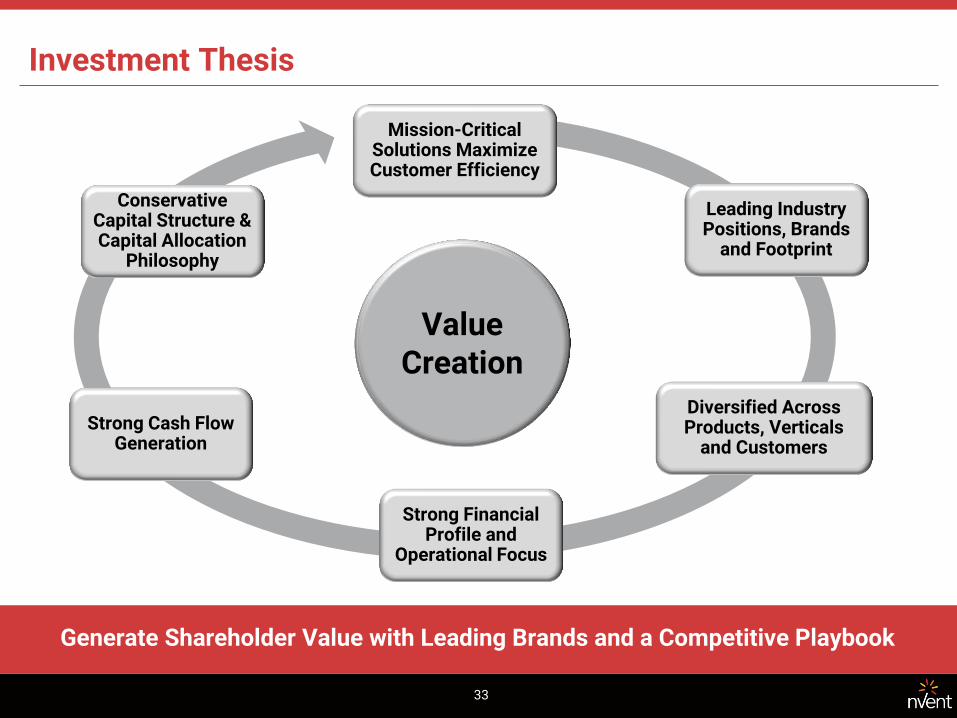
Investment Thesis
Generate Shareholder Value with Leading Brands and a Competitive Playbook
Mission-Critical Solutions Maximize Customer Efficiency
Leading Industry Positions, Brands
and Footprint
Diversified Across Products, Verticals
and Customers
Strong Financial Profile and
Operational Focus
Strong Cash Flow Generation
Conservative Capital Structure & Capital Allocation
Philosophy
Value Creation

Appendix
35
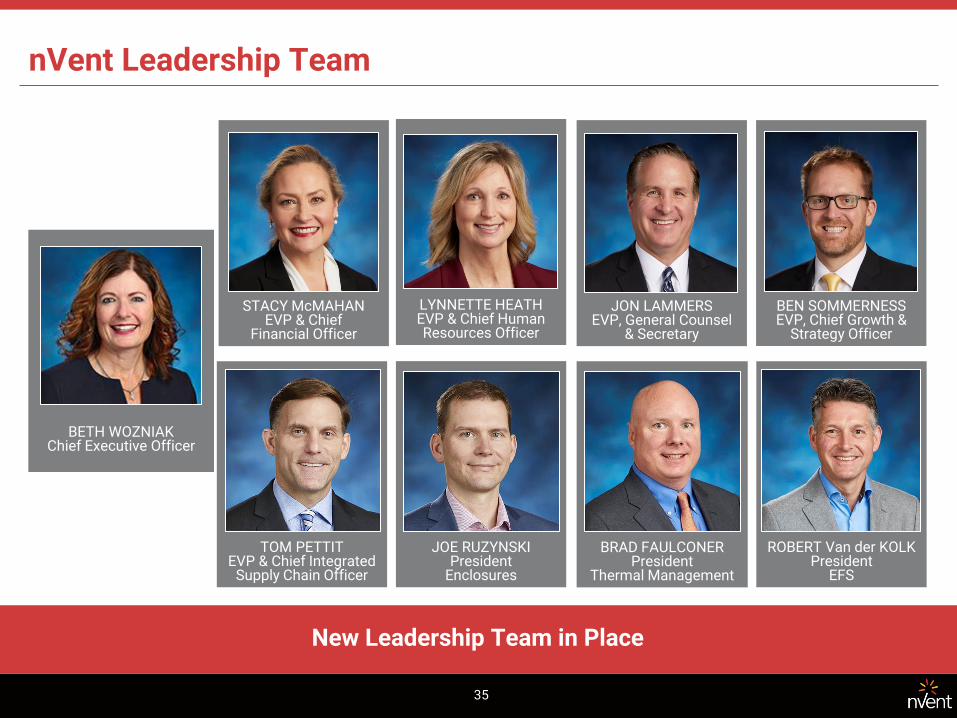
nVent Leadership Team
New Leadership Team in Place
BETH WOZNIAK Chief Executive Officer
TOM PETTIT EVP & Chief Integrated
Supply Chain Officer
JOE RUZYNSKI President
Enclosures
BRAD FAULCONER President
Thermal Management
STACY McMAHAN EVP & Chief
Financial Officer
LYNNETTE HEATH EVP & Chief Human Resources Officer
JON LAMMERS EVP, General Counsel
& Secretary
BEN SOMMERNESS EVP, Chief Growth &
Strategy Officer
ROBERT Van der KOLK President
EFS
Equipment Protection
Electronic Protection
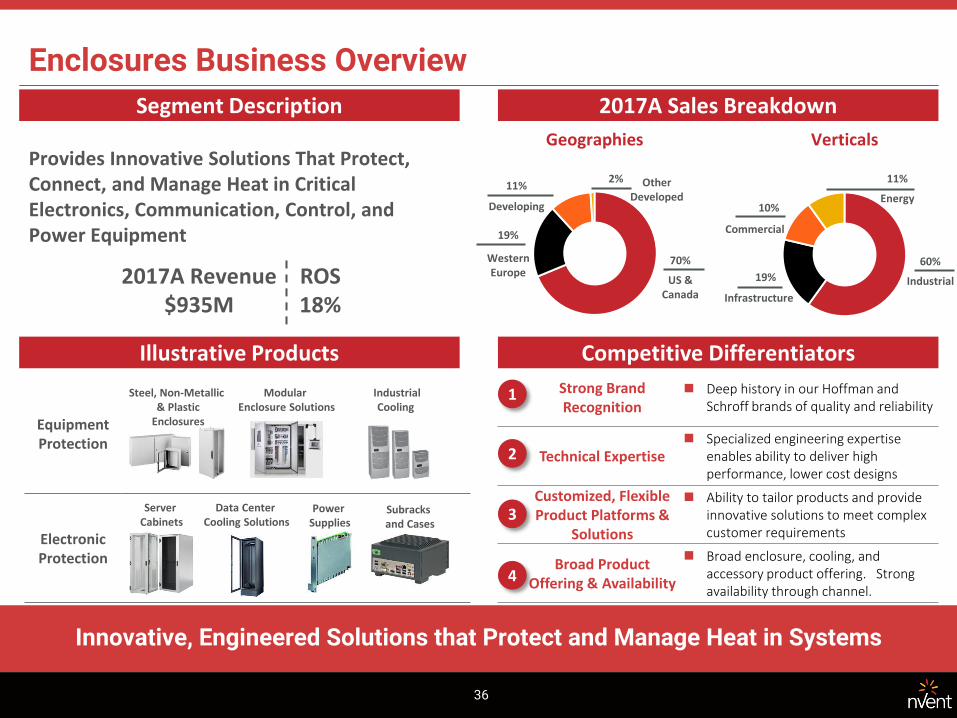
Enclosures Business Overview
Segment Description 2017A Sales Breakdown
Illustrative Products Competitive Differentiators
Geographies
Strong Brand Recognition
Deep history in our Hoffman and Schroff brands of quality and reliability
Technical Expertise Specialized engineering expertise
enables ability to deliver high performance, lower cost designs
Customized, Flexible Product Platforms &
Solutions
Ability to tailor products and provide innovative solutions to meet complex customer requirements
Broad Product Offering & Availability
Broad enclosure, cooling, and accessory product offering. Strong availability through channel.
1
2
3
4
Verticals
US & Canada
70%
Other Developed
2%
Developing
11%
Western Europe
19%
Industrial
60%
Energy
11%
Commercial
10%
Infrastructure
19%
Provides Innovative Solutions That Protect, Connect, and Manage Heat in Critical Electronics, Communication, Control, and Power Equipment
ROS 18%
2017A Revenue $935M
Steel, Non-Metallic & Plastic
Enclosures
Modular Enclosure Solutions
Industrial Cooling
Server Cabinets
Data Center Cooling Solutions
Power Supplies
Subracks and Cases
Innovative, Engineered Solutions that Protect and Manage Heat in Systems
36
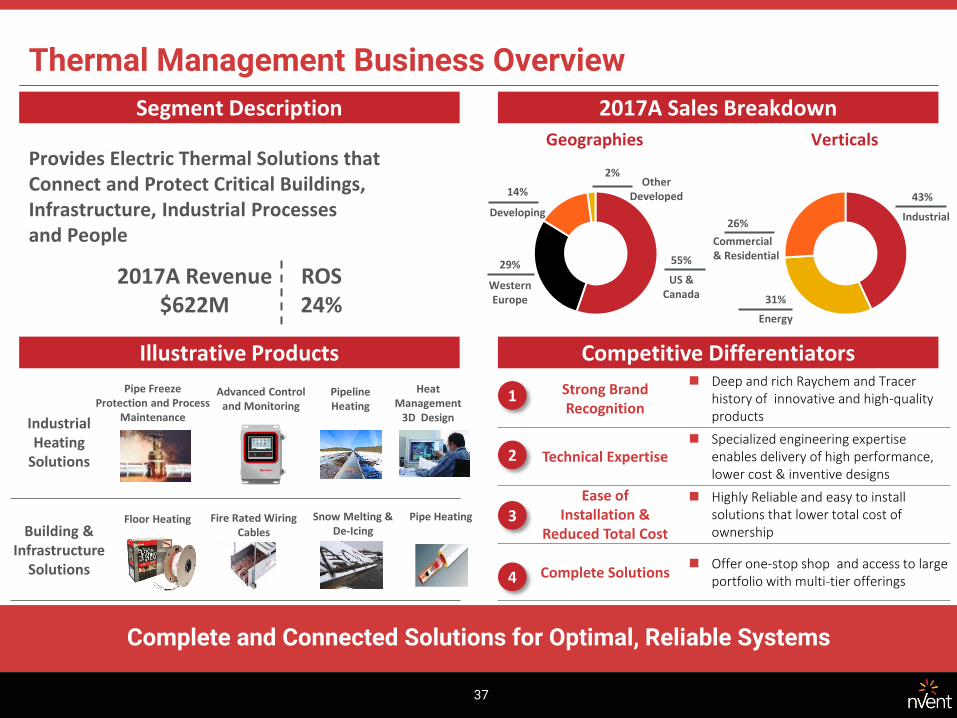
Thermal Management Business Overview
Segment Description 2017A Sales Breakdown
Illustrative Products Competitive Differentiators
Geographies
Strong Brand Recognition
Deep and rich Raychem and Tracer history of innovative and high-quality products
Technical Expertise Specialized engineering expertise
enables delivery of high performance, lower cost & inventive designs
Ease of Installation &
Reduced Total Cost
Highly Reliable and easy to install solutions that lower total cost of ownership
Complete Solutions Offer one-stop shop and access to large
portfolio with multi-tier offerings
1
2
3
4
Verticals Provides Electric Thermal Solutions that Connect and Protect Critical Buildings, Infrastructure, Industrial Processes and People
US & Canada
55%
Other Developed
2%
Developing
14%
Western Europe
29%
Industrial
43%
Energy
31%
Commercial & Residential
26%
Industrial Heating
Solutions
Building & Infrastructure
Solutions
Advanced Control and Monitoring
Floor Heating
Pipe Freeze Protection and Process
Maintenance
Heat Management
3D Design
Fire Rated Wiring Cables
Snow Melting & De-Icing
Pipe Heating
Pipeline Heating
Complete and Connected Solutions for Optimal, Reliable Systems
ROS 24%
2017A Revenue $622M
37
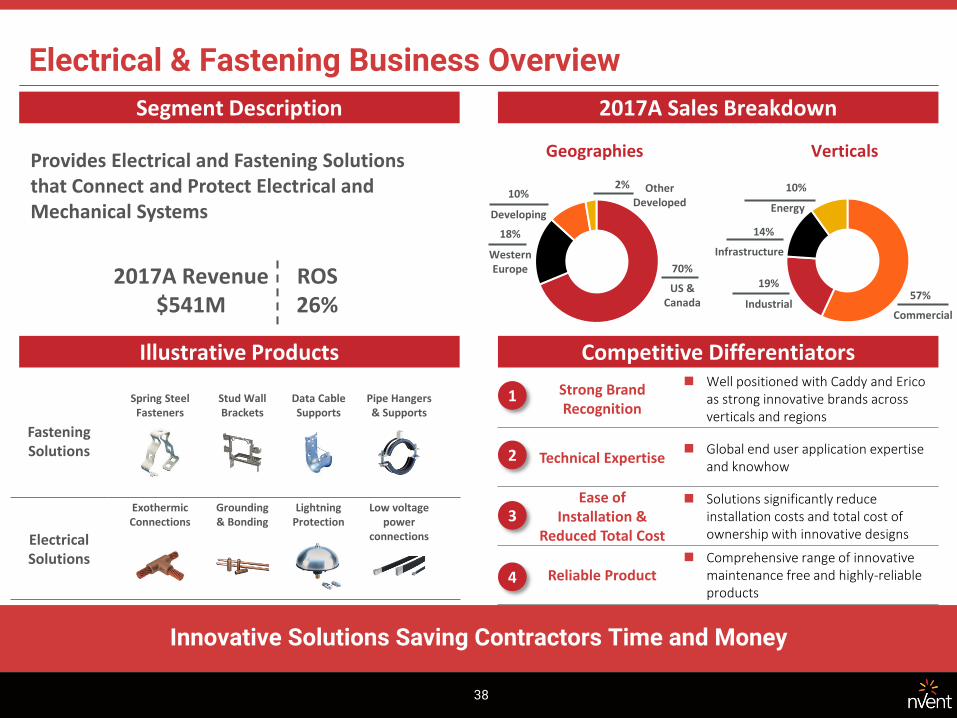
Electrical & Fastening Business Overview
Segment Description 2017A Sales Breakdown
Illustrative Products Competitive Differentiators
Geographies Verticals Provides Electrical and Fastening Solutions that Connect and Protect Electrical and Mechanical Systems
US & Canada
70%
Other Developed
2%
Developing
10%
Western Europe
18%
Commercial
57%
Energy
10%
Infrastructure
14%
Industrial
19%
Strong Brand Recognition
Well positioned with Caddy and Erico as strong innovative brands across verticals and regions
Technical Expertise Global end user application expertise
and knowhow
Ease of Installation &
Reduced Total Cost
Solutions significantly reduce installation costs and total cost of ownership with innovative designs
Reliable Product Comprehensive range of innovative
maintenance free and highly-reliable products
1
2
3
4
Innovative Solutions Saving Contractors Time and Money
Fastening Solutions
Electrical Solutions
Stud Wall Brackets
Pipe Hangers & Supports
Spring Steel Fasteners
Lightning Protection
Data Cable Supports
Low voltage power
connections
Exothermic Connections
Grounding & Bonding
ROS 26%
2017A Revenue $541M
38
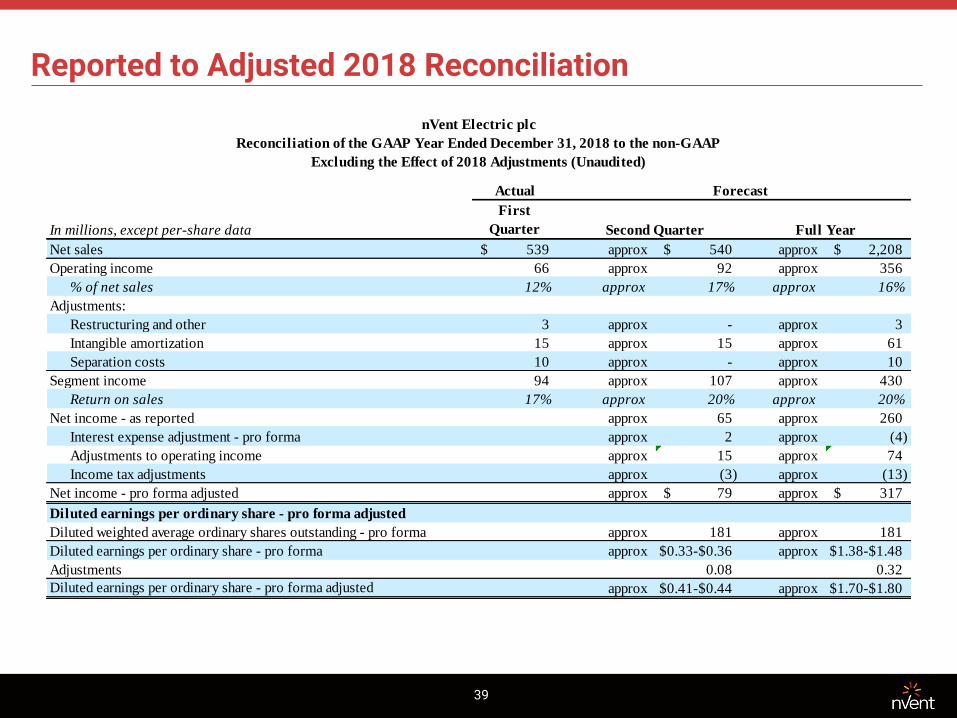
Reported to Adjusted 2018 Reconciliation
39
Actual
First
Quarter
Net sales 539$ approx 540$ approx 2,208$
Operating income 66 approx 92 approx 356
% of net sales 12% approx 17% approx 16%
Adjustments:
Restructuring and other 3 approx - approx 3
Intangible amortization 15 approx 15 approx 61
Separation costs 10 approx - approx 10
Segment income 94 approx 107 approx 430
Return on sales 17% approx 20% approx 20%
Net income - as reported approx 65 approx 260
Interest expense adjustment - pro forma approx 2 approx (4)
Adjustments to operating income approx 15 approx 74
Income tax adjustments approx (3) approx (13)
Net income - pro forma adjusted approx 79$ approx 317$
Diluted earnings per ordinary share - pro forma adjusted
Diluted weighted average ordinary shares outstanding - pro forma approx 181 approx 181
Diluted earnings per ordinary share - pro forma approx $0.33-$0.36 approx $1.38-$1.48
Adjustments 0.08 0.32
Diluted earnings per ordinary share - pro forma adjusted approx $0.41-$0.44 approx $1.70-$1.80
nVent Electric plc
Reconciliation of the GAAP Year Ended December 31, 2018 to the non-GAAP
Excluding the Effect of 2018 Adjustments (Unaudited)
In millions, except per-share data
Forecast
Second Quarter Full Year
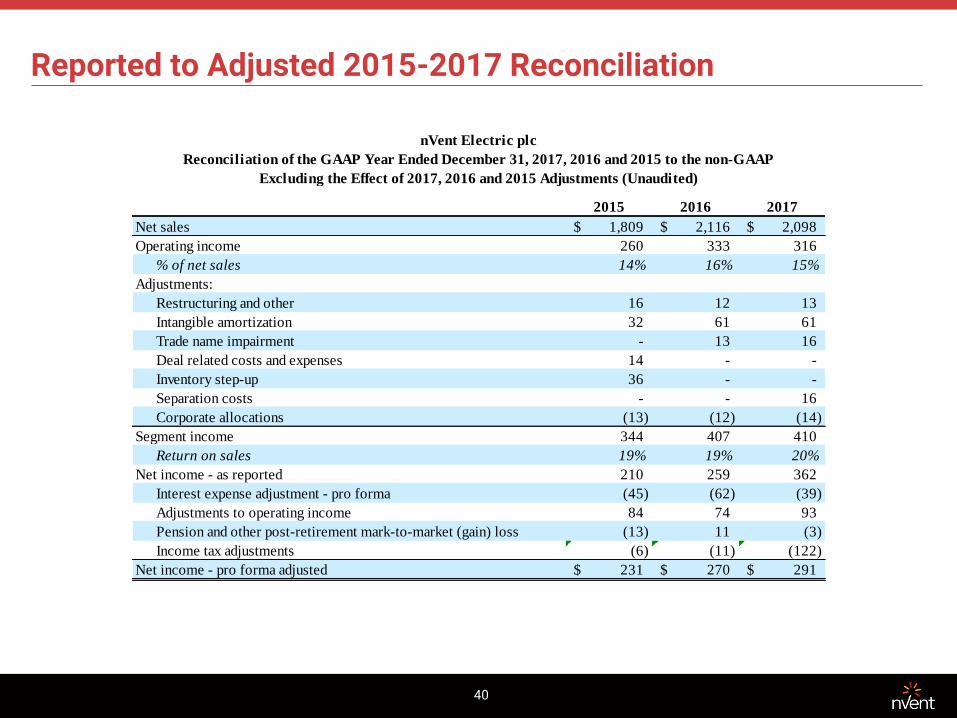
Reported to Adjusted 2015-2017 Reconciliation
40
2015 2016 2017
Net sales 1,809$ 2,116$ 2,098$
Operating income 260 333 316
% of net sales 14% 16% 15%
Adjustments:
Restructuring and other 16 12 13
Intangible amortization 32 61 61
Trade name impairment - 13 16
Deal related costs and expenses 14 - -
Inventory step-up 36 - -
Separation costs - - 16
Corporate allocations (13) (12) (14)
Segment income 344 407 410
Return on sales 19% 19% 20%
Net income - as reported 210 259 362
Interest expense adjustment - pro forma (45) (62) (39)
Adjustments to operating income 84 74 93
Pension and other post-retirement mark-to-market (gain) loss (13) 11 (3)
Income tax adjustments (6) (11) (122)
Net income - pro forma adjusted 231$ 270$ 291$
nVent Electric plc
Reconciliation of the GAAP Year Ended December 31, 2017, 2016 and 2015 to the non-GAAP
Excluding the Effect of 2017, 2016 and 2015 Adjustments (Unaudited)
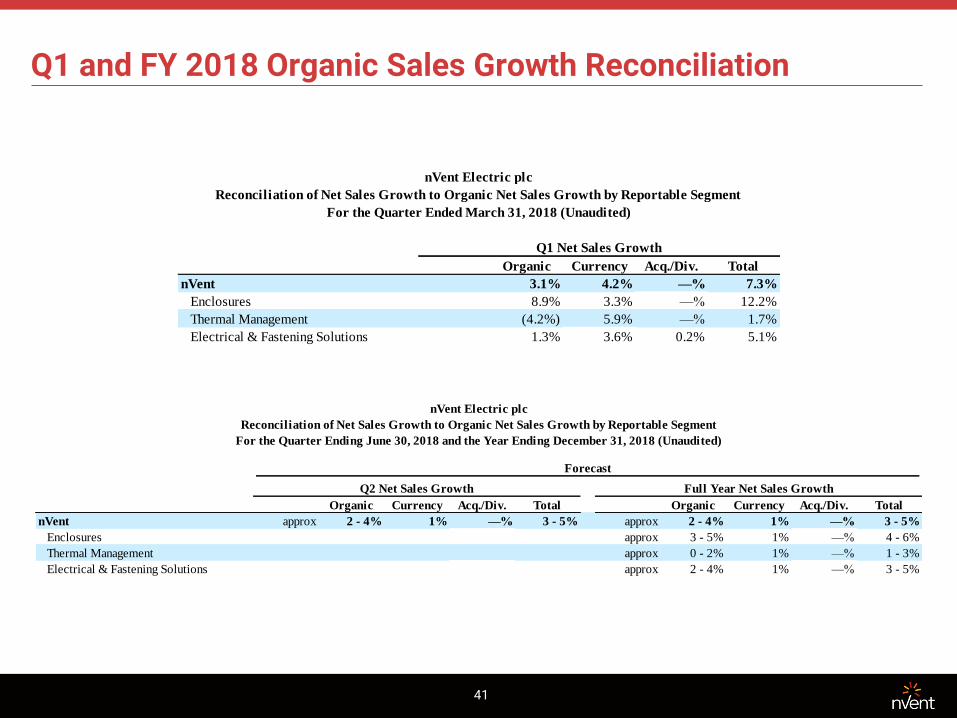
Q1 and FY 2018 Organic Sales Growth Reconciliation
41
Organic Currency Acq./Div. Total
nVent 3.1% 4.2% —% 7.3%
Enclosures 8.9% 3.3% —% 12.2%
Thermal Management (4.2%) 5.9% —% 1.7%
Electrical & Fastening Solutions 1.3% 3.6% 0.2% 5.1%
nVent Electric plc
Reconciliation of Net Sales Growth to Organic Net Sales Growth by Reportable Segment
For the Quarter Ended March 31, 2018 (Unaudited)
Q1 Net Sales Growth
nVent Electric plc
Reconciliation of Net Sales Growth to Organic Net Sales Growth by Reportable Segment
For the Quarter Ending June 30, 2018 and the Year Ending December 31, 2018 (Unaudited)
Forecast
Organic Currency Acq./Div. Total Organic Currency Acq./Div. Total
nVent approx 2 - 4% 1% —% 3 - 5% approx 2 - 4% 1% —% 3 - 5%
Enclosures approx 3 - 5% 1% —% 4 - 6%
Thermal Management approx 0 - 2% 1% —% 1 - 3%
Electrical & Fastening Solutions approx 2 - 4% 1% —% 3 - 5%
Q2 Net Sales Growth Full Year Net Sales Growth
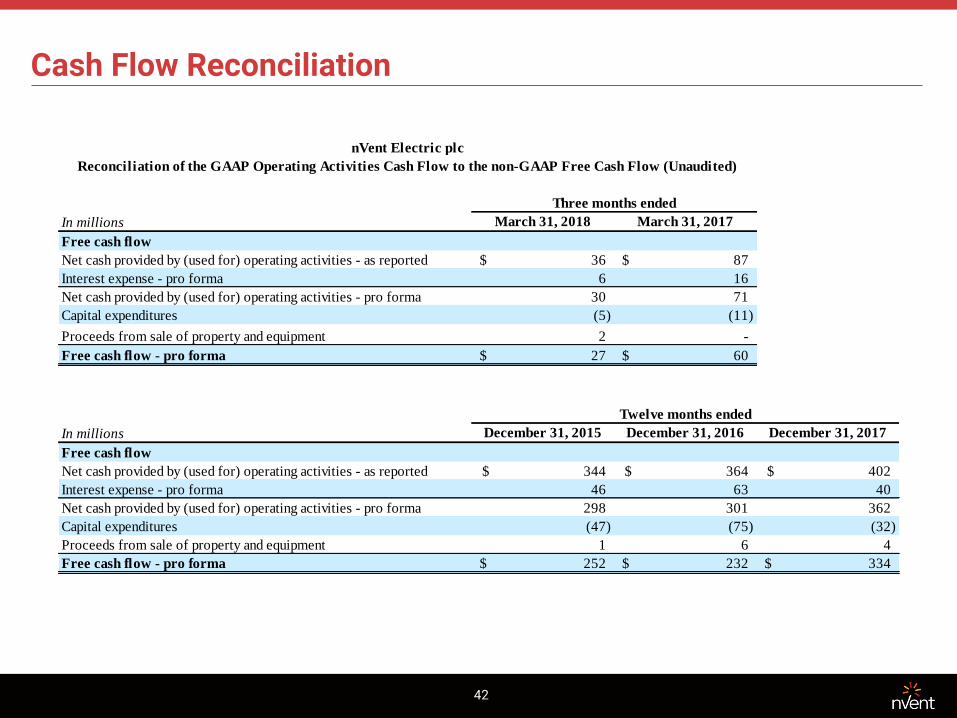
Cash Flow Reconciliation
42
March 31, 2018 March 31, 2017
Free cash flow
Net cash provided by (used for) operating activities - as reported 36$ 87$
Interest expense - pro forma 6 16
Net cash provided by (used for) operating activities - pro forma 30 71
Capital expenditures (5) (11)
Proceeds from sale of property and equipment 2 -
Free cash flow - pro forma 27$ 60$
December 31, 2015 December 31, 2016 December 31, 2017
Free cash flow
Net cash provided by (used for) operating activities - as reported 344$ 364$ 402$
Interest expense - pro forma 46 63 40
Net cash provided by (used for) operating activities - pro forma 298 301 362
Capital expenditures (47) (75) (32)
Proceeds from sale of property and equipment 1 6 4
Free cash flow - pro forma 252$ 232$ 334$
nVent Electric plc
Reconciliation of the GAAP Operating Activities Cash Flow to the non-GAAP Free Cash Flow (Unaudited)
In millions
Three months ended
In millions
Twelve months ended