Embed Size (px)
Citation preview

Nutritional Epidemiology in the Genomic Age
V. Saroja Voruganti, PhDAssistant Professor
Department of NutritionUNC Nutrition Research Institute

Nutritional Epidemiology
If we could give every individual the right amount of nourishment and exercise, not too little and not too much, we would have found the safest way to health
Hippocrates (460–377 BC) Father of Western medicine

Nutritional Epidemiology
Epidemiology – study and analysis of patterns, causes and effects of health and disease conditions in populations
Role of nutrition in the etiology of disease
Monitoring of nutritional status of populations
Develop and evaluate interventions to achieve and maintain healthy eating patterns among populations
Nutritional Epidemiological Studies
Correlation studies
Special exposure groups
Migrant studies
Case control and cohort studies
Controlled trials
Willett W. Overview of Nutritional Epidemiology
gDOI:10.1093/acprof:oso/9780199754038.003.0001

Every person is genetically unique
Assessments of human nutrition are not complete without taking into account the underlying genetic variability
Frequencies of genetically-determined traits/diseases differ among races and even among ethnic groups of the same race
Even within populations, risk for chronic disease differs between subgroups because of their genetic makeup
Genetics in Nutritional Epidemiology

Genotype by environment interaction results when
the same genotype gives rise to two variations in
the expression of the same phenotype in two
different environments
Distinct effects of an environmental factor in individuals with different genotypes
or Distinct effects of a genotype in two different
environments

Why study gene by environment interactions?
Better understand disease etiology
Better assess population disease risk related to genetic and environmental risk factors
Informs biological pathways
Can design new preventative and therapeutic strategies
Offer tailored preventative advice that is based on knowledge of genetic susceptibility

Gene-Nutrient interactions

Model I -Phenylketonuria
Model 1
genotype
diseaserisk factor
Mutation in phenylalanine hydroxylase
PKU
High levels of phenylalanine in blood
Genotype increases the expression of risk factor

Model II – XerodermaPigmentosum
Model 2
genotype
diseaserisk factor
Mutations in nucleotide excision repair enzymes
Skin cancer
UV radiation
Genotype excarbates the effect of the risk factor

Model III- Porphyria variegate
genotype
diseaserisk factor
Model 3
The risk factor excarbates the effect of the genotype
Mutation in PPOX gene
Skin problemsBarbiturates
and seizure medications

Model IV- alpha-1 antitrypsin deficiency
Genotype and risk factor each influence the risk by themselves
Model 4
genotype
disease
risk factor
Model 4
Mutation in SERPINA1
Lung disease
Smoke or pollutants

Model V-G6PD deficiency
Both genotype and risk factor are required to raise the risk
Model 5
genotype
disease
risk factor
Mutation in glucose 6 phosphate dehydrogenase
Hemolytic anemia
Fava bean consumption

Nutrigenetic differences
Most of them may have been inherited from our ancestors
Genetic variation affects food tolerances among populations
Nutritional environments seem to be the major determinants of human variation evolution
Populations vary in their requirements for foods and response to diet

Uric acid, fructose and genetic variants in different populations

Serum uric acid
Guanosine mono phosphate (GMP)
Inosine mono phosphate (IMP)
Allantoin
Xanthine
Uric acid
Xanthine oxidase
UricaseHumans and some higher primates
Adenosine mono phosphate (AMP)

Hyperuricemia and disease states
Choudhary et al., Cardiorenal Med. 2013; 3: 208-220

Dietary Factors affecting serum uric acid levels
Fructose [Carbonated beverages, most canned products, honey]
High-purine foods and amino acids [Organ meats such as liver, spleen, heart etc]
Alcohol
ATP depletion
Competition with uric acid for the same transporter (SLC2A9)
AMP, GMP or IMP
Dehydration
Hyperuricemia

Is a genetic study of CVD risk in American Indians
It is the genetic component of the Strong Heart Study started in 1998
More than 3800 members from multigenerational families enrolled from three centers located in Arizona, Dakotas and Oklahoma
Strong Heart Family study (SHFS) [PI: Dr. Shelley Cole]
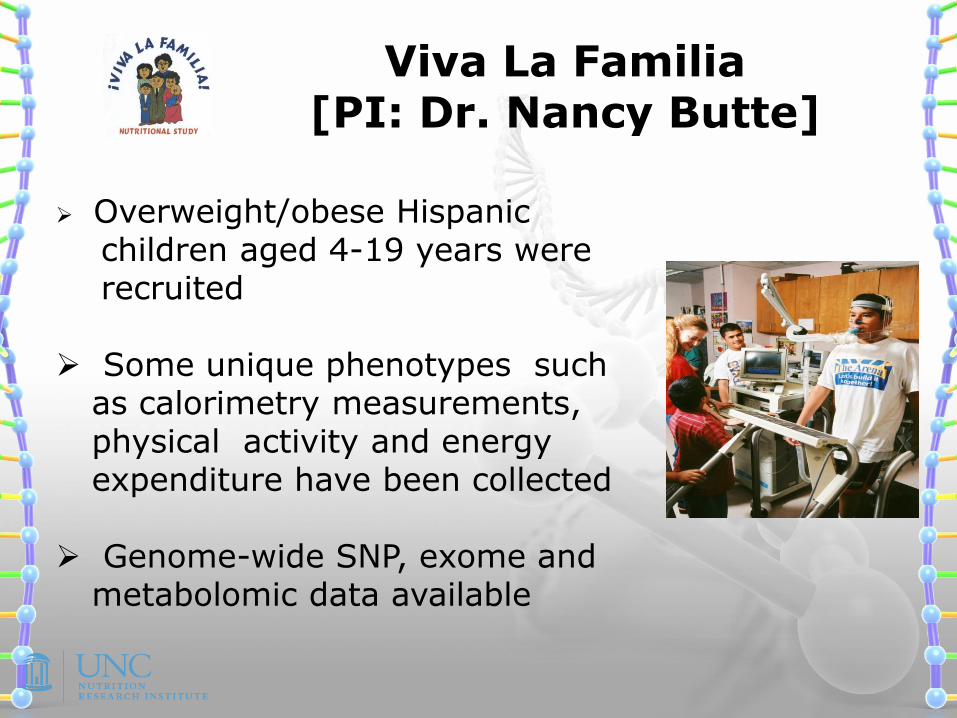
Viva La Familia[PI: Dr. Nancy Butte]
Overweight/obese Hispanic children aged 4-19 years wererecruited
Some unique phenotypes such as calorimetry measurements, physical activity and energy expenditure have been collected
Genome-wide SNP, exome and metabolomic data available

Descriptives
SHFS VFS
Age 39.50 ± 17 11.0 ± 4
Serum uric acid (mg/dl)
5.1 ± 1.5 5.2 ± 1.7
Hyperuricemia (%) 17 25
Sugars intake (% of total calories)
16.3 22
Heritability (%) 46 45

SNPs associated with serum uric acid concentrations differ across
populations
[(*,$Voruganti et al. 2014;2015; #Vitart et al. 2008; &,#Dehghan et al. 2008; #Kolz et al. 2008; &Tin et al.2011; #Kottgen et al.
2013; #Zemunik et al. #Karns etal. 2012). Proxy SNPs are bolded]

Uric acid and Fructose
Uric acid is a byproduct of fructose degradation and shares a transporter with fructose (GLUT9/SLC2A9)
Fructokinase is poorly regulated and phosphorylates fructose rapidly
Fructose upregulates its transporter GLUT5 as well as fructokinase
Serum uric acid increases rapidly after ingestion of fructose
Fructose interferes with uric acid excretion

Genotype-specific differences in SUA/added sugars
Minor allele shown next to the SNP in parantheses; added sugars are shown as percent of calories

Genotype- and Ethnic-specific responses of uric acid to fructose
challenge

Effect of fructose challenge on serum uric acid levels
Fr. challenge – baseline
Fr. challenge – 30min
Fr + Cf challenge -3hr
Fr. challenge – 1hr
Fr + Cf challenge –
24hr
Nutrient challenge &Timepoints
40 individuals
20 CaucasianAmericans
20 AfricanAmericans
women
men
men
men
Prescreening Study Participants

Serum uric acid response to fructose challenge
(by Ethnicity and Sex)4
56
78
9
Women Men
Caucasians African Americans Caucasians African Americans
0 min UA (mg/dL) 30 min UA (mg/dL)
60 min UA (mg/dL) 120 min UA (mg/dL)
180 min UA (mg/dL)

45
67
89
Healthy Overweight or obese
Caucasians African Americans Caucasians African Americans
0 min UA (mg/dL) 30 min UA (mg/dL)
60 min UA (mg/dL) 120 min UA (mg/dL)
180 min UA (mg/dL)
Serum uric acid response to fructose challenge (by Ethnicity and Obesity status)

Serum uric acid response to fructose challenge (by Ethnicity and
SLC2A9-rs16890979)4
56
78
9
CC CT TT
CaucasiansAfrican AmericansCaucasiansAfrican AmericansCaucasiansAfrican Americans
0 min UA (mg/dL) 30 min UA (mg/dL)
60 min UA (mg/dL) 120 min UA (mg/dL)
180 min UA (mg/dL)

45
67
89
GG GT
Caucasians African Americans Caucasians African Americans
0 min UA (mg/dL) 30 min UA (mg/dL)
60 min UA (mg/dL) 120 min UA (mg/dL)
180 min UA (mg/dL)
Serum uric acid response to fructose challenge (by Ethnicity and
ABCG2 - rs2231142)

Effect of ABCG2 genotype (rs2231142) on serum uric acid concentrations
during a fructose load
Dalbeth et al. Arthritis Research and Therapy. 2014; 16:R34

Serum uric acid response to fructose challenge (by ethnicity and
SLC17A1-rs1183201)4
56
78
9
AA AT TT
CaucasiansAfrican AmericansCaucasiansAfrican AmericansCaucasiansAfrican Americans
0 min UA (mg/dL) 30 min UA (mg/dL)
60 min UA (mg/dL) 120 min UA (mg/dL)
180 min UA (mg/dL)

Population-specific effects of SLC17A1 on serum uric acidconcentrations during a fructose
load
Dalbeth et al. Ann Rheum Dis. 2014; 73: 313-314

45
67
89
0 1
Caucasians African Americans Caucasians African Americans
0 min UA (mg/dL) 30 min UA (mg/dL)
60 min UA (mg/dL) 120 min UA (mg/dL)
180 min UA (mg/dL)
Serum uric acid response to fructose challenge (by ethnicity and genetic
risk score)

Individual genetic variation in human populations affects nutrient metabolism
Nutritional epidemiological studies should take into account the individual genetic variation
There is a need to optimize nutrient intake for each individuals in context of genetic diversity and complexity of nutrient metabolism
There is a need to ensure that nutritional genetic information is used in a socially responsible manner as it relates to various populations
Summary
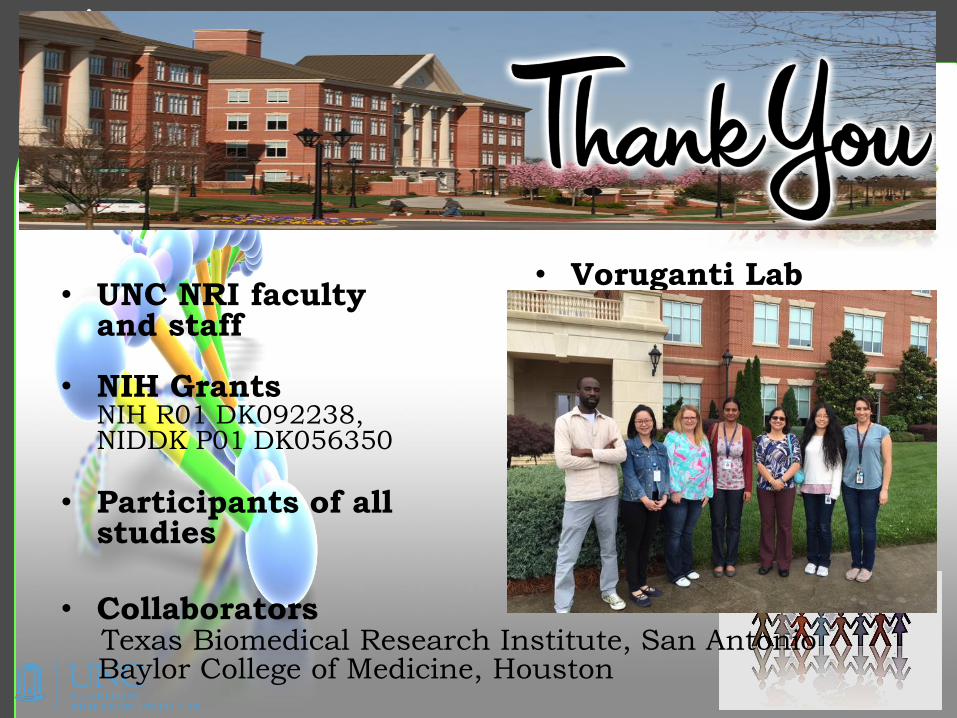
• Voruganti Lab
• Participants of all studies
• NIH GrantsNIH R01 DK092238,NIDDK P01 DK056350
• UNC NRI faculty and staff
• Collaborators Texas Biomedical Research Institute, San AntonioBaylor College of Medicine, Houston