Embed Size (px)
Citation preview

INTER-AGENCY NUTRITION ASSESSMENT
SYRIAN REFUGEES IN LEBANON
ASSESSMENT CONDUCTED: September 2012
FINALFINALFINALFINAL REPORTREPORTREPORTREPORT
JANUARY 2013

2
Nutrition Assessment Report for Syrian Refugees in
Lebanon, using SMART methodology

3
ACKNOWLEDGMENTS
UNICEF and WFP Lebanon, in collaboration with WHO and with support of ACF Lebanon, commissioned and
coordinated the assessment. The technical support for the assessment was provided by the Nutrition
Consultant Oumar Hamza, the Lebanon Task Force/ committee members (particulary Dr Alissar Rady from
WHO Lebanon), UNICEF Regional Office Advisors and WFP Regional Bureau advisors.
Gratefully acknowledge the important contributions made by so many people that made this assessment
possible, particularly all agencies involved in planning and executing of the assessment. Specific thanks to
UNICEF, WFP, WHO, MOPH, UNHCR and ACF Lebanon teams for their collaboration in the entire duration of
the exercise. Thanks to all the participants who engaged in data collection and data entry. Particularly thanks to
the assessment teams including drivers and administrative support team.
Most importantly, thanks to the women, men and children from different Syrian refugees’ families who agreed
to be interviewed, measured and weighed during this assessment.

4
TABLE OF CONTENTS
Acknowledgments ........................................................................................................................................................... 3
Table of contents ............................................................................................................................................................ 4
List of tables .................................................................................................................................................................... 6
List of figures................................................................................................................................................................... 7
Acronyms and abbreviations .......................................................................................................................................... 8
Introduction ................................................................................................................................................................... 15
I. Background and rationale................................................................................................................................... 16
II. Justification of the assessment .......................................................................................................................... 17
III. Task force committee ......................................................................................................................................... 18
IV. Objectives ........................................................................................................................................................... 18
V. Methodology ....................................................................................................................................................... 19
1. Study population ................................................................................................................................. 19
2. Sampling and sample size determination ........................................................................................... 19
3. Questionnaire ...................................................................................................................................... 21
4. Measurement methods ....................................................................................................................... 21
5. Different definitions and calculations .................................................................................................. 23
A. Malnutrition in children 6-59 months ......................................................................................... 23
B. Infant and young child feeding practices in children 0-24 months ............................................ 24
C. Malnutrition in women of reproductive age ............................................................................... 24
D. Children anthropometric data ................................................................................................... 24
6. Training and coordination ................................................................................................................... 25
7. Pilot testing and revision of the assessment tools .............................................................................. 25
8. Data collection ..................................................................................................................................... 25
9. Field work and quality control ............................................................................................................. 26
10. Data analysis ....................................................................................................................................... 26
VI. Results - Individual levels ................................................................................................................................... 28
1. Response rate ..................................................................................................................................... 28
2. Demography ........................................................................................................................................ 28
3. Health assistance ................................................................................................................................ 29
4. Children 6-59 Months .......................................................................................................................... 29
A. Anthropometric results (based on WHO growth standards 2006) ............................................ 29
B. Child morbidity .......................................................................................................................... 33
C. Children vaccination coverage .................................................................................................. 34
D. Infant and young child feeding .................................................................................................. 34
5. Women 15-49 years ............................................................................................................................ 36
A. Physiological status .................................................................................................................. 36
B. Women malnutrition .................................................................................................................. 36
VII. Results - Household level – WASH and food security ....................................................................................... 38
1. WASH.................................................................................................................................................. 38
A. Access to sufficient water ......................................................................................................... 38
B. Main water problems................................................................................................................. 38
C. Have soap and/or hygienic products ........................................................................................ 38

5
2. Food security ....................................................................................................................................... 39
A. Food sources ............................................................................................................................ 39
B. Number of meals per day ......................................................................................................... 39
C. Consumption of canned food .................................................................................................... 40
D. Food consumption score .......................................................................................................... 40
E. Food stocks ............................................................................................................................... 42
F. Coping strategies ...................................................................................................................... 43
Limitations ..................................................................................................................................................................... 45
Discussion ..................................................................................................................................................................... 46
Conclusion .................................................................................................................................................................... 51
Recommendations and priorities .................................................................................................................................. 52
Annex ............................................................................................................................................................................ 53
Annex 1: Sample for Syrian refugees in Lebanon.............................................................................................. 54
Annex 2: Arabic questionnaire for Syrian refugees in Lebanon ......................................................................... 55
Annex 3: Questionnaire in english, for Syrian refugees in Lebanon,
before Arabic translation and last revision .......................................................................................... 65
Annex 4: Results using the NCHS 1977 growth reference for Syrian refugees in Lebanon.............................. 76
Annex 5: Assessment teams’ members for Syrian refugees in Lebanon .......................................................... 79
Annex 6: Consent form for Syrian refugees in Lebanon .................................................................................... 80
Annex 7: SMART Plausibility report for Syrian refugees in Lebanon................................................................. 81

6
LIST OF TABLES
Table 1: Nutrition status for Syria, Jordan, Lebanon and MENA Region Average, UNICEF SOWC,
2012 and FHS 2009 ................................................................................................................................. 17
Table 2: Parameters used for sample size determination ...................................................................................... 20
Table 3: Definitions of acute malnutrition using weight-for-height and/or oedema in children 6–59 months ....... 23
Table 4: Definitions of stunting using height-for-age in children 6–59 months ...................................................... 23
Table 5: Definitions of underweight using weight-for-age in children 6–59 months ............................................... 23
Table 6: Classification of acute malnutrition based on MUAC in children 6-59 months (WHO) ............................ 23
Table 7: Classification of undernutrition based on MUAC in women of reproductive age (15 to 49 years) .......... 24
Table 8: Classification of public health significance for children under 5 years of age (WHO, 2000) ................... 24
Table 9: Target sample size and number covered during the assessment ........................................................... 28
Table 10: Distribution of age and sex of the Syrian refugees in Lebanon ............................................................... 29
Table 11: Prevalence of Acute Malnutrition based on weight-for-height z-scores (and/or oedema) and
by sex, among Syrian refugees in Lebanon ............................................................................................. 30
Table 12: Prevalence of acute malnutrition by age among Syrian refugees in Lebanon ........................................ 31
Table 13: Distribution of acute malnutrition and oedema based on weight-for-height z-scores .............................. 31
Table 14: Prevalence of stunting based on height-for-age z-scores and by sex among Syrian
Refugees in Lebanon ............................................................................................................................... 32
Table 15: Prevalence of stunting by age based on height-for-age z-scores among Syrian Refugees .................... 32
Table 16: Prevalence of underweight based on weight-for-age z-scores and by sex ............................................. 33
Table 17: Mean z-scores, Design Effects and excluded subjects – Syrian Refugees ............................................. 33
Table 18: Prevalence of reported diarrhea, cough and fever in the two weeks prior to the interview ..................... 33
Table 19: Breastfeeding and complimentary feeding ............................................................................................... 34
Table 20: Canned Food Consumption ..................................................................................................................... 40
Table 21: Food Consumption Score ........................................................................................................................ 41
Table 22: Coping strategies ..................................................................................................................................... 44
Table 23: Prevalence of malnutrition compared to UNICEF SoWC, 2012 .............................................................. 46
Table 24: Prevalence of self reported diarrhea, cough and fever in the two weeks prior to the interview ............... 47
Table 25: Number of meals per day ......................................................................................................................... 49
Table 26: Canned Food Consumption ..................................................................................................................... 49
Table 27: Food Consumption Score ........................................................................................................................ 49

7
LIST OF FIGURES
Figure 1: Localisation of Syrian refugees in Lebanon .......................................................................................... 16
Figure 2: Period stayed in Lebanon ...................................................................................................................... 28
Figure 3: Access to the free Health Services ........................................................................................................ 29
Figure 4: Distribution of age and sex of the Syrian refugees in Lebanon ............................................................. 30
Figure 5: Prevalence of acute malnutrition by age among Syrian Refugees in Lebanon .................................... 31
Figure 6: Prevalence of stunting by age based on height-for-age z-scores among Syrian Refugees ................. 32
Figure 7: Self reported vaccination coverage ....................................................................................................... 34
Figure 8: Physiological Status of Women 15-49 years – Syrian refugees in Lebanon......................................... 36
Figure 9: Prevalence of malnutrition among women by age groups – Syrian refugees in Lebanon .................... 37
Figure 10: Access to sufficient water for drinking, cooking and washing ............................................................... 38
Figure 11: Main Water Problems for Syrian Refugees in Lebanon ........................................................................ 38
Figure 12: Food Sources ........................................................................................................................................ 39
Figure 13: Number of Meals in Syrian refugees living in Lebanon ......................................................................... 40
Figure 14: Food Consumption Score ...................................................................................................................... 41
Figure 15: Having enough food or having money to buy food ................................................................................ 42
Figure 16: Duration of Food Stocks – Syrian refugees in Lebanon ........................................................................ 42
Figure 17-1: Coping Strategies – Proportion of using different coping strategies – Syrian refugees in Lebanon ..... 43
Figure 17-2: Coping Strategies – Proportion of using different coping strategies – Syrian refugees in Lebanon ..... 43

8
ACRONYMS AND ABBREVIATIONS
ACF Action Contre la Faim
CDC Centers for Disease Control and prevention
CFSA Comprehensive Food Security Assessment
CI Confidence Interval
CSI Coping Strategy Indices
DEFF Design effect
EFSNA Emergency Food Security and Nutrition Assessment
ENA Emergency Nutrition Assessment
EPI Expanded Programme on Immunization
FCS Food Consumption Score
GAM Global Acute Malnutrition
HAZ Height-for-Age z-score
HH Household
IYCF Infant and Young Child Feeding
MAM Moderate Acute Malnutrition
MCH Maternal and Child Heath
MICS Multiple Indicators Cluster Survey
MOPH Ministry of Public Health
MOSA Ministry of Social Affairs
MUAC Middle Upper Arm Circumference
NCHS National Centre for Health Statistics
NGO Non-Government Organization
PHC Primary Health Care
PPS Probability Proportional to Size
ProGres UNHCR registration database for refugees
SAM Severe Acute Malnutrition
SD Standard Deviation
SMART Standardised Monitoring & Assessment of Relief & Transitions
SOWC The State of the World’s Children
SPSS Statistical Package for Social Sciences (Statistical software)
U5 Children under 5 years old
UN United Nations
UNHCR United Nations High Commissioner for Refugees
UNICEF United Nations Children’s Funds
VAM Vulnerability Analysis and Mapping
WASH Water Sanitation and Hygiene
WAZ Weight-for-Age z-score
WHZ Weight-for-Height z-score
WFP World Food Programme
WHO World Health Organization

9
EXECUTIVE SUMMARY
In early January 2011, the protests started off peacefully in Syria, but they later erupted into a popular
uprising by mid-March 2011. Intense fighting has been taking place since then resulting to thousands of
Syrians being displaced in neighbouring countries of Lebanon, Turkey, Iraq, Egypt and Jordan.
UNICEF and WFP initiated a joint nutrition assessment for Syrian children aged 6 to 59 months and pregnant
and lactating women in Lebanonto establish the nutrition wellbeing of vulnerable displaced Syrian for potential
nutrition and health related interventions taking into consideration existing public health programmes and
strategies.
According to UNICEF's State of the World’s Children (2012) and FHS (2009), the nutrition situation in Syria
was worse than in Lebanon before the onset of the crisis in Syria, based on wasting (12%), stunting (28%) or
underweight (10%) data available. There was insufficient information to determine whether those leaving the
country are nutritionally worse or better than those remaining in the country. Furthermore, there was no
nutrition assessment/ screening established at the point(s) of entry to provide information on the nutrition well-
being of those arriving in Lebanon
The proposed nutrition assessment established the nutrition situation for the Syrian women and children in
Lebanon and provides guidance on likely response to these individuals. The information provided baselines for
monitoring for future nutrition programmes, if response is deemed necessary.
The nutrition assessment aimed at filling the information gap on the nutritional status of vulnerable Syrian
women and children and to propose interventions if there was any urgent need for response to mitigate
deterioration. Specific objectives of the assessment in Lebanon were:
1. To estimate wasting (acute malnutrition), stunting (chronic malnutrition) and underweight of Syrian
children aged 6-59 months.
2. To estimate the acute malnutrition levels for Syrian women of child bearing age based on MUAC
measurement.
3. To identify/document the underlying factors likely to influence the nutrition well-being of the Syrian
population.
4. To identify interventions and ensure that interventions are aligned with existing strategies and integrated.
The SMART (Standardized Monitoring and Assessment of Relief and Transition) methodology was used
to collect and analyze data on child anthropometry. Additional questionnaires were designed for to collect
quantitative data on infant and child feeding, health (disease and immunization), water and sanitation services
and food security. A total of 42 clusters were randomly selected for all registered refugees in Lebanon, using
probability proportional to size (PPS). UNHCR population figures from ProGres1 were used for cluster
allocation.
Two-stage cluster sampling design was used. SMART software – Emergency Nutrition Assessment (ENA) was
used to calculate the sample size, to select different clusters (localities) and households. The sample size was
500 households (42 clusters of 12 families2) and UNHCR registered families lists were used as the data
reference for the household/ family selection.
A total of 4 assessment teams composed of three members (who speak Arabic) each were formed for the
assessments. A training lasting four days was provided, using standard training package, followed by a one-
day pre-test exercise, to assess the training quality and the teams’ readiness for data collection. The
assessment teams were supported by supervisors and coordinators throughout the duration of data collection.
Anthropometric data for children aged 6-59 months were entered using ENA for SMART software (Delta
version, November 8th 2011) by the coordination team. All other data were doubled entered by a team of clerks
1 ProGres: UNHCR registration database for refugees
2 Household: UNHCR definition of household was used which as the family registered

10
using an Excel template. Data analysis was done using ENA for SMART, Food Consumption Scores (FCS),
Coping Strategy Indices (CSI) and SPSS software.
Key findings
� The assessment covered 100% of the sample and 20% of the families are female headed. The average
size of family was 6.2 people. This average family size was higher than the 4.5 people from UNHCR data
base, used at the time of the assessment planning.
� The prevalence of global acute malnutrition (GAM) for children aged 6-59 months from Syrian Refugees in
Lebanon was less than 5% (4.4%), which is categorized as acceptable as per WHO classification. The
prevalence of severe acute malnutrition (SAM) recorded was less than 1% (0.8%) for Syrian refugees.
Moreover, the proportion of the “At Risk of Acute Malnutrition” category (WHZ_WHO scores between -1
SD and -2 SD) was analyzed and the findings of the assessment showed that 6.8% of Syrian refugees’
children aged 6-59 months in Lebanon were at risk of acute malnutrition.
� Therefore, the nutrition situation of Syrian families in Lebanon is acceptable, though there is greater risk of
children becoming malnourished if the situation deteriorates. The presence of aggravating factors (e.g.
winter, increasing numbers of new arrivals, high disease burden, etc), can make the nutrition situation
rapidly change to the worse. The situation of children aged 6-59 months needs close monitoring and the
malnourished children idenitified through screening should be treated.
� The prevalence of stunting and underweight for children aged 6-59 months from the Syrian refugee
population in Lebanon was lower than reflected in previously available data and is within acceptable levels
according to the WHO classification.
� The assessments collected data on diarrhea, cough and fever which are closely linked to nutritional status.
The prevalence was calculated based on mothers or caregivers’ recall. The findings show that the Syrian
refugees’ children aged 6-59 months in Lebanon had suffered from 3 illnesses in the two weeks prior to
the assessment. The morbidity for each illness occurred in at least 40% of the children assessed.
However, these results have to be interpreted cautiously since the illnesses were not defined properly with
the mothers/caregivers.
� The findings of the assessment show that 78.6% of mothers or caregivers reported that their children had
received their vaccines in Syria before leaving and 23% of mothers or caregivers reported that their
children had received their immunization since they arrived in Lebanon. The two coverage rates seem to
complement each other to reflect good coverage. However, these reports were based on recall by the
mothers or caregivers and could not be confirmed by any immunization card. Moreover, the assessment
did not collect the different antigens that the children had received.
� Adequate food alone will not lead to improved nutritional status if practices related to child care remain
poor. It has been shown that children from food secure and well-off households can still be malnourished if
caring practices such as health seeking behavior (illnesses), hygiene and child feeding practices are poor.
The results of the assessment show that 28% of children born in the last 24 months, among Syrian
refugees in Lebanon, were still being breastfed at the time of the assesment. However, table 19 shows
that only 15% children amongs the 6-12 months were breastfed during the day before assessment.
� The results of assessment show that, among Syrian refugees living in Lebanon, 73% of children 6-12
months of age received a complementary food, implying that the remaining 27% had sub-optimal feeding
at this critical child’ age. This proportion was around 60% for children between 12 and 24 months of age.
� The prevalence of moderate and severe acute malnutrition among women aged 15-49 years, based on
MUAC, was assessed. Among Syrian refugees’ families, the assessment showed that there are 5.0%
malnourished (MUAC < 23 cm) women aged 15-49 years and among them 0.5% severely malnourished
(MUAC < 21 cm).

11
� Access to sufficient water for the family needs was assessed. Forty-one percent (41%) of families reported
not having any water problem (quality or quantity). However, 24% of Syrian refugees’ families reported
buying water (cost incurred) as a main water problem while 16% reported that some days, taps do not
have water at all. With regards to “Soap and/or Hygienic products”, 78% of families reported that they have
“Soap and/or Hygienic products” meaning 22% do not have in their residence the essential hygiene
products.
� In Lebanon, Syrian refugees’ families registered with UNHCR receive “Food Vouchers” and they use them
to get food. Food assistance represents an important source of their food consumption. However, to
complement their meals, the families buy some fresh food.
� Syrian refugees reported that food assistance (food aid, gift from charity and purchase with cash from
charity) was a main source of food for less than 25% of the households. However, Syrian refugees’
reported that they bought 66.7% of their food, with their own resources, hence the need to closely monitor
this trend of food purchasing visa-a-vis their ability to buy food in adequate quantity and quality.
� Regarding the number of meals consumed per day, by the Syrian refugees living in Lebanon, 92.7% of
families have 2 meals or more. However, 5.7% of families reported that they did not eat any meal
during the previous day of assessment.
� Consumption of canned food: 52.7% of Syrian refugees’ families in Lebanon consume canned food.
Moreover, more than 50% consumed canned food 2 or 3 days per week and 13% of families consumed
canned food almost every day.
� In 2010, an Emergency Food Security and Nutrition Asssessment done in Syria (EFSNA) showed that the
food consumption score (FCS) was poor (4%), borderline (23%) and acceptable (72%), which is similar to
the findings of this assessment. However, for the borderline FCS, the situation of Syrian refugees’ families
is worst. Based on these results, among Syrian refugees in Lebanon, 32% (Poor and Borderline) of
families were considered food insecure. However, this comparison can be taken cautiously because of the
2010 EFSNA was done during drought and it was conducted in Northern part of Syria only.
� In Lebanon, 73% of Syrian refugees‘families have not had enough food or money to buy food.
However, 42.2% of Syrian refugees’ families had some food stocks, of which the main ones were wheat
and rice: almost 40% of Syrian refugees’ families reported having wheat and rice stocks for fifteen to thirty
days. 20% or more familes reported that they have wheat, rice, beans and potatoes for more than one
month.
� The households adopt a wide range of coping strategies in efforts to cover their food gaps when faced with
declined food availability and access. The survey findings showed that Syrian refugees’ families have a
high rate of sending children daily to eat with relatives. However, the findings (figure 17-1) show that,
“Reducing the size of portions”, “Eating less meals” or “Not eating” are used 5 or more days a week.
� About the conditions of the Syrian refugees’ families in Lebanon, the findings of the assessment
demonstrate that 61.6% of them have had a member leave in search of work so that their family may
survive; 36% have sold their personal assets and 19.3% of the families have school children involved in
the income. Moreover, most families (80.2%) of Syrian refugees in Lebanon have taken it upon
themselves to decrease their health expenditures.
� During the days that they did not have enough food or did not have money to buy food, the Syrian
refugees’families in Lebanon adopted some coping strategies: 24.8% of them purchased food on credit,
21.5% relied on more affordable foods, 19.9% limited portion size during meal times, 18.0% reduced the
number of meals per day, 12.7% of the adults within families harnessed the strategy of food restriction so
that small children can eat, 10.7% would eat at the residences of friends or family members. In extreme
cases, to be able to adequately survive, some families (4.3%) would spend the whole day without eating
and some others (8.2%) would send their family members elsewhere to eat.
12
RECOMMENDATIONS AND PRIORITIES
Immediate term
1. Having a discussion with MOPH, MOSA and all other partners to set up mechanism for acute
malnutrition management and the nutrition surveillance including screening for malnutrition of refugees
at border crossing points and appropriate referral for treatment for the malnourished cases (children and
pregnant and lactating women.
2. Formation and reinforcement of the role and responsibility of the Health and nutrition working group,
taking on the organization and coordination the nutrition sector and response.
3. Developing guidelines or protocol for acute malnutrition management and prevention as well as national
training plan.
4. Strengthen the awareness, promotion and protection of positive infant and young child feeding practices
through NGOs activities by accelerating sensitization and awareness creation on appropriate breast-
feeding and complimentary feeding practices as well as uncontrolled use of breastmilk substitute and
micronutrient supplementation.
5. Improving education and communication strategies in the health centers and community level including
integrating communication for development strategies to positively influence behavior and practices.
6. Scale-up of hygiene promotion activities and improve access to quality water and monitoring the quality
of water as well as treatment of diseases in the health facilities.
7. Facilitate the availability of adequate micronutrient supplements for children, women of child bearing
age, pregnant and lactating women according to national/global protocols.
Medium term
1. Integrating the nutrition surveillance system in existing Health Surveillance System.
2. Putting a proper targeting the refugees and host communities with a minimum response package on
health and nutrition including surveillance, disease treatment, appropriate health and nutrition promotion,
adequate food security, livelihood support, water and sanitation services, shelter, etc.
Longer term
1. If the situation in Syria will not have improved to enable safe return of the refugees, conduct nutrition
assessment in six months’ time, (depending on the delivery of adequate response in the next 6 months).
Assessment methodology should be simplified to capture only key indicators of anthropometry in children
aged 6-59 months and mortality in the whole population as recommended by the SMART methodology.
A full expanded nutrition assessment should be repeated in 12 months.
2. Conduct a comprehensive nutrition assessment after one year, if adequate humanitarian assistance will
have been provided, with a parallel and independent food security assessment. The nutrition assessment
should cater for coverage of response delivered and mortality.

13
Summary of the Results
Assessment area SYRIAN REFUGEES Classification of public health significance or
target (where applicable Date of Assessment September 11th
– 24th
2012
FAMILY OR HOUSEHOLD CHARACTERISTICS
Sample coverage (Response rate) 101%
Average family size 6.2 people
Woman headed housholds 20%
CHILDREN UNDER 5 YEARS
Acute Malnutrition (WHO 2006 Growth Standards) – 95% CI
Global Acute Malnutrition (GAM) 4.4 % (2.6 - 7.3)
Critical: if ≥ 15%
Serious: between 10-14.9%
Poor: between 5 - 9.9%
Moderate Acute Malnutrition (MAM) 3.5 %(2.2 - 5.6)
Severe Acute Malnutrition (SAM) 0.8 % (0.2 - 2.8)
At Risk Acute Malnutrition (WHZ_WHO between -1 SD and -2 SD)1 6.8% (4.6 - 9.1)
Oedema 0.0%
Stunting (WHO 2006 Growth Standards) – 95% CI
Total stunting 12.2 %(9.2 - 16.1)
Critical: if ≥ 40%
Serious: between 30-39.9%
Poor: between 20 - 29.9%
Severe stunting 2.1 % (1.2 - 3.6)
Underweight (WHO 2006 Growth Standards) – 95% CI
Total underweight 3.1 % (1.9 - 4.9)
Critical: if ≥ 30%
Serious: between 20-29.9%
Poor: between 10 - 19.9%
Severe underweight 1.0 % (0.4 - 2.9)
Full vaccination coverage
Self reported vaccination in Syria before leaving 78%
Self reported immunization in Lebanon 23%
Children Morbidity
Diarrhea in past 2 weeks 40.2%
Cough in past 2 weeks 46.7%
Fever in past 2 weeks 49.7%
CHILDREN 0-24 MONTHS
Infant and Young Children Feeding Practices
Children born in the last 24 months and still being breastfed 28%
1 As the situation of acute malnutrition can change quickly and to help the monitoring of children with acute malnutrition, at risk of acute
malnutrition category (WHZ_WHO scores between -1 SD and -2 SD) was analyzed.

14
Assessment area SYRIAN REFUGEES Classification of public health significance or
target (where applicable Date of Assessment September 11th
– 24th
2012
Continued breastfeeding at 6-12 months 15%
Continued breastfeeding at 12-18 months 55%
Continued breastfeeding at 18-24 months 30%
WOMEN 15-49 YEARS
Physiological Status
Women aged 15-49 years who were pregnant 15.9%
Women aged 15-49 years who were Lactating 7.5%
MUAC Women
Malnourished Women (MUAC < 23 cm) 5.0% (3.3 – 6.7)
Severely Malnourished Women (MUAC < 21 cm) 0.5% (0.0 – 1.0)
WASH
Refugee proportion with good water access 63%
Refugee proportion that does not have any water problem 41%
Proportion thae have soap and hygiene products 78%
FOOD SECURITY
Food Sources
Food Assistance (Food aid + Charity) 23.1%
To buy food with own resources 66.7%
Number of Meals per day
Households who have two (2) meals or more per day 92.7%
Consumption of canned food
Proportion of families consume canned food 52.7%
Food Consumption Score (FCS)
Poor (FCS ≤ 21) 3.4%
Borderline (FCS between 21.5 and 35) 28.5%
Acceptable (FCS > 35) 68.1%
Food Stocks
Proportion of families don’t had enough food/money to buy food 73.0%
Proportion of families have Food stocks 42.2%

15
INTRODUCTION
This report presents the outcomes of the nutrition assessment conducted in Lebanon to assess the
nutrition situation of Syrian refugees. UNICEF and WFP commissioned the assessment, with technical
support from WHO, in collaboration with MOPH of Lebanon and ACF in Lebanon. The fieldwork of this
assessment was conducted from September 8th to September 24th. At the time of survey planning and
data collection, the UNHCR data indicated that there were 30,000 Syrian refugees registered. However, at
the time of data analysis and writing this report (end of November 2012), the UNHCR database indicated
that the number of Syrian refugees in Lebanon is 133,634 (102, 369 registered and 31,265 Syrians in
Lebanon awaiting registration).
This report is divided into the following sections:
� Executive summary: Brief summary of the methodology, main results and recommendation.
� Background and Rationale: In this section the background information related to Syrian situation
and justification of sssessment is presented.
� Methodology: The summary methodology for the assessment (SMART methodology is described).
� The Results: The results are reported in different sections.
� The Discussion: The discussion which refers to the context, nutrition results and the literature on
nutrition.
� Recommendations are made for all Syrian refugees in Lebanon.
16
I. BACKGROUND AND RATIONALE
The basic indicators for assessing the severity of a crisis are the mortality, or death rate, and the
nutritional status of the population. These are both estimated by conducting an assessment of the affected
population.
In order to correctly assess the magnitude of the problem, it’s important to know the affected population
size and, if possible, the demographic characteristics of the population. A high proportion of malnourished
cases in a small population is normally of less magnitude than a lower proportion of malnourished cases
in a large population. The scale and type of intervention depends on the magnitude of the emergency
rather than simply on the prevalence of malnutrition.
In early January 2011, while the protests started off peacefully in Syria, they later erupted into a popular
uprising by mid-March 2011.
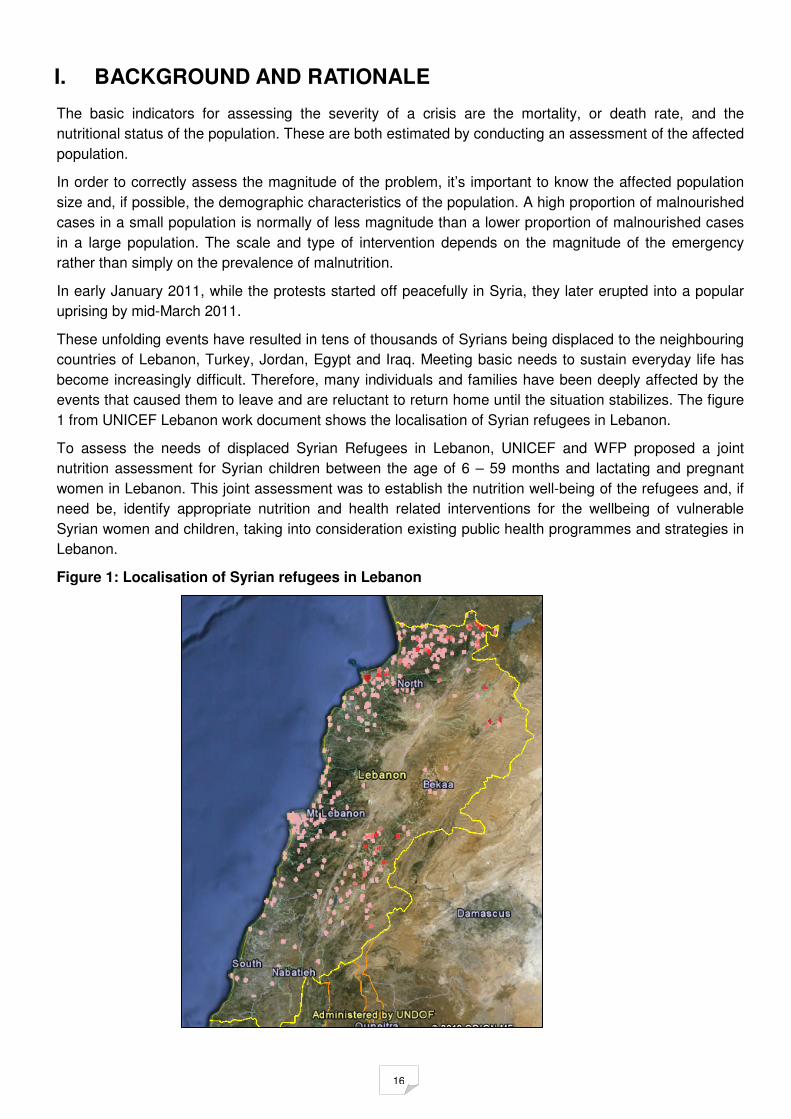
These unfolding events have resulted in tens of thousands of Syrians being displaced to the neighbouring
countries of Lebanon, Turkey, Jordan, Egypt and Iraq. Meeting basic needs to sustain everyday life has
become increasingly difficult. Therefore, many individuals and families have been deeply affected by the
events that caused them to leave and are reluctant to return home until the situation stabilizes. The figure
1 from UNICEF Lebanon work document shows the localisation of Syrian refugees in Lebanon.
To assess the needs of displaced Syrian Refugees in Lebanon, UNICEF and WFP proposed a joint
nutrition assessment for Syrian children between the age of 6 – 59 months and lactating and pregnant
women in Lebanon. This joint assessment was to establish the nutrition well-being of the refugees and, if
need be, identify appropriate nutrition and health related interventions for the wellbeing of vulnerable
Syrian women and children, taking into consideration existing public health programmes and strategies in
Lebanon.
Figure 1: Localisation of Syrian refugees in Lebanon

17
II. JUSTIFICATION OF THE ASSESSMENT
Since early 2011, the number of Syrians crossing the border into Lebanon has gradually been increasing.
In Lebanon, joint registration of refugees with the government is ongoing. Many of the refugees are in a
precarious situation, with little or no financial resources to rely on. UNHCR’s latest estimates1 with
partners indicate that there are 130,799 Syrian registered refugees (between Bekaa and North Lebanon)
and more than 46,855 are currently receiving protection and assistance though the efforts of the
Government of Lebanon, local authorities, UNHCR and national and international NGO. UNHCR´s latest
assessment shows approximately 9,250 Syrian refugees in need in different towns along Bekaa Valley,
Mashari al Qaa, Hermel, Arsal, Jdeide and Fakeha in north Bekaa, Saadnayel, Taalabaya and Taalyel in
Central Bekaa and Rassayeh in south Bekaa. It is difficult to estimate the exact number of displaced
Syrians in Lebanon because of illegal border crossing by Syrians into Lebanon and in view of the fact that
the borders between Lebanon and Syria are not demarcated.
The majority of the refugees are women and children, as many men/heads of households could not leave
Syria. Displaced dependents in Lebanon are therefore socially and economically vulnerable and have a
myriad of needs. Most fled their homes and villages due to fighting in these areas. They have been deeply
affected by the loss of their homes, communities and many have lost loved ones. Over 75% of those who
are being assisted are woman and children. At the early stage of the crisis, many lived with hosting
families who themselves struggle to make ends meet, but recent data as shown that refugees are now
sustaining on their own. Among the most pressing needs are food and basic non-food items, shelter,
medical care and psychosocial support.
According to UNICEF's State of the World’s Children (2012) and FHS (2009), the nutrition situation in Syria
was worse than in Lebanon before the onset of the crisis in Syria, based on wasting (12%), stunting (28%)
or underweight (10%) data available (ref table 1 for comparison). There was however inadequate
information to determine whether those leaving the country are nutritionally worse or better than those
remaining in the country.
Table 1: Nutrition status for Syria, Jordan, Lebanon and MENA Region Average, UNICEF SOWC, 2012 and FHS 2009
Since there is no nutrition assessment/screening established at the point(s) of entry the proposed nutrition
assessment will establish the nutrition situation for a targeted section of Syrian women and children in
Lebanon and provide guidance on likely response to these individuals. The information may provide
baselines for monitoring for future nutrition programmes, if response is ever established. Any such
response will be in line with and complimentary to the current nutrition strategy of the Government of
Lebanon and will therefore also encompass the currently existing mechanisms and systems in Lebanon
with associated impact on the wider Lebanese host population. The SMART (Standardized Monitoring
and Assessment of Relief and Transition) methodology has been chosen to assess the nutrition
situation which has more requirements than other surveys but can provide more reliable and accurate
information/results easily and rapidly for decision makers.
1 WFP Sitrep #34, Januray 2013
Nutrition status for Syria, Jordan, Lebanon and MENA Region Average, UNICEF SOWC, 2012 and FHS, 2009
Country
Stunting
(Moderate &
Severe)
Wasting
(Moderate
& Severe)
Underweight
(Moderate &
Severe)
Exclusively
Breast Fed (<
6 month)
Vitamin A
supplementati
on Coverage
% Households
consuming
Iodized salt
Syria 28 12 10 43 33 79
Jordan 8 2 2 22 - 88
Lebanon 11 5 - 27 - 92
MENA Average 28 9 11 34 48

18
III. TASK FORCE COMMITTEE
To help and advise on the coordination of the nutrition assessment through all the stages of the
assessment, a task force was established in the early planning phase of the assessment.
The duties of the members of the Task Force were to:
1. Review and validate the TOR of the nutrition assessment;
2. Review and validate the methodology and all the tools suggested for the Nutrition Assessment;
3. Advise the assessment coordination team on the feasibility of different activities planned for the
assessment and ensure smooth assessment implementation;
4. Help the assessment coordination to resolve different difficulties that emerged during the
assessment;
5. Review and validate the report and recommendations of the Nutrition Assessment.
The members of the task force had a good technical background and/or a good knowledge about the
Lebanese and assessment context. They helped the realization of the nutrition assessment by advising on
the coordination of the assessment and by supporting the preparation and logistics aspects of the
assessment.
The membership of the task force committee consisted of representatives from UN agencies (UNICEF,
WFP, WHO and UNHCR) in Lebanon and ACF. WHO accepted the responsibility of coordinating the task
force committee.
IV. OBJECTIVES
The nutrition assessment aimed to fill the information gap on the nutritional well-being of the vulnerable
Syrian women and children and to propose interventions, ifthe need for response to mitigate deterioration,
is identified. Specific objectives for the assessment were:
1. To estimate wasting (acute malnutrition), stunting (chronic malnutrition) and underweight of Syrian
children aged 6-59 months in Lebanon
2. To estimate the acute malnutrition levels for Syrian women of child bearing age in Lebanon based
on MUAC measurement
3. To identify/document the underlying factors likely to influence the nutrition well-being of the Syrian
population in Lebanon.
4. To identify interventions and ensure alignement with existing strategies and integrated.

19
V. METHODOLOGY
1. STUDY POPULATION
The study population was a representative sample of the vulnerable Syrian women and child renrecently
dispalced in Lebanon. The target population of the assessment in Lebanon was the Syrian refugees
located in the Bekaa Valley and North Region of the country: Aarsal, Al Ain, Fekha, Jdeideh, Labwe,
Alzeitune and Balbeck in North Bekaa; Saadnayel Taalabaya, Taanyel, Majdel Anjar and Sawari in
Central Bekaa; Rashaiah and West Bekaa. Akkar, Tripoli and Wadi Khalid in North Lebanon. Though
there were uncertainties on the security situation in some locations, all locations which hosted the Syrian
refugees were included in the sampling frame. Access to those locations could be achieved but not all the
time – hence it needed some planning and adjustment in plans when such access issues occured.
A detailed list of the locations and the population size formed the sampling frame/ sampling universe was
used in the random selection of households to facilitate the enrollment of children and the mothers in the
assessment. A representative sample of Syrian refugee children aged 6 to 59 months and women aged
15 to 49 years old was assessed.
2. SAMPLING AND SAMPLE SIZE DETERMINATION
Two stage cluster sampling was conducted to random pick the children and women assessed and the
households whose data was to be collected.
A household was the assessment sample unit. The definition of household is a group of people who live
together and routinely eat out from the same pot. For this assessment, household as UNHCR used in their
register for Syrian Refugees, was used, thus the family as registered by UNHCR, was the household unit
used for the assessment as sampling unit.
According to the number of indicators and based on the pre-testing of the questionnaire, it was estimated
that no more than 12 households could be assessed in one day by each team. A total of 42 clusters were
randomly selected for the Syrian refugees in Lebanon, using probability proportional to size (PPS).
2.1. Sample size determination
The assessment sample was calculated using ENA (Emergency Nutrition Assessment) software1 for
SMART2 methodology (Delta version). To determine the sample size for the assessment, the below
parameters were used (cf. Table 2).
1 Emergency Nutrition Assessment. Le logiciel ENA Delta pour SMART peut-être téléchargé sur http://www.nutrisurvey.net/ena/ena.html
2 SMART : Standardized Monitoring and Assessment of Relief and Transitions

20
Table 2: Parameters used for sample size determination S
yri
an
Refu
gees N
utr
itio
n A
ssessm
en
t, L
eb
an
on
Parameters/Indicators Rate/Number Justification/Sources
Syrian Refugees Size in
Lebanon 28 196
The Syrian Refugees UNHCR data base was used as
the sampling frame. The total number of individuals and
families or households came from this data base
(August 14th, 2012).
Number of Syrian families or
households 6 256
Estimated Prevalence of Global
Acute Malnutrition 12 %
In the UNICEF SoWC 2012, the estimated prevalence of
GAM is 12% for Syria. As it is very difficult to estimate
the more current prevalence of GAM for the Syrian
Refugees, the available Syrian estimated GAM
prevalence was used.
Desired Precision 5 %
The context of Syrian Refugees is changing constantly.
Because of that, it will be difficult to have a precision
level of less than 5%.
Design Effect (DEFF) 2
The population came from different regions and because
of high variation of the context, and no any reference for
the real DEFF, the maximum of DEFF of 2 was used.
Average HH size 4.5
In the data base of UNHCR, there are some single
families. When the total number of Syrian Refugees in
Lebanon was divided by the total number of families/HH
(28,196/6256), a HH average size of 4.5 was obtained.
% Syrian Children under 5 19,6 % The % of children U5 was obtained from the UNHCR
data base.
% Non Response HH 10 % Because of the context of movement of Syrian Refugees
10% as a Non Response rate was chosen.
Children Sample Size 353 ENA software for SMART was used to calculate the
number of children and the number of HH as a sample
size. It was estimated that each team can investigate 12
HH every day and this number became the number of
HH by cluster. To obtain the number of clusters in the
sample, the target 500 HH were divided by 12 HH to
obtain 42 clusters.
Households Sample Size 495 (500)
Number of HH by Cluster 12
Number of Cluster in the sample 42
2.2. First stage of sampling
The first stage consisted of choosing randomly 42 clusters, usually derived from census data or projected
population data or the UNHCR data base for this case.
The UNHCR lists of registered Syrian Refugees were used as the data base for sampling frame
development. The lists had details of individuals by districts, sub-districts, cities, neighborhoods,
mohafaza, qada, and village. The ultimate assessment subjects were households’ members, primarily
children under five, and women of child bearing age. It is worth noting that in some localities, the total
number of individuals was too small to be considered as geographical units for the cluster sampling. In
this case locations with low populations and in close geographical proximity were conglomerated before
choosing randomly the different clusters (localities, groups of localities, district or sub-districts, mohafaza,
qada, and village).
This first stage enabled random selection of clusters needed (42 clusters), thus paving way for the next
level of second stage sampling to pick the 12 households/families from each cluster.

21
2.3. Second stage of cluster sampling methodology
For the second stage of cluster sampling, for each randomly selected geographical unit (locality, district or
sub-district, mohafaza, qada or village) or cluster, a list of the Syrian Refugees provided by UNHCR (with
name of head of family and phone number) was used to choose randomly 12 households by cluster. After
choosing the sample (500 HH), the community workers (coordinated by ACF) verified the addresses of the
entire sample of HH chosen randomly. The sample assessed is presented in Annex 1.
3. QUESTIONNAIRE
The questionnaire was prepared in English and translated and administered in Arabic. The questionnaire
was pre-tested before the assessment and necessary adjustment made before the assessment began.
All information regarding nutrition assessment of children aged between 6 and 59 months and women of
childbearing age (15 – 49 years), and food security at household level was gathered using a validated
interview questionnaire. The questionnaire had 5 modules: - Household consent; - Household Food security; - Feeding and immunization of children aged 0 to 59 months; - Anthropometry and morbidity of children aged 6 to 59 months; - Anthropometry of women of childbearing age (15 to 49 years old).
The Arabic questionnaire is included in annex 2 and the English version is presented in annex 3.
4. MEASUREMENT METHODS
a) Household-level indicators
WASH: The questions used were adapted from the ones recommended in UNHCR’s newly developed
Standardised Nutrition Survey Guidelines for Refugee Populations.
FOOD SECURITY: The questionnaire used was similar to the ones used in Comprehensive Food Security
Assessment (CFSA) as recommended by WFP.
The food consumption was calculated using a seven-day recall for all food groups consumed at least once
during this period and weighting it according to the nutrient content. Households with a total score less
than 21 were considered to have poor food consumption, those with score between 21.5 - 35 were
considered as with borderline food consumption while those above 35 were considered to have an
acceptable food consumption score. Different sources of food, the number of meals per day and coping
strategy index were also analysed.
HEALTH: The questionnaire used was validated by WHO Lebanon. At first, WHO had some reservations
regarding the value of the Diarrhea questions formulation, and the value of the question on Vit A
supplementation (Vitamin A supplementation is not the practice in Lebanon Primary Health Care package
of services). However, for the sake of harmonization with Jordan tools, the questions were kept as are.
b) Individual-level indicators
Sex of children: Gender was recorded as male or female.
Age in months for children 0-59 months: In view that in Syria, a lot of births are registered few months
(up to 6 months) after the real date of birth and the parent provide a later date of birth than the actual, the
child’s age was estimated in months using the “Events Calendar” developed during the assessment
planning. The age was recorded in months on the questionnaire. If the child’s age could absolutely not be
determined through use of local events calendar or by probing, the child’s length/height was used for
inclusion; the child had to measure between 65 cm and 110 cm.

22
Weight of children 6-59 months: Measurements were taken to the closest 100 grams using an
electronic scale (SECA scale) with a wooden board to stabilise placed under scaled when taking
measurements. Most children were weighed with clothes. Hence, the mean weight of 150 grams (for
clothes) was taken into consideration during data analysis.
Height/Length of children 6-59 months: Children’s height or length was taken to the closest millimeter
using a wooden height board. Height was used to decide on whether a child should be measured lying
down (length) or standing up (height). Children less than 87cm were measured lying down (length), while
those greater than or equal to 87cm were measured standing up (height). However, for children taller than
87cm but could not stand, length was taken then later adjusted by deducting 0.7cm from the recorded
readings.
Oedema in children 6-59 months: bilateral oedema was assessed by applying gentle thumb pressure on
to the top of both feet of the child for a period of three seconds and thereafter observing for the presence
or absence of an indent.
MUAC of children 6-59 months and women 15-49 years: MUAC was measured at the mid-point of the
left upper arm between the elbow and the shoulder and taken to the closest millimetre using a standard
tape. MUAC was recorded in centimers for children and for women.
Measles and Polio vaccination in children 6-59 months: vaccination was assessed by checking for
vaccine records on the EPI card if available or by asking the mother or the caregiver to recall if no EPI
card was available.
Measles vaccination coverage: UNHCR recommends target coverage of 95% (same as Sphere
Standards).
Infant and young child feeding practices in children 0-24 months: Infant and young child feeding
practices were assessed based on standard WHO recommendations (WHO 2007).
Diarrhoea in last 2 weeks in children 0-59 months: Mothers or caregivers were asked if their child had
suffered from diarrhoea in the past two weeks and were asked about the duration (number of days) of the
diarrhoea. Diarrhoea: Presence of three or more loose or watery stools in a 24-hour period was used as
the operational definition.
Cough in last 2 weeks in children 0-59 months: Mothers or caregivers were asked if their child had
suffered from cough in the past two weeks.
Fever in last 2 weeks in children 0-59 months: Mothers or caregivers were asked if their child had
suffered from fever in the past two weeks.

23
5. DIFFERENT DEFINITIONS AND CALCULATIONS
A. MALNUTRITION IN CHILDREN 6-59 MONTHS
Acute malnutrition, also known as wasting, was defined using weight-for-height index values or the
presence of oedema and classified as shown in Table 3. Main results are reported after analysis using the
WHO 2006 Growth Standards. Results using the NCHS 1977 Growth Reference are reported in Annex 4.
Table 3: Definitions of acute malnutrition using weight-for-height and/or oedema in children 6–59 months
Categories of acute malnutrition
Percentage of median (NCHS
Growth Reference 1977 only)
Z-scores (NCHS Growth Reference 1977 and WHO Growth Standards 2006)
Bilateral Oedema
Global acute malnutrition < 80% < -2 z-scores Yes/No
Moderate acute malnutrition < 80% to ≥ 70% < -2 z-scores and ≥ -3 z-scores No
Severe acute malnutrition < 70% < -3 z-scores Yes/No
Stunting, also known as chronic malnutrition was defined using height-for-age index values and was
classified as severe or moderate based on the cut-offs shown in Table 4. Main results are reported
according to the WHO Growth Standards 2006. Results using the NCHS 1977 Growth Reference are
reported in Annex 4.
Table 4: Definitions of stunting using height-for-age in children 6–59 months
Categories of stunting Z-scores (WHO Growth Standards 2006 and NCHS Growth Reference 1977)
Stunting <-2 z-scores
Moderate stunting <-2 z-scores and >=-3 z-scores
Severe stunting <-3 z-scores
Underweight was defined using the weight-for-age index values and was classified as severe or
moderate based on the cut-offs shown in Table 5. Main results are reported according to the WHO Growth
Standards 2006. Results using the NCHS 1977 Growth Reference are reported in Annex 4.
Table 5: Definitions of underweight using weight-for-age in children 6–59 months
Categories of underweight Z-scores (WHO Growth Standards 2006 and NCHS Growth Reference 1977)
Underweight <-2 z-scores
Moderate underweight <-2 z-scores and >=-3 z-scores
Severe underweight <-3 z-scores
Mid Upper Arm Circumference (MUAC) values for children aged 6-59 months were used to define
malnutrition according to the cut-offs shown in Table 6. However, the official results are those based on
the weight for height indicator.
Table 6: Classification of acute malnutrition based on MUAC in children 6-59 months (WHO)
Categories of Malnutrition MUAC Reading
At risk of malnutrition ≥ 12.5 cm and <13.5 cm
Moderate malnutrition ≥ 11.5 cm and <12.5 cm
Severe malnutrition < 11.5 cm

24
B. INFANT AND YOUNG CHILD FEEDING PRACTICES IN CHILDREN 0-24 MONTHS
Children born in the last 24 months
Continued breastfeeding at 1 year: Proportion of children 12–18 months who are breastfed and children
12–18 months of age who received breast milk during the previous day.
Children still breastfed at 24 months: Proportion of children born in the last 24 months who were still
breastfeeding.
Introduction of solid, semi-solid or soft foods: Proportion of infants 6–12 months of age who received
solid, semi-solid or soft foods during the previous day.
Continued breastfeeding at 2 years: Proportion of children 18–24 months of age who are breastfed
during the previous day.
C. MALNUTRITION IN WOMEN OF REPRODUCTIVE AGE
Mid Upper Arm circumference (MUAC) in women was classified according to cut-offs, as per the
recommendation of the Sphere Project’s Handbook (2011), shown in Table 7.
Table 7: Classification of undernutrition based on MUAC in women of reproductive age (15 to 49 years)
Categories of Malnutrition MUAC Reading
Global malnutrition <23 cm
Moderate malnutrition ≥21 cm and <23 cm
Severe malnutrition <21 cm
D. CHILDREN ANTHROPOMETRIC DATA
UNHCR Strategic Plan for Nutrition and Food Security (2008-2012) states that the target for the
prevalence of global acute malnutrition (GAM) for children 6-59 months of age by camp, country and
region should be < 5% and the target for the prevalence of severe acute malnutrition (SAM) should be
<1%. Table 8 shows the classification of public health significance of the anthropometric results for
children under-5 years of age according to WHO.
Table 8: Classification of public health significance for children under 5 years of age (WHO, 2000)
Prevalence % Critical Serious Poor Acceptable
Low weight-for-height ≥ 15 10-14 5-9 < 5
Low height-for-age ≥ 40 30-39 20-29 < 20
Low weight-for-age ≥ 30 20-29 10-19 < 10

25
6. TRAINING AND COORDINATION
To support the realization of the nutrition assessment, UNICEF and WFP Lebanon hired ACF Lebanon
through a tripartite partnership agreement to support the two nutrition consultants. ACF Lebanon had to
do the preparatory work for the assessment (to hire the surveyors, to prepare and to organize the logistic
for the training); to hire the clerks for the complementary data entry and to manage the logistic during the
data collection.
The design of assessment was conceptualized by two nutritionists (Oumar Hamza, UNICEF Consultant
and Mohamed Mansour, WFP consultant), with the technical support of the Nutrition Specialist from
UNICEF MENA Regional Office (James Kingori). The assessment was coordinated by UNICEF nutrition
consultant (Oumar Hamza) with support of UNICEF Lebanon emergency specialist (Jean-Marc Cordoro)
and support of ACF Lebanon (Muatasim Hamdan, ACF Emergency coordinator and Beatriz Perez
Bernabe, ACF Lebanon consultant).
The training lasted four days followed by one day to finalize the standardization test (and to organize the
different teams) and one day pre-test. Training was conducted to all assessment team members (see
annex 5): enumerators, team leaders and field supervisors. The training took place from August 29th to
September 2nd and the pre-test was on September 3rd. The training focused on: the purpose and
objectives of the assessment; roles and responsibilities of each team member, familiarization with the
different parts of the questionnaire by reviewing the purpose for each question; interviewing skills and
recording of data; interpretation of calendar of events and age determination; how to take anthropometric
measurements and common errors; and a practical session on anthropometric measurements. The
practical session on anthropometric measurements involved volunteer children for practice as well as a
standardization test.
The assessment was undertaken by 4 teams. Each team was composed of three members who speak
Arabic; a team leader and two measurers. The daily supervision was conducted by the UNICEF nutrition
consultant in addition to two field supervisors with the support of the ACF consultant for Bekka data
collection. The team leaders conducted the interview for all parts of the questionnaire. The rest of the
team members took the anthropometric measurements and assisted with sampling, age determination
and reading of health/vaccination cards or birth certificates.
7. PILOT TESTING AND REVISION OF THE ASSESSMENT TOOLS
Before beginning the assessment, tools and methods were pre-tested and revised. A half day pre-test
exercise was conducted, that included all the process and data collection methods. This activity helped to
ensure that the team leaders understood the questions and were able to follow the interview/data
collection procedures as outlined in the assessment protocol and during training. It also helped in having
feedback about to what extent interviewees understood questions. For the pre-test, each team selected
five households, administered the questionnaire and took the anthropometric measurements
The second half of the day (afternoon) was used to review and discuss the findings of the pre-test, logistic
issues, questionnaires, difficulties based on the pre-test assessment, etc. Based on this pre-test and
discussions, the data collection tools and forms were reviewed and finalized.
8. DATA COLLECTION
Prior to the data collection phase, a sensitization session was done targeting community leaders gathered
from sites in the sampling frame/ universe. It included a presentation of the assessment objectives and the
role of the whole assessment team, roles expected from leaders, as well as clarification about possible
expectations among communities.

26
Data collection lasted 14 days from 11th – 24th September 2012. Each assessment team explained the
purpose of the assessment and issues of confidentiality and obtained verbal consent before proceeding
with the assessment in the selected households (UNHCR Families registered). The informed consent form
is shown in Annex 6.
9. FIELD WORK AND QUALITY CONTROL
Due to cultural and social considerations, female members did the women anthropometric measurements.
Throughout the field work, rigorous quality control measures were adopted. Anthropometric equipment
(scales, height boards and MUAC tapes) was calibrated and checked before distributing them to the
different teams and the calibration & accuracy verification was repeated every day before starting the field
work.
Every day, filled questionnaires were reviewed on site by team leaders and checked by field supervisors
including for data accuracy and completeness. For each case of severe acute malnutrition, a referral form
was filled with the child’s details and the team leader explained to and advised the parent/caregiver to
takethe child to a designated health center for further nutrition support and guidance.
Team leaders checked the questionnaires before leaving the household, identified errors and made sure
data collected was correct before signing off. At the end of each day and/or before leaving the cluster, the
team checked all the questionnaires for any identifiable errors and made sure data collected was correct.
While still in the field or at the end of the day (before the anthropometric data entry began), supervisors re-
checked the questionnaires to ascertain completeness. After all verification, team leaders prepared the
questionnaires and brought them for the daily anthropometric data entry.
The coordinator (Nutrition consultant) with the support of supervisors verified all the questionnaires filled
by the team in each cluster on the same day. The anthropometric data entry using the ENA software was
organizedand checked for any suspect data (outliers) every night through the appropriate sections of the
plausibility report (Plausibility check is an important data quality verification property of the ENA software).
The nutrition consultant reviewed the anthropometric data quality report and gave the feedback to the
supervisors and teams the next day, during the daily early morning meeting (planning of the day).
Plausibility reports and feed-back of the consultant determined whether the team needs to go back to the
previous day’s cluster to rectify the errors identified, before embarking on another cluster. In case of
incorrect anthropometric measurements or “flagged” results which demand the return to the previous
day’s cluster, the field supervisor accompanied the team back to the cluster to take fresh measurement of
the child.
10. DATA ANALYSIS
All anthropometric data entry was completed every night in the field using ENA for SMART software (delta
version, November 8th 2011), by the coordinator of the survey (Consultant) supported by the supervisors
and team leaders. The entry of complimentary data was completed by a team of three (3) clerks using an
Excel template, at ACF office in Zahleh.
All questionnaires were manually checked for completeness, consistency and range before data entry by
the supervisors and coordinator. This check was also used to provide feedback to the teams to improve
data collection as the assessment progressed. All data files were cleaned before analysis. Analysis was
performed using ENA for SMART and SPSS software. The SMART Plausibility Report was generated in
order to check the quality of the anthropometric data and a summary of the key quality criteria is shown in
Annex 7.

27
To ensure there were no data entry errors, after completion of the data entry, all entries were double
checked one by one with the original questionnaire. For cleaning the anthropometric data, the flexible
cleaning approach recommended in the UNHCR Standardized Nutrition Survey Guidelines (Version 1.2,
June 2011) in accordance with SMART recommendations was used. For the weight-for-height index, a
cleaning window of +/- 4 SD was used instead of the default +/- 3 SD value contained in the SMART for
ENA software.
During the process of data analysis, the UNICEF nutrition consultant and assessment coordinator was
supported by a team from WFP Office, particularly for food security indicators (FCS and Copping Strategy
index). This team was constituted by: Michèle Doura, WFP Nutritionist and Regional Programme Officer;
Asif Niazi, Regional VAM advisor; Briony Stevens, WFP Nutritionist; Gehan Al-Hossiny, VAM officer and
Shaimaa Amin, GIS officer (mapping).
28
VI. RESULTS - INDIVIDUAL LEVELS
1. RESPONSE RATE
Table 9 shows the different response rate and the total number of households (families) and children
under 5 who were covered during the assessment. 42 clusters were sampled and on average 12 families
per cluster assessed.
Table 9: Target sample size and number covered during the assessment
Target groups Target
Sample Size
Families/Children covered during the Assessment
Response Rate (% of the target)
Number of households (families) 500 505 101%
Number of Children 6-59 months 353 483 136.8%
For Syrian refugees in Lebanon, the nutrition assessment covered 101% of the target of numbers of
households. Regarding the number of under five year old children, due to an underestimation on the
average size of family, based on UNHCR record, the response rate is more than 130%.
2. DEMOGRAPHY
The findings of the assessment show that the average household size was 6.2 people. This average
family size is higher than the 4.5 people according to the UNHCR data base, upon which the assessment
planning was based upon.
Female headed households were around 20%. These results are lower than what UNHCR reported as
percentage of households headed by women (66%). This may be due to women being registered as the
head of family as men may be travelling to and from Syria.
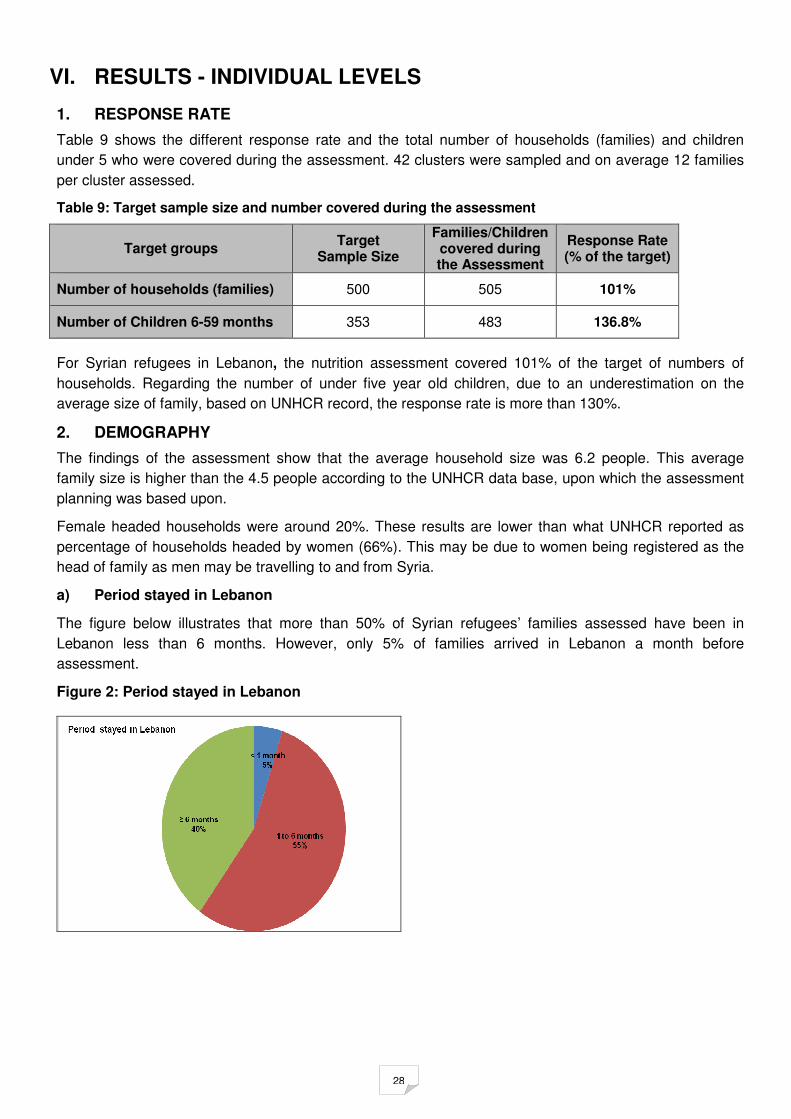
a) Period stayed in Lebanon
The figure below illustrates that more than 50% of Syrian refugees’ families assessed have been in
Lebanon less than 6 months. However, only 5% of families arrived in Lebanon a month before
assessment.
Figure 2: Period stayed in Lebanon

29
b) Sharing an accommodation
Only eight percent (8.1%) of Syrian families are hosted by resident families. Thirty-one percent (31.0%) of
Syrian refugees’ families reported that they shared accommodation with other Syrian refuggees’ families.
Among the families sharing accommodation, 12.4% shared accommodation with one family; 62.7%
shared their accommodation with 2-3 other Syrian families and 24.9% shared accommodation with 4 or
more other Syrian families. These numbers are coherent with other sources, indicating that the majority of
Syrian refugees on Lebanon have moved into their own settlements (not hosted by resident families).
3. HEALTH ASSISTANCE
The proportion of families which had access to health services (or had known where to get health
assistance) is very high. More than 75% (75.8%) of Syrian refugees in Lebanon have access to free
health services (Public Health facilities – MOPH or NGO Clinic).
Figure 3: Access to the free Health Services
4. CHILDREN 6-59 MONTHS
A. ANTHROPOMETRIC RESULTS (BASED ON WHO GROWTH STANDARDS 2006)
Distribution of the sample per ages and per sex
The age distribution of the assessed children is presented in table 10 and figure 4. The overall sex ratio
was 1.0 (sex ratio should be between 0.8 - 1.2), which confirms that both sexes were equally distributed
and well represented in the randomly selected sample. The sex ratio indicates that there was no bias in
the sampling for or against either gender (girls or boys).
Table 10: Distribution of age and sex of the Syrian refugees in Lebanon
Boys Girls Total Ratio
AGE (mo) No. % No. % No. % Boy:Girl
6-11 31 59.6 21 40.4 52 10.8 1.5
12-23 64 47.8 70 52.2 134 27.7 0.9
24-35 45 46.4 52 53.6 97 20.1 0.9
36-47 55 51.9 51 48.1 106 21.9 1.1
48-59 50 53.2 44 46.8 94 19.5 1.1
Total 245 50.7 238 49.3 483 100.0 1.0

30
Figure 4: Distribution of age and sex of the Syrian refugees in Lebanon
Prevalence of Acute Malnutrition (Wasting) by sex
The results in table 11 show the overall global acute malnutrition (wasting) rates of 4.4% among Syrian
refugees in Lebanon. The findings also show a variation between boys and girls in the prevalence of acute
malnutrition. However, the difference between boys and girls in the prevalence of acute malnutrition is not
statistically significant (X2: 2.641, P> 0.05).
Table 11: Prevalence of Acute Malnutrition based on weight-for-height z-scores (and/or oedema) and by sex, among Syrian refugees in Lebanon
Prevalence of All
n = 482
Boys
n = 244
Girls
n = 238
Global Acute Malnutrition (GAM)
(<-2 z-score and/or oedema)
(21) 4.4 %
(2.6 - 7.3 95% C.I.)
(15) 6.1 %
(3.5 - 10.5 95% C.I.)
(6) 2.5 %
(1.0 - 6.0 95% C.I.)
Moderate Acute Malnutrition (MAM)
(<-2 z-score and >=-3 z-score, no oedema)
(17) 3.5 %
(2.2 - 5.6 95% C.I.)
(13) 5.3 %
(3.0 - 9.2 95% C.I.)
(4) 1.7 %
(0.6 - 4.3 95% C.I.)
Severe Acute Malnutrition (SAM)
(<-3 z-score and/or oedema)
(4) 0.8 %
(0.2 - 2.8 95% C.I.)
(2) 0.8 %
(0.2 - 3.4 95% C.I.)
(2) 0.8 %
(0.1 - 6.0 95% C.I.)
The prevalence of oedema is 0.0 %
Anthropometric results based on NCHS 1977 Growth Reference are shown in Annex 4.
Prevalence of Acute Malnutrition by age
The results from table 12 and figure 5 showed that, among Syrian refugees in Lebanon, the youngest age
group of children (6-11 months) tends to be the most affected by severe wasting (SAM) while the other
equally young categories of 12-23 and 24-35 have slightly elevated moderate acute malnutrition (MAM)
prevalence. This situation indicates possibility of weak caring practices particularly at this transition period
from exclusive breastfeeding to introduction of complimentary feeding.

31
Table 12: Prevalence of acute malnutrition by age among Syrian refugees in Lebanon
Severe wasting
(<-3 z-score)
Moderate wasting
(>= -3 and <-2 z-score )
Normal
(> = -2 z score) Oedema
Age (mo) Total no. No. % No. % No. % No. %
6-11 52 1 1.9 1 1.9 50 96.2 0 0.0
12-23 134 1 0.7 6 4.5 127 94.8 0 0.0
24-35 96 1 1.0 5 5.2 90 93.8 0 0.0
36-47 106 1 0.9 4 3.8 101 95.3 0 0.0
48-59 94 0 0.0 1 1.1 93 98.9 0 0.0
Total 482 4 0.8 17 3.5 461 95.6 0 0.0
Figure 5: Prevalence of acute malnutrition by age among Syrian Refugees in Lebanon
Table 13: Distribution of acute malnutrition and oedema based on weight-for-height z-scores
SYRIAN REFUGGEES IN
LEBANON
<-3 z-score >=-3 z-score
Oedema
present
Marasmic kwashiorkor
No. 0
(0.0 %)
Kwashiorkor
No. 0
(0.0 %)
Oedema
absent
Marasmic
No. 4
(0.8 %)
Not severely malnourished
No. 478
(99.2 %)
Prevalence of Risk of Acute Malnutrition
As the situation of acute malnutrition can change quickly and to help the monitoring of children with acute
malnutrition, at risk of acute malnutrition category (WHZ_WHO scores between -1 SD and -2 SD) was
analyzed.
The analysis showed that among Syrian refugees in Lebanon, 6.8% (4.6% - 9.1% CI 95%) of children 6-
59 months were at risk of acute malnutrition.

32
Prevalence of Chronic Malnutrition (Stunting) by Sex
In the current context gathering data on the exact ages of children can be difficult as many children are
not registered and parents or caregivers may not remember precise dates. As explained in the
methodology section, teams made reference to the “Events Calendar” to estimate and verify age in
months. Even though great lengths were taken to ensure quality age data, the data must be understood in
light of its limitation. The assessment found a lower prevalence than in Syria (12.2% vs 28%) of chronic
malnutrition as shown in table 14, based on the 2006 WHO child growth standards.
Table 14: Prevalence of stunting based on height-for-age z-scores and by sex among Syrian Refugees in Lebanon
All
n = 482
Boys
n = 244
Girls
n = 238
Prevalence of stunting
(<-2 z-score)
(59) 12.2 %
(9.2 - 16.1 95% C.I.)
(26) 10.7 %
(6.9 - 16.2 95% C.I.)
(33) 13.9 %
(10.0 - 18.9 95% C.I.)
Prevalence of moderate stunting
(<-2 z-score and >=-3 z-score)
(49) 10.2 %
(7.5 - 13.6 95% C.I.)
(21) 8.6 %
(5.6 - 13.0 95% C.I.)
(28) 11.8 %
(8.2 - 16.6 95% C.I.)
Prevalence of severe stunting
(<-3 z-score)
(10) 2.1 %
(1.2 - 3.6 95% C.I.)
(5) 2.0 %
(0.9 - 4.7 95% C.I.)
(5) 2.1 %
(0.9 - 4.8 95% C.I.)
Prevalence of Stunting by age
For Syrian refugees in Lebanon, children from 12 to 59 months are more affected by chronic malnutrition.
Moreover, the children from group of age between 48 to 59 months are the most affected by the stunting.
Table 15: Prevalence of stunting by age based on height-for-age z-scores among Syrian Refugees
Severe stunting
(<-3 z-score)
Moderate stunting
(>= -3 and <-2 z-score )
Normal
(> = -2 z-score)
Age (mo) Total no. No. % No. % No. %
6-11 52 1 1.9 2 3.8 49 94.2
12-23 134 3 2.2 15 11.2 116 86.6
24-35 96 3 3.1 8 8.3 85 88.5
36-47 106 1 0.9 12 11.3 93 87.7
48-59 94 2 2.1 12 12.8 80 85.1
Total 482 10 2.1 49 10.2 423 87.8
Figure 6: Prevalence of stunting by age based on height-for-age z-scores among Syrian Refugees
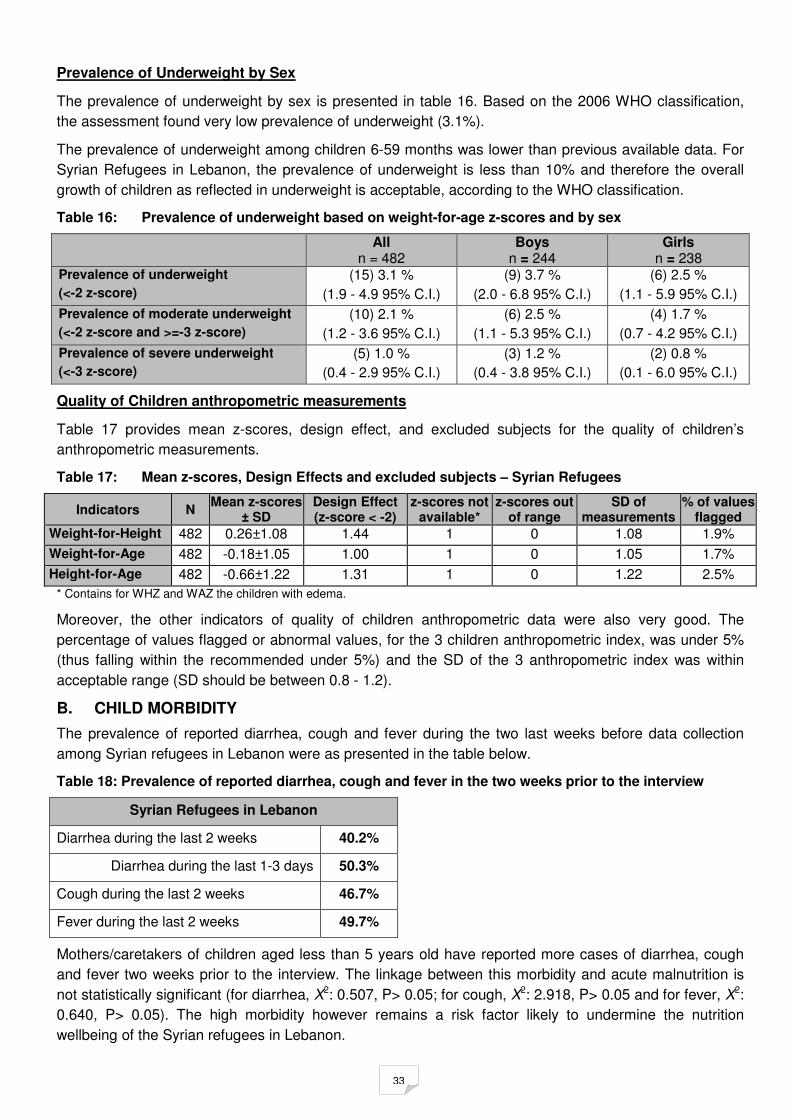
33
Prevalence of Underweight by Sex
The prevalence of underweight by sex is presented in table 16. Based on the 2006 WHO classification,
the assessment found very low prevalence of underweight (3.1%).
The prevalence of underweight among children 6-59 months was lower than previous available data. For
Syrian Refugees in Lebanon, the prevalence of underweight is less than 10% and therefore the overall
growth of children as reflected in underweight is acceptable, according to the WHO classification.
Table 16: Prevalence of underweight based on weight-for-age z-scores and by sex
All n = 482
Boys n = 244
Girls n = 238
Prevalence of underweight
(<-2 z-score)
(15) 3.1 %
(1.9 - 4.9 95% C.I.)
(9) 3.7 %
(2.0 - 6.8 95% C.I.)
(6) 2.5 %
(1.1 - 5.9 95% C.I.)
Prevalence of moderate underweight
(<-2 z-score and >=-3 z-score)
(10) 2.1 %
(1.2 - 3.6 95% C.I.)
(6) 2.5 %
(1.1 - 5.3 95% C.I.)
(4) 1.7 %
(0.7 - 4.2 95% C.I.)
Prevalence of severe underweight
(<-3 z-score)
(5) 1.0 %
(0.4 - 2.9 95% C.I.)
(3) 1.2 %
(0.4 - 3.8 95% C.I.)
(2) 0.8 %
(0.1 - 6.0 95% C.I.)
Quality of Children anthropometric measurements
Table 17 provides mean z-scores, design effect, and excluded subjects for the quality of children’s
anthropometric measurements.
Table 17: Mean z-scores, Design Effects and excluded subjects – Syrian Refugees
Indicators N Mean z-scores
± SD Design Effect (z-score < -2)
z-scores not available*
z-scores out of range
SD of measurements
% of values flagged
Weight-for-Height 482 0.26±1.08 1.44 1 0 1.08 1.9%
Weight-for-Age 482 -0.18±1.05 1.00 1 0 1.05 1.7%
Height-for-Age 482 -0.66±1.22 1.31 1 0 1.22 2.5%
* Contains for WHZ and WAZ the children with edema.
Moreover, the other indicators of quality of children anthropometric data were also very good. The
percentage of values flagged or abnormal values, for the 3 children anthropometric index, was under 5%
(thus falling within the recommended under 5%) and the SD of the 3 anthropometric index was within
acceptable range (SD should be between 0.8 - 1.2).
B. CHILD MORBIDITY
The prevalence of reported diarrhea, cough and fever during the two last weeks before data collection
among Syrian refugees in Lebanon were as presented in the table below.
Table 18: Prevalence of reported diarrhea, cough and fever in the two weeks prior to the interview
Syrian Refugees in Lebanon
Diarrhea during the last 2 weeks 40.2%
Diarrhea during the last 1-3 days 50.3%
Cough during the last 2 weeks 46.7%
Fever during the last 2 weeks 49.7%
Mothers/caretakers of children aged less than 5 years old have reported more cases of diarrhea, cough
and fever two weeks prior to the interview. The linkage between this morbidity and acute malnutrition is
not statistically significant (for diarrhea, X2: 0.507, P> 0.05; for cough, X2: 2.918, P> 0.05 and for fever, X2:
0.640, P> 0.05). The high morbidity however remains a risk factor likely to undermine the nutrition
wellbeing of the Syrian refugees in Lebanon.

34
C. CHILDREN VACCINATION COVERAGE
Mothers or caregivers had to report if their children had received all their vaccines in Syria (with or without
showing any vaccination card). They had also to report if their children had received any immunization
since they arrived in Lebanon.
The findings of the assessment show that 78.6% of mothers or caregivers reported that their children had
received their vaccines in Syria before leaving and 23% of mothers or caregivers reported that their
children had received their immunization since they arrived in Lebanon. The two coverage rates seem to
complement each other to reflect good coverage. However, these reports were based on recall by the
mothers or caregivers and were not confirmed by any immunization official document and the assessment
did not collect the different antigens that the children had received.
Figure 7: Self reported vaccination coverage
The figure 7 above shows that the self reported vaccination coverage of Syrian refugees’ children in
Lebanon increased by the time the Syrian refugees stayed in Lebanon. It is could be linked to high access
to the free health services (Public Health facilities – MOPH or NGO Clinic).
This self reported vaccination coverage points towards an acceptable average but needs to be verified
further.
D. INFANT AND YOUNG CHILD FEEDING
Children breastfed
The results of assessments show that 28% of children born in the last 24 months, among Syrian refugees
in Lebanon, were still breastfed. However, the findings of assessment in table 19 show that only 15%
children among group of 6-12 months breastfed during the day before assessment.
Table 19: Breastfeeding and complimentary feeding
Age BreastFeeding Other food
6 to 12 months 15% 73%
12 to 18 months 55% 61%
18 to 24 months 30% 66%

35
Introduction of solid, semi-solid or soft foods:
The results of the assessment show that, among Syrian refugees livng in Lebanon, 73% of children 6-12
months of age received a complimentary food. This proportion was around 60% for children between 12
and 24 months of age. These results show that not all children received optimal food at the right age (in
terms of quantity) and not all children are still breastfed for the recommended two years and beyond.

36
5. WOMEN 15-49 YEARS
A. PHYSIOLOGICAL STATUS
As shown in figure 8, among Syrian refugees in Lebanon, more than 80% of lactating women and
pregnant women are less than 35 years old. The results of assessment show that 15.9% of women 15-49
years old are pregnant and 7.5% are lactating.
Figure 8: Physiological Status of Women 15-49 years – Syrian refugees in Lebanon
B. WOMEN MALNUTRITION
Mid Upper Arm circumference (MUAC) in women was classified according to the Sphere Project’s
Handbook (2011) cut-offs of:
� Global malnutrition: MUAC < 23 cm
� Moderate malnutrition: MUAC ≥21 cm and <23 cm
� Severe malnutrition: MUAC < 21 cm
The assessment results show that there are 5.0% (3.3 – 6.7 95% C.I.) malnourished (MUAC < 23 cm)
Syrian Refugees’ women aged 15-49 years and among them 0.5% (0.0 – 1.0 95% C.I.) severely
malnourished (MUAC < 21 cm).
Figure 9 shows that more than 85% of malnourished women among Syrian refugees in Lebanon were
aged less than 30 years old: 28% were between 15-19 years, 38% between 20 and 24 years and 21%
between 25 and 29 years. However, 10% of malnourished women among Syrian Refugees in Lebanon
were between 45 and 49 years.

37
Figure 9: Prevalence of malnutrition among women by age groups – Syrian refugees in Lebanon

38
VII. RESULTS - HOUSEHOLD LEVEL –WASH AND FOOD SECURITY
1. WASH
All households (families UNHCR registered) randomly selected were interviewed on water access, on
presence of any main water problem and on whether they had “Soap and Hygiene products”.
A. ACCESS TO SUFFICIENT WATER
During the assessment, only the access to sufficient water for the family needs was investigated with 63%
of Syrian refugees’ families reporting to have access to sufficient water.
Figure 10: Access to sufficient water for drinking, cooking and washing
B. MAIN WATER PROBLEMS
During the assessment, the head of families were asked if they have “Water problems”. Among Syrian
refugees living in Lebanon, 41% of families did not have any water problem. However, 24% of Syrian
refugees’ families reported as a main water problem “Buying Water”, because of cost issue, and 16%
reported that some days they do not have tap water at all.
The situation of Syrian refugees “main water problems” is similar, and not worse, than the situation of the
Lebanese people residing in Lebanon.
Figure 11: Main Water Problems for Syrian Refugees in Lebanon
C. HAVE SOAP AND/OR HYGIENIC PRODUCTS
During the assessment, the head of families were asked if they have “Soap and/or Hygienic products”.
Amongst the Syrian refugees in Lebanon, 78% of families reported that they had “Soap and/or Hygienic
products”.

39
2. FOOD SECURITY
The Food Security part of the nutrition assessment, for Syrian refugees in Lebanon is constituted of:
� Family food sources
� Number of meals per day
� Consumption of canned food
� Food consumption Scores (FCS)
� Food stocks
� Coping strategies
A. FOOD SOURCES
In Lebanon, Syrian refugees’ families registered with UNHCR receive “Food Vouchers” and they use them
to get food. Food assistance represents an important source of their food consumption. However, the
families need to buy food to complement their meals (e.g. some fresh food).
During the assessment, the Syrian refugees’ families were asked about the different food sources, as
shown in figure 12.
The findings of the assessment showed that food assistance (food aid, gift from charity and purchase with
cash from charity) represented less than 25% (9.8% + 4.2% + 9.1%) of the food sources of Syrian
refugees in Lebanon. However, they reported that they bought 66.7% of their food, with their own
resources. This situation has to be monitored.
Figure 12: Food Sources
B. NUMBER OF MEALS PER DAY
The results of the assessment (Figure 13) show that among Syrian refugees who lived in Lebanon, 92.7%
of families 2 meals or more per day. However, 5.7% of families reported that they did not have any meal.
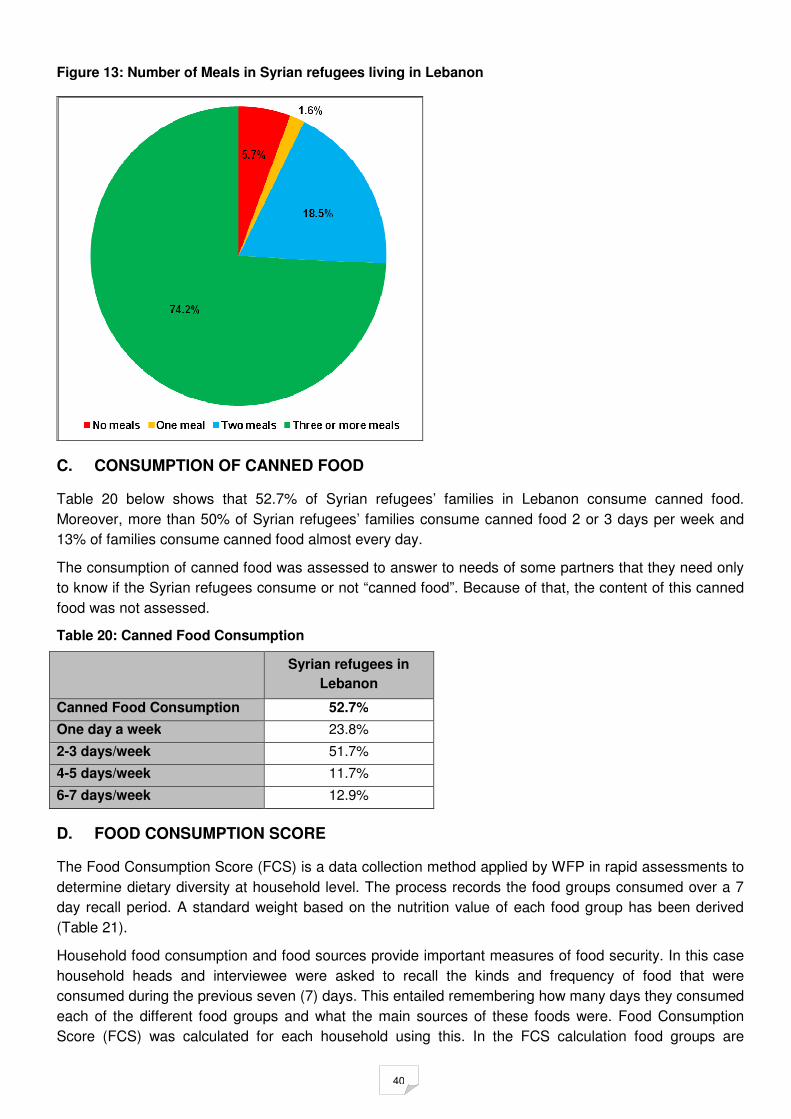
40
Figure 13: Number of Meals in Syrian refugees living in Lebanon
C. CONSUMPTION OF CANNED FOOD
Table 20 below shows that 52.7% of Syrian refugees’ families in Lebanon consume canned food.
Moreover, more than 50% of Syrian refugees’ families consume canned food 2 or 3 days per week and
13% of families consume canned food almost every day.
The consumption of canned food was assessed to answer to needs of some partners that they need only
to know if the Syrian refugees consume or not “canned food”. Because of that, the content of this canned
food was not assessed.
Table 20: Canned Food Consumption
Syrian refugees in
Lebanon
Canned Food Consumption 52.7%
One day a week 23.8%
2-3 days/week 51.7%
4-5 days/week 11.7%
6-7 days/week 12.9%
D. FOOD CONSUMPTION SCORE
The Food Consumption Score (FCS) is a data collection method applied by WFP in rapid assessments to
determine dietary diversity at household level. The process records the food groups consumed over a 7
day recall period. A standard weight based on the nutrition value of each food group has been derived
(Table 21).
Household food consumption and food sources provide important measures of food security. In this case
household heads and interviewee were asked to recall the kinds and frequency of food that were
consumed during the previous seven (7) days. This entailed remembering how many days they consumed
each of the different food groups and what the main sources of these foods were. Food Consumption
Score (FCS) was calculated for each household using this. In the FCS calculation food groups are
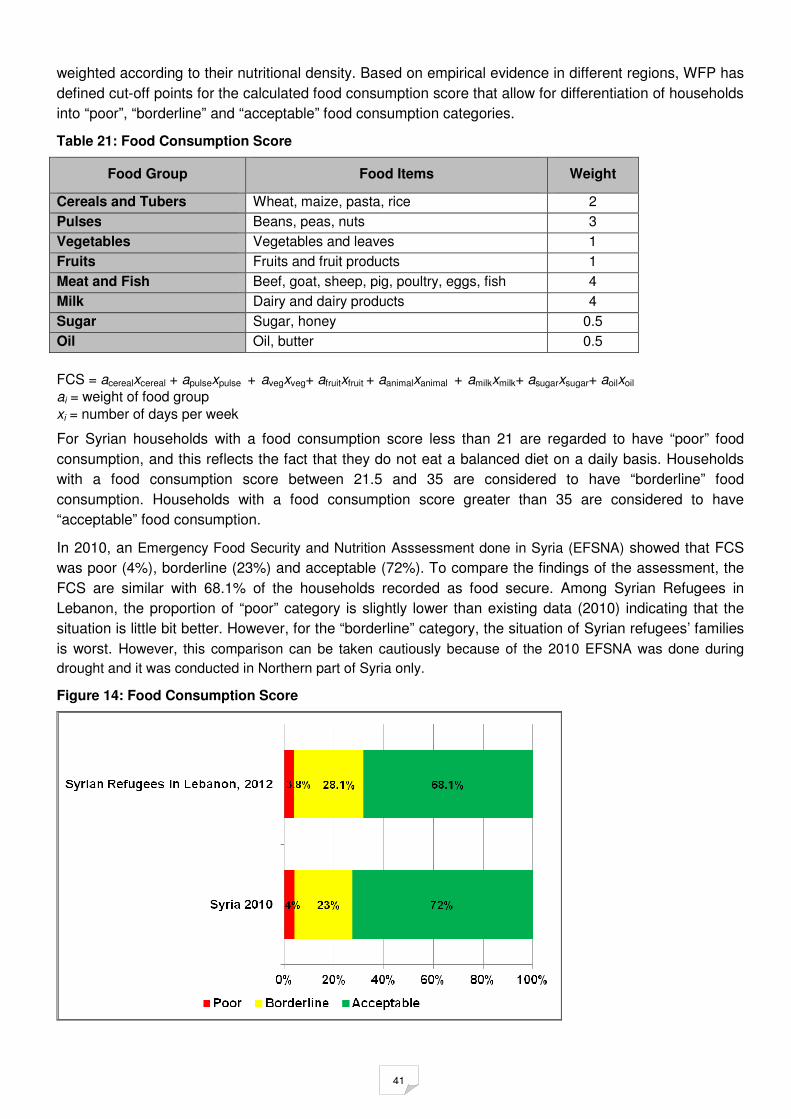
41
weighted according to their nutritional density. Based on empirical evidence in different regions, WFP has
defined cut-off points for the calculated food consumption score that allow for differentiation of households
into “poor”, “borderline” and “acceptable” food consumption categories.
Table 21: Food Consumption Score
Food Group Food Items Weight
Cereals and Tubers Wheat, maize, pasta, rice 2
Pulses Beans, peas, nuts 3
Vegetables Vegetables and leaves 1
Fruits Fruits and fruit products 1
Meat and Fish Beef, goat, sheep, pig, poultry, eggs, fish 4
Milk Dairy and dairy products 4
Sugar Sugar, honey 0.5
Oil Oil, butter 0.5
FCS = acerealxcereal + apulsexpulse + avegxveg+ afruitxfruit + aanimalxanimal + amilkxmilk+ asugarxsugar+ aoilxoil
ai = weight of food group
xi = number of days per week
For Syrian households with a food consumption score less than 21 are regarded to have “poor” food
consumption, and this reflects the fact that they do not eat a balanced diet on a daily basis. Households
with a food consumption score between 21.5 and 35 are considered to have “borderline” food
consumption. Households with a food consumption score greater than 35 are considered to have
“acceptable” food consumption.
In 2010, an Emergency Food Security and Nutrition Asssessment done in Syria (EFSNA) showed that FCS
was poor (4%), borderline (23%) and acceptable (72%). To compare the findings of the assessment, the
FCS are similar with 68.1% of the households recorded as food secure. Among Syrian Refugees in
Lebanon, the proportion of “poor” category is slightly lower than existing data (2010) indicating that the
situation is little bit better. However, for the “borderline” category, the situation of Syrian refugees’ families
is worst. However, this comparison can be taken cautiously because of the 2010 EFSNA was done during
drought and it was conducted in Northern part of Syria only.
Figure 14: Food Consumption Score

42
E. FOOD STOCKS
The findings of the assessment show that 73% of Syrian refugees‘families in Lebanon did not have
enough food or money to buy food.
Figure 15: Having enough food or having money to buy food
However, the results of the assessment show that 42.2% of Syrian refugees’ families in Lebanon had
some food stocks and the longest duration of food stock was observed in wheat and rice. Almost 40% of
Syrian refugees’ families in Lebanon reported that they have wheat and rice food stocks for fifteen to thirty
days while 20% or more familes reported that they have wheat, rice, beans and potatoes for more than
one month of duration of food stocks.
Figure 16: Duration of Food Stocks – Syrian refugees in Lebanon

43
F. COPING STRATEGIES
The households adopt a wide range of coping strategies in an effort to cover their food gaps when faced
with acute food decline. In Lebanon, Syrian refugees’ families, indicated to have a high rate of daily use of
sending children to eat with family relatives. However, the findings (figure 17-1) show that, , Syrian
refugees’ families in Lebanon use the following coping strategies 5 or more days a week: “Reducing the
size of portions”, “Eating less meals” or “Not eating”.
Figure 17-1: Coping Strategies – Proportion of using different coping strategies – Syrian refugees in Lebanon
The findings in figure 17-2 demonstrate the conditions of the Syrian refugees’ families in Lebanon. Sixty-
two (61.6%) of them have had a member leave in search of work so that their family may survive; 36%
have sold their personal assets and 19.3% of the families have school children involved in the income.
Moreover, most families (80.2%) of Syrian refugees in Lebanon have taken it upon themselves to
decrease their health expenditures.
Figure 17-2: Coping Strategies – Proportion of using different coping strategies – Syrian refugees in Lebanon

44
Table 22 below presents rhe results coping strategies that thes Syrian refugees in Leban used during the
days that they did not have enough food or did not have money to buy food.
Table 22: Coping strategies
During the days that they did not have enough food or did not have
money to buy food, the Syrian refugees in Lebanon
Proportion
(%)
Relying on less preferred and less expensive foods 21.5
Borrowing food, or relying on help from a friend or relative 10.9
Limited portion size during meal times 19.9
Restricted consumption for adults so that small children are able to eat 12.7
Reducing the number of meals eaten per day 18.0
Spending the whole day without eating 4.3
Purchasing food at credit 24.8
Have family members eat at placing of relatives or neighbors 10.7
Sending family members elsewhere to eat 8.2
The findings show that, 24.8% of them purchased food on credit, 21.5% relied on a more affordable
nature of foods, 19.9% adopted a limited portion size during meal times, 18.0% reduced the number of
meals per day, 12.7% of the adults within families harnessed the strategy of food restriction so that small
children can eat, 10.7% would eat at the residence of friends or family members.
In the extreme cases, to be able to adequately survive, some families (4.3%) would spend the whole day
without eating and some others (8.2%) would send their family members elsewhere to eat.

45
LIMITATIONS
� Poor quality of age data for children U5 years: Considering the inaccuracies in birth registration
there were challenges in age documentation among children 6-59 months. Due to this limitation and
although an event calendar was used by the teams to ascertain age, stunting and underweight
results are to be interpreted with caution because z-scores for height-for-age (and weight for age)
require accurate ages to within two weeks (CDC/WFP: A manual: Measuring and Interpreting
Mortality and Malnutrition, 2005).
� Sample had not covered the unregistered Syrian families: The analysis only included those who
are part of aid programs (registered by UNHCR). Households that were not registered or with
incorrect information were not represented in this assessment.
� The questionnaire was heavy to administrate due to the needs of different UN agencies
� Children morbidity data could be more detailed and more precise: Respondents were not
asked to define nor have a standardized definition of ‘diarrhea’ or ‘cough’. However the definition
use of 3-4 loose stools per day was consistent with the Lebanon MOPH operational definition for
diarrhea hence assumed to be applicable for the Syrians as well.

46
DISCUSSION
The nutrition assessment covered 100% of the target of numbers of Syrian refugees’ households. Due to
the underestimation of the average family size and as a result the number of under five year old, the
number of children exceeded the target thus getting a response rate is more than 130%. The overall sex
ratio was 1.0 (sex ratio should be between 0.8 - 1.2), which confirms that both sex were equally distributed
and well represented and that there was no bias in terms of sampling girls or boys.
1. NUTRITIONAL STATUS OF YOUNG CHILDREN
The close supervision and the daily data entry of anthropometric measurements combined with the daily
feed-back to the assessment teams on the data quality facilitated achievement of valid anthropometric
data for children under 5 years old (table 17).
Table 23: Prevalence of malnutrition compared to UNICEF SoWC, 2012
ASSESSMENT Wasting (GAM
rate) At Risk
of Wasting Total
Underweight rate Total
Stunting rate
Syrian refugees in Lebanon – September 2012
4.4 % (2.6 - 7.3) 6.8% (4.6% - 9.1%) 3.1 % (1.9 - 4.9) 12.2 % (9.2 - 16.1)
SOWC (2012) and MICS 2006 12% ------ 10% 28%
The prevalence of global acute malnutrition (GAM), among children 6-59 months among Syrian Refugees
in Lebanon, was 4.4% thus less than 5% cut-off for acceptable nutrition situation as per WHO
classification. The prevalence of severe acute malnutrition (SAM) found was under 1% for Syrian
refugees.
However, due to presence of of some aggravating factors (e.g. harsh winter, high disease burden,
increasing numbers of new arrivals, sub-optimal feeding for some of the households/ children), the
nutrition situation can potentially change rapidly to the worse. There is need for close monitoring and
establish nutrition screening mechanism to identify and appropriately refer any malnourished case
identified for treatment.
The proportion of the “At Risk of Acute Malnutrition” (WHZ_WHO scores between -1 SD and -2 SD)
analyzed was high (6.8%), a confirmation of the need to address the aggravating factors and setting up of
the necessary other mitigating efforts.
Table 23 shows the comparison between the malnutrition rates found in this assessment to the Syrian
rates from the SOWC 2012 and FHS 2009 (table 1). All malnutrition rates found are lower than the
previous rates for Syria. It is difficult to compare these results against the MICs report since there is no
subnational data available and the place of origin within Syria for the refugees was not investigated.
Regarding stunting and underweight, in view of the inaccuracies in registration, there were challenges in
age documentation among children 6-59 months. Due to this limitation and although an event calendar
was used by the teams to ascertain age, stunting and underweight results are to be interpreted with
caution because z-scores for height-for-age (and weight for age) require accurate ages to within two
weeks (CDC/WFP: A manual: Measuring and Interpreting Mortality and Malnutrition, 2005).
By gender, the prevalence of wasting (table 11), the findings show also a variation between boys and girls
in the prevalence of acute malnutrition. However, the difference between boys and girls in the prevalence
of acute malnutrition is not statistically significant (X2: 2.641, P> 0.05).
By group of age, table 12 and figure 5 showed that, among Syrian refugees in Lebanon, the youngest
children (6-11 months) of age groups tend to be the most affected by severe wasting. This situation could
be associated with sub-optimal child care (breastfeeding, type and frequency of complimentary feeding,
etc). For moderate wasting, the rates of MAM among children between 12 and 47 months are higher and
the children of age group (24-35 months) are the most affected.
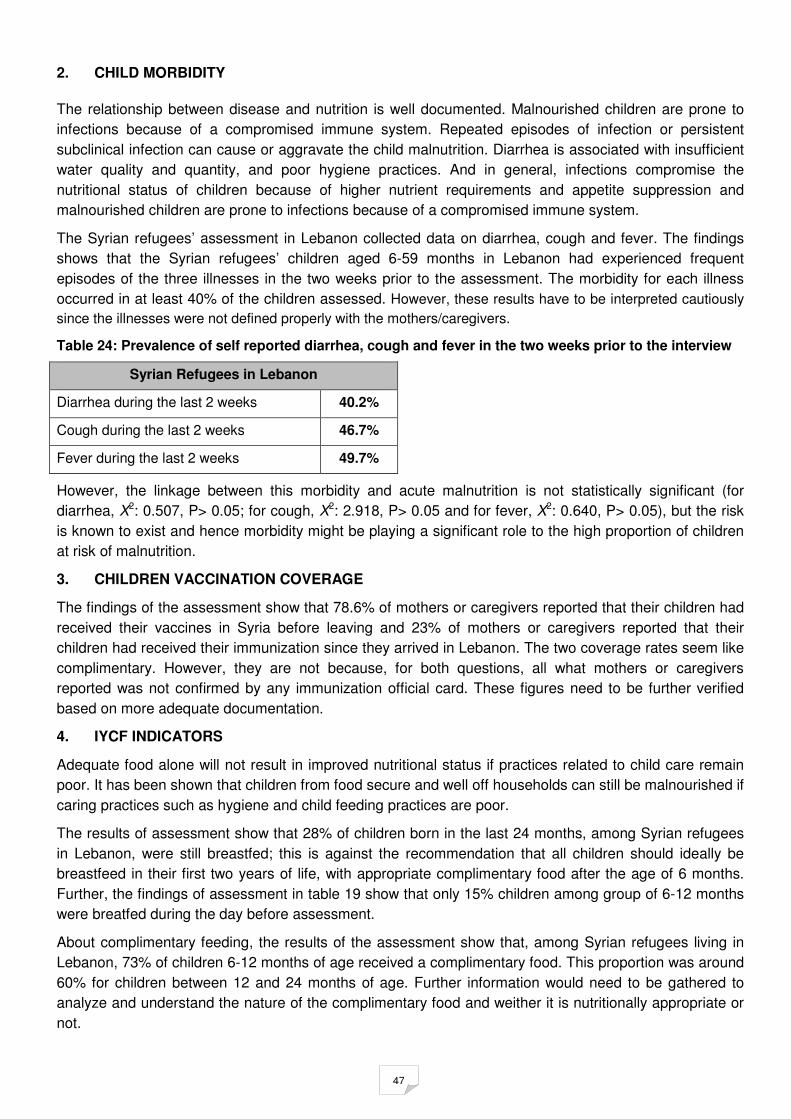
47
2. CHILD MORBIDITY
The relationship between disease and nutrition is well documented. Malnourished children are prone to
infections because of a compromised immune system. Repeated episodes of infection or persistent
subclinical infection can cause or aggravate the child malnutrition. Diarrhea is associated with insufficient
water quality and quantity, and poor hygiene practices. And in general, infections compromise the
nutritional status of children because of higher nutrient requirements and appetite suppression and
malnourished children are prone to infections because of a compromised immune system.
The Syrian refugees’ assessment in Lebanon collected data on diarrhea, cough and fever. The findings
shows that the Syrian refugees’ children aged 6-59 months in Lebanon had experienced frequent
episodes of the three illnesses in the two weeks prior to the assessment. The morbidity for each illness
occurred in at least 40% of the children assessed. However, these results have to be interpreted cautiously
since the illnesses were not defined properly with the mothers/caregivers.
Table 24: Prevalence of self reported diarrhea, cough and fever in the two weeks prior to the interview
Syrian Refugees in Lebanon
Diarrhea during the last 2 weeks 40.2%
Cough during the last 2 weeks 46.7%
Fever during the last 2 weeks 49.7%
However, the linkage between this morbidity and acute malnutrition is not statistically significant (for
diarrhea, X2: 0.507, P> 0.05; for cough, X2: 2.918, P> 0.05 and for fever, X2: 0.640, P> 0.05), but the risk
is known to exist and hence morbidity might be playing a significant role to the high proportion of children
at risk of malnutrition.
3. CHILDREN VACCINATION COVERAGE
The findings of the assessment show that 78.6% of mothers or caregivers reported that their children had
received their vaccines in Syria before leaving and 23% of mothers or caregivers reported that their
children had received their immunization since they arrived in Lebanon. The two coverage rates seem like
complimentary. However, they are not because, for both questions, all what mothers or caregivers
reported was not confirmed by any immunization official card. These figures need to be further verified
based on more adequate documentation.
4. IYCF INDICATORS
Adequate food alone will not result in improved nutritional status if practices related to child care remain
poor. It has been shown that children from food secure and well off households can still be malnourished if
caring practices such as hygiene and child feeding practices are poor.
The results of assessment show that 28% of children born in the last 24 months, among Syrian refugees
in Lebanon, were still breastfed; this is against the recommendation that all children should ideally be
breastfeed in their first two years of life, with appropriate complimentary food after the age of 6 months.
Further, the findings of assessment in table 19 show that only 15% children among group of 6-12 months
were breatfed during the day before assessment.
About complimentary feeding, the results of the assessment show that, among Syrian refugees living in
Lebanon, 73% of children 6-12 months of age received a complimentary food. This proportion was around
60% for children between 12 and 24 months of age. Further information would need to be gathered to
analyze and understand the nature of the complimentary food and weither it is nutritionally appropriate or
not.
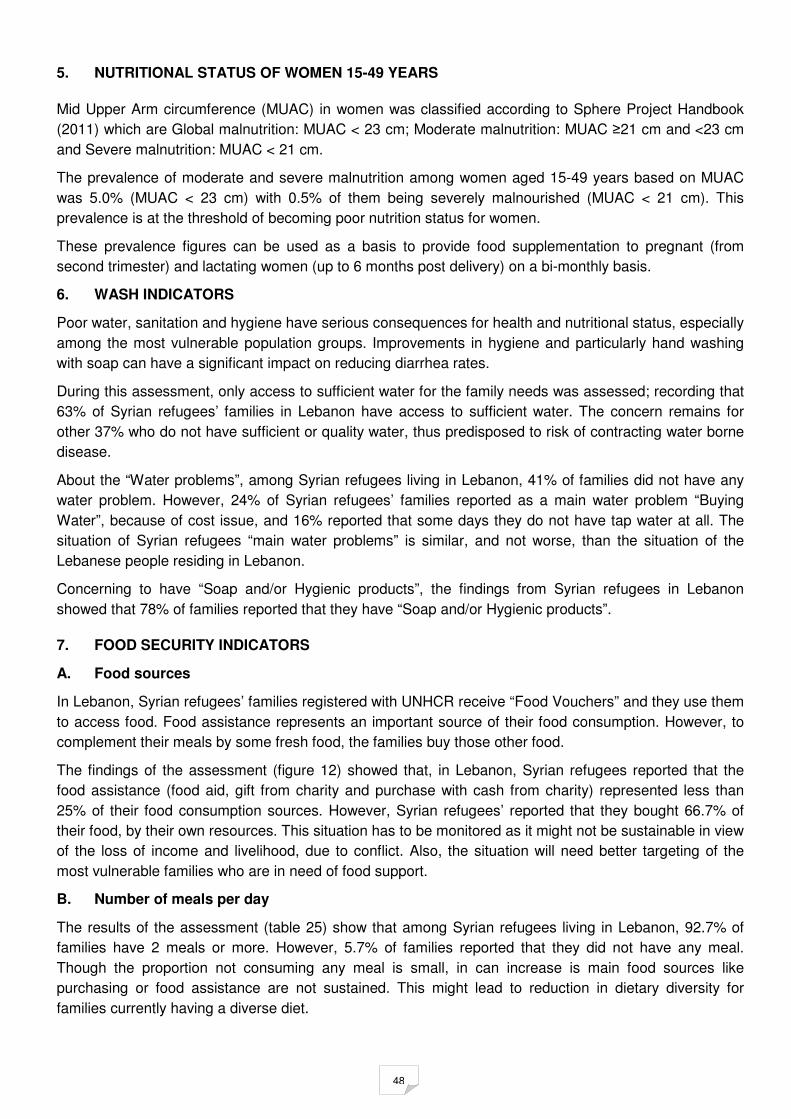
48
5. NUTRITIONAL STATUS OF WOMEN 15-49 YEARS
Mid Upper Arm circumference (MUAC) in women was classified according to Sphere Project Handbook
(2011) which are Global malnutrition: MUAC < 23 cm; Moderate malnutrition: MUAC ≥21 cm and <23 cm
and Severe malnutrition: MUAC < 21 cm.
The prevalence of moderate and severe malnutrition among women aged 15-49 years based on MUAC
was 5.0% (MUAC < 23 cm) with 0.5% of them being severely malnourished (MUAC < 21 cm). This
prevalence is at the threshold of becoming poor nutrition status for women.
These prevalence figures can be used as a basis to provide food supplementation to pregnant (from
second trimester) and lactating women (up to 6 months post delivery) on a bi-monthly basis.
6. WASH INDICATORS
Poor water, sanitation and hygiene have serious consequences for health and nutritional status, especially
among the most vulnerable population groups. Improvements in hygiene and particularly hand washing
with soap can have a significant impact on reducing diarrhea rates.
During this assessment, only access to sufficient water for the family needs was assessed; recording that
63% of Syrian refugees’ families in Lebanon have access to sufficient water. The concern remains for
other 37% who do not have sufficient or quality water, thus predisposed to risk of contracting water borne
disease.
About the “Water problems”, among Syrian refugees living in Lebanon, 41% of families did not have any
water problem. However, 24% of Syrian refugees’ families reported as a main water problem “Buying
Water”, because of cost issue, and 16% reported that some days they do not have tap water at all. The
situation of Syrian refugees “main water problems” is similar, and not worse, than the situation of the
Lebanese people residing in Lebanon.
Concerning to have “Soap and/or Hygienic products”, the findings from Syrian refugees in Lebanon
showed that 78% of families reported that they have “Soap and/or Hygienic products”.
7. FOOD SECURITY INDICATORS
A. Food sources
In Lebanon, Syrian refugees’ families registered with UNHCR receive “Food Vouchers” and they use them
to access food. Food assistance represents an important source of their food consumption. However, to
complement their meals by some fresh food, the families buy those other food.
The findings of the assessment (figure 12) showed that, in Lebanon, Syrian refugees reported that the
food assistance (food aid, gift from charity and purchase with cash from charity) represented less than
25% of their food consumption sources. However, Syrian refugees’ reported that they bought 66.7% of
their food, by their own resources. This situation has to be monitored as it might not be sustainable in view
of the loss of income and livelihood, due to conflict. Also, the situation will need better targeting of the
most vulnerable families who are in need of food support.
B. Number of meals per day
The results of the assessment (table 25) show that among Syrian refugees living in Lebanon, 92.7% of
families have 2 meals or more. However, 5.7% of families reported that they did not have any meal.
Though the proportion not consuming any meal is small, in can increase is main food sources like
purchasing or food assistance are not sustained. This might lead to reduction in dietary diversity for
families currently having a diverse diet.

49
Table 25: Number of meals per day
Syrian refugees in Lebanon
No meals 5.7%
One meal/day 1.6%
Two meals/day 18.5%
Three meals or more/day 74.2%
C. Consumption of canned food
Among Syrian refugees’ families in Lebanon, 52.7% consume canned food. Moreover, more than 50% of
Syrian refugees’ families consume canned food 2 or 3 days per week and 13% of families consume
canned food almost every day.
Table 26: Canned Food Consumption
Syrian refugees in Lebanon
Canned Food Consumption 52.7%
One day a week 23.8%
2-3 days/week 51.7%
4-5 days/week 11.7%
6-7 days/week 12.9%
D. Food Consumption score
Household food consumption and food sources provide important measures of food security. Food
Consumption Score (FCS) was calculated for each household. In the FCS calculation food groups are
weighted according to their nutritional density. Based on empirical evidence in different regions, WFP has
defined cut-off points for the calculated food consumption score that allow for differentiation of households
into “poor”, “borderline” and “acceptable” food consumption categories. For Syrian Households with food
consumption score less than 21 are regarded to have “poor” food consumption, and this reflects the fact
that they do not eat a balanced diet on a daily basis. Households with a food consumption score between
21 and 35 are considered to have “borderline” food consumption. Households with a food consumption
score greater than 35 are considered to have “acceptable” food consumption.
In 2010, a Syrian EFSNA showed that FCS was poor (4%), borderline (23%) and acceptable (72%). To
compare the findings of the assessment, the FCS are similar with 68.1% of the households recorded as
food secure. Among Syrian Refugees in Lebanon, the proportion of “poor” category, indicating that the
situation is little bit better. However, for the “borderline” category, the situation of Syrian refugees’ families
is worst. However, this comparison can be taken cautiously because of the 2010 EFSNA was done during
drought and it was conducted in Northern part of Syria only.
Findings from table 27 show that among Syrian refugees in Lebanon, 32% (Poor and Borderline) of
families were in none Food Secure situation.
Table 27: Food Consumption Score
Food Consumption Score Syrian refugees in Lebanon Syria in 2010
Poor food consumption (≤ 21) % 3.8 4
Borderline food consumption (21.5- 35) % 28.1 23
Acceptable food consumption ( > 35) % 68.1 72

50
E. Food stocks
The findings of the assessment show that 73% of Syrian refugees‘families in Lebanon have not have
enough food or money to buy food. However, 42.2% of Syrian refugees’ families in Lebanon have some
food stocks and the longest duration of food stock was observed for wheat and rice. Almost 40% of Syrian
refugees’ families in Lebanon reported that they have wheat and rice food stocks for Fifteen to thirty days.
However, 20% or more families reported that they have wheat, Rice, bean and potato for more than one
month of duration of food stocks.
F. Coping strategies
The households adopt a wide range of coping strategies in efforts to cover their food gaps when faced
with acute food decline.
In Lebanon, Syrian refugees’ families, as coping strategies, have a high rate of daily use of sending
children to eat with relative family. However, the findings (figure 17-1) show that, as coping strategies
used 5 or more days a week, Syrian refugees’ families in Lebanon have “Reducing the size of portions”,
“Eating less meals” or “Not eating”.
About the conditions of the Syrian refugees’ families in Lebanon, the findings of the assessment
demonstrate that 61.6% of them have had a member leave them in search of work so that their family may
survive; 36% have sold their personal assets and 19.3% of the families have school children involved in
the income. Moreover, most families (80.2%) of Syrian refugees in Lebanon have taken it upon
themselves to decrease their health expenditures.
During the days that they did not have enough food or did not have money to buy food, the Syrian
refugees’families in Lebanon adopted some coping strategies: 24.8% of them purchased food on credit,
21.5% relied on a more affordable nature of foods, 19.9% adopted a limited portion size during meal
times, 18.0% reduced the number of meals per day, 12.7% of the adults within families harnessed the
strategy of food restriction so that small children can eat, 10.7% would eat at the residencies of friends or
family members. In the extreme cases, to be able to adequately survive, some families (4.3%) would
spend the whole day without eating and some others (8.2%) would send their family members elsewhere to
eat.

51
CONCLUSION
Nutrition situation of Syrian refugees’ families in Lebanon is within acceptable levels with the prevalence
of GAM of less than 5% among children while among women aged 15-49 years the malnutrition rate is
5%. However, because of some aggravating factors (winter, high disease burden, risk for food insecurity,
increasing of numbers and the new arrivals could be in worse conditions), nutrition situation can change
quickly and is potentially likely to deteriorate. Concerted integrated efforts, in collaboration with MOPH and
MOSA, will be required to monitor the nutrition situation because of the multifactorial nature of malnutrition
Immediate measures must be taken to set up or to reinforce the monitoring of the nutrition situation
because of high level of risk of malnutrition and among new arrivals or families are waiting for UNHCR
registrations, and address the aggravating factors associated with the above risk levels of malnutrition.
This should include screening and treatment of acute malnutrition in various age-groups, supplementary
feeding programme for pregnant and lactating women, addressing the inappropriate infant and young
children feeding practices and micronutrient deficiencies.

52
RECOMMENDATIONS AND PRIORITIES
Immediate term
1. Having a discussion with MOPH, MOSA and all other partners to set up mechanism for acute
malnutrition management and the nutrition surveillance including screening for malnutrition of
refugees at border crossing points and appropriate referral for treatment for the malnourished cases
(children and pregnant and lactating women.
2. Formation and reinforcement of the role and responsibility of the Health and nutrition working group,
taking on the organization and coordination the nutrition sector and response.
3. Developing guidelines or protocol for acute malnutrition management and prevention as well as national
training plan.
4. Strengthen the awareness, promotion and protection of positive infant and young child feeding practices
through NGOs activities by accelerating sensitization and awareness creation on appropriate breast-
feeding and complimentary feeding practices as well as uncontrolled use of breastmilk substitute and
micronutrient supplementation.
5. Improving education and communication strategies in the health centers and community level including
integrating communication for development strategies to positively influence behavior and practices.
6. Scale-up of hygiene promotion activities and improve access to quality water and monitoring the
quality of water as well as treatment of diseases in the health facilities.
7. Facilitate the availability of adequate micronutrient supplements for children, women of child bearing
age, pregnant and lactating women according to national/global protocols.
Medium term
1. Integrating the nutrition surveillance system in existing Health Surveillance System.
2. Putting a proper targeting the refugees and host communities with a minimum response package on
health and nutrition including surveillance, disease treatment, appropriate health and nutrition
promotion, adequate food security, livelihood support, water and sanitation services, shelter, etc.
Longer term
1. If the situation in Syria will not have improved to enable safe return of the refugees, conduct
nutrition assessment in six months’ time, (depending on the delivery of adequate response in the
next 6 months). Assessment methodology should be simplified to capture only key indicators of
anthropometry in children aged 6-59 months and mortality in the whole population as recommended
by the SMART methodology. A full expanded nutrition assessment should be repeated in 12
months.
2. Conduct a comprehensive nutrition assessment after one year, if adequate humanitarian assistance
will have been provided, with a parallel and independent food security assessment. The nutrition
assessment should cater for coverage of response delivered and mortality.

53
ANNEX
Annex 1: Sample for Syrian refugees in Lebanon
Annex 2: Arabic Questionnaire for Syrian refugees in Lebanon
Annex 3: Questionnaire in English, for Syrian refugees in Lebanon, before Arabic translation and last
revision
Annex 4: Results using the NCHS 1977 Growth Reference for Syrian refugees in Lebanon
Annex 5: Assessment teams’ members for Syrian refugees in Lebanon
Annex 6: Consent form for Syrian refugees in Lebanon
Annex 7: SMART Plausibility Report for Syrian refugees in Lebanon
54
ANNEX 1: SAMPLE FOR SYRIAN REFUGEES IN LEBANON
SYRIAN REFUGEES NUTRITION ASSESSMENT IN LEBANON
FIRST STAGE SAMPLING
Geographical unit Population size Assigned cluster
MOUNTLEBANON-Keserwane and Jbeil 96 1
NORTH-Zgharta, Qoubbe 903 2 and 3
NORTH-Tripoli-Abou Samra 855 4
NORTH-Tripoli-Mina Jardin 652 5
NORTH-Tripoli-Wadi Nahle 246 6
NORTH-Tripoli-Maloule and Trablous Jardins 171 7
NORTH-El Minieh-Dennie, El Baddaoui 595 8
NORTH-El Minieh-Dennie, El Minie 485 9
NORTH-Akkar, Amayer 796 10
NORTH-Akkar, Maccha 442 11
NORTH-Akkar, Bire 380 12
NORTH-Akkar, Khirbel Daoud 322 13
NORTH-Akkar, Knaisse 301 RC
NORTH-Akkar, Aaklar El Attiqa 202 14
NORTH-Akkar, Bebnine and Oueishat 225 15
NORTH-Akkar, Takrit and Borj 204 16
NORTH-Akkar, Wadi Khaled 189 RC
NORTH-Akkar, Rama 727 17
NORTH-Akkar, Majdel Akkar and Kharayeb AlHayat 210 18
NORTH-Akkar, Bqayaa 483 19
NORTH-Akkar, Tall Aabbas El Gharbi 231 20
NORTH-Akkar, Mouanse and Amaret el Baykat 181 21
NORTH-Akkar, Kafartoun and Tlaile 261 22
NORTH-Akkar, Aabboudiye, Sahle and Kawashra 216 23
NORTH-Akkar, Hissa, Qochloq, Dibbabiye, Haouchah, Baaliye and Kroum el Arab 173 RC
BEKAA-Zahle, Qabb Elias 1010 24
BEKAA-Zahle, Saadnayel 1315 25 and 26
BEKAA-Zahle, Bar Elias 1251 27 and 28 BEKAA-Zahle, Terbol 730 29
BEKAA-Zahle, Majdel Anjar 673 30
BEKAA-Zahle, Taalabaya 352 31
BEKAA-Zahle, Al Faour 279 32
BEKAA-Zahle, Rayak, Haouch el Oumara Aradi and Bouarej 184 33
BEKAA-West Bekka, Joub Jannine 357 34
BEKAA-West Bekka, Loussia and Khirbet Qanfar 189 35
BEKAA-West Bekka, Khirbet Rouha 206 36
BEKAA-Baalbek, Aarsal 2307 37 and 2 RC
BEKAA-Baalbek, Baalbek 1692 38, 39 and 40
BEKAA-Baalbek, Fakehe 481 41
BEKAA-Baalbek, Laboue 143 42
(RC = Reserve Clusters, approx. 10% of the original clusters, all of the reserve clusters should be surveyed when it was not possible to collect some of the other clusters.)

ANNEX 2: ARABIC QUESTIONNAIRE FOR SYRIAN REFUGEES IN LEBANON
� ا�ر�� �� ����ا ����ن ا����� ا��� ا��ا�� �� �ل 2012�"
�ا��)ل و ا&%���ر ا$#�ا�� )��ان ا* +�-,�ل *:
��ان ا0 �ة •* +� ا1,2 *
ا8�ح ا56ف �3 ا& ����ن •
• ����$��(;ّ�� آ1 ا��$ )ا0 �ة = آ1 ا
:ا�-�� و ;�اءة ا-��ق
ل ��ب آ� ا�ا��� ��� ا���ر � د �� �� ا��� � اءة ه%ا ا$�ن ب ا�� ة ، او !م، و �( ���)*�+, ة )$- ا$�ء �. )/�,0� 12 ف ا�� ة �ّ/
�< ا+ ار ا=�� . ا>;� 92: 9��� ا8س ا%�� ��5�6ن ف رب ا�� ة �C2 ا9 د ا+�B �5@ون ا�� ة و ��� A@و12 و ه� ?ّ/.
�، ا�,$� � �ى �E8,( ا2>�2(و ا/,- _______________________ ���5رآ( �� ا��$�ن �را�( ا�HI �2/� أ� �2د أن *8$,* �;J �� ��ر�K���� *>�ر��� ا+د��� LMو ا �Bا%Nا.
• )�2ت ا2><�@� � .ا�ا/� 1%ا ا�+��� ه
• P� ص� ه%ا ا�+��� ه� ��ر �� Pاآ �Aرآ(. ار ا,5رآ( أو /�م ا,5�RJ ان P2;�� . �� S(��ا P2;�5رآ(، �$,اذا اRJ%ت ) ار �/�ات. أي EL( �ي �$< آن<� �� V+*�J � ا�6�- �H ا� PJ أو �,� �NJ ي� >$<�� � P%� S(��رت ا .اذا )
• �� 9ل ا=آ$W! ل�Xزن و ا�%راع ، اا [�L� س\� PJ و �8+�م �+��6*[ �J أ��ر �/ P>@ا�رآ(، �\)�م 5, 6اذا اRJ%ت ) ارا � �� N?=�1ر و اA5 ا. ��8ات �� 82 2+�م �+�س ��L] ا%راع *8>ء و ا��9ت ا�آ$� P` ذا )�I15 �� N?=م و ام 49//.
5رآ( •,ك �I6*� /� رJ أن P8� >*X8� ،ت� �( ا��(. )$- أن 2$�أ �\ي �� ا��)*e أو أ�% أي �(<� `EL�� 8 .أي �6*��( ���� ه
• R� ر8� /� اي ا��9>\<J أن P2;��5رآ( أو /��1, ارا �( %R�J ن )$- أن .f ه%ا ا=��$�
ا;A
|___| �J-0 �62-1 ا/�ن ا,�ا�+( =
_________________________ رب ا�� ةا��
ا����ف� � ��� _________________________)ا������(
:ا=��$�ن ر)�

� ا�ر�� �� ����ا ����ن ا����� ا��� ا��ا�� �� �ل"� 2012
)ا& ����ن 1B أ �ة 1(%,��? ا0 �ة
)*�ر�i ا,+J)م��ا / )ا>8(/ا15 ر)� ا86+�د
|___|___|/|___|___|/|___|___| |___|___|
]� ر)� ا�� ة ر)� ا9
|___| |___|___|
�E( ا�� ا86+�د L,ا
No الD ر3) ا&�E�F ا
Q1-7 ة� %,��? ا0
Q1. ة� |___| اF = +JKذآ� = M: رب ا0
Q2a. آ� *5دآ� )��em�>�ر���ا اة ) � _______________________________________________________ �� MNK ا0
Q2b. ث(*5د ا0و&د�K18دون )ذآ�ر و ا � ____________ �3�Q�2��) 68� 59-0(*5د ا�NR0ل دون � ا:_________________________
Q3a. ة� |___| �68ر او أآJ� 6= 3 �68ر 6إ+ �31 = 2 68� أو أ;1= 1 �� ه�ا ا(�B؟) ا�UFV(53ة ا;��3 ا0
Q3b. �)��3 ة� �5 أ* �B\ 11 &=0 ه =�$K |___|
Q3c. ب �E�F&ا ]Kال " &"آ�D |___| �UF& 0=& 1 =�$K ا%�ى ب ، ه1 أK[ ����3 �3 أ �ة �ر��3*� ا
Q3d. ب �E�F&ا ]Kآ�"�$K " الD _____________________________ )c�� �)E أ �\b(ب ،ج ،آ� *5د ا0 � ا(��(� �� MNK ا(�B 3*� ا
Q4. ��-, ا(�*5ة ا
Q4a. ��35 \-��ج %�35ت ���R، �3 ه� ا�6d : أ *
g ا�ر;مإ%��ر( ��6 ؟ا�� \��F ا��) ا
)�E�Fا&
& اh-E *� 3�*5ة = 1 \5اوي ذا\�= 2 j k��3-� *�م= 3
4 =��-Eر ��m � D3 دة��*
5 =�j�% دة��*
6 =��5�j
�أ��ف =9
|___|
Q4b.
�� " & اh-E *� 3�*5ة"اذا آ�K[ ا&�E�F ب اN�ع أ، ��(�ذا؟
1 = �N�B ار\�Nع ا
2 =��� دوا*� ا3
3=*�E�F&ا �� ��m� 5م ا
_____________أ%�ى، 52د= 4|___|
Q5 – 7: �3�$����o ا ا(��p و %�35ت ا,�ف ا,-� و ا
Q5. :& ؟p��) |___| K=1$� 0=ه1 5ى ا0 �ة ا��K�B3 ا��jل ا+ آ(��ت ا(��p اVزm0 �3�اض ا#�ب و ا�6q و ا��1 و دورات ا
Q6. ��B#)#�آ1 ا����� ا(/ �3 ه� ا cFا�\ ��(��p و ا�E ���$�)ا
ا�E�F وا52ة أو *5ة (ا0 �ة ؟ )ا�E�Fت
1=5F�� &
�8\رى=2
3= ��,Q#����o ا*5م آ���N ا(��ة m0�اض ا��NRل
4=����6K ��N�- u$E ا��0م \(� دون \��� p��3 ا
5 = �oه�E �U�$)ا(��p ا�ا ���NR0ل �qv�ون �)Jا
#�ب ��3��N�- p ا
_________أ%�ى=6
|___||___||___||___|
Q7. ن؟�E�,�w�o و ا� |___| K=1$� 0=& ه1 \(��b ا0 �ة ا��K�B3 ا��jل ا+ �3اد ا
ا����ف � � ��� _________________________)ا������(
:ا=��$�ن ر)�

� ا�ر�� �� ����ا ����ن ا����� ا��� ا��ا�� �� ل�� 2012
�ى ا����ل �� �� ا���ة ����� -ا#" ا! ا�� و ا)ا& ����ن 1B أ �ة 1(
)*�ر�i ا,+J)م��ا / )ا>8(/ا15 � ا=��$�ن �+]( ر)� ا86+�د �( ]� ر)� ا86+�د ر)� ا9
|___|___|/|___|___|/|___|___| |___|___| |___| |___|___|
�E( ا�� ا86+�دL,ا
Q8 - 20 : ���ى ا����ل �� � ����� '&� �� ا���ة 59-0ا#" ا! ا�� و ا
�6ا
��
ا& � ا0ول
)ا%���ري(
ر;�
ا0 �ة
�\
ا*Vن
ا(�ا���
�=0
)*+=1
Q8
M�F
1Nq ا
M=ذآ
`K2أ=F
Q9
xر��\
(�Vد ا
)5Fان و(
/68�/��م
��
Q10
�)*
1Nq ا
)ا&68�(
Q11
ه. -,���
�ر#�ع 0
344,�²
؟��6�*�
�=0
)*+=1
Q12
g��2 +�E&���� ا
b�NR ��q$\ 1ه �*���ا
�mاء "%�
&�8ء= 0
2���E gدرة= 1
2 =p��3
�8ي=3
R$�م ا�NRل=4
�mاء %�ص = 5
�mاء ا0 �ة 3-�را = 6
1Nq�
اq$�م �3 ����ول = 7
ا0 �ة
ا�E�F وا52ة أو *5ة (
)ا�E�Fت
Q13
8924ل ال ;�#�����; ا <�، آ( ��ة = 34�� ;@ !A0
) ��C 0! اء ;��#�ا;�*�6E )ا
��G ��ة= 0
��ة وا�Hة= 1
2 =��-��
8Lث ��ات= 3
أر0" ��ات= 4
5 = M�9�Nات أو أآ��
Q14 ه. -( -=��
.�Eا�0���A�� أ
;AO89ل اأ'&�
��#�; ؟ ا
ا��ض (;��* )ا
�=0
)*+=1
9=�أ��ف
Q15
ه. -( )�*E- .�Eا QOR0=ا+�� )�*EAا
�4ز+��; اOر@; ;��� ؟ا
�=0
)*+=1
9=�أ��ف
Q16
ه1 1,2
+�* 1Nqا
��*�q3 أي
��dء 3�� ا
+��� ا��.
0=&
1=�$K
) ]Kاذا آ�
�$�E �E�F&ا
�-5د
)ا(q$�م
Q17
ا=�1ل � ا,�6ي �ا=�$�/�� ���I ا,
==0
�62=1
Q18
اذا
o2آ )�m=ا �68�
*>@ال 17 آ� /�د ا=�م �ا� ا��,
ت �1(؟Lا
Q19
ه-
ا?�< 1ب �=�ا �Bي
) ا>6ل( ��
ا=�$�/�ن
���I ا,
==0
�62=1
Q20
ه-
ا?�< `,L�
��ا=�$� ��/Iا,���
==0
�62=1
1. 0 1 M F |___|___|___|___|
2. 0 1 M F |___|___|___|___|
3. 0 1 M F |___|___|___|___|
4. 0 1 M F |___|___|___|___|
:ا=��$�ن ر)�

Q8 - 20 : ���ى ا����ل �� � ����� '&� �� ا���ة 59-0ا#" ا! ا�� و ا
�6ا
��
ا& � ا0ول
)ا%���ري(
ر;�
ا0 �ة
�\
ا*Vن
ا(�ا���
�=0
)*+=1
Q8
M�F
1Nq ا
M=ذآ
`K2أ=F
Q9
xر��\
(�Vد ا
)5Fان و(
/68�/��م
��
Q10
�)*
1Nq ا
)ا&68�(
Q11
ه. -,���
�ر#�ع 0
344,�²
؟��6�*�
�=0
)*+=1
Q12
g��2 +�E&���� ا
b�NR ��q$\ 1ه �*���ا
�mاء "%�
&�8ء= 0
2���E gدرة= 1
2 =p��3
�8ي=3
R$�م ا�NRل=4
�mاء %�ص = 5
�mاء ا0 �ة 3-�را = 6
1Nq�
اq$�م �3 ����ول = 7
ا0 �ة
ا�E�F وا52ة أو *5ة (
)ا�E�Fت
Q13
8924ل ال ;�#�����; ا <�، آ( ��ة = 34�� ;@ !A0
) ��C 0! اء ;��#�ا;�*�6E )ا
��G ��ة= 0
��ة وا�Hة= 1
2 =��-��
8Lث ��ات= 3
أر0" ��ات= 4
5 = M�9�Nات أو أآ��
Q14 ه. -( -=��
.�Eا�0���A�� أ
;AO89ل اأ'&�
��#�; ؟ ا
ا��ض (;��* )ا
�=0
)*+=1
9=�أ��ف
Q15
ه. -( )�*E- .�Eا QOR0=ا+�� )�*EAا
�4ز+��; اOر@; ;��� ؟ا
�=0
)*+=1
9=�أ��ف
Q16
ه1 1,2
+�* 1Nqا
��*�q3 أي
��dء 3�� ا
+��� ا��.
0=&
1=�$K
) ]Kاذا آ�
�$�E �E�F&ا
�-5د
)ا(q$�م
Q17
ا=�1ل � ا,�6ي �ا=�$�/�� ���I ا,
==0
�62=1
Q18
اذا
o2آ )�m=ا �68�
*>@ال 17 آ� /�د ا=�م �ا� ا��,
ت �1(؟Lا
Q19
ه-
ا?�< 1ب �=�ا �Bي
) ا>6ل( ��
ا=�$�/�ن
���I ا,
==0
�62=1
Q20
ه-
ا?�< `,L�
��ا=�$� ��/Iا,���
==0
�62=1
5. 0 1 M F |___|___|___|___|
)�$3 k�{�\ ����� ��$(� /5اذا �K�K�; : >@الا �/ )�m=� �+J =9 ت *�+��$� )�10@ال (و ا���Rم رز2�( ا,8
6. 0 1 M F
|___|___|___|___|
7. 0 1 M F
|___|___|___|___|
8. 0 1 M F
|___|___|___|___|
9. 0 1 M F
|___|___|___|___|
10. 0 1 M F
|___|___|___|___|
11. 0 1 M F
|___|___|___|___|
12. 0 1 M F
|___|___|___|___|
13. 0 1 M F
|___|___|___|___|
k�{�\ ����� ��$(� /3$�(5 اذا �K�K�; : >@الا �/ )�m=� �+J =9 ت *�+��$� )�10@ال (و ا���Rم رز2�( ا,8
ا����ف � � ��� _________________________)ا������(

� ا�ر�� ������ ا ����ن ا����� ا��� ا��ا�� �� ل�� 2012
'&� 59ا,����ت ا�6+�; و ا��8Aل ��� ا����ل �� )ا& ����ن 1B أ �ة 1(
) ���)$�+ ر*��� ا�NR0ل ا��� �$�#�ن 3$�6 �� ا�N�ة ا* ��)����� ا+ F(�� اU )'&� c�F�\ ���0-59 ا0
)*�ر�i ا,+J)م��ا / )ا>8(/ا15 ن �+]�� ا=�( ر)� ا86+�د �$�( ]� ر)� ا86+�د ر)� ا9
|___|___|/|___|___|/|___|___| |___|___| |___| |___|___|
�E( ا�� ا86+�دL,ا
Q21-30 :$��2( و ا=/��لت ا��5 ا�NR0ل �3 ا+�*68� 0-59
Id.
ا& � ا0ول
(ا���ري)
ر;� ا0 �ة
�J ا/�ن ا,�ا�+(
==0
�62=1
Q21
ا80:
M=ذآ
`K2أ=F
Q22
ر�i ا,��د J)�mان و(
1 /��مA/)8�
Q23
ا6,
1A��
Q24
ا�زن )�Nآ(
± 0.1 kg
Q25
)��(ا�Xل
± 0.1 cm
Q26
�Jرم ا>ق
N = =
Y = �62
Q27
|�-3 w,��)ا��راع��ي $ ا
)� (
± 0.1 cm
Q28
�;�ر-زي
�Wل/وزن
0=rأ�
1= أ?9
2=\ ,�ا
Q29
( ا` �uا �J �>��?S؟
0 ==
�W1ل/وزن= 1
�W2ل/وزن=2
�Jرم=3
Q30
س �( �J -ه -(ا�زن �آ,�( �� ا,��:
==0
�62=1
1. 1 0 M F N Y 0 1 2 3 0 1
2. 1 0 M F N Y 0 1 2 3 0 1
3. 1 0 M F N Y 0 1 2 3 0 1
4. 1 0 M F N Y 0 1 2 3 0 1
5. 1 0 M F N Y 0 1 2 3 0 1
6. 1 0 M F N Y 0 1 2 3 0 1
:ا=��$�ن ر)�

Q21-30 :$��2( و ا=/��لت ا��5 ا�NR0ل �3 ا+�*68� 0-59
Id.
ا& � ا0ول
(ا���ري)
ر;� ا0 �ة
�J ا/�ن ا,�ا�+(
==0
�62=1
Q21
ا80:
M=ذآ
`K2أ=F
Q22
ر�i ا,��د J)�mان و(
1 /��مA/)8�
Q23
ا6,
1A��
Q24
ا�زن )�Nآ(
± 0.1 kg
Q25
)��(ا�Xل
± 0.1 cm
Q26
�Jرم ا>ق
N = =
Y = �62
Q27
|�-3 w,��)ا��راع��ي $ ا
)� (
± 0.1 cm
Q28
�;�ر-زي
�Wل/وزن
0=rأ�
1= أ?9
2=\ ,�ا
Q29
( ا` �uا �J �>��?S؟
0 ==
�W1ل/وزن= 1
�W2ل/وزن=2
�Jرم=3
Q30
س �( �J -ه -(ا�زن �آ,�( �� ا,��:
==0
�62=1
7. 1 0 M F N Y 0 1 2 3 0 1
8. 1 0 M F N Y 0 1 2 3 0 1
9. 1 0 M F N Y 0 1 2 3 0 1
10. 1 0 M F N Y 0 1 2 3 0 1
11. 1 0 M F N Y 0 1 2 3 0 1
12. 1 0 M F N Y 0 1 2 3 0 1
13. 1 0 M F N Y 0 1 2 3 0 1
14. 1 0 M F N Y 0 1 2 3 0 1
15. 1 0 M F N Y 0 1 2 3 0 1
16. 1 0 M F N Y 0 1 2 3 0 1
17. 1 0 M F N Y 0 1 2 3 0 1
18. 1 0 M F N Y 0 1 2 3 0 1
19. 1 0 M F N Y 0 1 2 3 0 1
20. 1 0 M F N Y 0 1 2 3 0 1
ا����ف � � ��� _________________________)ا������(

� ا�ر�� �� ����ا ����ن ا����� ا��� ا��ا�� �� ل�� 2012
;�+�64��Oء �� �� ا�+�Wب ) م م ع ذ(ا,����ت ا)15- 49 ;��� ا���ة) � )ا& ����ن 1B أ �ة 1(
�� ا(U �� �� ا0 �ة ا(��Qرة 49و 15+ F(�� ا�5ات ا�ا;$� أ*(�ره� c�F�\ ��� ��E �3 ا0 (
)*�ر�i ا,+J)م��ا / )ا>8(/ا15 � ا=��$�ن �+]( ر)� ا86+�د �( ]� ر)� ا86+�د ر)� ا9
|___|___|/|___|___|/|___|___| |___|___| |___| |___|___|
�E( ا�� ا86+�دL,ا
Q31 - 35 : ;�+�64��Oء �� �� ا�+�Wب ) MUAC(ا,����ت ا)15- 49 ;� �� ا���ة) �
ID
ا��� )ا���ري(
ر)� ا�� ة
�J ا/�ن ا,�ا�+(
�=0
���=1
Q31
��� ا�
)#"�! �ات (
Q32
ا��"�$ ا�&!����%�$
1 = "'
2= �)� ) � 6*& ا� ).-�ر
�� .3ء �" ذآ= 3
أ/*� ==9
Q33
84446د %�4446"ت ا���� �444س ا��3444 >� ا;:ه"
�ة= 0 �&>
�ة وا'8ة= 1
2 =��<�
ABث �ات= 3
= أ/*�=9
Q34
ت ا���L و $� ��8و�� �J -ه ا�9=ت
0==
1=�62
= أ/*�=9
Q35
)MUAC(
CD� ا�� E��
ا���Gي �G:راع
)��(
1. 0 1 1 2 3 9 0 1 2 3 9 0 1 9
2. 0 1 1 2 3 9 0 1 2 3 9 0 1 9
3. 0 1 1 2 3 9 0 1 2 3 9 0 1 9
4. 0 1 1 2 3 9 0 1 2 3 9 0 1 9
ا����ف � � ��� _________________________)ا������(
:ا=��$�ن ر)�

� ا�ر�� �� ����ا ����ن ا����� ا��� ا��ا�� �� 2012 "��ل
�ة –ا�30 ا��ا�� � ��3���� *� ا��Qرات و ا$�دات ا��ا��� اU ا0
)ا& ����ن 1B أ �ة 1(
�� ا+ ا(Dول ا���� *� ا*5اد ا���Fت��� \�c�F ه�( U )p ا0
)*�ر�i ا,+J)م��ا / )ا>8(/ا15 � ا=��$�ن �+]( ر)� ا86+�د �( ]� ر)� ا86+�د ر)� ا9
|___|___|/|___|___|/|___|___| |___|___| |___| |___|___|
�E( ا�� ا86+�دL,ا
�( �( ا>@ال اm=ا wر�
Q36 - 37: ت$m�ة و /�د ا در �%اء ا��M�
Q36. ؟;,E��Wء ا���ة اX ا �� �O��� )ا�E�F وا52ة أو *5ة ا�E�Fت( ��ه ��Yر ا! اء ا
اOAق �� ��Yدر ا�9. ا]�ص=1
2= �� ;�0����Oات �� ;+�*A���0 قOAا
;@��[ اW&�ت ا
3 = �@� ا�=�Aاض/ ا^�اء �0
W&�ت ا]��@;ه�@; �� ا= 4
5=����`� �A'��0اك �" ا
6= ;�+�O+; ا���ا !����Oات ا ا
7=.� C اء �,�0. �
)�,�0. 0`��" أ�9ى(�,�@`; =8
��ول اE*�م =99- )A@ )��#�; 89ل ا�@�م ا6O*; ا
|___|___||___|___||___|___|
Q37. ���H ;b4&AO� _______________________________________________ ا�م؟/ �� ه ��د ا�6cت ا
Q38 - 39 : S�;�ا -B و�
Q38a. ، ;�#����رت �d0وف ( هل �� ا�@�م ا6O*; ا ���b��ل ا-A�� ��&� آ���ت ا! اء ا8ز�; او ا
^�اء ا! اء * 3A4�ا
&=0 �$K=1
)�m=ا o2�( ا>@ال �اذا آmy� �+J ��38b |___|
Q38b. ا�@�م �� �-^�اء ا! اء ، ا ���b��ل ا� �ا( -A�� ��&� آ���ت ا! اء ا8ز�; او ا*�A(Read all the answer choice: one by one) آ( ��ة
إX عا��6��
عا��9�$� /�د ا��م
$ و أ� ���ا؟� ��K $�Lا:K ا< "ف MG6 ا���6"د |___|
!"86ات � ا�<8�"ء أو ا��"رب ؟ا� MG6 اء أو ا���6"د:Oرة ا�"�� |___|
$PG-�!ت ا��"��Pا� �G�< ت" |___| ؟6 8 > "ول ا��%
ا�TUاد اUآ� � " �����T ا��R� SD*&"ل � � $PG-�!ت ا��"��P8 ا�V8�<؟ |___|
|___| ؟ا��ا'8 ا���ما��!�-�G�< 3T $PG 86د ا��%"ت
�"م Xدون > "ول ا� $G �ور أV"م آ" |___|
|___| ا����اض ���اء ا�O:اء؟
|___| #� "ول ا�O:اء �8ى اU�"رب او ا�[��ان ) و أآ\�أ'8 أ/(ا(�Xار ا�Tاد ا��Uة
:ا=��$�ن ر)�

�( �( ا>@ال اm=ا wر�
P"ن _;�� "ول ا�O:اء �) و أآ\�أ'8 أ/(ا�Tاد ا��Uة ر�"لا 3T |___|
�"م �Vم �ورXدون > "ول ا� |___| آ"
Q39. ءW4� ذآ�ه� ه. ��ر-( �d0وف ا#�Eر-( اX ا�A��؟��&� اX ا��ر ا�=1 �=0
���ت A,���b4Aت / 0�" ا�; ، ا��Lث اf (ا�,��Wه�ات، ا&ا-g ا |___| ...)ا
; ا����ل ����ر��; (���4H; ا |___| )�� ا
;�RY��,�ت ا |___| -]��i ا
�!�درة �NR0 �� ��ص ��.ا#�Eار أ�H أ��ا |___| د9./ د ا���ة ا

�( �( ا��e*( اm=ا wر�
Q40 – 43 : اء%N* ة ا���1ك ا��
Q40. )B�+ �FاgK اk��q، & \�%� ا* �*��)�)ل أو �� x�q3 *�م E$�� ا&*���ر و �M �� ا(�q*� ا�j�Q أو ا)6��B �� ا�)5Fا E$�� ��ت ا,���ة%� ا���Fت ا )ا;1 �3 3�$�� �8ي وا52ة(ا&*���ر
����)(5ة آ� ��م %Vل ا�$� ا��م ا���� ا �6آ[ ا �\b ا(�اد ا
�3 ه� أه� 5,3ر �mاء ؟
(�Q ا
�ء= 0A ول اي8J ��� �
��م 1= 1
��م 2= 2
��م 3=3
��م 4= 4
��م 5=5
��م 6= 6
��م 7=7
|___|
1 =�Jج ذا (�� ا��L+/ ا�2
0ر = 2J ر�( و اء �� ا,L*�ت ا�0A ا,9 ق
3 = �V8�"# اض/ ا���اء���ا�
4= �6 #"� K:اء
5= $bV"� �"# #�L"b أ;�ى((
6= � $V8رب أو ا�[��ان أو ه"�Uا
#"��!�ل
7= $��"!� ا��!"86ات ا�O:ا�L$ ا�
9= $��"م : اVU"م ا�!Xول ا�" < ��V ��
ا��"(�$
|___|
})� |___| |___| ، ا&رز، ا�رة ، اB$)�وR(�K-�� أو g2(ا
�;�q |___| |___| ا��Bت، ا��Bت *�� ا
��ة - |___| |___| ا��R�q، ا��R�q ا
��ء، 2(?،*5س، ا��ز�Vء�j�� |___| |___|
|___| |___| اvQ�اوات
cاآ�N |___| |___| ا
�5ق ا(B�ات ، ا�dز، ا� |___| |___|
�-�م |___| |___| )ا-(�اء، ا5وا�F(ا
u�� |___| |___| ا
b) |___| |___| ا
3���dت ا0��ن ) wNd)��g ا-ا)�Eدي، وا��d، وا g��- )ا
|___| |___|
�) |___| |___| ز�[ ��K\� ، ز5Eة،
2����ت ،+E�3 ، 1* ،�B |___| |___|
Q41. ت؟���$) ه1 \���ول R$�م ا
& 0 = �$K=1 |___|
�2ع ا,6*$ت,� �68� )�m=ا o2 اذا آ
|___|______________________آ� � ة �� ا=�$�ع
Q42. ا��؟�m ون(Q3 اي b�5�( �� �� K=1$� 0=& ه1 m=ا o2�( ا>@ال اذا آm� �+J 43
Q43. ون؟(Q) 0(اآ�< /�د ا=�م �3 5�3ار ا(5ة ا�� \��;� ان ���6�q ا���� )اذا آن ا,wRون ��
})� ا��م |___|___| )R-�� أو g2(ا
ا��م |___|___| ارز
��ء، 2(?،*5س، ا��ز�Vء�j�� |___|___| م ا��
��ة - ا��م |___|___| ا��R�q، ا��R�q ا
�) ا��م |___|___| ز�[ ��K\� ، ز5Eة،
�B ا��م |___|___|
ا����ف � � ��� _________________________)ا������(
ANNEX 3: QUESTIONNAIRE IN ENGLISH, FOR SYRIAN REFUGEES IN LEBANON, BEFORE ARABIC TRANSLATION AND LAST REVISION
NUTRITION ASSESSMENT FAMILY QUESTIONNAIRE SYRIAN REFUGEE IN LEBANON – September 2012
Finding the family Address and choosing randomly the Family:
• Find the address of family
• Explain the objective of survey
• Survey all the people in the same address, as one Family.
Greeting and reading of rights: THIS STATEMENT IS TO BE READ TO THE HEAD OF THE FAMILY OR TO THE MOTHER OR, IF THEY ARE ABSENT, ANOTHER ADULT MEMBER OF THE HOUSE BEFORE THE INTERVIEW. ALL PEOPLE LIVING IN THE SAME ADDRESS ARE CONSIDERED AS ONE FAMILY. Hello, my name is ________________________________________________ and I work with Humanitarian Organization in Lebanon. We would like to invite your Family to participate in a survey that is looking at the nutrition and health status of people who came recently from Syria.
• Humanitarian Organisations are sponsoring this nutrition survey.
• Taking part in this survey is totally your choice. You can decide to participate or not to participate. If you participate, you can stop taking part in this survey at any time for any reason. If you stop being in this survey, it will not have any negative effects on how you or your Family is treated or what aid you receive.
• If you agree to participate, I will ask you some questions about your family and we will then measure the arm circumference, the weight and height of children who are older than 6 months and younger than 5 years. In addition to these assessments, we will also measure the arm circumference of women and girls who are older than 15 years and younger than 49 years.
• Before we start to ask you any question or take any measurement, we will ask you to state your consent. Any information that you will provide will be kept strictly confidential.
• You can ask me any question that you have about this survey before you decide to participate or not.
Thank you.
Consent Given 0-No 1-Yes |___| Person who gave consent:____________________________________________
Checked by Supervisor (Sign) ____________________________
QNo:

NUTRITION ASSESSMENT FAMILY QUESTIONNAIRE SYRIAN REFUGEE IN LEBANON – September 2012
CHARACTERISTICS OF FAMILY (1 QUESTIONNAIRE BY FAMILY)
Date of interview (dd/mm/yy) Cluster Number
|___|___|/|___|___|/|___|___| |___|___|
Team Number HH Number
|___| |___|___|
Cluster Name Governorate
No QUESTION ANSWER CODES
Q1-7 Characteristics of Family
Q1. Head of Family (M = Male; F = Female) |___|
Q2a. Total number of persons in the family (Only Syrian Refugees)______________________________________
Q2b. Total number of children under 18 years old : ____________________
Number of children less than 5 years (0-59 months) today: ________
Q3a. How long has this (refugee) family lived in this locality? 1 = ≤ 1 Month 2 = 1 - 6 Months 3 = ≥ 6 Months
|___|
Q3b. Are you hosted by a resident family? 0 = No 1 = Yes |___|
Q3c. If No (in 3b above), are you sharing with another Refugee family from Syria?
0 = No 1 = Yes |___|
Q3d. If yes (in 3b or 3c above), how many families are living here? ________________________________
Q4. Health assistance
Q4a. Where do you seek health assistance when sick currently?
(Ask the question and choose one number corresponding to answer)
1 = No assistance sought 2 = Own medication 3 = Public Health Facility
4 = NGO Clinic
5 = Private clinic
6 = Pharmacy
9 = Don’t Know
|___|
Q4b. If ‘No assistance’ in Q8a, why? 1 = Too expensive
2 = Security concerns
3 = Refuse to answer
4 = Other, specify ________________ |___|
Q5 – 7: WATER SANITATION AND HYGIENE QUESTIONS
QNo:

No QUESTION ANSWER CODES
Q5. Does the family have access to sufficient water for drinking, cooking, washing and toilet purposes? 0 = No 1 = Yes
|___|
Q6. What is the main water problem for your family? (select one or several answers )
1 = No problem 2 = Buying Water (cost) 3 = Not enough water for adequate personal hygiene of children
4 = Some days with no tap water at all
5 = Drinking bottled water is too expensive so children drink tap water 6 = other ____________
|___||___||___||___|
Q7. Does the family have access to soap and hygiene items? 0 = No 1 = Yes |___|
Checked by Supervisor (Sign) __________________________________

NUTRITION ASSESSMENT FAMILY QUESTIONNAIRE SYRIAN REFUGEE IN LEBANON – September 2012
FEEDING, IMMUNIZATION STATUS AND MORBIDITY OF CHILDREN AGED 0 – 59 MONTHS IN THE FAMILY
(1 QUESTIONNAIRE BY FAMILY)
Date of interview (dd/mm/yy) Cluster Number Team Number Cluster Number
|___|___|/|___|___|/|___|___| |___|___| |___| |___|___|
Cluster Name Governorate
Q8 - 20: Feeding, Immunization status and Morbidity of children aged 0 – 59 months in the family
Id.
First Name
(optional)
HH No.
Consent Given
1 = Yes 2 = No
Q8
- Ch
ild S
ex (M
/F)
Q9
Date of Birth (if
available)
dd/mm/yy
Q10
Child Age (in
completed
months)
(If DOB is available skip months)
Q11
Are you breast-feeding
(mention by
name)?
0 = No 1 = Yes
Q12
In addition to your breast milk, what are you giving to
your child (by name)?
0= Nothing 1= Formula milk 2= Water 3=Tea 4=Baby food 5=Special Food 6=Modified Family Food 7=Eat with the family
(Write different answers)
Q13
How many times did you feed the child in the last 24 hours (besides breast milk)?
0 = Zero time 1 = 1 time 2 =2 times 3 = 3 times 4 =-4 times 5 = 5 or more times
Q14
Has child been
provided with
Vitamin A in the last 6
months?
(show sample) 0 = No 1 = Yes 9 = Don’t know
Q15
Has the child been immunized as per the regulations
of the Syrian
national calendar?
0 = No 1 = Yes 9=Don’t know
Q16
Has the child received any
vaccine since the
displacement to Lebanon?
0 = No 1 = Yes (If YES, specify)
Q17
Diarrhea in last two
weeks 0= No 1=yes
Q18
If yes in Q17 for
how many
days did the child
have diarrhea?
Q19
Has the
child had
cough in the last two
weeks
0= No 1=yes
Q20
Fever in the last two
weeks 0= No 1=yes
1. 1 2
|___|___|___|___|
2. 1 2 |___|___|___|___|
3. 1 2 |___|___|___|___|
4. 1 2 |___|___|___|___|
QNo:

Q8 - 20: Feeding, Immunization status and Morbidity of children aged 0 – 59 months in the family
Id.
First Name
(optional)
HH No.
Consent Given
1 = Yes 2 = No
Q8
- Ch
ild S
ex (M
/F)
Q9
Date of Birth (if
available)
dd/mm/yy
Q10
Child Age (in
completed
months)
(If DOB is available skip months)
Q11
Are you breast-feeding
(mention by
name)?
0 = No 1 = Yes
Q12
In addition to your breast milk, what are you giving to
your child (by name)?
0= Nothing 1= Formula milk 2= Water 3=Tea 4=Baby food 5=Special Food 6=Modified Family Food 7=Eat with the family
(Write different answers)
Q13
How many times did you feed the child in the last 24 hours (besides breast milk)?
0 = Zero time 1 = 1 time 2 =2 times 3 = 3 times 4 =-4 times 5 = 5 or more times
Q14
Has child been
provided with
Vitamin A in the last 6
months?
(show sample) 0 = No 1 = Yes 9 = Don’t know
Q15
Has the child been immunized as per the regulations
of the Syrian
national calendar?
0 = No 1 = Yes 9=Don’t know
Q16
Has the child received any
vaccine since the
displacement to Lebanon?
0 = No 1 = Yes (If YES, specify)
Q17
Diarrhea in last two
weeks 0= No 1=yes
Q18
If yes in Q17 for
how many
days did the child
have diarrhea?
Q19
Has the
child had
cough in the last two
weeks
0= No 1=yes
Q20
Fever in the last two
weeks 0= No 1=yes
IF NO VALID AGE DOCUMENTATION IS AVAILABLE: DO NOT FILL IN Q9 AND ESTIMATE AGE USING THE EVENTS CALENDAR (Q10).
5. 1 2
|___|___|___|___|
6. 1 2
|___|___|___|___|
7. 1 2
|___|___|___|___|
8. 1 2
|___|___|___|___|
9. 1 2
|___|___|___|___|
10. 1 2
|___|___|___|___|
11. 1 2
|___|___|___|___|
12. 1 2
|___|___|___|___|
13. 1 2
|___|___|___|___|
14. 1 2
|___|___|___|___|
15. 1 2
|___|___|___|___|
IF NO VALID AGE DOCUMENTATION IS AVAILABLE: DO NOT FILL IN Q9 AND ESTIMATE AGE USING THE EVENTS CALENDAR (Q10).
Checked by Supervisor (Sign) __________________________________

NUTRITION ASSESSMENT FAMILY QUESTIONNAIRE SYRIAN REFUGEE IN LEBANON – September 2012
ANTHROPOMETRY OF CHILDREN AGED 0 – 59 MONTHS IN THE FAMILY
(1 QUESTIONNAIRE BY FAMILY)
(THIS QUESTIONNAIRE IS TO BE ADMINISTERED TO ALL CARETAKERS OF A CHILD THAT LIVES WITH THEM AND IS BETWEEN 0 AND 59 MONTHS OF AGE)
Date of interview (dd/mm/yy) Cluster Number Team Number Cluster Number
|___|___|/|___|___|/|___|___| |___|___| |___| |___|___|
Cluster Name Governorate
Q21 - 30: Anthropometric of Children aged 0 – 59 months in the family
(to measure only children aged 6 – 59 months)
Id.
First Name (optional)
HH No.
Consent Given
1= Yes 2 = No
Q21
Sex (M/F)
Q22
Date of Birth (if
available)
dd/mm/yy
Q23
Age
(in completed months)
Q24 Weight
(kg)
± 0.1 kg
Q25
Height (cm)
± 0.1 cm
Q26
Bilateral Leg
Oedema
N = No Y = yes
Q27
MUAC (cm)
± 0.1 cm
Q28
Weight taken with
minimum clothes
0= No 1=yes
Q29
W/H Z-scores
Green = 0 Yellow = 1 Red = 2
Q30
Referral to Health Center
0 = None
1= (W/H=yellow) 2= (W/H=Red)
3= Oedema DOB reported from Q9 or Age reported from Q10
1. 1 2 M F N Y 0 1 0 1 2 0 1 2 3
2. 1 2 M F N Y 0 1 0 1 2 0 1 2 3
3. 1 2 M F N Y 0 1 0 1 2 0 1 2 3
4. 1 2 M F N Y 0 1 0 1 2 0 1 2 3
5. 1 2 M F N Y 0 1 0 1 2 0 1 2 3
QNo:

Q21 - 30: Anthropometric of Children aged 0 – 59 months in the family
(to measure only children aged 6 – 59 months)
Id.
First Name (optional)
HH No.
Consent Given
1= Yes 2 = No
Q21
Sex (M/F)
Q22
Date of Birth (if
available)
dd/mm/yy
Q23
Age
(in completed months)
Q24 Weight
(kg)
± 0.1 kg
Q25
Height (cm)
± 0.1 cm
Q26
Bilateral Leg
Oedema
N = No Y = yes
Q27
MUAC (cm)
± 0.1 cm
Q28
Weight taken with
minimum clothes
0= No 1=yes
Q29
W/H Z-scores
Green = 0 Yellow = 1 Red = 2
Q30
Referral to Health Center
0 = None
1= (W/H=yellow) 2= (W/H=Red)
3= Oedema DOB reported from Q9 or Age reported from Q10
6. 1 2 M F N Y 0 1 0 1 2 0 1 2 3
7. 1 2 M F N Y 0 1 0 1 2 0 1 2 3
8. 1 2 M F N Y 0 1 0 1 2 0 1 2 3
9. 1 2 M F N Y 0 1 0 1 2 0 1 2 3
10. 1 2 M F N Y 0 1 0 1 2 0 1 2 3
11. 1 2 M F N Y 0 1 0 1 2 0 1 2 3
12. 1 2 M F N Y 0 1 0 1 2 0 1 2 3
13. 1 2 M F N Y 0 1 0 1 2 0 1 2 3
14. 1 2 M F N Y 0 1 0 1 2 0 1 2 3
15. 1 2 M F N Y 0 1 0 1 2 0 1 2 3
16. 1 2 M F N Y 0 1 0 1 2 0 1 2 3
17. 1 2 M F N Y 0 1 0 1 2 0 1 2 3
18. 1 2 M F N Y 0 1 0 1 2 0 1 2 3
19. 1 2 M F N Y 0 1 0 1 2 0 1 2 3
20. 1 2 M F N Y 0 1 0 1 2 0 1 2 3
Checked by Supervisor (Sign) __________________________________

NUTRITION ASSESSMENT FAMILY QUESTIONNAIRE SYRIAN REFUGEE IN LEBANON – September 2012
ANTHROPOMETRY (MUAC) FOR ALL ADULT WOMEN OF CHILDBEARING AGE (15-49 YEARS) PRESENT
AT THE FAMILY (1 QUESTIONNAIRE BY FAMILY)
(THIS QUESTIONNAIRE IS TO BE ADMINISTERED TO ALL WOMEN AGED BETWEEN 15 AND 49 YEARS IN THE SELECTED FAMILY)
Date of interview (dd/mm/yy) Cluster Number Team Number Cluster Number
|___|___|/|___|___|/|___|___| |___|___| |___| |___|___|
Cluster Name Governorate
Q31 - 35: Anthropometry (MUAC) for all adult women of childbearing age (15-49 years) present at the family
ID
Woman Name (optional)
HH No.
Consent Given
1 = Yes 2 = No
Q31
Age (in completed
years)
Q32
Physiological status
1 = Pregnant 2 = Lactating 3 = None of the above 9 = Don’t Know
Q33
Number of Tetanus vaccine received
0 = None 1 = One 2 = Two 3 =Three 9 = Don’t Know
Q34
Are you currently receiving iron-folate
pills
0 = No 1 = yes 9 = Don’t know
Q35
MUAC (cm)
± 0.1 cm
1. 1 2 1 2 3 9 0 1 2 3 9 0 1 9
2. 1 2 1 2 3 9 0 1 2 3 9 0 1 9
3. 1 2 1 2 3 9 0 1 2 3 9 0 1 9
4. 1 2 1 2 3 9 0 1 2 3 9 0 1 9
5. 1 2 1 2 3 9 0 1 2 3 9 0 1 9
Checked by Supervisor (Sign) __________________________________
QNo:

NUTRITION ASSESSMENT FAMILY QUESTIONNAIRE SYRIAN REFUGEE IN LEBANON – September 2012
FOOD SECURITY - QUESTIONS ARE ABOUT FAMILY DAILY CHOICES AND
EATING HABITS (1 QUESTIONNAIRE BY FAMILY)
(THIS QUESTIONNAIRE IS TO BE ADMINISTERED TO THE MAIN CARETAKER WHO IS RESPONSIBLE FOR COOKING THE MEALS)
Date of interview (dd/mm/yy) Cluster Number
|___|___|/|___|___|/|___|___| |___|___|
Team Number HH Number
|___| |___|___|
Cluster Name Governorate
No QUESTION ANSWER CODES
Q36 - 37: FAMILY FOOD SOURCES AND NUMBER OF MEALS
Q36. What was the main source of food, from the time the family arrived here as a refugee?
(select one or several answers )
1 = Purchase from personal resource 2 = Purchase with cash given by charity 3 = Purchase at credit, borrowed 4 = Received as gift from charity 5 = Shared with hosts
6 = Humanitarian food aid 7 = Received against work (in-kind payment) 8 = Bartered against other goods 99 = Not eaten during the 7 past days
|___|___||___|___||___|___|
Q37. How many meals do you eat each day currently? ___________________________________________
Q38 - 39: COPING STRATEGIES
Q38a.
In the past 7 days, have you had enough food or money to buy food for your Family?
0 = NO 1 = YES |___| If answer is No, don’t ask the Q38b.
Q38b. During the days that you did not have enough food or money to buy food, what did you do? (read all the answer one by one) For each answer, ask the number of days
Number of the days per week
Rely on less preferred and less expensive foods? |___|
Borrow food, or rely on help from a friend or relative? |___|
QNo:

No QUESTION ANSWER CODES
Limit portion size at meal times? |___|
Restrict consumption by adults in order for small children to eat? |___|
Reduce number of meals eaten in a day? |___|
Spend whole day without eat? |___|
Purchase food at credit? |___|
Have family members eat at relatives or neighbours? |___|
Send family members elsewhere to eat? |___|
Spend whole day without eating? |___|
Q39. Have there been times when your family had to do the following in order to get money or food, from the time of displacement? 0 = No 1= Yes
Sell family assets (jewellery, phone, furniture etc.)? |___|
Have school age children involved in income generation? |___|
Decrease health expenditures? |___|
Have family member leave in search of work/income? |___|

No QUESTION ANSWER CODES
Q40 - 43: FAMILY FOOD CONSUMPTION
Q40. Consider only meals consumed at home or in public kitchen but not in private restaurants or street food
Do NOT count food consumed in very small amount (less than a teaspoon per person
How many days for the last 7 days did your family consume these food items?
What was the main source of these food?
Bread
0 = Not eaten 1 = 1 day 2 = 2 days 3 = 3 days 4 = 4 days 5 = 5 days 6 = 6 days 7 = 7 days
|___|
1 = Own production/garden 2 = Purchase in shops, markets, petty traders 3 = Purchase at credit, borrowed 4 = Received against work (in-kind payment) 5 = Bartered against other goods 6 = Received as gift from family or neighbours, begged 7 = Humanitarian food aid 9 = Not eaten during the 7 past days
|___|
Wheat (grain, flour), rice, maize, pasta |___| |___|
Biscuits, High Energy Biscuits |___| |___|
Potatoes, sweet potatoes |___| |___|
Beans, chickpeas, lentils, peas |___| |___|
Vegetables |___| |___|
Fruits |___| |___|
Nuts, walnuts, hazelnuts |___| |___|
Meat (red, poultry) |___| |___|
Eggs |___| |___|
Fish |___| |___|
Dairy products (yogurt, cheese, milk, milk powder)
|___| |___|
Vegetable oil, butter, grease |___| |___|
Sugar, honey, jam, sweets |___| |___|
Q41. Do you eat canned foods?
(0 = No 1 = Yes) |___|
If Yes, what type of canned foods ___________________________
How many days in a week |___|
Q42. Do you have some stocks of food? 0 = No 1 = Yes │___│ If No stocks, don’t ask the Q43
Q43. How long will your stocks last for the family consumption? Write number of days (0 if no stock)
Wheat (grain, flour) |___|___| Days
Rice |___|___| Days
Beans, peas, chickpeas, lentils |___|___| Days
Potatoes, sweet potatoes |___|___| Days
Oil, butter, grease |___|___| Days
Sugar |___|___| Days
Checked by Supervisor (Sign) __________________________________

ANNEX 4: RESULTS USING THE NCHS 1977 GROWTH REFERENCE FOR SYRIAN REFUGEES IN LEBANON
Result Tables for NCHS growth reference 1977
Table: Prevalence of acute malnutrition based on weight-for-height z-scores (and/or oedema) and by sex
All
n = 482
Boys
n = 244
Girls
n = 238
Prevalence of global malnutrition
(<-2 z-score and/or oedema)
(17) 3.5 %
(1.9 - 6.4 95%
C.I.)
(11) 4.5 %
(2.3 - 8.6 95%
C.I.)
(6) 2.5 %
(1.0 - 6.0 95%
C.I.)
Prevalence of moderate malnutrition
(<-2 z-score and >=-3 z-score, no
oedema)
(15) 3.1 %
(1.8 - 5.5 95%
C.I.)
(11) 4.5 %
(2.3 - 8.6 95%
C.I.)
(4) 1.7 %
(0.6 - 4.3 95%
C.I.)
Prevalence of severe malnutrition
(<-3 z-score and/or oedema)
(2) 0.4 %
(0.1 - 1.7 95%
C.I.)
(0) 0.0 %
(0.0 - 0.0 95%
C.I.)
(2) 0.8 %
(0.2 - 3.3 95%
C.I.)
The prevalence of oedema is 0.0 %
Table: Prevalence of acute malnutrition by age, based on weight-for-height z-scores and/or oedema
Severe wasting
(<-3 z-score)
Moderate
wasting
(>= -3 and <-2 z-
score )
Normal
(> = -2 z score)
Oedema
Age
(mo)
Total
no.
No. % No. % No. % No. %
6-11 52 0 0.0 0 0.0 52 100.0 0 0.0
12-23 134 1 0.7 6 4.5 127 94.8 0 0.0
24-34 96 1 1.0 4 4.2 91 94.8 0 0.0
35-47 106 0 0.0 4 3.8 102 96.2 0 0.0
48-59 94 0 0.0 1 1.1 93 98.9 0 0.0
Total 482 2 0.4 15 3.1 465 96.5 0 0.0
Table: Distribution of acute malnutrition and oedema based on weight-for-height z-scores
<-3 z-score >=-3 z-score
Oedema present Marasmic kwashiorkor
No. 0
(0.0 %)
Kwashiorkor
No. 0
(0.0 %)
Oedema absent Marasmic
No. 2
(0.4 %)
Not severely malnourished
No. 480
(99.6 %)
Table: Prevalence of acute malnutrition based on the percentage of the median and/or oedema
n = 482
Prevalence of global acute malnutrition
(<80% and/or oedema)
(10) 2.1 %
(1.0 - 4.1 95% C.I.)
Prevalence of moderate acute
malnutrition
(<80% and >= 70%, no oedema)
(9) 1.9 %
(1.0 - 3.6 95% C.I.)
Prevalence of severe acute malnutrition
(<70% and/or oedema)
(1) 0.2 %
(0.0 - 1.6 95% C.I.)

Table: Prevalence of malnutrition by age, based on weight-for-height percentage of the median and oedema
Severe wasting
(<70% median)
Moderate
wasting
(>=70% and
<80% median)
Normal
(> =80% median)
Oedema
Age
(mo)
Total
no.
No. % No. % No. % No. %
6-11 52 0 0.0 0 0.0 52 100.0 0 0.0
12-23 134 0 0.0 5 3.7 129 96.3 0 0.0
24-34 96 1 1.0 1 1.0 94 97.9 0 0.0
35-47 106 0 0.0 3 2.8 103 97.2 0 0.0
48-59 94 0 0.0 0 0.0 94 100.0 0 0.0
Total 482 1 0.2 9 1.9 472 97.9 0 0.0
Table: Prevalence of underweight based on weight-for-age z-scores by sex
All
n = 482
Boys
n = 244
Girls
n = 238
Prevalence of underweight
(<-2 z-score)
(27) 5.6 %
(3.7 - 8.4 95%
C.I.)
(15) 6.1 %
(3.9 - 9.6 95%
C.I.)
(12) 5.0 %
(2.3 - 10.8
95% C.I.)
Prevalence of moderate
underweight
(<-2 z-score and >=-3 z-score)
(24) 5.0 %
(3.2 - 7.8 95%
C.I.)
(14) 5.7 %
(3.5 - 9.2 95%
C.I.)
(10) 4.2 %
(1.7 - 10.0
95% C.I.)
Prevalence of severe underweight
(<-3 z-score)
(3) 0.6 %
(0.1 - 2.8 95%
C.I.)
(1) 0.4 %
(0.1 - 3.1 95%
C.I.)
(2) 0.8 %
(0.1 - 6.0 95%
C.I.)
Table: Prevalence of underweight by age, based on weight-for-age z-scores
Severe
underweight
(<-3 z-score)
Moderate
underweight
(>= -3 and <-2 z-
score )
Normal
(> = -2 z score)
Oedema
Age
(mo)
Total
no.
No. % No. % No. % No. %
6-11 52 0 0.0 3 5.8 49 94.2 0 0.0
12-23 134 2 1.5 9 6.7 123 91.8 0 0.0
24-34 96 1 1.0 4 4.2 91 94.8 0 0.0
35-47 106 0 0.0 6 5.7 100 94.3 0 0.0
48-59 94 0 0.0 2 2.1 92 97.9 0 0.0
Total 482 3 0.6 24 5.0 455 94.4 0 0.0
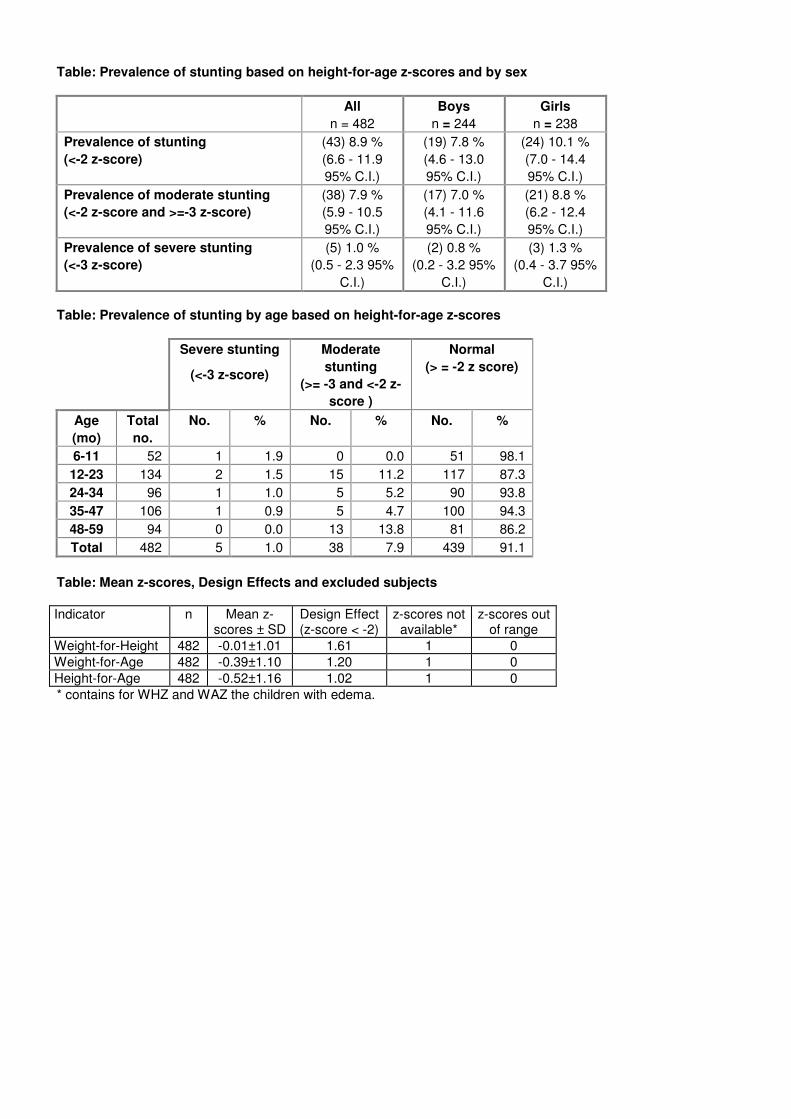
Table: Prevalence of stunting based on height-for-age z-scores and by sex
All
n = 482
Boys
n = 244
Girls
n = 238
Prevalence of stunting
(<-2 z-score)
(43) 8.9 %
(6.6 - 11.9
95% C.I.)
(19) 7.8 %
(4.6 - 13.0
95% C.I.)
(24) 10.1 %
(7.0 - 14.4
95% C.I.)
Prevalence of moderate stunting
(<-2 z-score and >=-3 z-score)
(38) 7.9 %
(5.9 - 10.5
95% C.I.)
(17) 7.0 %
(4.1 - 11.6
95% C.I.)
(21) 8.8 %
(6.2 - 12.4
95% C.I.)
Prevalence of severe stunting
(<-3 z-score)
(5) 1.0 %
(0.5 - 2.3 95%
C.I.)
(2) 0.8 %
(0.2 - 3.2 95%
C.I.)
(3) 1.3 %
(0.4 - 3.7 95%
C.I.)
Table: Prevalence of stunting by age based on height-for-age z-scores
Severe stunting
(<-3 z-score)
Moderate
stunting
(>= -3 and <-2 z-
score )
Normal
(> = -2 z score)
Age
(mo)
Total
no.
No. % No. % No. %
6-11 52 1 1.9 0 0.0 51 98.1
12-23 134 2 1.5 15 11.2 117 87.3
24-34 96 1 1.0 5 5.2 90 93.8
35-47 106 1 0.9 5 4.7 100 94.3
48-59 94 0 0.0 13 13.8 81 86.2
Total 482 5 1.0 38 7.9 439 91.1
Table: Mean z-scores, Design Effects and excluded subjects
Indicator n Mean z-scores ± SD
Design Effect (z-score < -2)
z-scores not available*
z-scores out of range
Weight-for-Height 482 -0.01±1.01 1.61 1 0
Weight-for-Age 482 -0.39±1.10 1.20 1 0
Height-for-Age 482 -0.52±1.16 1.02 1 0
* contains for WHZ and WAZ the children with edema.

ANNEX 5: ASSESSMENT TEAMS’ MEMBERS FOR SYRIAN REFUGEES IN LEBANON
Inter-agency Syrian refugees nutrition assessment
Field team list - Lebanon
NAME AND SURNAME PHONE
NUMBER E-MAIL ADDRESS POSITION TEAM
Oumar Hamza 78/800558 [email protected] Coordinator
Mutasim Hamdan 70/182791 [email protected] Coordinator
Beatriz Pérez Bernabé 78/815047 [email protected] Coordinator
Sabeen Abdulsater 03/952423 [email protected]
m Supervisor
Ghada M. Dib 03/869448 [email protected] Team leader
1 Waleed Alwan 76/049853 [email protected] Measurer
Ahmad Trad 03/830484 [email protected] Assistant
Joyce Issa El Khoury 70/106633 [email protected] Team leader
2 Maria Abboud 70/742852 [email protected] Measurer
Nabeel Mohammad Raduan 70/429912 [email protected] Assistant
Zakia Sadek 70/969266 [email protected] Team leader
3 Fatima Mohamad Dirani 76/707581 [email protected] Measurer
Omran Naime Shehade ALFA 70/568664 omran-
[email protected] Assistant
Maysam Mohamed ALFA 70/484238 [email protected] Team leader
4 Maria Elie Hakem 71/647855 [email protected] Measurer
Mohamad Hassan Zaidan 76/071393 [email protected]
m Assistant
Celine Abou Boutros 03/193711 [email protected] Team leader
5 Roberto Fallini 76/582627 [email protected] Measurer
Joumana Jaber 71/737921 [email protected] Assistant

ANNEX 6: CONSENT FORM FOR SYRIAN REFUGEES IN LEBANON
� ا�ر�� �� ����ا ����ن ا����� ا��� ا��ا�� �� �ل 2012�"
� �ا-,�ل *��)ل و ا&%���ر ا$#�ا�� )��ان ا* +:
��ان ا0 �ة •* +� ا1,2 *
ا8�ح ا56ف �3 ا& ����ن •
• ����$��(;ّ�� آ1 ا��$ )ا0 �ة = آ1 ا
:ا�-�� و ;�اءة ا-��ق
ل ��ب آ� ا�ا��� ��� ا���ر � د �� �� ا�� ة )$- ا� � اءة ه%ا ا$�ن ب ا�� ة ، او !م، و �( ���)*�+,12 �0,�/( .$�ء � ف ا�� ة �ّ/
�< ا+ ار ا=�� . ا>;� 92: 9��� ا8س ا%�� ��5�6ن ف رب ا�� ة �C2 ا9 د ا+�B �5@ون ا�� ة و ��� A@و12 و ه� ?ّ/.
�، ا�,$� � �ى �E8,( ا2>�2(و ا/,- _______________________ ���رآ( �� ا��$�ن �را�( ا�HI �2/� أ� J;� *,5 �2د أن *8$ �� ��ر�K���� *>�ر��� ا+د��� LMو ا �Bا%Nا.
• )�2ت ا2><�@� � .ا�ا/� 1%ا ا�+��� ه
• P� ص� ه%ا ا�+��� ه� ��ر �� Pاآ �Aرآ(. ار ا,5رآ( أو /�م ا,5�RJ ان P2;�� . �� S(��ا P2;�5رآ(، �$,اذا اRJ%ت ) ار � )EL نأي/�ات. �ي �$< آ<� �� V+*�J � ا�6�- �H ا� PJ أو �,� �NJ ي� >$<�� � P%� S(��رت ا .اذا )
• �� 9ل ا=آ$W! ل�Xزن و ا�%راع ، اا [�L� س\� PJ و �8+�م �+��6*[ �J أ��ر �/ P>@ا�رآ(، �\)�م 5, 6اذا اRJ%ت ) ارا � �� N?=�1ر و اA5 `. ��8اتا )�Iا �� 82 2+�م �+�س ��L] ا%راع *8>ء و ا��9ت ا�آ$� P15ذ �� N?=م و ام 49//.
5رآ( •,ك �I6*� /� رJ أن P8� >*X8� ،ت� �( . )$- أن 2$�أ �\ي �� ا��)*e أو أ�% أي �(<� `EL�� 8 أي �6*��( ���� ه)� .ا�
8� /� اي ا��9>ر �fR ه%ا ا= •\<J أن P2;��5رآ( أو /��1, ارا �( %R�J ن )$- أن�$��.
ا;A
|___| �J-0 �62-1 ا/�ن ا,�ا�+( =
_________________________ رب ا�� ةا��
ا����ف� � ��� _________________________)ا������(

ANNEX 7: SMART PLAUSIBILITY REPORT FOR SYRIAN REFUGEES IN LEBANON
Plausibility check for: LIB_201209_UNInterAgency_NutAssessment_Syrefugees13-FV-1.as
Standard/Reference used for z-score calculation: WHO standards 2006
(If it is not mentioned, flagged data is included in the evaluation. Some parts of this plausibility report are more for advanced
users and can be skipped for a standard evaluation)
Overall data quality
Criteria Flags* Unit Excel. Good Accept Problematic Score
Missing/Flagged data Incl % 0-2.5 >2.5-5.0 >5.0-10 >10
(% of in-range subjects) 0 5 10 20 0 (1.9 %)
Overall Sex ratio Incl p >0.1 >0.05 >0.001 <0.000
(Significant chi square) 0 2 4 10 0 (p=0.750)
Overall Age distrib Incl p >0.1 >0.05 >0.001 <0.000
(Significant chi square) 0 2 4 10 0 (p=0.136)
Dig pref score - weight Incl # 0-5 5-10 10-20 > 20
0 2 4 10 0 (4)
Dig pref score - height Incl # 0-5 5-10 10-20 > 20
0 2 4 10 2 (9)
Standard Dev WHZ Excl SD <1.1 <1.15 <1.20 >1.20
0 2 6 20 0 (0.98)
Skewness WHZ Excl # <±1.0 <±2.0 <±3.0 >±3.0
0 1 3 5 0 (-0.21)
Kurtosis WHZ Excl # <±1.0 <±2.0 <±3.0 >±3.0
0 1 3 5 0 (0.19)
Poisson dist WHZ-2 Excl p >0.05 >0.01 >0.001 <0.000
0 1 3 5 0 (p=0.715)
Timing Excl Not determined yet
0 1 3 5
OVERALL SCORE WHZ = 0-5 5-10 10-15 >15 2 %
At the moment the overall score of this survey is 2 %, this is excellent.
There were no duplicate entries detected.
Missing data:
WEIGHT: Line=278/ID=273
HEIGHT: Line=278/ID=273
Percentage of children with no exact birthday: 78 %
Anthropometric Indices likely to be in error (-3 to 3 for WHZ, -3 to 3 for HAZ, -3 to 3 for WAZ, from observed mean -
chosen in Options panel - these values will be flagged and should be excluded from analysis for a nutrition survey in
emergencies. For other surveys this might not be the best procedure e.g. when the percentage of overweight children has to be calculated):
Line=68/ID=63: WHZ (-2.969), Weight may be incorrect
Line=86/ID=81: HAZ (3.737), WAZ (3.488), Age may be incorrect
Line=99/ID=94: HAZ (-4.410), Age may be incorrect
Line=152/ID=147: WHZ (3.594), Weight may be incorrect
Line=158/ID=153: WHZ (-2.990), Weight may be incorrect
Line=161/ID=156: WHZ (-2.892), Weight may be incorrect
Line=170/ID=165: HAZ (3.097), WAZ (2.989), Age may be incorrect
Line=171/ID=166: HAZ (2.420), Age may be incorrect
Line=177/ID=172: HAZ (3.114), Height may be incorrect
Line=184/ID=179: WHZ (-3.107), WAZ (-3.697), Weight may be incorrect
Line=253/ID=248: WHZ (-2.937), Weight may be incorrect
Line=269/ID=264: WHZ (-3.053), WAZ (-3.419), Weight may be incorrect
Line=270/ID=265: HAZ (2.650), Height may be incorrect
Line=295/ID=290: WHZ (-3.842), WAZ (-3.216), Weight may be incorrect
Line=317/ID=312: HAZ (2.461), Age may be incorrect
Line=338/ID=333: WHZ (-3.011), Weight may be incorrect
Line=348/ID=343: HAZ (2.518), Age may be incorrect
Line=398/ID=393: HAZ (-3.818), WAZ (-3.252), Age may be incorrect
Line=426/ID=421: HAZ (-3.786), Age may be incorrect

Line=446/ID=441: WAZ (3.399), Age may be incorrect
Line=447/ID=442: HAZ (3.386), Age may be incorrect
Line=478/ID=473: HAZ (2.437), WAZ (3.215), Age may be incorrect
Percentage of values flagged with SMART flags:WHZ: 1.9 %, HAZ: 2.5 %, WAZ: 1.7 %
Age distribution:
Month 6 : ###########
Month 7 : #####
Month 8 : #######
Month 9 : #######
Month 10 : ########
Month 11 : #############
Month 12 : #######
Month 13 : ##########
Month 14 : #########
Month 15 : #############
Month 16 : ########
Month 17 : #################
Month 18 : ######
Month 19 : ##############
Month 20 : ########################
Month 21 : ####
Month 22 : #######
Month 23 : ###############
Month 24 : ##########
Month 25 : #######
Month 26 : #########
Month 27 : ###
Month 28 : #########
Month 29 : ########
Month 30 : ######
Month 31 : #########
Month 32 : #####################
Month 33 : ##########
Month 34 : ######
Month 35 : #######
Month 36 : ##########
Month 37 : ############
Month 38 : ######
Month 39 : #######
Month 40 : ############
Month 41 : ####
Month 42 : ######
Month 43 : #########
Month 44 : ############
Month 45 : #######
Month 46 : ######
Month 47 : #######
Month 48 : ####
Month 49 : #######
Month 50 : #######
Month 51 : #####
Month 52 : #####
Month 53 : ########
Month 54 : #######
Month 55 : ####
Month 56 : ###################
Month 57 : ##############
Month 58 : #########
Month 59 : ######
Age ratio of 6-29 months to 30-59 months: 0.92 (The value should be around 1.0).

Statistical evaluation of sex and age ratios (using Chi squared statistic): Age cat. mo. boys girls total ratio boys/girls
-------------------------------------------------------------------------------------
6 to 11 6 31/28.7 (1.1) 21/27.9 (0.8) 52/56.6 (0.9) 1.48
12 to 23 12 64/56.0 (1.1) 70/54.4 (1.3) 134/110.3 (1.2) 0.91
24 to 34 11 45/49.7 (0.9) 52/48.3 (1.1) 97/98.0 (1.0) 0.87
35 to 47 13 55/57.8 (1.0) 51/56.2 (0.9) 106/114.0 (0.9) 1.08
48 to 59 12 50/52.8 (0.9) 44/51.3 (0.9) 94/104.1 (0.9) 1.14
-------------------------------------------------------------------------------------
6 to 59 54 245/241.5 (1.0) 238/241.5 (1.0) 1.03
The data are expressed as observed number/expected number (ratio of obs/expect)
Overall sex ratio: p-value = 0.750 (boys and girls equally represented)
Overall age distribution: p-value = 0.136 (as expected)
Overall age distribution for boys: p-value = 0.722 (as expected)
Overall age distribution for girls: p-value = 0.092 (as expected)
Overall sex/age distribution: p-value = 0.039 (significant difference)
Digit preference Weight:
Digit .0 : ################################################
Digit .1 : ######################################
Digit .2 : ############################################
Digit .3 : ###################################################
Digit .4 : ##########################################################
Digit .5 : #############################################
Digit .6 : ##################################################
Digit .7 : ##########################################################
Digit .8 : ##################################################
Digit .9 : ########################################
Digit Preference Score: 4 (0-5 excellent, 6-10 good, 11-20 acceptable and > 20 problematic)
Digit preference Height:
Digit .0 : ###############
Digit .1 : ################################
Digit .2 : ##############################
Digit .3 : ##########################
Digit .4 : ################################
Digit .5 : ####################
Digit .6 : ##############################
Digit .7 : ##################
Digit .8 : ###################
Digit .9 : ###################
Digit Preference Score: 9 (0-5 excellent, 6-10 good, 11-20 acceptable and > 20 problematic)
Digit preference MUAC:
Digit .0 : #
Digit .1 : #
Digit .2 : #
Digit .3 : ###
Digit .4 : ######################
Digit .5 : ########################################
Digit .6 : ##############################################
Digit .7 : #################################
Digit .8 : ############
Digit .9 : ##
Digit Preference Score: 35 (0-5 excellent, 6-10 good, 11-20 acceptable and > 20 problematic)

Evaluation of Standard deviation, Normal distribution, Skewness and Kurtosis using the 3 exclusion (Flag) procedures . no exclusion exclusion from exclusion from
. reference mean observed mean
. (WHO flags) (SMART flags)
WHZ
Standard Deviation SD: 1.08 1.08 0.98
(The SD should be between 0.8 and 1.2)
Prevalence (< -2)
observed: 4.4% 4.4%
calculated with current SD: 1.8% 1.8%
calculated with a SD of 1: 1.2% 1.2%
HAZ
Standard Deviation SD: 1.22 1.22 1.10
(The SD should be between 0.8 and 1.2)
Prevalence (< -2)
observed: 12.2% 12.2% 11.9%
calculated with current SD: 13.6% 13.6% 12.0%
calculated with a SD of 1: 9.0% 9.0% 9.7%
WAZ
Standard Deviation SD: 1.05 1.05 0.97
(The SD should be between 0.8 and 1.2)
Prevalence (< -2)
observed: 3.1% 3.1%
calculated with current SD: 4.2% 4.2%
calculated with a SD of 1: 3.4% 3.4%
Results for Shapiro-Wilk test for normally (Gaussian) distributed data:
WHZ p= 0.000 p= 0.000 p= 0.035
HAZ p= 0.000 p= 0.000 p= 0.037
WAZ p= 0.040 p= 0.040 p= 0.988
(If p < 0.05 then the data are not normally distributed. If p > 0.05 you can consider the data normally
distributed)
Skewness
WHZ -0.50 -0.50 -0.21
HAZ 0.42 0.42 0.24
WAZ 0.05 0.05 0.00
If the value is:
-below minus 2 there is a relative excess of wasted/stunted/underweight subjects in the sample
-between minus 2 and minus 1, there may be a relative excess of wasted/stunted/underweight subjects in the
sample.
-between minus 1 and plus 1, the distribution can be considered as symmetrical.
-between 1 and 2, there may be an excess of obese/tall/overweight subjects in the sample.
-above 2, there is an excess of obese/tall/overweight subjects in the sample
Kurtosis
WHZ 1.00 1.00 0.19
HAZ 0.60 0.60 -0.20
WAZ 0.74 0.74 -0.14
(Kurtosis characterizes the relative peakedness or flatness compared with the normal distribution, positive
kurtosis indicates a relatively peaked distribution, negative kurtosis indicates a relatively flat
distribution)
If the value is:
-above 2 it indicates a problem. There might have been a problem with data collection or sampling.
-between 1 and 2, the data may be affected with a problem.
-less than an absolute value of 1 the distribution can be considered as normal.
Test if cases are randomly distributed or aggregated over the clusters by calculation of the Index of Dispersion (ID) and
comparison with the Poisson distribution for: WHZ < -2: ID=0.86 (p=0.715)
GAM: ID=0.86 (p=0.715)
HAZ < -2: ID=1.30 (p=0.091)
HAZ < -3: ID=0.85 (p=0.733)
WAZ < -2: ID=0.76 (p=0.872)
WAZ < -3: ID=1.00 (p=0.471)
Subjects with SMART flags are excluded from this analysis.
The Index of Dispersion (ID) indicates the degree to which the cases are aggregated into certain clusters (the degree to which
there are "pockets"). If the ID is less than 1 and p > 0.95 it indicates that the cases are UNIFORMLY distributed among the
clusters. If the p value is between 0.05 and 0.95 the cases appear to be randomly distributed among the clusters, if ID is higher
than 1 and p is less than 0.05 the cases are aggregated into certain cluster (there appear to be pockets of cases). If this is the case
for Oedema but not for WHZ then aggregation of GAM and SAM cases is likely due to inclusion of oedematous cases in GAM

and SAM estimates.
Are the data of the same quality at the beginning and the end of the clusters? Evaluation of the SD for WHZ depending upon the order the cases are measured within each cluster (if one cluster per day is
measured then this will be related to the time of the day the measurement is made).
Time SD for WHZ
point 0.8 0.9 1.0 1.1 1.2 1.3 1.4 1.5 1.6 1.7 1.8 1.9 2.0 2.1 2.2 2.3
01: 1.28 (n=42, f=2) ####################
02: 1.32 (n=41, f=2) ######################
03: 0.80 (n=42, f=0)
04: 1.08 (n=42, f=0) ############
05: 1.01 (n=41, f=1) #########
06: 1.05 (n=39, f=0) ##########
07: 1.00 (n=37, f=1) #########
08: 1.12 (n=34, f=1) #############
09: 1.24 (n=28, f=1) ###################
10: 1.13 (n=24, f=1) ##############
11: 0.92 (n=23, f=0) #####
12: 0.97 (n=21, f=0) #######
13: 0.84 (n=14, f=0) OO
14: 1.15 (n=11, f=0) OOOOOOOOOOOOOOO
15: 0.92 (n=10, f=0) OOOOO
16: 1.00 (n=09, f=0) OOOOOOOO
17: 1.09 (n=08, f=0) OOOOOOOOOOOO
18: 0.94 (n=05, f=0) ~~~~~~
19: 1.18 (n=03, f=0) ~~~~~~~~~~~~~~~~
20: 0.17 (n=02, f=0)
(when n is much less than the average number of subjects per cluster different symbols are used: 0 for n <
80% and ~ for n < 40%; The numbers marked "f" are the numbers of SMART flags found in the different time
points)
Analysis by Team
Team 1 2 3 4 n = 128 93 117 145
Percentage of values flagged with SMART flags: WHZ: 3.1 3.2 0.9 1.4
HAZ: 1.6 4.3 2.6 2.8
WAZ: 1.6 2.2 1.7 2.1
Age ratio of 6-29 months to 30-59 months: 0.83 1.02 1.21 0.77
Sex ratio (male/female): 0.94 1.27 0.89 1.10
Digit preference Weight (%): .0 : 11 6 11 10
.1 : 7 11 10 5
.2 : 7 11 10 9
.3 : 11 12 9 11
.4 : 13 14 9 12
.5 : 12 6 10 8
.6 : 10 9 15 8
.7 : 12 15 10 12
.8 : 6 13 9 14
.9 : 11 3 7 10
DPS: 7 12 6 8 Digit preference score (0-5 excellent, 5-10 good, 10-20 acceptable and >
20 problematic)
Digit preference Height (%): .0 : 11 8 2 5
.1 : 14 11 14 14
.2 : 10 16 11 13
.3 : 9 16 13 8
.4 : 6 17 15 17
.5 : 14 12 3 5
.6 : 12 8 18 11
.7 : 9 4 6 9
.8 : 8 4 8 10
.9 : 6 4 12 8
DPS: 9 16 17 12 Digit preference score (0-5 excellent, 5-10 good, 10-20 acceptable and >

20 problematic)
Digit preference MUAC (%): .0 : 0 0 1 1
.1 : 0 0 1 1
.2 : 2 0 0 0
.3 : 2 3 2 1
.4 : 14 8 21 11
.5 : 30 20 24 24
.6 : 25 31 31 28
.7 : 20 25 14 24
.8 : 6 11 5 9
.9 : 1 2 2 1
DPS: 36 36 36 36 Digit preference score (0-5 excellent, 5-10 good, 10-20 acceptable and >
20 problematic)
Standard deviation of WHZ: SD 1.14 1.11 1.02 1.01
Prevalence (< -2) observed:
% 4.7 7.5 3.4 2.8
Prevalence (< -2) calculated with current SD:
% 2.9 3.3 0.8 1.1
Prevalence (< -2) calculated with a SD of 1:
% 1.6 2.0 0.7 1.0
Standard deviation of HAZ: SD 1.14 1.29 1.13 1.29
observed:
% 16.5 9.7 9.4 12.4
calculated with current SD:
% 15.7 9.2 12.4 15.4
calculated with a SD of 1:
% 12.6 4.4 9.7 9.4
Statistical evaluation of sex and age ratios (using Chi squared statistic) for:
Team 1: Age cat. mo. boys girls total ratio boys/girls
-------------------------------------------------------------------------------------
6 to 11 6 5/7.3 (0.7) 6/7.7 (0.8) 11/15.0 (0.7) 0.83
12 to 23 12 16/14.2 (1.1) 20/15.1 (1.3) 36/29.2 (1.2) 0.80
24 to 34 11 12/12.6 (1.0) 14/13.4 (1.0) 26/26.0 (1.0) 0.86
35 to 47 13 17/14.6 (1.2) 16/15.6 (1.0) 33/30.2 (1.1) 1.06
48 to 59 12 12/13.4 (0.9) 10/14.2 (0.7) 22/27.6 (0.8) 1.20
-------------------------------------------------------------------------------------
6 to 59 54 62/64.0 (1.0) 66/64.0 (1.0) 0.94
The data are expressed as observed number/expected number (ratio of obs/expect)
Overall sex ratio: p-value = 0.724 (boys and girls equally represented)
Overall age distribution: p-value = 0.404 (as expected)
Overall age distribution for boys: p-value = 0.828 (as expected)
Overall age distribution for girls: p-value = 0.510 (as expected)
Overall sex/age distribution: p-value = 0.291 (as expected)
Team 2: Age cat. mo. boys girls total ratio boys/girls
-------------------------------------------------------------------------------------
6 to 11 6 6/6.1 (1.0) 3/4.8 (0.6) 9/10.9 (0.8) 2.00
12 to 23 12 13/11.9 (1.1) 15/9.4 (1.6) 28/21.2 (1.3) 0.87
24 to 34 11 12/10.6 (1.1) 9/8.3 (1.1) 21/18.9 (1.1) 1.33
35 to 47 13 10/12.3 (0.8) 5/9.7 (0.5) 15/21.9 (0.7) 2.00
48 to 59 12 11/11.2 (1.0) 9/8.8 (1.0) 20/20.0 (1.0) 1.22
-------------------------------------------------------------------------------------
6 to 59 54 52/46.5 (1.1) 41/46.5 (0.9) 1.27
The data are expressed as observed number/expected number (ratio of obs/expect)
Overall sex ratio: p-value = 0.254 (boys and girls equally represented)
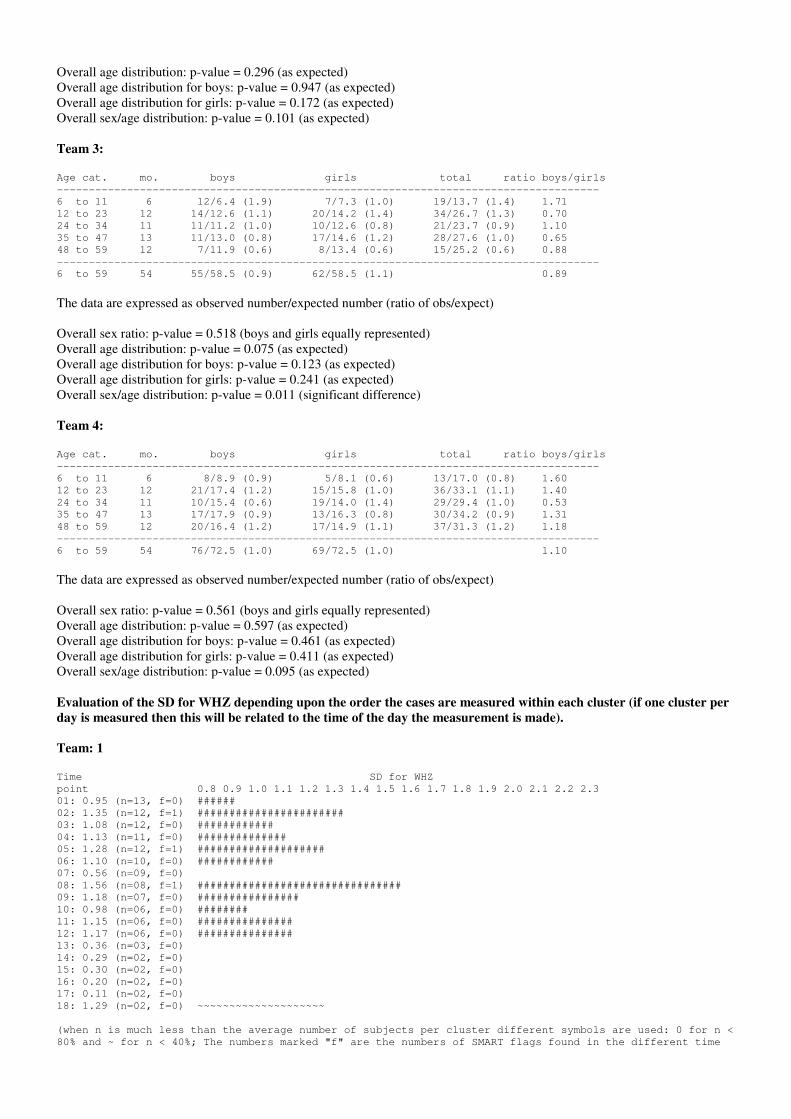
Overall age distribution: p-value = 0.296 (as expected)
Overall age distribution for boys: p-value = 0.947 (as expected)
Overall age distribution for girls: p-value = 0.172 (as expected)
Overall sex/age distribution: p-value = 0.101 (as expected)
Team 3: Age cat. mo. boys girls total ratio boys/girls
-------------------------------------------------------------------------------------
6 to 11 6 12/6.4 (1.9) 7/7.3 (1.0) 19/13.7 (1.4) 1.71
12 to 23 12 14/12.6 (1.1) 20/14.2 (1.4) 34/26.7 (1.3) 0.70
24 to 34 11 11/11.2 (1.0) 10/12.6 (0.8) 21/23.7 (0.9) 1.10
35 to 47 13 11/13.0 (0.8) 17/14.6 (1.2) 28/27.6 (1.0) 0.65
48 to 59 12 7/11.9 (0.6) 8/13.4 (0.6) 15/25.2 (0.6) 0.88
-------------------------------------------------------------------------------------
6 to 59 54 55/58.5 (0.9) 62/58.5 (1.1) 0.89
The data are expressed as observed number/expected number (ratio of obs/expect)
Overall sex ratio: p-value = 0.518 (boys and girls equally represented)
Overall age distribution: p-value = 0.075 (as expected)
Overall age distribution for boys: p-value = 0.123 (as expected)
Overall age distribution for girls: p-value = 0.241 (as expected)
Overall sex/age distribution: p-value = 0.011 (significant difference)
Team 4: Age cat. mo. boys girls total ratio boys/girls
-------------------------------------------------------------------------------------
6 to 11 6 8/8.9 (0.9) 5/8.1 (0.6) 13/17.0 (0.8) 1.60
12 to 23 12 21/17.4 (1.2) 15/15.8 (1.0) 36/33.1 (1.1) 1.40
24 to 34 11 10/15.4 (0.6) 19/14.0 (1.4) 29/29.4 (1.0) 0.53
35 to 47 13 17/17.9 (0.9) 13/16.3 (0.8) 30/34.2 (0.9) 1.31
48 to 59 12 20/16.4 (1.2) 17/14.9 (1.1) 37/31.3 (1.2) 1.18
-------------------------------------------------------------------------------------
6 to 59 54 76/72.5 (1.0) 69/72.5 (1.0) 1.10
The data are expressed as observed number/expected number (ratio of obs/expect)
Overall sex ratio: p-value = 0.561 (boys and girls equally represented)
Overall age distribution: p-value = 0.597 (as expected)
Overall age distribution for boys: p-value = 0.461 (as expected)
Overall age distribution for girls: p-value = 0.411 (as expected)
Overall sex/age distribution: p-value = 0.095 (as expected)
Evaluation of the SD for WHZ depending upon the order the cases are measured within each cluster (if one cluster per
day is measured then this will be related to the time of the day the measurement is made).
Team: 1
Time SD for WHZ
point 0.8 0.9 1.0 1.1 1.2 1.3 1.4 1.5 1.6 1.7 1.8 1.9 2.0 2.1 2.2 2.3
01: 0.95 (n=13, f=0) ######
02: 1.35 (n=12, f=1) #######################
03: 1.08 (n=12, f=0) ############
04: 1.13 (n=11, f=0) ##############
05: 1.28 (n=12, f=1) ####################
06: 1.10 (n=10, f=0) ############
07: 0.56 (n=09, f=0)
08: 1.56 (n=08, f=1) ################################
09: 1.18 (n=07, f=0) ################
10: 0.98 (n=06, f=0) ########
11: 1.15 (n=06, f=0) ###############
12: 1.17 (n=06, f=0) ###############
13: 0.36 (n=03, f=0)
14: 0.29 (n=02, f=0)
15: 0.30 (n=02, f=0)
16: 0.20 (n=02, f=0)
17: 0.11 (n=02, f=0)
18: 1.29 (n=02, f=0) ~~~~~~~~~~~~~~~~~~~~
(when n is much less than the average number of subjects per cluster different symbols are used: 0 for n <
80% and ~ for n < 40%; The numbers marked "f" are the numbers of SMART flags found in the different time

points)
Team: 2
Time SD for WHZ
point 0.8 0.9 1.0 1.1 1.2 1.3 1.4 1.5 1.6 1.7 1.8 1.9 2.0 2.1 2.2 2.3
01: 1.57 (n=16, f=2) ################################
02: 1.20 (n=14, f=0) #################
03: 0.83 (n=13, f=0) #
04: 0.85 (n=09, f=0) ##
05: 0.88 (n=08, f=0) ###
06: 0.51 (n=07, f=0)
07: 0.87 (n=06, f=0) ###
08: 0.77 (n=05, f=0)
09: 0.59 (n=03, f=0)
10: 1.64 (n=03, f=1) OOOOOOOOOOOOOOOOOOOOOOOOOOOOOOOOOOO
11: 0.30 (n=03, f=0)
12: 0.54 (n=03, f=0)
(when n is much less than the average number of subjects per cluster different symbols are used: 0 for n <
80% and ~ for n < 40%; The numbers marked "f" are the numbers of SMART flags found in the different time
points)
Team: 3
Time SD for WHZ
point 0.8 0.9 1.0 1.1 1.2 1.3 1.4 1.5 1.6 1.7 1.8 1.9 2.0 2.1 2.2 2.3
01: 1.29 (n=16, f=1) ####################
02: 1.15 (n=13, f=0) ###############
03: 0.81 (n=11, f=0)
04: 1.02 (n=11, f=0) #########
05: 0.88 (n=08, f=0) ####
06: 1.07 (n=08, f=0) ###########
07: 0.72 (n=08, f=0)
08: 0.82 (n=08, f=0) #
09: 1.39 (n=07, f=0) #########################
10: 0.73 (n=06, f=0)
11: 0.70 (n=06, f=0)
12: 1.25 (n=05, f=0) OOOOOOOOOOOOOOOOOOO
13: 1.27 (n=03, f=0) OOOOOOOOOOOOOOOOOOOO
14: 1.03 (n=02, f=0) ~~~~~~~~~
15: 0.41 (n=02, f=0)
16: 1.62 (n=02, f=0) ~~~~~~~~~~~~~~~~~~~~~~~~~~~~~~~~~~
(when n is much less than the average number of subjects per cluster different symbols are used: 0 for n <
80% and ~ for n < 40%; The numbers marked "f" are the numbers of SMART flags found in the different time
points)
Team: 4 Time SD for WHZ
point 0.8 0.9 1.0 1.1 1.2 1.3 1.4 1.5 1.6 1.7 1.8 1.9 2.0 2.1 2.2 2.3
01: 1.12 (n=18, f=0) #############
02: 0.96 (n=16, f=0) #######
03: 0.48 (n=15, f=0)
04: 1.74 (n=13, f=2) ########################################
05: 0.67 (n=12, f=0)
06: 0.51 (n=10, f=0)
07: 1.08 (n=09, f=0) ############
08: 0.76 (n=07, f=0)
09: 0.63 (n=07, f=0)
10: 1.13 (n=07, f=0) ##############
11: 1.07 (n=06, f=0) OOOOOOOOOOO
12: 0.94 (n=06, f=0) OOOOOO
13: 1.16 (n=06, f=0) OOOOOOOOOOOOOOO
14: 1.59 (n=03, f=0) ~~~~~~~~~~~~~~~~~~~~~~~~~~~~~~~~~
15: 0.74 (n=03, f=0)
16: 0.07 (n=03, f=0)
17: 1.01 (n=03, f=0) ~~~~~~~~~
(when n is much less than the average number of subjects per cluster different symbols are used: 0 for n <
80% and ~ for n < 40%; The numbers marked "f" are the numbers of SMART flags found in the different time
points)
(for better comparison it can be helpful to copy/paste part of this report into Excel)