Embed Size (px)
Citation preview
American Journal of Mechanical Engineering, 2014, Vol. 2, No. 7, 307-311 Available online at http://pubs.sciepub.com/ajme/2/7/29 © Science and Education Publishing DOI:10.12691/ajme-2-7-29
Numerical Verification of a Full-field Deformation Analysis of a Specimen Loaded by Combined Loading
Martin Hagara*, Róbert Huňady, Pavol Lengvarský, Jozef Bocko
1Department of Applied Mechanics and Mechanical Engineering, Technical University of Košice, Faculty of Mechanical Engineering, Košice, Slovakia
*Corresponding author: [email protected]
Received October 13, 2014; Revised November 03, 2014; Accepted November 27, 2014
Abstract The contribution deals with an experimental investigation of deformation fields of a specimen loaded by combined loading. The experiment was done using non-contact optical method of low-speed digital image correlation. This technique allows investigate displacement as well strain fields. The experimentally obtained results depicted in the paper in a form of color maps and graphs were verified by a numerical simulation performed in Ansys, where two types of meshing were used to demonstrate the coherence between experiment and simulation.
Keywords: digital image correlation, full-field measurement, strain, gauge
Cite This Article: Martin Hagara, Róbert Huňady, Pavol Lengvarský, and Jozef Bocko, “Numerical Verification of a Full-field Deformation Analysis of a Specimen Loaded by Combined Loading.” American Journal of Mechanical Engineering, vol. 2, no. 7 (2014): 307-311. doi: 10.12691/ajme-2-7-29.
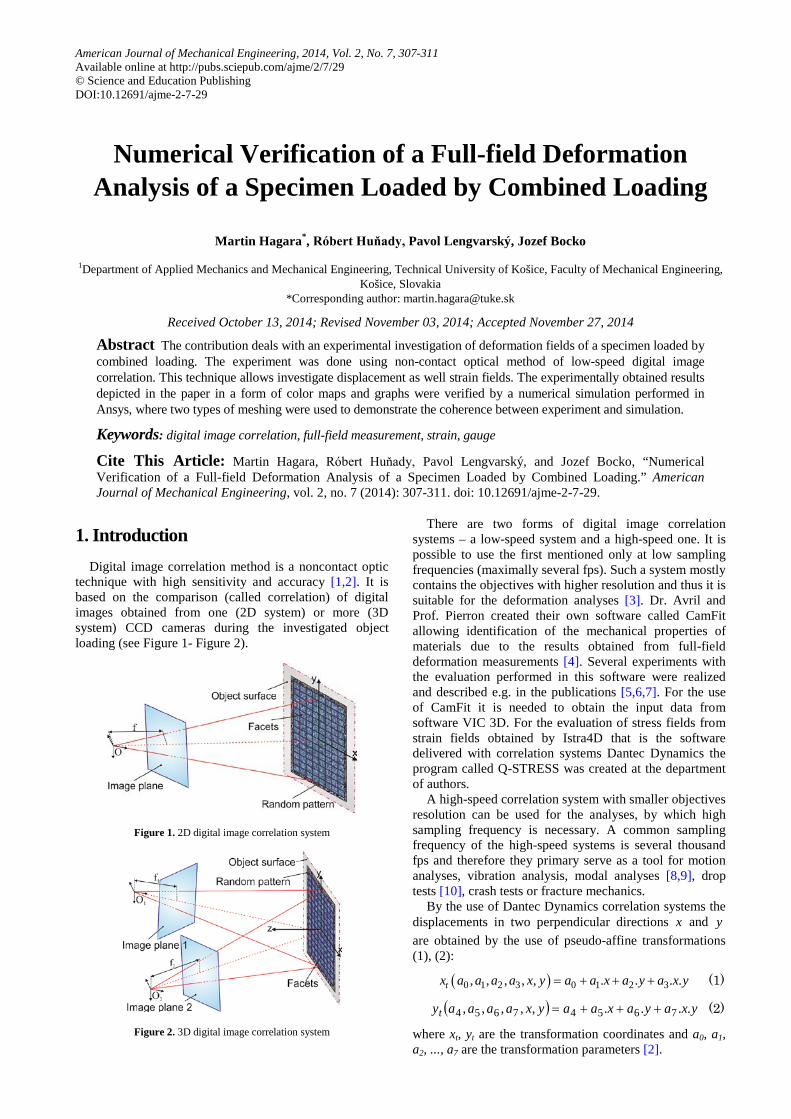
1. Introduction Digital image correlation method is a noncontact optic
technique with high sensitivity and accuracy [1,2]. It is based on the comparison (called correlation) of digital images obtained from one (2D system) or more (3D system) CCD cameras during the investigated object loading (see Figure 1- Figure 2).
Figure 1. 2D digital image correlation system
Figure 2. 3D digital image correlation system
There are two forms of digital image correlation systems – a low-speed system and a high-speed one. It is possible to use the first mentioned only at low sampling frequencies (maximally several fps). Such a system mostly contains the objectives with higher resolution and thus it is suitable for the deformation analyses [3]. Dr. Avril and Prof. Pierron created their own software called CamFit allowing identification of the mechanical properties of materials due to the results obtained from full-field deformation measurements [4]. Several experiments with the evaluation performed in this software were realized and described e.g. in the publications [5,6,7]. For the use of CamFit it is needed to obtain the input data from software VIC 3D. For the evaluation of stress fields from strain fields obtained by Istra4D that is the software delivered with correlation systems Dantec Dynamics the program called Q-STRESS was created at the department of authors.
A high-speed correlation system with smaller objectives resolution can be used for the analyses, by which high sampling frequency is necessary. A common sampling frequency of the high-speed systems is several thousand fps and therefore they primary serve as a tool for motion analyses, vibration analysis, modal analyses [8,9], drop tests [10], crash tests or fracture mechanics.
By the use of Dantec Dynamics correlation systems the displacements in two perpendicular directions x and y are obtained by the use of pseudo-affine transformations (1), (2):
( )0 1 2 3 0 1 2 3, , , , , . . . .tx a a a a x y a a x a y a x y= + + + (1)
( ) yxayaxaayxaaaayt ....,,,,, 76547654 +++= (2)
where xt, yt are the transformation coordinates and a0, a1, a2, ..., a7 are the transformation parameters [2].

American Journal of Mechanical Engineering 308
Figure 3. Transformation parameters of potential translation, stretch, shear and distortion
Transformation parameters are determined using minimization of the difference between the value of intensity in actual image ( )yxG ,2 and the previous one
( )yxG ,1 as follows:
( ) ( ) ( )( )∑ −+yx
yxtyyxtxGggyxGggaa ,
,,,2.10,11,0,7,...,0
min (3)
where g0 and g1 represents the illumination parameters [2].
2. Experimental Strain Fields Analysis of the Specimen Loaded by Combined Loading
Shape and dimensions of the analyzed specimen (Figure 4) were set in such a way that it was possible to evaluate the strain fields obtained by specimen tension loading combined with bending. The loading, which was realized in laboratory conditions, was ensured using mechanical loading system working on lever mechanism.
Figure 4. Shape and dimensions of analysed specimen
As the mentioned loading system is not able to initiate high loading force the specimen was created from PS-1 material used in PhotoStress method. Its mechanical properties are: E = 2500 MPa, η = 0,38, Rp0,2 = 80 MPa, ρ = 1280 kg.m-3.
The experiment was performed with digital image correlation system Q-400 Dantec Dynamics. This system comprises of two low-speed cameras with spatial resolution of 5 MPx (Figure 5) furnished by objectives with Schneider Kreuznach Germany lenses.
Figure 5. Low-speed CCD cameras Dantec Dynamics
The data transfer between cameras and notebook that is a control unit of the correlation system is ensured due to high-speed serial bus with IEEE 1394 interface. As the cameras do not dispose of any internal memory the cabling is connected directly to the notebook using external card FireWire800 CardBus (Figure 6). The data transfer speed is 800 Mbit/s.
Figure 6. External card FireWire800 CardBus
Synchronization of the cameras is ensured by TU-4XB box, which the cameras are connected with using coaxial cables with BNC connector. The block scheme of digital image correlation system Q-400 is depicted in Figure 7.
Figure 7. Block scheme of digital image correlation system Q-400
The basic characteristics of digital image correlation system Q-400 Dantec Dynamics used for the measurement are introduced in Table 1.
Table 1. Technical data of Q-400 Dantec Dynamics [11] Technical data Q-400
Measurement accuracy up to 1 |jm depending on measurement conditions CCD sensor resolution 5 M P x
Measuring range from 1 |jm up to several mm Measuring area commonly from 3mm x 3mm to some m2
Distance to object various depending on the size of specimen Operational modes Automatic, manual, 2D and 3D analysis
Sampling frequency max. 2 fps by automatic mode Illumination spotlight with performance of 400 W
Control device notebook with 8-cores processor, 4 GB RAM Operational system Windows 7
309 American Journal of Mechanical Engineering
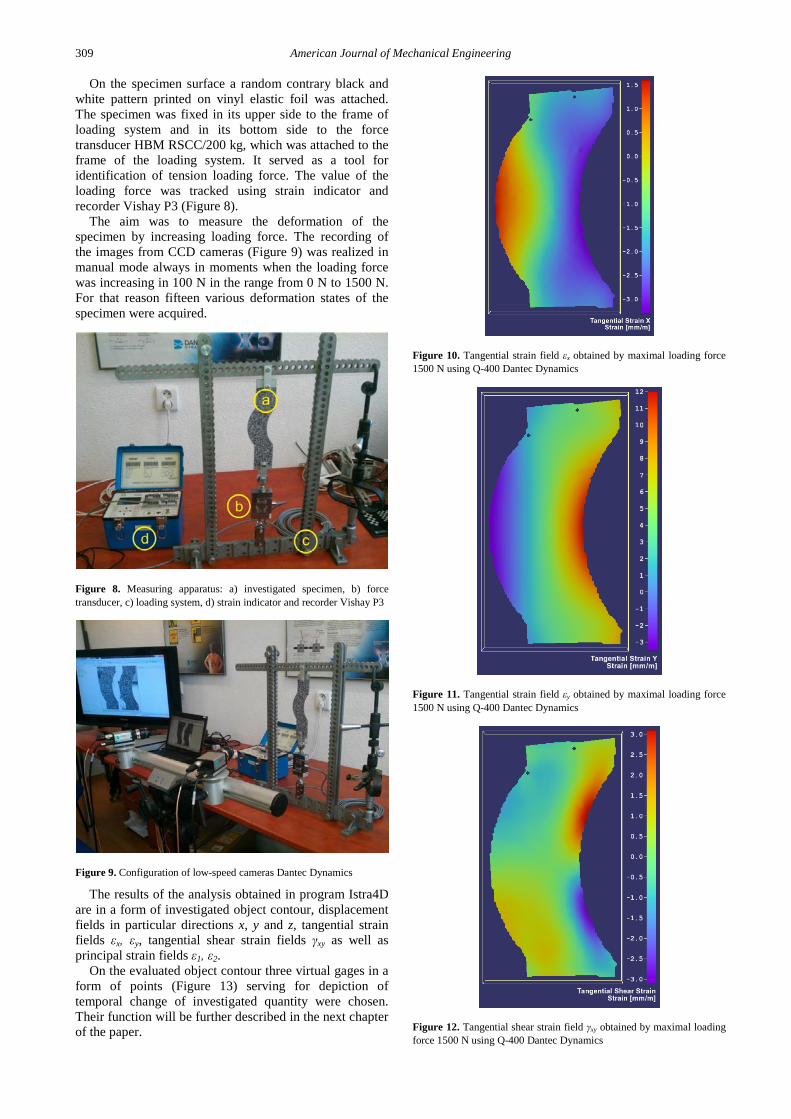
On the specimen surface a random contrary black and white pattern printed on vinyl elastic foil was attached. The specimen was fixed in its upper side to the frame of loading system and in its bottom side to the force transducer HBM RSCC/200 kg, which was attached to the frame of the loading system. It served as a tool for identification of tension loading force. The value of the loading force was tracked using strain indicator and recorder Vishay P3 (Figure 8).
The aim was to measure the deformation of the specimen by increasing loading force. The recording of the images from CCD cameras (Figure 9) was realized in manual mode always in moments when the loading force was increasing in 100 N in the range from 0 N to 1500 N. For that reason fifteen various deformation states of the specimen were acquired.
Figure 8. Measuring apparatus: a) investigated specimen, b) force transducer, c) loading system, d) strain indicator and recorder Vishay P3
Figure 9. Configuration of low-speed cameras Dantec Dynamics
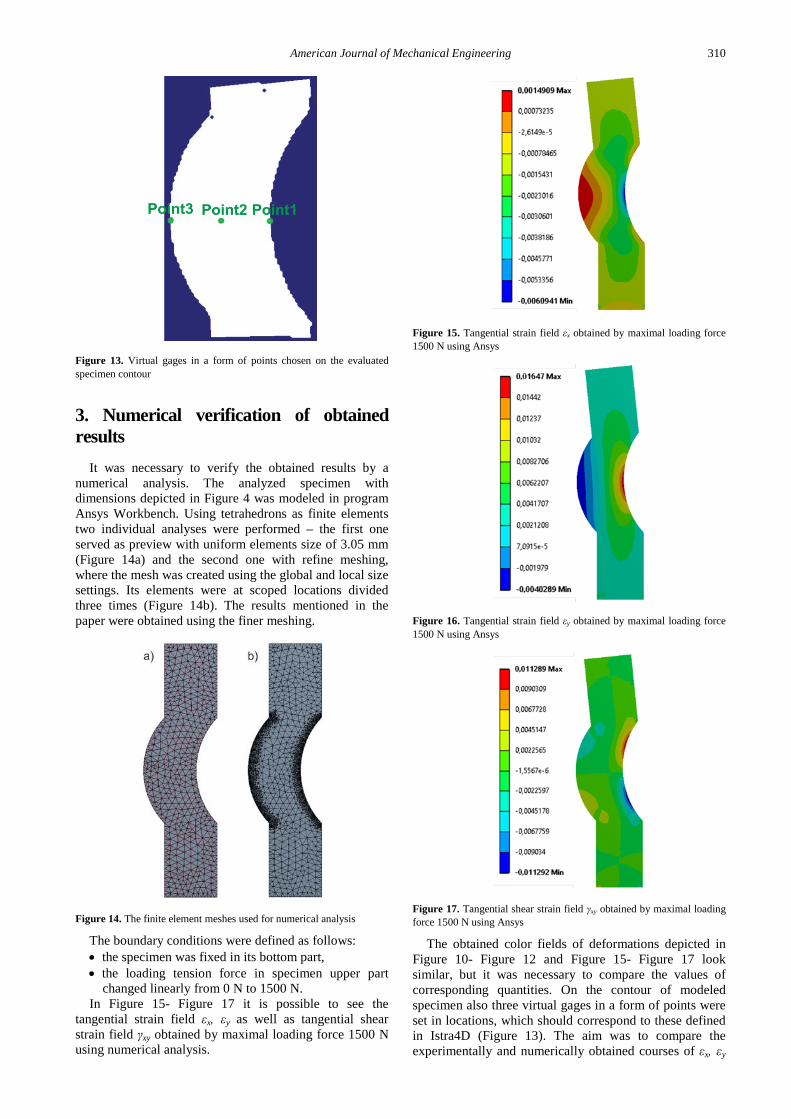
The results of the analysis obtained in program Istra4D are in a form of investigated object contour, displacement fields in particular directions x, y and z, tangential strain fields εx, εy, tangential shear strain fields γxy as well as principal strain fields ε1, ε2.
On the evaluated object contour three virtual gages in a form of points (Figure 13) serving for depiction of temporal change of investigated quantity were chosen. Their function will be further described in the next chapter of the paper.
Figure 10. Tangential strain field εx obtained by maximal loading force 1500 N using Q-400 Dantec Dynamics
Figure 11. Tangential strain field εy obtained by maximal loading force 1500 N using Q-400 Dantec Dynamics
Figure 12. Tangential shear strain field γxy obtained by maximal loading force 1500 N using Q-400 Dantec Dynamics
American Journal of Mechanical Engineering 310
Figure 13. Virtual gages in a form of points chosen on the evaluated specimen contour
3. Numerical verification of obtained results
It was necessary to verify the obtained results by a numerical analysis. The analyzed specimen with dimensions depicted in Figure 4 was modeled in program Ansys Workbench. Using tetrahedrons as finite elements two individual analyses were performed – the first one served as preview with uniform elements size of 3.05 mm (Figure 14a) and the second one with refine meshing, where the mesh was created using the global and local size settings. Its elements were at scoped locations divided three times (Figure 14b). The results mentioned in the paper were obtained using the finer meshing.
Figure 14. The finite element meshes used for numerical analysis
The boundary conditions were defined as follows: • the specimen was fixed in its bottom part, • the loading tension force in specimen upper part
changed linearly from 0 N to 1500 N. In Figure 15- Figure 17 it is possible to see the
tangential strain field εx, εy as well as tangential shear strain field γxy obtained by maximal loading force 1500 N using numerical analysis.
Figure 15. Tangential strain field εx obtained by maximal loading force 1500 N using Ansys
Figure 16. Tangential strain field εy obtained by maximal loading force 1500 N using Ansys
Figure 17. Tangential shear strain field γxy obtained by maximal loading force 1500 N using Ansys
The obtained color fields of deformations depicted in Figure 10- Figure 12 and Figure 15- Figure 17 look similar, but it was necessary to compare the values of corresponding quantities. On the contour of modeled specimen also three virtual gages in a form of points were set in locations, which should correspond to these defined in Istra4D (Figure 13). The aim was to compare the experimentally and numerically obtained courses of εx, εy
311 American Journal of Mechanical Engineering
in these specific points during the specimen loading. Mentioned courses can be seen in Figure 18-Figure 19.
Figure 18. Temporal courses of εx in defined points during the specimen loading
Figure 19. Temporal courses of εy in defined points during the specimen loading
4. Conclusions In the contribution the deformation analysis of the
specimen loaded by combined loading performed using low-speed digital image correlation system Q-400 Dantec Dynamics is described. The verification of obtained results was realized by the numerical analysis in Ansys Workbench. For the comparison three corresponding virtual gages in a form of points were chosen, in which the temporal changes of strains in x and y direction were compared. The acquired courses signify that by both methods approximately equal results were obtained. Differences occurred in the courses can be caused by
several reasons. The first reason can be that the attachment of the specimen to the loading system was not such ideal as in numerical solution. The second possibility is that the chosen points in Istra4D and Ansys did not correspond totally and also their negligible shifts could cause relatively outstanding difference in obtained results. The last reason can be the unknown factors influencing the results such as defects in material or any residual stresses generated by the preparation of the specimen.
Acknowledgement The work has been accomplished under the projects
VEGA 1/0937/12, APVV-0091-11, VEGA 1/1205/12 and KEGA 054TUKE-4/2014.
References [1] Sutton M., Orteu J.-J. and Schreier H., Image Correlation for
Shape, Motion and Deformation Measurements - Basic Concepts, Theory and Applications, Springer Science+Business Media, LLC 2009, 321 p.
[2] Siebert T., Splitthof K., Stecklum S. and Herbst Ch., New features in digital image correlation techniques, in: 22nd DANUBIA-ADRIA Symposium on Experimental Methods in Solid Mechanics, Parma : MONTICELLI TERME, 2005.
[3] Kalina M., Šimčák F., Hagara M., Schrötter M. and Štamborská M., "The use of the experimental optical technique for investigation of shear strains of the samples exposed to shear stress beyond the yield point", Procedia Engineering, Vol. 48, 264-272, 2012.
[4] Avril S. and Pierron F., "Camfit: a virtual fields method based software", in: XIth International Congress and Exposition, Florida, 1-6, 2008.
[5] Štamborská M., Losertová M., Mareš V. and Horsák L., "Stress analysis in cylindrical specimens made from 34CrMo4 using DIC", Acta Metallurgica Slovaca, Vol. 20, Issue 2, 229-235, 2014.
[6] Štamborská M., Kvíčala M. and Losertová M., "Identification of the mechanical properties of high-strength steel using digital image correlation", Advanced Materials Research, Vol. 980, 122-126, 2014.
[7] Štamborská M., Fajkoš R. and Kvíčala M., "Comparing plastic strain fields and stress fields for different directions of rolling", International Review of Mechanical Engineering, Vol. 7, Issue 7, 1384-1391, November 2013.
[8] Trebuňa F. and Hagara M., "Experimental modal analysis performed by high-speed digital image correlation system", Measurement, Vol. 50, 78-85, April 2014.
[9] Trebuňa F., Huňady R., Bobovský Z. and Hagara M., "Results and experiences from the application of digital image correlation in operational modal analysis", Acta Polytechnica Hungarica, Vol. 10, no. 5, 159-174, 2013.
[10] Trebuňa F., Hagara M. and Huňady R., "Strain Fields Identification of Chosen Cycling Helmets Types by Their Impact Loading", Acta Mechanica Slovaca, Vol. 16, no. 2, 22-30, 2012.
[11] Dantec Dynamics: Q-400 - Basics of 3D Digital Image Correlation. Dantec Dynamics Technical Note, 2008.


![GC-FID Method Development and Validation …pubs.sciepub.com/plant/2/3/2/plant-2-3-2.pdfof adulterants [4]. ... chemistry which deals with methods for determining the ... technique](https://img.dokumen.tips/doc/110x75/5b05f4967f8b9ac33f8c226f/gc-fid-method-development-and-validation-pubs-adulterants-4-chemistry-which.jpg)