Embed Size (px)
Citation preview

1
Numerical Simulation of Hydrogen Removal from Molten Steel in the
Vacuum Arc Degasser
By:
Faris Karouni
A thesis submitted in partial fulfilment of the requirements for the degree of
Doctor of Philosophy
The University of Sheffield
Department of Materials Science and Engineering
September 2018

2
ABSTRACT
Hydrogen removal from molten steel during secondary steelmaking is typically achieved by subjecting the melt to vacuum pressures together with the introduction of an argon carrier gas through a porous plug at the bottom of the ladle. The time dependent change of hydrogen content in a steel melt in a vacuum arc degasser has been predicted using a computational fluid dynamics model employing the commercial software package ANSYS Fluent.
The model is formulated using the Eulerian multiphase approach for the slag, steel and argon phases. Turbulence is modelled using the standard k-epsilon equations, and the bubble size distribution is predicted with population balance modelling. Mass transfer equations are solved for the interfacial gas-liquid hydrogen transfer over a 20-minute period of vacuum degassing. The predictive capability of the model is validated using experimental measurements obtained over a series of melts from an industrial ladle at Sheffield Forgemasters International Ltd.
The importance of incorporating the slag layer is investigated, which is found to limit the rate of hydrogen removal by creating a barrier at the gas-steel interface and interfering with the circulation flow field of the melt. Several design and operating variables are investigated for their effect on the hydrogen removal, shear stress imposed on the ladle walls and slag entrainment. Increasing the number of argon plugs at the base of the ladle from 1 to 3 distributed the gas plume across a wider horizontal cross sectional area of the ladle, producing a higher hydrogen removal rate, while reducing slag entrainment and wall shear. A mid-radial plug position at the ladle bottom maintained both a maximum hydrogen removal rate and minimum slag entrainment, although wall shear increased with increasing plug radial distance from the centre to the wall. The hydrogen removal rate was maximised with a ladle aspect ratio (bath height to diameter ratio) of 1.2 due to a combination of melt depth-dependent effects on hydrogen transfer and changes to the flow field. More slag entrainment occurred with higher aspect ratio due to the widening of the bubble plume at the free surface, and the slag entrainment was maximised at an aspect ratio of 1.2. With a reduction in inter-plug angle from 120⁰ to 45⁰ in a triple plug ladle, the bubble plumes combined and strengthened the flow field, increasing the hydrogen removal rate in addition to slag entrainment and wall shear. Increasing the argon flowrate increases the rate of hydrogen removal while increasing both slag entrainment and wall shear. Reducing the vacuum pressure of the VAD unit increases the rate of hydrogen removal while allowing a lower hydrogen content in the melt to be reached.
In summary, increases in the rate of hydrogen removal are achieved by reducing the vacuum pressure, increasing the argon flowrate, increasing the number of argon plugs, adopting a mid-radial plug radial position and adopting a ladle aspect ratio of 1.2 and inter-plug angle of 450 for the triple plug ladle.

3
PUBLICATIONS
This thesis has been presented using the alternative submission method. Some aspects of the following work have been published in peer-reviewed journals, published and presented at conferences, or presented only at conferences. These are listed below.
Journal Publications
1. Karouni, F., Wynne Bradley, P., Talamantes-Silva, J., & Phillips, S. (2018). Hydrogen Degassing in a Vacuum Arc Degasser Using a Three Phase Eulerian Method and Discrete Population Balance Model. Steel research international, 89(5), 1700550. doi:https://doi.org/10.1002/srin.201700550
2. Karouni, F., Wynne Bradley, P., Talamantes-Silva, J., & Phillips, S. (2018). Modeling the Effect of Plug Positions and Ladle Aspect Ratio on Hydrogen Removal in the Vacuum Arc Degasser. Steel research international, 89(5), 1700551. doi:https://doi.org/10.1002/srin.201700551
3. Karouni, F., Wynne Bradley, P., Talamantes-Silva, J., & Phillips, S. (2018). A parametric study on the effects of process conditions on dehydrogenation, wall shear and slag entrainment in the vacuum arc degasser using mathematical modelling. ISIJ International, 58(9), pp. 1679-1686. doi:https://doi.org/10.2355/isijinternational.ISIJINT-2018-254
Conference Publications and Presentations
1. Karouni, F., Wynne, B. P., & Talamantes-Silva, J. (2017). Mathematical Modeling and Optimization of Hydrogen Dagassing in an Argon-Stirred Ladle. Paper presented at the AISTech 2017, Nashville, Tennessee, USA. In AISTech 2017 Proceedings, pp. 1479-1490. http://digital.library.aist.org/pages/PR-372-029.htm
2. Karouni, F., Wynne, B. P., Talamantes-Silva, J., & Phillips, S. (2017). Modelling of Hydrogen Removal from Molten Steel in a Vacuum Arc Degasser. Paper presented at the 20th International Forgemasters Meeting - IFM 2017, Graz, Austria. In IFM 2017 proceedings.
Conference Presentations
1. Karouni, F. (2014). Hydrogen in steel - infiltration, degradation, measurement, and mitigation. Paper presented at the National Student Conference in Metallic Materials, Sheffield, UK.
2. Karouni, F. (2015). Computational fluid dynamics of argon bubbled molten steel in vacuum arc degasser. Paper presented at the National Student Conference in Metallic Materials, Manchester, UK.
3. Karouni, F. (2016). Fluid dynamics and hydrogen degassing in an argon-stirred steel ladle. Paper presented at the National Student Conference in Metallic Materials, Sheffield, UK.
4. Karouni, F., Wynne, B. P., & Talamantes-Silva, J. (2017). Modelling Hydrogen removal from Molten Steel in a Vacuum Arc Degasser. Paper presented at the

4
The Electric Steelmakers Guild (ESMG) 120th Technical Meeting, Outokumpu, Sheffield, Sheffield.
5. Karouni, F., Wynne, B. P., & Talamantes-Silva, J. (2017). Simulation of Hydrogen Removal in the Vacuum Arc Degasser. Paper presented at the Rolls-Royce Steels Research Meeting, Sheffield Forgemasters International Ltd. Head Office, Sheffield.
6. Karouni, F., Wynne, B. P., & Talamantes-Silva, J. (2018). Simulation of Hydrogen Removal in the Vacuum Arc Degasser. Paper presented at the Annual Postgraduate Research Symposium on Ferrous Metallurgy, Armourers' Hall, Armourers & Brasiers' Company London, Tuesday 27th February 2018, London.

5
CONTENTS
1. Introduction…………………………………………………………………………………………………….……..13
1.1. Aims and Objectives……………………………………………………………………….………..14
2. Literature Review…………………………………………………………………………………………………...16
2.1. Argon-Stirring in Secondary Steelmaking……………………………………………….…16
2.1.1. Input Energy……………………………………………………………………..……….17
2.1.2. Bubble Dynamics………………………………………………………………….……18
2.2. Mixing and Mass Transfer…………………………………………………………………………29
2.2.1. Liquid-Phase Mixing…………………………………………………………………..29
2.2.2. Gas-Liquid Equilibria………………………………………………………………….29
2.2.3. Interfacial Mass Transfer……………………………………………………………29
2.2.4. Mass Transfer Coefficient…………………………………………………………..30
2.3. Computational Fluid Dynamics………………………………………………………………...31
2.3.1. Types of Multiphase CFD………………………………….………………………..31
2.3.2. Turbulence……………………………………………………………………….……….32
2.3.3 Population Balance Model……………………………………………………..…..33
2.4. Modelling of Ladles…………………………………………………………………………….…...35
2.4.1. Overview of CFD Models……………………………………………………….…..35
2.4.2. Input Energy and Ladle Dimensions……………………………………………36
2.4.3. Single Plug Arrangement……………………….……………………….………….39
2.4.4. Multi Plug Arrangement ……………………………………………….…...……..39
2.4.5. Slag Layer………………………………………………..………………………....…….40
2.4.6. Mass Transfer………………………………………………………………………..….44
2.5. Basis for Research…………………………………………………………………………………….48
3. Numerical Approach……………………………………………………………………………………….………49
4. Results ……………………………………………………………………………………………………………………55
4.1. PAPER 1 - Hydrogen Degassing in a Vacuum Arc Degasser Using a Three-Phase Eulerian Method and Discrete Population Balance Model………..............57
4.2. PAPER 2 - Modeling the Effect of Plug Positions and Ladle Aspect Ratio on Hydrogen Removal in the Vacuum Arc Degasser…………………………………….........78

6
4.3. PAPER 3 - A parametric study on the effects of process conditions on dehydrogenation, wall shear and slag entrainment in the vacuum arc degasser using mathematical modelling………………………………………………………………..…..….96
5. Supplementary Results and Analysis………………………………………………………………….….115
5.1. Presence of Slag Layer………………………………………………………………………….…115
5.2. Number of Argon Plugs…………………………………………………………………..………118
5.3. Radial Position of Argon Plugs……………………………………………………..………….126
5.4. Ladle Aspect Ratio………………………………………………..…………………………….….129
5.5. Argon Plug Angle……………………………………………………………………………….…..134
5.6. Vacuum Pressure……………………………………………………………………………….…..135
5.7. Industrial Implications……………………………………………………………………..…….143
6. Conclusions and Future Work…………………………………………………………………………..…..145
6.1. Conclusions……………………………………………………………………………………...……145
6.2. Future Work……………………………………………………………………………………….….146
7. Appendix………………………………………………………………………………………………………………147
7.1. User Defined Functions…………………………………………………………………….…….147

7
LIST OF TABLES
Literature Review
Table 1 - Summary of CFD studies on gas-stirred ladles. Numerical Approach Table 2 - Description of computational meshes used in sensitivity study. Table 3 - List of PBM bin sizes for 5, 10, 15 and 20 bin simulations. Results Table 4 – List of Simulation Cases
Paper 1 - Hydrogen Degassing in a Vacuum Arc Degasser Using a Three‐Phase Eulerian Method and Discrete Population Balance Model
Table 1 - Chemical composition of steel along with corresponding interaction coefficients according to experimental data
Table 2 - Physical properties of different phases and operating conditions of the VAD unit.
Table 3 - Geometric comparison of SFIL ladle with validation cases of Sheng and Anagbo.
Table 4 - Hydrogen content in molten steel before and after 20 min degas measured by HYDRIS probe and predicted by model
Paper 2 - Modeling the Effect of Plug Positions and Ladle Aspect Ratio on Hydrogen Removal in the Vacuum Arc Degasser
Table 1 - Physical properties of multiphase system
Table 2 - Governing equations for multiphase flow in the vacuum arc degasser
Table 3 - Interfacial force terms for Eulerian model
Table 4 - Governing equations for hydrogen transport model
Table 5 - Hydrogen interaction coefficients for alloying elements in liquid steel
Paper 3 - A parametric study on the effects of process conditions on dehydrogenation, wall shear and slag entrainment in the vacuum arc degasser using mathematical modelling
Table 1 - Formulation of flow, mass transfer and bubble size model equations.
Table 2 - Interaction parameters of elements in molten steel.
Table 3 - Ladle geometry, material properties and standard operating conditions of vacuum arc degasser.

8
LIST OF FIGURES
Literature Review
Figure 1 – Overview of steelmaking process.
Figure 2 – Cross sectional illustration of gas-stirred ladle.
Figure 3 – Bubble shapes as a function of Reynolds and Weber number based on the
bubble terminal velocity.
Figure 4 – Variation of bubble size with vertical position in Szekely experiments.
Figure 5 – Mixing time as a function of specific input energy for range of surface
pressures.
Figure 6 – Change in ratio of localised/mean specific input energy with distance from
free surface, h, for range of surface pressures.
Figure 7 – Anagbo experiments showing (a) discrete (Q=200cm3s-1), (b) incipient
coalescence (Q=600 cm3s-1), (c) fully developed coalescence bubble flow regimes
(Q=1200 cm3s-1).
Figure 8 – Dependence of bubble flow regime on pore diameter of porous plug.
Figure 9 – Gas fraction distribution from Iguchi experiments, compared with Anagbo correlation for range of pore diameters.
Figure 10 – Bubble distribution in air-water model of Iguchi over bath pressures (50,
100 and 200kPa).
Figure 11 – Change in hydrogen concentration in melt approaching the steel-gas
interface, adapted from Banneberg.
Figure 12 – Comparison of experimentally measured to Mazumdar correlation over a
range of gas flowrates.
Figure 13 – Change in mixing time with bath height from experiments of Ghosh.
Figure 14 – Total specific kinetic energy in water phase as a function of specific input
rate, by Mazumdar and Nakajima.
Figure 15 - Flow reversal at slag eye, taken from Mazumdar et al.
Figure 16 - Effect of chamber pressure on CO2 desorption from NaOH solution
Q=0.4L/min, from Guo et al.
Figure 17 – Effect of gas flowrate on CO2 desorption from NaOH solution P=25kPa,
units of Q = L/min from Guo et al.
Numerical Approach
Figure 18 – Flowchart of numerical solver.

9
Figure 19 – Vertical velocity profiles for each of the four meshes in Table 1. Figure 20 – Sauter Mean Bubble Size Distribution along vertical cross sectional plane of SFIL ladle.
Figure 21 – Sauter Mean Bubble Size Distribution along vertical cross sectional plane of (a) single axisymmetric, (b) double plug and (c) triple plug ladles.
Supplementary Results
Figure 23 – Melt velocity field distribution for (a) slag-free and (b) slag-containing cases along symmetry plane.
Figure 24 – Mass transfer coefficient distribution for (a) slag-free and (b) slag-containing cases along symmetry plane.
Figure 25 – Interfacial hydrogen transfer rate distribution for (a) slag-free and (b) slag-containing ladle melts along symmetry plane.
Figure 26 – Interfacial hydrogen transfer rate distribution for (a) single, (b) double, and (c) triple plug ladles along horizontal cross sectional plane at height of 0.9L.
Figure 27 – Melt velocity field distribution for (a) single, (b) double, and (c) triple plug ladles along horizontal cross sectional plane at height of 0.9L.
Figure 28 - Change in the slag entrainment fraction with the number of argon plugs.
Figure 29 – Isosurface of slag volume fraction=0.01 for (a) single, (b) double, and (c) triple plug ladles.
Figure 30 – Maximum wall shear and wall shear area integral for varying number of plugs.
Figure 31 - Wall shear stress distribution for (a) single, (b) double, and (c) triple plug ladles.
Figure 32 - Change in the slag entrainment fraction with the radial position of a single argon plug.
Figure 33 - Isosurface of slag volume fraction=0.01 for single plug of (a) axisymmetric, (b) 0.5R and (c) 0.8R radial position.
Figure 34 – Maximum wall shear and wall shear area integral for single plugs of varying radial position.
Figure 35 - Wall shear stress distribution for single plugs with (a) axisymmetric, (b) 0.5R and (c) 0.8R radial positions.
Figure 36 – Melt velocity field distribution for (a) AR=1.6 and (b) AR=1.2, and (c) AR=0.8 along symmetry plane.
Figure 37 – Interfacial hydrogen transfer rate distribution for (a) AR=1.2 and (b) AR=1.6 along symmetry plane.
Figure 38 - Change in the slag entrainment fraction with the ladle aspect ratio for a two plug system.
Figure 39 - Isosurface of slag volume fraction=0.01 for double plug ladle with (a) AR=1.6, (b) AR=1.2 and (c) AR=0.8.

10
Figure 40 – Maximum wall shear and wall shear area integral for double plugs of varying ladle aspect ratios.
Figure 41 - Wall shear stress distribution for (a) AR=0.8, (b) AR=1.2 and (c) AR=1.6.
Figure 42 – Melt velocity field distribution for triple plug ladles along horizontal cross sectional planes at (a) 0.2L, (b) 0.5L, and (c) 0.9L.
Figure 43 – Melt velocity field distribution for triple plug ladles with (a) θ=120° and (b) θ=45°.
Figure 44 – Interfacial hydrogen transfer rate distribution for triple plug ladles with (a) θ=45° and (b) θ=120° along horizontal cross sectional plane at vertical height of 0.9L
Figure 45 - Change in the slag entrainment fraction with the plug angle for a three plug system.
Figure 46 - Isosurface of slag volume fraction=0.01 for (a) θ=45° and (b) θ=120°.
Figure 47 – Maximum wall shear and wall shear area integral for triple plugs of varying plug angles.
Figure 48 - Wall shear stress distribution for triple plug angle with (a) θ=45° and (b) θ=120°.
Figure 49 – Removal Ratios for ladle design and operating conditions.
Paper 1: Hydrogen Degassing in a Vacuum Arc Degasser Using a Three‐Phase Eulerian Method and Discrete Population Balance Model
Figure 1: Vacuum pressure and argon flowrate variation over degassing cycle.
Figure 2: a) Schematic representation of ladle at SFIL illustrating cross sectional planes and geometric dimensions from b) side view (Plane 1) and c) bottom view.
Figure 3: Simulation of Sheng and Irons experiments for a) Vertical velocity profile and b) Gas fraction profile along vertical position of plume centerline, Simulation of Anagbo and Brimacombe experiments for c) bubble diameter along vertical position of plume centerline, and Sensitivity of predicted bubble size along vertical position of plume centerline in SFIL ladle to d) Number of size bins and e) Initial bubble size.
Figure 4: Molten steel flow field and hydrogen distribution across side profile plane
(Plane 1) after 20 min of vacuum degassing for a) slagless and b) slag‐containing melt, Volume fraction of slag eye viewed from top profile plane (Plane 2) after 20 s of argon stirring for argon flowrates of a) 170, b) 237, and c) 305 NL min−1.
Figure 5: Slag eye diameter as a function of argon flowrate predicted by model and compared with experimental correlation of Peranandhanthan and Mazumdar.
Figure 6: Comparison of measured and predicted final hydrogen content in steel after 20 min of vacuum degassing for a series of melts of varying initial hydrogen content.
Paper 2: Modeling the Effect of Plug Positions and Ladle Aspect Ratio on Hydrogen Removal in the Vacuum Arc Degasser
Figure 1: Argon plug arrangement on ladle baseplate.

11
Figure 2: The effect of the number of argon plugs on a) hydrogen distribution in melt after 20 min degas and melt velocity field, b) t1.5, c) average melt velocity as a function of vertical position for single (axisymmetric), dual plug (θ = 180°, 0.5R), triple plug (θ = 120°, 0.5R) layouts.
Figure 3: The effect of ladle aspect ratio for single, double (θ = 180°, 0.5R) and triple (θ = 120°, 0.5R) plugs layouts on a) hydrogen distribution in melt after 20 min degas and melt velocity field, b) t1.5, c) average melt velocity for double plug (θ = 180°, 0.5R) ladle as a function of vertical position.
Figure 4: The effect of single, double (θ = 180°) and triple (θ = 120°) plug radial position on a) hydrogen distribution in melt after 20 min degas and melt velocity field, b) t1.5, c) average melt velocity as a function of vertical position for single plug.
Figure 5: The effect of double (0.5R) and triple (0.5R) plug angle on a) hydrogen distribution in melt after 20 min degas and melt velocity field, b) t1.5, c) average melt velocity as a function of vertical position for triple plug.
Paper 3: A parametric study on the effects of process conditions on dehydrogenation, wall shear and slag entrainment in the vacuum arc degasser using mathematical modelling
Figure 1: Computational mesh and porous plug arrangement on base plane of ladle.
Figure 2: Effect of argon flowrate on hydrogen removal ratio over 20 minutes of degassing.
Figure 3: Effect of argon flowrate on hydrogen decay profile over 20 minutes of degassing.
Figure 4: Slag volume fraction contour and steel velocity vector plot across vertical plane after the first minute of degassing.
Figure 5: Slag entrainment and interface velocity as a function of argon flowrate.
Figure 6: Wall shear contour plot (Pa) for argon flowrates of 13, 20 and 29 Nm3hr-1.
Figure 7: Maximum wall shear force and wall shear area integral as a function of argon flowrate.
Figure 8: Effect of vacuum pressure on hydrogen removal ratio over 20 minutes of degassing.
Figure 9: Effect of vacuum pressure on decay profile over 20 minutes of degassing.
Figure 10: Change in equilibrium concentration as a function of vertical position along plume centreline after the first minute of degassing.
Figure 11: Change in hydrogen content in gas phase as a function of vertical position along plume centreline after the first minute of degassing.
Figure 12: Hydrogen transfer rate in melt across vertical plane as a function of vacuum pressure after the first minute of degassing.

12
ACKNOWLEDGEMENTS
I would like to thank my supervisor Prof. Brad Wynne for providing continuous feedback, support
and advise throughout my PhD project. I would also like to thank Prof. Jesus Talamantes-Silva
and Stephen Phillips for their supervision and support. Finally, I would like to thank the
Engineering and Physical Sciences Research Council and Sheffield Forgemasters International
Ltd for their financial support.

13
1. INTRODUCTION
Steelmaking is the set of processes involved in converting molten pig iron and/or scrap steel to
steel of specific composition. The main stages are divided into primary steelmaking, secondary
steelmaking and casting, as summarised in Figure 1.
Figure 1 – Overview of steelmaking process.
Primary steelmaking is generally performed using one of two well established routes: basic
oxygen steelmaking (BOS) or electric arc furnace (EAF) processes. In the BOS approach, scrap
steel is placed in a refractory lined vessel followed by carbon-rich molten pig iron. High purity
oxygen is then blown from a lance into the surface region of the melt, converting it to steel by
the exothermic oxidation of chemical elements, e.g. carbon, phosphorous, manganese and
silicon. Gaseous CO and CO2 are removed for further processing while the other oxides are
dissolved with fluxes, such as lime, to form a liquid slag layer at the melt surface, in effect
trapping the unwanted elements away from the newly formed liquid steel. The EAF process uses
scrap steel and/or direct reduced iron (DRI) rather than molten iron as raw materials. Thermal
energy is supplied via graphite electrodes, striking an arc that melts the scrap metal and DRI.
Oxygen is then injected into the furnace to generate oxides and slag formers are added to trap
the non-gaseous oxides in a similar fashion to BOS.
Once the temperature and chemistry of the primary steel melt are correct it is tapped (poured)
into a refractory lined ladle, within which several refining operations are performed, which are
collectively referred to as secondary steelmaking. The purpose of secondary steelmaking is to
lower the nitrogen, oxygen, hydrogen, sulphur, nitrogen and phosphorus content to levels

14
dictated by customer requirements, optimise the chemical composition of steel through
chemical additions, and maintain a suitable temperature before casting. A slag of customised
chemical composition is also synthesised on top of the melt, acting as an impurity sink and
playing a key role in deoxidation, desulphurisation and inclusion control. The slag also provides
insulation, reducing heat loss from the underlying steel.
To ensure good mixing in the secondary ladle, an inert gas such as argon is injected through a
plug at the base of the ladle, homogenising the melt as well as helping promote various slag-
metal and gas-metal reactions. This leads to a temperature drop and to prevent freezing and
ensure the steel is at the optimum temperature for casting the steel is periodically reheated by
lowering graphite electrodes into the melt. The steel is then cast into solid form, either by direct
pouring (known as teeming) into a mould to form an ingot or via continuous casting into slabs,
blooms and billets.
In the present study the focus is on the removal of hydrogen during ladle refining. Hydrogen is
detrimental to the mechanical properties of steel, contributing to reduced ductility and lowered
fatigue resistance1. Hydrogen is picked up during steelmaking from the addition of damp
charging materials2 and exposure of steel to water vapour in the air from ladle tapping. It
diffuses at a fast rate through the melt due to its low atomic mass. Upon solidification, the
solubility of hydrogen in steel decreases3 and any excess hydrogen dissolved in the steel forms
gaseous, molecular hydrogen4, which accumulates in pores forming pinholes and blowholes,
leading to failure either during manufacture or under standard in-service conditions4.
Hydrogen is removed from molten steel during secondary steelmaking by placing the argon-
stirred ladle within a vacuum chamber. This provides the thermodynamic conditions that favour
the transport of monatomic hydrogen (H) from the steel into the bubbles (or free surface of the
bath) and recombination into molecular hydrogen (H2). A reduction in the partial pressure of
hydrogen in the bubbles is accompanied by a reduction in the solubility of hydrogen in the steel.
This process, known as degassing, can be achieved in several types of ladle configuration. The
two most common are a stirred-tank design known as the vacuum arc degasser (VAD), and one
that adopts an additional circulation system with a snorkel, known as the Rurhstahl-Heraeus (RH)
degasser. The VAD system is the subject of this research.
1.1. Aims and Objectives
The aim of this thesis is to develop a numerical model to predict hydrogen removal from molten
steel in the VAD unit for a given ladle geometry and set of operating conditions.
Computational fluid dynamics (CFD) has proven to be a valuable theoretical tool for studying
gas-stirred ladles5. The aim of this work is to develop a CFD model of the VAD process and
identify methods for the optimisation of hydrogen removal. The proposed approach extends the
capability of previous degassing models32,72 by incorporating the interaction of the slag layer
with the melt. This is achieved by solving a full set of Eulerian transport equations for each of
the slag, steel and argon phases in the ladle to predict the time-dependent change of hydrogen
content in the melt. This is coupled to a bubble population balance model (PBM) for the
calculation of the bubble-steel interfacial area. Hydrogen concentration measurements taken
from an industrial sized vacuum arc degasser at Sheffield Forgemasters International Ltd. using
the hydrogen immersion method (HYDRIS) are compared to the results from the model for
validation purposes. The model is then deployed to investigate the effect of a series of ladle
designs and operating conditions on the rate of hydrogen degassing.
The thesis is structured as follows. First a review of the existing literature is presented (Chapter
2). Details of the numerical approach are found in Chapter 3. This is followed by the results

15
chapters (Chapters 4.1-4.3). For each results chapter, a journal paper is attached as an inset (for
which permission has been obtained from the relevant journals to include the papers in this
thesis), in combination with supplementary results (Chapter 5). Finally, conclusions and
recommendations for future work are made (Chapter 6). The three results chapters are divided
as follows:
1. Description of the mathematical model, validation with industrial data, and simulation
of slag layer effects.
2. Study of Ladle Design Variables, including the effects of ladle aspect ratio, number of
argon plugs, and plug positions on the rate of hydrogen removal.
3. Study of Operating Conditions, including the effects of argon flowrate and vacuum
pressure on the rate of hydrogen removal.

16
2. LITERATURE REVIEW
The literature review is divided into sections covering the governing principles of argon stirred
ladles and CFD, as well as a review of the experimental and modelling work and its analysis
related to the aims and objectives of this thesis. Firstly, the fundamentals of gas-stirring in ladles
are introduced (Chapter 2.1), including the concept of the input energy. The regimes of bubble
discharge, shape and size distribution are summarised, with particular focus on the effects of
the vacuum chamber pressure on bubble dynamics. The theoretical concepts of mixing and mass
transfer, gas-liquid equilibria and mass transfer are explained in Chapter 2.2. The underlying
physics of CFD is then outlined (Chapter 2.3), including turbulence modelling and population
balance modelling of bubble size distribution within gas-liquid flows, followed by a review of
existing modelling approaches of gas-stirred ladles. The results of experimental and theoretical
models of ladles in the literature are analysed. The effect of several variables such as argon plug
arrangement, the number of plugs, argon flowrate, and the presence of a buoyant slag on ladle
mixing performance and mass transfer processes are highlighted (Chapter 2.4). Studies focussing
on the removal of hydrogen from molten steel are then explored. The key findings of the
literature review are then summarised. Key subject areas requiring further work are then
identified, which leads to justification of the research undertaken within this thesis (Chapter 2.5).
2.1. Argon Stirring in Secondary Steelmaking
Argon is purged through the steel melt via an injection device at the base of the ladle. The two-
phase region comprising the upward flowing argon containing bubbles and surrounding liquid is
known as the ‘plume’, Figure 2. The bubbles induce motion of the liquid phase, which flows
vertically upwards with the bubbles in the plume (with a velocity of ulp), then recirculates in the
surrounding region, forming loops.

17
Figure 2 – Cross sectional illustration of gas-stirred ladle4.
2.1.1. Input Energy
The forces acting within the ladle can be summarised as: buoyant forces of the bubbles, inertial
force of the liquid motion, surface forces of the top of the bath and the shear forces at the ladle
wall. These can be parametrised using dimensionless variables such as the Froude number4,
which is the ratio of inertial to gravitational forces
Fr=Up
2
gH (1)
where the Up=average plume rise velocity, g=gravitational acceleration and H=bath height.
The energy provided by the injected gas phase can be quantified by the specific input energy, 𝜀,
wherein the temperature (T) and pressure (P) are taken into account, in addition to the gas
flowrate, due to their effect on bubble expansion. By taking the logarithmic mean values of the
gas flowrate and pressure, Ghosh4 defines the amount of energy provided by the bubbles per
unit volume as
εm=340QTl
Mln(1+0.707
H
P0) (2)
where M=mass of melt, Tl=melt temperature, Q=gas flowrate and P0=surface pressure.
Mazumdar6 studied the modes by which this input energy is dissipated within the ladle. Of the
total specific energy input, 10-30% goes to turbulence in the liquid, with the remainder going
into bubble slippage within the plume, surface waves, and wall friction. Additional dissipation
occurs in the presence of a slag layer, which contributed to 10% of the total.

18
There are significant challenges in measuring the flow field of molten steel due to its visual
opacity and harsh operating conditions. Experimental data is instead obtained from reduced-
scale physical models of ladles conducted at room temperature. Water is typically used as the
liquid phase, as its kinematic viscosity (7x10⁻⁷ m2s-1) is similar to that of molten steel (1x10⁻⁶ m2s-
1). For a physical model to be reflective of a full-scale ladle system it should obey dynamic
similarity criterion to ensure that forces act at corresponding times and locations in both
systems. It can be shown that this implies equivalence in the Reynolds (ratio of inertial to viscous
forces) and Froude numbers4. In reality it is difficult to maintain similarity across both Reynolds
and Froude numbers without significantly changing the material properties. Hence, in Froude-
dominated flows (high buoyant input energy/gas flowrate), the Froude number is used as the
sole similarity criterion4.
2.1.2. Bubble Dynamics
The surface area of the gas-liquid interface is a key variable governing the rate of hydrogen transfer from the melt. By assuming a spherical bubble shape, this area is relatable to the bubble diameter (db) via the surface area to volume ratio via A = 6αg db⁄ (3)
where αg is the volume fraction of the gas phase in a given volume.
The theoretical prediction of db within the ladle bath requires knowledge of the physical phenomena governing bubble dynamics, which involve several important considerations. From the moment of injection, the bubbles may vary in size over the course of their motion through the ladle. Bubbles are also influenced by the surface pressure and can behave differently under vacuum than atmospheric7,8. While the study of single bubbles is a useful foundation for understanding their behaviour in a ladle bath, groups of bubbles exhibit unique features and therefore the mutual interaction requires additional consideration. This section will outline attempts to model bubble size distribution in steelmaking ladles. (a) Gas Fraction The properties of bubble swarms that constitute the two-phase plume can be characterised using void fraction (gas fraction). The radial distribution of gas fraction in a nozzle injector ladle can be described by the following correlation produced via empirical regression9:
α
αmax=exp (-0.7 (
r
rαmax/2)
2.4
) (4)
where rαmax/2 is the radial distance at which the gas fraction is equal to half its maximum value. This produces a bell-shaped curve that is narrower than a Gaussian distribution. A Gaussian type distribution was also identified for porous plug-generated flows10. The vertical gas fraction distribution in a porous plug injector ladle is described by
αmax=0.71 [z
(Q2 g⁄ )0.2]-0.9
(5)
where z is the vertical position11.

19
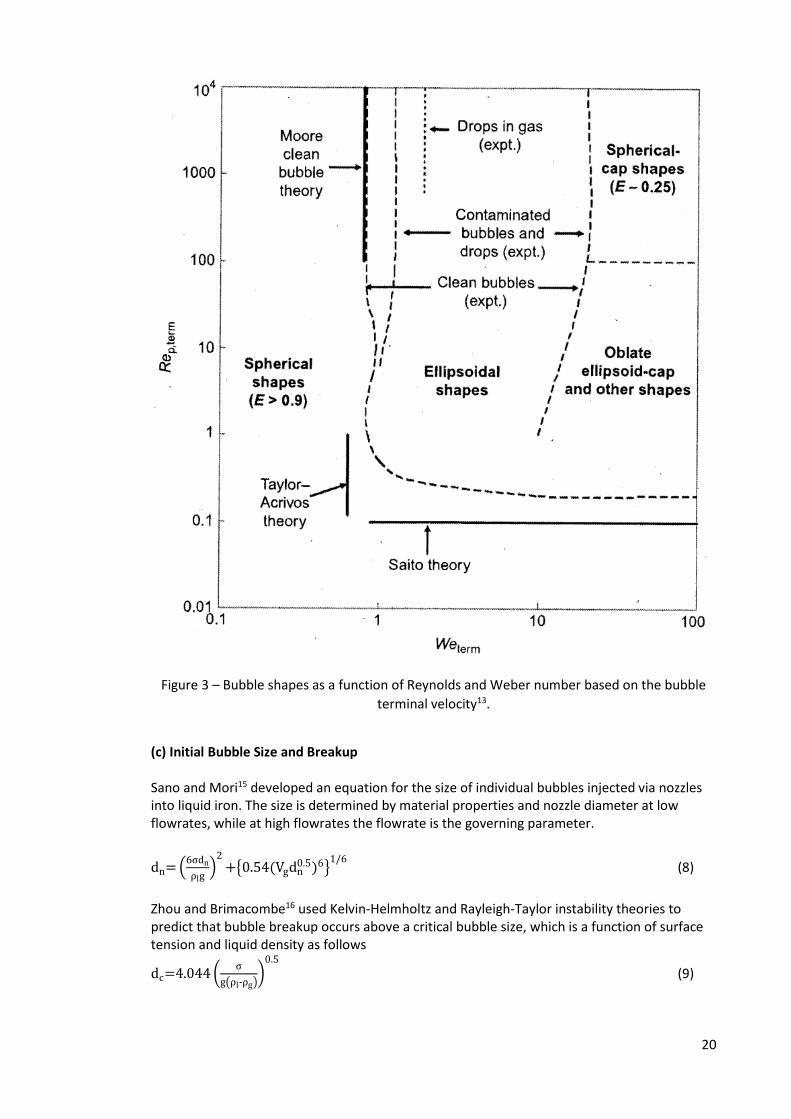
(b) Bubble Shape Bubbles adopt a spherical shape when the surface tension is high enough to stabilise the bubble relative to the disruptive action of the drag force. This ratio is encapsulated by the Weber number,
We=ρldbub
2
σ (6)
Bubbles rising due to buoyancy in a liquid medium experience considerable inertial forces, which leads to deformation. Based on experimental observations, bubbles are generally classified into three shapes under a given set of conditions. These are: spherical, ellipsoidal, and spherical-cap shaped12. The particular shape of a single bubble can be conveniently identified based on the Weber and Reynolds numbers (Figure 3) in the bubble-liquid system13, where
Re=ρldbub
μl (7)
If the Weber number is sufficiently high, then as the bubble size is increased (also causing Reynolds number increase) it will transform from a sphere to an ellipsoid, and finally to a spherical-cap. Under typical ladle stirring operations, the Weber and Reynolds numbers are sufficiently high (≈102 and ≈104 respectively14) to place the bubbles within the spherical cap shaped regime. This bubble shape has also been experimentally observed under vacuum pressures7.
20
Figure 3 – Bubble shapes as a function of Reynolds and Weber number based on the bubble
terminal velocity13.
(c) Initial Bubble Size and Breakup Sano and Mori15 developed an equation for the size of individual bubbles injected via nozzles into liquid iron. The size is determined by material properties and nozzle diameter at low flowrates, while at high flowrates the flowrate is the governing parameter.
dn= (6σdn
ρlg)
2+{0.54(Vgdn
0.5)6}1/6
(8)
Zhou and Brimacombe16 used Kelvin-Helmholtz and Rayleigh-Taylor instability theories to predict that bubble breakup occurs above a critical bubble size, which is a function of surface tension and liquid density as follows
dc=4.044 (σ
g(ρl-ρg))
0.5
(9)
21
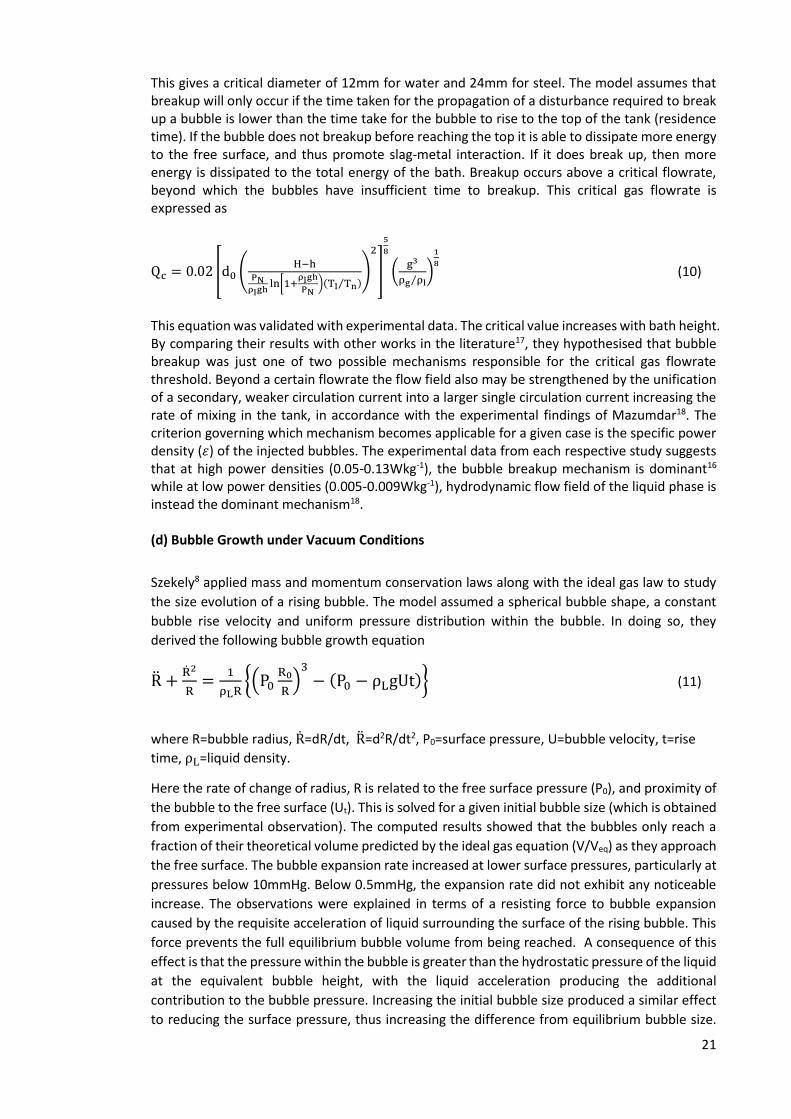
This gives a critical diameter of 12mm for water and 24mm for steel. The model assumes that breakup will only occur if the time taken for the propagation of a disturbance required to break up a bubble is lower than the time take for the bubble to rise to the top of the tank (residence time). If the bubble does not breakup before reaching the top it is able to dissipate more energy to the free surface, and thus promote slag-metal interaction. If it does break up, then more energy is dissipated to the total energy of the bath. Breakup occurs above a critical flowrate, beyond which the bubbles have insufficient time to breakup. This critical gas flowrate is expressed as
Qc = 0.02 [d0 (H−h
PNρlgh
ln[1+ρlgh
PN)(Tl Tn⁄ )
)
2
]
5
8
(g3
ρg ρl⁄)
1
8 (10)
This equation was validated with experimental data. The critical value increases with bath height. By comparing their results with other works in the literature17, they hypothesised that bubble breakup was just one of two possible mechanisms responsible for the critical gas flowrate threshold. Beyond a certain flowrate the flow field also may be strengthened by the unification of a secondary, weaker circulation current into a larger single circulation current increasing the rate of mixing in the tank, in accordance with the experimental findings of Mazumdar18. The criterion governing which mechanism becomes applicable for a given case is the specific power density (𝜀) of the injected bubbles. The experimental data from each respective study suggests that at high power densities (0.05-0.13Wkg-1), the bubble breakup mechanism is dominant16 while at low power densities (0.005-0.009Wkg-1), hydrodynamic flow field of the liquid phase is instead the dominant mechanism18. (d) Bubble Growth under Vacuum Conditions
Szekely8 applied mass and momentum conservation laws along with the ideal gas law to study
the size evolution of a rising bubble. The model assumed a spherical bubble shape, a constant
bubble rise velocity and uniform pressure distribution within the bubble. In doing so, they
derived the following bubble growth equation
R +R2
R=
1
ρLR{(P0
R0
R)
3
− (P0 − ρLgUt)} (11)
where R=bubble radius, R=dR/dt, R=d2R/dt2, P0=surface pressure, U=bubble velocity, t=rise
time, ρL=liquid density.
Here the rate of change of radius, R is related to the free surface pressure (P0), and proximity of
the bubble to the free surface (Ut). This is solved for a given initial bubble size (which is obtained
from experimental observation). The computed results showed that the bubbles only reach a
fraction of their theoretical volume predicted by the ideal gas equation (V/Veq) as they approach
the free surface. The bubble expansion rate increased at lower surface pressures, particularly at
pressures below 10mmHg. Below 0.5mmHg, the expansion rate did not exhibit any noticeable
increase. The observations were explained in terms of a resisting force to bubble expansion
caused by the requisite acceleration of liquid surrounding the surface of the rising bubble. This
force prevents the full equilibrium bubble volume from being reached. A consequence of this
effect is that the pressure within the bubble is greater than the hydrostatic pressure of the liquid
at the equivalent bubble height, with the liquid acceleration producing the additional
contribution to the bubble pressure. Increasing the initial bubble size produced a similar effect
to reducing the surface pressure, thus increasing the difference from equilibrium bubble size.

22
These results were mirrored by experimental observations of a single bubble rising inside a thin
mercury film filling a thin layer between two plexiglass plates. Equation 11 has been adopted
into multiphase CFD models of the Rheinsahl-Heraeus (RH) degassing unit19-22. The equation,
however, does not take into account bubble-bubble interactions or liquid-bubble interactions in
the form of turbulent eddies, and bubble swarms were not tested experimentally. Szekely23
subsequently adapted Equation 11 to take into account the effect of mass transfer on bubble
size. This was investigated experimentally with n-pentane as the solute transferring from the
solvent, N-tetradecane into rising helium bubbles. The original bubble growth equation was
supplemented with an additional term and the molar content present in the ideal gas equation
(N) was recast in the form of its time derivative. The mass transfer coefficient (k) was calculated
using Higbie’s equation24, while a uniform distribution of solutes was assumed across the melt,
which is equivalent to infinite mixing. The resulting differential equation is
[Pt + ρg(h0 − h) +4σ
3R+ RR +
3
2R2] R −
RρgU
3= kRT(Cb − Ci) (12)
with the rising velocity, U is expressed by Basset’s equation,
dU
dt+
3U
R
dR
dt+
3CDU
4R− 2g = 0 (13)
After validating the theoretical model with experimental data, it was applied to the geometry
and conditions of a vacuum degasser with nitrogen uptake into the bubbles. The results
demonstrated that surface kinetics and liquid inertia significantly reduce the bubble growth rate
(Figure 4).
The associated effect of reduced chamber pressure on the flow field between 100-700Torr (133-
933mbar) was studied experimentally by Tatsuoka7. Although the mixing time decreased with
pressure, upon reaching 7mbar, further pressure reductions had a minimal impact between 100-
700Torr (Figure 5). This was explained by the majority of bubble expansion occurring in the final
100mm (25%) of the ascent to the free surface (bath depth=400mm). Theoretically, ε is the work
done by the gas over the entire bath volume. If instead the work is calculated over a localised
region of bubble rising distance (h and h-∆ℎ) the equation becomes
εlocal= lim∆h→0
{nRT
A∆hln (
P0+ρgh
P0+ρg(h-∆h))} =
nRT
A×
ρg
P0+ρgh (14)
As h decreases (nearer to the surface), 𝜀𝑙𝑜𝑐𝑎𝑙
ε increases, particularly as the pressure is reduced,
as shown in Figure 6. Therefore, at low pressures most of the input energy is selectively
expended at the free surface instead of across the entire volume of the melt. The traditional
relationship of energy input to mixing time (t ∝ ε-n) therefore breaks down under conditions
where the pressure is reduced below ≈700Pa.
(e) Regimes of Discharge The presence of bubbles in the melt is best analysed by first considering the mechanism of bubble discharge from the injector into the base of the ladle. Empirical tests have been performed to understand the dynamics of bubbles, such as the bubble frequency, size, and variation in size as a function of time7,11,25. This was the subject of physical modelling by Brimacombe9 and Anagbo11, who analysed the two phase plume of an air-water tank using nozzle and plug bubble injection devices, respectively. The distribution of the gas fraction throughout the tank was measured using a double-contact electro resistivity sensor. Plugs tend to produce finer bubbles than nozzles due to the multiple channels through which bubbles are formed11, although the propensity for the production of larger bubbles is sensitive to operating

23
conditions, as will be discussed later in further detail. Water tends to be used as a room temperature analogue for molten steel, which happens to exhibit a similar Weber number and kinematic viscosity to steel. Having said this, bubbles detach less readily into molten steel than water due to the former behaving in a non-wetting manner4. This means that it is more likely for bubbles to coalesce prior to the moment of discharge in steel than in water.
Figure 4 – Variation of bubble size with vertical position in Szekely23 experiments.

24
Figure 5 – Mixing time as a function of specific input energy for range of surface pressures7.

25
Figure 6 – Change in ratio of localised/mean specific input energy with distance from free
surface, h, for range of surface pressures7.
Bubbles interact with one another in a complex manner. They can join together in a process known as coalescence, or alternatively breakup into smaller bubbles. There are several causes of bubble breakup, such as density differences between bubble and liquid causing perturbations at the interface (Rayleigh Taylor instability), in addition to deformation caused by shear forces and turbulence12. These processes may, in turn, affect the level of intensity that the bubbles are able to impose on mixing the liquid phase, and so it is of critical importance to understand the governing mechanisms. Three distinct bubble size regimes are formed in the ladle, depending on gas flowrate, according
to an air-water study on porous plug injection (Q=200-1200 cm3s-1) by Anagbo11. At Q=200cm3s-
1, bubbles with a near uniform size distribution are formed at the point of injection and rise with
a near constant size distribution to the free surface (the discrete regime). At Q=600cm3s-1,
however, coalescence begins to occur. First, gas pockets are formed which are surrounded by
discrete bubbles. Then, At Q=1200cm3s-1, a large gas envelope covers the plug surface, which
then breaks down into smaller bubbles above the plug (Figure 7). This behaviour has been
confirmed in subsequent experiments by Guo and Irons26. In both cases of coalescence, the
mean bubble size increased in the vicinity of the plug, and then gradually reduced with
increasing vertical position as the bubbles disintegrated11. In all cases the gas velocity also
reduced with vertical height. The bubble breakup process has been found to occur at a faster
rate with nozzle25 compared to plug11 injection, which Anagbo11 attributes to the reduced
turbulence levels produced during plug injection.

26
Figure 7 – Anagbo11 experiments showing (a) discrete (Q=200cm3s-1), (b) incipient coalescence
(Q=600 cm3s-1), (c) fully developed coalescence bubble flow regimes (Q=1200 cm3s-1).
Castillejos9 observed the breakup phenomena in nozzles in the coalescent regime as follows. As
a bubble detaches from a nozzle, there is a visible depression at its base caused by a newly
released upstream bubble rising up and colliding with it9. The two bubbles then coalesce
together, before disintegrating into a jet of bubbles with a range of sizes. With increasing vertical
position, a relatively constant log-normal bubble size distribution is formed.
Iguchi27 found using a physical water model that the gas flowrate corresponding to the transition
point between each of the bubble regimes depends on the pore diameter (dpm) of the plug
(Figure 8). Between dpm = 5x10⁻⁶ and 100x10-6 metres there was no major change in the
transition line. Above 100x10-6 metres, the transition from the low to medium flowrate regimes
decreased, while the transition from the medium to high flowrate regimes increased. Overall
this resulted in an overall widening of the medium flowrate range. The authors suggested that
as the distance between pores is reduced, the rate of bubble coalescence at the plug nozzles
increases. Moreover, the discrete regime arises12 when the bubble Reynolds number is less than
300, where
Reb =ρldb(ub−ul)
μl (15)
where ��𝑏,𝑙=mean rising velocity of bubble/liquid and ��𝑏=mean bubble diameter. The bubbles then begin to rise in a zig-zag path, before the bubble wake begins to experience
turbulent motion at 𝑅𝑒𝑏 ≈ 400, at which the bubble trajectory becomes more complex and
coalescence occurs. As the pore diameter is increased, the overall gas fraction distribution is
increased, although this effect became less pronounced as higher flowrates. An empirical
correlation27 relating the gas fraction to the gas flowrate and vertical position in the tank is
plotted alongside the Anagbo11 correlation in Figure 9. By contrast, the bath pressure had a
minimal effect on both the transition zones gas fraction distribution in the ranges tested (50-
200kPa), as shown in Figure 10. This was explained in terms of the fact that the modified Froude
numbers considered (which depend on the gas density, and in turn on the bath pressure), were

27
relatively low (0.005-10), and the pressures were probably not low enough for a noticeable
change to be recorded.
Figure 8 – Dependence of bubble flow regime on pore diameter of porous plug27.
Figure 9 – Gas fraction distribution from Iguchi27 experiments, compared with Anagbo11
correlation for range of pore diameters.

28
Figure 10 – Bubble distribution in air-water model of Iguchi27 over bath pressures (50, 100 and
200kPa).

29
2.2. Mixing and Mass Transfer
The rate of ladle refining processes depends on: (a) chemical kinetics, and (b) mixing in the melt.
Mixing itself is governed by three simultaneous mechanisms: bulk convection, turbulent
diffusion, and molecular diffusion.
2.2.1. Liquid-Phase Mixing
The efficiency of mixing has traditionally been measured using tracer analysis. A tracer is injected
into a fixed position of in the vessel. Measurement probes are stationed around the vessel,
which record the tracer concentration over time, using techniques such as electrical conductivity.
The tracer diffuses and is transported by convection around the bath. Over time, the tracer
concentration reaches a well-mixed, equilibrium value. A cut off point of 95% of this value is
used as a time metric to quantify mixing, known as the 95% mixing time, 𝜏95.
2.2.2. Gas-Liquid Equilibria
The reversible transfer of atomic hydrogen dissolved in molten steel to gaseous molecular
hydrogen is described by the equation
[H] ⇌1
2H2 (16)
The equilibrium constant for the reaction is expressed via Sievert’s Law as
KH =fHCH,eq
pH20.5 (17)
where fH = activity coefficient of hydrogen for a dilute multicomponent system according to
Henry’s Law, CH,eq= hydrogen concentration in equilibrium with gas phase and pH2= partial
pressure of hydrogen in the gas phase4.
Furthermore, from the property of thermodynamic equilibrium
KH = exp(−∆G0/RT) (18)
where the standard Gibbs free energy, ∆G0 = 36485 + 30.46T, T = melt temperature and
R=ideal gas constant.
Combining Equations 45 and 46 gives the equilibrium hydrogen concentration, CH,eq in the form
CH,eq =pH2
0.5KH
fH=
exp(−∆G0/RT)
fH√pH2
(19)
The value of fH depends on the interaction of chemical solutes in the melt (Z) and is calculated
via
logfH = ∑ eHZ [%wtZ] (20)
where eHZ is the interaction coefficient corresponding to each solute.
2.2.3. Interfacial Mass Transfer
The factors affected the rate of hydrogen removal from molten steel are (a) liquid-phase mixing
to transfer H from bulk steel to steel-gas interface, (b) chemical reaction at interface converting
H to H2, (c) transfer of H2 from interface into the bubble. Step (a) is considered the rate-limiting
step28. Assuming that the chemical reaction (Equation 16) occurs at the gas-liquid interface and
operates at thermodynamic equilibrium, the interfacial mass transfer flux (J) can be expressed
as

30
J = Aκ(CH,int − CH,eq) (21)
where A=steel-gas interfacial area, κ =mass transfer coefficient and CH,int =hydrogen
concentration at steel-gas interface, as shown in Figure 11.
Figure 11 – Change in hydrogen concentration in melt approaching the steel-gas interface,
adapted from Banneberg29.
2.2.4. Mass Transfer Coefficient
An appropriate expression for the mass transfer coefficient (k) must be specified. For a mobile
gas-liquid interface in which there is continuous transfer (renewal) of liquid over the bubble
surface, the mass flux can be calculated by averaging Fick’s Law of diffusion over a time interval
up to the renewal time.
κ = 2√D
πτr (22)
Higbie24 defined the renewal time (τr) resulting from laminar flow as
τr =urel
db (23)
where urel=relative velocity between phases and db=bubble size.
For turbulent flow, Lamont30 suggested that the renewal depends on small scale eddies, giving
κ = K√D (𝜀
υ)
0.5 (24)
where K=scaling factor, υ is the kinematic viscosity of the liquid and 𝜀 is the turbulence
dissipation rate of the liquid.
A scaling factor value of K=0.3 was found to conform to experimental data for bubble columns
by Wang31, who postulated that groups of bubbles produce a lower mass transfer coefficient

31
than single bubbles due to their interaction with one another. This particular value of K has been
validated against experimental data for hydrogen removal from molten steel in a subsequent
study32.
2.3. Computational Fluid Dynamics
Mathematical models allow the prediction of the hydrodynamics within a ladle, which can in
turn be related to the efficiency of mass transfer operations such as hydrogen degassing. In
contrast to industrial trials and laboratory-scale (physical) models, theoretical models offer
three key advantages: (a) flexibility to test a wide range of flow conditions that can be
experimentally difficult or impossible to replicate, (b) ability to quantify output variables (flow
field, concentrations of species) across an entire geometry and within small time intervals, (c)
mitigation of energy, capital and operating costs associated with conducting expensive
experiments.
Computational fluid dynamics (CFD) is a method whereby the flow equations for a physical
system are discretised onto a grid (or mesh) of control volumes and solved using numerical
methods, subject to a given set of boundary conditions. The fundamental equations for a viscous
fluid flow derived via the principles of mass and momentum conservation are known as the
Navier-Stokes equations (NSE). By taking volume integrals of the NSE and then converting them
into surface integrals, the flux across each control volume boundary is calculated. This is known
as the finite volume method.
2.3.1. Types of Multiphase CFD
CFD models have been increasingly popular in simulating gas-liquid flows such as those
encountered in ladles. Such systems comprising more than one phase are referred to as
multiphase flows, and require advanced solution methods due to the coupling between phases.
A comparison of different multiphase CFD models of gas-stirred ladles are outlined below,
followed by a more detailed description of the Eulerian approach adopted in this work, and
finally concluding with coupling procedures for mass transfer modelling of hydrogen removal.
There are 4 main methods for solving the multiphase CFD equations: a) quasi-single phase, b)
Euler-Lagrange (EL), c) volume of fluid (VOF), and d) Eulerian. The quasi-single phase (QS)
method is the simplest CFD approach5. The transport equations are only solved for gas-liquid
mixture, rather than for each separate phase. It the most computationally efficient approach
among the four CFD methods. A key limitation of this approach, however, is that the gas volume
fraction in the bubble plume must be known a priori to solve the equations. In reality the gas
fraction is a function of the bubble size distribution and flow field, and can vary due to process
conditions and ladle geometry. Therefore, the flexibility of the QSP method is limited to
simplified ladle designs for which reliable empirical correlations already exist. In the Euler-
Lagrange (EL) approach the liquid phase is solved using the fixed (Eulerian) reference frame
while an ordinary differential equation (ODE) is solved for the trajectory of bubbles in the moving
(Lagrangian) reference frame33-36. For the volume of fluid (VOF) method, a single Eulerian
momentum equation is solved for the mixture and phases are not allowed to interpenetrate.
The interface is resolved by a continuity equation for volume fraction of each phase20,37. The
Eulerian method (also known as Euler-Euler) solves a separate set of Eulerian transport
equations for each phase. It is obtained from an ensemble averaging procedure on single phase
equations. Separate phases are allowed to interpenetrate, and phase interactions are modelled
using additional source terms to the momentum equation (Equation 25).

32
IFqq
Tqqq,effqqqqq
qqqFguupuu
t
u
(25)
where αq=volume fraction of phase q, ρ=density, u=velocity, p=pressure, μeff=effective
viscosity, t=time and FIF=interfacial force terms38. The terms on the right hand side of the Equation 25 represent the pressure gradient, viscous
stresses, gravitational force and interfacial forces respectively.
2.3.2. Turbulence
The flow of liquid steel within a ladle may exhibit a highly complex pattern containing swirling
currents known as ‘eddies’. Such flows are characterised as turbulent, which is typically
correlated with the ratio of inertial to viscous forces (Reynolds Number). Applying the Navier
Stokes Equations to such systems is referred to as direct numerical simulation (DNS). In practice
the non-linear form of the equations results in sensitivity to small changes in boundary
conditions and the need for a sufficiently fine mesh to resolve the Kolmogorov (smallest) eddy
length scales, which can drop below 1mm in size under ladle refining conditions4. Under
turbulent flow conditions, the velocity at any point in the flow field is subject to random
fluctuations over the course of time. The simulation time step must be small enough that
motion within each mesh cell occurs on a length scale smaller than the cell size. Pfleger and
Gomes39 showed that Eulerian solutions to the NSE for an air-water bubble column exhibit
chaotic behaviour. Inclusion of turbulence modelling (see below) improved the predictions,
mimicking the periodicity in the in the fluid velocity profile, which resulted from the movement
of the bubble plume.
Alternatives to DNS include the large eddy simulation (LES) method. This involves filtering out
eddies below a certain size by applying a filter kernel function on the NSE35,40. A more
computationally efficient method, however, is the Reynolds-Averaged Navier Stokes (RANS)
approach, whereby the NSE is decomposed into its mean and fluctuating components, as
described above. This introduces a new term known as the Reynolds stress tensor, which is an
unknown quantity. This can be modelled directly in the form of the Reynolds Stress Model (RSM).
However, this model is computationally expensive. For further reading on RSM, the reader is
directed to the book by Davidson41 who explains this method in detail. One way of addressing
this complexity is to decompose the velocity in the NSE using statistical methods, into its mean
(u) and fluctuating (u') components. In Cartesian coordinates, the velocity in the x direction is
ux=ux+u'x (26)
with equivalent expressions for the y and z direction components of the velocity vector,
respectively.
Large eddies in the flow field derive their kinetic energy from the mean flow and transmit their
energy down to eddies of ever smaller sizes, ending with those on the Kolmogorov length scale,
the size of which is inversely proportional to the Reynolds number and is on the order of 1mm
in secondary steelmaking operations4. The total turbulent kinetic energy provided by all eddies
is defined as
k = 0.5[ux′2 + uy
′2 + uz′2 ] (27)
In the Boussinesq approach the Reynolds stress tensor is formulated as a function of the eddy
viscosity and the mean strain rate. The eddy viscosity is an additional component to the
molecular viscosity that is a product of turbulence. Unlike the molecular viscosity, the eddy

33
viscosity depends not just on the material properties of the fluid, but also on the level of
turbulence within the given system. Methods for defining it can involve algebraic approaches or
partial differential equations (PDEs). The k-epsilon model42 uses the latter approach. A closure
scheme for the RANS equations is obtained by defining the eddy viscosity in terms of two
additional quantities – the turbulence kinetic energy (TKE), k and dissipation rate, ε.
2
qT
kC (28)
These are, in turn, related to the length scales of turbulence and the model uses the assumption
of isotropic, fully developed turbulence.
k and ε are then described by the partial differential equations:
kklllkll
k
Tlllll
lll SGGkkut
k
(29)
S)CGC(
ku
tll2kl
l
lll
Tlllll
lll (30)
Schwarz and Turner43 found good experimental agreement of the k-ε model with experimental
data when the standard model constants of Launder42 were used. The vertical velocity and
turbulent kinetic energy predictions matched closely with the experiments of Mazumdar18. The
additional contribution to liquid phase turbulence due to the gas bubbles rising is known as
bubble induced turbulence (BIT). Appropriate modelling of this term in the Eulerian approach
has been shown to improve prediction of the turbulent kinetic energy38,44, thus reducing the
mean liquid velocity in the bubble plume.
2.3.3. Population Balance Model
The discrete population balance model has been applied for the prediction of the surface area of the bubble/melt interfacial area (Equation 21) for the hydrogen transport equations. The main principles of this method will be outlined, leading to the equations and explanation of the derivation. If the range of bubble sizes comprising the bubble size distribution (BSD) is discretised into a set of sizes, i, the volume fraction of i is
1N,...1,0i,VN iii (31)
where the total number of bubbles per unit volume in the ith size range Ni, depends on number density function, n
1i
i
V
Vi dV)t,V(n)t(N (32)
The population balance equation (PBE) describes the evolution of the bubble number density function across space and time45
cbrkcbrk DDBB)t,V(n
t
V)t,V(un
t
)t,V(n
(33)

34
(a) Bubble Breakage
Bbrk and Dbrk are the birth and death terms corresponding to bubbles of volume V’ breaking into bubbles of volume V.
The Luo breakup model46 assumes isotropic turbulence and binary breakup. The latter assumption implies that bubbles breakup into two smaller bubbles, so that a given bubble does not breakup more than once at any instant in time.
The number of child bubbles produced by the parent bubble (2 for binary breakage), probability
density function and breakage frequency are p, )'VV( and τ(V’), respectively
'dV)'V(n)'VV()'V(pBV
brk
(34)
)V(n)V(Dbrk (35)
The breakage kernel ΩBR (m-3s-1) is related to the probability an eddy has the kinetic energy greater to or equal than that required to break a bubble of size (volume), V’ into two daughter bubbles of size, V.
If the eddies reach a bubble of size V’ at a frequency of τ(V′) with a probability distribution function β(V|V′), then
ΩBR = β(V|V′)τ(V′) (36)
Only eddies that are smaller than the bubble size can produce these oscillations that cause breakup. The larger eddies on the other hand do not deform the bubbles but transport them around the vessel by convection.
The general form of the breakup kernel is obtained by integration over the dimensionless eddy size, ξ = l L⁄ ,
dd047.2
]1)5.01(5.0[12exp
1
L923.0)V,'V(
3532811
32321
Ll 311
231
2brkmin
(37)
where α=gas volume fraction, ε=turbulence dissipation rate and σ=gas/liquid surface tension.
(b) Bubble Aggregation
Bc and Dc correspond to the birth and death terms rate due to aggregation of bubbles of volume V-V’ and volume V’.The aggregation kernel, ac (m3s-1) is the product of the binary collision frequency for bubbles of volume Vi and Vj , ωc(Vi,Vj) and collision probability λc,
'dV)'V(n)'VV(n)'V,'VV(a5.0BV
0
c (38)
'dV)'V(n)V(n)'V,V(aD0
c
(39)
)V,V()V,V(a jicjicc (40)
where
ijjijic unn)LL(4
(41)
The characteristic velocity of bubble collision,

35
5.032
j
32
i
31ij LL43.1u (42)
5.0
3ji
5.0lg
23ji
2ji
c We)LL1()5.0(
)LL(1)LL(175.0exp (43)
with Weber number
2
ijil uLWe (44)
The sauter mean diameter is given by
2ii
3ii
SMLN
LNd
(45)
2.4. Modelling of Ladles
This section contains a summary of previous research into various ladle design variables, including both experimental and CFD studies. The section starts with the application of CFD to gas-stirred ladles (2.4.1), before outlining studies that investigate the effect of various parameters on ladle mixing time (2.4.2-2.4.5). Finally, the application of CFD to mass transfer processes is highlighted (2.4.6).
2.4.1. Overview of CFD Models
Hydrogen degassing falls within the framework of general processing operations of gas-stirred ladles. It is therefore natural to start the literature review with a summary of previous studies on gas-stirred ladles. This is a field of research that has been studied over recent decades using both physical models and computational models, boosted in capability by developments in computing power over time. A summary of the CFD studies on gas-stirred ladles published since the review paper by Mazumdar and Guthrie6 published in 1995 is shown in Table 1. Each study is classified by the parameters investigated, CFD method, bubble size prediction method and treatment of the slag layer. The parameters investigated include the fluid dynamics (FD), mass transfer (M), temperature (T) and slag layer behaviour (S). The CFD methods include the Eulerian (E), Volume of Fluid (VOF), Euler-Lagrange (EL) and Quasi Single phase (QS) methods. The bubble size methods include a constant assumption, ordinary differential equations (ODE), coalescence algorithms (CBA), interface tracking (IT), population balance models (PBM) and interfacial area concentration models (IAC). The slag layer is listed as a phase (P), chemical specie (s), or has been excluded (none).

36
Table 1 – Summary of CFD studies on gas-stirred ladles.
Parameters Investigated
CFD Method
Bubble Size
Slag Layer
Year Reference Number
S E Constant s 1996 71
M EL Constant none 2000 26
FD QS ODE none 2000 21
FD QS ODE none 2001 22
M E Constant s 2001 28
FD EL+QS Constant P 2005 36
S VOF IT P 2008 72
FD EL CBA s 2011 64
FD, M, T E Constant none 2011 55
FD E Constant none 2013 38
FD EL CBA P 2013 33
M E IAC none 2013 32
FD E PBM P 2015 15 (Paper 3)
S, M VOF IT P 2016 37
S EL CBA P 2016 35
FD E Constant none 2016 19
S EL Constant P 2017 34
FD EL ODE P 2017 20
FD, S EL CBA P 2017 56
2.4.2. Input Energy and Ladle Dimensions
Mazumdar18 produces an empirical correlation relating the mixing time in an axisymmetric ladle
to the ladle dimensions and specific input energy of the gas phase (ε) via
τm=37ε-1/3R5/3L-1 (46)
where, R=vessel radius and L=liquid bath height.
This dependence of τ95 on Q-0.34 was found to conform to experimental data above a certain
flowrate threshold. Below the threshold, the dependence switched to Q-0.48 (Figure 12). The
authors suggested that the transition of the liquid flow field from two flow loops to a single flow
loop was responsible for the transition. The applicability of Equation 46 is consequently confined
to flows for which ε > 6 x 10³ Wkg-1.

37
Figure 12 – Comparison of experimentally measured to Mazumdar18 correlation over a range
of gas flowrates.
According to Ghosh47, mixing time decreases as the height-to-diameter ratio (H/D) of the bath
increases. This does not continue indefinitely, with a minimum mixing time reached at a given
H/D value, after which the mixing time begins to increase again as shown in Figure 13. The
authors ascertained from observation of the plume that multiple circulation loops arose with
increasing bath height and the swirling of the plume caused bubbles to disperse over a wider
area, in a manner that is characteristic of bubble columns. The onset of multiple loops ultimately
limited the efficiency of convective mixing, thus increasing the mixing time. The precise value
for the optimal H/D value (for the minimum mixing time) varies across different studies, with
1.0, 1.2 and 1.5 suggested by Helle48, Cloete33 and Turoglu49, respectively.

38
Figure 13 – Change in mixing time with bath height from experiments of Ghosh47

39
2.4.3. Single-Plug Arrangement
An important avenue of research in the design of gas-stirred ladles has been the optimisation of
argon plug position. In single plug ladles, the plug position can be axisymmetric (central) or offset
from the centre (eccentric) at a given radial distance from the centre. Several studies50,51 have
indicated that the mixing time is reduced with eccentric (as opposed to axisymmetric) plug
positioning. The flow field arising from an axisymmetric plug comprises several loops that
surround the central two-phase plume. With an eccentric plug the flow forms a single loop
which spreads across the height and diameter of the tank. Though the axial and radial
momentum reduces, there is a strengthening of the angular momentum51. The flow field in the
eccentric case appears to be stronger in the lower sections near the base, which is an area of
weaker flow in the axisymmetric case50. The mixing performance of an eccentric plug therefore
exceeds that of an axisymmetric plug. Experimental velocity profiles obtained by Xie et al52 have
shown that the eccentric plug induces a current in the liquid phase that inclines in the direction
of the wall and is elliptic in shape. The superior mixing performance obtained by placing porous
plugs eccentrically has been confirmed by several studies51,53,54, with minimal mixing times
reported at radial positions of 0.5R51 or 0.67R55. The increase in mixing time occurring as the
plug position exceeds 0.5R was explained as being due to the distortion of the plume, bubble
slippage and the drag force exerted on the wall51, all of which dissipated some of the buoyancy
energy from the bubbles.
2.4.4. Multiple Plug Arrangement
The design of the ladle baseplate allows for the introduction of multiple argon plugs. The
distribution of argon through more than one plug leads to variation in the distribution of bubbles
in the bath, the liquid flow pattern and overall mixing characteristics. Studies investigating the
effects caused by the number of plugs typically employ a constant overall flowrate for
comparative purposes, whereby the total volume of argon entering the ladle per unit time is
conserved.
Liu et al56 and Chattopadhyay et al57 found lower mixing times were obtained with two plugs
compared to one. The lowest mixing times have been obtained with mid-radial (0.5R) plug
positions58, and plug angles of 45° 58 or 60° 59. Mazumdar and Mandal60 have compared single to
double plug systems using physical modelling. Beyond a critical flowrate (12Lmin-1), the dual
plug was shown to give lower mixing times than the single plug. The transition corresponds to
the onset of the inertial force dominated (Froude regime) flow regime (ε > 0.007 Wkg-1). With
the introduction of a third plug, the mixing time reduces further, according to Cloete33. Roth61
found that an added benefit of dividing the argon through multiple plugs was the reduction of
wave formation at the free surface of the liquid bath, which leads to splashing onto the ladle
freeboard. Thus, despite the evident benefits to mixing provided by increased argon flowrate,
there is likely to be an upper limit that is dictated by surface disturbances. The inverse
relationship between the number of plugs and mixing time identified by the above studies has
however been disputed by Maldonado-Parra et al55, Conejo et al62 and Zhu et al63, who found an
increase in mixing time accompanied an increase in the number of plugs.
Other studies64,65 have found the relationship between mixing time and the number of plugs for
a given system to be highly sensitive to the gas flowrate and plug positions, with a complex
interaction between the different variables. Liu et al64 found that the effect of flowrate on mixing
time for dual plug ladles is influenced by the particular range of argon flowrate under
consideration. For low flowrates (< 300Lmin-1) the mixing time did not diminish with flowrate.
Above this threshold flowrate, the mixing time began to reduce with flowrate. This was
attributed to the increasing level of slag-metal interactions with flowrate that dissipates the

40
input energy of the bubble plume, along with the presence of dead zones under low flowrates
which disappear at increasing flowrates. Furthermore, the operating argon flowrate range also
impacted on the mixing efficiency of different plug angles. Under low gas flowrates (below that
at which eye formation occurred), the 90° plug angle was less efficient than 180°, whereas the
opposite was true at higher flowrates64. The flowrate also impacts on the optimal plug radial
position according to Conejo et al62 with 0.5R favoured at low flowrates, and 0.67R favoured at
high flowrates (for a plug angle of 180°), which was confirmed by Haiyan et al66. The optimal
plug position is further influenced by the plug angle67, with 0.55R favoured at 45° and 0.70
favoured at 180° (regardless of flowrate). Conversely, the plug radial position also impacts on
the flowrate-induced effect on the mixing time, according to Terrezas. When r/R is between 0.5-
0.85R, further reductions in the mixing time were negligible when the flowrate was increased.
Furthermore, when r/R was increased beyond 0.5 the mixing time increased (Terrezas and
Haiyan et al66), except at the lowest flowrate where it reduced. However, the relative changes
in mixing time above r/R=0.5 were much lower than the changes between r/R=0-0.5, with the
minimum mixing time occurring at or very near to the mid-radial position67. Both Haiyan et al66
and Conejo et al62 found that the precise relationship between plug angle and mixing time was
sensitive to the radial position of the two plugs. Haiyan et al66 studied a wider range of plug
angles (45-180°) than Conejo et al62 (60-180°). Both studies found an initial increase in the mixing
time as a function of plug angle, followed by a subsequent reduction in mixing time. The onset
of a maximum mixing time value at an intermediate plug angles was attributed to an increase in
the collision and interaction of the two bubble plumes (Haiyan et al66) at these plug positions.
The relative increase in mixing time observed by Haiyan et al66 between plug angles of 45-90°
was greater for r/R = 0.55 compared to r/R = 0.70. Conejo et al62 observed a similar effect
between 60-120°, with a greater increase in mixing time for r/R=0.5 in comparison to r/R=0.67.
The maximum mixing time occurred at 120° according to Conejo et al62, while Haiyan et al66
found it varied between 90-130° as r/R was varied between 0.55-0.70. Regardless of r/R, the
minimum mixing time occurred at 45° for Haiyan et al66 and 180° for Conejo et al62, although it
is worth noting that Conejo et al62 did not explore angles lower than 60°, which may explain the
discrepancy. Haiyan et al66 found that the unequal distribution of flowrate through two argon
plugs (eg. a distribution of 2.3NLmin-1 and 4.62NLmin-1) can reduce mixing time by producing
an asymmetry in the strength of each corresponding bubble plume. Cloete33 found that for a
three plug ladle, reducing the inter-angular spacing (towards a more asymmetric arrangement)
created a flow loop that was more unified. On the other hand, equiangular (120° plug angle)
plug arrangements created multiple flow loops. Ultimately, the kinetic energy (KE) in the melt
was boosted at low angles, but the mixing time did not change significantly. This was explained
by the better distribution of KE with equiangular plugs due to greater distance between each
plug, which is counterbalanced by the interference between the flow field produced by each as
they recirculate in multiple flow loops. Overall, it appeared that low angles were favoured due
to the greater advantage of higher KE in the melt despite the insignificant change in mixing time.
The authors also showed that while increasing the ladle aspect ratio increased the KE
continuously for low plug angles, at high angles it reaches a maximum and then begins to
decrease. This indicated that when the plugs are equiangular (120°), the effect of plume
interference becomes significant, and serves to reduce the total KE contained in the melt.
Therefore, for optimal gas-stirred mixing, a high aspect ratio ladle had to be coupled with low
plug angles to ensure minimal mixing times and maximal KE in the melt.
2.4.5. Slag Layer
The effect of the slag layer on liquid mixing has been studied by Kim and Freuhan54, whereby the
inclusion of an oil layer in a water model increased the mixing time consistently across a range

41
of nozzle positions. The authors argue that the input energy is dissipated at the free surface due
to generation of turbulence at the interface and the deformation of the oil layer. This limits the
strength of liquid recirculation in the vicinity of the free surface, as confirmed by Mazumdar and
Nakajima68, who studied oil-water systems. The kinetic energy in the liquid was reduced with
slag present, including both the mean and turbulent components. Moreover, the liquid velocity
beneath the oil-water interface changed in direction from horizontal to a downward deflection
of 30 degrees. This was attributed to the deformation of the slag-steel interface. The effect of a
rigid, flat interface was measured by placing a wooden block on top of the liquid surface (with a
central hole cut through it for gas to escape), as shown in Figure 14. It was found to have no
noticeable effect on the liquid flow, but did dampen out surface waves. The importance of
surface waves increases with specific input energy, as more energy dissipation occurs at the free
surface. Therefore, the flat surface assumption was shown to be inaccurate in simulation gas-
stirred ladles. Mazumdar6 later studied the various modes by which this input energy is
dissipated within the ladle. Of the total specific energy input, 10-30% goes to turbulence in the
liquid, with the remainder goes into bubble slippage in plume, surface waves, wall friction.
Additional dissipation occurs in the presence of a slag layer, which contributed to 10% of the
total. The energy is lost due to change in the direction of steel flow in the vicinity of the slag
layer, as shown in Figure 15. The detrimental effect of slag on mixing is contested by Roth61 who
found that the slag layer reduced mixing time, postulating that in its presence less input energy
would be utilised in free surface deformation so that more is left available for inducing mixing
in the liquid phase.

42
Figure 14 – Total specific kinetic energy in water phase as a function of specific input rate, by
Mazumdar and Nakajima68.
Figure 15 - Flow reversal at slag eye, taken from Mazumdar6.

43
Conejo62 identified conflicting effects of slag layer thickness on mixing time for dual plug ladles,
depending on gas flowrate and plug positions. At low gas flowrates, and with 0.67R (R=radius)
and 180-degree plug position and spacing, the mixing time reduces with an increase in slag layer
thickness. The opposite effect occurs at high flowrates and for all flowrates at 0.5R nozzle
spacing. Increasing the thickness of the slag layer increased the rate of water-oil mass transfer
(Kim and Freuhan54). Singh37 found the double plug layout to be advantageous for the promotion
of slag-steel interactions when compared to the single plug. As the overall flowrate is halved
through each plug in the two plug system, there is a weakening of each individual gas plume.
This reduces the degree of slag entrainment into the bulk steel, but enhances the amount of
slag-metal mixing by increasing the interfacial area between the two phases while avoiding the
formation of an enlarged slag eye. Increasing the slag layer thickness also reduced the slag eye
size. An enlarged eye can lead to reoxidation of steel and is undesirable, while a high interfacial
area is favourable for desulphurisation. Moreover, increasing the argon flowrate between 100-
500NL/min increased the mass transfer coefficient by 50%, while leading to greater distortions
in the slag layer which produces an increased contact area between the slag and steel phases.
The authors argued that the slag/steel interfacial area is maximised by distorting but not
breaking the slag layer, which is enhanced by the adoption of two plugs as opposed to one (with
the same total argon flowrate). Irons34 has also confirmed the importance of argon purging rate
on the deformation of the slag layer, finding it to have a significant impact on the rate of slag
droplet formation in the melt, while surface tension and slag viscosity had a lesser effect and no
effect at all, respectively.
The size of the slag eye has been the subject of several CFD analyses. Yonezawa69 created a
physical model with mercury and silicon oil and undertook industrial trials on a 350 tonne ladle
with a gas flowrate range was 100-500NL/min. Dimensional analysis was then applied to relate
the slag eye area to various independent variables for both systems. However, these did not
include the material properties or bath height, and the industrial data did not match the
correlation as closely as the physical model. A subsequent study by Mazumdar70 incorporated
the effects of flowrate, bath height, slag thickness, and slag density and viscosity for an
axisymmetric single plug ladle. Using dimensional analysis and regression of experimental data
from a water model, the dimensionless slag eye area was related to the Froude number,
Reynolds number, and density ratios, respectively as follows
(Aes
hH) = 3.25 (
UP2
gH)
1.28
(ρl
∆ρ)
0.55
(νs
HUP
)−0.05
(47)
where H=slag height and h=bath height.
The correlation is valid for axisymmetric injection, where 𝜀 =0.01 Wkg-1, 0.006 ≤ ℎ/𝐷 ≤ 0.05
and 𝜈𝑏𝑢𝑙𝑘~10−6 m2s-1. Interfacial tension was notably absent from the expression, which
predicts that slag eye size is be maximised primarily via increasing the gas flowrate, bath depth,
and liquid density, and by decreasing the density ratio between the liquid and slag phases. The
correlation was found to agree with experimental data from Yonezawa69, further studies and
those performed by the authors themselves.
Jonsson71 has used the weber number as a critical parameter for determining whether slag
entrainment into steel will occur, while the degree of slag layer emulsification can be quantified
by three parameters, according to Li et al72: the melt velocity at the eye, the slag eye size, and
the slag-steel interface wave frequency. The latter parameter refers to the frequency at the slag-
steel interface caused by the bubble-induced surface sloshing. The authors suggested that an

44
increase in all three of these parameters with flowrate would lead to an accompanying increase
in slag emulsification, and in turn, desulphurization. There was a general increase in all of these
variables with argon purging rate. A threefold increase in downward melt velocity at the
interface was observed at Q=300NL/min compared to Q=100NL/min. The predicted slag eye
sizes were validated against the non-dimensional areas as a function of the modified Froude
numbers, and found to agree well. The summed slag eye area produced from two plugs (and
two resulting smaller eyes) was found to be greater than that of a single eye produced from a
single plug setup, while the interface velocities were higher for the single plug case. The authors
inferred that each of these effects would cancel each other out but remained inconclusive on
whether the twin plug system was more efficient than the single plug system in terms of slag
emulsification. The summed slag eye area produced from two plugs (and two resulting smaller
eyes) was found to be greater than that of a single eye produced from a single plug setup, while
the interface velocities were higher for the single plug case, according to Li et al72. The predicted
slag eye sizes were validated against the non-dimensional areas as a function of the modified
Froude numbers and were found to agree well. The authors inferred that each of these effects
would cancel each other out in terms of their effect on slag emulsification.
2.4.6. Mass Transfer Models
In a laboratory-scale study, Guo and Irons26 simulated the process of carbon removal from steel
using carbon dioxide (CO2) desorption from sodium hydroxide (NaOH) solution. The pH (acidity)
of NaOH was controlled to within 6.0-8.5, so there were no interfacial chemical reactions and
the gas-phase diffusion occurred at a much faster rate than of the liquid phase. At this pH range,
mass transfer is thus liquid-controlled, and so desorption of CO2 occurs as a result of conversion
of aqueous to gaseous CO2. As desorption progresses further, the pH increases from 6.0-8.5, and
beyond that the slope becomes nonlinear indicating a transition from liquid phase mass transfer
to chemical reaction control. Moreover, the CO2 decay curve changes from linear to plateau
which is attributed to the same transition to chemical reaction control. The results indicated
that chamber pressure (Figure 16) was the most important variable in influencing the CO2
removal rate, followed by gas flowrate (Figure 17). The effect caused by pressure reduction is
distinguished from that of gas flowrate by the data points shown as open circles in Figure 16.
Despite operating at a standard pressure of 1 atm, the higher gas flowrate (2.0 instead of 0.4
L/min) used for these data points produces the same ‘effective’ gas flowrate (taking into account
gas expansion effects) as that of a vacuum pressure of 25kPa (depicted as black triangles). Out
of the two cases, the lower pressure system (P=25kPa, Q=0.4L/min) nonetheless achieves a
faster CO2 removal rate. Hence the benefits of reducing the chamber pressure are not
attributable simply to bubble expansion (which could only increase the interfacial area and
turbulence production), but also to variation in the chemical equilibrium at the interface.
Moreover, enlargement of the plug diameter and distributing the gas across a larger number of
plugs were both found to increase the volumetric mass transfer coefficient (𝜅A). The same
authors then simulated this experimental setup using an Euler-Lagrange model73 coupled to a
transport equation for the mass fraction CO2. The model predictions demonstrated reasonable
agreement with the experimental data.

45
Figure 16 - Effect of chamber pressure on CO2 desorption from NaOH solution Q=0.4L/min,
from Guo et al26.
Figure 17 – Effect of gas flowrate on CO2 desorption from NaOH solution P=25kPa, units of Q =
L/min from Guo et al26.
Kleimt74 used a first order differential equation to describe the removal rate of hydrogen.
−dC
dt=
κA
V(CH,steel − CH,eq) (48)
where V=volume of steel.
It was noted that the reduction in hydrostatic pressure with rising height causes the argon
bubbles to expand. This, in turn, requires the acceleration of liquid surrounding each bubble.

46
The pressure of the bubble is increased due to the combination of this liquid acceleration and
the uptake of hydrogen from steel. The partial pressure of hydrogen in the gas phase is
pH = P0 + PZFDHDH
FDHDH+Qg (49)
where P0 is the vacuum chamber pressure, FDH is a conversion factor based on the ratio of the
degassing rate to the gas flowrate, DH=rate of hydrogen removal and Qg=gas flowrate.
The additional bubble pressure due to acceleration of the steel, PZ is defined as
PZ = PZEexp [− P0 2PZE⁄ ] (50)
where PZE is a model parameter that is specified from industrially obtained data for the specific
degassing plant in question. 30 melts were analysed using HYDRIS from the melt shop74, and the
hydrogen content before and after degassing were found to be predicted well by the
mathematical model.
The hydrogen removal rate has been found to increase with argon flowrate and decrease
considerably at pressures above 10mbar, while lime addition (for slag formation) and the initial
hydrogen content plays a negligible role29. Steneholm75 found that 70% removal rate of
hydrogen was achieved within the first 10 minutes of vacuum degassing. These studies29,75
adopted an equivalent first order equation modelling approach to that of Kleimt74, with the
exception that the partial pressure of hydrogen was assumed to be equal to the total pressure
of the bubble.
CFD modelling has been adopted for hydrogen degassing using the two-phase Eulerian
approach28,32,76. Numerical solutions to the NSE for the argon and steel phases were obtained.
These were coupled to hydrogen transport equations within the steel phase together with an
equilibrium assumption to model the interfacial gas-liquid transfer. In calculating the
equilibrium concentration of hydrogen from Sievert’s Law (Equation 19), the interaction
parameters, (eHZ in Equation 20) for each alloying element and component solutes of the given
steel grade were obtained from experimental data in the literature. Jonsson71 implemented an
additional scalar transport equation to track the movement of the slag layer (subscript, s) by
advection within the liquid steel phase (subscript, l). The mass of either specie within the liquid
phase (steel or slag) entering each unit control volume per unit time (kgm-3s-1) was formulated
as
∂
∂t(αlρlc1)+∇∙(αlρlulc1)=0 (51)
∂
∂t(αlρsc3)+∇∙(αlρsusc3)=0 (52)
where c1=1 (in steel) and 0 (in slag) at t=0 and where c3=0 (in steel) and 1 (in slag) at t=0.
Industrial data was obtained in all cases28,32,76 and found to conform well to the simulated
predictions. Yu and Louhenkilpi32 demonstrated the accuracy of the Lamont30 expression for the
mass transfer coefficient in comparison to the Higbie24 equation. Inclusion of dual argon plugs
accelerated the hydrogen removal rate when compared to a single plug28, and increasing the
vacuum pressure from 200Pa to 667Pa led to a two-minute increase in time taken to reach 40%
of the initial hydrogen content76.
The slag layer was not treated as an independent Eulerian phase in any of these studies. The
free surface was assumed to be flat. These assumptions will be explored in this work, whereby
the mathematical treatment of the slag will be incorporated into the Eulerian model and its

47
effect on both flow characteristics and hydrogen transfer from the melt will be analysed. A
population balance model will be coupled to the CFD equations to resolve the bubble size
distribution. Following the formulation of the three-phase ladle model, a parametric study of
the design and process parameters (including the argon plug arrangement, number of plugs,
ladle aspect ratio, gas flowrate and operating pressure) will be performed. The consequences of
process optimisation on wall shear and slag-steel interactions will be considered. The model is
then presented for application as an industrial design tool for optimisation of vacuum arc
degassing operations.

48
2.5. Basis for Research
This literature review has outlined physical and theoretical approaches aimed at achieving adequate mixing and refining of liquid steel in gas stirred ladles. The ladle variables of critical influence to mixing characteristics, including gas flowrate, ladle geometry and plug layouts have been discussed. The mutual interaction of different variables on ladle refining performance combined with constraints on operating conditions and design present challenges to industrial practice. Theoretical studies on vacuum degassing have indicated that the hydrogen removal rate can be optimised via increasing the argon purging rate and the number of plugs, and decreasing the vacuum pressure. However, there is still a lack of literature exploring the effect of multiple ladle design variables and VAD operating conditions parameters on hydrogen removal. Furthermore, the presence of a buoyant slag phase above the steel melt is known to impact the liquid flow patterns. However, there are no published studies investigating how this affects mass transfer process, specifically hydrogen degassing. The current work aims to fill these gaps and develop a mathematical model for the prediction and optimisation of hydrogen removal from steel in the VAD unit. In addition to the quantitative prediction of the rate of hydrogen degassing for a range of conditions, the modelling approach will allow an improved understanding of the physical mechanisms responsible for varying performances across each condition. An output of this analysis is a design tool for industry and a series of recommendations for best practice for the VAD process. The Eulerian model is used to solve the mass and momentum conservation equations for the VAD unit, extending the two phase (argon-steel) system to a three phases (slag-steel-argon). Instead of considering the relative momentum balance of the slag phase in terms of the diffusive, convective, pressure and gravitational forces alone64, the interfacial force terms are additionally considered. The slag and steel are allowed to deform one another via the exchange of interfacial forces. A mass transfer model is then coupled to the Eulerian flow equations. This must take into account the interfacial area between the gas and liquid phases. Since hydrogen can escape from the free surface of the melt, the slag eye size must be known. Rather than assuming it to be constant7, it is calculated from the fluid dynamics within the ladle (the solution of the three phase Eulerian equations for the given system). A discrete PBM approach is used to track changes in the bubble size distribution in the melt, subject to the dynamic interaction of bubbles with one another. Once the model is fully developed, a range of industrially applicable ladle geometries are simulated. The plug layout and ladle shape is varied, and the resulting hydrogen removal rate calculated. Further to the design parameters, the operating conditions are also investigated, including the argon flowrate and vacuum pressure. The limiting aspects of these variables will be explored in terms of their interference with the wall shear and slag entrainment and the resulting contamination of the melt.

49
3. NUMERICAL APPROACH
Figure 18 shows the flowchart of the algorithm for solving the flow equations. The initial solution to the Eulerian equations is based upon a constant bubble size (from Equation 8) for the mass equations. The mass transfer coefficient (Equation 24) is fed into the interfacial mass transfer equations (Equation 21), which are programmed into ANSYS Fluent using User Defined Functions (UDF), and then solved together with the hydrogen transport equation (Paper 1, Equation 35). The velocity solution field from these calculations are then used as the basis for the PBM model in calculating the bubble size distribution. Once the BSD is known the interfacial area concentration can be calculated using A= 6αg dSM⁄ , which allows the mass transfer equations to
then be solved.
Figure 18 – Flowchart of numerical solver.
The sensitivity of the model to the computational mesh size was assessed using a baseline geometry of a 100 tonne steel ladle of cylindrical shape and an aspect ratio of 1.0. Four meshes of varying resolutions were studied, as listed in Table 2. Figure 19 shows the vertical component of the liquid velocity profile as a function of the vertical position in the ladle. The velocity profile remained relatively constant between the M3 and M4 meshes. In the interest of achieving an

50
appropriate balance between accuracy and computational efficiency the M3 mesh was adopted in subsequent simulations.
Table 2 – Description of computational meshes used in sensitivity study.
Mesh Number of Cells
M1 165,825 M2 338,550 M3 696,630 M4 1,200,144
Figure 19 – Vertical velocity profiles for each of the four meshes in Table 1.
The case settings used for the three-dimensional ladle at SFIL in the PBM bin size sensitivity analysis are listed in Table 3. Following the analysis in Paper 1, 15 bubble size bins were applied to the PBM model in subsequent simulations. The sauter mean bubble size distribution for the SFIL ladle is plotted on the central vertical plane in Figure 20. In the lower half of the bath (Zone 1), the high bubble velocity and turbulent intensity produced in the melt causes the breakup of bubbles, which reduces their sauter mean diameter. Bubble expansion then begins at approximately the half way point along the vertical centreline of the plume (Zone 2).
In the simulation of two plug ladles, the flowrate deployed through each of the plugs is half that of the single plug case, maintaining a constant overall flowrate. Similarly, the flowrate per plug for three plugs is one third of the single plug case. The population balance model was used to predict the bubble size distribution arising in the single, double and triple plug systems.
The sauter mean bubble diameter distribution for each case along the central vertical cross sectional plane aligned with the argon plugs are shown in Figure 21. The corresponding changes in bubble diameter along the plume centreline are plotted in Figure 22.
The final sauter mean bubble diameter at the free surface region of the bath for the double (dSM=10mm) and triple (dSM=11mm) plug layouts is 11% and 22% higher than that of the single

51
plug layout (dSM=9mm) respectively. There are noticeable differences in the initial phase of bubble breakup, with the bubble size in the multi plug systems reducing at a slower rate upon entering the melt compared to the single plug system. This is attributable to reducing bubble velocity with an increase in plugs which reduces the turbulent intensity required to break up the bubbles. A larger mean bubble size is therefore produced half way up after the introduction of each new plug. In the upper half of the bath, bubble growth (due to pressure reduction) occurs at a similar rate for all three cases. Overall, this indicates a low sensitivity of the sauter mean bubble size in the ladle to the inlet gas flowrate through each plug.
Table 3 – List of PBM bin sizes for 5, 10, 15 and 20 bin simulations.
TOTAL BINS
5 10 15 20
BIN number
BUBBLE DIAMETER (m)
1 0.14 0.14 0.14 0.14
2 0.066 0.10 0.11 0.12
3 0.031 0.073 0.094 0.10
4 0.014 0.052 0.076 0.089
5 0.007 0.037 0.061 0.076
6 0.026 0.049 0.065
7 0.019 0.039 0.055
8 0.013 0.032 0.047
9 0.0097 0.025 0.040
10 0.007 0.020 0.034
11 0.016 0.029
12 0.013 0.025
13 0.010 0.021
14 0.0087 0.018
15 0.007 0.015
16 0.013
17 0.011
18 0.0096
19 0.0082
20 0.007

52
Figure 20 – Sauter Mean Bubble Size Distribution along vertical cross sectional plane of SFIL ladle.

53
Figure 21 – Sauter Mean Bubble Size Distribution along vertical cross sectional plane of (a) single axisymmetric, (b) double plug and (c) triple plug ladles.

54
Figure 22 – Change in Sauter Mean Bubble Diameter with vertical position along plume centreline for single axisymmetric plug, double plug and triple plug ladles.

55
4. RESULTS
Three results chapters are presented in this thesis (Chapters 4.1-4.3). Each chapter constitutes a peer-reviewed journal paper which is inserted in full along with figures and tables. Following on from these chapters, supplementary results are presented which refer to the papers in Chapters 4.1-4.3. The simulation cases referred to in these chapters are listed in Table 4.
The results chapters are themed as follows:
Chapter 4.1 – Hydrogen Degassing in a Vacuum Arc Degasser Using a Three-Phase
Eulerian Method and Discrete Population Balance Model.
o The mathematical model is presented and validated using physical models in
the literature and data extracted from SFIL steelworks.
Chapter 4.2 – Modeling The Effect of Plug Positions and Ladle Aspect Ratio On Hydrogen
Removal in The Vacuum Arc Degasser
o Ladle Design variables are analysed including the number of argon plugs, plug
positions, and ladle aspect ratio.
Chapter 4.3 – A Parametric Study On the Effects of Process Conditions on
Dehydrogenation, Wall Shear and Slag Entrainment in The Vacuum Arc Degasser Using
Mathematical Modelling
o Ladle operating variables are analysed including the argon flowrate and vacuum
pressure. Ladle wall shear and slag entrainment are assessed in addition to
hydrogen removal.

56
Table 4 – List of Simulation Cases
Quantity L D Q P r/R θ np slag
Case Number/Units
m m Nm3hr-1 Pa - degrees - (y/n)
Slag Test L1 2.79 2.3 13 100 0.52 - 1 n
L2 2.79 2.3 13 100 0.52 - 1 y
Number of Plugs
(np)
N1 2.97 2.48 13 100 0.5 - 1 y
N2 2.97 2.48 13 100 0.5 180 2 y
N3 2.97 2.48 13 100 0.5 120 3 y
Plug Radial
Position (r/R)
R1 2.97 2.48 13 100 0 - 1 y
R2 2.97 2.48 13 100 0.35 - 1 y
R3 2.97 2.48 13 100 0.5 - 1 y
R4 2.97 2.48 13 100 0.65 - 1 y
R5 2.97 2.48 13 100 0.8 - 1 y
Aspect Ratio, L/D
(AR)
A1 2.27 2.83 13 100 0.5 180 2 y
A2 2.63 2.63 13 100 0.5 180 2 y
A3 2.97 2.48 13 100 0.5 180 2 y
A5 3.29 2.35 13 100 0.5 180 2 y
A6 3.6 2.25 13 100 0.5 180 2 y
Plug Angle (θ)
T1 2.97 2.48 13 100 0.5 45 3 y
T2 2.97 2.48 13 100 0.5 90 3 y
T3 2.97 2.48 13 100 0.5 120 3 y
Argon Flowrate
Q1 2.97 2.48 13 100 0.5 45 3 y
Q2 2.97 2.48 17 100 0.5 45 3 y
Q3 2.97 2.48 20 100 0.5 45 3 y
Q4 2.97 2.48 23 100 0.5 45 3 y
Q5 2.97 2.48 27 100 0.5 45 3 y
Q6 2.97 2.48 29 100 0.5 45 3 y
Vacuum Pressure
P1 2.97 2.48 13 100 0.5 45 3 y
P2 2.97 2.48 13 500 0.5 45 3 y
P3 2.97 2.48 13 1000 0.5 45 3 y
P4 2.97 2.48 13 2000 0.5 45 3 y
P5 2.97 2.48 13 10000 0.5 45 3 y

57
4.1. PAPER 1
Hydrogen Degassing in a Vacuum Arc Degasser Using a Three-Phase Eulerian Method and Discrete Population Balance Model
Faris Karouni, Bradley P Wynne*, Jesus Talamantes-Silva, and Stephen Phillips.
*Prof. B. P. Wynne, Faris Karouni
Department of Materials Science and Engineering, University of Sheffield, Mappin St, Sheffield, S1 3JD, UK.
Prof. J. Talamantes-Silva, Stephen Phillips
Sheffield Forgemasters International Ltd, Brightside Lane, Sheffield, S9 2RW, UK.
Contributions of Authors:
Name: Faris Karouni
Contribution: Primary Contributor. Planned and carried out the simulations, analysis of data.
Signed:_____________________________
Name: Bradley Wynne
Contribution: Academic supervisor of PhD project. Provided critical feedback and assistance in
preparation of manuscript.
Signed: _____________________________
Name: Jesus Talamantes-Silva
Contribution: Industrial supervisor of PhD project. Provided critical feedback and assistance in
preparation of manuscript.
Signed: _____________________________
Name: Stephen Phillips
Contribution: Supervision of hydrogen measurement extraction from VAD unit at SFIL
steelworks. Provided critical feedback and assistance in preparation of manuscript.
Signed: _____________________________

58
A three-phase Eulerian model incorporating slag-steel interactions to predict the rate of hydrogen removal from molten steel in a full-scale industrial vacuum arc degasser (VAD) has been developed. The interfacial area for hydrogen transfer is calculated using a bubble population balance model. This accounts for bubble growth due to changes in hydrostatic pressure as well as coalescence and breakup. The predicted velocity field and bubble distribution are compared with experimental data in the literature. The bubble size predictions under atmospheric pressure conditions are sensitive to the initial bubble size, while under vacuum conditions they are relatively independent of the initial size. The omission of the slag layer from the model results in a 12% increase in the hydrogen removal rate. Variation in the slag eye diameter as a function of argon flowrate is simulated and compared with empirical correlations in the literature. Hydrogen measurements from a full-scale VAD unit at Sheffield Forgemasters International Ltd. steelworks are compared to the model predictions for a series of melts of varying initial hydrogen content. Based on the initial hydrogen content of the liquid steel, the model predicts the amount of hydrogen removed to within ±20% of final experimental measurements obtained from the melt.
1. Introduction
The removal of hydrogen is a critical part of secondary steelmaking as its presence, even in amounts no greater than several parts per million, can result in the premature failure of steel components. A well-developed processing technique used in melt shops to reduce hydrogen content is vacuum arc degassing (VAD). This process subjects the steel melt to a combination of low pressure and argon purging. The solubility of hydrogen in steel decreases considerably under vacuum conditions, which combined with the large interfacial area for mass transfer provided by bubbles, facilitates the removal of hydrogen from the melt.[1] During ladle refining, a slag layer is formed on top of the melt for the purposes of desulphurization, inclusion control and thermal insulation. The rising bubble plume generates an eye within the slag layer, through which the melt is exposed to the atmosphere and the bubbles reach the surface. The efficiency of hydrogen degassing is dependent on several factors, including the rate of bubble injection, the bubble size distribution (and hence surface area between the gas and liquid phases) and the degree of bubble-induced mixing of the liquid steel. In order to theoretically predict the rate of hydrogen degassing, the motion and spatial distribution of each of the phases (steel, argon, slag) arising from argon purging must be resolved. Computational fluid dynamics (CFD) models have been developed to generate such data by simulating the multiphase flow within gas-stirred ladles using fundamental conservation equations of mass and momentum and accompanying submodels. These include the Eulerian, Volume of Fluid, and Euler-Lagrangian methods, and have been reviewed extensively by Mazumdar.[2] Lou and Zhu have performed a CFD study of ladles using the Eulerian approach, testing the sensitivity of interfacial closure models using benchmark experimental data on air-water experiments.[3] The model demonstrated the accuracy of the Eulerian model in modelling large scale ladles.
Bubbles are subject to a variety of physical phenomena during their motion through the ladle which results in a distribution of bubble sizes. Bubble growth arises from changes in hydrostatic pressure as a function of vertical position within the melt. Inter-bubble collisions and the interaction of bubbles with the turbulent flow field of the melt can lead to coalescence and breakup. Furthermore, experimental studies have indicated that the presence of the slag layer on top of the molten steel bath weakens the fluid circulation rate[4] and increases mixing time.[5] Physical modelling and theoretical analysis of slag layer behavior during gas stirring by Mazumdar and Guthrie[6] found that approximately 10% of the buoyant energy of the gas plume is dissipated by the layer. This was attributed to the redirection of the flow at a sudden angle in the plume eye region. The resulting distortion in the flow field causes the dissipation of input energy provided by the buoyancy of the injected gas, which would otherwise have strengthened the circulation within the underlying bulk steel flow.

59
Yu and Louhenkilpi[7] coupled a species transport model with an Eulerian CFD model to simulate hydrogen removal in a VAD. The interfacial transfer was expressed in terms of the concentration gradient between the bulk hydrogen concentration and the equilibrium concentration of hydrogen dissolved in the steel according to Sievert’s Law. Mass transfer coefficients based on the liquid turbulence (Lamont) or bubble size (Higbie) properties were adopted, while bubble coalescence and breakup were accounted for with a one-group interfacial area concentration model. It was assumed that hydrogen transport at the bath surface is limited to a fixed region corresponding to the slag eye. However, the effect of the slag phase on the fluid flow of the melt were not modelled.
The objective of this study is to develop a hydrogen degassing model in which the slag layer is treated as an independent phase interacting with the molten steel and argon bubbles via the exchange of interfacial forces. A three-phase (steel/slag/argon) Eulerian model is proposed where the dynamic bubble size distribution is accounted for by using a discrete population balance model. The size of the slag eye produced from a series of gas flowrates is predicted and hydrogen concentrations are compared with data from an industrial ladle at Sheffield Forgemasters International Ltd. (SFIL) steelworks.
2. Industrial Ladle
Industrial scale degassing was undertaken in the VAD unit at SFIL steelworks for steel melts of composition shown in Table 1. The degassing process begins with the reduction of pressure in the ladle from atmospheric pressure to 1.3mbar. At this point the argon flowrate is increased from 0.01 to 0.18 Nm3min-1. The pressure is held constant for 20 minutes and then released to atmospheric pressure and the argon flowrate is lowered to its original value (Figure 1). The ladle dimensions are shown in in Figure 2. The argon is injected into the ladle through a porous plug located at a distance of 0.6m from the center of the base of the ladle. The hydrogen concentration in the ladle was measured both before and after degassing using a Hydrogen Direct Reading Immersion System (HYDRIS) probe.[8]
3. Mathematical Model
A multiphase CFD model is applied to predict the time-dependent flow field inside the ladle. This is combined with bubble size and mass transfer models to predict the rate of hydrogen transfer across the gas-liquid interface. The following assumptions have been adopted:
(a) The effect of chemical reactions (such as decarburization, the reaction of surface active elements and slag-metal reactions) on hydrogen transport are assumed to be negligible and are not taken into account.
(b) The slag and steel phases are treated as incompressible fluids. (c) The temperature is assumed to remain constant at 1598oC (1871K) across all
simulations. (d) Argon is treated as an ideal gas with its density specified according to the ideal gas law
(Equation (1)):
ArArHH
lsurface
gMCMCRT
)zH(gP
(1)
where Psurface=pressure at surface of ladle, ρl =steel density, M=molecular weight of argon/hydrogen, H=height of steel bath in ladle, z=distance from bottom of ladle to local grid cell, R=ideal gas constant, T=temperature of bubble, C = mass fraction of hydrogen or argon in the bubble.

60
3.1. Hydrodynamic Equations
Using the Eulerian method[9], a separate set of momentum and continuity equations are solved for each of the molten steel, argon, and slag phases (Equations (2) and (3)). The phases are coupled via shared pressure field and interfacial force terms. The physical properties of the different phases are shown in Table 2. The drag force, lift force and turbulent dispersion force were included as interfacial source terms in the momentum equations.
IFqq
Tqqq,effqqqqq
qqqFguupuu
t
u
(2)
q,Hqqq Su (3)
TMeff (4)
2
qT
kC (5)
where αq=volume fraction of phase q, uq=velocity, p=pressure, t=time, ρq=density, q,HS =
interfacial mass transfer (defined in Equation (36)), μeff =effective viscosity, μM =molecular viscosity, μT =turbulent viscosity and Cµ=0.09.
For turbulence modelling, the standard k-ε model was used
kklllkll
k
Tlllll
lll SGGkkut
k
(6)
S)CGC(
ku
tll2kl
l
lll
Tlllll
lll (7)
where Gk is the production of turbulence kinetic energy, σk, σε, C1ε and C2ε with model constants defined as 1.0, 1.3, 1.44, 1.92 according to Launder and Spalding.[10]
Sk and Sε are the source terms in each equation due to bubble induced turbulence . These are defined using the Troshko and Hasan[11] equations:
LGdragBIT,k uuF75.0S (8)
bVM
LGD
BIT,dC2
uuC345.0S
(9)
where the virtual mass coefficient, CVM=0.5 and db=bubble diameter.
The interfacial force term in Equation (2) is expressed as
TDVMliftdragIF FFFFF
where Fdrag, Flift , FVM and FTD are the drag, lift, virtual mass and turbulence dispersion forces
respectively.
The drag force, Fdrag, provides a resistance to flow due to the motion of bubbles relative to
the liquid, and is calculated from:
lglgDgl2sm
drag uuuuCd4
3F (10)
where dSM = sauter mean diameter of bubbles.

61
The drag coefficient CD is calculated according to the bubble shape using the Ishii and Zuber[12] correlation:
)]}cap(C),ellipse(Cmin[),sphere(Cmax{C DDDD (11)
where CD = {
CD(sphere) = (24/Re)(1 + 0.1Re0.75)
CD(ellipse) = (2/3)√Eo
CD(capped) = 8/3
(12)
where l
blgl duuRe
(13)
and
2bgl dg
Eo (14)
The interaction of the bubbles with the shear field of the liquid phase causes a lift force, Flift, acting perpendicular to the direction of flow in the direction of the ladle walls:
llgLlglift uuuCF (15)
The lift coefficient, CL, is calculated using the Tomiyama[13] correlation:
CL= {
min[0.288tanh(0.121Re, f(Eo')] Eo'≤4
f(Eo') 4<Eo'≤10
-0.27 10<Eo'
(16)
where f(Eo')=0.00105Eo3-0.0159Eo2-0.0204Eo +0.474
and
2hgl dg
'Eo (17)
The modified Eotvos number Eo′ uses the horizontal bubble diameter dh which is a function of the Eotvos number[9]:
31757.0
bh )Eo163.01(dd (18)
The virtual mass force, FVM, results from the inertia of the liquid phase relative to the relative acceleration of the gas phase and is expressed according to the Drew model[14]:
Dt
Du
Dt
Du5.0F lg
ggVM (19)
The turbulent dispersion force, FTD, arises from turbulent fluctuations in the liquid velocity due to bubble-eddy interactions and is calculating using Burns equations[15]:
l
l
g
gll,Tglg
b
g
DTD9.0
5.0uud
C4
3F (20)
3.2. Population Balance Model

62
The bubble size distribution is discretized into a set of size intervals (known as bins) using the discrete population balance model[16], where αi is the volume fraction of bubble size i,
1N,...1,0i,VN iii (21)
The number density is defined as
1i
i
V
Vi dV)t,V(n)t(N (22)
where V is the bubble volume and n(V,t) is the number density function with the transport equation:
cbrkcbrk DDBB)t,V(n
t
V)t,V(un
t
)t,V(n
(23)
where
'dV)'V(n)'VV()'V(pBV
brk
(24)
'dV)'V(n)'VV(n)'V,'VV(a5.0BV
0
c (25)
)V(n)V(Dbrk (26)
'dV)'V(n)V(n)'V,V(aD0
c
(27)
Bbrk is the birth rate of bubbles of volume V due to the breakage of bubbles of volume V’. The corresponding number of child bubbles produced by the parent bubble (2 for binary breakage),
probability density function and breakage frequency are p, )'VV( and τ(V’), respectively. Dbrk
is defined as the death rate of these breaking bubbles. The birth rate of bubbles of volume V due to coalescence of bubbles of volume V-V’ and volume V’ is expressed as Bc while the death rate of bubbles of volume V due to coalescence is expressed as Dc.
The Luo model is used to resolve the coalescence and breakage kernels.[17] The aggregation kernel is
)V,V()V,V(a jicjicc (28)
where the collision frequency is
ijjijic unn)LL(4
(29)
where L=bubble diameter of pair i and j, and uij is their characteristic velocity
5.032
j
32
i
31ij LL43.1u (30)
and the collision probability is
5.0
3ji
5.0lg
23ji
2ji
c We)LL1()5.0(
)LL(1)LL(175.0exp (31)
The weber number is

63
2
ijil uLWe (32)
The breakage kernel is
dd047.2
]1)5.01(5.0[12exp
1
L923.0)V,'V(
3532811
32321
Ll 311
231
2brkmin
(33)
where ξ is the dimensionless eddy size =l/L.
The sauter mean diameter is defined by
2ii
3ii
SMLN
LNd
(34)
3.3. Mass Transfer Model
Hydrogen transport within the argon and steel phases is calculated via the convection-diffusion equation
q,H
q,T
q,T
Hqqq,Hqqq
q,HqqS
ScCu
t
C
(35)
where CH,q is the mass fraction of hydrogen, γHis the hydrogen diffusivity, ScT is the turbulent Schmidt number and μT is the turbulent viscosity. SH,q is the source term, driven by the concentration gradient between the bulk hydrogen in
the steel (CH,metal) and the concentration of hydrogen in liquid steel in equilibrium with the gas
phase (CH,equilibrium), calculated as
)CC(AS l,Heq,Hll,H (36)
where κ is the mass transfer coefficient.[7] The interfacial area concentration, A is calculated from the sauter mean diameter in Equation (34) and defined as A= 6αg dSM⁄ . For the gas
phase, SH,g = −SH,l.
The equilibrium concentration is determined according to partial pressure of hydrogen in the gaseous phase via Sievert’s Law
2H
H
0
eq,H pf
)RT/Gexp(C
(37)
where standard Gibbs free energy, ∆G0 = 36485 + 30.46T, pH,bubble = partial pressure of hydrogen in bubble, T = temperature, R=ideal gas constant, fH = activity coefficient of hydrogen.
Z%eflog wt
Z
HH (38)
The interaction coefficients eHZ corresponding to each alloying element (Z) are determined
from experimental data[18-21] based on composition of the steel measured at SFIL steelworks (Table 1).
The partial pressure of hydrogen in the bubbles is expressed as

64
ArArHH
HHbubbleH
MCMC
)MC(pp
2 (39)
The mass transfer coefficient is calculated by the Lamont eddy cell theory[22]:
5.0
D3.0
(40)
where D=diffusion coefficient of hydrogen in steel, υ = kinematic viscosity of steel and ϵ = turbulence dissipation rate of steel.
3.4. Numerical Details
The computational mesh consists of 650,000 cells with a maximum cell size of 3cm and mesh refinement at the plug. Velocity inlet and pressure outlet boundary conditions were specified according to the argon purging rate and vacuum pressure respectively.
No slip boundary conditions were applied to the ladle wall and base for the liquid phase, while slip conditions were used for the gas phase and standard wall functions for the k-epsilon turbulence model.
The equations were solved using the commercial fluid dynamics package ANSYS FLUENT 16.1 and supplemented with user-defined functions (UDFs). 2nd order upwind discretization was applied to the transport equations. The solution was judged as converged when all residuals were lower than 10-3. The governing equations are solved sequentially. First, the flow equations are solved with the hydrogen transport equations using a constant bubble size from Equation (41). Then, the population balance equations are solved on their own (using a constant flow field) to obtain the bubble size distribution. Finally, the hydrogen transport equations are solved on their own (using a constant flow field and bubble size distribution) to calculate the hydrogen removal from the melt.
The bubble size correlation from Sano and Mori[23] is used to estimate the initial bubble size at the exit of the porous plug
61
867.0n
2
2
l
nb )dQ(0248.0
g
d6d
(41)
where dn = nozzle diameter (which is assumed to equal the porous plug diameter) and Q=argon flowrate.
4. Results and Discussion
4.1. Flow Field
The ability of the model to correctly predict the velocity field and bubble size distribution was assessed by comparison with physical models reported in the literature. [24-25] The gas flowrates and system geometries of these validation cases together with the industrial ladle at SFIL are shown in Table 3.
The velocity field was validated against data from an air-water model by Sheng and Irons.[24] As shown in Figures 3a and 3b both the liquid velocity and gas volume fraction decay with increasing vertical distance from the gas injector. This experiment was repeated for two gas flowrates (50 and 150mLs-1). The model correctly predicts the axial velocity and volume fraction profiles for both flowrates, indicating that the Eulerian method accurately represents the flow behavior within the bubble plume and surrounding liquid.

65
4.2. Bubble Size
The nitrogen/water model developed by Anagbo and Brimacombe was simulated to assess the accuracy of the population balance model in predicting the bubble size distribution.[25] According to the experimental results the bubble size distribution follows one of two general behaviors, depending on the gas flowrate. For high flowrates (600 and 1200 mLs-1) there is rapid coalescence in the vicinity (<0.05m) of the porous plug, followed by a gradual reduction in bubble size with bath height as a result of bubble breakup. Anagbo and Brimacombe describe this as the coalescent regime. At low flowrates (200 mL/s), however, bubbles rise with very little change in size (which is termed the discrete regime).
Equation (41) was used to calculate the initial bubble sizes (23mm, 30mm and 50mm) for each of the three argon injection flowrates cases analyzed in the experiments (200, 600 and 1200 mLs-1) respectively.
A comparison of the measured bubble diameter with the model predictions along the vertical centerline of the bubble plume is shown in Figure 3c. In accordance with the experimental data, the model predicts a larger amount of bubble disintegration at the high flowrate (1200mL/s) compared to the medium flowrate (600mL/s). The predictions are closer for the higher flowrate than the medium flowrate where the model under predicts the rate of disintegration.
At the lowest flowrate (200mL/s) the predicted bubble size distribution is generally overestimated. The bubble size gradually reduces with height and eventually reaches the equilibrium value corresponding to the experimental data (3mm) close to the free surface. This is attributed to the fact that bubbles produced by porous plugs are expected to be smaller than those produced by nozzles, and the correlation (Equation (41)) was developed for the latter mode of bubble injection.[26]
The model is then applied to the geometry and argon injection rate of the SFIL ladle (Table 3). The variation in the sauter mean diameter of argon bubbles with vertical position along the bubble plume centerline is shown in Figure 3d. The sensitivity of the bubble size distribution to the number of bubble size bins (or size intervals) is shown in the same figure. 15 bins were adopted for all simulations as it was found that the accuracy did not vary significantly with further increases in bin size. During the initial stages of rising, the sauter mean diameter decreases with vertical distance. This is equivalent to the experimental observations of Anagbo and Brimacombe whereby there was a reduction in bubble size due to bubble break-up under the medium and high flowrate regimes.[25] As the bubbles near the free surface, the rate of bubble expansion dominates in comparison to the breakup rate, causing an increase in bubble size with vertical position. This effect departs from the observations of Anagbo and Brimacombe (where there was a continued reduction in bubble size all the way to the bath surface) and is attributable to the reduced surface pressure under vacuum conditions. Prior to impacting with the free surface, the bubble diameter reaches a maximum size of 70mm. A bubble size of 32mm at the bath surface was predicted by Witchterie[27] using theoretical calculations, with hydrostatic pressure and bubble breakup accounted, though in the absence of mass transfer.
The effect of the initial bubble size on the final size distribution (for 5 bubble size bins) is also shown in Figure 3e. Here it is seen that both initial conditions reach an equivalent size profile beyond reaching a vertical height of 1.75m. This supports the conclusion of Witchterie[27] that the bubble size distribution under vacuum pressures in a steelmaking ladle is largely independent of the initial bubble size.
4.3. Slag Eye Size
The molten steel velocity field and hydrogen distribution in the melt after 20 minutes of vacuum degassing for the slagless and slag-containing cases are shown in Figures 4a and 4b. The slag depth is thicker towards the side of the wall furthest from the eye and thinnest on the opposite side. The rising molten steel current driven by the gas plume deforms the edge of the slag eye,

66
pushing slag further away from the eye and redirecting the melt into a downwards loop before it re-joining the bubble plume.
The hydrodynamics of the slag eye at SFIL was simulated during argon stirring prior to vacuum degassing. The results are analyzed across a horizontal plane intersecting the slag eye, as shown in Figures 4c, 4d and 4e. The size of the slag eye was analyzed for a series of argon flowrates (170, 237 and 305 NLmin-1). As the flowrate increases, the eye shape generally becomes more dynamic in shape as the faster flowing molten metal interacts with the slag. Due to the dynamic motion of the slag layer the eye size varies with time. A time-averaged eye area was converted to a diameter based on the assumption that the eye is circular. The slag eye was assumed to constitute all regions in which with the slag volume fraction was less than 10%. The calculated slag eye area was converted to the corresponding diameter by assuming the eye is circular in shape.
The predicted diameter was compared to the empirical correlation of Peranandhanthan and Mazumdar.[28] This correlation was developed using dimensionless analysis and non-linear regression based on experimental data of various oils with water. The resulting expression for the area of the eye is a function of the bath height, gas flowrate, the density ratio between slag and steel, and slag viscosity. The results are compared in Figure 5. The relative change in eye diameter with flowrate is similar to that of the correlation. However, the absolute values are approximately 25% lower than that of the correlation over the range of flowrates. As the correlations were developed for non-metallic liquids and density ratios (between the liquid and top layer phases) different from those in the ladle, the discrepancy between data sets are attributed to the correlation having over predicting the eye size, while has also been noted from the results of VOF simulations by Singh.[29]
4.4. Hydrogen Removal Rate
As shown in Figures 4a and 4b, the highest hydrogen content in the melt is concentrated in the areas furthest from the bubble plume. A concentration gradient in the vertical direction with increasing hydrogen towards the base of the ladle. This spatial distribution of hydrogen within the VAD unit is a result of the strength of convective mass transfer, the equilibrium hydrogen composition of the steel, and the bubble-steel interfacial area.
Areas of the bulk flow corresponding to a high magnitude in the melt velocity experience an accelerated rate of convective transport of hydrogen within the liquid phase which minimizes the concentration gradient between higher hydrogen regions (near the walls and the base of the lade) and lower hydrogen regions (in the bubble plume and the top of the ladle).
The equilibrium concentration of hydrogen increases with vertical depth from the bath surface due to the hydrostatic pressure gradient in the melt. The concentration gradient for interfacial mass transfer consequently reduces with depth.
The higher plume rise velocity in the vicinity of the argon plug results in a lower hydrogen level near the plug compared to the regions either side of it as shown in Figure 4b.
The average hydrogen content in the slagless melt (1.20ppm) is 12% lower than that of slag-containing melt (1.36ppm). The velocity vector plot indicates that the radial velocity field of the melt near the free surface is strengthened in the absence of slag. The presence of the eye results in a reduction in the magnitude of the velocity vectors towards the ladle walls. This is due to the impact of the melt with the slag at the point of the open eye, at which point the rising steel current rotates downwards at a steeper angle than the relatively smoothly circulation current of the slagless case. Moreover, without slag the hydrogen removal rate is accelerated by the total exposure of the free surface to the vacuum, unlike the slag case in which only the eye is exposed. Interfacial surface area in this region is particularly beneficial for hydrogen transfer as it is here that the concentration gradient is largest.

67
The predictive capability of the hydrogen transport model has been validated against measurements from several melts in a VAD unit for which hydrogen concentrations were extracted before and after the degas cycle using a HYDRIS measurement probe.
Hydrogen concentration in the liquid steel was sampled prior to and immediately after the degassing cycle at a vacuum pressure of 1.3mbar using a HYDRIS probe. The sampling location was 30cm below the slag eye. Six melts of initial hydrogen concentration levels varying between 1.86-4.70 ppm were analyzed (Table 4).
The results from the model at the sampling location are compared alongside the industrial data in Figure 6. The measured values lie close to the model predictions, with data points falling within ±20% of the 1:1 line (at which the predicted and measured values are exactly equal). The variation between the two data sets is attributable to several factors. Firstly, atmospheric humidity is not constant across melts due to changing weather conditions. Although the hydrogen content of the slag layer will decrease under vacuum conditions simultaneously to the reduction of hydrogen in the melt, the moisture in the slag layer may contribute to hydrogen pickup in the melt due to slag-metal contamination, particularly in regions where the slag is entrained in the melt.[30]
Furthermore, the performance of the vacuum pump system and the porous purging plugs may vary with time and hence across different melts. The plant operators adjust the operating pressure and argon flow rate on a case-by-case basis for each melt. In practice, the conditions in the VAD unit may therefore deviate from the standard operating conditions of 1.3mbar chamber pressure and 0.003Nm3s-1 adopted in the model. As the model is sensitive to these parameters, this results in variation between the numerical predictions of the hydrogen removal rate and the measured HYDRIS readings.
These difficulties in maintaining constant operating conditions contribute to the ±20% error between predicted/measured hydrogen values. It can be inferred from the results of the CFD model that this error would be compounded if the slag layer is omitted from the mathematical analysis, due to the predicted influence of the slag layer on the fluid dynamics of the melt, and consequent increase in the hydrogen transfer rate.
5. Conclusion
A coupled population balance-three phase Eulerian model has been developed using ANSYS Fluent and validated with empirical data from the literature. This model incorporates the k epsilon turbulence equations, with source terms for bubble induced turbulence. Drag, lift and turbulence dispersion terms are included in the momentum balance equations for each phase to account for the interaction with other phases. A species transport equation was solved with source and sink terms in the gas and liquid phases respectively, to predict the rate of hydrogen transfer and the transient concentration distribution throughout the melt. The Lamont equation was used for the mass transfer coefficient and hydrogen activity coefficients for the each of the alloying elements in the melt was based upon experimental data in the literature. The surface area between the bubbles and surrounding liquid was predicted using a discrete population balance model, including bubble breakup, aggregation, and growth effects due to hydrostatic pressure gradients in the bath.
The conclusions can be summarized as follows:
The flow field is accurately predicted over two different gas flowrate conditions. Comparison with experimental benchmarks demonstrate that the accuracy of the population balance model predictions of bubble size under atmospheric pressure conditions is largely dependent on accurate specification of the initial bubble size, particularly at low gas purging rates. Under the vacuum pressure and flow conditions of

68
the industrial VAD unit, the bubble size distribution is relatively insensitive to initial size with bubble size increasing as a function of bath height.
The model simulates the deformation of the slag layer by the ascending liquid flow field driven by the bubbles which results in migration of slag towards the ladle walls. Omission of the slag layer results in a 12% increase in the predicted hydrogen removal rate due to the exposure of the entire free surface to the vacuum, when compared with the slag-containing melt. The effect of argon flowrate on the size of the slag eye has been investigated and the results are validated against an empirical correlation from the literature.
For a range of steel melts the model predicts the hydrogen removal rate to within 20% of HYDRIS measurements obtained from the VAD unit. This demonstrates the ability of the CFD model to simulate the complex slag-metal-argon flow field and bubble size variation inherent in the VAD process.
Nomenclature a Aggregation kernel (-)
A Interfacial area concentration (m2/m3)
B Birth terms due to aggregation and breakage (-) C Mass fraction (-)
Cµ, C1ε, C2ε Turbulence constants (-)
Cdrag, CL, CVM Drag/lift/virtual mass coefficients (-)
d Bubble diameter (m) D Death terms due to aggregation and breakage (-) e Interaction coefficient (-) Eo Eotvos number (-) Eo’ Modified Eotvos number (-) f Activity coefficient (-)
F Force per unit volume (N/m3)
G Turbulence production term (kg/ms3)
G Gibbs free energy (J)
g Gravitational constant (m/s2)
H Bath height (m) κ Mass transfer coefficient (m/s)
k Turbulence kinetic energy (m2/s2)
l eddy size (m) L Bubble diameter, PBM model (m) M Molecular mass (kg/mol) N Number of bubble size i (-)
n Bubble number density probability function (m-3)
p Partial pressure (Pa) P Pressure (Pa) R Gas constant (J/molK) Re Reynolds number (-)
Sk, Sε, SH Source terms for turbulence eqns (m2/s2, m2/s3, kg/m3s)
Sc Schmidt number (-) T Temperature (K)
u Velocity (ms-1)
υ Kinematic viscosity (m2/s)
V Bubble volume (m3)

69
We Weber number (-) z Height of local grid cell (m) Greek Symbols α Volume fraction β Probability density function
γ Diffusivity (m2/s)
ρ Density (kg/m3)
μ Dynamic viscosity (kg/ms) σ Surface tension (Pa)/turbulence constants
ε Turbulence dissipation rate (m2/s3)
λ Collision probability (-) ω Collision frequency (-) τ breakage frequency (-) ξ dimensionless eddy size (-) Subscripts BIT Bubble induced turbulence c Collision eff Effective g Gas h Horizontal H Hydrogen i,j Bubble size bin in population balance model IF Interfacial k Turbulent kinetic energy L Lift l Liquid M Molecular n Nozzle q Phase s Species SM Sauter mean T Turbulent TD Turbulence dispersion VM Virtual mass Superscripts brk Breakage c Coalescence
Acknowledgements The authors would like to thank the Engineering and Physical Science Research Council (EPSRC(UK)) through the EPSRC Centre for Doctoral Training in Advanced Metallic Systems (EP/L016273/1) and Sheffield Forgemasters International Ltd. for their financial support.

70
Figures
Figure 1. Vacuum pressure and argon flowrate variation over degassing cycle.
Figure 2. (a) Schematic representation of ladle at SFIL illustrating cross sectional planes and geometric dimensions from (b) side view (Plane 1) and (c) top view (Plane 2).
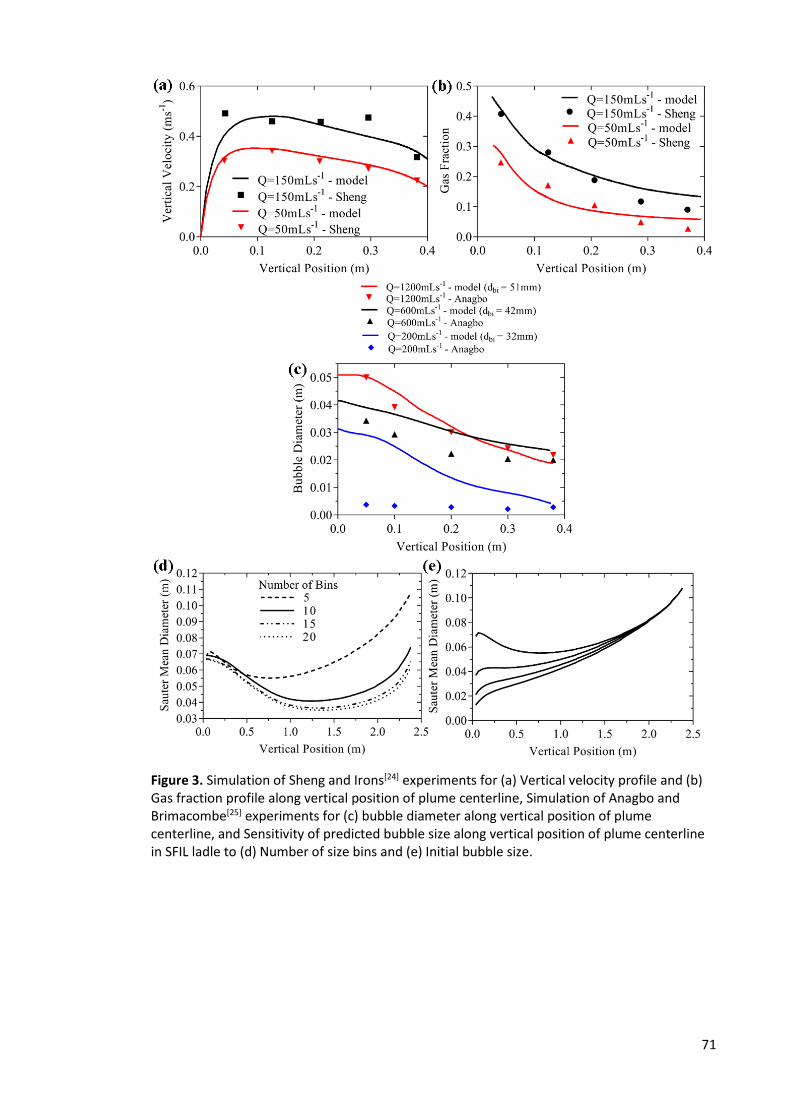
71
Figure 3. Simulation of Sheng and Irons[24] experiments for (a) Vertical velocity profile and (b) Gas fraction profile along vertical position of plume centerline, Simulation of Anagbo and Brimacombe[25] experiments for (c) bubble diameter along vertical position of plume centerline, and Sensitivity of predicted bubble size along vertical position of plume centerline in SFIL ladle to (d) Number of size bins and (e) Initial bubble size.

72
Figure 4. Molten steel flow field and hydrogen distribution across side profile plane (Plane 1) after 20 minutes of vacuum degassing for (a) slagless and (b) slag-containing melt, Volume fraction of slag eye viewed from top profile plane (Plane 2) after 20s of argon stirring for argon flowrates of (a) 170, (b) 237, and (c) 305 NLmin-1.

73
Figure 5. Slag eye diameter as a function of argon flowrate predicted by model and compared with experimental correlation of Peranandhanthan and Mazumdar.[28]
Figure 6. Comparison of measured and predicted final hydrogen content in steel after 20 minutes of vacuum degassing for a series of melts of varying initial hydrogen content.

74
Tables
Table 1. Chemical composition of steel along with corresponding interaction coefficients according to experimental data.
Element (Z) wt % Interaction
Coefficient (𝐞𝐇𝐙 )
Reference Number
C 0.77 0.06 [18]
Mn 0.2 -0.0014 [18]
P 0.005 0.011 [18]
S 0.005 0.008 [18]
Si 0.6 0.029 [19]
Cu 0.09 0.0004 [19]
B 0.0005 0.08 [19]
Cr 3.0 -0.008 [19]
Ni 0.5 -0.002 [20]
Ti 0.001 -0.08 [21]
Table 2. Physical properties of different phases and operating conditions of the VAD unit.
Parameter Value
Slag Thickness (m) 0.1
Slag Viscosity (kgm-1s-1) 0.04
Slag Density (kgm-3) 3000
Steel Viscosity (kgm-1s-1) 0.005
Steel Density (kgm-3) 7000
Argon Viscosity (kgm-1s-1) 2.125e-5
Argon Density (kgm-3) 1.62
Argon/Steel Surface Tension (Nm-1) 1.192
Slag/Argon Surface Tension (Nm-1) 0.58
Slag/Steel Surface Tension (Nm-1) 0.12
Temperature (K) 1871
Surface Pressure (bar) 0.0013

75
Table 3. Geometric comparison of SFIL ladle with validation cases of Sheng[24] and Anagbo[25].
SFIL Ladle
Sheng
Water Model
Anagbo
Water Model
Gas Flowrate (Nm3s-1)
0.003 0.00005-0.00012 0.0002-0.0012
Bath Height (m) 2.79 0.42 0.4
Gas Injector Diameter (m)
0.06 0.004 0.06
Table 4. Hydrogen content in molten steel before and after 20 minute degas measured by HYDRIS probe and predicted by model.
Pre-Degas Hydrogen
(ppm)
Post-Degas Hydrogen (ppm)
Measured Predicted
4.7 1.57 1.39
4.2 1.43 1.3
3.8 1.01 1.18
3.33 1.31 1.26
2.51 1.13 1.19
1.86 1.55 1.35

76
References
[1] C. Moore, R. I. Marshall: Steelmaking, The Institute of Metals, London, UK 1991. [2] D. Mazumdar, R.I.L. Guthrie, ISIJ Int. 1995, 35, 1. [3] W. Lou, M. Zhu: Metall. Mater. Trans. B, 2013, 44, 1251. [4] M. Iguchi, O.J. Ilegbusi, H. Ueda, T. Kuranaga and Z.I. Morita: Metall. Mater. Trans. B,
1996, 27, 35. [5] S. Kim, R. Fruehan: Metall. Mater. Trans. B, 1987, 18, 673. [6] D. Mazumdar, R.I.L. Guthrie: Metall. Mater. Trans. B, 2010, 41, 976. [7] S. Yu, S. Louhenkilpi: Metall. Mater. Trans. B. 2013, 44, 459. [8] J.W. Kor, P.C. Glaws, The Making, Shaping and Treating of Steel, AISE, Pittsburgh, PA,
USA 1998. [9] ANSYS, ANSYS FLUENT Theory Guide Version 16.1. ANSYS Inc., Canonsburg, PA, 2015. [10] B. E. Launder, D. B. Spalding, Comp. Meth. Appl. Mech. Eng., 1974, 3, 269. [11] A.A. Troshko, Y. A. Hassan, Int. J. Multiphase Flow. 2001, 27, 1965. [12] M. Ishii, N. Zuber, AIChE J. 1979, 25, 843. [13] A. Tomiyama, Proceeding of the Third International Conference on Multiphase Flow,
Lyon, France, 1998. [14] D.A. Drew, Annu. Rev. Fluid Mech. 1983, 15, 261. [15] A.D.B. Burns, 5th International Conference on Multiphase Flow, Yokohama, Japan,
2004. [16] ANSYS, ANSYS Population Balance Module Manual Version 16.1. ANSYS Inc.,
Canonsburg, PA, 2015. [17] H. Luo, H.F. Svendsen, AIChE J., 1996, 42, 1225. [18] M. Weinstein, J.F. Elliott, Trans. Metall. Soc. AIME. 1963, 227, 382. [19] W.M. Boorstein, R.D. Pehlke, Metall. Trans. 1974, 5, 399. [20] K. Gunji, K. Ono, Y. Aoki, Journal of Japan Institute of Metals. 1964, vol. 28, pp. 64-68. [21] M.M. Karnaukhov A.N. Morozov, Izvest. Akad. Nauk. SSSR, Otd. Tekhn. Nauk. 1948, 12,
1845. [22] J.C. Lamont, D.S. Scott, AIChE J. 1970, 16, 513. [23] K. Mori, M. Sano, T. Sato, Trans. Iron Steel Inst. Jpn., 1979, 19, 553. [24] Y. Sheng, G.A. Irons, Metall. Mater. Trans. B, 1993, 24, 695. [25] P.E. Anagbo, J.K. Brimacombe, Metall. Mater. Trans. B, 1990, 21, 637. [26] A. Ghosh, Secondary Steelmaking, Principles and Applications, CRC Press LLC, Florida,
USA, 2001. [27] K. Witchterie, Steel Research Int. 2010, 81, 5. [28] M. Peranandhanthan, D. Mazumdar, ISIJ Int., 2010, 50, 1622. [29] U. Singh, R. Anapagaddi, S. Mangal, K. A. Padmanabhan, Metall. Mater. Trans. B, A. K.
Singh, 2016, 47, 1804. [30] B. Carrier, M. Nadif, C. Gatellier, Rev. Metall. (Les Ulis, Fr.), 1988, 85, 307.

77
4.2. PAPER 2
Modeling The Effect of Plug Positions and Ladle Aspect Ratio on Hydrogen Removal in the Vacuum Arc Degasser
Faris Karouni, Bradley P Wynne*, Jesus Talamantes-Silva, and Stephen Phillips.
*Prof. B. P. Wynne, Faris Karouni
Department of Materials Science and Engineering, University of Sheffield, Mappin St, Sheffield, S1 3JD, UK.
Prof. J. Talamantes-Silva, Stephen Phillips
Sheffield Forgemasters International Ltd, Brightside Lane, Sheffield, S9 2RW, UK.
Contributions of Authors:
Name: Faris Karouni
Contribution: Primary Contributor. Planned and carried out the simulations, analysis of data.
Signed:_____________________________
Name: Bradley Wynne
Contribution: Academic supervisor of PhD project. Provided critical feedback and assistance in
preparation of manuscript.
Signed: _____________________________
Name: Jesus Talamantes-Silva
Contribution: Industrial supervisor of PhD project. Provided critical feedback and assistance in
preparation of manuscript.
Signed: _____________________________
Name: Stephen Phillips
Contribution: Provided critical feedback and assistance in preparation of manuscript.
Signed: _____________________________

78
The rate of hydrogen removal from molten steel in a vacuum arc degasser (VAD) is simulated using a three-phase (slag-argon-steel) Eulerian model. The time required to degas a 100 tonne melt from 5ppm to 1.5ppm is predicted for a series of ladle aspect ratios and plug layouts. Compared to an axisymmetric single plug system, the degassing time can be reduced by 36% with the use of three equiangular plugs. Increasing the aspect ratio (AR) of the melt from 0.8-1.2 leads to an improvement in degassing performance, followed by a reduction in performance between AR=1.2-1.6. A radial plug position of 0.5R is optimal for achieving low hydrogen levels in the melt. Reducing the inter-plug angle from θ=180° (for double plug) and θ=120° (for triple plug) to θ=45° further reduces this time by 18% and 3.8% respectively. The fastest rate of hydrogen removal is obtained through the use of three plugs at positioned at an angle of θ=45° and plug radial position of 0.5R. 1. Introduction
The vacuum arc degasser (VAD) is a critical ladle refining operation that ensures hydrogen and nitrogen levels in steel are kept to a minimum level. Argon bubbles are injected into the bottom of the ladle to promote stirring of the liquid steel and acting as a carrier gas for hydrogen transferred out of the melt. Efficient hydrogen removal typically requires vacuum conditions to be maintained for over 15 minutes, making it highly energy intensive. Optimising the ladle design and process conditions is therefore of prime importance in ensuring the process is cost effective.
It is practically impossible to perform experimental measurements of the flow field in an industrial ladle due to the visual opacity and high temperature of molten steel. On the other hand, resorting to scaled-down physical models leads to difficulties in maintaining dynamic similarity between systems and in replicating the physical properties of the slag layer with alternative materials. Computational fluid dynamics (CFD) allows simulation of any design condition of interest at minimal cost, and to analyse the resulting data (flow field, concentration of chemical species, etc) dynamically at all spatial positions. This can provide a wealth of data that overcomes the time-constraints, cost and physical limitations that would otherwise be encountered via experimental techniques. CFD involves solving mass and momentum conservation equations using numerical methods across finite volumes within a specified geometry. For a full review of different CFD techniques the reader is referred to the paper by Mazumdar and Guthrie.1] In the Eulerian method the phases are allowed to interpenetrate whereby one set of transport equations are solved per phase. The equations are coupled via a shared pressure field and interfacial force terms. Hydrogen transfer from one phase to another can be simulated by coupling the Eulerian model to a species transport model.2] This was further expanded on in a recent study by the current authors, who detailed a three-phase model in which the effect of slag phase and rapid expansion of bubbles on hydrogen removal were also considered.3] In that work the model predictions were validated against industrial data from a VAD unit at Sheffield Forgemasters International Ltd (SFIL) steelworks.
Selection of the optimal design and process parameters for ladle stirring has been the subject of several studies over the years.4-11] These have focussed on the argon plug position, number of plugs, argon flowrate and aspect ratio of the ladle. Physical and theoretical models of single and multi-plug ladles have concluded that the lowest mixing times are obtained for plug radial positions in the range of 0.5-0.75R (where R=vessel radius). 4,5,7,8,10]
The two-phase Eulerian model of Maldonado-Parra et al. identified 0.67R as the optimal position for the single plug case. 4] Moreover, upon consideration of heat transfer effects, they found that thermal mixing was enhanced with a central plug. Increasing the number of plugs from 1-3 increased the mixing time while improving thermal mixing. However, the presence of multiple bubble plumes acted as thermal barriers, limiting convective heat transfer between the liquid enclosed by the plume and the liquid between the plumes and the walls.

79
Tang et al. developed a 1/3rd scale water model of an industrial ladle with nitrogen injection through two bottom plugs.9] The mixing times were measured over a series of plug flowrates, flowrate ratio between plugs, plug angles, and plug radial positions. Mixing time increased between 0.55-0.64R and then decreased between 0.64-0.7R. This was explained by the competition between the circulation loop in between the two plumes and the loops between each plume and the tank wall. At first the closer plumes are more efficient because they produce strong near wall currents. This current weakens as R is increased, but the central current is strengthened as there is less interference between the two plumes and therefore an increased stirring energy. Eventually (at R=0.7) the increase in the central current outbalances the weakening of the near wall currents, creating an overall reduction in mixing time. In the case of unequal flowrates, with a flowrate of 2.3NL/min in one plug and 4.62NL/min in the other, the mixing time was reduced by 42% compared to an equal flowrate of 6.92NL/min between both plugs. CFD modelling using the volume of fluid (VOF) method showed that there was less interference between the plumes for unequal plug flow rates due to the asymmetry of the resulting plumes. Positioning the plug at a radial position of 0.55R and an angle between the plugs of 45° was the most efficient layout.
Cloete et al. makes the distinction between the quantity and quality of mixing performance.7]
The former is quantified by the kinetic energy of the melt while the latter is represented by the mixing time. Euler-Lagrange simulations showed that increasing the ladle aspect ratio (bath height-to-diameter ratio) of the bath from 0.65-1.2 increased the kinetic energy of the melt while reducing the mixing time. Beyond an aspect ratio of approximately 1.2, the mixing time then began to increase, which was attributed to the greater interference between bubble plumes in narrower ladles. A similar trend in mixing time as a function of aspect ratio was identified from physical modelling studies undertaken by Helle, and using Eulerian simulations by Turkoglu et al., but the point of minimal mixing time occurred at an aspect ratio of 1.0 and 1.5 in each study respectively.10-11] Furthermore, Cloete et al. found that reducing the angle between plugs in a triple plug system increased the kinetic energy but had a negligible effect on mixing time. The use of three plugs produced lower mixing times and higher kinetic energy than two plugs.7]
While increasing the gas flowrate may enhance mixing, the bubble-steel exchange of hydrogen, and desulphurisation via slag metal interactions, it also increases the entrainment of slag which can lead to reoxidation of steel, nitrogen pickup, and erosion of ladle refractories.12] In addition to mixing performance, the surface area of rising gas bubbles in contact with the melt is of prime importance in dictating the rate of hydrogen degassing during argon stirring in the VAD. The relative depth of a given region of gas-liquid interface directly affects the rate of hydrogen removal via the local partial pressure (Sievert’s Law) of hydrogen in the gas phase.
This work aims to quantify the effect of porous plug position and ladle aspect ratio on hydrogen removal. Single, double and triple plug arrangements will be considered. The degas time required to reach a hydrogen content of 1.5ppm and the distribution in the velocity field of the melt will be compared and contrasted for various case studies, with the aim of identifying the optimal design conditions for achieving low hydrogen levels in the VAD unit.
2. Numerical Model
The flow equations for slag, steel and argon are solved using a three-phase Eulerian model. This is coupled to a discrete population balance model to resolve the bubble-steel interfacial area and a mass transfer model to predict the rate of hydrogen removal from the melt.3]
Argon is assumed to be an ideal gas law with variable density while the steel and slag phases are assumed to be incompressible fluids. The physical properties of the phases and the flow equations are listed in Table 1. The governing equations of the Eulerian equations are shown in Table 2 and the interfacial force terms are shown in Table 3. 13-16]

80
The turbulence kinetic energy (k) and dissipation energy (ε) are expressed by the standard k-ε model[17]
kklllkll
k
Tlllll
lll SGGkkut
k
(1)
S)CGC(
ku
tll2kl
l
lll
Tlllll
lll (2)
where Gk is the production of turbulence kinetic energy, σk=1.00, σε=1.30, C1ε=1.44 and C2ε=1.92. Sk and Sε are the source terms in each equation due to bubble induced turbulence and are defined by Troshko and Hassan.18]
The hydrogen transport equations are listed in Table 4.19] The gas-liquid interfacial area concentration is calculated using the population balance model, as detailed in a previous paper by the authors.3] The concentration of atomic hydrogen in liquid steel in equilibrium with molecular hydrogen in the surrounding bubbles is given by Sievert’s Law:
2H
H
0
eq,H pf
)RT/Gexp(C
(3)
where standard Gibbs free energy, ∆G0 = 36485 + 30.46T, pH2= partial pressure of hydrogen
in bubble, T = melt temperature, R=ideal gas constant, fH = activity coefficient of hydrogen and is defined as follows
Z%eflog wt
Z
HH (4)
The interaction coefficients eHZ corresponding to each alloying element (Z) are obtained from
experimental data based on the steel chemistry shown in Table 5. 20-23]
The partial pressure of hydrogen in the bubbles is expressed as
ArArHH
HHbubbleH
MCMC
)MC(pp
2 (5)
where pbubble, MH and MAr are the pressure in the bubble and the molecular weights of hydrogen and argon respectively.
The predictive capability of the hydrogen transport model has been validated against measurements from several melts in a VAD unit at SFIL steelworks, for which hydrogen concentrations were extracted before and after the degas cycle using a HYDRIS measurement probe.3] Velocity inlet and pressure outlet boundary conditions were specified according to the argon purging rate and vacuum pressure respectively.
3. Results
A set of ladle designs are simulated to investigate the effect of plug layout and aspect ratio on hydrogen removal in the VAD unit. The plug layout is defined by the number of plugs, the radial position (r/R) of each plug and the angle between neighbouring plug(s), θ. Figure 1 illustrates the plug layout parameters. The aspect ratio (L/D) is defined by the ladle diameter (D) and melt height (L) both of which are varied to maintain a constant melt volume corresponding to a 100 tonne melt. For all simulations, a slag layer comprising 6% of the melt height is included on top of the melt and the overall argon flowrate is 13Nm3hr-1, with the flowrate per plug equal to the overall flowrate divided by the number of plugs.

81
The following performance metrics are used in this study, exploring both qualitative and quantitative differences between the simulated cases:
Hydrogen distribution and degassing time (t1.5) – Hydrogen distribution is illustrated using a mass fraction contour plot while t1.5 is defined as the time under vacuum required to degas the melt from 5ppm to 1.5ppm.
Velocity magnitude and flow field – the average velocity across horizontal planes of varying elevation (0.2L, 0.5L and 0.8L) and the velocity vector field of the melt indicate the regions of relative strong/weak flow.
3.1. Number of plugs
The effect of the number of plugs on degassing performance is shown in Figure 2. A comparison is made between single axisymmetric, double (θ=180°, 0.5R) and triple (θ=120°, 0.5R) plug layouts. The hydrogen distribution after a 20 minute degas and the corresponding melt velocity vectors along a central vertical plane are shown in Figure 2a. A general feature of all cases simulated is that the region of the melt in contact with the bubble plume has a lower hydrogen concentration than that of the surrounding melt, with the hydrogen content reducing with vertical elevation. This is a consequence of the partial pressure of hydrogen in the gas bubbles reducing with height which in turn reduces the solubility of hydrogen in molten steel due to Sievert’s Law. The dissolved hydrogen thus moves down an increasingly steep concentration gradient with vertical distance, maximising the hydrogen removal rate in the vicinity of the free surface.
The t1.5 value of a single axisymmetric plug (20.7 mins) is reduced by 21% and 36% with the introduction of a second (θ=180°, 0.5R) and third plug (θ=120°, 0.5R), respectively, as shown in Figure 2b. Although the overall argon flowrate is the same across all cases, the velocity vector plot (Figure 2a) illustrates the reason for their differing performance. While the central region above the plug is well mixed with a single plug, on either side of the bubble plume the magnitude of the of the melt is significantly weaker. The flow field comprises an upward flowing current driven by the bubbles that radially spreads towards the wall at the top of the melt before angling downwards, flowing towards the bottom wall, and recombining with the original current. The initial strength of the current driven by the bubbles is reduced as the flow changes direction upon reaching the free surface. The downward flowing current further weakens with increasing depth. At the bottom of the ladle near the ladle walls, it reaches its lowest magnitude. It is within this region that the hydrogen content is highest. As the melt velocity is reduced, the hydrogen transport rate from the bulk regions of the melt to the bubble interface is reduced, causing a build-up of hydrogen in these regions and greater inhomogeneity in hydrogen content across the melt. For the two plug ladle, the velocity near the walls is greater than that of the single plug. As the plugs are located at mid-radial positions, the radial distance between each plug and the walls is halved. This produces a more even distribution of the velocity field. Overall the combined action of the two rising plugs provides a greater rate of hydrogen removal despite the gas flowrate of each plug being equal to half that of the single plug.
The marginal improvement of an additional third plug is lower than that of introducing the second plug. This is understood by observing the velocity at a series of vertical positions within the melt as shown in Figure 2c. Here it is found that the 2 and 3 plug ladles produce a greater average melt velocity than the single plug, but the difference between the 2 and 3 plug ladles is minimal. Furthermore, the double plug has a higher average velocity at a vertical position of 0.9L than the triple plug. As the number of plugs is increased, the bubbles distribute over a greater horizontal cross section of the melt. This reduces the average distance between each bubble and the surrounding steel and the hydrogen has to undergo less convective transport in the melt to reach the bubble interface. Therefore, it can be inferred that despite the lack of improvement in the velocity field when moving from 2 to 3 plugs, the additional bubble plume increases spatial distribution of bubbles, providing a greater hydrogen removal rate from the melt.

82
3.2. Aspect ratio
The effect of varying the ladle aspect ratio between 0.8-1.6 on degassing time for single (axisymmetric), double (0.5R) and triple plug (0.5R) layouts is shown in Figure 3. The final hydrogen content in a central vertical plane after 20 minutes of degassing is shown in Figure 3a for AR=0.8 and 1.2 together with the velocity vectors within this plane. t1.5 decreases between AR=0.8-1.2 and then begins to increase between AR=1.2-1.6 (Figure 3b). This effect is explained as follows. As the AR is increased, the bubble plume occupies a greater proportion of the ladle diameter allowing more effective mixing and hydrogen removal from the surrounding steel. Parallel to this effect, the higher melt depth results in regions near the base of the ladle becoming subject to a greater hydrostatic pressure. The concentration of hydrogen in equilibrium with the bubbles is raised, lowering the concentration gradient for interfacial mass transfer. As the bath depth is increased, not only is this effect magnified, but the corresponding increase in distance between the base and free surface increases the time taken for the hydrogen rich melt in the base to reach the surface regions of low hydrostatic pressure. The vertical velocity field for the double plug as a function of AR is shown in Figure 3c. The velocity field continues to increase beyond AR=1.2 despite the reduction in hydrogen removal efficiency. This indicates that beyond a certain aspect ratio the benefit of higher velocities is outweighed by the lower rate of mass transfer due to hydrostatic pressure effects.
3.3. Plug position
The radial position of single, double (θ=180°, 0.5R) and triple (θ=120°, 0.5R) plug layouts was varied and the resulting changes in the final hydrogen content, velocity vectors, t1.5, and the velocity field are shown in Figure 4. The 0.5R position produces the lowest hydrogen content in the melt (Figure 4a) and minimal t1.5 value for single, double and triple plug systems (Figure 4b). As the plug is moved closer to the wall (0.8R) the velocity in the melt is reduced (Figure 4c). The width of the vertical current driven by the bubble plume is narrowed due to the radial expansion of the plume being constrained by its proximity to the wall. The 0.5R plug achieves a balance of being far enough from the central position so as to generate a strong circulation current, but not too far so as to prevent plume-wall interactions. This balance creates a flow field that supersedes both the axisymmetric position and 0.8R in velocity magnitude and hydrogen removal rate. The velocity vectors are stronger in magnitude across all vertical positions when the plug is at 0.5R compared to 0.2R and 0.8R (Figure 4c). The same is the case for the dual and triple plug systems.
3.4. Plug angle
The effect of varying the angle between subsequent plugs in double (0.5R) and triple (0.5R) plug systems is shown in Figure 5, ranging from diametrically opposed dual plugs (θ=180°) and equiangular triple plugs (θ=120°) to a minimum plug angle of θ=45°. The hydrogen distribution for the triple plug layouts of θ=45° and θ=120° are shown in Figure 5a. The results indicate that narrowing the angle provides greater hydrogen homogeneity and lower overall hydrogen levels. The equiangular layout results in a weaker flow zone in the central region separating the plumes. For the dual plug system, changing the inter-plug angle from θ=180° to θ=45° causes a 18% reduction in the degas time (t1.5) from 16.4 to 13.4 minutes (Figure 5b). For the three plug ladle, the degas time reduces by 3.8% from 13.2 to 12.7 minutes. The triple plug (θ=120°, 0.5R) outperforms the double plug (θ=180°, 0.5R) at all plug angles. The velocity field increases with reducing plug angle as shown for the triple plug case in Figure 5c. The potential for improving the performance of the three plug system with plug angle is limited due to the fact that it already exhibits a stronger flow field than the two plug system. Of all the design cases investigated the triple plug with θ=45° plug spacing positioned at 0.5R produces the fastest rate of hydrogen degassing and is recommended for industrial use.

83
4. CONCLUSION For a series of ladle designs, the hydrogen removal rates of a 100 tonne steel melt within a vacuum arc degasser operating at vacuum pressure of 1.3mbar and an argon flowrate of 13m3hr-
1 have been predicted using a three phase argon-steel-slag model based on the Eulerian method. A set of convection-diffusion equations with source terms for liquid-gas hydrogen transfer were solved to calculate the time-dependent evolution of hydrogen concentration throughout the melt. Simulations were designed to explore the effect of aspect ratio and plug positon on the rate of hydrogen removal. The conclusions are summarised as follows:
Double (θ=180°, 0.5R) and triple plug (θ=120°, 0.5R) ladles reduce the time taken to degas a 100 tonne melt of molten steel from 5 to 1.5ppm (t1.5) by 21% and 36% respectively when compared to a single axisymmetric plug. This is due to a greater spatial distribution in the flow field provided by multiple gas plumes.
Increasing the ladle AR for single, double and triple plug systems leads to a reduction in t1.5 between AR=0.8-1.2, followed by an increase in t1.5 between AR=1.2-1.6. While the flow field generally strengthens with AR, beyond AR=1.2 the increased solubility of hydrogen arising from the depth-dependent hydrostatic pressure limits the hydrogen removal rate.
The mid-radial plug position (0.5R) produces the lowest degassing time and greatest distribution of hydrogen throughout the melt for single, double and triple plug systems. For the three plug system, this position reduces the degassing time by 11% compared to the 0.2R position. When the plug position is more centralised (r<0.5R) the flow is weakened in the region between the gas plume and the ladle walls, while positioning the plugs too far from the centre (r>0.5R) limits the radial distribution of bubbles due to their interaction with the ladle walls.
For the dual and triple plug (0.5R) ladles, a plug angle of θ=45° produces the optimal hydrogen removal rate, reducing t1.5 by 18% and 3.8% in comparison to plug angles of θ=180° and θ=120° for each respective layout.
Of all the ladle design variables considered (aspect ratio, plug position and number of plugs), the number of plugs has the greatest impact on t1.5, followed by the aspect ratio. A three plug ladle (θ=120°, 0.5R) produces the fastest rate of hydrogen removal from molten steel in the VAD unit.
5. Nomenclature
A Interfacial area concentration (m2/m3)
C Mass fraction (-) Cµ, C1ε, C2ε Turbulence constants (-)
Cdrag, CL, CVM Drag/lift/virtual mass coefficients (-)
d Bubble diameter (m) D Death terms due to aggregation and breakage (-) Eo Eotvos number (-) Eo’ Modified Eotvos number (-) e Activity coefficient (-) f Interaction coefficient (-) F Force per unit volume (N/m3)
G Turbulence production term (kg/ms3)
G Gibbs free energy (J)

84
g Gravitational constant (m/s2)
H Bath height (m) κ Mass transfer coefficient (m/s) k Turbulence kinetic energy (m2/s2)
M Molecular mass (kg/mol) p Partial pressure (Pa) P Pressure (Pa) R Gas constant (J/molK) Re Reynolds number (-) Sk, Sε, SH Source terms for turbulence eqns (m2/s2, m2/s3, kg/m3s)
Sc Schmidt number (-) T Temperature (K) u Velocity (ms-1)
υ Kinematic viscosity (m2/s)
V Bubble volume (m3)
We Weber number (-) z Height of local grid cell (m) 5.1 Greek symbols α Volume fraction γ Diffusivity (m2/s)
ρ Density (kg/m3)
μ Dynamic viscosity (kg/ms) σ Surface tension (Pa)/turbulence constants ε Turbulence dissipation rate (m2/s3)
5.2 Subscripts Ar Argon b Bubble BIT Bubble induced turbulence c Collision eff Effective g Gas h Horizontal H Hydrogen IF Interfacial k Turbulent kinetic energy L Lift l Liquid M Molecular n Nozzle q Phase SM Sauter mean T Turbulent TD Turbulence dispersion VM Virtual mass
Acknowledgements The authors would like to thank the Engineering and Physical Science Research Council (EPSRC(UK)) through the EPSRC Centre for Doctoral Training in Advanced Metallic Systems (EP/L016273/1) and Sheffield Forgemasters International Ltd. for their financial support.

85
Figures
Figure 1. Argon plug arrangement on ladle baseplate.

86
Figure 2. The effect of the number of argon plugs on (a) hydrogen distribution in melt after 20 minute degas and melt velocity field, (b) t1.5, (c) average melt velocity as a function of vertical position for single (axisymmetric), dual plug (θ=180°, 0.5R), triple plug (θ=120°, 0.5R) layouts.

87
Figure 3. The effect of ladle aspect ratio for single, double (θ=180°, 0.5R) and triple (θ=120°, 0.5R) plugs layouts on (a) hydrogen distribution in melt after 20 minute degas and melt velocity field, (b) t1.5, (c) average melt velocity for double plug (θ=180°, 0.5R) ladle as a function of vertical position.

88
Figure 4. The effect of single, double (θ=180°) and triple (θ=120°) plug radial position on (a) hydrogen distribution in melt after 20 minute degas and melt velocity field, (b) t1.5, (c) average melt velocity as a function of vertical position for single plug.

89
Figure 5. The effect of double (0.5R) and triple (0.5R) plug angle on (a) hydrogen distribution in melt after 20 minute degas and melt velocity field, (b) t1.5, (c) average melt velocity as a function of vertical position for triple plug.

90
Tables
Table 1. Physical properties of multiphase system.
Parameter Value
Slag viscosity (kgm-1s-1) 0.04
Slag density (kgm-3) 3000
Steel viscosity (kgm-1s-1) 0.005
Steel density (kgm-3) 7000
Argon viscosity (kgm-1s-1) 2.125e-5
Argon density (kgm-3) 1.62
Argon/steel surface tension (Jm-2) 1.192
Slag/argon surface tension (Jm-2) 0.58
Slag/steel surface tension (Jm-2) 0.12
Temperature (K) 1871
Surface pressure (bar) 0.0013
Argon flowrate (Nm3hr-1) 13
Mass of melt (tonnes) 100

91
Conti
nuit
y
equat
ion
∇∙αqρquq=
0
volu
me
frac
tion o
f ph
ase
q,
,
Mom
entu
m
equat
ion
p=
pre
ssure
, ef
fect
ive
vis
cosi
ty,
mole
cula
r
vis
cosi
ty,
μT
=tu
rbule
nt
vis
cosi
ty.
Tab
le 2
. G
over
nin
g e
quat
ions
for
mult
iphas
e fl
ow
in t
he
vac
uum
arc
deg
asse
r.

92
Dra
g
forc
e[13]
,
Lif
t fo
rce[1
4]
,
Turb
ule
nce
dis
per
sion
forc
e[15]
Vir
tual
mas
s
forc
e[16]
Tab
le 3
. In
terf
acia
l fo
rce
term
s fo
r E
ule
rian
model
.

93
Table 4. Governing equations for hydrogen transport model.
Table 5. Hydrogen interaction coefficients for alloying elements in liquid steel.
Element (Z) wt % Interaction Coefficient (𝐞𝐇𝐙 ) Reference
C 0.15 0.06 20]
Mn 0.5 -0.0014 20]
P 0.005 0.011 20]
S 0.005 0.008 20]
Si 0.28 0.029 21]
Cu 0.09 0.0004 21]
B 0.0005 0.08 21]
Cr 3-5 -0.008 21]
Ni 1.55 -0.002 22]
Ti 0.001 -0.08 23]
Hydrogen transport equation
q,H
q,T
q,T
Hqq
q,Hqqq
q,Hqq
SSc
Cut
C
CH,q = mass fraction of hydrogen in
phase q, H =hydrogen diffusivity,
ScT=turbulent Schmidt number and µT = turbulent viscosity.
Source terms )CC(kAS l,Heq,Hll,H l,Hg,H SS , k= mass transfer
coefficient, interfacial area concentration,
SMg d6A and
Ceq=equilibrium concentration of hydrogen in steel.
Mass transfer coefficient[19]
5.0
D3.0k
D=diffusion coefficient of hydrogen in steel, υ= kinematic viscosity of steel and ε= turbulence dissipation rate of steel.

94
References
1] D. Mazumdar, R.I.L. Guthrie, ISIJ Int. 1995, 35, 1. 2] S. Yu, S. Louhenkilpi: Metall. Mater. Trans. B. 2013, 44, 459. 3] ((Work accepted)) F. Karouni, B. P. Wynne, J. Talamantes-Silva, S.Phillips, Steel Research
Int. 2018, DOI: /(srin.201700550) 4] F. D. Maldonado-Parra, M. A. Ramirez-Argaez, A. N. Conejo, C. Gonzalez, ISIJ Int. 2011,
51, 1110. 5] A. M. Amaro-Villeda, M. A. Ramirez-Argaez, A. N. Conejo, ISIJ Int. 2014, 54, 1. 6] S. Joo, R. I. L. Guthrie, Metall. Mater. Trans. B. 1992, 23, 765. 7] S. W. P. Cloete, J. J. Eksteen, S. M. Bradshaw, Miner. Eng. 2013, 46, 16. 8] M. S. C. Terrazas, A. N. Conejo, Metall. Mater. Trans. B. 2015, 46, 711. 9] H. Tang, X. Guo, G. Wu, Y. Wang, ISIJ Int. 2016, 56, 2161. 10] L. W. Helle, J. South. Afr. Inst. Min. Metall. 1981, 81, 329. 11] H. Turkoglu, B. Farouk, ISIJ Int. 1991, 31, 1371. 12] D. Mazumdar,P. Dhandapani, R. Sarvanakumar, ISIJ Int. 2017, 57, 286. 13] M. Ishii, N. Zuber, AIChE J. 1979, 25, 843. 14] A. Tomiyama, Proceeding of the Third International Conference on Multiphase Flow,
Lyon, France, 1998. 15] A.D.B. Burns, 5th International Conference on Multiphase Flow, Yokohama, Japan,
2004. 16] D.A. Drew, Annu. Rev. Fluid Mech. 1983, 15, 261. 17] B. E. Launder, D. B. Spalding, Comp. Meth. Appl. Mech. Eng., 1974, 3, 269. 18] A.A. Troshko, Y. A. Hassan, Int. J. Multiphase Flow. 2001, 27, 1965. 19] J.C. Lamont, D.S. Scott, AIChE J. 1970, 16, 513. 20] M. Weinstein, J.F. Elliott, Trans. Metall. Soc. AIME. 1963, 227, 382. 21] W.M. Boorstein, R.D. Pehlke, Metall. Trans. 1974, 5, 399. 22] K. Gunji, K. Ono and Y. Aoki: Journal of Japan Institute of Metals. 1964, 28, 64. 23] M.M. Karnaukhov A.N. Morozov, Izvest. Akad. Nauk. SSSR, Otd. Tekhn. Nauk. 1948, 12,
1845.

95
4.3. PAPER 3
A Parametric Study on the Effects of Process Conditions on Dehydrogenation, Wall Shear and Slag Entrainment in the Vacuum Arc Degasser using Mathematical Modelling
Faris KAROUNI1)*, Bradley P WYNNE2), Jesus TALAMANTES-SILVA3), and Stephen PHILLIPS4).
1) PhD Student, Department of Materials Science and Engineering, University of Sheffield, Mappin St, Sheffield, S1 3JD, UK.
2) Department of Materials Science and Engineering, University of Sheffield, Mappin St, Sheffield, S1 3JD, UK.
3,4) Sheffield Forgemasters International Ltd, Brightside Lane, Sheffield, S9 2RW, UK.
* Corresponding author: E-mail: [email protected]
Contributions of Authors:
Name: Faris Karouni
Contribution: Primary Contributor. Planned and carried out the simulations, analysis of data.
Signed:_____________________________
Name: Bradley Wynne
Contribution: Academic supervisor of PhD project. Provided critical feedback and assistance in
preparation of manuscript.
Signed: _____________________________
Name: Jesus Talamantes-Silva
Contribution: Industrial supervisor of PhD project. Provided critical feedback and assistance in
preparation of manuscript.
Signed: _____________________________
Name: Stephen Phillips
Contribution: Provided critical feedback and assistance in preparation of manuscript.
Signed: _____________________________

96
The effect of vacuum pressure and argon flow rate on hydrogen degassing of molten steel in a triple plug, 100 tonne vacuum arc degasser has been examined using a three phase Eulerian CFD-mass transfer coupled model. The model takes into account the interaction between the slag, steel and argon phases over a 20-minute degassing period. Increasing the argon flowrate from 13-29 Nm3hr-1 produces a 10% increase in the hydrogen removal ratio, generating a faster melt velocity and larger slag eye. This also results in the maximum shear stress on the ladle walls increasing by a factor of 2.2 and the shear stress integrated across the wall increasing by a factor of 3.75, thus contributing to enhance refractory erosion. Within the same flowrate range the volume of entrained slag also increases by a factor of 1.4, which may result in increased nitrogen/oxygen pickup. Reducing the vacuum pressure maintains a low equilibrium hydrogen concentration and allows more efficient hydrogen removal, with a 38% reduction in the removal ratio between 102-104 Pa.
1. Introduction
Ladle metallurgy involves the treatment of molten steel produced from primary steelmaking furnaces in order to achieve the desired chemistry and lower the hydrogen, nitrogen, sulphur, and phosphorus content. A standard feature of these processes is the introduction of argon via a porous plug as a stirring agent to homogenise the melt and allow the transfer of dissolved gases out of the melt via diffusion into the bubbles. The presence of a buoyant slag phase above the melt serves to trap inclusions that rise with the bubbles and aids in desulphurisation. The rising bubble plume induces an upward flowing current in the melt that deforms the slag layer and forms an open eye, exposing the molten steel to the atmosphere. Central to ladle refining operations is vacuum degassing, a process through which the hydrogen and nitrogen content in steel is reduced via tank (vacuum arc degassing, VAD) or recirculating (RH degassing) methods operating under surface pressures close to 102 Pa.
Mathematical modelling of the flow field in gas-stirred ladles have followed the finite volume computational fluid dynamics (CFD) approach based upon the volume of fluid (VOF) method1,2), Euler-Lagrange3,4) and Eulerian5,6) methods. The VOF method is an interface tracking technique in which a single set of equations are solved across all phases. A sufficiently fine mesh is required to resolve each bubble making this method ideally suited for systems containing one or a small number of bubbles. The Eulerian model involves solving a separate transport equation for each phase with the assumption that the phases interpenetrate within each unit cell. This makes it less grid-sensitive and hence computationally more efficient than the VOF method7), particularly when handling large geometries containing a large number of bubbles, for which the latter approach would require significantly more grid cells. Lou and Zhu5) performed a detailed analysis and validation of the two-phase Eulerian method for modelling gas-stirred ladles. Predictions of the liquid velocity and turbulent kinetic energy were in close agreement with experimental data from physical models. Further simulations also showed a marginal improvement in the accuracy of the Eulerian model in comparison to the Euler-Lagrange model.
The performance characteristics of a gas-stirred ladle are typically measured using the mixing time. Physical models are adopted in which tracer is injected into the melt and the time taken for the concentration to homogenise to 95% of the equilibrium composition is measured. Various papers have investigated the role of flowrate on mixing time8-10 in gas-stirred ladles. The presence of the buoyant slag layer in these analyses have been factored in through the use of material analogues, which have been used to incorporate the presence of the layer and its associated thickness into the correlation of mixing time. Mazumdar11) showed that buoyant energy is lost from the gas plume primarily to bubble slippage and wall friction, with 10% lost to the slag layer interactions, primarily via the large velocity gradient in the melt caused by the interaction between the rising flow field and the edge of the slag eye.
The relative motion between the periphery of the slag eye and the steel current colliding with it destabilises the slag layer, causing droplets to detach from it and submerge into the melt in the

97
direction of the flow field. This is known as entrainment. While entrainment accelerates the desulphurisation of the melt, it can lead to re-oxidation and nitrogen pickup. Singh et al2) demonstrated that purging argon through a twin plug arrangement is favourable for sulphur removal in comparison to a single plug, as the former leads to more deformation of the slag layer which in turn increases the slag-steel contact area. The single plug produces a larger slag eye but lowers the total interfacial area with the steel. Thicker slags tended to enhance desulphurisation and reduce the slag eye size. The entrainment rate has been quantified in the literature in terms of the percent volume of slag entrained per unit time12), vertical velocity at interface13 and the number of slag droplets entrained per second14). Qualitative studies of entrainment have also been done in Eulerian15) and Euler-Lagrange16) models.
Furthermore, the slag layer affects the rate of hydrogen degassing via the size of the open eye formed from deformation by the gas-liquid plume which, together with the argon bubbles, serves as an interface for mass transfer.
Various new phenomena come into play with adoption of vacuum pressures to ladle refining operations. Guo and Irons17) highlighted the relative importance of vacuum pressure over argon flowrate on the decarburisation rate of molten steel using a physical model of carbon dioxide desorption from sodium hydroxide solution. The influence of vacuum pressure on hydrogen degassing is apparent from Sievert’s Law, whereby the solubility of hydrogen in molten steel is proportional to the square root of the partial pressure of hydrogen in the gas phase. This law can be incorporated into a mass transfer model and combined with CFD analysis to predict the rate of hydrogen transfer from the melt into the gas phase6). A three-phase Eulerian-mass transfer coupled model has been developed by the authors and validated against physical models in the literature and industrial hydrogen measurements from a VAD unit at Sheffield Forgemasters International steelworks18).
The purpose of this paper is to perform a parametric study on the effect of vacuum pressure and argon flowrate on the hydrogen removal performance of a VAD unit. The Eulerian method18 is used to solve transport equations for the argon, steel and slag phases. Limitations on these process parameters resulting from the deformation of the slag layer, slag entrainment and wall shear are investigated and discussed.
2. Numerical model and assumptions
The three-phase Eulerian method is adopted to predict the flow fields of the slag, steel and argon phases. The details of the model are outlined in the recent study by the authors18) and summarised in Table 1.
2.1. Flow Equations
The Eulerian method19) solves a separate set of transport equations for each phase. Separate phases are allowed to interpenetrate, and interfacial forces are modelled using additional source terms to the momentum equation. The continuity equation for phase q is
0u
tqqq
…………………………………………………………………………………………….… (1)
and the momentum conservation equation is
IFqq
Tqqq,effqqqqq
qqqFguupuu
t
u
……… (2)
where αq=volume fraction of phase q, ρ=density, u=velocity, p=pressure, t=time.
The interfacial force term FIF is expressed as
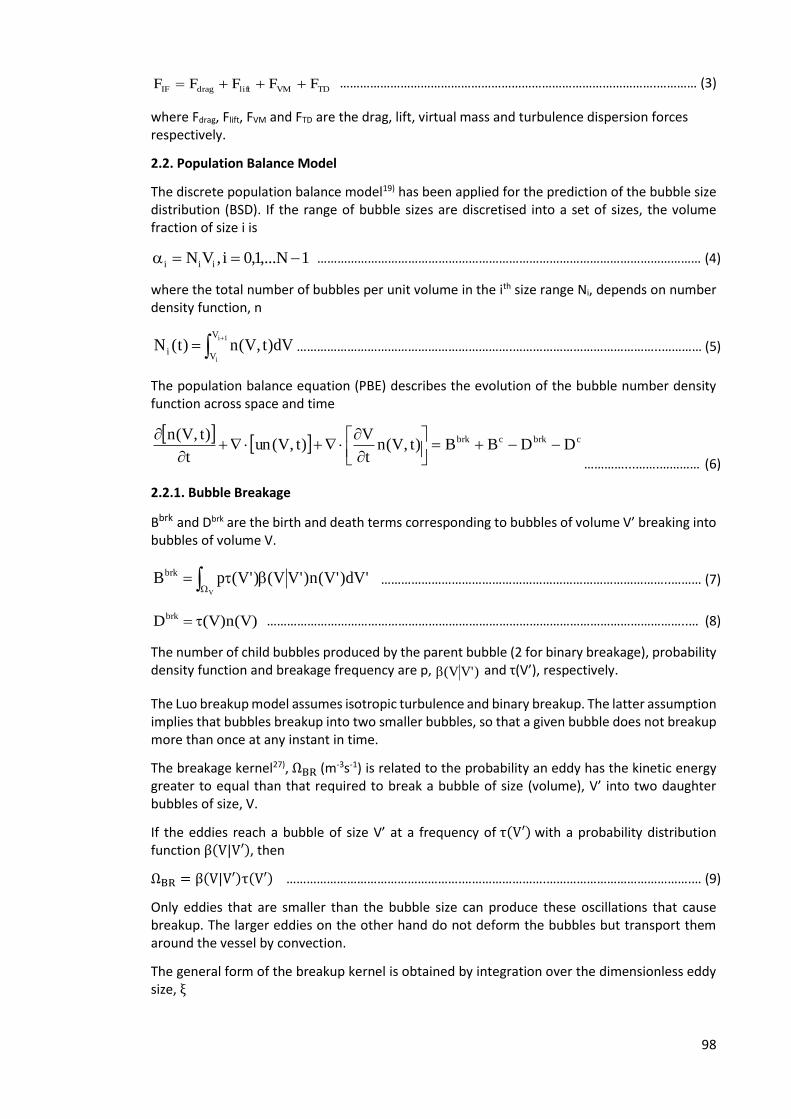
98
TDVMliftdragIF FFFFF ………………………………………………………………………………….………… (3)
where Fdrag, Flift, FVM and FTD are the drag, lift, virtual mass and turbulence dispersion forces respectively.
2.2. Population Balance Model
The discrete population balance model19) has been applied for the prediction of the bubble size distribution (BSD). If the range of bubble sizes are discretised into a set of sizes, the volume fraction of size i is
1N,...1,0i,VN iii …………………………………………………………………………………………………… (4)
where the total number of bubbles per unit volume in the ith size range Ni, depends on number density function, n
1i
i
V
Vi dV)t,V(n)t(N ……………………………………………………….……………………………………..………… (5)
The population balance equation (PBE) describes the evolution of the bubble number density function across space and time
cbrkcbrk DDBB)t,V(n
t
V)t,V(un
t
)t,V(n
…………...…….………… (6)
2.2.1. Bubble Breakage
Bbrk and Dbrk are the birth and death terms corresponding to bubbles of volume V’ breaking into bubbles of volume V.
'dV)'V(n)'VV()'V(pBV
brk
…………………………………………………………………………..……… (7)
)V(n)V(Dbrk ……………………………………………………………………………………………………………..… (8)
The number of child bubbles produced by the parent bubble (2 for binary breakage), probability density function and breakage frequency are p, )'VV( and τ(V’), respectively.
The Luo breakup model assumes isotropic turbulence and binary breakup. The latter assumption implies that bubbles breakup into two smaller bubbles, so that a given bubble does not breakup more than once at any instant in time.
The breakage kernel27), ΩBR (m-3s-1) is related to the probability an eddy has the kinetic energy greater to equal than that required to break a bubble of size (volume), V’ into two daughter bubbles of size, V.
If the eddies reach a bubble of size V’ at a frequency of τ(V′) with a probability distribution function β(V|V′), then
ΩBR = β(V|V′)τ(V′) …………………………………………….…………………….…………………………………….… (9)
Only eddies that are smaller than the bubble size can produce these oscillations that cause breakup. The larger eddies on the other hand do not deform the bubbles but transport them around the vessel by convection.
The general form of the breakup kernel is obtained by integration over the dimensionless eddy size, ξ

99
dd047.2
]1)5.01(5.0[12exp
1
L923.0)V,'V(
3532811
32321
Ll 311
231
2brkmin
…
…………………………………………………………………………………………………………………………………………..(10)
where l=eddy size, L=bubble diameter and ξ = l L⁄ .
2.2.2. Bubble Aggregation
Bc and Dc correspond to the birth and death terms rate due to aggregation of bubbles of volume V-V’ and volume V’. The aggregation kernel27), ac (m3s-1) is the product of the binary collision frequency for bubbles of volume Vi and Vj , ωc(Vi,Vj) and collision probability λc,
'dV)'V(n)'VV(n)'V,'VV(a5.0BV
0
c ………………………………………………………………… (11)
'dV)'V(n)V(n)'V,V(aD0
c
………………………………………………………………………………… (12)
)V,V()V,V(a jicjicc …………………………………………………………………………………….....…… (13)
where
ijjijic unn)LL(4
……………………………………………………………………………………………..… (14)
The characteristic velocity of bubble collision,
5.032
j
32
i
31ij LL43.1u ………………………………………………………………………………………………(15)
5.0
3ji
5.0lg
23ji
2ji
c We)LL1()5.0(
)LL(1)LL(175.0exp …………………………….………… (16)
with Weber number
2
ijil uLWe ……………………………………………………………………………..…………………………………… (17)
The sauter mean diameter is given by
2ii
3ii
SMLN
LNd
…………………………………………………………………………………………………….…………… (18)
2.3. Mass Transfer Model
The reversible transfer of atomic hydrogen dissolved in molten steel to gaseous molecular hydrogen is described by the equation
[H] ⇌1
2H2 ……………………………………………………………………………………………………………………… (19)
From Sievert’s Law, the concentration of dissolved hydrogen in equilibrium with gaseous hydrogen, CH,eq is
2H
H
0
eq,H pf
)RT/Gexp(C
……………………………………………………………………………..……. (20)

100
where standard Gibbs free energy, ∆G0 = 36485 + 30.46T, pH2= partial pressure of hydrogen
in gas, T = temperature, R=ideal gas constant, fH = activity coefficient of hydrogen, where
Z%eflog wt
Z
HH …………….……………………………………………………………………………..…….…. (21)
The interaction coefficients eHZ corresponding to each alloying element (Z) are determined from
the elemental composition of a melt manufactured at Sheffield Forgemasters International Limited (SFIL) steelworks listed in Table 2.
The partial pressure of hydrogen in the gas phase is expressed as
ArArHH
HHbubbleH
MCMC
)MC(pp
2 …………………………………………………………….….… (22)
where pbubble is the bubble pressure and M is the molecular mass of hydrogen or argon.
The mass fraction of hydrogen in the steel and argon phases are solved using a convection-diffusion species transport equation
q,H
q,T
q,T
Hqqq,Hqqq
q,HqqS
ScCu
t
C
……………..…… (23)
where α=volume fraction, ρ=density, u=velocity CH=mass fraction of hydrogen, γH=hydrogen diffusivity, ScT=turbulent Schmidt number and μT is the turbulent viscosity. SH,q is the hydrogen transfer rate across the gas/liquid interface. This is driven by the
concentration gradient between hydrogen in the melt (CH,l) and the equilibrium concentration
(CH,eq), via
)CC(AS l,Heq,Hll,H ……………………………………………………………………………………….…… (24)
where κ is the mass transfer coefficient. The interfacial area concentration, A is defined as A= 6αg dSM⁄ , where
g is the gas volume fraction and the and dSM is the sauter mean diameter
obtained from the discrete population balance model18). The hydrogen pickup in the gas phase is expressed as SH,g = −SH,l.
3. Results and Discussion
The ladle geometry, material properties and process conditions are listed in Table 3. The ladle adopted for all simulations consists of three argon plugs, each of which is located at a mid-radial position with an inter-plug angle of 45o. This design was found to produce optimal hydrogen removal rates in a previous study by the authors28) in comparison to single and double plug designs. Based upon this standard ladle design, the purpose of the current study is to investigate the influence of VAD process conditions (argon flowrate and vacuum pressure) on hydrogen removal. The all-hexahedral computational mesh is shown in Fig. 1, together with the argon plug layout and the cross sectional plane used for analysing the resulting data.
3.1. Flowrate
The hydrogen removal ratio (RR) as a function of argon flowrates between 13-29 Nm3hr-1 is
shown in Fig. 2, where RR = 0t20t0t HHH , H=mass fraction of hydrogen in the melt and
t=degassing time (in minutes). The flowrate values refer to the combined flowrate summed across all three plugs, with an equal flowrate passing through each plug. The range of flowrates was selected based on the typical range expected in industry across light and heavy stirring operations29).

101
The changes in hydrogen content over a degassing period of 20 minutes for argon flowrates between 13-29 Nm3hr-1 are shown in Fig. 3. The removal ratio increases from 0.77 to 0.85 between these flowrates. The velocity field, slag layer and interfacial hydrogen transfer rate contours at the start of the degassing period along the vertical plane are shown in Fig. 4. The factors contributing to this improvement in hydrogen removal are explained as follows.
As the flowrate increases, the total gas fraction in the bath increases, providing greater bubble-liquid surface area for hydrogen transfer. Furthermore, the flow field of the melt is enhanced. This has the dual effect of increasing the mixing of hydrogen within the melt and increasing the mass transfer coefficient for interfacial transfer. An added consequence of higher flowrates is the greater interaction between the melt and the slag layer. As the argon bubbles rise, the vertically flowing steel pushes slag in the radial direction, exposing a region of the melt (the slag eye) to the vacuum. The slag eye increases in size with flowrate which increases the proportion of the free surface exposed to the vacuum chamber. Together, these factors result in an increase in the concentration gradient for hydrogen removal, interfacial area and mass transfer coefficient, which is reflected in the greater interfacial transfer rate, as shown in the mass transfer contour diagram.
To analyse the deformation of the slag layer during argon-stirring, the fraction of the total slag volume that is entrained beneath the lower edge of the slag layer is calculated, as shown in Fig. 5. This is plotted alongside the average vertical velocities of the slag phase within a 0.2m-thick cross sectional slice at the slag-steel interface. The volume of entrained slag is found to increase by a factor of 1.4 across the flowrate range (13-29 Nm3hr-1), while there is a three-fold increase in the vertical slag velocity at the interface. The downward flow of the slag results in increasing depth of entrainment into the melt. Strong circulation currents produced by argon bubbling also causes preferential localised wear of the ladle refractory lining30). Damage can occur due to shear stresses dislodging grains from the refractory or chemical attack via turbulence-enhanced mass transfer from the slag layer to the refractory surface. In order to investigate this phenomena, the wall shear stress contours have been computed as a function of argon flowrate, shown in Fig. 6. Where the bubble plumes produced from these plugs meet the slag layer, the slag-steel interaction produces the region of highest wall shear in the ladle, in the upper third of the ladle, as shown by the shear stress distribution. The plumes expand radially as they rise, interacting with the wall to an increasing extent with vertical position. The shear stress on the wall reaches a peak value at the bath surface in the region of the slag layer. Within this region there is a higher stress concentration in the path of the two outermost plumes compared to that of the central plume in the triple plug arrangement. As the flowrate is increased there is a build-up of shear stress, particularly in the region at the top of the bath by the slag layer as shown in the contour plot. Most of the shear on the base is located near the two outermost plugs, at where the flow field is most intense. In addition to the side walls, the shear stress concentration within the horizontal basal plane of the ladle also increases with argon flowrate. The maximum shear stress value across the entire wall and basal plane of the ladle is plotted as a function of argon flowrate in Fig. 7. The shear stress increases by a factor of 2.2 across the flowrate range of 13-29 Nm3hr-1. The integrated shear stress over the entire wall is shown in the same figure and increases by a factor of 3.75 from 4 to 15N between 13-29 Nm3hr-1 of argon purging. In summary, while increasing the argon flowrate is preferable for hydrogen removal, it also leads to an accompanying increase in refractory shear stress and entrainment of slag into the melt.
3.2. Pressure
The hydrogen removal ratio was calculated for a series of vacuum pressures between 102-104 Pa at a constant argon flowrate of 13 Nm3hr-1. The results are shown in Fig. 8 along with the hydrogen variation in the melt as a function of time for these pressures (Fig. 9). As the vacuum pressure is raised between 102-104 Pa there is a reduction in RR from 0.77 to 0.48. The reduction in pressure is accompanied by a reduction in the hydrogen concentration in the melt in equilibrium with that in the gas phase according to Sievert’s Law (Eq. 20). This concentration

102
dictates the lower bound to which hydrogen content in steel can be degassed. A lower pressure increases the concentration gradient (Eq. 23) and hence the rate of hydrogen removal at a given flowrate.
The vertical variation in the equilibrium concentration along the centreline of the bubble plume is shown in Fig. 10. This is plotted alongside the hydrogen concentration in the bubbles as shown in Fig. 11. The rate of interfacial mass transfer at the start of the degassing period along the vertical plane is shown in Fig. 12 for the two different vacuum pressures. Three distinct stages can be identified on the equilibrium curve (Fig. 10). Hydrogen removal from the melt begins as soon as the bubbles exit the porous plug (which are initially composed of pure argon). In the first stage, (at a vertical distance from the base of 0-0.5m), there is a sudden rise in equilibrium concentration from 0 to 5wt%. As hydrogen is picked up by the bubbles, there is a rise in the molar fraction of hydrogen and hence its partial pressure. As shown in the Fig. 12 the mass transfer rate is maximised both in this region (at the base) and the region near the free surface. During the second stage (between 0.5m-2.5m) the equilibrium concentration begins to plateau at 5ppm and then reduces. The reason for this plateau is the increase in partial pressure of hydrogen due to higher molar concentration in the bubbles. The hydrogen pickup from the argon bubbles remains largely unchanged for vacuum pressures of 102 and 104 Pa in the first two stages. The influence of vacuum pressure becomes noticeable during the third stage, in the final 0.5m of rising distance (2.5-2.9m). The equilibrium concentration for the 104 Pa pressure case descends at a slower rate than the 102 Pa case, reaching 2.7ppm (for 104 Pa) and 0.4ppm (for 102
Pa). The H content within the bubbles increases at its fastest rate during this phase. Fig. 12 illustrates this effect, where the 102 Pa case has a larger mass transfer rate in the top half of the bath compared to 104 Pa case. The hydrogen content in the bubbles reach a final value of 8.5% for 5.5% at the free surface for vacuum pressures of 102 Pa and 104 Pa respectively (Fig. 11). This variation in hydrogen pickup is reflected in the variation of the RR between the two pressures (Fig. 8). As the bubbles approach the surface, there is a rapid decrease in the bubble pressure with an accompanying increase in the mass fraction of hydrogen within each bubble. The bubble pressure in the melt decreases (due to hydrostatic pressure changes) at a faster rate than the simultaneous increase in hydrogen content of the bubbles. The net effect is that there is an overall reduction in partial pressure of hydrogen and equilibrium concentration, resulting in an increase in hydrogen transfer rate.
4. Conclusion
Hydrogen degassing in the VAD was simulated by coupling a mass transfer model to a three phase, slag-steel-argon CFD model based on the Eulerian method. The effect of argon flowrate and vacuum pressure on hydrogen removal rates, slag entrainment and wall shear were analysed for a triple plug ladle of inter-plug angle, θ=45˚. The conclusions can be summarised as follows:
Argon flowrate influences the velocity field in the melt, with higher flowrates increasing the rate of convective hydrogen transfer from regions of bulk liquid to the liquid-gas interface, increasing the rate of hydrogen removal. The slag eye is simultaneously expanded providing a greater surface area for hydrogen to transfer out of the steel. There is a 10% increase in RR between 13-29 Nm3hr-1.
Increasing the argon injection rate within this range also results in the following side effects:
o A region of high wall shear stress concentration occurs in the region beneath the slag eye where the flow field in the melt and slag layer induced by the bubble plume interacts with the wall. This maximum shear stress across the wall and the total wall area-integrated stress increase by a factor of 2.2 and 3.75 across
the above flowrate range, respectively, increasing the risk of refractory erosion. o The volume of slag entrained into the steel melt and the vertical slag velocity at
the slag-steel interface increase by a factor of 1.4 and 3, respectively. Despite

103
aiding in the desulphurisation of steel, entrainment detrimentally affects cleanliness via nitrogen and oxygen pickup.
Reduction of vacuum pressure has the dual effect of increasing the rate of hydrogen removal and permitting lower hydrogen contents to be reached according to Sievert’s Law. The hydrogen removal ratio (RR) experiences a 38% reduction as the pressure is raised from 102-104 Pa. The hydrogen removal rate is governed by the concentration of hydrogen dissolved within the steel in equilibrium with that of the gas phase, which is in turn influenced by the vacuum pressure. Hydrogen transfer is concentrated in the region close to the plug exit where the gas velocity and volume fraction of gas are greatest, in addition to the near-surface region where the partial pressure of hydrogen in the bubbles is lowest.
Acknowledgements
The authors would like to thank the Engineering and Physical Science Research Council (EPSRC(UK)) through the EPSRC Centre for Doctoral Training in Advanced Metallic Systems (EP/L016273/1) and Shefeld Forgemasters International Ltd. for their fnancial support.

104
Figures
Fig. 1. Computational mesh and porous plug arrangement on base plane of ladle.

105
Fig. 2. Effect of argon flowrate on hydrogen removal ratio over 20 minutes of degassing.
Fig. 3. Effect of argon flowrate on hydrogen decay profile over 20 minutes of degassing.
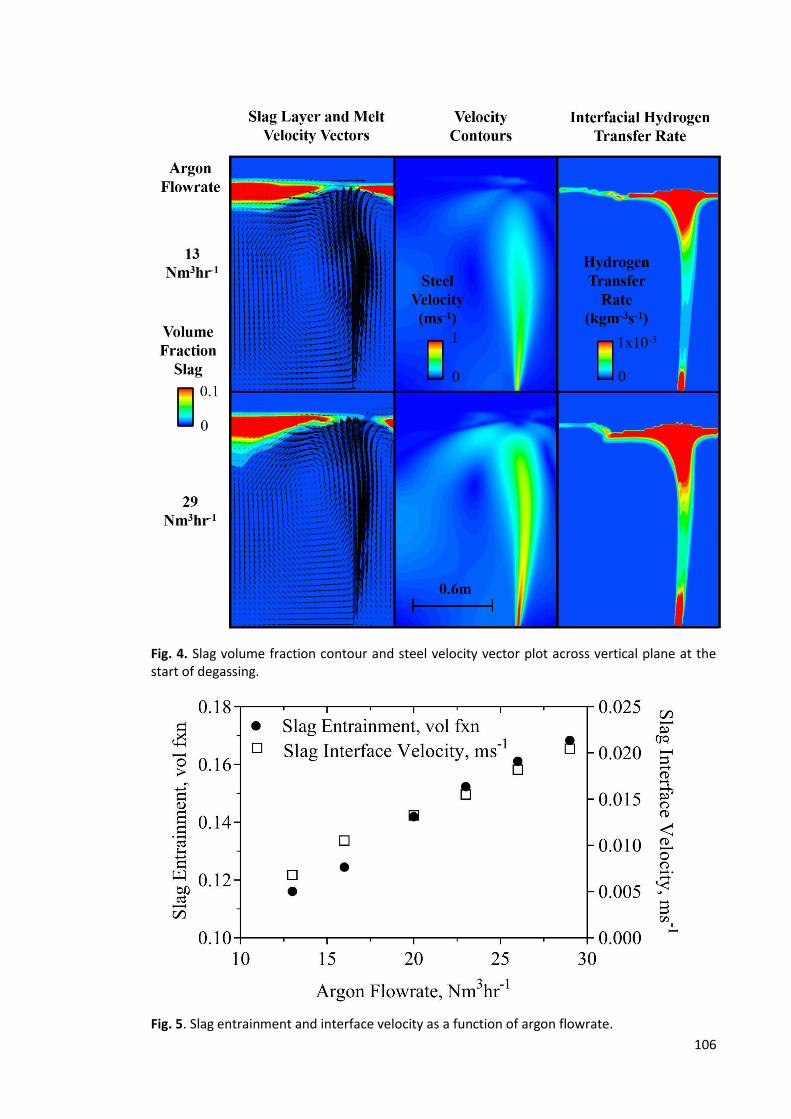
106
Fig. 4. Slag volume fraction contour and steel velocity vector plot across vertical plane at the start of degassing.
Fig. 5. Slag entrainment and interface velocity as a function of argon flowrate.

107
Fig. 6. Wall shear contour plot (Pa) for argon flowrates of 13, 20 and 29 Nm3hr-1.
Fig. 7. Maximum wall shear force and wall shear area integral as a function of argon flowrate.

108
Fig. 8. Effect of vacuum pressure on hydrogen removal ratio over 20 minutes of degassing.
Fig. 9. Effect of vacuum pressure on decay profile over 20 minutes of degassing.

109
Fig. 10. Change in equilibrium concentration as a function of vertical position along plume centreline at the start of the degassing process.
Fig. 11. Change in hydrogen content in gas phase as a function of vertical position along plume centreline at the start of the degassing process.

110
Fig. 12. Hydrogen transfer rate in melt across vertical plane as a function of vacuum pressure at the start of degassing.
Tables
Table 1. Formulation of flow, mass transfer and bubble size model equations.
Multiphase Flow Equations Eulerian method19) for three phases (slag/steel/argon). Interfacial Force Terms Drag20), lift21), turbulence dispersion22) and virtual mass23). Turbulence Model Standard k-epsilon24) with Troshko and Hasan bubble
induced turbulence source terms25). Mass Transfer Coefficient Lamont26). Bubble Size Distribution Discrete population balance model19) with Luo aggregation
and breakup kernels27). CFD Software Package ANSYS Fluent 16.1.

111
Table 2. Interaction parameters of elements in molten steel.
Element (Z) wt % Interaction Coefficient (𝐞𝐇𝐙 )
C 0.15 0.06
Mn 0.5 -0.0014
P 0.005 0.011
S 0.005 0.008
Si 0.28 0.029
Cu 0.09 0.0004
B 0.0005 0.08
Cr 3-5 -0.008
Ni 1.55 -0.002
Ti 0.001 -0.08
Table 3. Ladle geometry, material properties and standard operating conditions of vacuum arc degasser.
Parameter Value
Slag Viscosity, kgm-1s-1 0.04
Slag Density, kgm-3 3000
Steel Viscosity, kgm-1s-1 0.005
Steel Density, kgm-3 7000
Argon Viscosity, kgm-1s-1 2.12e-5
Argon Density, kgm-3 1.62
Argon/Steel Surface Tension, Jm-2 1.19
Slag/Argon Surface Tension, Jm-2 0.58
Slag/Steel Interfacial Tension, Jm-2 0.12
Temperature, K 1871
Surface Pressure, Pa 100
Mass of Melt, tonnes 100
Bath Height (m) 2.9
Bath Radius (m) 1.2
Argon Plug Radius (m) 0.03

112
References
1) C. A. Llanos, S. Garcia-Hernandez, J. A. Ramos-Banderas, J. J. De Barreto and G. Solorio-Diaz: ISIJ Int., 50 (2010), 396.
2) U. Singh, R. Anapagaddi, S. Mangal, K. A. Padmanabhan and A. K. Singh: Metall. Mater.
Trans. B, 47 (2016), 1804. 3) S.W.P.Cloete, J.J.Eksteen and S.M.Bradshaw: Progress in Computational Fluid Dynamics
9 (2009), 345. 4) G. Chen, S. He, Y. Li, Y. Guo and Q. Wang: JOM, 68 (2016), 2138. 5) W. Lou and M. Zhu: Metall. Mater. Trans. B, 44 (2013), 1251. 6) S. Yu and S. Louhenkilpi: Metall. Mater. Trans. B, 44 (2013), 459. 7) F. Gauss, D. Lucas and E. Krepper: Nuclear Engineering and Design 305 (2016), 371. 8) S. Joo and R. I. L. Guthrie: Metall. Mater. Trans. B, 23 (1992), 765. 9) H. Tang, X. Guo, G. Wu and Y. Wang: ISIJ Int., 56 (2016), 2161. 10) M.S.C.Terrazas and A.N.Conejo, Metall. Mater. Trans. B, 46 (2015), 711. 11) D. Mazumdar and R.I.L. Guthrie: Metall. Mater. Trans. B, 41 (2010), 976. 12) A. Senguttuvan and G. A. Irons: ISIJ Int., 57 (2017). 13) B. Li, H. Yin, C. Q. Zhou and F. Tsukihashi: ISIJ Int., 48 (2008), 1704. 14) G. Irons, A. Senguttuvan and K. Krishnapisharody: ISIJ Int., 55 (2015), 1. 15) L. Li, Z. Liu, B. Li, H. Matsuura and F. Tsukihashi: ISIJ Int., 55 (2015), 1337. 16) L. Li and B. Li: JOM, 68 (2016), 2160. 17) D. Guo and G. A. Irons: Metall. Mater. Trans. B, 31 (2000), 1447. 18) F. Karouni, F., B. P. Wynne, J. Talamantes-Silva and S. Phillips: Steel Res. Int., (2018), DOI:
srin.201700550. 19) ANSYS Fluent Theory Guide, ANSYS Inc. (2015). 20) M. Ishii and N. Zuber: AIChE J. 25 (1979), 843. 21) A. Tomiyama: Proc. of 3rd Int. Conf. on Multiphase Flow , Lyon, France (1998). 22) A. D. B. Burns: 5th Int. Conf. on Multiphase Flow, Yokohama, Japan, (2004). 23) D. A. Drew: Annu. Rev. Fluid Mech., 15 (1983), 261.

113
24) B. E. Launder and D. B. Spalding: Comp. Meth. Appl. Mech. Eng., 3 (1974), 269. 25) A. A. Troshko and Y. A. Hassan: Int. J. Multiphase Flow, 27 (2001), 1965. 26) J. C. Lamont and D. S. Scott: AIChE J., 16 (1970), 513. 27) H. Luo and H.F. Svendsen: AIChE J., 42 (1996), 1225. 28) F. Karouni, F., B. P. Wynne, J. Talamantes-Silva and S. Phillips: Steel Res. Int., (2018),
DOI: srin.201700551. 29) A. Ghosh: Secondary Steelmaking, Principles and Applications, CRC Press LLC, Florida,
USA, (2001), 62. 30) R. Singh, D. Mazumdar and A. K. Ray: ISIJ Int., 48 (2008), 1033.

114
5. SUPPLEMENTARY RESULTS AND ANALYSIS
This section includes supplementary results and analysis for Papers 1,2 and 3. The purpose of this is to further elaborate on the results presented in the papers, providing a detailed understanding of the physical mechanisms governing the rate of hydrogen removal from molten steel for each of the simulation cases considered. This is achieved by referring to a series of performance variables including the mass transfer coefficient, mass transfer rate, fluid velocity, slag entrainment and wall shear.
The contours presented in this section were extracted from the vertical cross sectional plane aligned with the argon plug(s) shown in Figure 23 (referred to as the symmetry plane), or from horizontal cross sections at specified bath heights. Slag entrainment was quantified by the volume fraction of slag entrained beneath the slag-steel interface (entrainment fraction) and the vertical depth entrained by the slag into the melt (slag depth) from the free surface. The lower boundary of the slag layer was taken as the isosurface at which the slag volume fraction is equal to 1%.
5.1. Presence of Slag Layer
The effect of incorporating the slag layer on the rate of hydrogen degassing in the VAD unit at SFIL was discussed in Paper 1, where it was found that the slag layer reduced the hydrogen removal rate from the melt. Figures 23-25 show the velocity contour plots, mass transfer coefficients, and interfacial mass transfer rate for each case.
Three zones within the symmetry plane of the velocity contour plots for the slag free and slag-containing cases are highlighted in Figures 23a and Figure 23b. The flow field across these regions is strengthened in the absence of the slag layer. Zone 1 occupies a thin slice beneath the bath surface. This is where the rising melt reaches the slag layer melt and is radially channelled from the plume to the far side wall on the left. The continuous deformation of slag at the eye interferes with the liquid flow pattern. In the slag-free case a smooth current flowing to the wall is formed. In the slag case a downward current is induced as the steel impacting with the edges of the slag eye is forced down at a greater velocity gradient. This creates a low velocity zone in the centre of the ladle (Zone 2), between the slag eye and the left wall. The zone extends from the top of the plume to the mid-section of the left wall where there is a reduced velocity. The mass transfer coefficient also reduces in the presence of slag (Figure 24b) compared to the slag free case (Figure 24a). Furthermore, the width of the velocity field in the plume region is narrowed in the presence of slag. Due to the asymmetric placement of the argon plug, the horizontal distance between the plug and the near-side wall is smaller than that of the far-side wall. Therefore, the steel is confined to a greater extent in the region between the plug and the near-side wall and the melt spreading outwards from the plume in the radial direction is forced to rotate downwards along the wall at a faster rate. The velocity within this region (Zone 3) is reduced in the slag-containing case due to the interaction of the steel with the slag eye limiting the magnitude of the downward circulation loop in comparison to the slag-free case. As the entire bath surface of the melt in the slag-free case is exposed to the vacuum, there is a greater area for mass transfer. This is shown by the increased spatial distribution of mass transfer rate along the free surface (Figure 25a), which in the case of slag is restricted to the eye region (Figure 25b).

115
Figure 23 – Melt velocity field distribution for (a) slag-free and (b) slag-containing cases along symmetry plane.

116
Figure 24 – Mass transfer coefficient distribution for (a) slag-free and (b) slag-containing cases along symmetry plane.

117
Figure 25 – Interfacial hydrogen transfer rate distribution for (a) slag-free and (b) slag-containing ladle melts along symmetry plane.
5.2. Number of Argon Plugs
The effect of the number of argon plugs on the rate of hydrogen degassing was discussed in Paper 2. It was concluded that there was an increase in the hydrogen removal rate with an increase in the number of plugs. Figures 26-31 show the velocity contour plots, interfacial mass transfer rate, slag entrainment fraction and wall shear for each case. Three standard baseline plug arrangements are used in this study: the single axisymmetric plug, the double plug (θ=180°, 0.5R) and the triple plug (θ=120°, 0.5R). The argon flowrate through each plug is Q1/2 for the two plug ladle and Q1/3 for the three plug ladle, where Q1 is the flowrate for the single plug ladle. Therefore, although the flowrate through each plug varies across each of the ladles, the total throughput of gas injected into the melt at any given point in time remains the same for each case.

118
The mass transfer rate across a horizontal cross sectional plane close to the free surface of the bath (0.9L) is used for comparison. While the mass transfer rate across each plume reduces in magnitude with an increasing number of plugs, the overall mass transfer rate grows as a result of each additional plume increasing the spatial distribution of bubbles within the melt. The presence of the additional plume creates an overall increase in mass transfer in the three plug ladle. This occurs despite the lack of overall improvement in the velocity profile with three plugs compared to two (Figure 27). This implies the velocity field and mass transfer coefficient are not the dominant factors in determining the rate of hydrogen removal from the melt. The advantage of the increased number of plugs is therefore due to the wider distribution of bubbles across the horizontal cross sectional area of the melt. For the transition from two to three plugs, this effect produces an increase in the mass transfer rate of hydrogen from the steel into the bubbles. This also results in an increase in the slag entrainment fraction with the number of plugs (Figure 28). Increasing the number of plugs from 1 to 2 increases the slag entrainment fraction by 30% (from 0.058 to 0.075), while a third plug increases it by a further 12% (from 0.075 to 0.084). The maximum slag penetration depth (Figure 29) increases with the number of plugs (19%, 24% and 27% for 1, 2 and 3 plugs respectively). The regions of maximal penetration depth correspond to the regions of maximal downward steel velocity. There is a constant reduction in both wall shear variables (Figure 30) with an increase in the number of plugs of mid-radial position (51% reduction from one to two plugs, and 18% reduction from two to three plugs). With the triple plug system, there is a triangular concentration of wall shear stress (Figure 31) at the base of the ladle due to the connecting circulation currents in the melt produced by each of the respective bubble plumes.

119
Figure 26 – Interfacial hydrogen transfer rate distribution for (a) single, (b) double, and (c) triple plug ladles along horizontal cross sectional plane at height of 0.9L.

120
Figure 27 – Melt velocity field distribution for (a) single, (b) double, and (c) triple plug ladles along horizontal cross sectional plane at height of 0.9L.

121
Figure 28 - Change in the slag entrainment fraction with the number of argon plugs.

122
Figure 29 – Isosurface of slag volume fraction=0.01 for (a) single, (b) double, and (c) triple plug ladles.

123
Figure 30 – Maximum wall shear and wall shear area integral for varying number of plugs.

124
Figure 31 - Wall shear stress distribution for (a) single, (b) double, and (c) triple plug ladles.

125
5.3. Radial Position of Argon Plugs
The results of this section were included in Paper 2, where 0.5R was shown to be the optimal radial position for hydrogen removal. The mid-radial plug position produces the lowest slag entrainment fraction. There is a 20% reduction (from 0.058 to 0.046) in slag entrainment between the axisymmetric position and 0.5R, followed by a 103% increase (from 0.046 to 0.093) between 0.5R-0.8R (Figure 32). The maximum slag penetration depth of the 0.8R case is higher (23%) than that of the 0.5R and 0R cases (both of which are 19%) as shown in Figure 33. This occurs due to the overlapping of the slag eye with the ladle wall as the plug radial distance is increased. While the angle of entrainment is restricted to the direction opposite the wall, the wall acts as a supporting backboard against which slag is dragged up, before reversing direction and plunging downwards into the melt. As the plug is moved to the 0.5R position a region of high shear stress intensity appears on the side of the wall closest to the plug position (Figure 35). This occurs due to the transition from the axisymmetric flow field with multiple loops to a single loop, as described in Paper 2. The high intensity region lies just beneath the slag layer at the top of the bath where the impact of the vertically flowing steel driven by the plume generates a large velocity gradient in the melt as it begins to recirculate downwards along the ladle wall. At a radial positon of 0.8R the region is further enlarged and elongates downwards towards the plug. This shows that the increasing proximity of the plug to the wall causes a greater level of shear stress, as summarised in Figure 34.
Figure 32 - Change in the slag entrainment fraction with the radial position of a single argon plug.

126
Figure 33 - Isosurface of slag volume fraction=0.01 for single plug of (a) axisymmetric, (b) 0.5R and (c) 0.8R radial position.

127
Figure 34 – Maximum wall shear and wall shear area integral for single plugs of varying radial position.

128
Figure 35 - Wall shear stress distribution for single plugs with (a) axisymmetric, (b) 0.5R and (c) 0.8R radial positions.
5.4. Ladle Aspect Ratio
The effect of the ladle aspect ratio (AR) ranging from 0.8 to 1.6 on the rate of hydrogen degassing was discussed in Paper 2, with AR=1.2 found to be the optimal specification. Figures 36-41 show the velocity contour plots, interfacial mass transfer rate, slag entrainment fraction and wall shear for each plug position.
Between AR=0.8-1.2, the ladle transitions from a shorter and wider shape to a taller and narrower shape. A by-product of this change is that the bubbles have a longer distance to travel before they reach the surface and are able to expend more of their energy on mixing the liquid.
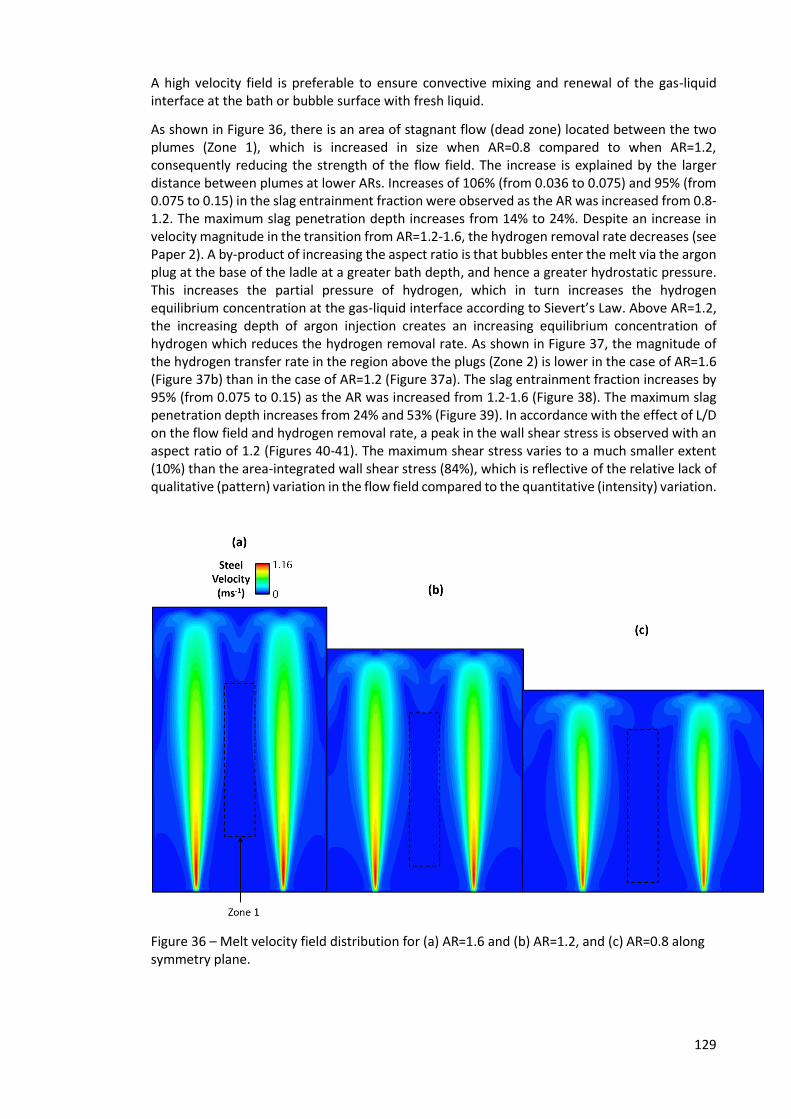
129
A high velocity field is preferable to ensure convective mixing and renewal of the gas-liquid interface at the bath or bubble surface with fresh liquid.
As shown in Figure 36, there is an area of stagnant flow (dead zone) located between the two plumes (Zone 1), which is increased in size when AR=0.8 compared to when AR=1.2, consequently reducing the strength of the flow field. The increase is explained by the larger distance between plumes at lower ARs. Increases of 106% (from 0.036 to 0.075) and 95% (from 0.075 to 0.15) in the slag entrainment fraction were observed as the AR was increased from 0.8-1.2. The maximum slag penetration depth increases from 14% to 24%. Despite an increase in velocity magnitude in the transition from AR=1.2-1.6, the hydrogen removal rate decreases (see Paper 2). A by-product of increasing the aspect ratio is that bubbles enter the melt via the argon plug at the base of the ladle at a greater bath depth, and hence a greater hydrostatic pressure. This increases the partial pressure of hydrogen, which in turn increases the hydrogen equilibrium concentration at the gas-liquid interface according to Sievert’s Law. Above AR=1.2, the increasing depth of argon injection creates an increasing equilibrium concentration of hydrogen which reduces the hydrogen removal rate. As shown in Figure 37, the magnitude of the hydrogen transfer rate in the region above the plugs (Zone 2) is lower in the case of AR=1.6 (Figure 37b) than in the case of AR=1.2 (Figure 37a). The slag entrainment fraction increases by 95% (from 0.075 to 0.15) as the AR was increased from 1.2-1.6 (Figure 38). The maximum slag penetration depth increases from 24% and 53% (Figure 39). In accordance with the effect of L/D on the flow field and hydrogen removal rate, a peak in the wall shear stress is observed with an aspect ratio of 1.2 (Figures 40-41). The maximum shear stress varies to a much smaller extent (10%) than the area-integrated wall shear stress (84%), which is reflective of the relative lack of qualitative (pattern) variation in the flow field compared to the quantitative (intensity) variation.
Figure 36 – Melt velocity field distribution for (a) AR=1.6 and (b) AR=1.2, and (c) AR=0.8 along symmetry plane.

130
Figure 37 – Interfacial hydrogen transfer rate distribution for (a) AR=1.2 and (b) AR=1.6 along symmetry plane.

131
Figure 38 - Change in the slag entrainment fraction with the ladle aspect ratio for a two plug system.
Figure 39 - Isosurface of slag volume fraction=0.01 for double plug ladle with (a) AR=1.6, (b) AR=1.2 and (c) AR=0.8.

132
Figure 40 – Maximum wall shear and wall shear area integral for double plugs of varying ladle aspect ratios.

133
Figure 41 - Wall shear stress distribution for (a) AR=0.8, (b) AR=1.2 and (c) AR=1.6.
5.5. Argon Plug Angle
The effect of triple plug angles (θ=45° and θ=120°) on the rate of hydrogen degassing was discussed in Paper 2, with θ=45° found to be the optimal angle. Figures 42-48 show the velocity contour plots, interfacial mass transfer rate, slag entrainment fraction and wall shear for each plug position.
The results indicate that an improvement in liquid velocity magnitude and increasing slag entrainment fraction are obtained with a reduction in the plug angle. Furthermore, there is a 175% increase in the maximum shear stress as the angle is reduced from θ =120° to θ =45°, as shown in Figures 47 and 48. Reducing the plug angle from Θ=120O to Θ=45O increases the slag entrainment fraction by 38% (from 0.084 to 0.12), as shown in Figure 45. It is accompanied by an increase maximum slag penetration depth from 25 to 30%. This is reflective of the improved degassing performance at the lower plug angle that arises from the multiple bubble plumes combining into a single flow loop which is otherwise split into multiple, separated loops at larger plug angles. The most noticeable improvement in melt velocity occurs near the base of the ladle at a vertical height of 0.2L (Figure 43a). For θ=45°, there is a greater distribution of velocity away from the plumes. For θ=120°, there are larger areas surrounding the plumes which are stagnant. This is also visible in the vertical cross sectional plot of the velocity magnitude aligned with the centre of the ladle baseplate, as shown in Figure 42b. For θ=45°, there is a vertical channel from the base of the ladle extending upwards to the centre of the ladle where the velocity magnitude is close to zero. For θ=120°, by contrast, the corners experience a weakened velocity field, while the majority of the base has a greater velocity magnitude. With an increase in vertical height to

134
0.5L in Figure 42b, there is a higher spatial distribution in the flow field around each bubble plume for the θ=120° case, with the flow spreading more to the wall regions.
For θ=45°, the flow field arising from each bubble plume strongly overlap, combining together to form a large circulation current. As the plume approaches the free surface (at 0.9L in Figure 42c), the θ=120° case still retains a dead zone in the inter-plume region. The θ=45° case also maintains a dead zone to the right but results in a greater distribution in the velocity field. The mass transfer rate is increased as the plug angle is decreased from θ=120° to θ=45° (Figure 44). This is the result of the combined effects of all three bubble plumes and their close proximity, which feeds the velocity field in the melt along the bubble plume, as confirmed in Figure 42c. Consequently, the velocity magnitude at the plume eye is greater for θ=45° than for θ=120°. This allows a larger mass transfer coefficient and convective mixing rate within the melt.
5.6. Vacuum Pressure
The simulations investigating the role of vacuum pressure on the rate of hydrogen degassing are outlined in Section 3.2 of Paper 3 (Chapter 4.3).
First, the flow field and bubble size distribution were obtained for the triple plug ladle (r/R=0.5, θ=45°) operating at a gas flowrate of Q=13 Nm3hr-1. The hydrogen transport equations (Equations 16-19) were then solved at each point in the computational domain for the 20-minute degassing duration. The pressure at the free surface influences the concentration of hydrogen in the melt in equilibrium with that in the gas phase. This occurs via the effect of the hydrostatic pressure on the bubble pressure, which in turn dictates the partial pressure of hydrogen in the gas phase (Equation 19).
In a theoretical model of single bubbles rising under vacuum conditions, Szekely and Martins13 demonstrated that the bubble pressure increases beyond that obtained for the liquid phase at a given hydrostatic depth. The additional pressure is required to accelerate the liquid displaced by the bubbles as they rise. This increases the partial pressure of hydrogen in the bubble and, in turn, the equilibrium concentration (Equation 19) as well. Assuming the bubble pressure to be equal to that of the liquid phase results in an under prediction of the equilibrium concentration and an over prediction of the hydrogen transfer rate across the gas-liquid interface (Equation 21). Furthermore, the rate of bubble expansion increases as the surface pressure reduces, causing a greater displacement of liquid along the path of the expanding bubbles. This displacement influences the liquid flow field in the bath, as demonstrated in a physical modelling study by Tatsuoka10, who found the vessel mixing time reduced at lower surface pressures.
As a fixed flow field is adopted in Section 3.2 (Paper 3), variations in the hydrogen removal rate with surface pressure are attributable to changes in the thermodynamic equilibrium at the gas-liquid interface. The effect of surface pressure on the flow field and the additional contribution to the bubble pressure caused by liquid displacement would lead to an increase and decrease in the hydrogen removal rate from the melt, respectively. The two effects are likely to have counterbalanced each other out in the present study.

135
Figure 42 – Melt velocity field distribution for triple plug ladles along horizontal cross sectional planes at (a) 0.2L, (b) 0.5L, and (c) 0.9L.

136
Figure 43 – Melt velocity field distribution for triple plug ladles with (a) θ=120° and (b) θ=45°.

137
Figure 44 – Interfacial hydrogen transfer rate distribution for triple plug ladles with (a) θ=45° and (b) θ=120° along horizontal cross sectional plane at vertical height of 0.9L

138
Figure 45 - Change in the slag entrainment fraction with the plug angle for a three plug system.

139
Figure 46 - Isosurface of slag volume fraction=0.01 for (a) θ=45° and (b) θ=120°.

140
Figure 47 – Maximum wall shear and wall shear area integral for triple plugs of varying plug angles.

141
Figure 48 - Wall shear stress distribution for triple plug angle with (a) θ=45° and (b) θ=120°.

142
5.7. Industrial Implications
Through the adoption of the mass transfer-CFD coupled model outlined in this work, we have identified the relationship between the main VAD design parameters and the hydrogen removal ratio over the course of a fixed 20-minute degassing period.
The predicted removal ratios for each of the variables investigated (np, θ, slag presence, r/R, AR, Q and P) in Chapters 4.1-4.3 are shown in Figure 49. The number of plugs and aspect ratio were the design variables with the most impact on hydrogen removal ratio in the VAD unit, producing changes of 9% and 5% respectively within the ranges investigated. In contrast, the plug radial position and inter-plug angle were less significant 1% and 0.7% respectively. The slag layer had an impact of 4% on the removal ratio. The relative gains in hydrogen removal achieved by variation of each variable within a given range must be contrasted with the associated effects on slag entrainment and wall shear to evaluate its overall impact on the VAD process. For most variables, optimising the removal ratio was achieved at the expense of higher slag entrainment and wall shear, though this was not the case for the number of plugs and the plug radial position. For both these variables, increases in RR were accompanied by decreases in wall shear and slag entrainment. The number of plugs provides the most scope for improvement in the removal ratio. By increasing the number of plugs, the flowrate through each plug can be reduced, reducing wall shear and entrainment effects, while simultaneously improving mixing and hydrogen removal. Existing ladles can be retrofitted to install additional plugs, proving this to be one of the most practical and cost effective ways of improving VAD performance. In terms of the ladle operating conditions, both the flowrate and pressure had a large impact on the removal ratio (7% and 29% respectively). It is worth noting that the maximum flowrate is limited by the spraying of liquid steel onto the ladle freeboard. The vacuum pressure is critical to the reduction of the minimum hydrogen level that can be achieved (via the gas/liquid equilibrium and Sievert’s Law).
In this thesis, we have brought attention to the mechanisms responsible for variations in the RR. These include the effect of the input parameters on:
- Magnitude and distribution of the melt velocity field. - Mass transfer coefficient for interfacial hydrogen transfer. - Spatial distribution of bubble plume within melt. - Equilibrium concentration for hydrogen transfer from melt.
We have also demonstrated that the increases in the hydrogen removal ratio can come at the cost of detrimental effects to the process, via:
- Shear of ladle walls, characterised by the integral and maximum shear stress profiles. - Entrainment of slag into the melt, characterised by changes in the entrainment depth, and
interface velocity.
The ladle design parameters offer the most scope for process optimisation, as opposed to the operating conditions. Based on the results of this research the following ladle design is recommended for industrial VAD units: triple plug (r/R=0.5, θ=45°, AR =1.2). The argon flowrate should be increased as high as possible while preventing excessive slag entrainment, wall shear, and surface waves. The vacuum pressure should be reduced as low as possible so as to allow a low hydrogen content to be reached and in a reasonable amount of time.

143
Figure 49 – Removal Ratios for ladle design and operating conditions.

144
6. CONCLUSIONS AND FUTURE WORK
6.1. Conclusions
The purpose of this study was to establish a mathematical model to simulate and optimise the removal of hydrogen from molten steel in the vacuum arc degasser. The process has been modelled using the three dimensional, three phase Eulerian method for the steel, slag and argon phases which are coupled to population balance and mass transfer equations. The model predictions are experimentally validated using industrial measurements obtained from Sheffield Forgemasters International steelworks. A series of ladle designs and ladle operating conditions are then simulated in order to identify optimal specifications for hydrogen degassing. The following conclusions can be drawn:
The inclusion of a slag layer was found to detrimentally affect the efficiency of hydrogen removal from the melt. The rising melt at the top of the plume is redirected upon contact with the slag, reducing the efficiency of the overall circulation pattern in the bath and the mass transfer coefficient in the ladle. The presence of slag creates a barrier for mass transfer at the free surface by limiting the melt exposed to the vacuum chamber for hydrogen transfer. The rate of hydrogen removal from the steel bath is concentrated in the region directly above the plug exit and at the slag eye (Paper 3, Figure 12). While the mass transfer coefficient is greatest near the plug (where the flow field is most vigorous) (Section 5.1, Figure 24), the exposure of the melt to the vacuum at the slag eye provides the dominant contribution to the transfer of hydrogen into the gas phase (Paper 3, Figure 11).
Double and triple plug systems are more efficient at hydrogen removal than single plugs. Both the velocity field of the melt and spatial distribution of bubbles throughout it are factors that explain this improvement. In the transition from 1 to 2 plugs, the magnitude of the melt velocity field over a range of vertical positions within the ladle increases. The velocity change is less significant in the 2 to 3 plug transition, with the added performance of the third plug explained by the increase in spatial distribution of the bubble plume throughout the melt with the number of argon plugs. The slag entrainment fraction increases in parallel to the number of plugs, although the wall shear stress reduces. A single plug ladle (as in operation at SFIL steelworks) can be retrofitted with two additional plugs without requiring the replacement of the entire ladle unit.
As the radial position of a single plug is increased from the central axisymmetric position to the mid-radial position the hydrogen removal rate increases to its maximum value. With further radial distance (r/R>0.5) the removal rate then reduces. As the plug nears the ladle wall, the radial expansion of the bubble plume is increasingly confined by the ladle wall causing a reduction in the efficiency of the melt flow field.
The optimal ladle aspect ratio for hydrogen degassing was found to be 1.2. Increasing the ladle aspect ratio from 0.8 to 1.2 increased the hydrogen degassing rate, followed by a reduction between 1.2 and 1.6 due to hydrostatic pressure effects. The height of the bubble plume increases with aspect ratio, allowing greater radial expansion which improves the bubble-induced mixing of the melt. The shift in hydrogen removal at an aspect ratio of 1.2 is explained by the increase in hydrostatic pressure at the bottom off the ladle with aspect ratio, which increases the concentration of hydrogen in equilibrium with the gas phase reducing the hydrogen transfer rate.

145
In a ladle with three argon plugs, reducing the argon plug angle from θ=120⁰ to θ=45⁰ increases the hydrogen removal rate. With this change in plug angle, the flow pattern of the melt transitions from a multi-loop structure to a single loop structure. In the latter case, the bubble plumes produced from each plug combine together, increasing the bubble-induced mixing of the melt. Due to the mutual interaction of the each of the three recirculating flow loops at a plug angle of θ=120⁰, a region of reduced velocity is produced between each of the plumes which reduces the hydrogen removal rate.
Increasing the argon flowrate increases the rate of hydrogen removal by improving the convective mixing of hydrogen around the melt and increasing the size of the slag eye. This improvement in performance comes at the expense of higher wall shear and slag entrainment. Reduction of the vacuum pressure allows a lower final hydrogen content to be reached over a given period of degassing and increases the hydrogen removal rate. The economic costs and industrial practicalities of implementing changes to the operating conditions and ladle design parameters must ultimately be assessed alongside their respective profit-making potential via a cost-benefit analysis.
6.2. Future Work
The current thesis opens up a wide scope for future research. This research can be divided into the following themes:
Extension of the current three-phase model to incorporate nitrogen and sulphur removal from the steel melt. Nitrogen removal is influenced by surface-active elements such as sulphur and oxygen in the melt. Sulphur, in turn, is removed via chemical interaction with the slag layer. Therefore, this would involve modelling chemical kinetics in addition to the rate of gas-metal (for nitrogen) and slag-metal (for sulphur) interfacial mass transfer.
Design and development of a physical model to simulate the effect of vacuum pressure on mixing time, mass transfer coefficient for gas-liquid solute transfer and mass transfer rate of dissolved impurities from the melt. This can be combined with CFD modelling of the bubble growth-induced effect on liquid phase mixing and gas-liquid mass transfer rates under vacuum pressures. This could be achieved by coupling the fluid flow equations with population balance modelling. The model predictions can then be compared against data obtained from physical models.
Comparison of several multiphase CFD schemes (eg. Euler-Lagrange vs Eulerian methods)
for computational efficiency and accuracy in determining the hydrogen degassing rate. This can build upon the results of the study by Lou and Zhu38, who compared the fluid dynamic predictions of both schemes.

146
7. APPENDIX
7.1 – User Defined Functions
#include "udf.h" #include "mem.h" #include "sg.h" #include "flow.h" #include "metric.h" #include "sg_pb.h" DEFINE_MASS_TRANSFER(source1,cell,thread,from_index,from_species_index,to_index,to_species_index) { #if !RP_HOST real x; real KH=pow(10,((-1900/1873)+0.9201)); real activity=1.023; real surfacepressure=100; Thread *liq=THREAD_SUB_THREAD(thread,from_index); Thread *gas=THREAD_SUB_THREAD(thread,to_index); real m_lg; int curr_ts; real xc[ND_ND]; C_CENTROID(xc, cell, thread); if (C_VOF(cell,gas)<0.1 || xc[1]<2.1) { m_lg=2*0.27*pow(((pow(10,-7))*sqrt(C_D(cell,liq)/(7.04*pow(10,-7)))),0.5)*((6*C_VOF(cell,gas)*(1-C_VOF(cell,gas)))/C_PHASE_DIAMETER(cell,gas))*7100*(C_YI(cell,liq,from_species_index)-(((KH/activity)*pow(10,-7))*pow(((surfacepressure+(7100*9.81*(2.97-xc[1])))*((C_YI(cell,gas,to_species_index)/0.001)/((C_YI(cell,gas,to_species_index)/0.001)+((1-C_YI(cell,gas,to_species_index))/0.0399)))),0.5))); } else
{ m_lg=0; } if (m_lg<=0) { m_lg=0; } return (m_lg); #endif } DEFINE_PROPERTY(density, c, t) {

147
real rho; real xc[ND_ND]; real surfacepressure=100; real M=0.001; real R=8.31; C_CENTROID(xc, c, t); if (xc[0]<2.6) { rho =((surfacepressure+(7100*9.81*(2.8-xc[1]))))/(R*1821*((C_YI(c,t,0)/0.001)+(C_YI(c,t,1)/0.039))); } else { rho =0.02; } C_UDMI(c,t,3)=rho; return rho; }

148
REFERENCES
1 Louthan Jr, M. R. Hydrogen embrittlement of metals: A primer for the failure analyst. Journal of Failure Analysis and Prevention 8, 289-307 (2008).
2 Moore, C. & Marshall, R. I. Steelmaking. (Institute of Materials, 1991). 3 Smiauowski, M. in Hydrogen in Steel xiii-xiv (Pergamon, 1962). 4 Ghosh, A. Secondary Steelmaking: Principles and Applications. (CRC Press, 2000). 5 Mazumdar, D. & Guthrie, R. I. L. Physical and mathematical modelling of gas stirred ladle
systems. ISIJ International 35, 1-20 (1995). 6 Mazumdar, D. & Guthrie, R. I. L. Modeling energy dissipation in slag-covered steel baths
in steelmaking ladles. Metallurgical and Materials Transactions B: Process Metallurgy and Materials Processing Science 41, 976-989, doi:10.1007/s11663-010-9389-x (2010).
7 Tatsuoka, T., Kamata, C. & Ito, K. Expansion of injected gas bubble and its effects on bath mixing under reduced pressure. ISIJ International 37, 557-561 (1997).
8 Szekely, J. & Martins, G. P. STUDIES IN VACUUM DEGASSING-%%- 1. Met Soc of AIME-Trans 245, 629-636 (1969).
9 Castillejos, A. H. & Brimacombe, J. K. Measurement of physical characteristics of bubbles in gas-liquid plumes: Part II. Local properties of turbulent air-water plumes in vertically injected jets. Metallurgical Transactions B 18, 659-671, doi:10.1007/BF02672882 (1987).
10 Xie, Y. & Oeters, F. Experimental studies on the flow velocity of molten metals in a ladle model at centric gas blowing. Steel Research 63, 93-104 (1992).
11 Anagbo, P. E. & Brimacombe, J. K. Plume characteristics and liquid circulation in gas injection through a porous plug. Metallurgical Transactions B 21, 637-648, doi:10.1007/BF02654242 (1990).
12 Gift, R., Grace, J. R. & Weber, M. E. Bubbles, Drops, and Particles, Academic Press, New York, NY, 103 (1978).
13 Loth, E. Quasi-steady shape and drag of deformable bubbles and drops. International Journal of Multiphase Flow 34, 523-546, doi:10.1016/j.ijmultiphaseflow.2007.08.010 (2008).
14 Pistorius, P. C. in Treatise on Process Metallurgy Vol. 2 179-196 (2013). 15 Mori, K., Sano, M. & Sato, T. SIZE OF BUBBLES FORMED AT SINGLE NOZZLE IMMERSED
IN MOLTEN IRON. Transactions of the Iron and Steel Institute of Japan 19, 553-558 (1979).
16 Zhou, M. & Brimacombe, J. K. Critical fluid-flow phenomenon in a gas-stirred ladle. Metallurgical and Materials Transactions B 25, 681-693, doi:10.1007/BF02655176 (1994).
17 Hirasawa, M. et al. RATE OF MASS TRANSFER BETWEEN MOLTEN SLAG AND METAL UNDER GAS INJECTION STIRRING. Transactions of the Iron and Steel Institute of Japan 27, 277-282, doi:10.2355/isijinternational1966.27.277 (1987).
18 Mazumdar, D. & Guthrie, R. I. L. Mixing models for gas stirred metallurgical reactors. Metallurgical Transactions B 17, 725-733, doi:10.1007/BF02657134 (1986).
19 Chen, G., He, S., Li, Y., Guo, Y. & Wang, Q. Investigation of Gas and Liquid Multiphase Flow in the Rheinsahl–Heraeus (RH) Reactor by Using the Euler–Euler Approach. JOM 68, 2138-2148, doi:10.1007/s11837-016-1850-0 (2016).
20 Chen, G., He, S. & Li, Y. Investigation of the Air-Argon-Steel-Slag Flow in an Industrial RH Reactor with VOF–DPM Coupled Model. Metallurgical and Materials Transactions B: Process Metallurgy and Materials Processing Science 48, 2176-2186, doi:10.1007/s11663-017-0992-y (2017).
21 Park, Y. G., Doo, W. C., Yi, K. W. & An, S. B. Numerical calculation of circulation flow rate in the degassing Rheinstahl-Heraeus process. ISIJ International 40, 749-755, doi:10.2355/isijinternational.40.749 (2000).

149
22 Park, Y. G., Yi, K. W. & Ahn, S. B. The effect of operating parameters and dimensions of the RH system on melt circulation using numerical calculations. ISIJ International 41, 403-409, doi:10.2355/isijinternational.41.403 (2001).
23 Szekely, J. & Fang, S. D. STUDIES IN VACUUM DEGASSING: MASS AND MOMENTUM TRANSFER TO GAS BUBBLES RISING IN MELTS, THE FREEBOARD OF WHICH IS EVACUATED. Metall Trans 5, 1429-1436 (1974).
24 Higbie, R. The rate of absorption of a pure gas into a still liquid during short periods of exposure. Trans. Am. Inst. Chem. Eng. 31, 365-389 (1935).
25 Castillejos, A. H. & Brimacombe, J. K. Measurement of physical characteristics of bubbles in gas-liquid plumes: Part I. An improved electroresistivity probe technique. Metallurgical Transactions B 18, 649-658, doi:10.1007/BF02672881 (1987).
26 Guo, D. & Irons, G. A. Modeling of gas-liquid reactions in ladle metallurgy: Part I. Physical modeling. Metallurgical and Materials Transactions B: Process Metallurgy and Materials Processing Science 31, 1447-1455 (2000).
27 Iguchi, M., Kaji, M. & Morita, Z.-I. Effects of pore diameter, bath surface pressure, and nozzle diameter on the bubble formation from a porous nozzle. Metallurgical and Materials Transactions B 29, 1209-1218, doi:10.1007/s11663-998-0043-9 (1998).
28 Jönsson, P. G. & Jonsson, L. T. I. The use of fundamental process models in studying ladle refining operations. ISIJ International 41, 1289-1302, doi:10.2355/isijinternational.41.1289 (2001).
29 Bannenberg, N., Bergmann, B. & Gaye, H. Combined decrease of sulphur, nitrogen, hydrogen and total oxygen in only one secondary steelmaking operation. Steel Research 63, 431-437 (1992).
30 Lamont, J. C. & Scott, D. S. An eddy cell model of mass transfer into the surface of a turbulent liquid. AIChE Journal 16, 513-519, doi:10.1002/aic.690160403 (1970).
31 Wang, T. & Wang, J. Numerical simulations of gas-liquid mass transfer in bubble columns with a CFD-PBM coupled model. Chemical Engineering Science 62, 7107-7118, doi:10.1016/j.ces.2007.08.033 (2007).
32 Yu, S. & Louhenkilpi, S. Numerical simulation of dehydrogenation of liquid steel in the vacuum tank degasser. Metallurgical and Materials Transactions B: Process Metallurgy and Materials Processing Science 44, 459-468, doi:10.1007/s11663-012-9782-8 (2013).
33 Cloete, S. W. P., Eksteen, J. J. & Bradshaw, S. M. A numerical modelling investigation into design variables influencing mixing efficiency in full scale gas stirred ladles. Minerals Engineering 46-47, 16-24, doi:10.1016/j.mineng.2013.03.014 (2013).
34 Senguttuvan, A. & Irons, G. A. Modeling of slag entrainment and interfacial mass transfer in gas stirred ladles. ISIJ International 57, 1962-1970, doi:10.2355/isijinternational.ISIJINT-2016-589 (2017).
35 Li, L. & Li, B. Investigation of Bubble-Slag Layer Behaviors with Hybrid Eulerian–Lagrangian Modeling and Large Eddy Simulation. JOM 68, 2160-2169, doi:10.1007/s11837-016-1849-6 (2016).
36 Madan, M., Satish, D. & Mazumdar, D. Modeling of mixing in ladles fitted with dual plugs. ISIJ International 45, 677-685, doi:10.2355/isijinternational.45.677 (2005).
37 Singh, U., Anapagaddi, R., Mangal, S., Padmanabhan, K. A. & Singh, A. K. Multiphase Modeling of Bottom-Stirred Ladle for Prediction of Slag–Steel Interface and Estimation of Desulfurization Behavior. Metallurgical and Materials Transactions B: Process Metallurgy and Materials Processing Science 47, 1804-1816, doi:10.1007/s11663-016-0620-2 (2016).
38 Lou, W. & Zhu, M. Numerical simulation of gas and liquid two-phase flow in gas-stirred systems based on Euler-Euler approach. Metallurgical and Materials Transactions B: Process Metallurgy and Materials Processing Science 44, 1251-1263, doi:10.1007/s11663-013-9897-6 (2013).
39 Pfleger, D., Gomes, S., Gilbert, N. & Wagner, H. G. Hydrodynamic simulations of laboratory scale bubble columns fundamental studies of the Eulerian-Eulerian modelling

150
approach. Chemical Engineering Science 54, 5091-5099, doi:10.1016/S0009-2509(99)00261-4 (1999).
40 Linmin, L. I., Baokuan, L. I. & Liu, Z. Modeling of gas-steel-slag three-phase flow in ladle metallurgy: Part II. Multi-scale mathematical model. ISIJ International 57, 1980-1989, doi:10.2355/isijinternational.ISIJINT-2017-069 (2017).
41 Davidson, P. Turbulence: An Introduction for Scientists and Engineers. (Oxford University Press, 2015).
42 Launder, B. E. & Spalding, D. B. The numerical computation of turbulent flows. Computer Methods in Applied Mechanics and Engineering 3, 269-289, doi:10.1016/0045-7825(74)90029-2 (1974).
43 Schwarz, M. P. & Turner, W. J. Applicability of the standard k-ε{lunate} turbulence model to gas-stirred baths. Applied Mathematical Modelling 12, 273-279, doi:10.1016/0307-904X(88)90034-0 (1988).
44 Zhang, D., Deen, N. G. & Kuipers, J. A. M. Numerical simulation of the dynamic flow behavior in a bubble column: A study of closures for turbulence and interface forces. Chemical Engineering Science 61, 7593-7608, doi:10.1016/j.ces.2006.08.053 (2006).
45 Inc., A. ANSYS Fluent Theory Guide. (2015). 46 Luo, H. & Svendsen, H. F. Theoretical Model for Drop and Bubble Breakup in Turbulent
Dispersions. AIChE Journal 42, 1225-1233 (1996). 47 Murthy, G. G. k., Mehrotra, S. P. & Ghosh, A. Experimental investigation of mixing
phenomena in a gas stirred liquid bath. Metallurgical Transactions B 19, 839-850, doi:10.1007/BF02651408 (1988).
48 Helle, L. W. J. South Afr. Inst. Min. Met., 329-337 (1981). 49 Turkoglu, H. & Farouk, B. Effect of gas injection velocity on mixing and heat transfer in
molten steel baths. Numerical Heat Transfer; Part A: Applications 21, 377-399 (1992). 50 Mietz, J. & Oeters, F. Flow field and mixing with eccentric gas stirring. Steel Research 60,
387-394, doi:10.1002/srin.198901673 (1989). 51 Joo, S. & Guthrie, R. I. L. Modeling flows and mixing in steelmaking ladles designed for
single- and dual-plug bubbling operations. Metallurgical Transactions B 23, 765-778, doi:10.1007/BF02656455 (1992).
52 Xie, Y. & Oeters, F. Measurements of bubble plume behaviour and flow velocity in gas stirred liquid Wood's metal with an eccentric nozzle position. Steel Research 65, 315-319 (1994).
53 Krishnakumar, K., Ballal, N. B., Sinha, P. K., Sardar, M. K. & Jha, K. N. Water model experiments on mixing phenomena in a VOD ladle. ISIJ International 39, 419-425, doi:10.2355/isijinternational.39.419 (1999).
54 Kim, S. H. & Fruehan, R. J. Physical modeling of liquid/liquid mass transfer in gas stirred ladles. Metallurgical Transactions B 18, 381-390, doi:10.1007/BF02656157 (1987).
55 Maldonado-Parra, F. D., Ramírez-Argáez, M. A., Conejo, A. N. & González, C. Effect of both radial position and number of porous plugs on chemical and thermal mixing in an industrial ladle involving two phase flow. ISIJ International 51, 1110-1118, doi:10.2355/isijinternational.51.1110 (2011).
56 Liu, Z., Linmin, L. I. & Baokuan, L. I. Modeling of gas-steel-slag three-phase flow in ladle metallurgy: Part I. Physical modeling. ISIJ International 57, 1971-1979, doi:10.2355/isijinternational.ISIJINT-2016-710 (2017).
57 Chattopadhyay, K., SenGupta, A., Ajmani, S. K., Lenka, S. N. & Singh, V. Optimisation of dual purging location for better mixing in ladle: A water model study. Ironmaking and Steelmaking 36, 537-542, doi:10.1179/174328109X445732 (2009).
58 Chen, M., Wang, N., Yao, Y., Geng, J. & Xiong, K. Optimal mixing effect of LF bottom-blown stirring by two nozzles. Steel Research International 78, 468-472, doi:10.1002/srin.200706233 (2007).

151
59 Gómez, A. S., Conejo, A. N. & Zenit, R. Effect of separation angle and nozzle radial position on mixing time in ladles with two nozzles. Journal of Applied Fluid Mechanics 11, 11-20, doi:10.18869/acadpub.jafm.73.244.27503 (2018).
60 Mandal, J., Patil, S., Madan, M. & Mazumdar, D. Mixing time and correlation for ladles stirred with dual porous plugs. Metallurgical and Materials Transactions B: Process Metallurgy and Materials Processing Science 36, 479-487 (2005).
61 Roth, C., Peter, M., Schindler, M. & Koch, K. Cold model investigations into the effects of bottom blowing in metallurgical reactors. Steel Research 66, 325-330, doi:10.1002/srin.199501132 (1995).
62 Conejo, A. N., Kitamura, S., Maruoka, N. & Kim, S. J. Effects of top layer, nozzle arrangement, and gas flow rate on mixing time in agitated ladles by bottom gas injection. Metallurgical and Materials Transactions B: Process Metallurgy and Materials Processing Science 44, 914-923, doi:10.1007/s11663-013-9829-5 (2013).
63 Zhu, M. Y., Inomoto, T., Sawada, I. & Hsiao, T. C. Fluid Flow and Mixing Phenomena in the Ladle Stirred by Argon through Multi-Tuyere. ISIJ International 35, 472-479, doi:10.2355/isijinternational.35.472 (1995).
64 Liu, H., Qi, Z. & Xu, M. Numerical simulation of fluid flow and interfacial behavior in three-phase argon-stirred ladles with one plug and dual plugs. Steel Research International 82, 440-458, doi:10.1002/srin.201000164 (2011).
65 Amaro-Villeda, A. M., Ramirez-Argaez, M. A. & Conejo, A. N. Effect of slag properties on mixing phenomena in gas-stirred ladles by physical modeling. ISIJ International 54, 1-8, doi:10.2355/isijinternational.54.1 (2014).
66 Tang, H., Guo, X., Wu, G. & Wang, Y. Effect of gas blown modes on mixing phenomena in a bottom stirring ladle with dual plugs. ISIJ International 56, 2161-2170, doi:10.2355/isijinternational.ISIJINT-2016-360 (2016).
67 Terrazas, M. S. C. & Conejo, A. N. Effect of Nozzle Diameter on Mixing Time During Bottom-Gas Injection in Metallurgical Ladles. Metallurgical and Materials Transactions B: Process Metallurgy and Materials Processing Science 46, 711-718, doi:10.1007/s11663-014-0263-0 (2015).
68 Mazumdar, D., Nakajima, H. & Guthrie, R. I. L. Possible roles of upper slag phases on the fluid dynamics of gas stirred ladles. Metallurgical Transactions B 19, 507-511, doi:10.1007/BF02657751 (1988).
69 Yonezawa, K. & Schwerdtfeger, K. Spout eyes formed by an emerging gas plume at the surface of a slag-covered metal melt. Metallurgical and Materials Transactions A: Physical Metallurgy and Materials Science 30, 411-418 (1999).
70 Peranandhanthan, M. & Mazumdar, D. Modeling of slag eye area in argon stirred ladles. ISIJ International 50, 1622-1631, doi:10.2355/isijinternational.50.1622 (2010).
71 Jonsson, L. & Jönsson, P. Modeling of fluid flow conditions around the slag/metal interface in a gas-stirred ladle. ISIJ International 36, 1127-1134 (1996).
72 Li, B., Yin, H., Zhou, C. Q. & Tsukihashi, F. Modeling of Three-phase Flows and Behavior of Slag/Steel Interface in an Argon Gas Stirred Ladle. ISIJ International 48, 1704-1711, doi:10.2355/isijinternational.48.1704 (2008).
73 Guö, D. & Irons, O. A. Modeling of gas-liquid reactions in ladle metallurgy: Part II. Numerical simulation. Metallurgical and Materials Transactions B: Process Metallurgy and Materials Processing Science 31, 1457-1464 (2000).
74 Kleimt, B., Köhle, S., Johann, K. P., Jungreithmeier, A. & Molinero, J. Dynamic process model for denitrogenation and dehydrogenation by vacuum degassing. Scandinavian Journal of Metallurgy 29, 194-205 (2000).
75 Steneholm, K., Andersson, M., Tilliander, A. & Jönsson, P. G. Removal of hydrogen, nitrogen and sulphur from tool steel during vacuum degassing. Ironmaking and Steelmaking 40, 199-205, doi:10.1179/1743281212Y.0000000029 (2013).

152
76 Hallberg, M., Jönsson, P. G., Jonsson, T. L. I. & Eriksson, R. Process model of inclusion separation in a stirred steel ladle. Scandinavian Journal of Metallurgy 34, 41-56, doi:10.1111/j.1600-0692.2005.00716.x (2005).