Embed Size (px)
Citation preview
Numeracy Across the Curriculum
ART & DESIGN
Symmetry
A line of symmetry is a line which divides a picture into two parts, each of which is the
mirror image of the other. Pictures may have more than one line of symmetry.
www.mrshowardsnumeracynetwork.com @MrsHsNumeracy
Numeracy Across the Curriculum
ART & DESIGN
Symmetry
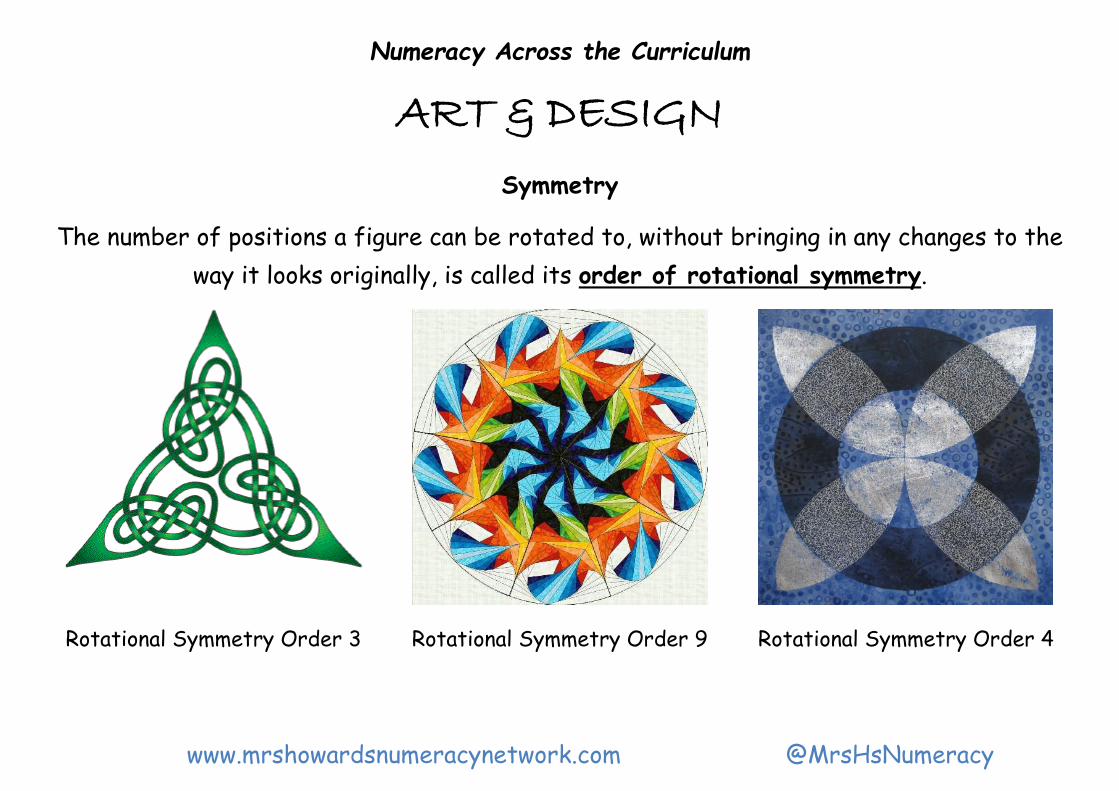
The number of positions a figure can be rotated to, without bringing in any changes to the
way it looks originally, is called its order of rotational symmetry.
Rotational Symmetry Order 3 Rotational Symmetry Order 9 Rotational Symmetry Order 4
www.mrshowardsnumeracynetwork.com @MrsHsNumeracy
Numeracy Across the Curriculum
ART & DESIGN
Ratio
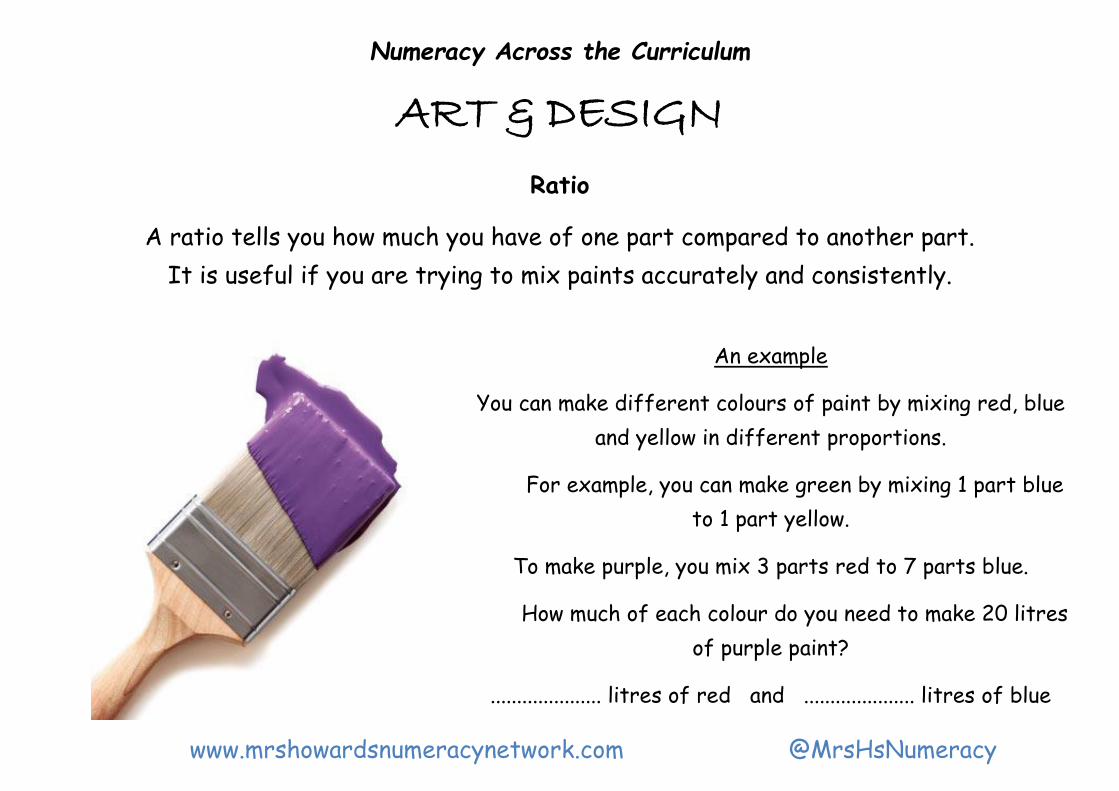
A ratio tells you how much you have of one part compared to another part.
It is useful if you are trying to mix paints accurately and consistently.
An example
You can make different colours of paint by mixing red, blue
and yellow in different proportions.
For example, you can make green by mixing 1 part blue
to 1 part yellow.
To make purple, you mix 3 parts red to 7 parts blue.
How much of each colour do you need to make 20 litres
of purple paint?
..................... litres of red and ..................... litres of blue
www.mrshowardsnumeracynetwork.com @MrsHsNumeracy
Numeracy Across the Curriculum
ART & DESIGN
Ratio
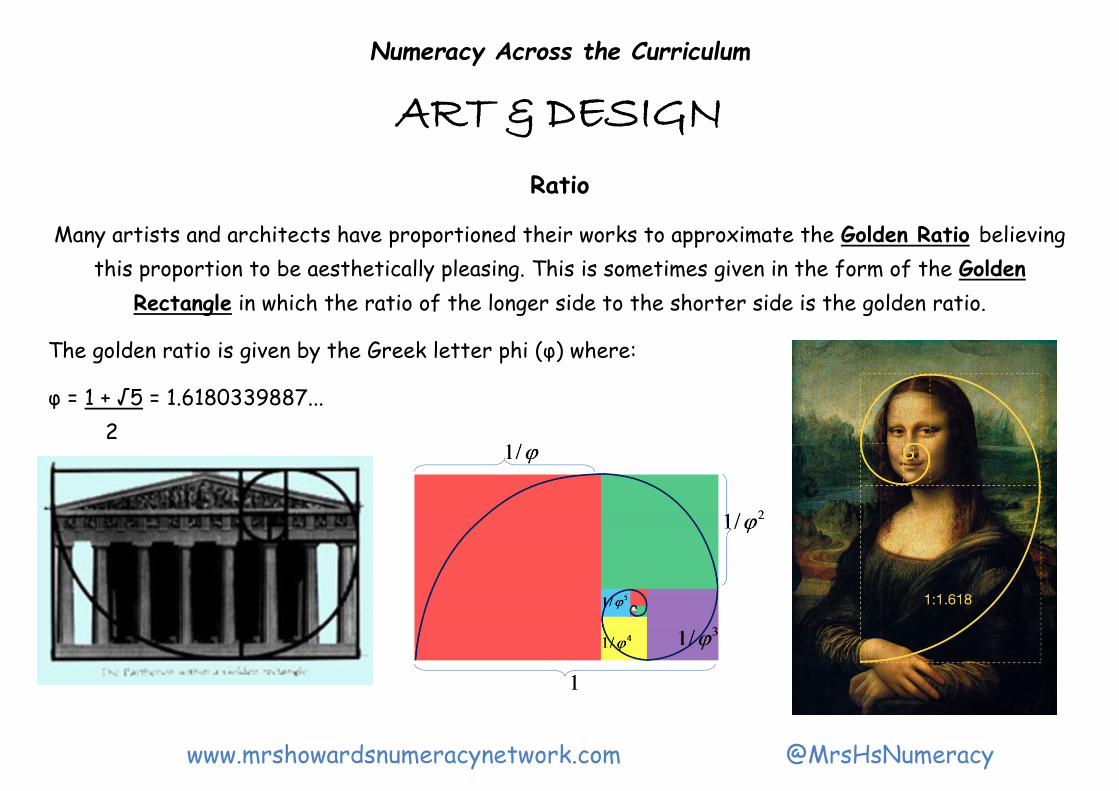
Many artists and architects have proportioned their works to approximate the Golden Ratio believing
this proportion to be aesthetically pleasing. This is sometimes given in the form of the Golden
Rectangle in which the ratio of the longer side to the shorter side is the golden ratio.
The golden ratio is given by the Greek letter phi (φ) where:
φ = 1 + √5 = 1.6180339887...
2
www.mrshowardsnumeracynetwork.com @MrsHsNumeracy
Numeracy Across the Curriculum
ART & DESIGN
Perspective, Enlargement and Scale Factor
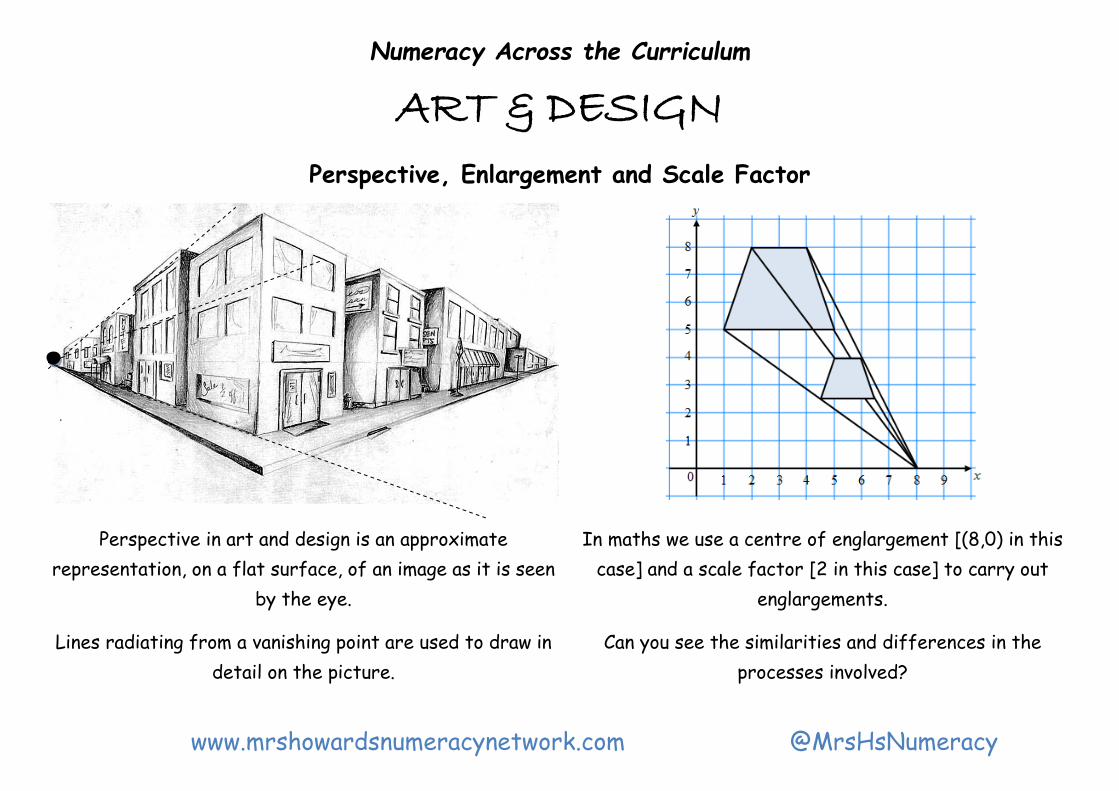
Perspective in art and design is an approximate
representation, on a flat surface, of an image as it is seen
by the eye.
Lines radiating from a vanishing point are used to draw in
detail on the picture.
In maths we use a centre of englargement [(8,0) in this
case] and a scale factor [2 in this case] to carry out
englargements.
Can you see the similarities and differences in the
processes involved?
www.mrshowardsnumeracynetwork.com @MrsHsNumeracy
Numeracy Across the Curriculum
ART & DESIGN
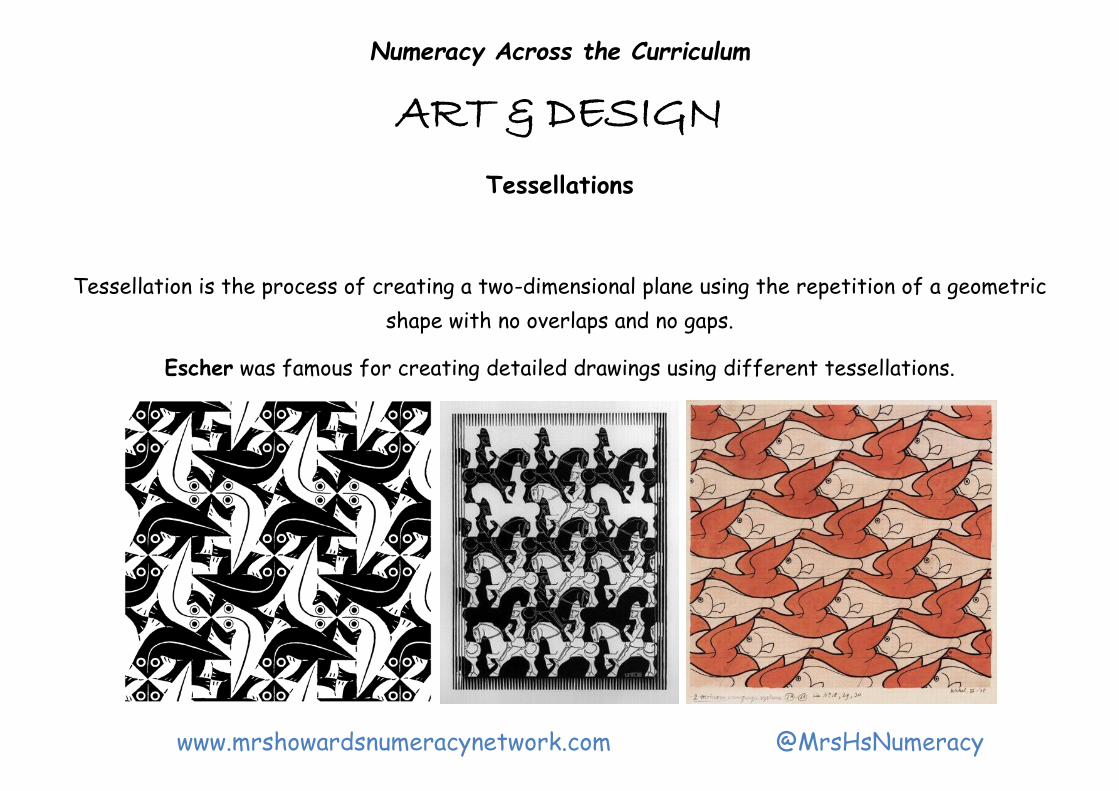
Tessellations
Tessellation is the process of creating a two-dimensional plane using the repetition of a geometric
shape with no overlaps and no gaps.
Escher was famous for creating detailed drawings using different tessellations.
www.mrshowardsnumeracynetwork.com @MrsHsNumeracy
Numeracy Across the Curriculum
ART & DESIGN
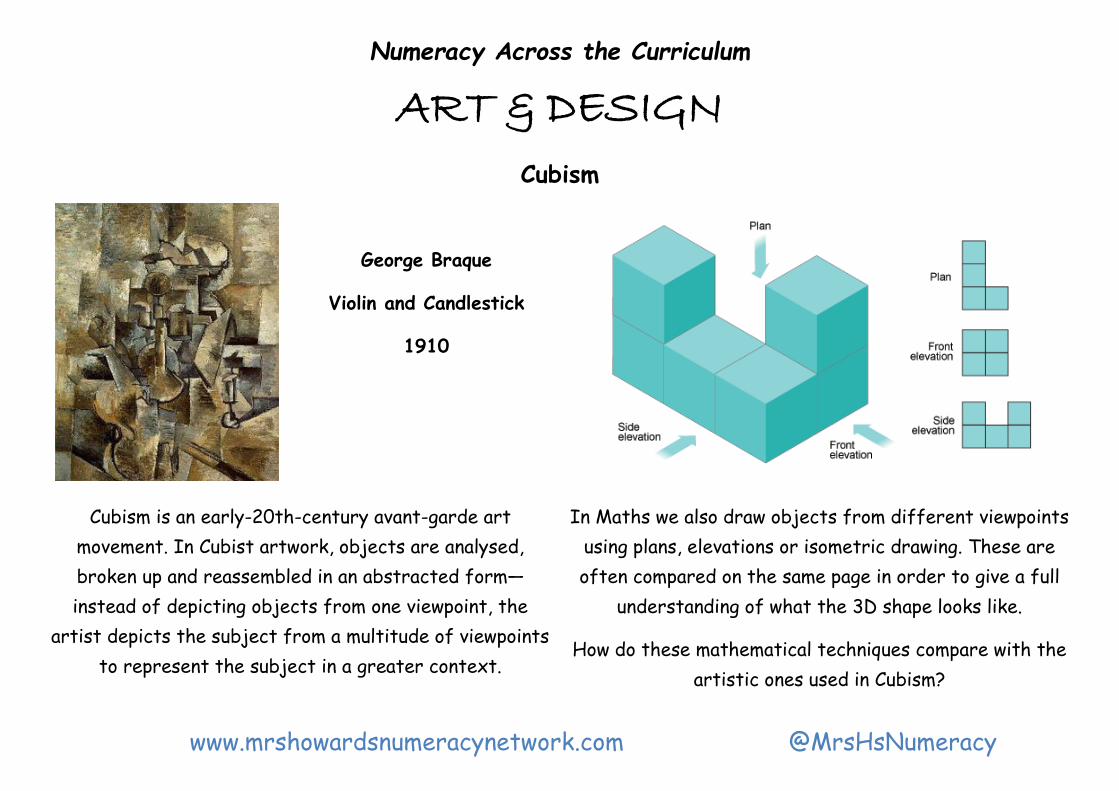
Cubism
George Braque
Violin and Candlestick
1910
Cubism is an early-20th-century avant-garde art
movement. In Cubist artwork, objects are analysed,
broken up and reassembled in an abstracted form—
instead of depicting objects from one viewpoint, the
artist depicts the subject from a multitude of viewpoints
to represent the subject in a greater context.
In Maths we also draw objects from different viewpoints
using plans, elevations or isometric drawing. These are
often compared on the same page in order to give a full
understanding of what the 3D shape looks like.
How do these mathematical techniques compare with the
artistic ones used in Cubism?
www.mrshowardsnumeracynetwork.com @MrsHsNumeracy
Numeracy Across the Curriculum
ART & DESIGN
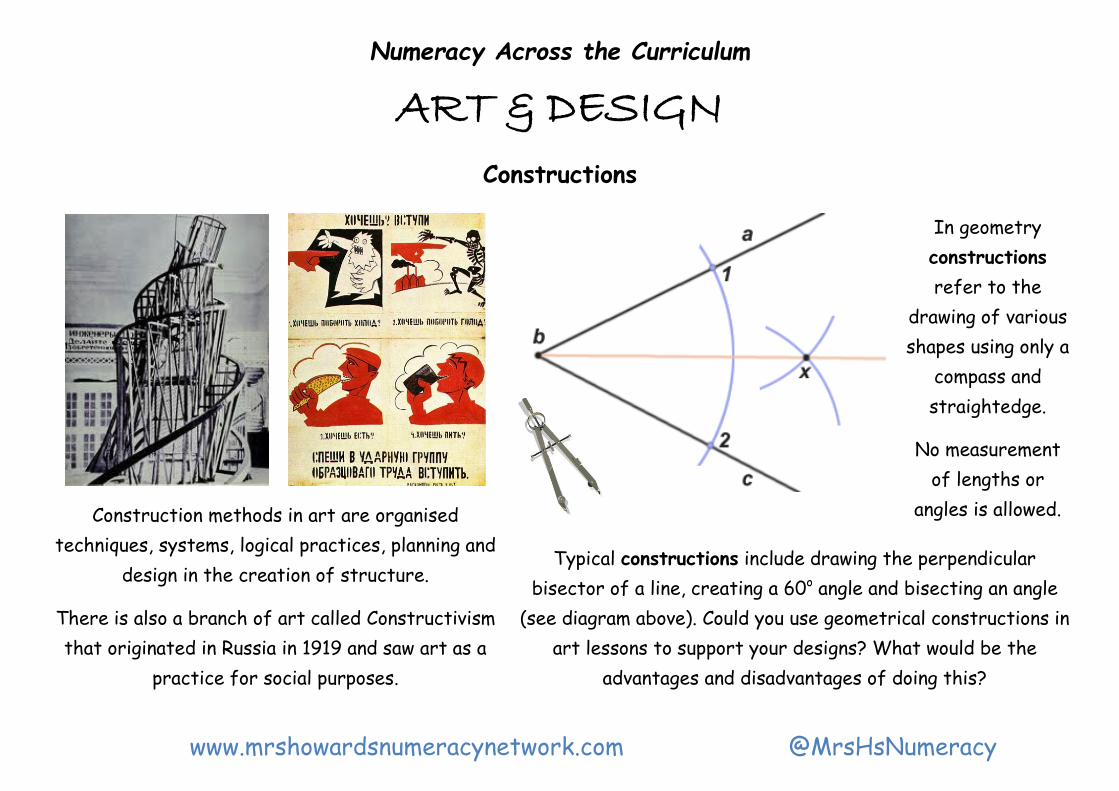
Constructions
In geometry
constructions
refer to the
drawing of various
shapes using only a
compass and
straightedge.
No measurement
of lengths or
angles is allowed. Construction methods in art are organised
techniques, systems, logical practices, planning and
design in the creation of structure.
There is also a branch of art called Constructivism
that originated in Russia in 1919 and saw art as a
practice for social purposes.
Typical constructions include drawing the perpendicular
bisector of a line, creating a 60o angle and bisecting an angle
(see diagram above). Could you use geometrical constructions in
art lessons to support your designs? What would be the
advantages and disadvantages of doing this?
www.mrshowardsnumeracynetwork.com @MrsHsNumeracy
Numeracy Across the Curriculum
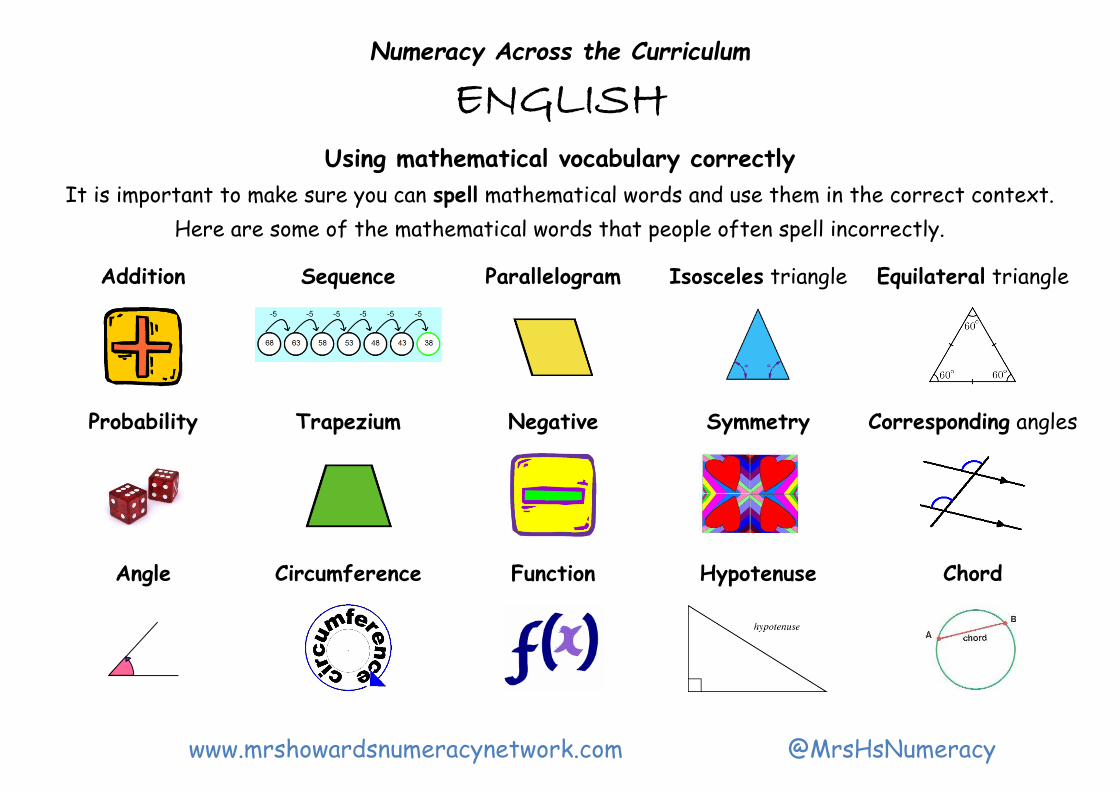
ENGLISH Using mathematical vocabulary correctly
It is important to make sure you can spell mathematical words and use them in the correct context.
Here are some of the mathematical words that people often spell incorrectly.
Addition Sequence Parallelogram Isosceles triangle Equilateral triangle
Probability Trapezium Negative Symmetry Corresponding angles
Angle Circumference Function Hypotenuse Chord
www.mrshowardsnumeracynetwork.com @MrsHsNumeracy
Numeracy Across the Curriculum
ENGLISH
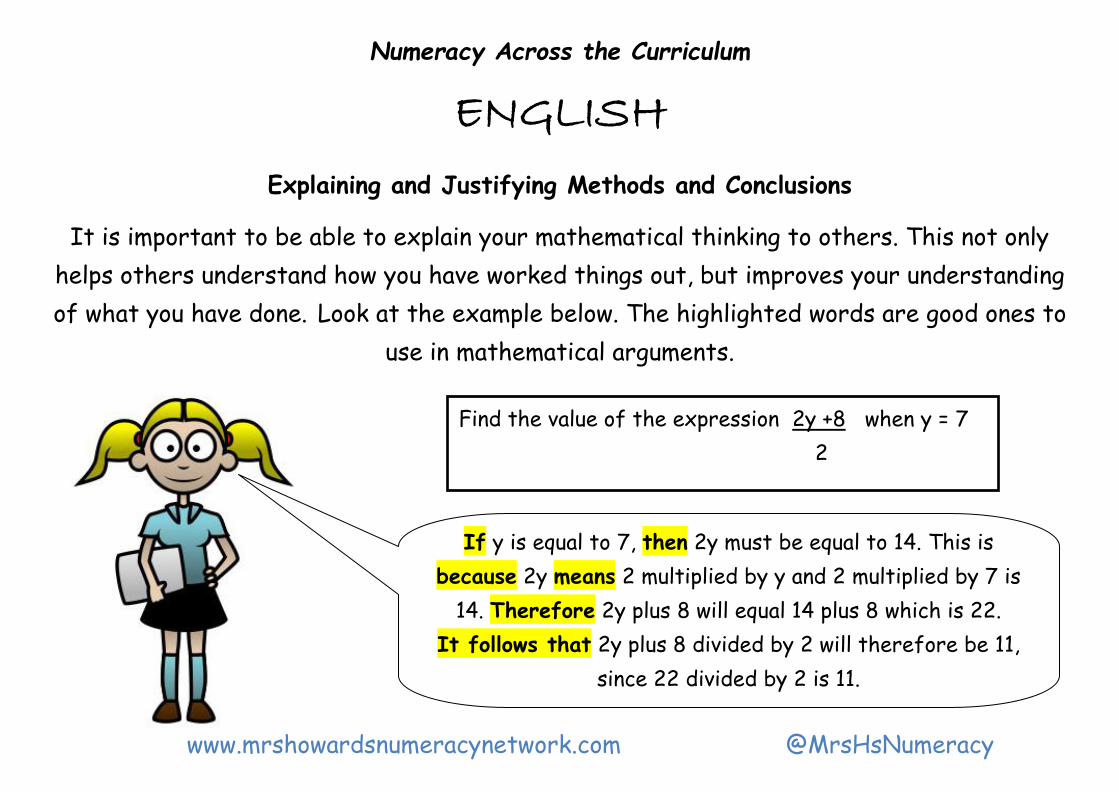
Explaining and Justifying Methods and Conclusions
It is important to be able to explain your mathematical thinking to others. This not only
helps others understand how you have worked things out, but improves your understanding
of what you have done. Look at the example below. The highlighted words are good ones to
use in mathematical arguments.
If y is equal to 7, then 2y must be equal to 14. This is
because 2y means 2 multiplied by y and 2 multiplied by 7 is
14. Therefore 2y plus 8 will equal 14 plus 8 which is 22.
It follows that 2y plus 8 divided by 2 will therefore be 11,
since 22 divided by 2 is 11.
Find the value of the expression 2y +8 when y = 7
2
www.mrshowardsnumeracynetwork.com @MrsHsNumeracy
Numeracy Across the Curriculum
ENGLISH
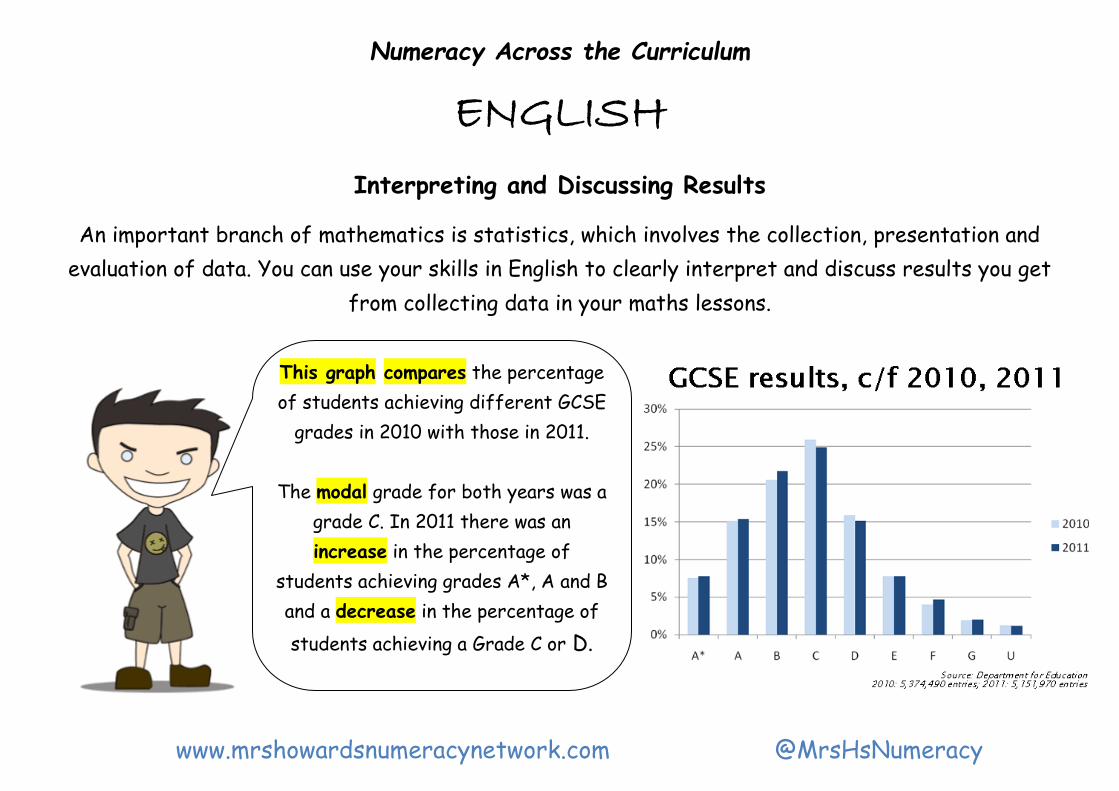
Interpreting and Discussing Results
An important branch of mathematics is statistics, which involves the collection, presentation and
evaluation of data. You can use your skills in English to clearly interpret and discuss results you get
from collecting data in your maths lessons.
This graph compares the percentage
of students achieving different GCSE
grades in 2010 with those in 2011.
The modal grade for both years was a
grade C. In 2011 there was an
increase in the percentage of
students achieving grades A*, A and B
and a decrease in the percentage of
students achieving a Grade C or D.
www.mrshowardsnumeracynetwork.com @MrsHsNumeracy
Numeracy Across the Curriculum
DESIGN & TECHNOLOGY (FOOD)
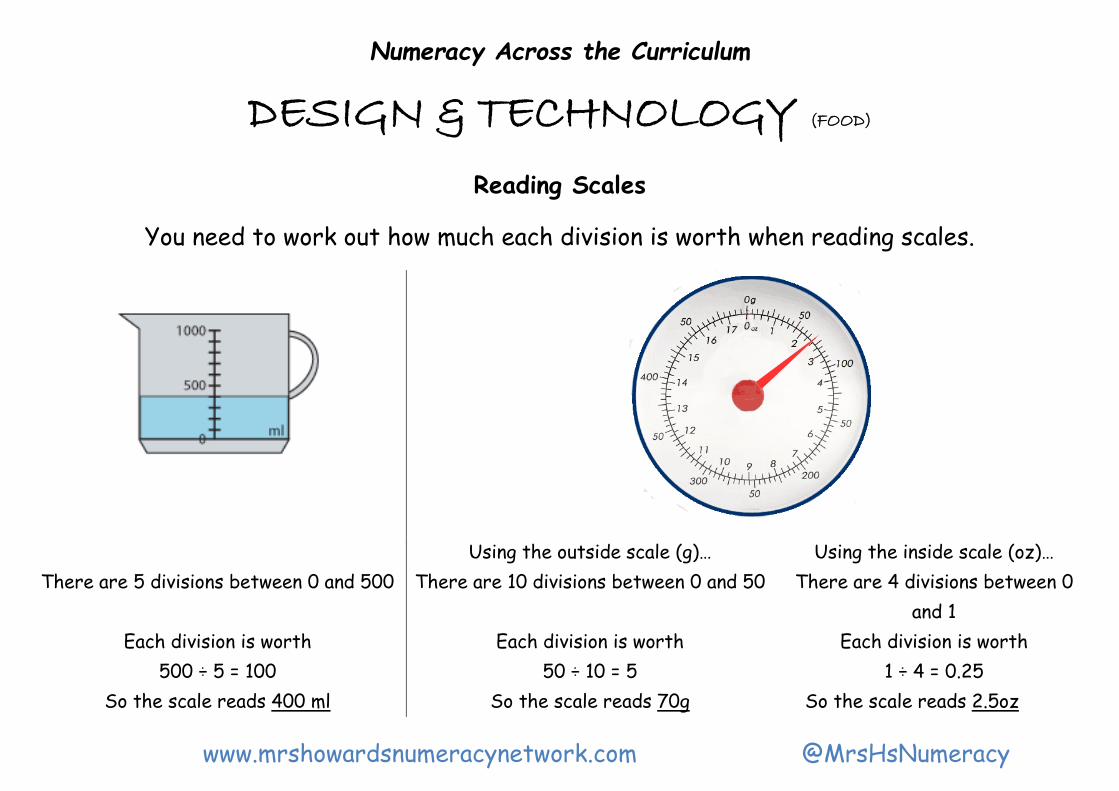
Reading Scales
You need to work out how much each division is worth when reading scales.
There are 5 divisions between 0 and 500
Each division is worth
500 ÷ 5 = 100
So the scale reads 400 ml
Using the outside scale (g)…
There are 10 divisions between 0 and 50
Each division is worth
50 ÷ 10 = 5
So the scale reads 70g
Using the inside scale (oz)…
There are 4 divisions between 0
and 1
Each division is worth
1 ÷ 4 = 0.25
So the scale reads 2.5oz
www.mrshowardsnumeracynetwork.com @MrsHsNumeracy
Numeracy Across the Curriculum
DESIGN & TECHNOLOGY (FOOD)
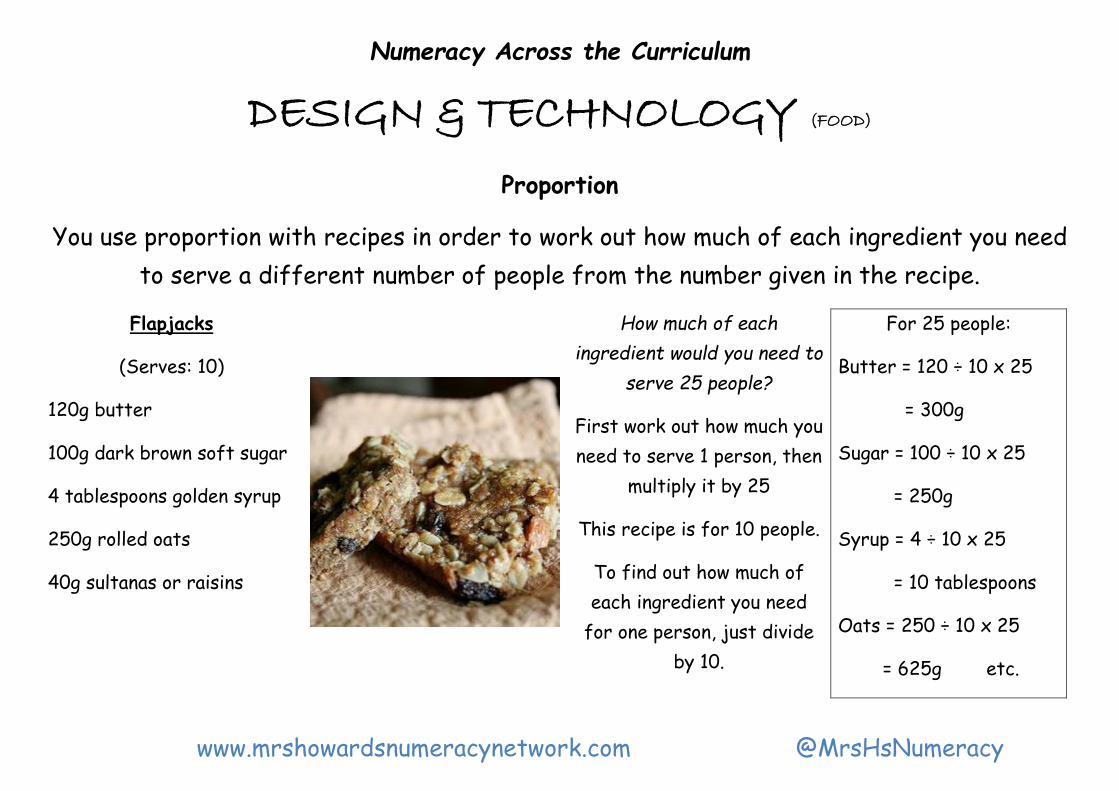
Proportion
You use proportion with recipes in order to work out how much of each ingredient you need
to serve a different number of people from the number given in the recipe.
Flapjacks
(Serves: 10)
120g butter
100g dark brown soft sugar
4 tablespoons golden syrup
250g rolled oats
40g sultanas or raisins
How much of each
ingredient would you need to
serve 25 people?
First work out how much you
need to serve 1 person, then
multiply it by 25
This recipe is for 10 people.
To find out how much of
each ingredient you need
for one person, just divide
by 10.
For 25 people:
Butter = 120 ÷ 10 x 25
= 300g
Sugar = 100 ÷ 10 x 25
= 250g
Syrup = 4 ÷ 10 x 25
= 10 tablespoons
Oats = 250 ÷ 10 x 25
= 625g etc.
www.mrshowardsnumeracynetwork.com @MrsHsNumeracy
Numeracy Across the Curriculum
DESIGN & TECHNOLOGY (FOOD)
Ratio
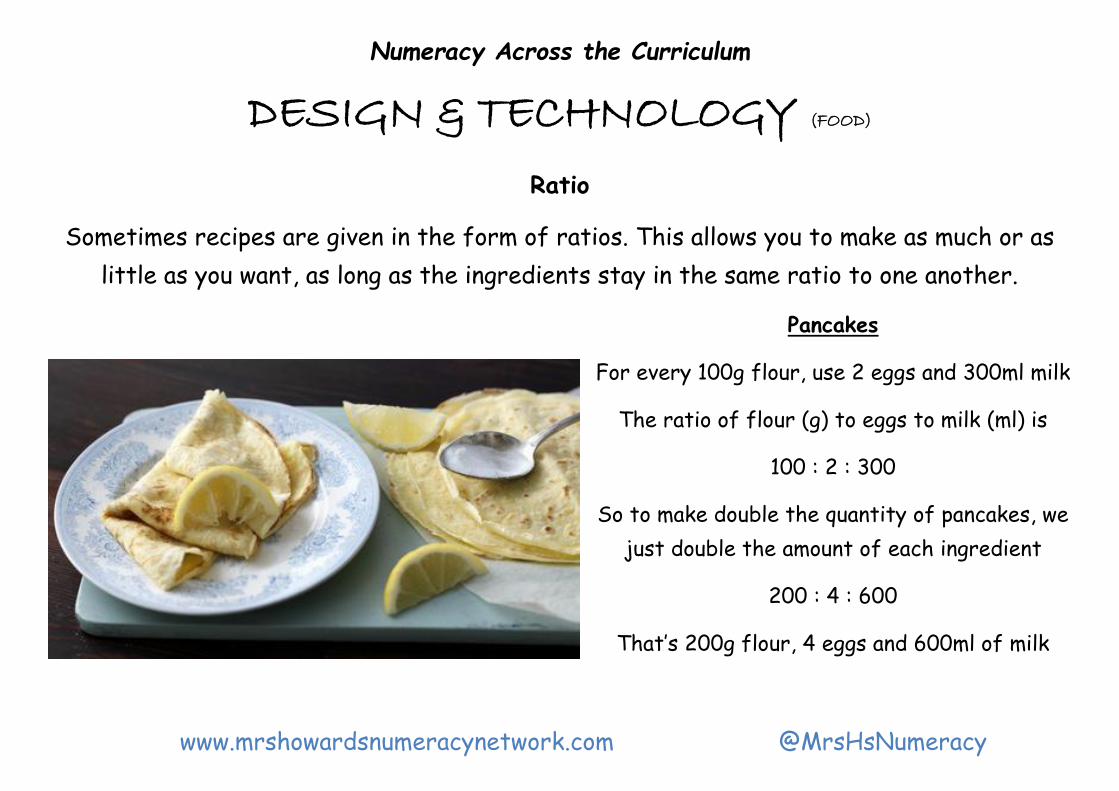
Sometimes recipes are given in the form of ratios. This allows you to make as much or as
little as you want, as long as the ingredients stay in the same ratio to one another.
Pancakes
For every 100g flour, use 2 eggs and 300ml milk
The ratio of flour (g) to eggs to milk (ml) is
100 : 2 : 300
So to make double the quantity of pancakes, we
just double the amount of each ingredient
200 : 4 : 600
That’s 200g flour, 4 eggs and 600ml of milk
www.mrshowardsnumeracynetwork.com @MrsHsNumeracy
Numeracy Across the Curriculum
DESIGN & TECHNOLOGY (RESISTANT MATERIALS)
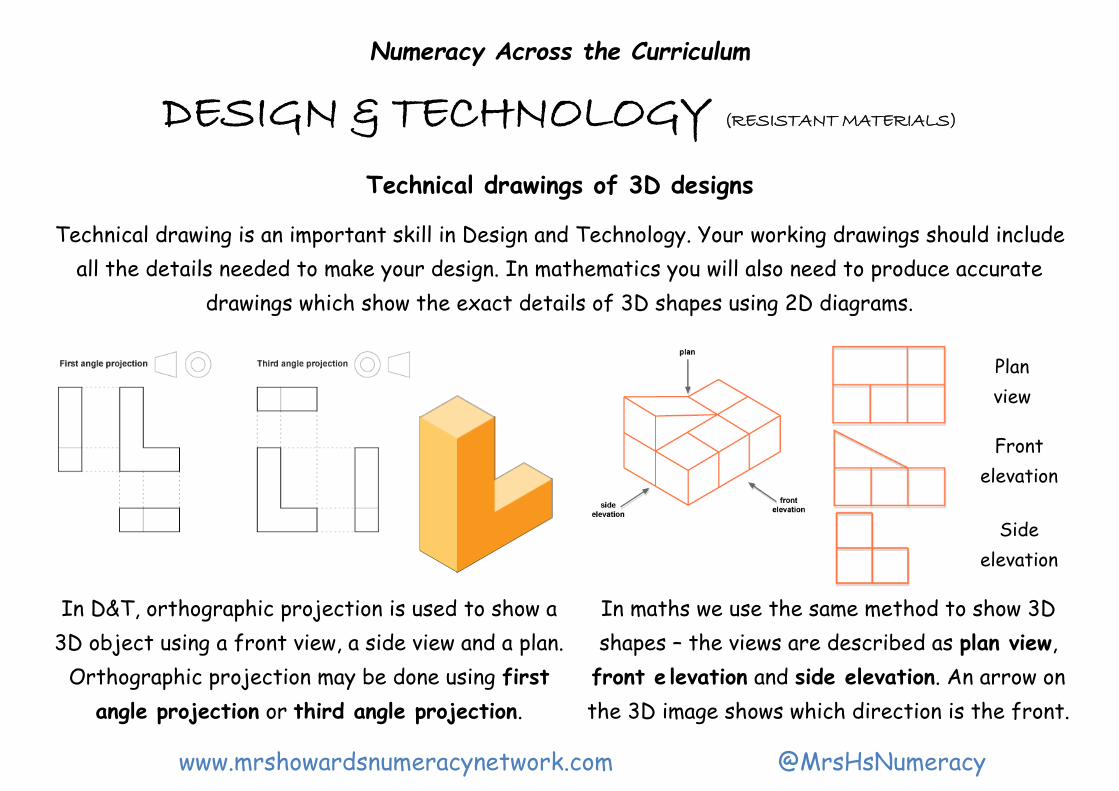
Technical drawings of 3D designs
Technical drawing is an important skill in Design and Technology. Your working drawings should include
all the details needed to make your design. In mathematics you will also need to produce accurate
drawings which show the exact details of 3D shapes using 2D diagrams.
In D&T, orthographic projection is used to show a
3D object using a front view, a side view and a plan.
Orthographic projection may be done using first
angle projection or third angle projection.
In maths we use the same method to show 3D
shapes – the views are described as plan view,
front e levation and side elevation. An arrow on
the 3D image shows which direction is the front.
Plan
view
Front
elevation
Side
elevation
www.mrshowardsnumeracynetwork.com @MrsHsNumeracy
Numeracy Across the Curriculum
DESIGN & TECHNOLOGY (SYSTEMS AND CONTROL)
Ratio
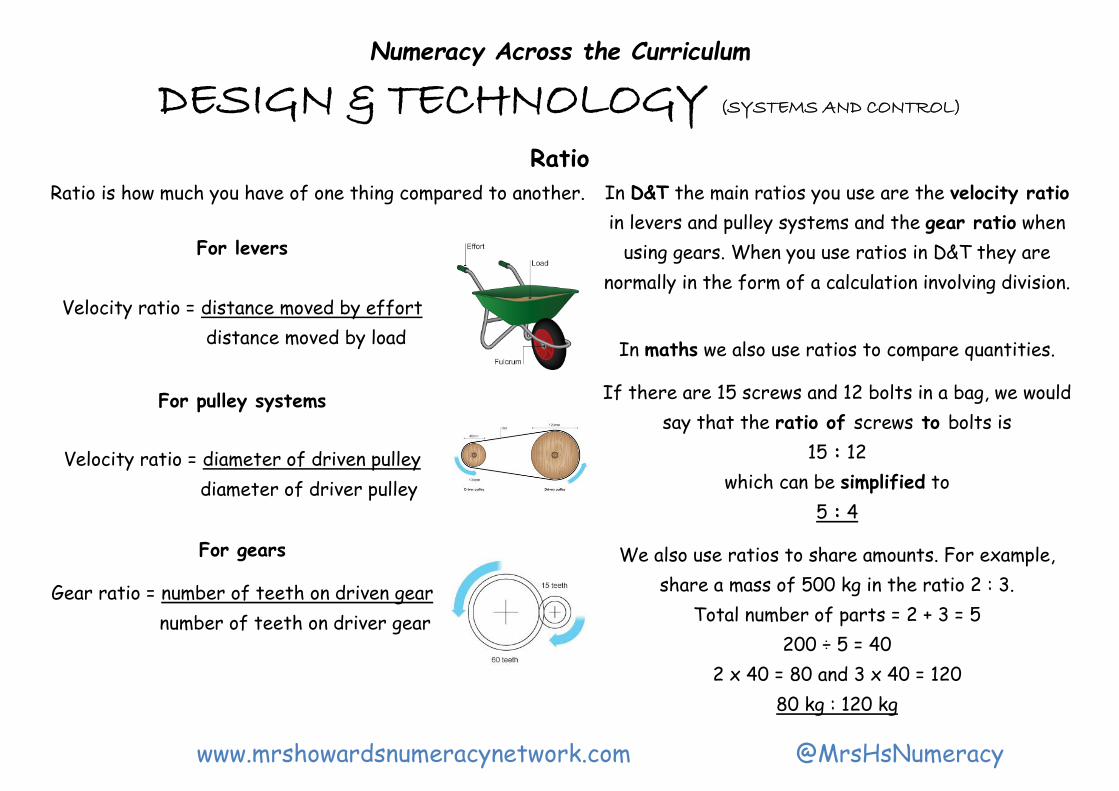
Ratio is how much you have of one thing compared to another. In D&T the main ratios you use are the velocity ratio
in levers and pulley systems and the gear ratio when
using gears. When you use ratios in D&T they are
normally in the form of a calculation involving division.
In maths we also use ratios to compare quantities.
If there are 15 screws and 12 bolts in a bag, we would
say that the ratio of screws to bolts is
15 : 12
which can be simplified to
5 : 4
We also use ratios to share amounts. For example,
share a mass of 500 kg in the ratio 2 : 3.
Total number of parts = 2 + 3 = 5
200 ÷ 5 = 40
2 x 40 = 80 and 3 x 40 = 120
80 kg : 120 kg
For levers
Velocity ratio = distance moved by effort
distance moved by load
For pulley systems
Velocity ratio = diameter of driven pulley
diameter of driver pulley
For gears
Gear ratio = number of teeth on driven gear
number of teeth on driver gear
www.mrshowardsnumeracynetwork.com @MrsHsNumeracy
Numeracy Across the Curriculum
DESIGN & TECHNOLOGY (ELECTRONICS)
Percentages
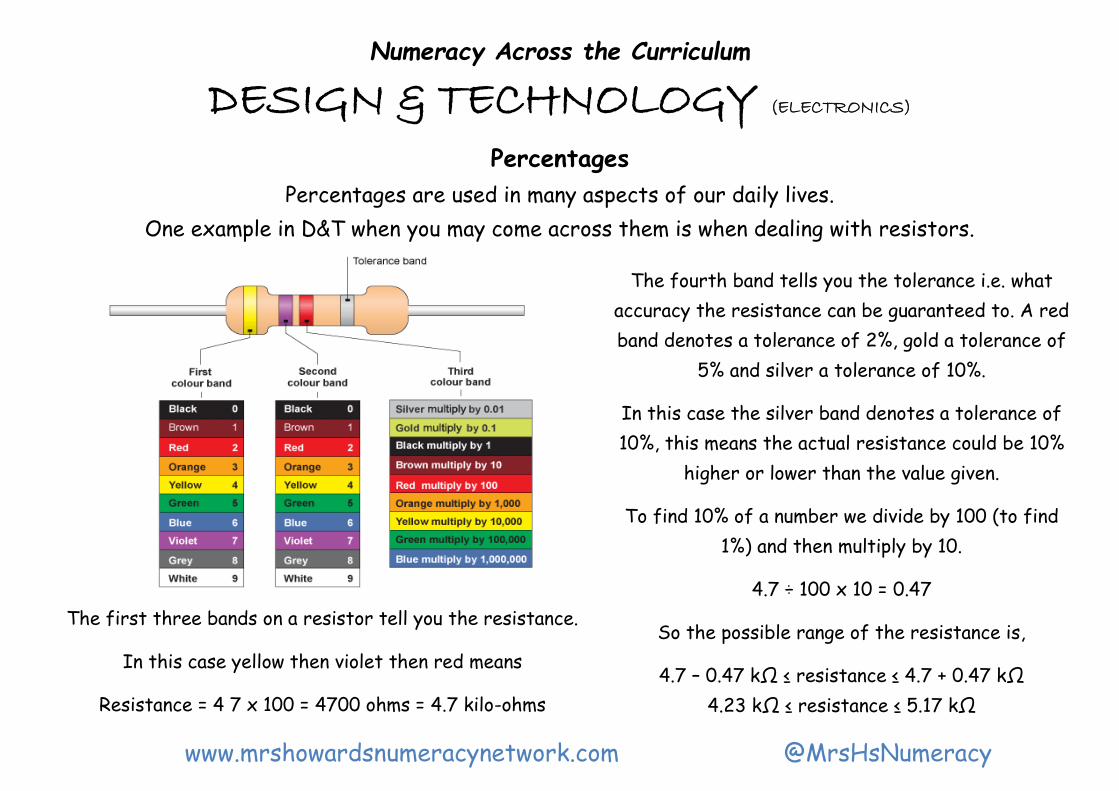
Percentages are used in many aspects of our daily lives.
One example in D&T when you may come across them is when dealing with resistors.
The fourth band tells you the tolerance i.e. what
accuracy the resistance can be guaranteed to. A red
band denotes a tolerance of 2%, gold a tolerance of
5% and silver a tolerance of 10%.
In this case the silver band denotes a tolerance of
10%, this means the actual resistance could be 10%
higher or lower than the value given.
To find 10% of a number we divide by 100 (to find
1%) and then multiply by 10.
4.7 ÷ 100 x 10 = 0.47
So the possible range of the resistance is,
4.7 – 0.47 kΩ ≤ resistance ≤ 4.7 + 0.47 kΩ
4.23 kΩ ≤ resistance ≤ 5.17 kΩ
The first three bands on a resistor tell you the resistance.
In this case yellow then violet then red means
Resistance = 4 7 x 100 = 4700 ohms = 4.7 kilo-ohms
www.mrshowardsnumeracynetwork.com @MrsHsNumeracy
Numeracy Across the Curriculum
DESIGN & TECHNOLOGY (GRAPHICS)
Isometric Drawings
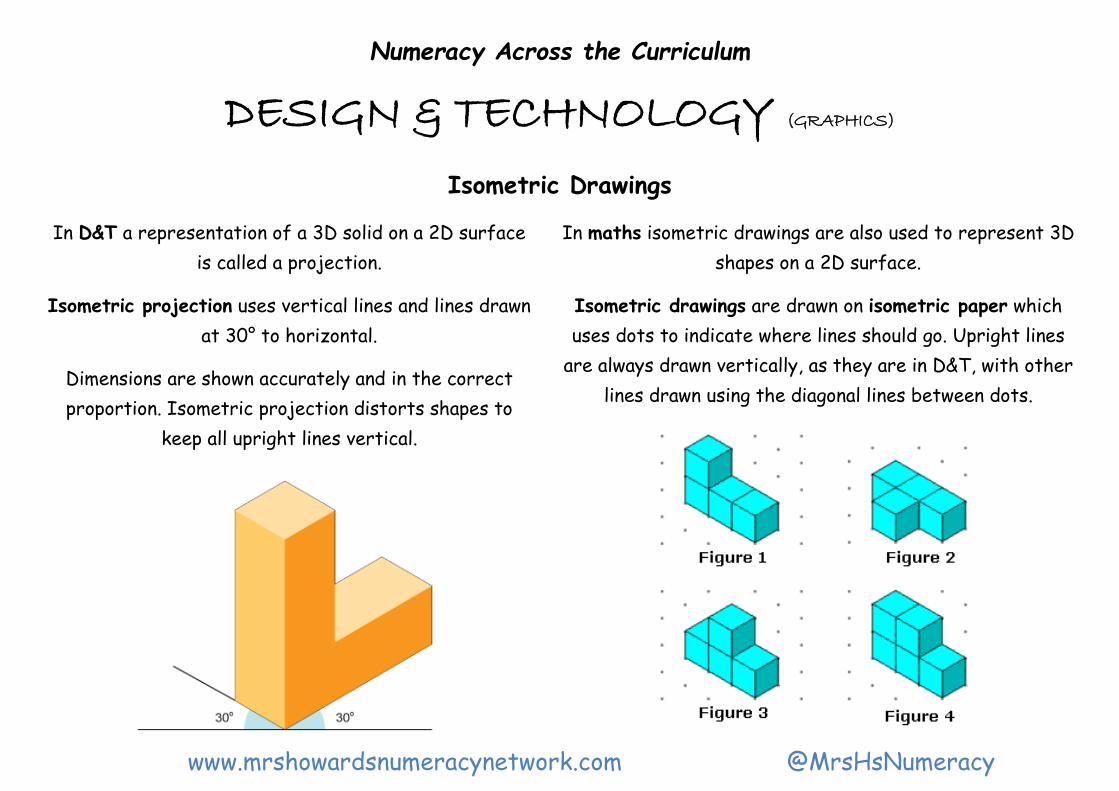
In D&T a representation of a 3D solid on a 2D surface
is called a projection.
Isometric projection uses vertical lines and lines drawn
at 30° to horizontal.
Dimensions are shown accurately and in the correct
proportion. Isometric projection distorts shapes to
keep all upright lines vertical.
In maths isometric drawings are also used to represent 3D
shapes on a 2D surface.
Isometric drawings are drawn on isometric paper which
uses dots to indicate where lines should go. Upright lines
are always drawn vertically, as they are in D&T, with other
lines drawn using the diagonal lines between dots.
www.mrshowardsnumeracynetwork.com @MrsHsNumeracy
Numeracy Across the Curriculum
DESIGN & TECHNOLOGY (GRAPHICS)
Scale and Scale Factor
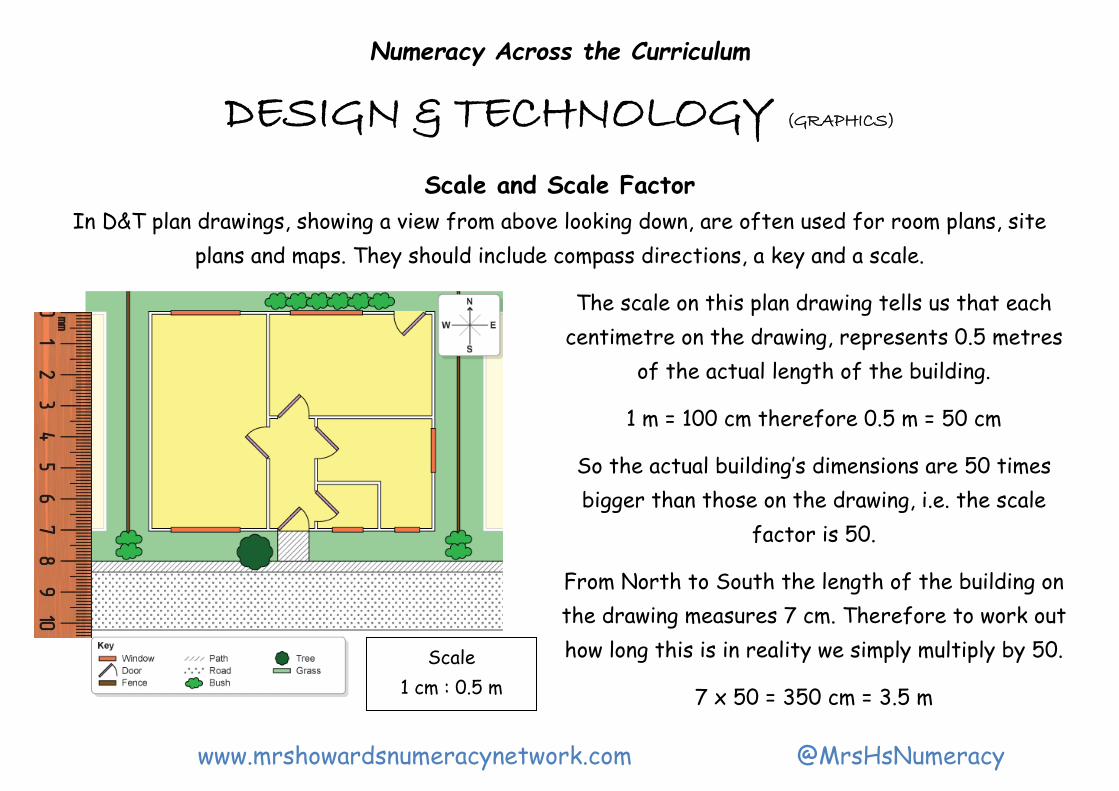
In D&T plan drawings, showing a view from above looking down, are often used for room plans, site
plans and maps. They should include compass directions, a key and a scale.
The scale on this plan drawing tells us that each
centimetre on the drawing, represents 0.5 metres
of the actual length of the building.
1 m = 100 cm therefore 0.5 m = 50 cm
So the actual building’s dimensions are 50 times
bigger than those on the drawing, i.e. the scale
factor is 50.
From North to South the length of the building on
the drawing measures 7 cm. Therefore to work out
how long this is in reality we simply multiply by 50.
7 x 50 = 350 cm = 3.5 m
Scale
1 cm : 0.5 m
www.mrshowardsnumeracynetwork.com @MrsHsNumeracy
Numeracy Across the Curriculum
DESIGN & TECHNOLOGY
Accuracy and Rounding
In both Design and Technology and Mathematics it is at times necessary to give measurements to a
certain degree of accuracy. This is usually done by rounding to a given number of decimal places or
significant figures. Sometimes you may be asked to round to the nearest whole unit.
The measuring equipment you use will determine what accuracy you can measure something to.
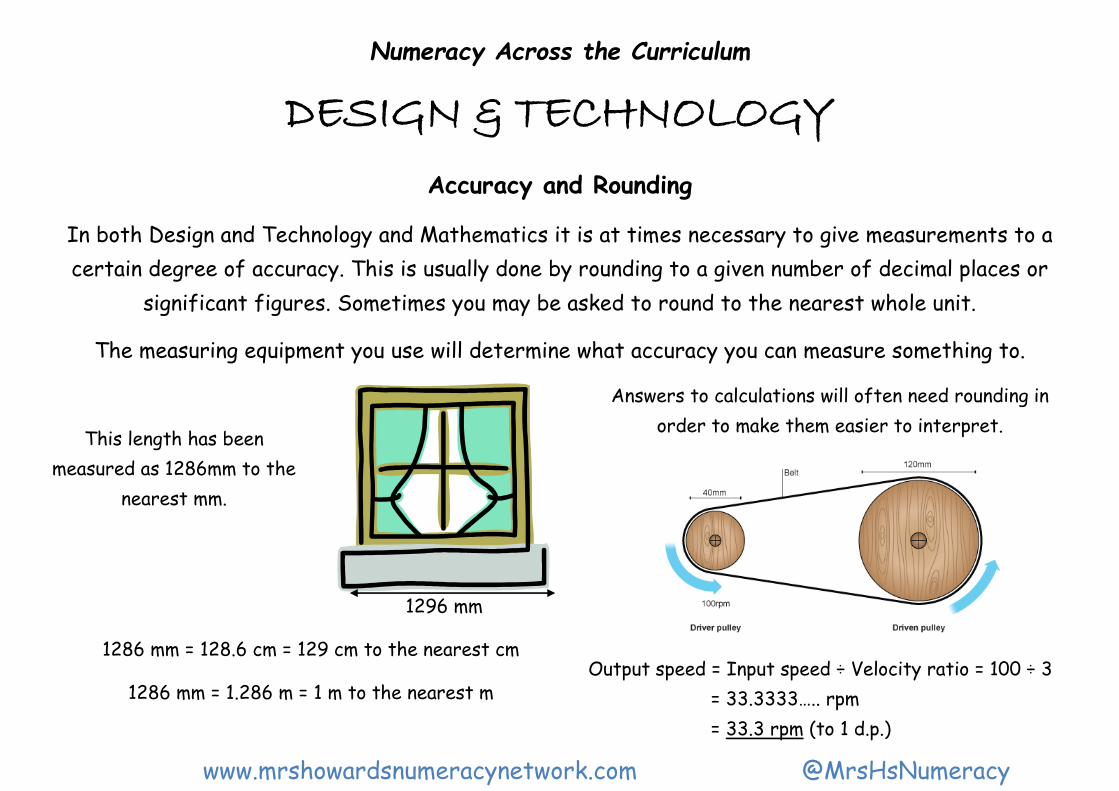
This length has been
measured as 1286mm to the
nearest mm.
1296 mm
Answers to calculations will often need rounding in
order to make them easier to interpret.
Output speed = Input speed ÷ Velocity ratio = 100 ÷ 3
= 33.3333….. rpm
= 33.3 rpm (to 1 d.p.)
1286 mm = 128.6 cm = 129 cm to the nearest cm
1286 mm = 1.286 m = 1 m to the nearest m
www.mrshowardsnumeracynetwork.com @MrsHsNumeracy
Numeracy Across the Curriculum
DESIGN & TECHNOLOGY (TEXTILES)
Using scale and proportion
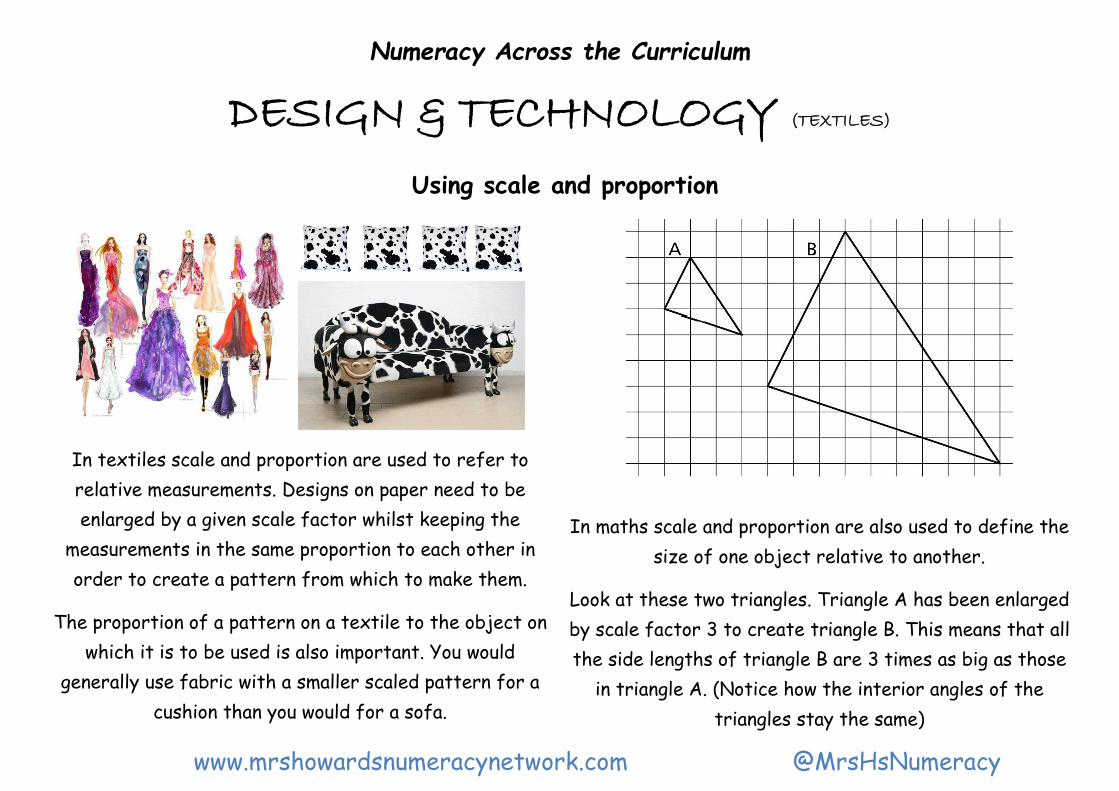
In textiles scale and proportion are used to refer to
relative measurements. Designs on paper need to be
enlarged by a given scale factor whilst keeping the
measurements in the same proportion to each other in
order to create a pattern from which to make them.
The proportion of a pattern on a textile to the object on
which it is to be used is also important. You would
generally use fabric with a smaller scaled pattern for a
cushion than you would for a sofa.
In maths scale and proportion are also used to define the
size of one object relative to another.
Look at these two triangles. Triangle A has been enlarged
by scale factor 3 to create triangle B. This means that all
the side lengths of triangle B are 3 times as big as those
in triangle A. (Notice how the interior angles of the
triangles stay the same)
www.mrshowardsnumeracynetwork.com @MrsHsNumeracy
Numeracy Across the Curriculum
DESIGN & TECHNOLOGY
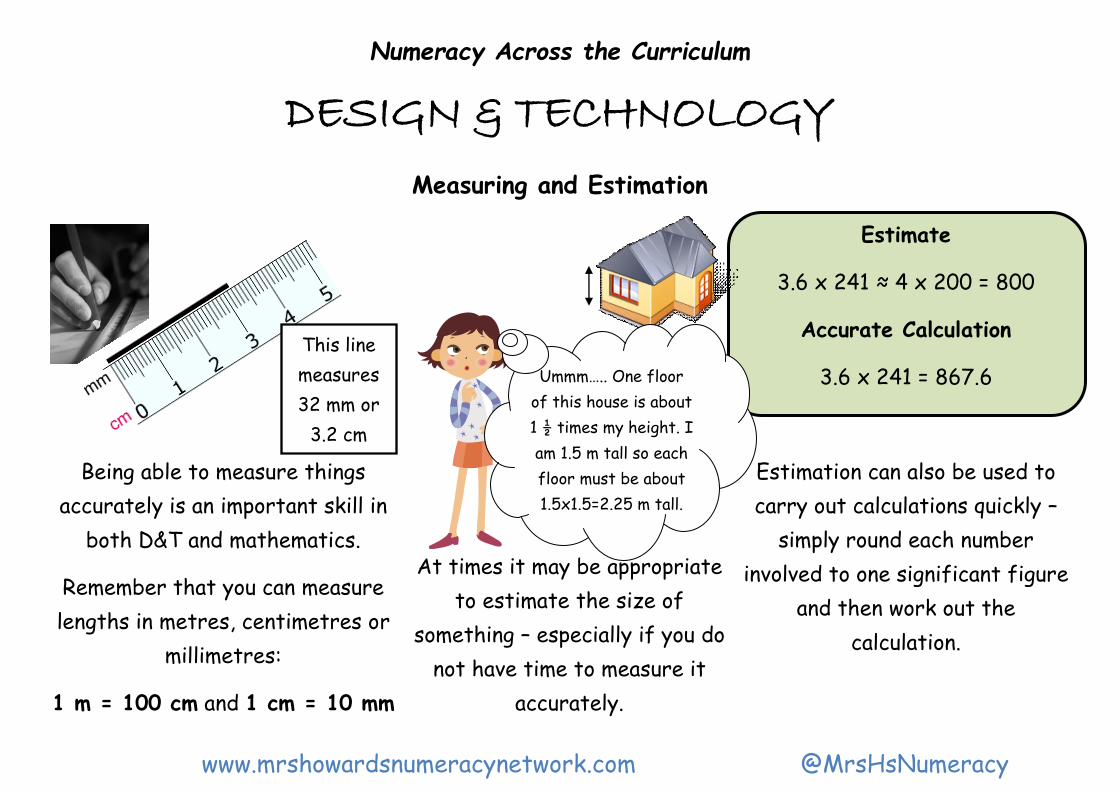
Measuring and Estimation
Estimate
3.6 x 241 ≈ 4 x 200 = 800
Accurate Calculation
3.6 x 241 = 867.6
Being able to measure things
accurately is an important skill in
both D&T and mathematics.
Remember that you can measure
lengths in metres, centimetres or
millimetres:
1 m = 100 cm and 1 cm = 10 mm
At times it may be appropriate
to estimate the size of
something – especially if you do
not have time to measure it
accurately.
Estimation can also be used to
carry out calculations quickly –
simply round each number
involved to one significant figure
and then work out the
calculation.
This line
measures
32 mm or
3.2 cm
Ummm….. One floor
of this house is about
1 ½ times my height. I
am 1.5 m tall so each
floor must be about
1.5x1.5=2.25 m tall.
www.mrshowardsnumeracynetwork.com @MrsHsNumeracy
Numeracy Across the Curriculum
GEOGRAPHY
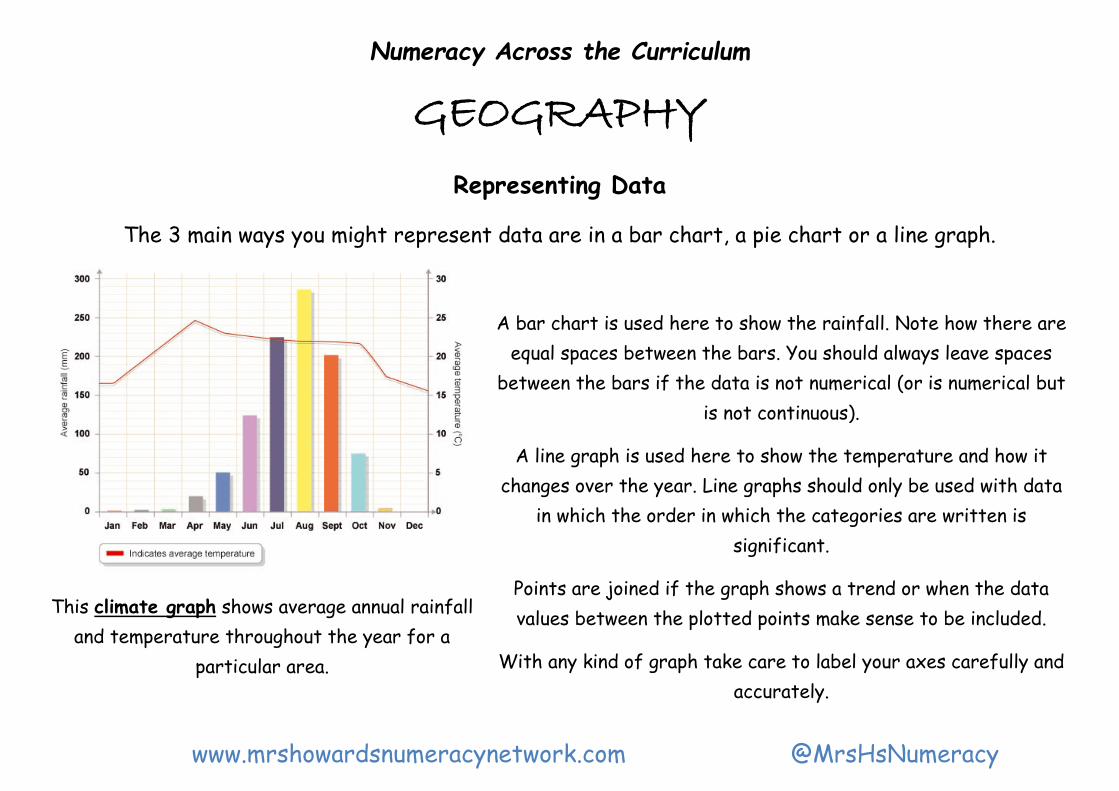
Representing Data
The 3 main ways you might represent data are in a bar chart, a pie chart or a line graph.
A bar chart is used here to show the rainfall. Note how there are
equal spaces between the bars. You should always leave spaces
between the bars if the data is not numerical (or is numerical but
is not continuous).
A line graph is used here to show the temperature and how it
changes over the year. Line graphs should only be used with data
in which the order in which the categories are written is
significant.
Points are joined if the graph shows a trend or when the data
values between the plotted points make sense to be included.
With any kind of graph take care to label your axes carefully and
accurately.
This climate graph shows average annual rainfall
and temperature throughout the year for a
particular area.
www.mrshowardsnumeracynetwork.com @MrsHsNumeracy
Numeracy Across the Curriculum
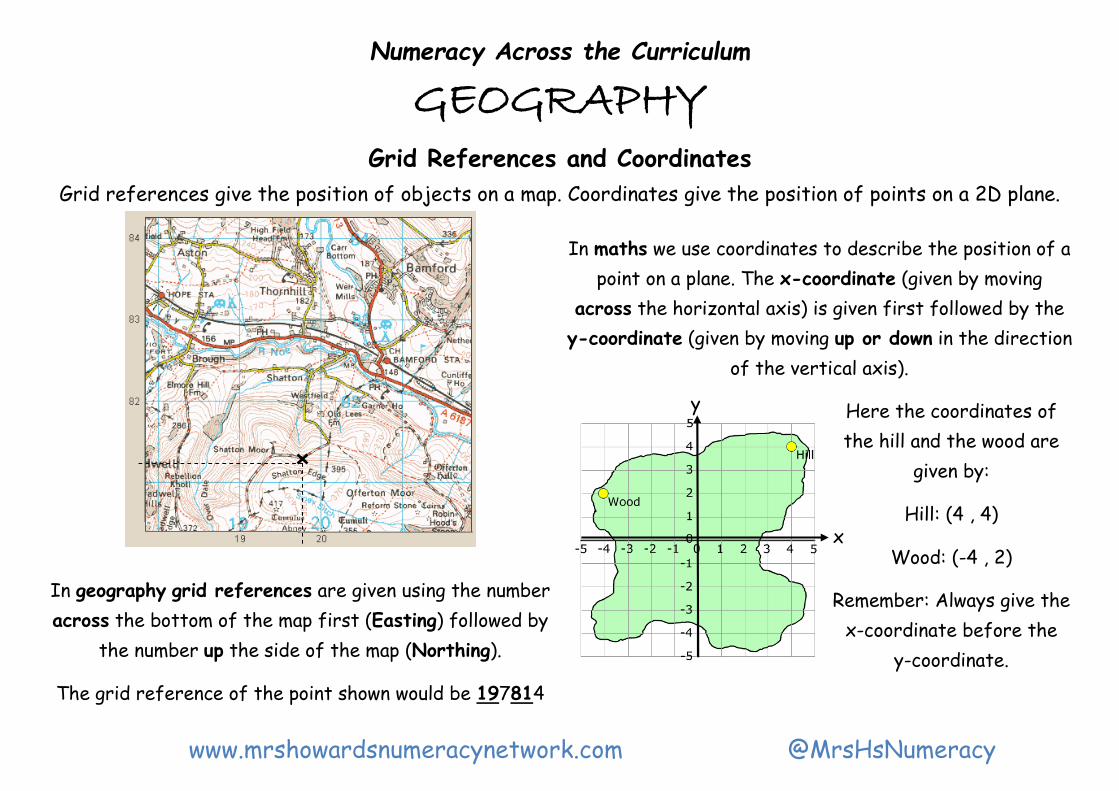
GEOGRAPHY Grid References and Coordinates
Grid references give the position of objects on a map. Coordinates give the position of points on a 2D plane.
In maths we use coordinates to describe the position of a
point on a plane. The x-coordinate (given by moving
across the horizontal axis) is given first followed by the
y-coordinate (given by moving up or down in the direction
of the vertical axis).
Here the coordinates of
the hill and the wood are
given by:
Hill: (4 , 4)
Wood: (-4 , 2)
Remember: Always give the
x-coordinate before the
y-coordinate.
In geography grid references are given using the number
across the bottom of the map first (Easting) followed by
the number up the side of the map (Northing).
The grid reference of the point shown would be 197814
x
y
www.mrshowardsnumeracynetwork.com @MrsHsNumeracy
Numeracy Across the Curriculum
GEOGRAPHY
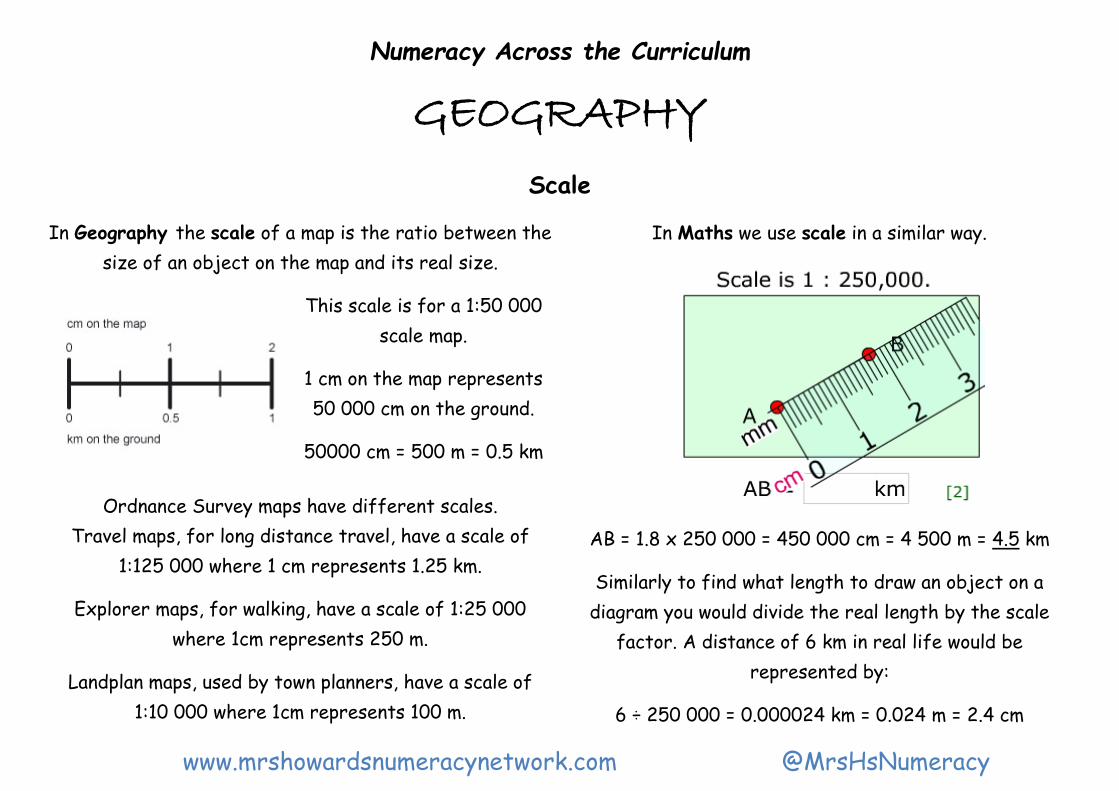
Scale
In Geography the scale of a map is the ratio between the
size of an object on the map and its real size. In Maths we use scale in a similar way.
The line AB measures 1.8cm.
Using the scale this converts to:
AB = 1.8 x 250 000 = 450 000 cm = 4 500 m = 4.5 km
Similarly to find what length to draw an object on a
diagram you would divide the real length by the scale
factor. A distance of 6 km in real life would be
represented by:
6 ÷ 250 000 = 0.000024 km = 0.024 m = 2.4 cm
This scale is for a 1:50 000
scale map.
1 cm on the map represents
50 000 cm on the ground.
50000 cm = 500 m = 0.5 km
Ordnance Survey maps have different scales.
Travel maps, for long distance travel, have a scale of
1:125 000 where 1 cm represents 1.25 km.
Explorer maps, for walking, have a scale of 1:25 000
where 1cm represents 250 m.
Landplan maps, used by town planners, have a scale of
1:10 000 where 1cm represents 100 m.
www.mrshowardsnumeracynetwork.com @MrsHsNumeracy
Numeracy Across the Curriculum
GEOGRAPHY
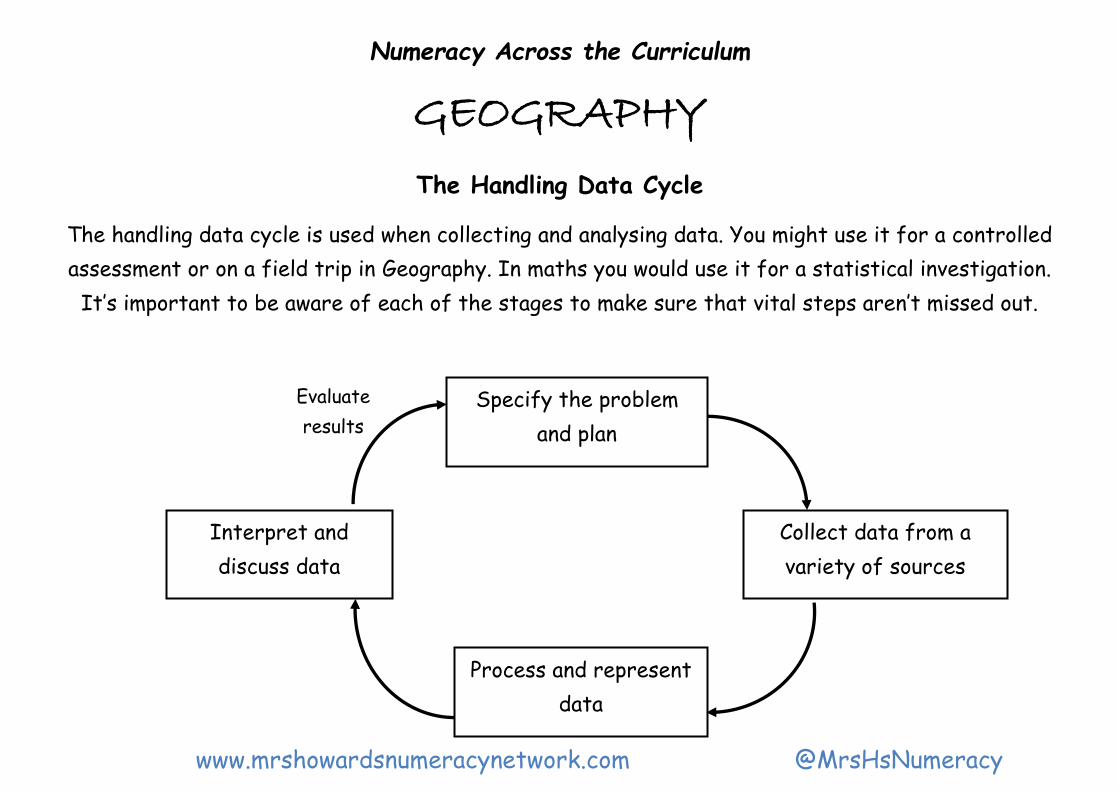
The Handling Data Cycle
The handling data cycle is used when collecting and analysing data. You might use it for a controlled
assessment or on a field trip in Geography. In maths you would use it for a statistical investigation.
It’s important to be aware of each of the stages to make sure that vital steps aren’t missed out.
Specify the problem
and plan
Collect data from a
variety of sources
Process and represent
data
Interpret and
discuss data
Evaluate
results
www.mrshowardsnumeracynetwork.com @MrsHsNumeracy
Numeracy Across the Curriculum
GEOGRAPHY
Representing Data
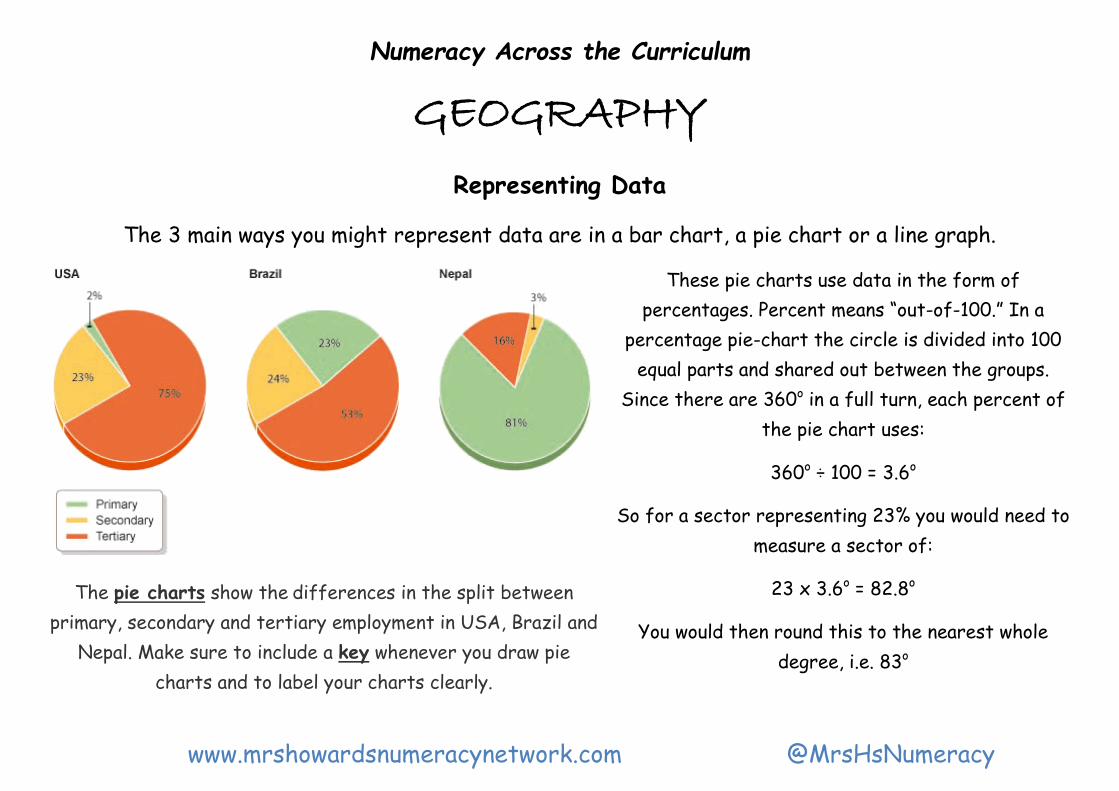
The 3 main ways you might represent data are in a bar chart, a pie chart or a line graph.
These pie charts use data in the form of
percentages. Percent means “out-of-100.” In a
percentage pie-chart the circle is divided into 100
equal parts and shared out between the groups.
Since there are 360o in a full turn, each percent of
the pie chart uses:
360o ÷ 100 = 3.6o
So for a sector representing 23% you would need to
measure a sector of:
23 x 3.6o = 82.8o
You would then round this to the nearest whole
degree, i.e. 83o
The pie charts show the differences in the split between
primary, secondary and tertiary employment in USA, Brazil and
Nepal. Make sure to include a key whenever you draw pie
charts and to label your charts clearly.
www.mrshowardsnumeracynetwork.com @MrsHsNumeracy
Numeracy Across the Curriculum
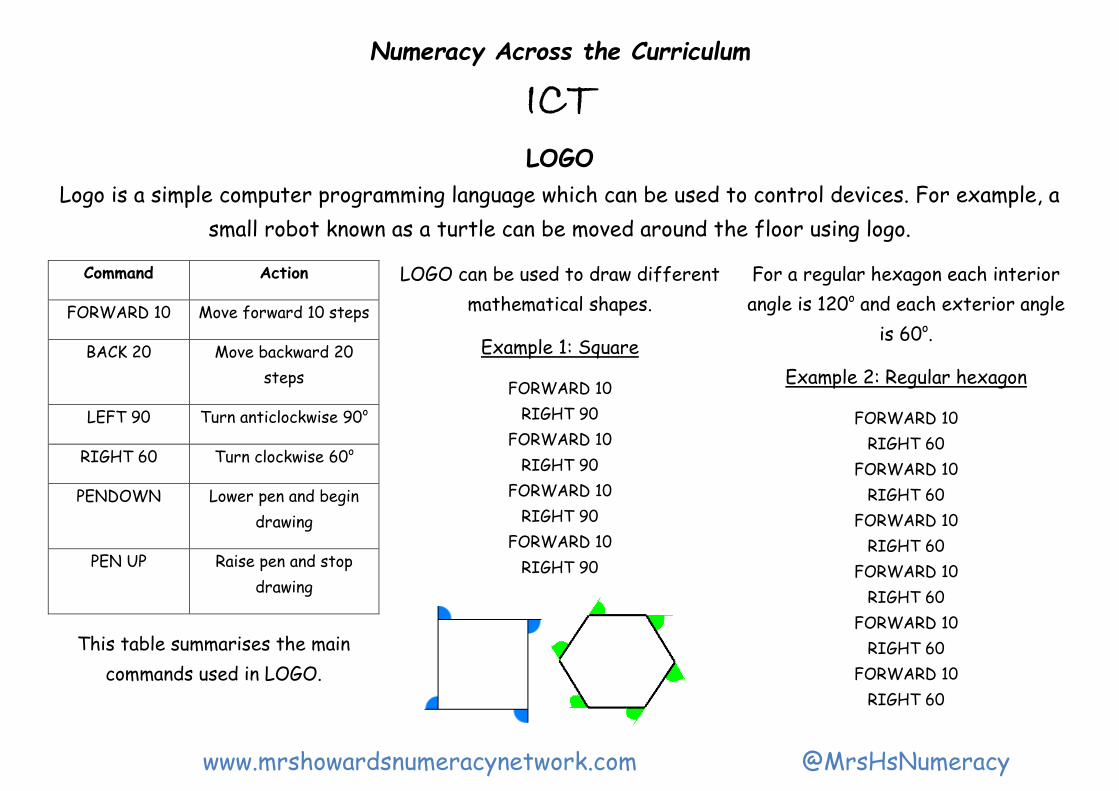
ICT LOGO
Logo is a simple computer programming language which can be used to control devices. For example, a
small robot known as a turtle can be moved around the floor using logo.
Command Action
FORWARD 10 Move forward 10 steps
BACK 20 Move backward 20
steps
LEFT 90 Turn anticlockwise 90o
RIGHT 60 Turn clockwise 60o
PENDOWN Lower pen and begin
drawing
PEN UP Raise pen and stop
drawing
LOGO can be used to draw different
mathematical shapes.
Example 1: Square
FORWARD 10
RIGHT 90
FORWARD 10
RIGHT 90
FORWARD 10
RIGHT 90
FORWARD 10
RIGHT 90
For a regular hexagon each interior
angle is 120o and each exterior angle
is 60o.
Example 2: Regular hexagon
FORWARD 10
RIGHT 60
FORWARD 10
RIGHT 60
FORWARD 10
RIGHT 60
FORWARD 10
RIGHT 60
FORWARD 10
RIGHT 60
FORWARD 10
RIGHT 60
This table summarises the main
commands used in LOGO.
www.mrshowardsnumeracynetwork.com @MrsHsNumeracy
Numeracy Across the Curriculum
ICT
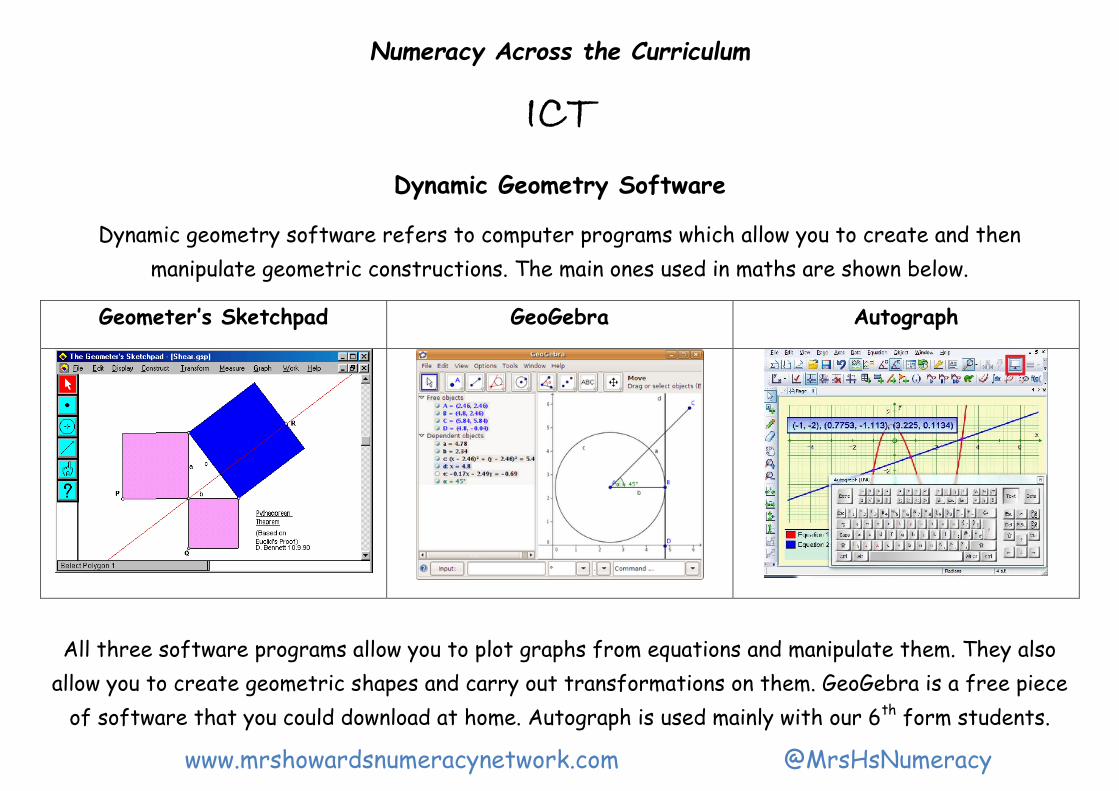
Dynamic Geometry Software
Dynamic geometry software refers to computer programs which allow you to create and then
manipulate geometric constructions. The main ones used in maths are shown below.
Geometer’s Sketchpad GeoGebra Autograph
All three software programs allow you to plot graphs from equations and manipulate them. They also
allow you to create geometric shapes and carry out transformations on them. GeoGebra is a free piece
of software that you could download at home. Autograph is used mainly with our 6th form students.
www.mrshowardsnumeracynetwork.com @MrsHsNumeracy
Numeracy Across the Curriculum
ICT
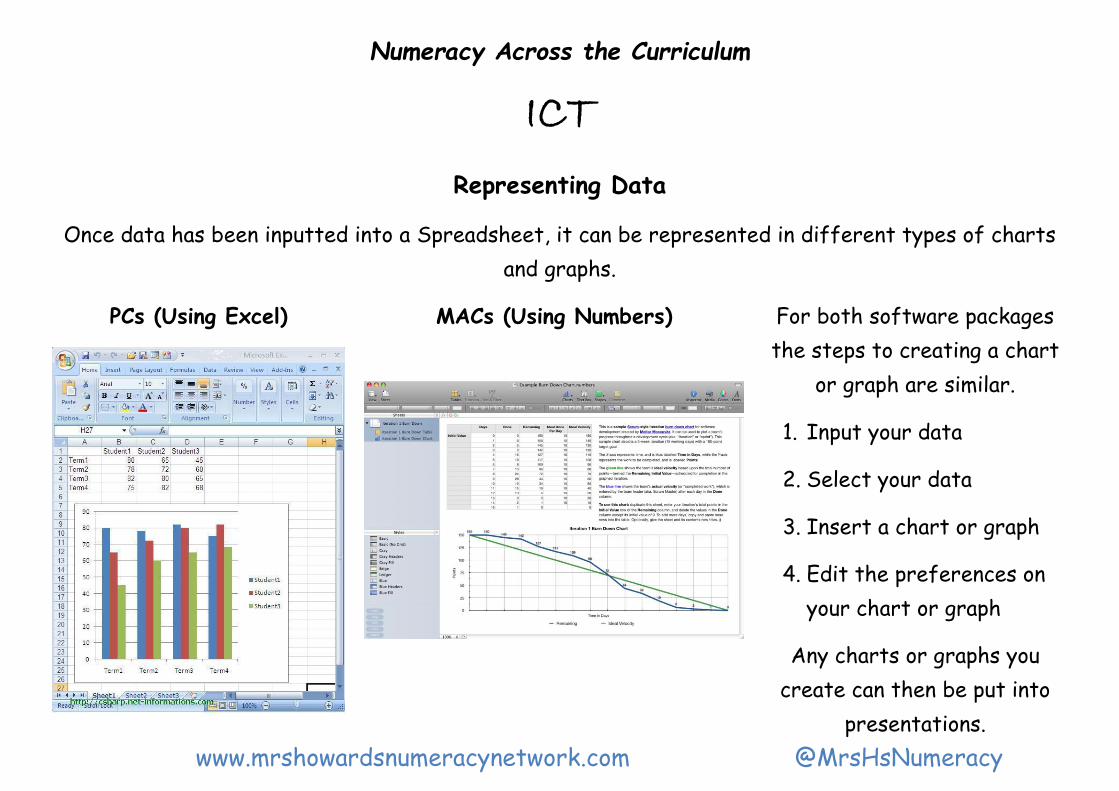
Representing Data
Once data has been inputted into a Spreadsheet, it can be represented in different types of charts
and graphs.
PCs (Using Excel) MACs (Using Numbers) For both software packages
the steps to creating a chart
or graph are similar.
1. Input your data
2. Select your data
3. Insert a chart or graph
4. Edit the preferences on
your chart or graph
Any charts or graphs you
create can then be put into
presentations.
www.mrshowardsnumeracynetwork.com @MrsHsNumeracy
Numeracy Across the Curriculum
ICT
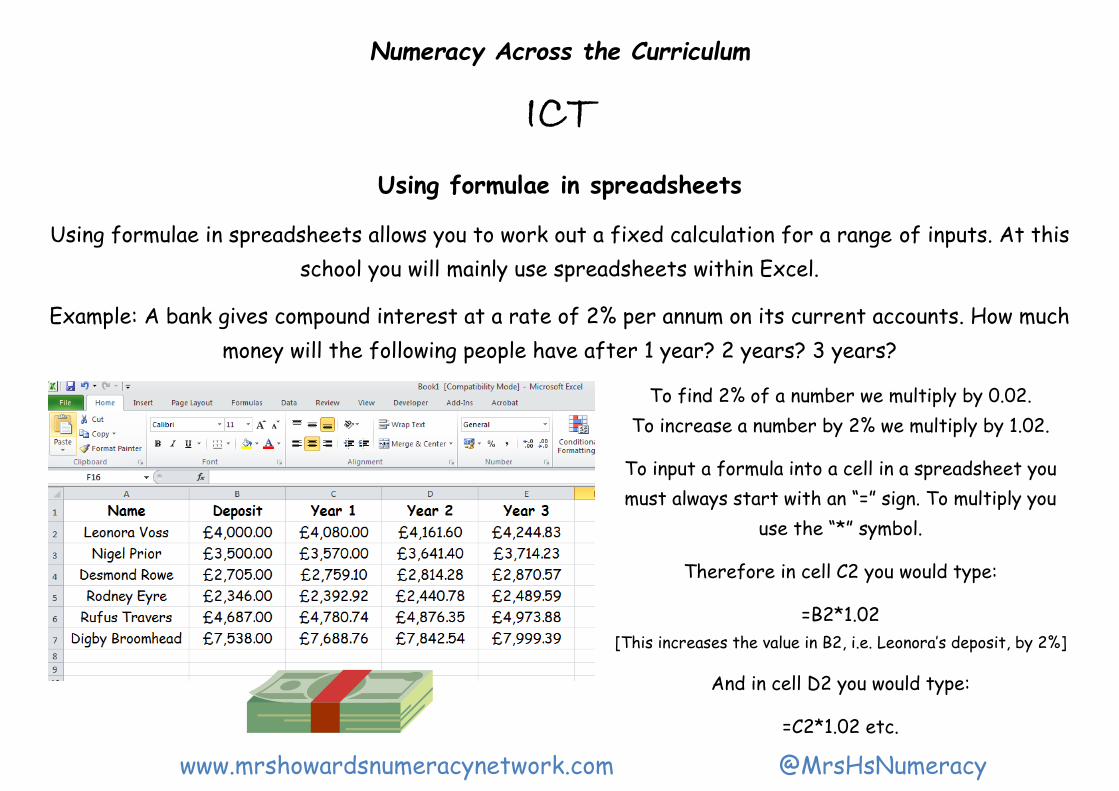
Using formulae in spreadsheets
Using formulae in spreadsheets allows you to work out a fixed calculation for a range of inputs. At this
school you will mainly use spreadsheets within Excel.
Example: A bank gives compound interest at a rate of 2% per annum on its current accounts. How much
money will the following people have after 1 year? 2 years? 3 years?
To find 2% of a number we multiply by 0.02.
To increase a number by 2% we multiply by 1.02.
To input a formula into a cell in a spreadsheet you
must always start with an “=” sign. To multiply you
use the “*” symbol.
Therefore in cell C2 you would type:
=B2*1.02
[This increases the value in B2, i.e. Leonora’s deposit, by 2%]
And in cell D2 you would type:
=C2*1.02 etc.
www.mrshowardsnumeracynetwork.com @MrsHsNumeracy
Numeracy Across the Curriculum
MFL
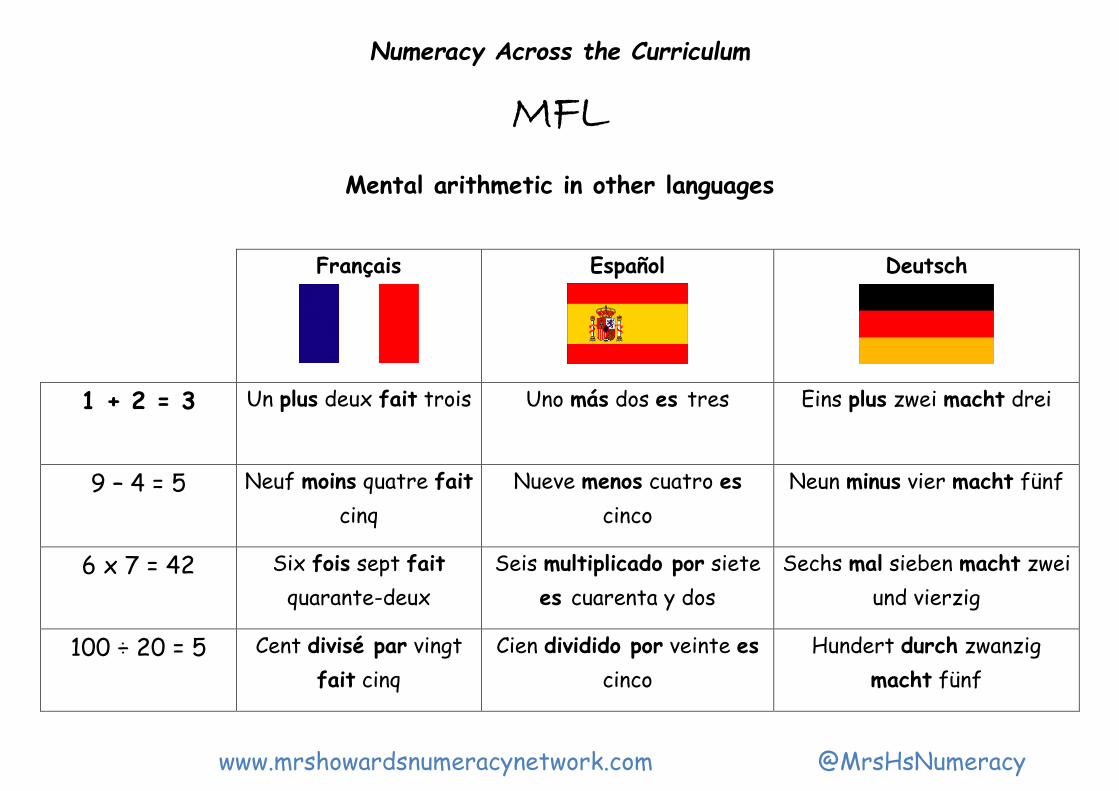
Mental arithmetic in other languages
Français
Español
Deutsch
1 + 2 = 3 Un plus deux fait trois
Uno más dos es tres Eins plus zwei macht drei
9 – 4 = 5 Neuf moins quatre fait
cinq
Nueve menos cuatro es
cinco
Neun minus vier macht fünf
6 x 7 = 42 Six fois sept fait
quarante-deux
Seis multiplicado por siete
es cuarenta y dos
Sechs mal sieben macht zwei
und vierzig
100 ÷ 20 = 5 Cent divisé par vingt
fait cinq
Cien dividido por veinte es
cinco
Hundert durch zwanzig
macht fünf
www.mrshowardsnumeracynetwork.com @MrsHsNumeracy
Numeracy Across the Curriculum
MUSIC
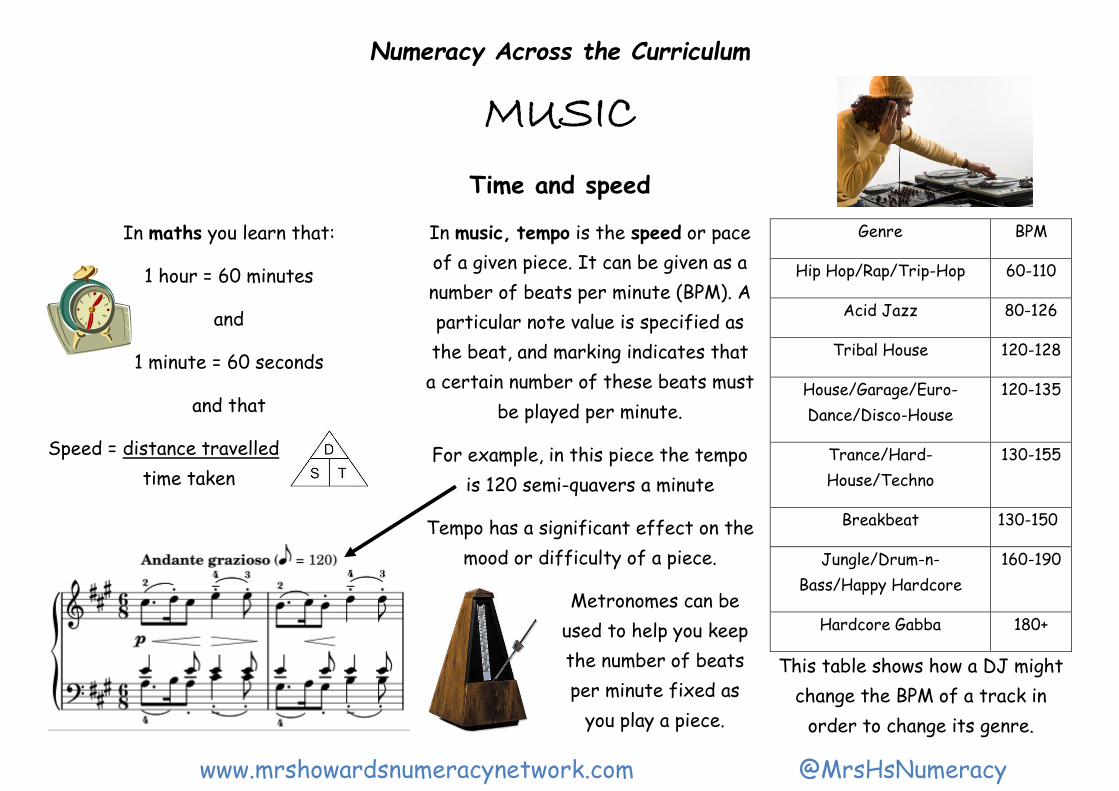
Time and speed
In maths you learn that:
1 hour = 60 minutes
and
1 minute = 60 seconds
and that
Speed = distance travelled
time taken
In music, tempo is the speed or pace
of a given piece. It can be given as a
number of beats per minute (BPM). A
particular note value is specified as
the beat, and marking indicates that
a certain number of these beats must
be played per minute.
For example, in this piece the tempo
is 120 semi-quavers a minute
Tempo has a significant effect on the
mood or difficulty of a piece.
Genre BPM
Hip Hop/Rap/Trip-Hop 60-110
Acid Jazz 80-126
Tribal House 120-128
House/Garage/Euro-
Dance/Disco-House
120-135
Trance/Hard-
House/Techno
130-155
Breakbeat 130-150
Jungle/Drum-n-
Bass/Happy Hardcore
160-190
Hardcore Gabba 180+
Metronomes can be
used to help you keep
the number of beats
per minute fixed as
you play a piece.
This table shows how a DJ might
change the BPM of a track in
order to change its genre.
www.mrshowardsnumeracynetwork.com @MrsHsNumeracy
Numeracy Across the Curriculum
MUSIC
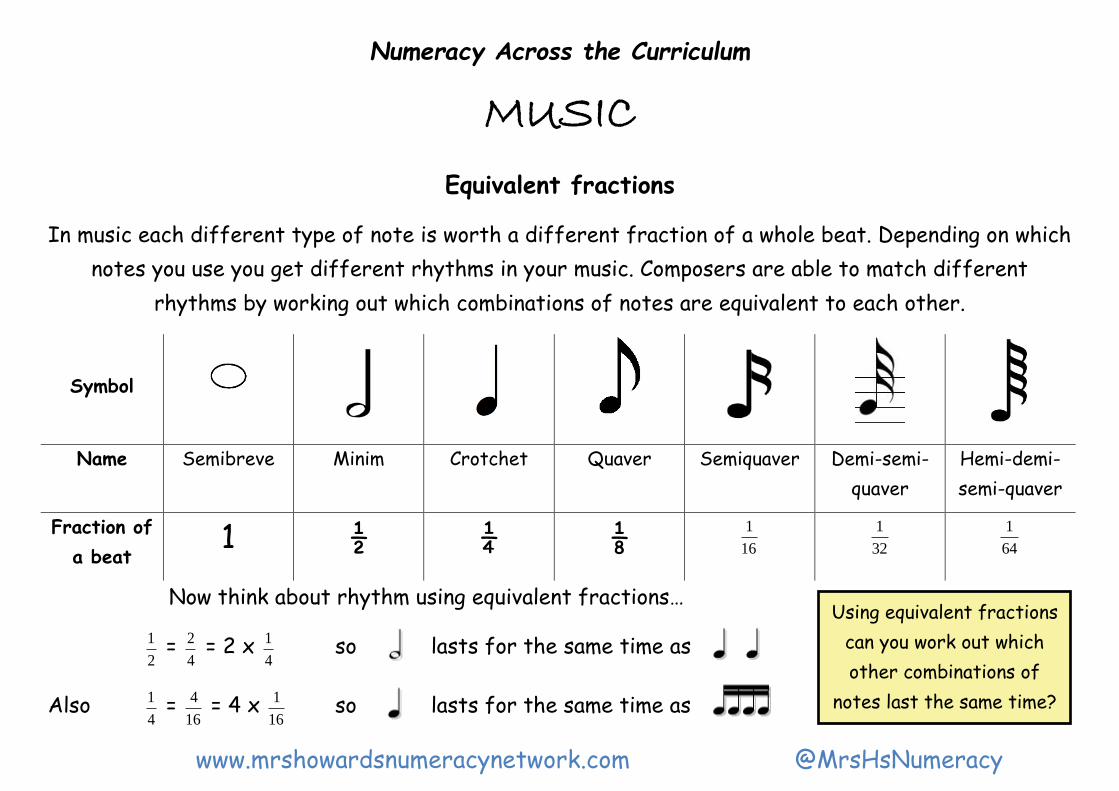
Equivalent fractions
In music each different type of note is worth a different fraction of a whole beat. Depending on which
notes you use you get different rhythms in your music. Composers are able to match different
rhythms by working out which combinations of notes are equivalent to each other.
Symbol
Name Semibreve Minim Crotchet Quaver Semiquaver Demi-semi-
quaver
Hemi-demi-
semi-quaver
Fraction of
a beat 1 ½ ¼ ⅛ 16
1 32
1 64
1
Now think about rhythm using equivalent fractions…
2
1 = 4
2 = 2 x 4
1 so lasts for the same time as
Also 4
1 = 16
4 = 4 x 16
1 so lasts for the same time as
Using equivalent fractions
can you work out which
other combinations of
notes last the same time?
www.mrshowardsnumeracynetwork.com @MrsHsNumeracy
Numeracy Across the Curriculum
HISTORY
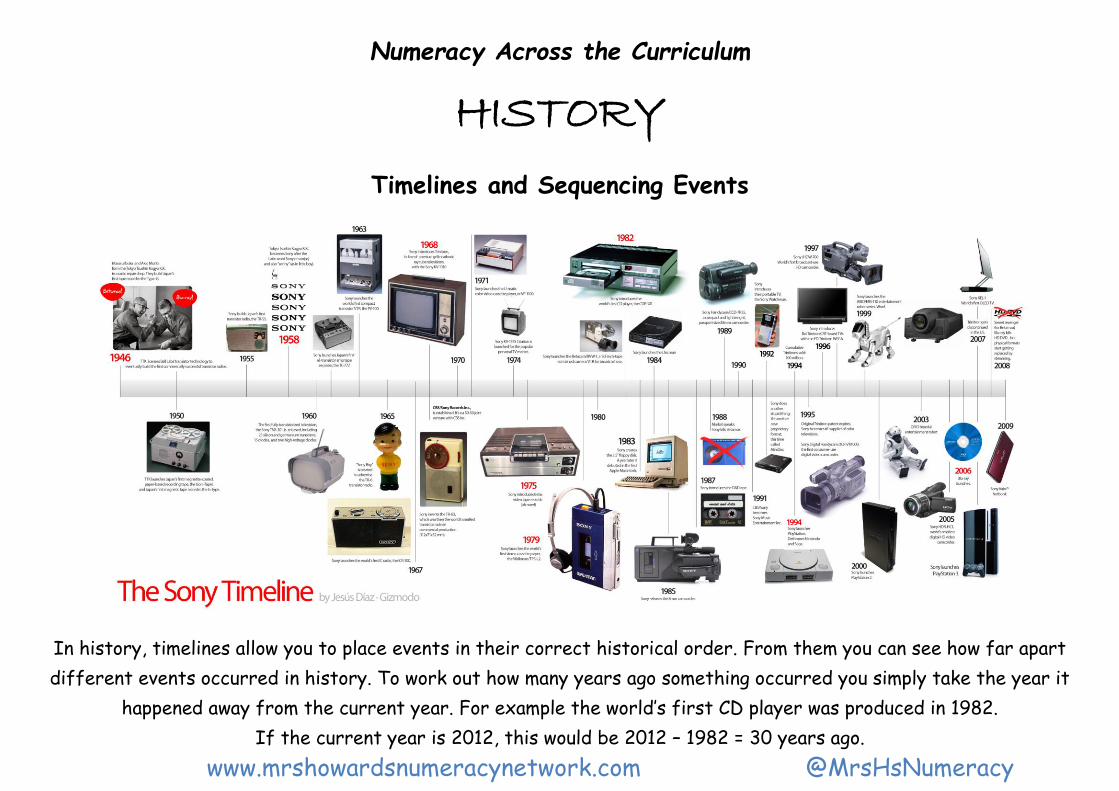
Timelines and Sequencing Events
In history, timelines allow you to place events in their correct historical order. From them you can see how far apart
different events occurred in history. To work out how many years ago something occurred you simply take the year it
happened away from the current year. For example the world’s first CD player was produced in 1982.
If the current year is 2012, this would be 2012 – 1982 = 30 years ago.
www.mrshowardsnumeracynetwork.com @MrsHsNumeracy
Numeracy Across the Curriculum
HISTORY
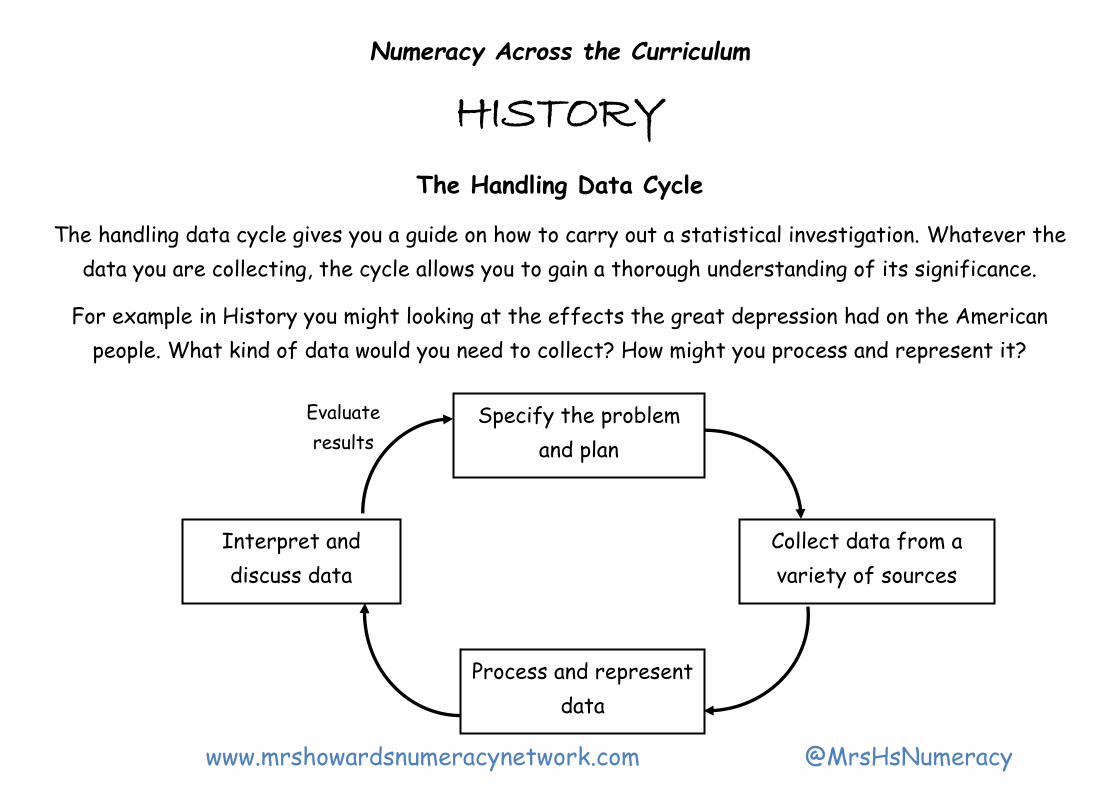
The Handling Data Cycle
The handling data cycle gives you a guide on how to carry out a statistical investigation. Whatever the
data you are collecting, the cycle allows you to gain a thorough understanding of its significance.
For example in History you might looking at the effects the great depression had on the American
people. What kind of data would you need to collect? How might you process and represent it?
Specify the problem
and plan
Collect data from a
variety of sources
Process and represent
data
Interpret and
discuss data
Evaluate
results
www.mrshowardsnumeracynetwork.com @MrsHsNumeracy
Numeracy Across the Curriculum
HISTORY
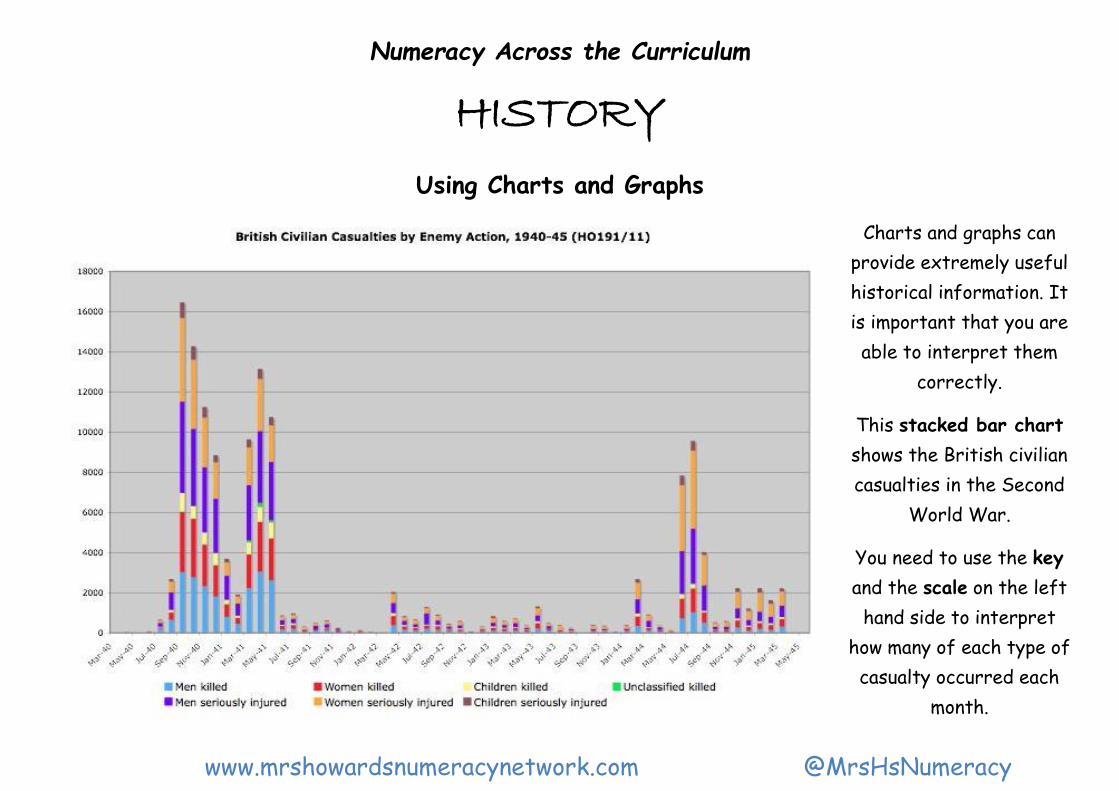
Using Charts and Graphs
Charts and graphs can
provide extremely useful
historical information. It
is important that you are
able to interpret them
correctly.
This stacked bar chart
shows the British civilian
casualties in the Second
World War.
You need to use the key
and the scale on the left
hand side to interpret
how many of each type of
casualty occurred each
month.
www.mrshowardsnumeracynetwork.com @MrsHsNumeracy
Numeracy Across the Curriculum
Physical Education
Time, Distance and Speed
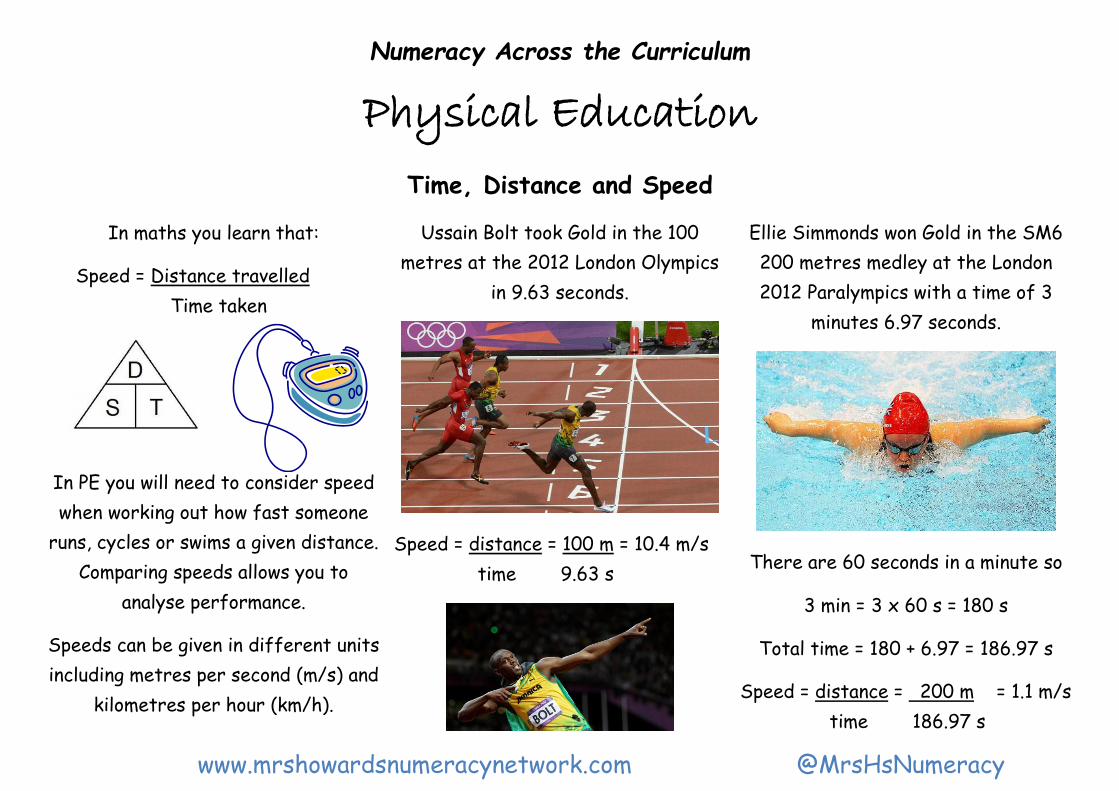
In maths you learn that:
Speed = Distance travelled
Time taken
In PE you will need to consider speed
when working out how fast someone
runs, cycles or swims a given distance.
Comparing speeds allows you to
analyse performance.
Speeds can be given in different units
including metres per second (m/s) and
kilometres per hour (km/h).
Ussain Bolt took Gold in the 100
metres at the 2012 London Olympics
in 9.63 seconds.
Speed = distance = 100 m = 10.4 m/s
time 9.63 s
Ellie Simmonds won Gold in the SM6
200 metres medley at the London
2012 Paralympics with a time of 3
minutes 6.97 seconds.
There are 60 seconds in a minute so
3 min = 3 x 60 s = 180 s
Total time = 180 + 6.97 = 186.97 s
Speed = distance = 200 m = 1.1 m/s
time 186.97 s
www.mrshowardsnumeracynetwork.com @MrsHsNumeracy
Numeracy Across the Curriculum
Physical Education
Collecting and Analysing Data
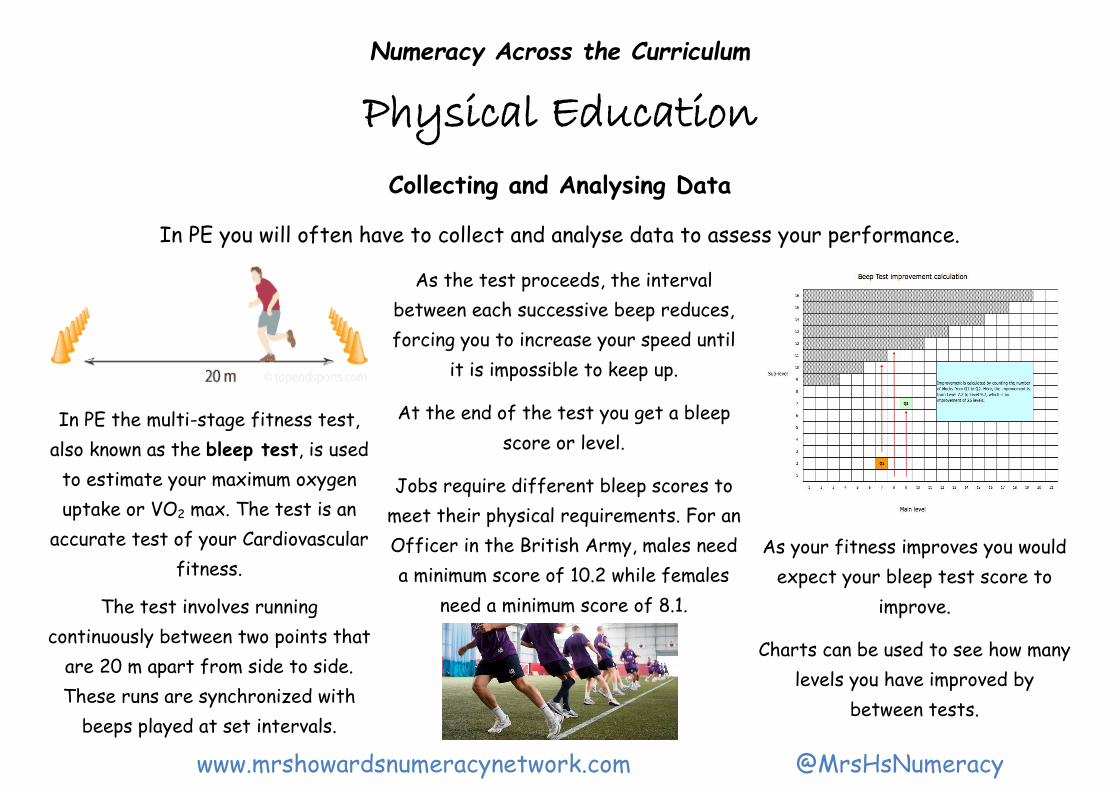
In PE you will often have to collect and analyse data to assess your performance.
In PE the multi-stage fitness test,
also known as the bleep test, is used
to estimate your maximum oxygen
uptake or VO2 max. The test is an
accurate test of your Cardiovascular
fitness.
The test involves running
continuously between two points that
are 20 m apart from side to side.
These runs are synchronized with
beeps played at set intervals.
As the test proceeds, the interval
between each successive beep reduces,
forcing you to increase your speed until
it is impossible to keep up.
At the end of the test you get a bleep
score or level.
Jobs require different bleep scores to
meet their physical requirements. For an
Officer in the British Army, males need
a minimum score of 10.2 while females
need a minimum score of 8.1.
As your fitness improves you would
expect your bleep test score to
improve.
Charts can be used to see how many
levels you have improved by
between tests.
www.mrshowardsnumeracynetwork.com @MrsHsNumeracy
Numeracy Across the Curriculum
Physical Education Map References and Bearings
Physical Education isn’t just limited to what you do in PE lessons. At school you have the opportunity to
participate in the Duke of Edinburgh Award Scheme which gives you the chance to go on expeditions
where you will need to plan your own route using maps. Map reading links strongly with your maths
lessons involving work on coordinates and bearings.
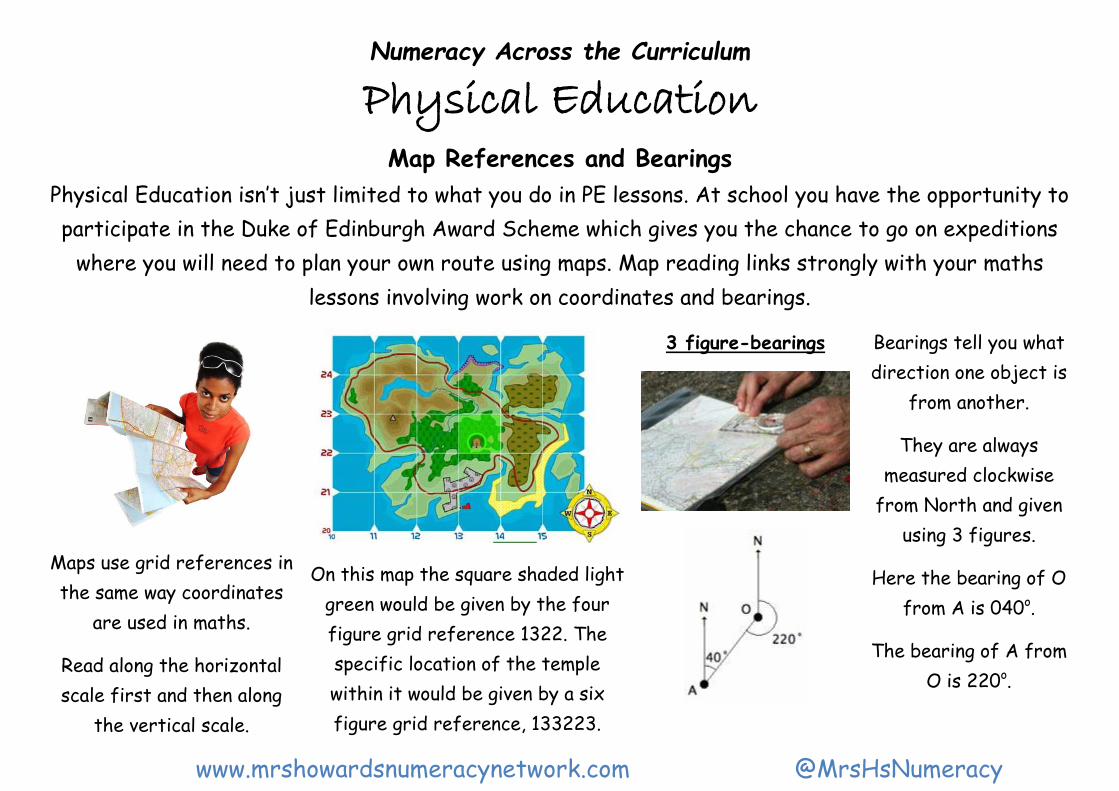
Maps use grid references in
the same way coordinates
are used in maths.
Read along the horizontal
scale first and then along
the vertical scale.
On this map the square shaded light
green would be given by the four
figure grid reference 1322. The
specific location of the temple
within it would be given by a six
figure grid reference, 133223.
3 figure-bearings
Bearings tell you what
direction one object is
from another.
They are always
measured clockwise
from North and given
using 3 figures.
Here the bearing of O
from A is 040o.
The bearing of A from
O is 220o.
www.mrshowardsnumeracynetwork.com @MrsHsNumeracy
Numeracy Across the Curriculum
Physical Education Using Averages - Mean, Mode and Median
An athlete’s performance will vary from event to event depending on their level of fitness at the time and the
conditions they are competing in. It is useful to measure performance on different occasions and use an “average”
measurement to give a more balanced indication of their overall performance.
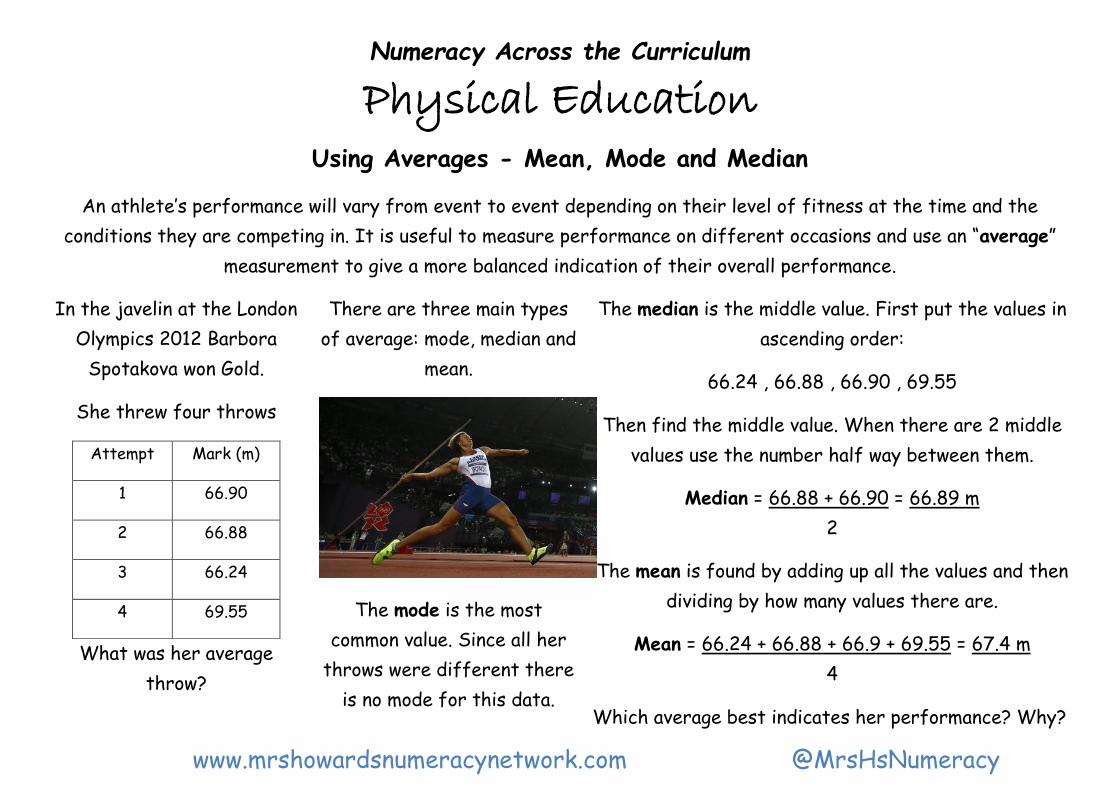
In the javelin at the London
Olympics 2012 Barbora
Spotakova won Gold.
She threw four throws
Attempt Mark (m)
1 66.90
2 66.88
3 66.24
4 69.55
There are three main types
of average: mode, median and
mean.
The mode is the most
common value. Since all her
throws were different there
is no mode for this data.
The median is the middle value. First put the values in
ascending order:
66.24 , 66.88 , 66.90 , 69.55
Then find the middle value. When there are 2 middle
values use the number half way between them.
Median = 66.88 + 66.90 = 66.89 m
2
The mean is found by adding up all the values and then
dividing by how many values there are.
Mean = 66.24 + 66.88 + 66.9 + 69.55 = 67.4 m
4
Which average best indicates her performance? Why?
What was her average
throw?
www.mrshowardsnumeracynetwork.com @MrsHsNumeracy
Numeracy Across the Curriculum
PSHE, RELIGIOUS EDUCATION & CITIZENSHIP
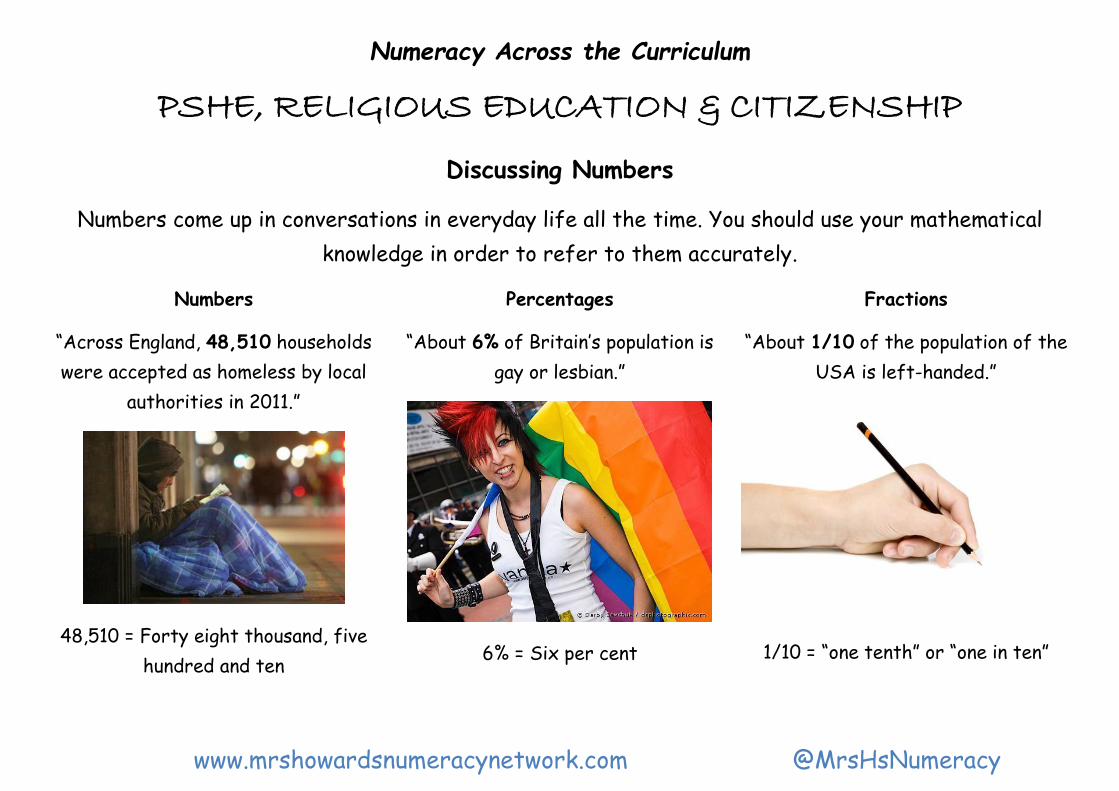
Discussing Numbers
Numbers come up in conversations in everyday life all the time. You should use your mathematical
knowledge in order to refer to them accurately.
Numbers Percentages Fractions
“Across England, 48,510 households
were accepted as homeless by local
authorities in 2011.”
48,510 = Forty eight thousand, five
hundred and ten
“About 6% of Britain’s population is
gay or lesbian.”
6% = Six per cent
“About 1/10 of the population of the
USA is left-handed.”
1/10 = “one tenth” or “one in ten”
www.mrshowardsnumeracynetwork.com @MrsHsNumeracy
Numeracy Across the Curriculum
PSHE, RELIGIOUS EDUCATION & CITIZENSHIP
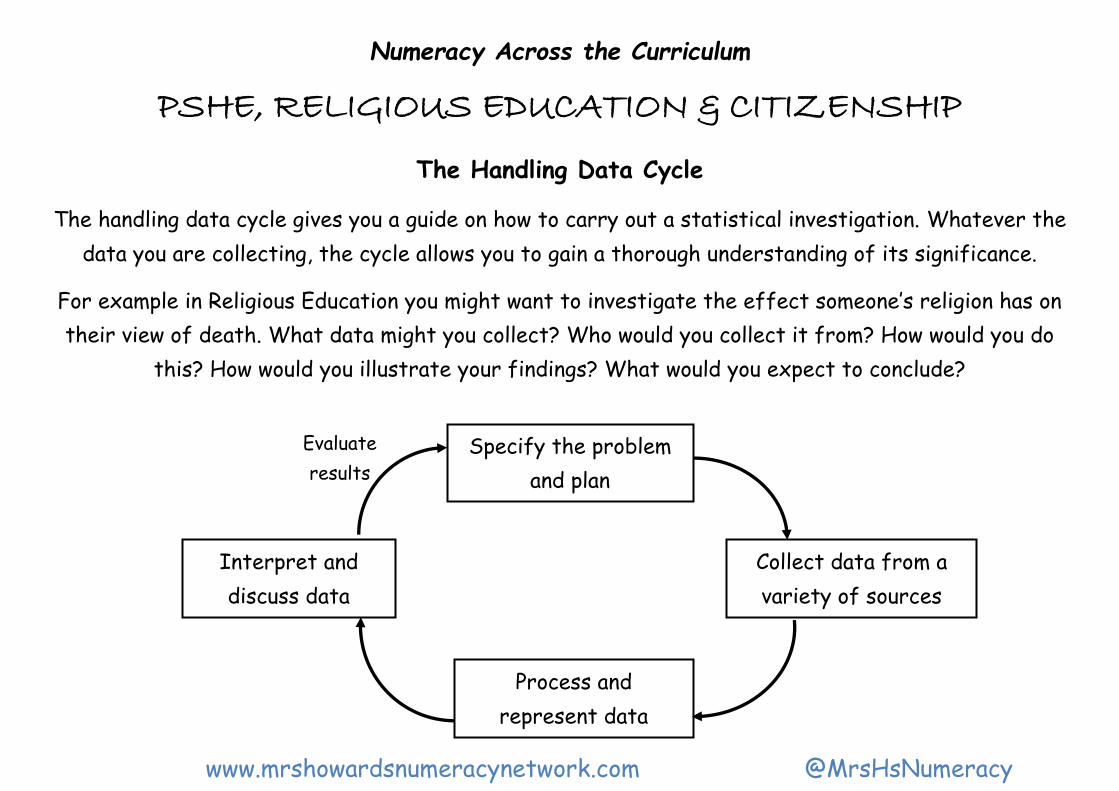
The Handling Data Cycle
The handling data cycle gives you a guide on how to carry out a statistical investigation. Whatever the
data you are collecting, the cycle allows you to gain a thorough understanding of its significance.
For example in Religious Education you might want to investigate the effect someone’s religion has on
their view of death. What data might you collect? Who would you collect it from? How would you do
this? How would you illustrate your findings? What would you expect to conclude?
Specify the problem
and plan
Collect data from a
variety of sources
Process and
represent data
Interpret and
discuss data
Evaluate
results
www.mrshowardsnumeracynetwork.com @MrsHsNumeracy
Numeracy Across the Curriculum
PSHE, RELIGIOUS EDUCATION & CITIZENSHIP
Mathematics in Other Cultures
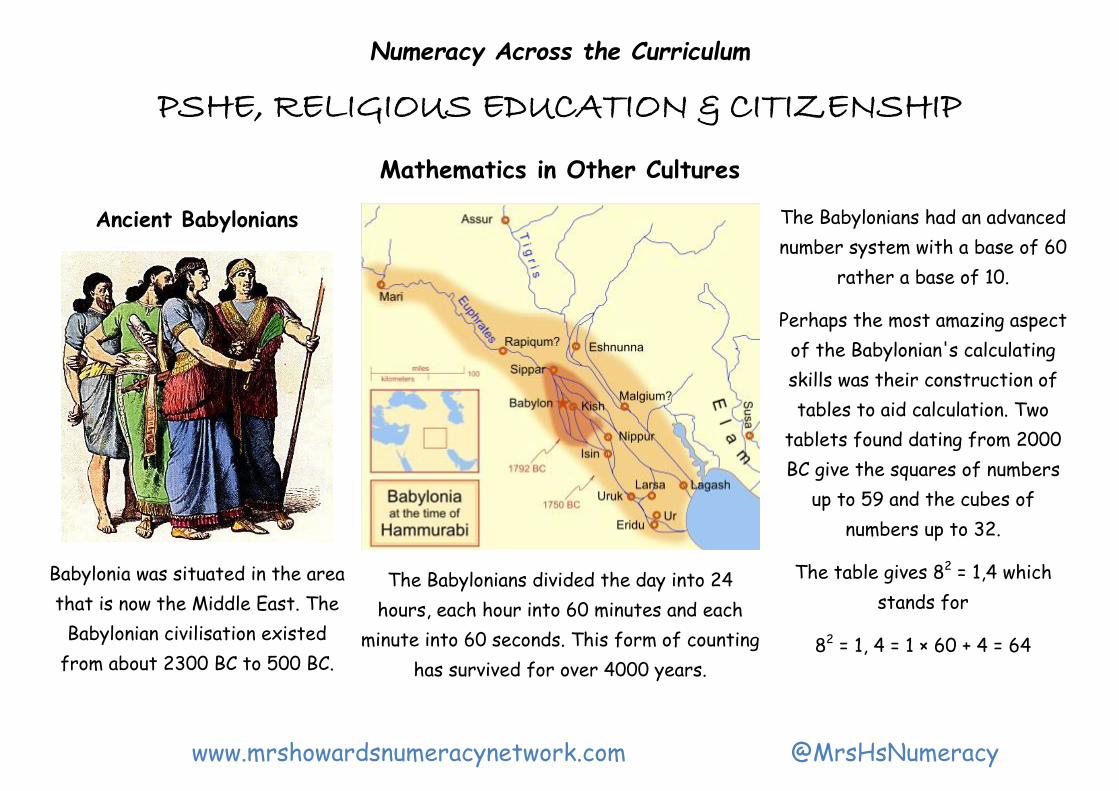
Ancient Babylonians
Babylonia was situated in the area
that is now the Middle East. The
Babylonian civilisation existed
from about 2300 BC to 500 BC.
The Babylonians divided the day into 24
hours, each hour into 60 minutes and each
minute into 60 seconds. This form of counting
has survived for over 4000 years.
The Babylonians had an advanced
number system with a base of 60
rather a base of 10.
Perhaps the most amazing aspect
of the Babylonian's calculating
skills was their construction of
tables to aid calculation. Two
tablets found dating from 2000
BC give the squares of numbers
up to 59 and the cubes of
numbers up to 32.
The table gives 82 = 1,4 which
stands for
82 = 1, 4 = 1 × 60 + 4 = 64
www.mrshowardsnumeracynetwork.com @MrsHsNumeracy
Numeracy Across the Curriculum
PSHE, RELIGIOUS EDUCATION & CITIZENSHIP
Mathematics in Other Cultures
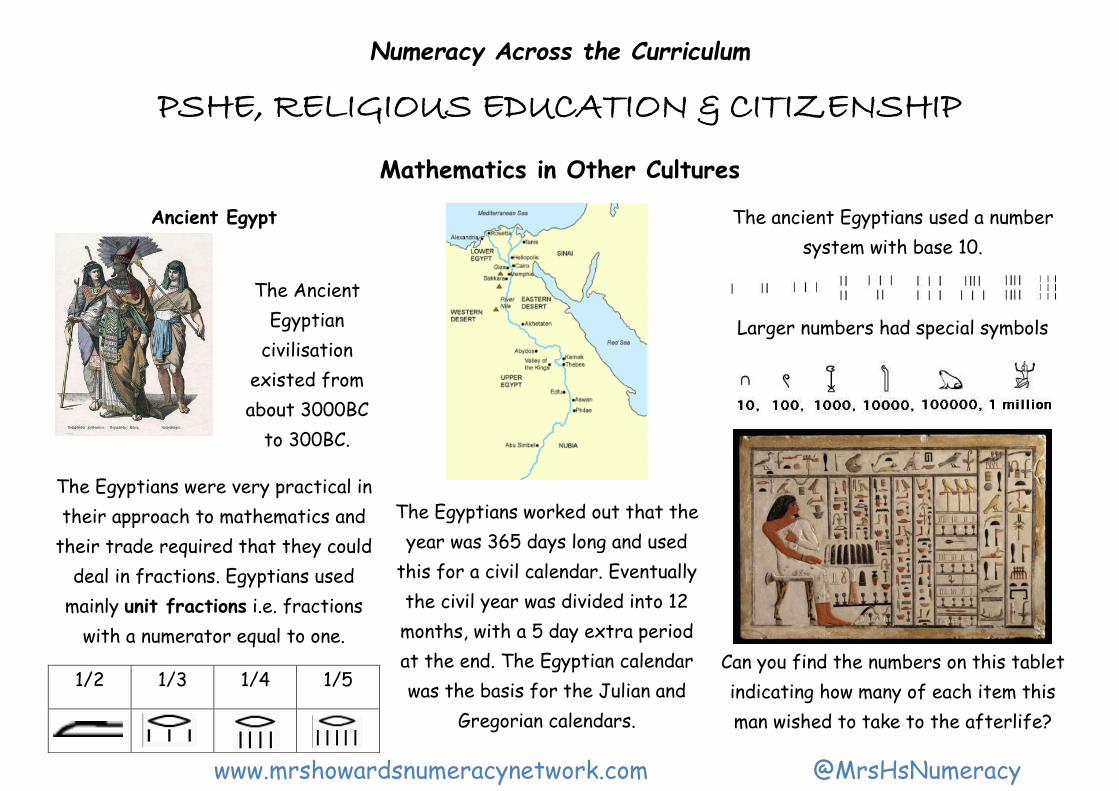
Ancient Egypt
The Egyptians worked out that the
year was 365 days long and used
this for a civil calendar. Eventually
the civil year was divided into 12
months, with a 5 day extra period
at the end. The Egyptian calendar
was the basis for the Julian and
Gregorian calendars.
The ancient Egyptians used a number
system with base 10.
Larger numbers had special symbols
Can you find the numbers on this tablet
indicating how many of each item this
man wished to take to the afterlife?
The Ancient
Egyptian
civilisation
existed from
about 3000BC
to 300BC.
The Egyptians were very practical in
their approach to mathematics and
their trade required that they could
deal in fractions. Egyptians used
mainly unit fractions i.e. fractions
with a numerator equal to one.
1/2 1/3 1/4 1/5
www.mrshowardsnumeracynetwork.com @MrsHsNumeracy
Numeracy Across the Curriculum
PSHE, RELIGIOUS EDUCATION & CITIZENSHIP
Probability, Risk and Chance
What’s the chance of you becoming infected with HIV? What’s the risk of a baby being stillborn? How likely is it that
you will live longer than your parents do? All these questions are connected with probability.
Probability can be discussed in different ways. Sometimes
you simply use words such as “likely”, “impossible” or
“certain” making sure to back up your opinions with
evidence.
You can give a more objective viewpoint if your
probabilities are backed up by numbers.
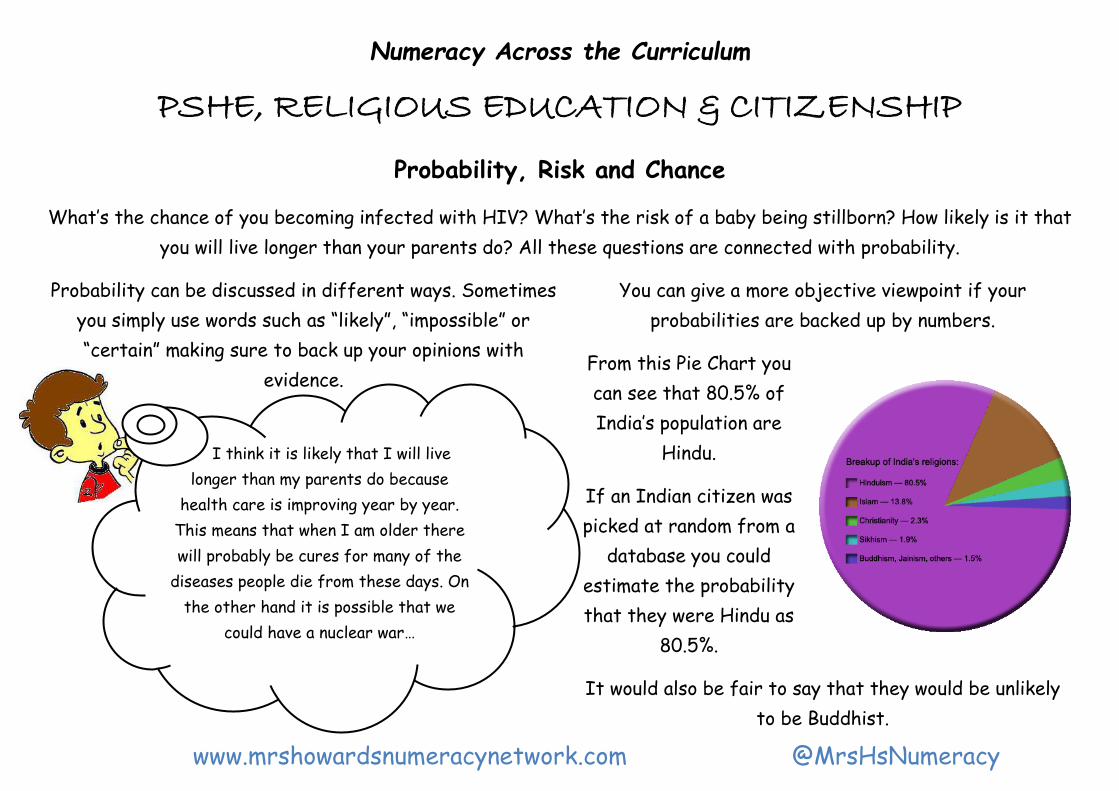
From this Pie Chart you
can see that 80.5% of
India’s population are
Hindu.
If an Indian citizen was
picked at random from a
database you could
estimate the probability
that they were Hindu as
80.5%.
It would also be fair to say that they would be unlikely
to be Buddhist.
I think it is likely that I will live
longer than my parents do because
health care is improving year by year.
This means that when I am older there
will probably be cures for many of the
diseases people die from these days. On
the other hand it is possible that we
could have a nuclear war…
www.mrshowardsnumeracynetwork.com @MrsHsNumeracy
Numeracy Across the Curriculum
PSHE, RELIGIOUS EDUCATION & CITIZENSHIP
Interpreting Charts and Graphs
Being able to interpret and discuss the information in charts and graphs is an important skill. Many
organisations use charts and graphs to illustrate issues that are relevant to their work.
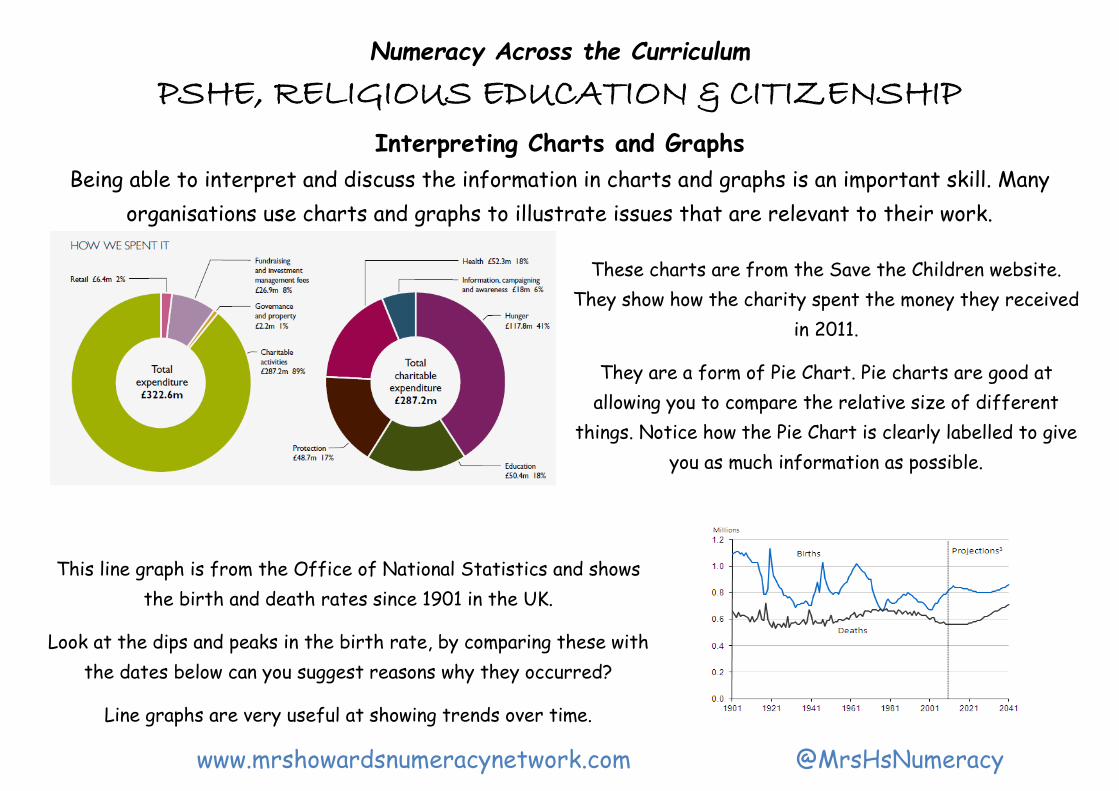
These charts are from the Save the Children website.
They show how the charity spent the money they received
in 2011.
They are a form of Pie Chart. Pie charts are good at
allowing you to compare the relative size of different
things. Notice how the Pie Chart is clearly labelled to give
you as much information as possible.
This line graph is from the Office of National Statistics and shows
the birth and death rates since 1901 in the UK.
Look at the dips and peaks in the birth rate, by comparing these with
the dates below can you suggest reasons why they occurred?
Line graphs are very useful at showing trends over time.
www.mrshowardsnumeracynetwork.com @MrsHsNumeracy
Numeracy Across the Curriculum
SCIENCE
Substituting into Formulae
In both your maths and science lessons you will be expected to substitute into formulae. In formulae
different variables are represented by letters.
Substitution simply means putting numbers where the letters are to work something out.
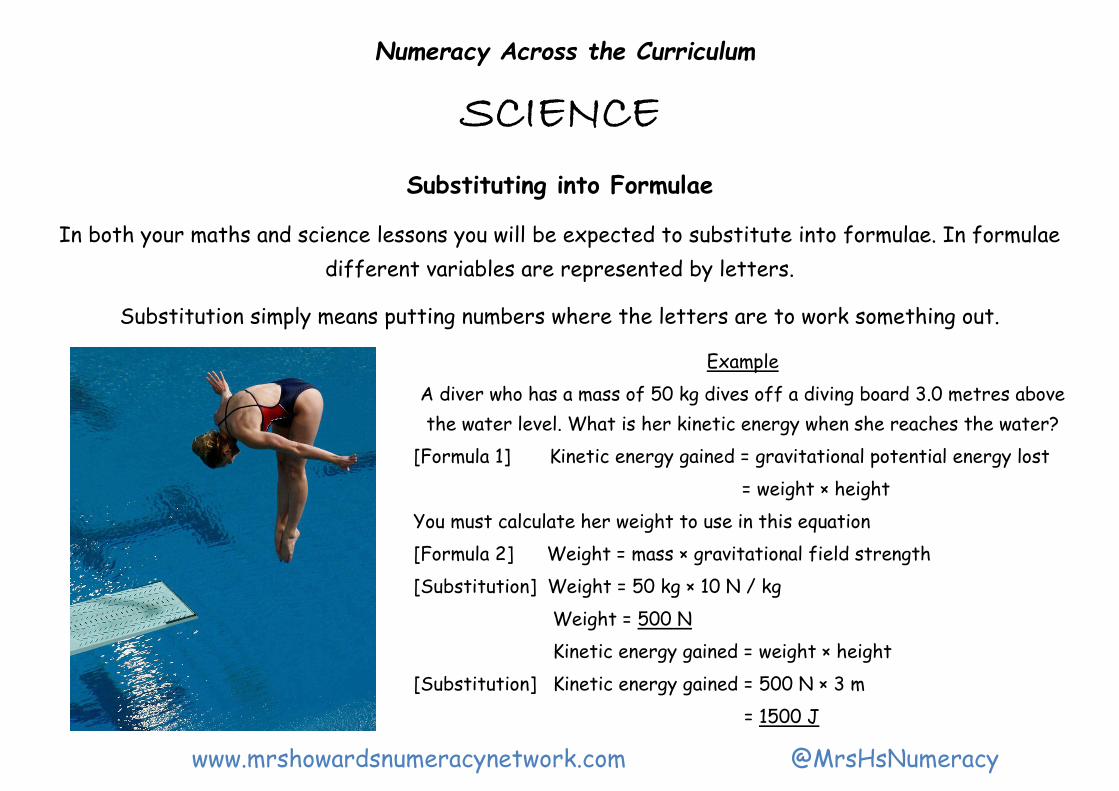
Example
A diver who has a mass of 50 kg dives off a diving board 3.0 metres above
the water level. What is her kinetic energy when she reaches the water?
[Formula 1] Kinetic energy gained = gravitational potential energy lost
= weight × height
You must calculate her weight to use in this equation
[Formula 2] Weight = mass × gravitational field strength
[Substitution] Weight = 50 kg × 10 N / kg
Weight = 500 N
Kinetic energy gained = weight × height
[Substitution] Kinetic energy gained = 500 N × 3 m
= 1500 J
www.mrshowardsnumeracynetwork.com @MrsHsNumeracy
Numeracy Across the Curriculum
SCIENCE Continuous and Discrete Data
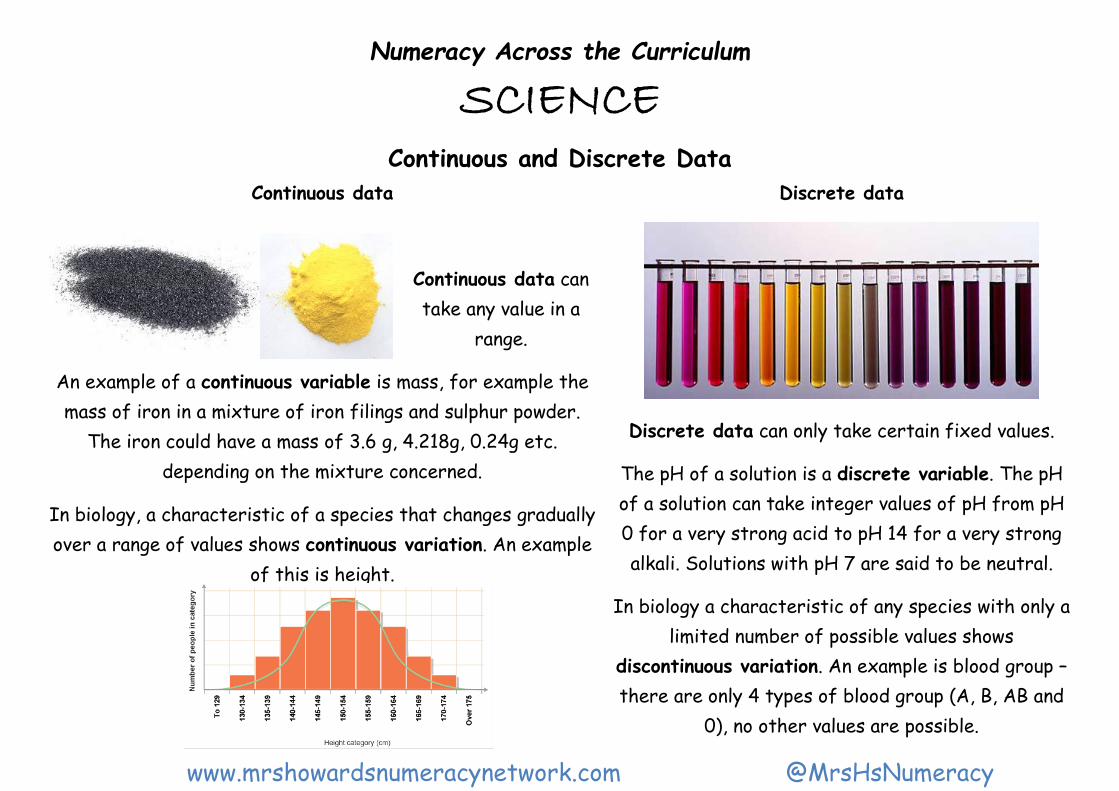
Continuous data Discrete data
Continuous data can
take any value in a
range.
An example of a continuous variable is mass, for example the
mass of iron in a mixture of iron filings and sulphur powder.
The iron could have a mass of 3.6 g, 4.218g, 0.24g etc.
depending on the mixture concerned.
In biology, a characteristic of a species that changes gradually
over a range of values shows continuous variation. An example
of this is height.
Discrete data can only take certain fixed values.
The pH of a solution is a discrete variable. The pH
of a solution can take integer values of pH from pH
0 for a very strong acid to pH 14 for a very strong
alkali. Solutions with pH 7 are said to be neutral.
In biology a characteristic of any species with only a
limited number of possible values shows
discontinuous variation. An example is blood group –
there are only 4 types of blood group (A, B, AB and
0), no other values are possible.
www.mrshowardsnumeracynetwork.com @MrsHsNumeracy
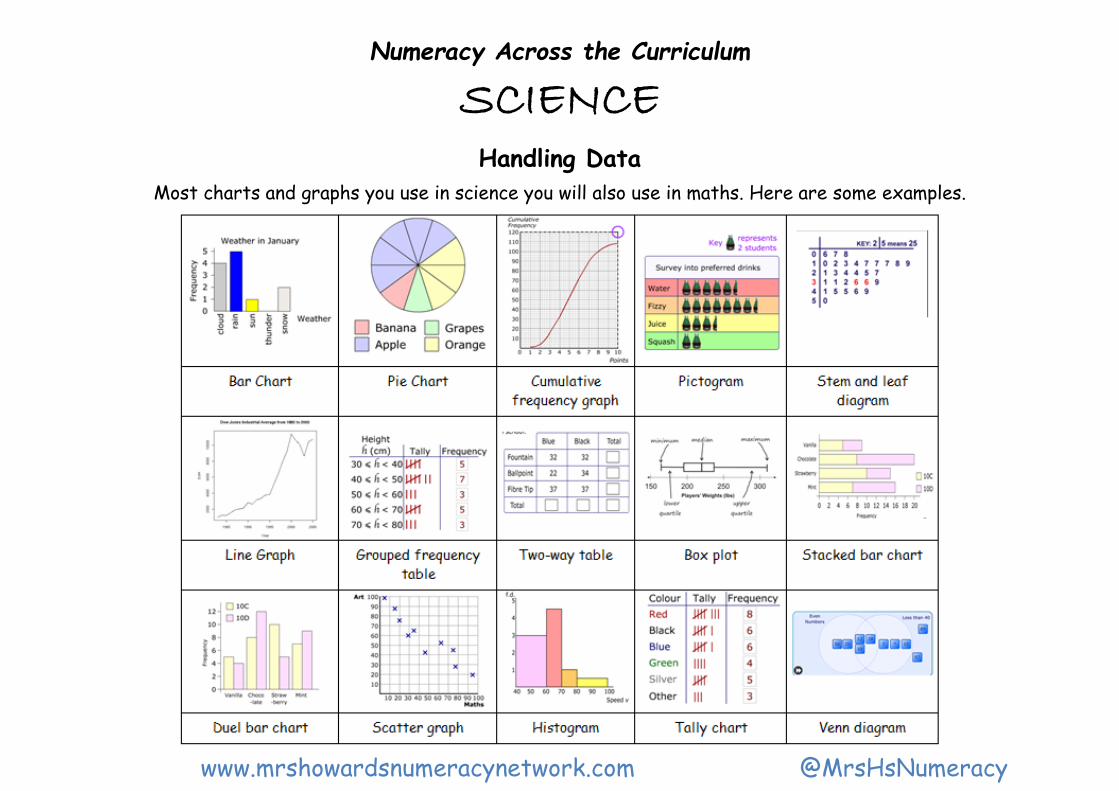
Numeracy Across the Curriculum
SCIENCE Handling Data
Most charts and graphs you use in science you will also use in maths. Here are some examples.
www.mrshowardsnumeracynetwork.com @MrsHsNumeracy
Numeracy Across the Curriculum
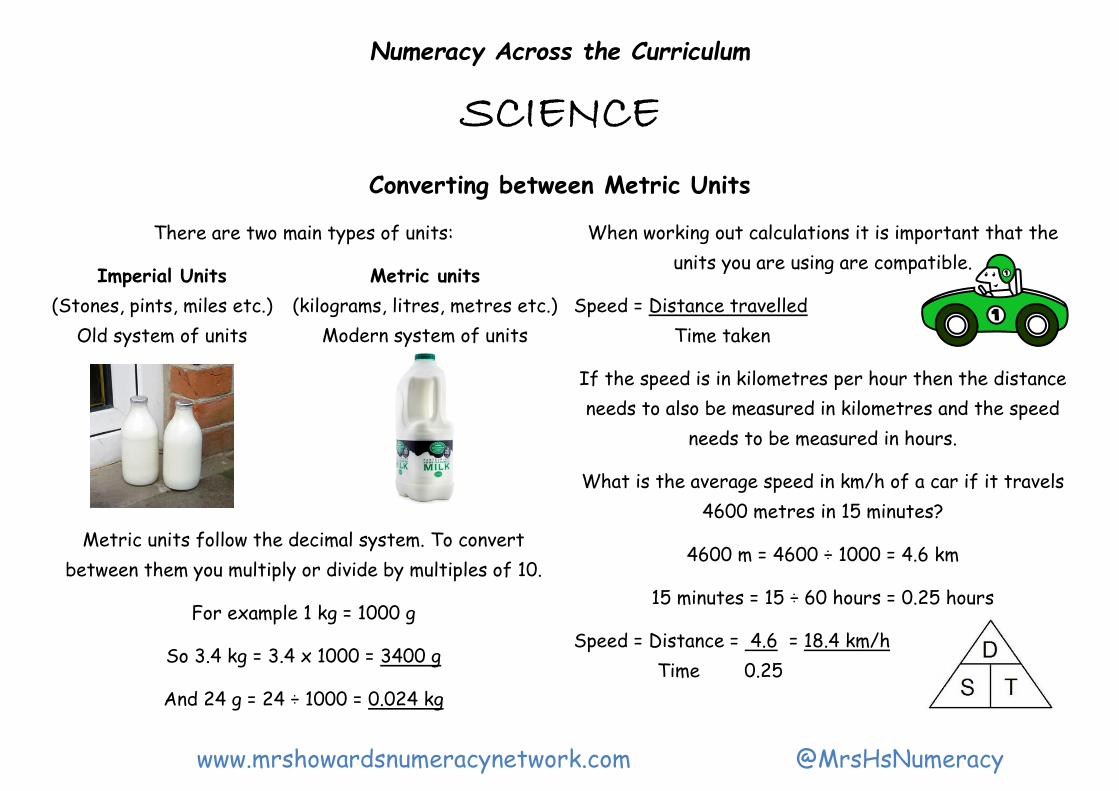
SCIENCE
Converting between Metric Units
There are two main types of units: When working out calculations it is important that the
units you are using are compatible.
Speed = Distance travelled
Time taken
If the speed is in kilometres per hour then the distance
needs to also be measured in kilometres and the speed
needs to be measured in hours.
What is the average speed in km/h of a car if it travels
4600 metres in 15 minutes?
4600 m = 4600 ÷ 1000 = 4.6 km
15 minutes = 15 ÷ 60 hours = 0.25 hours
Speed = Distance = 4.6 = 18.4 km/h
Time 0.25
Imperial Units
(Stones, pints, miles etc.)
Old system of units
Metric units
(kilograms, litres, metres etc.)
Modern system of units
Metric units follow the decimal system. To convert
between them you multiply or divide by multiples of 10.
For example 1 kg = 1000 g
So 3.4 kg = 3.4 x 1000 = 3400 g
And 24 g = 24 ÷ 1000 = 0.024 kg
www.mrshowardsnumeracynetwork.com @MrsHsNumeracy
Numeracy Across the Curriculum
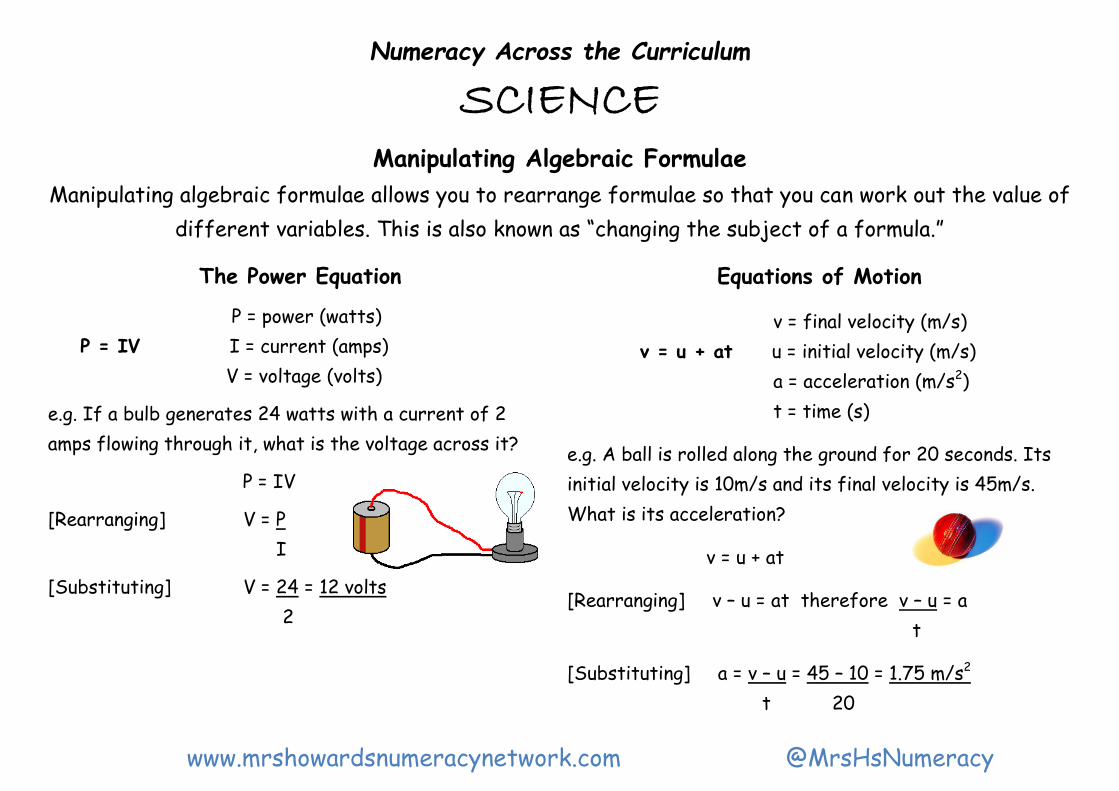
SCIENCE Manipulating Algebraic Formulae
Manipulating algebraic formulae allows you to rearrange formulae so that you can work out the value of
different variables. This is also known as “changing the subject of a formula.”
The Power Equation
P = power (watts)
P = IV I = current (amps)
V = voltage (volts)
e.g. If a bulb generates 24 watts with a current of 2
amps flowing through it, what is the voltage across it?
P = IV
[Rearranging] V = P
I
[Substituting] V = 24 = 12 volts
2
Equations of Motion
v = final velocity (m/s)
v = u + at u = initial velocity (m/s)
a = acceleration (m/s2)
t = time (s)
e.g. A ball is rolled along the ground for 20 seconds. Its
initial velocity is 10m/s and its final velocity is 45m/s.
What is its acceleration?
v = u + at
[Rearranging] v – u = at therefore v – u = a
t
[Substituting] a = v – u = 45 – 10 = 1.75 m/s2
t 20
www.mrshowardsnumeracynetwork.com @MrsHsNumeracy
Numeracy Across the Curriculum
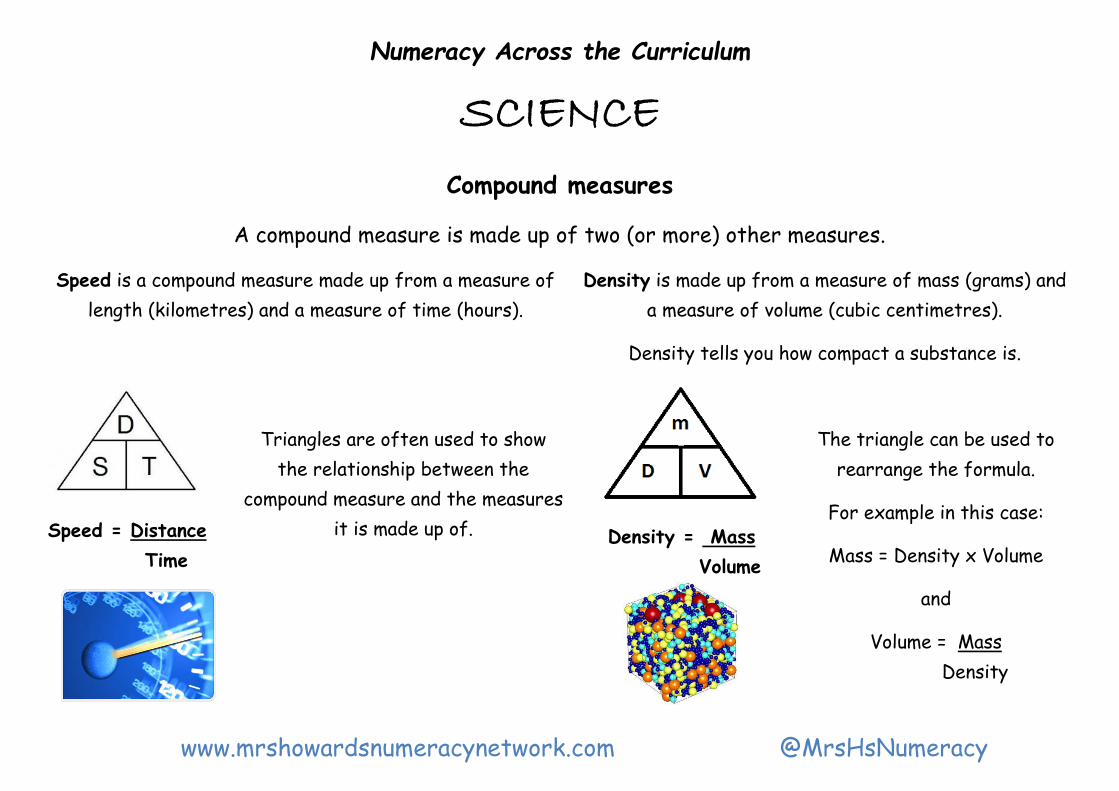
SCIENCE
Compound measures
A compound measure is made up of two (or more) other measures.
Speed is a compound measure made up from a measure of
length (kilometres) and a measure of time (hours).
Density is made up from a measure of mass (grams) and
a measure of volume (cubic centimetres).
Density tells you how compact a substance is.
Speed = Distance
Time
Triangles are often used to show
the relationship between the
compound measure and the measures
it is made up of.
Density = Mass
Volume
The triangle can be used to
rearrange the formula.
For example in this case:
Mass = Density x Volume
and
Volume = Mass
Density
www.mrshowardsnumeracynetwork.com @MrsHsNumeracy