Embed Size (px)
Citation preview
NuclearIncorporationofIronduringtheEukaryoticCellCycleIanRobinsona,b,YangYangc,FucaiZhanga,b,ChristopheLyncha,bandYusufMohammeda,baResearchComplexatHarwell,RutherfordAppletonLaboratory,Didcot,Oxon,OX110FA,UKbLondonCentreforNanotechnology,UniversityCollegeLondon,WC1E6BT,UKcEuropeanSynchrotronRadiationFacility,38043Grenoble,FranceScanningX-rayfluorescencemicroscopyhasbeenusedtoprobethedistributionofS,PandFewithincellnuclei.Nuclei,whichmayhaveoriginatedatdifferentphasesofthecellcycle,arefoundtoshowverydifferentlevelsofFepresentwithastronglyinhomogeneousdistribution.PandSsignals,presumablyfromDNA,arehighandrelativelyuniformacrossallthenuclei;theseagreewithcoherentzoomholographyphasecontrastimagesofthesamesamples.WediscusspossiblereasonsfortheFeincorporation.1.IntroductionHumancellnucleiareappropriatetestsamplesfortheNanoscaleImaging(NI)branchofthenew“NINA”beamline(ID16A)atESRF,describedbyMartinez-Criadoetal(2012).Theirsizesareintherangeof10µm,whichfallswithinthefieldofviewofthepropagation-basedphasecontrastimagingcapabilityofID16A.Inaddition,high-resolutionsubstructureisexpected,atleastifthenucleiareclosetothemetaphasepointofthecellcyclewhentheparentcellispreparingfordivision.ForthefluorescenceimagingcapabilitiesofID16A,knownquantitiesofDNAand(toalesserextent)proteinsareexpectedtobepresentinacellnucleus,whichcanbeusedinquantitativechemicalanalysisandtoverifythecalibrationofthesensitivity.Nucleiclosetometaphaseweretargetedinthisstudybecauseofinterestinthehigher-orderstructureoftheseparatedchromosomeslocatedwithinthem,butitwasalsoappreciatedthatthisreallyneedsathree-dimensional(3D)imagingcapabilitytosegregatethem.Oursamplepreparationmethodsmakeuseofcellcyclecheckpointinhibitorstosynchronizethecellsduringculture,butthisstillallowssomenucleitoemergefromthepreparationsatotherpointsofthecellcycle.Carefulfilteringisusedtoremovecytoplasmandmostoftheothercellcomponents(Yusufetal,2014),soarelativelypurepreparationofwholenucleiandindividualchromosomesisobtained,manywiththenuclearmembraneintact.Thisstrictlyexcludesnucleiinmetaphaseproper,oncethenuclearmembranedissolves,butdoesincludeprophasejustbeforehand,whenthe46chromosomesarefullyformedwithinanucleus.IfthecellswereinG1phasewhenthesampleswereprepared,theywouldcontaintwodouble-strandedcopiesofallthegenomicDNA;iftheywereinG2phaseorthebeginningofmetaphase(M-phase),thereshouldbefourcopies;inSphase,therewouldbesomewherebetweentwoandfourcopies.
Thefullhumangenomecontains3.2x109basepairs(bp)perdouble-strandofDNA,whichisdividedintothe23chromosomes.Associatedwitheachbasepairaretwophosphates,oneoneachstrand.ThesearebyfarthelargestexpectedcontributiontothePfluorescentX-raysignal,withsmalladditionalamountscomingfrombuffers,thelipidsinthecellmembranesandanyresidualRNAorATP.Soacellnucleusshouldhaveawell-definedsignalfromthese2.6x1010Patomsinitsfluorescentimagesifitisinthesecondhalfofthecellcycle(G2orMphase),or1.3x1010Patomsinitsfluorescentimagesifitisinthefirsthalfofthecellcycle(G1phase).Similarly,theSsignalwouldbemostlyattributedtoCysteine(Cys)andMethionine(Met)residuesinthenuclearproteins.Fortunately,muchisknownaboutthemake-upofthe(mostlystructural)chromosomalproteinsfoundinmetaphasefromtheworkofUchiyamaetal(2005):71%ofthetotalmassishistones,whicharethecoreproteinsaroundwhichtheDNAisspooledtomakenucleosomes.ThehistonescontainmanybasicArginineandLysinegroups,whichhelpneutralizethenegativechargecarriedbytheDNA.Onenucleosometypicallyoccupies170basepairsofDNAand,sincemostoftheDNAcanbeassumedtohavecondensedintonucleosomes,wecanusethistoestimatetheexpectedtotalamountofproteinpernucleus.Moreover,thehistonesequencesareallknown,sowecanexpecttheretobe14Satoms(2xCysand12xMet)per170bpofDNAassociatedwiththehistones(Mariño-Ramírezetal,2011).Wethereforeexpectacellnucleustohave2.1x109SatomsinitsfluorescentimagesinG2orMphaseand1.0x109SatomsinG1phase.ThepresenceofFeinthecellnucleushasbeendiscussedrepeatedlyinthescientificliterature.Yagietal(1992)havesuggestedtheremaybeanevolutionaryconnectionbetweenironandDNAbecauseofthepowerfulredoxpotentialofFe.Feisanessentialelementofproteins,oftenintheformofiron-sulfur(FeS)clustersusedinelectrontransportenzymes(Johnsonetal,2005)orinhemecomplexesincytochromes(Dawson,1988).Ironcanbetoxictocellsviathegenerationoffreeradicals(Yagietal,1992).SincethepresenceofironcanleadtoDNAdamagepathways,theremaybeevolutionaryadvantagetokeepingtheDNAinitsownnuclearcompartment,awayfrommanyofthemetabolicprocesses.DespitetheviewthatFe-containingenzymeswouldnotbewidelyusedwithinthenuclearcompartmentofthecell,therehavebeenrecentreportsofFeS-containingenzymesdirectlyinvolvedwithDNAreplication.DNAprimasewasfoundtocontainanFeSdomain(Klingeretal2007,Weineretal2007)alongwithDNAhelicase(WuandBrosh,2012)andDNArepairglycosylases(WuandBrosh,2012).AreviewbyLilletal(2006)namedfiveassociationsofFeSproteinswiththecellnucleus:DNAglycosylase(Ntg2),Histoneacetyltransferase(Elp3),P-loopATPase(Nbp35),Iron-onlyhydrogenase(Nar1)andABCprotein(Rli1).AllofthesesfunctionsarebelievedtobeassociatedwithDNAreplicationandrepairsoshouldbeexpressedonlyduringS-phaseofthecellcycleandshouldbeabsentduringotherphases.
Ferritin,theEukaryoticironstorageprotein,isnotexpectedtobecolocalizedwithDNA,yetthiswasreportedinafewdiverseexamplesbyThompsonetal(2002).NuclearferritinmightbeassociatedwiththeprotectionofDNAorconverselywithoxidativeDNAdamage.Ifnuclearferritinispresent,itmightbeexpectedtobeassociatedwiththenuclearmembrane,ratherthanmixedinwiththeDNA-containingchromatin.Toaddressthesequestions,FluorescentX-rayimagingofhumancellnucleiwasundertakenintheworkreportedhere.2.Methods2.1SamplepreparationNucleiwerepreparedaccordingtoapreviouslypublishedfiltration-basedprotocolforchromosomes(Yusufetal,2014)withmodificationstopreservetheintactnuclei.HumanLymphocytecellswerecultivatedinFetalBovineSerum(FBS)andtreatedwithColcemidtoarresttheminmetaphase.Followingextraction,thenucleiwerefixedin0.5%Glutaraldehydecontaining10mMHepes-KOHand5mMMgCl2.Thesampleswerepipettedin5µLdropsonto200nmthicksiliconnitridewindowsandstainedwith150µMSybergolddye.Afterwashinginwater,thesampleswerelefttodryinair.TheywereimagedusingaZeissAxioZ2microscope(using“Isis”software)toobtainvisiblelightandopticalfluorescenceimagesforreferenceandcorrelationwiththeX-rayresults.ForX-rayimaging,severalmembraneswerepreparedwiththesamesamplematerial.Theresultingsampleswerefoundtocontainalargenumberofintactnuclei,butalsochromosomespreadsandindividualchromosomesfromburstnuclei.Someofthemembrane-boundsampleswerestainedwithplatinumblue(WannerandFormanek,1995),at5mMfor30minutesandwashedinwater,butnosignificantdifferenceswerefoundinthephasecontrastimagesandnoPtsignalwasdetectedinfluorescence.ResultsarereportedfromsamplespreparedwithoutPtstaining.AftertheX-rayexperiment,thesampleswerereimageswithanOlympusLEXT4000confocalmicroscopetoobtainfurtherreferenceimagesoftherelevantsamples.2.2X-raymeasurementsSamplesonmembraneswereclampedintothesampleinsertionstubsdesignedforID16A.Thesewereload-lockedintotheUHVsamplechamberundervacuumatroomtemperaturebydroppingthemfromamanipulatorintothepiezo-drivensamplestage.Thepiezodrivesystemwaskeptactiveduringthisoperationsothatthecontactforcescouldbemonitoredinordertopreventoverloadingthestages.TheID16AbeamlinehasamultilayercoatedKirkpatrick-Baez(KB)focusingmirrorpairlocatedat185mfromanundulatorsourceoperatingat17keV(Moraweetal,2015).TheKBsystem,withextremedemagnificationdesignedfora14x14nmfocus,producedameasuredfocusof20x30nmwithveryhighfluxfromthebroadbandpassofthemultilayer.
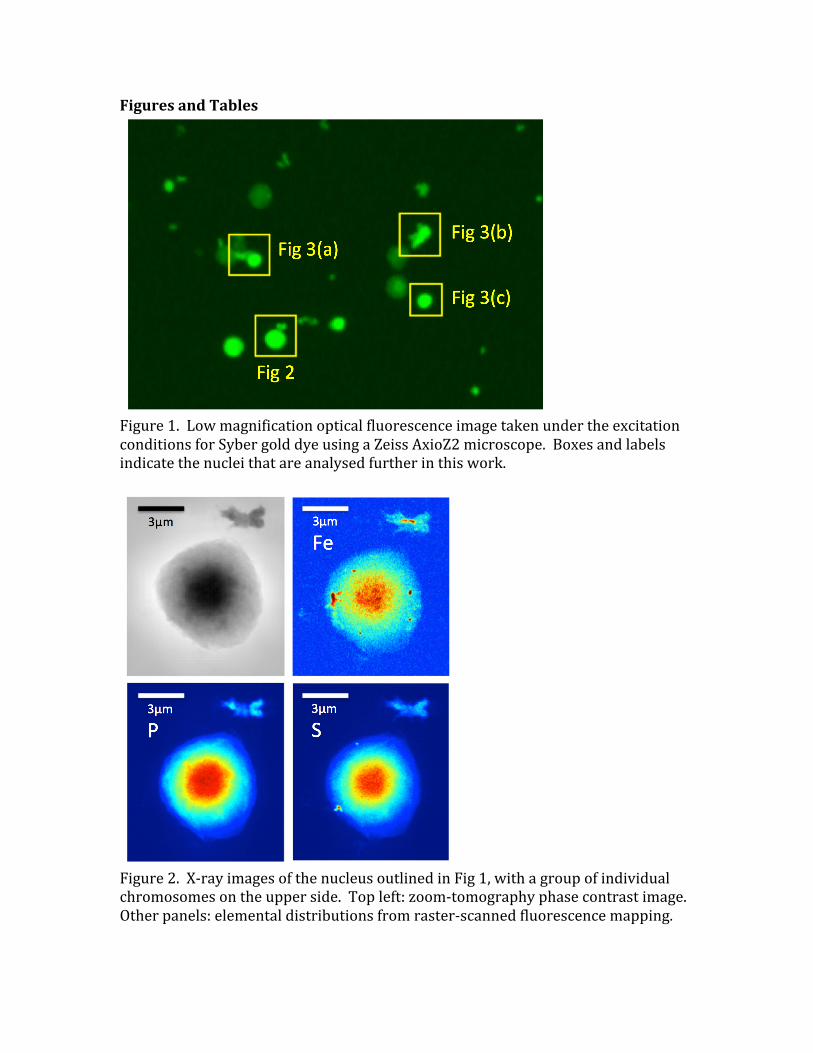
Forfluorescentimagingexperiments,thesamplewasraster-scannedacrossthebeamatthefocuspositionin30nmsteps.Theforwardandbackwarddirectedfluorescencewasdetectedbyapairof6-elementsilicondriftdiodedetectorswithadwelltimeof100ms(CHECK).SpectraweredecomposedintopuresignalsfromtheP-K,S-KandFe-Lemissionlinesat2014,2308and705eVrespectively(CHECK)byprinciplecomponentanalysisandcalibratedwithstandardsamplesofknownmassdensity(DETAILS).Dataforthephasecontrastimageswereobtainedbymovingthesampledownstreamofthefocusbyarangeofdistances(DETAILS)andrecordingtheprojectedimageonalens-coupledFReLoNdetectorwith2048x2048pixels,givinganeffectivepixelsizeof1.1µm.Thesedata,measuredcoherentlyatfourdifferentmagnifications,werecombinedusingtheholotomographymethod,nowcalled“zoom”tomography,toobtainfull-fieldquantitativephasecontrastimagesofthesampleintransmission(Cloetensetal,1999).3.ResultsandDiscussionFigure1showsanoverviewopticalfluorescenceimagetakenundertheexcitationconditionsforSybergolddye,whichbindsspecificallytoDNA.Whilethenucleiareclearlywellisolatedonthemembrane,itisclearthatnotallofthemareequallybright.Thissuggeststhateitherthedyeisunabletopenetratethesamplesuniformlyor,morelikely,thatsomenucleihavebecomedepletedintheirDNAcontent.Thismighthaveoccurredduringthewashingstepsofthesamplepreparation,orpossiblyduringhandlingofthesamples.Wenotethattheimagewastakenshortlyaftersamplepreparation,beforetransportingthesamplestoESRF,sothisdoesnottakeintoaccounttheeffectsofthevacuumsampletransferintotheID16Ainstrument.Figure2showscomparisonimagesofanisolatednucleusbybothavailableX-rayimagingmethods:zoomtomographyphasecontrastandscanningX-rayfluorescenceoftheP,SandFelines.Thetotalsignalsforthethreeelements,integratedovertheimagesandcalibratedinunitsofnumbersofatoms,arelistedinTable1.Thefieldofviewofthisimagealsocontainsoneortwoindividualchromosomesinasmallclusterattheside.ThisnucleuscontainstheleastquantityofFeobserved,thelowestlevelofPandthehighestS.ThedistributionoftheP-andS-signalsoverlaywellontopofeachotherandalsoagreewiththedistributionofphaseshiftmeasured(QUANTITATIVEANALYSISOFPHASEVALUES??).Thedome-shapeddistributionofallthreeimagesisroughlywhatwouldbeexpectedforasphericalorhemisphericalnucleuswithauniformdensityofchromatinmatterwithinitsvolume.ThetotalPsignalcomingfrom3.9x109Patomsisafactor-of-threebelowthelowerestimateof1.3x1010Patoms,givenabove,expectedforanucleusinthefirsthalfofthecellcycle.ThissuggestseitheracalibrationerrororthatsomePhasbeenlost
duringthesamplepreparationandinsertionintovacuum.Wedonotattributethistoradiationdamagebecausethesignallevelsintheimageswerefoundtobereproducibleuponrepeatedscanning.Ontheotherhand,thetotalfluorescentSsignalof4.3x109atomsissubstantiallyhigherthanthehigherestimateaboveof2.1x109SatomsinG2orMphase.Sincethisappearstobehomogeneouslydistributedwithinthechromatinfilledregionofthenucleus,thissuggeststhattheextrasignalmaybecomingfromthe29%non-histoneproteins,whichmayhavehigherrelativelevelsofCysandMetaminoacids(Uchiyamaetal,2005).Correspondingimagesfromthreemorenuclei,aslabelledinFig1andshowninFig3,gavetheintegratedsignalslistedinTable1.ThetrendissimilarwithanunderrepresentationofPandoverrepresentationofS.FortheSandPsignalsfrom5nucleimeasured,therearefactorsof2variationsfromonenucleustoanother,whichmightbeinherentmeasurementerrorsorvariationsofsamplepreparation.ThehighestPsignaldoesjustreachthelowerestimatefortheamountofDNApresentinG1phase,asdoesthelowestSsignalcrossovertheexpectedlevelforG2/M.MuchgreatervariationwasfoundinboththemassesanddistributionsoftheFesignal,forwhicha27xvariationwasfound.Fig2showsthenucleuswiththesmallestlevelofFe,whilethatofFig3(a)hasthehighestlevel.UnlikeSandP,theFesignalsarestronglyclusteredandoftenseentobelocatedattheperipheryofthenuclei.ItisthereforeconcludedthemostoftheFesignaliscomingfromthenuclearmembranestructures,ratherthanthecentralregions,asdiscussedfurtherbelow.WealsonotethattheseparatedchromosomestructureseenatthetopofFig2hascolocalisedPandSsignalscomingfromitsdistinctarmregionsandaseparateFesignalinthecentre,whichisdepletedinPandS.ThisisappearstobeanagglomerationoftwochromosomesontheleftandrightsidesandmaybeapieceofFe-richnuclearmembraneinthecentre.4.ConclusionsForthehumanlymphocytecellnucleipresentedinthisstudy,thedistributionsofPandSX-rayfluorescence,associatedwiththeDNA-proteincomplexofchromatin,arefoundtoberelativelyuniformandstructureless.Thiscouldbebecausethecellsareininterphase(G1,S,orG2ofthecellcycle),whenthechromatinisdecondensed,oritcouldbebecauseofinsufficientresolutiontoseetheindividualchromosomes.AcertainamountofmodulatedstructurecanbedistinguishedinthePsignalsofFig3(a)and3(c),whichresemblestheexpectedpatternofcondensedmetaphasechromosomes,eventhoughtheyarenotfullyresolved.Ifso,thesenucleiareinprophase,sincetheystillpossesstheirnuclearmembrane.ThelevelsofbothPandSarerelativelyreproduciblefromnucleustonucleus,withinafactorof2.ThelevelofPissystematicallylowerthanexpectedfromthenumberofPatomscontainedintheDNAofthehumangenome.Notingthatsome
relativelyempty(deflated)nucleiwereobservedintheopticalfluorescenceimageofFig1,thismaybecausedbypartiallossofchromosomesduringthewashingstepofsamplepreparation.ItisunfortunatethatsuchlosseshavetakenplaceasareliablePlevelmeasurementcouldhavebeenausefuldeterminationofthephaseofthecellcycle.BoththelevelsofSandtheS/Pratiosarefoundtobehigherthanexpectedfromthehistoneproteinsalone,whichcomprise71%ofthetotalchromosomalprotein.Thissuggeststhatthenon-histoneproteinsmaybericherinCysandMetresidues.TheFeconcentration,while3ordersofmagnitudelowerthanPorS,ismuchmorevariedamongthesamplesexamined,by27-foldamongtheintegratedsignalsinTable1.FeisnotexpectedtobeassociatedwithDNAingeneralforevolutionaryreasons(Yagietal,1992),yetsomeexceptions,particularlyduringDNAreplicationinSphase,arenotedabove.Feisseentoformsmallbrightspots,about100nmindiameter,inthesamplesshowninthelow-concentrationcasesinFigs2and3(b).Inonecase,Fig3(b),FespotsarecolocalisedwithS,perhapssuggestingthepresenceofFeSenzymes;intheothercases,Fig2,FeandSareseparatelylocalizedinspots.Feisseentoformshell-likecrescent-shapedplaquesaroundtheedgesofthehigh-FeconcentrationnucleiinFigs3(a)and3(c).TheseareastrongsuggestionofFebeinglocatedinthenuclearmembrane,ratherthanthechromatin-filledcentres.InmostcasestheFesignalcanbeseentosurroundthatofthePandS.ThismaythereforebeconsistentafterallwiththeevolutionaryhypothesisofYagietal(1992).Asfaraswecantell,thezoomtomographymeasurementsdidnonoticeabledamagetothesamples,evenaftermultipleandlongerexposuresweretested.Thebeamissubstantiallyoutoffocushere,enlargedtomorethanthe20x20µmfieldofviewintheclosest-distancecase.Howevertheraster-scanningfluorescencemeasurementdidcausevisiblechangestothesample,asrecordedinFig4.Thinningofthemembraneovertheentirescannedareacanbedetectedintheconfocalheightmap(greyscaleimage).Multipleoverlappingscannedareascanbeobservedfortheuppernucleus,forwhichtheimagesappearinFig3(b).However,nomasslossbetweenthesesscanswasdetectedinthefluorescencesignal.AcknowledgementsThisworkwassupportedbyaBBSRCProfessorialFellowshipBB/H022597/1"DiamondProfessorialFellowshipforimagingchromosomesbycoherentX-raydiffraction".AdditionalsupportcamefromanEPSRCgrantEP/I022562/1“PhasemodulationtechnologyforX-rayimaging”.WethankESRFforbeamtimeandhospitalityduringthemeasurements.References
Cloetens,P.,Ludwig,W,Baruchel,J,VanDyck,D,VanLanduyt,J,Guigay,JPandSchlenker,M(1999),Holotomography:Quantitativephasetomographywithmicrometerresolutionusinghardsynchrotronradiationxrays,Appl.Phys.Letts.752912-2914Dawson,JH(1988)ProbingStructure-FunctionRelationsinHeme-ContainingOxygenasesandPeroxidases,Science240433-439Johnson,DC,Dean,DR,Smith,ADandJohnson,MK(2005),Structure,function,andformationofbiologicaliron-sulfurclusters,Ann.Rev.Biochemistry74247-281Klinge,S.,Hirst,J.,MamanJD,KrudeT.andPellegrini,L.(2007),Iron-sulfurdomainoftheeukaryoticprimaseisessentialforRNAprimersynthesis,NatureStructural&MolecularBiology14875Lill,R.,Dutkiewicz,R.,Elsässer,H-P,Hausmann,A.Netz,DJA,Pierik,AJ,Stehling,O.,Urzica,E.andMühlenhoff,U.,(2006),Mechanismsofiron–sulfurproteinmaturationinmitochondria,cytosolandnucleusofeukaryotes,BiochimicaetBiophysicaActa1763652Mariño-Ramírez,L.,Levine,K.M.,Morales,M.,Zhang,S.,Moreland,R.T.,Baxevanis,A.D.,andLandsman,D.(2011)TheHistoneDatabase:anintegratedresourceforhistonesandhistonefold-containingproteins.DatabaseVol.2011:articleIDbar048,doi:10.1093/database/bar048.Martinez-Criado,G,Tucoulou,R,Cloetens,P,Bleuet,P,Bohic,S,Cauzid,J,Kieffer,I,Kosior,E,Laboure,S,Petitgirard,S,Rack,A,Sans,JA,Segura-Ruiz,J,Suhonen,H,Susini,J.andVillanova,J(2012),StatusofthehardX-raymicroprobebeamlineID22oftheEuropeanSynchrotronRadiationFacility,JournalofSynchrotronRadiation1910-18Morawe,C,Barrett,R,Cloetens,P,Lantelme,B,Peffen,JC,Vivo,A(2015),GradedmultilayersforfiguredKirkpatrick-BaezmirrorsonthenewESRFendstationID16A,AdvancesinX-Ray/EUVOpticsandComponentsX,ProceedingsofSPIE9588958803-1Thompson,KJ,Fried,MG,Ye,Z.,BoyerP.andConnor,JR,(2002),Regulation,mechanismsandproposedfunctionofferritintranslocationtocellnuclei,JournalofCellScience1152165Wanner,G;Formanek,H(1995),ImagingofDNAinHumanandPlantChromosomesbyHigh-ResolutionScanningElectron-Microscopy,ChromosomeResearch3368-374
Weiner,B.E.,HuangH.,Dattilo,BM,NilgeMJ,FanningE.andChazin,W.J.(2007),AnIron-SulfurClusterintheC-terminalDomainofthep58SubunitofHumanDNAPrimase,J.BiologicalChemistry28233444WuY.andBrosh,R.M.(2012),DNAhelicaseandhelicase–nucleaseenzymeswithaconservediron–sulfurcluster,NucleicAcidsResearch404247Yagi,K.,Ishida,N.,Komura,S.,Ohishi,N.,Kusai,M.andKohno,M,(1992),Generationofhydroxylradicalfromlinoleicacidhydroperoxideinthepresenceofepinephrineandiron,Biochem.Biophys.Res.Commun.183945–951Yusuf,M,N.Parmar,G.K.BhellaandI.K.Robinson(2014),Asimplefiltrationtechniqueforobtainingpurifiedhumanchromosomesinsuspension,BioTechniques56257-261
FiguresandTables
Figure1.LowmagnificationopticalfluorescenceimagetakenundertheexcitationconditionsforSybergolddyeusingaZeissAxioZ2microscope.Boxesandlabelsindicatethenucleithatareanalysedfurtherinthiswork.
Figure2.X-rayimagesofthenucleusoutlinedinFig1,withagroupofindividualchromosomesontheupperside.Topleft:zoom-tomographyphasecontrastimage.Otherpanels:elementaldistributionsfromraster-scannedfluorescencemapping.
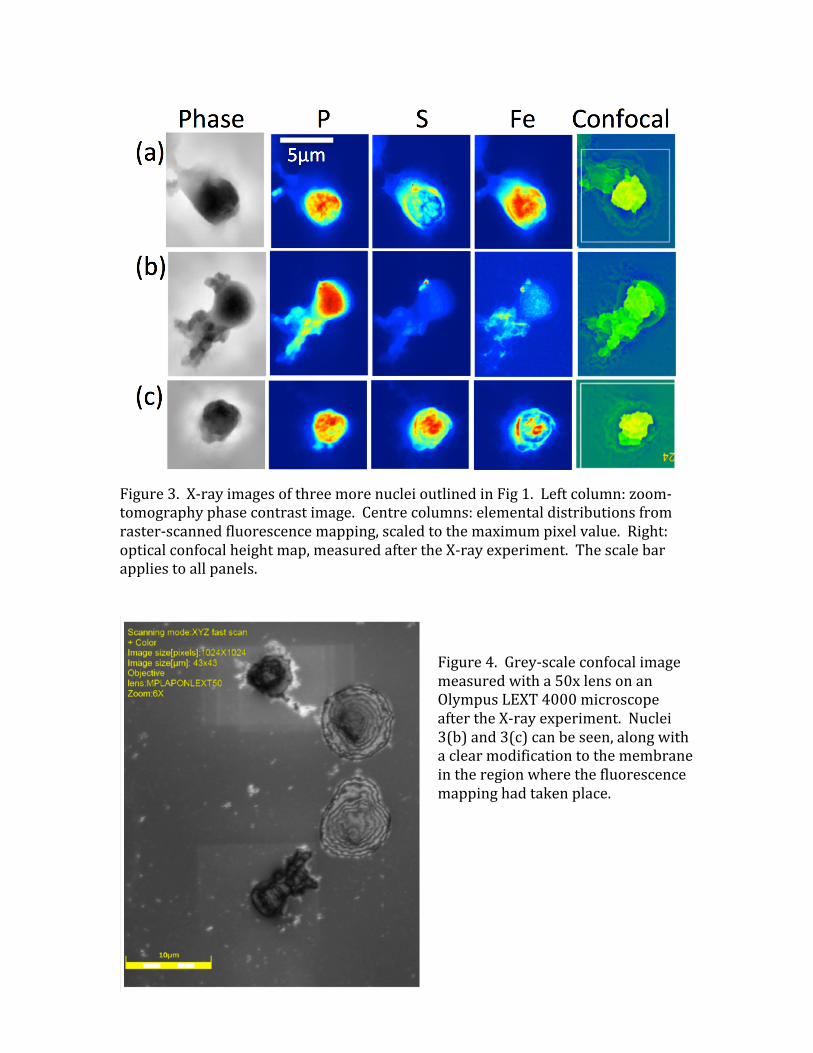
Figure3.X-rayimagesofthreemorenucleioutlinedinFig1.Leftcolumn:zoom-tomographyphasecontrastimage.Centrecolumns:elementaldistributionsfromraster-scannedfluorescencemapping,scaledtothemaximumpixelvalue.Right:opticalconfocalheightmap,measuredaftertheX-rayexperiment.Thescalebarappliestoallpanels.
Figure4.Grey-scaleconfocalimagemeasuredwitha50xlensonanOlympusLEXT4000microscopeaftertheX-rayexperiment.Nuclei3(b)and3(c)canbeseen,alongwithaclearmodificationtothemembraneintheregionwherethefluorescencemappinghadtakenplace.
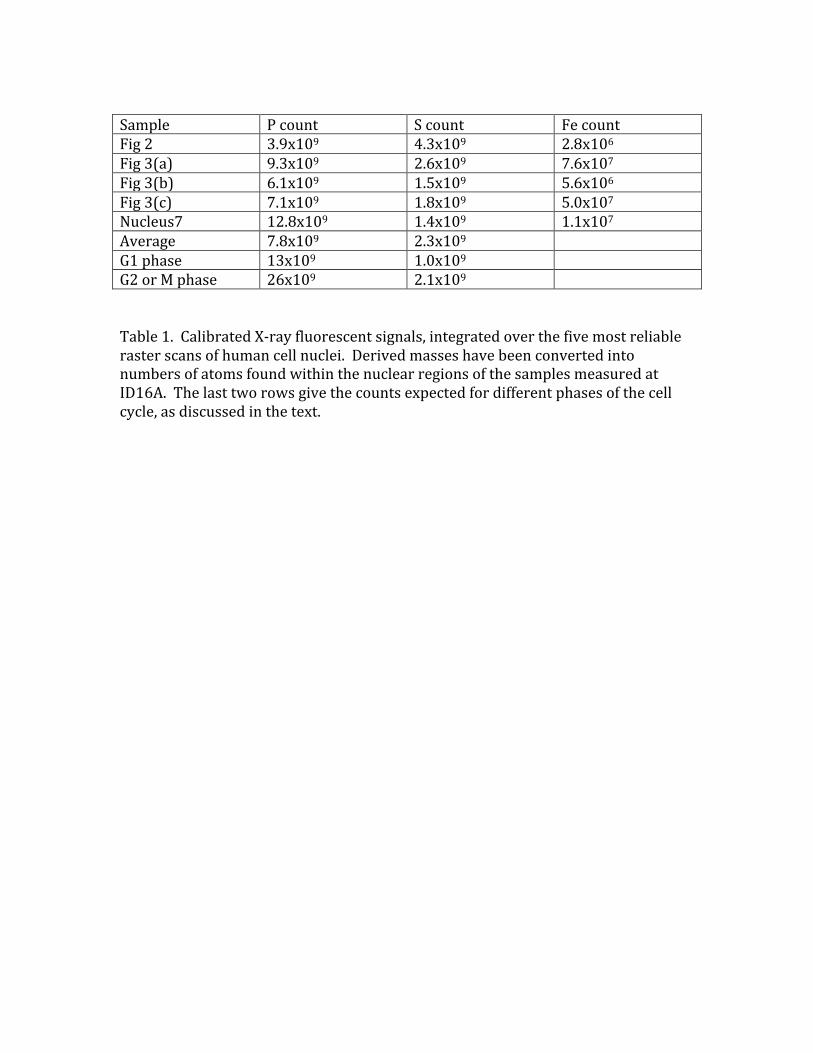
Sample Pcount Scount FecountFig2 3.9x10⁹ 4.3x10⁹ 2.8x10⁶Fig3(a) 9.3x10⁹ 2.6x10⁹ 7.6x10⁷Fig3(b) 6.1x10⁹ 1.5x10⁹ 5.6x10⁶Fig3(c) 7.1x10⁹ 1.8x10⁹ 5.0x10⁷Nucleus7 12.8x10⁹ 1.4x10⁹ 1.1x10⁷Average 7.8x10⁹ 2.3x10⁹ G1phase 13x109 1.0x10⁹ G2orMphase 26x109 2.1x10⁹ Table1.CalibratedX-rayfluorescentsignals,integratedoverthefivemostreliablerasterscansofhumancellnuclei.DerivedmasseshavebeenconvertedintonumbersofatomsfoundwithinthenuclearregionsofthesamplesmeasuredatID16A.Thelasttworowsgivethecountsexpectedfordifferentphasesofthecellcycle,asdiscussedinthetext.