Embed Size (px)
Citation preview
DOCKETED Docket Number: 21-IEPR-07
Project Title: Clean Transportation Benefits
TN #: 239084
Document Title: Presentation -CEC CTP Benefits Analysis 2021 Results for the
IEPR Workshop
Description: Presentation by Chris Neuman,Maddy Gilleran, Chad Hunter,
Ranjit Desai, Andre Fernandes TomonAvelino, Maggie Mann
Filer: Raquel Kravitz
Organization: National Renewable Energy Laboratory (NREL)
Submitter Role: Public Agency
Submission Date: 7/29/2021 12:04:59 PM
Docketed Date: 7/29/2021
CEC CTP Benefits Analysis: 2021 Results for the IEPR Workshop
Chris Neuman, Maddy Gilleran, Chad Hunter, Ranjit Desai, Andre Fernandes Tomon Avelino, Maggie Mann
July 30, 2021
Executive Summary – IEPR Workshop
OverviewMethods UpdatesExpected Benefits ResultsMarket Transformation Results
NREL | 3
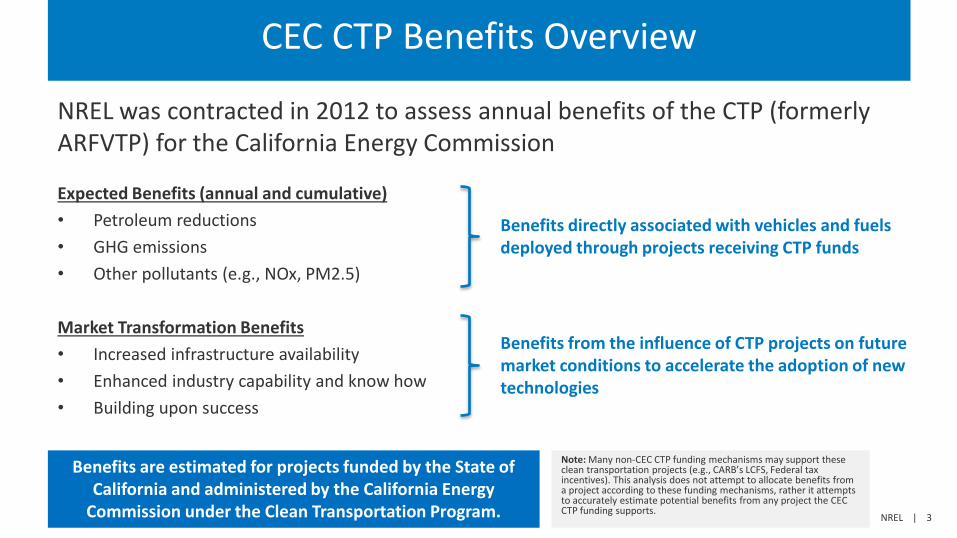
CEC CTP Benefits Overview
NREL was contracted in 2012 to assess annual benefits of the CTP (formerly ARFVTP) for the California Energy Commission
Expected Benefits (annual and cumulative)• Petroleum reductions• GHG emissions • Other pollutants (e.g., NOx, PM2.5)
Market Transformation Benefits• Increased infrastructure availability• Enhanced industry capability and know how• Building upon success
Benefits are estimated for projects funded by the State of California and administered by the California Energy
Commission under the Clean Transportation Program.
Benefits directly associated with vehicles and fuels deployed through projects receiving CTP funds
Benefits from the influence of CTP projects on future market conditions to accelerate the adoption of new technologies
Note: Many non-CEC CTP funding mechanisms may support these clean transportation projects (e.g., CARB’s LCFS, Federal tax incentives). This analysis does not attempt to allocate benefits from a project according to these funding mechanisms, rather it attempts to accurately estimate potential benefits from any project the CEC CTP funding supports.
NREL | 4
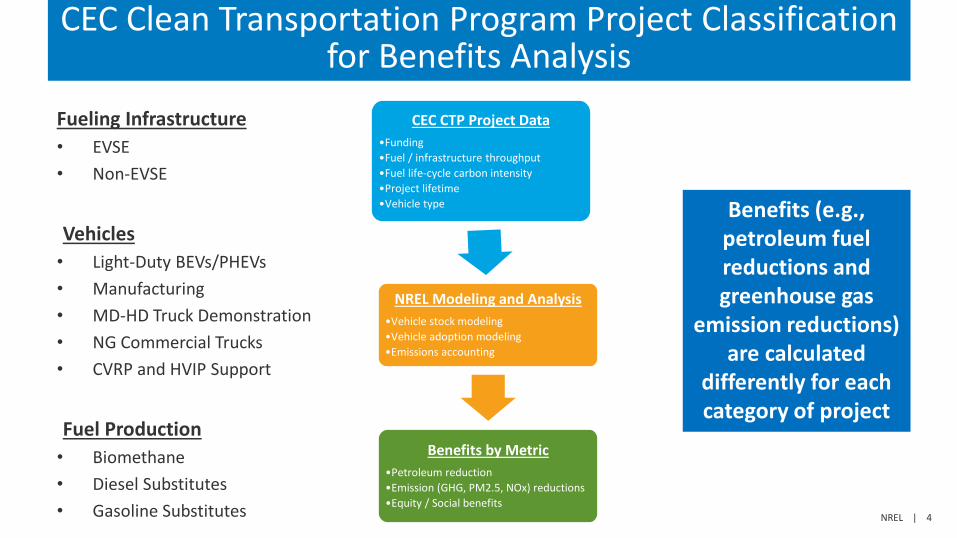
CEC Clean Transportation Program Project Classification for Benefits Analysis
Fueling Infrastructure• EVSE• Non-EVSE
Vehicles• Light-Duty BEVs/PHEVs• Manufacturing• MD-HD Truck Demonstration• NG Commercial Trucks• CVRP and HVIP Support
Fuel Production• Biomethane• Diesel Substitutes• Gasoline Substitutes
Benefits (e.g., petroleum fuel reductions and greenhouse gas
emission reductions) are calculated
differently for each category of project
CEC CTP Project Data•Funding•Fuel / infrastructure throughput•Fuel life-cycle carbon intensity•Project lifetime•Vehicle type
NREL Modeling and Analysis•Vehicle stock modeling•Vehicle adoption modeling•Emissions accounting
Benefits by Metric•Petroleum reduction•Emission (GHG, PM2.5, NOx) reductions•Equity / Social benefits
NREL | 5
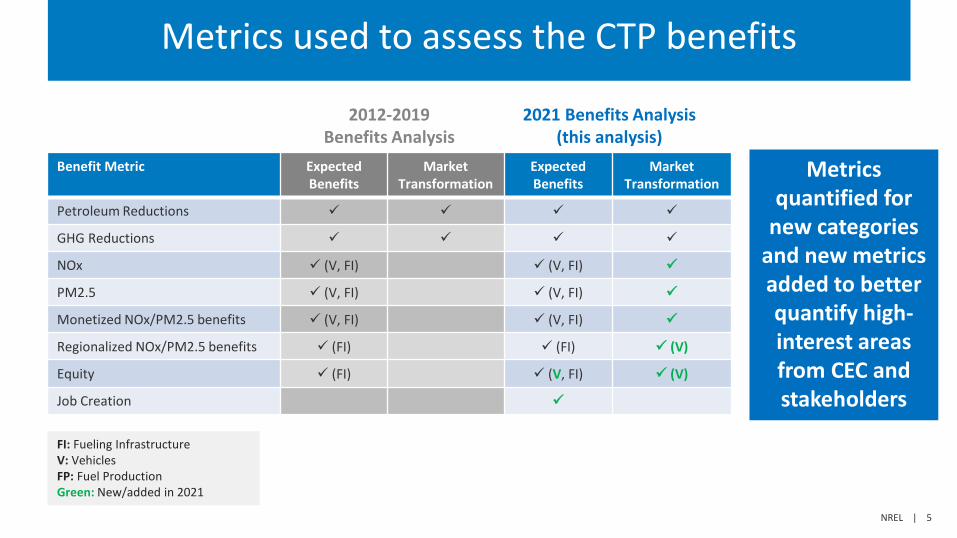
Metrics used to assess the CTP benefits
Benefit Metric Expected Benefits
Market Transformation
Expected Benefits
Market Transformation
Petroleum Reductions
GHG Reductions
NOx (V, FI) (V, FI)
PM2.5 (V, FI) (V, FI)
Monetized NOx/PM2.5 benefits (V, FI) (V, FI)
Regionalized NOx/PM2.5 benefits (FI) (FI) (V)
Equity (FI) (V, FI) (V)
Job Creation
2012-2019 Benefits Analysis
2021 Benefits Analysis (this analysis)
FI: Fueling Infrastructure V: VehiclesFP: Fuel ProductionGreen: New/added in 2021
Metrics quantified for
new categories and new metrics added to better quantify high-interest areas from CEC and stakeholders
Executive Summary – IEPR Workshop
OverviewMethods UpdatesExpected Benefits ResultsMarket Transformation Results
NREL | 7
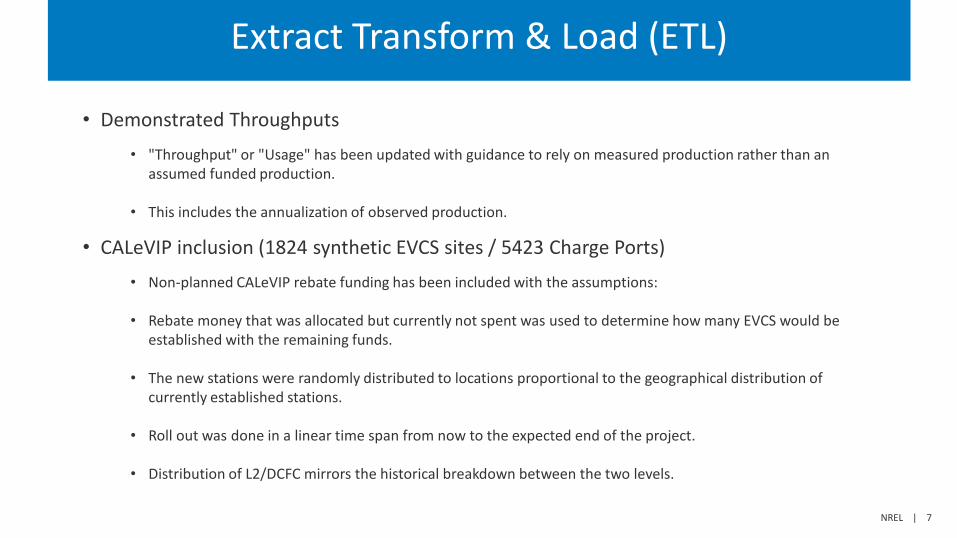
Extract Transform & Load (ETL)
• Demonstrated Throughputs• "Throughput" or "Usage" has been updated with guidance to rely on measured production rather than an
assumed funded production.
• This includes the annualization of observed production.
• CALeVIP inclusion (1824 synthetic EVCS sites / 5423 Charge Ports)• Non-planned CALeVIP rebate funding has been included with the assumptions:
• Rebate money that was allocated but currently not spent was used to determine how many EVCS would be established with the remaining funds.
• The new stations were randomly distributed to locations proportional to the geographical distribution of currently established stations.
• Roll out was done in a linear time span from now to the expected end of the project.
• Distribution of L2/DCFC mirrors the historical breakdown between the two levels.
NREL | 8
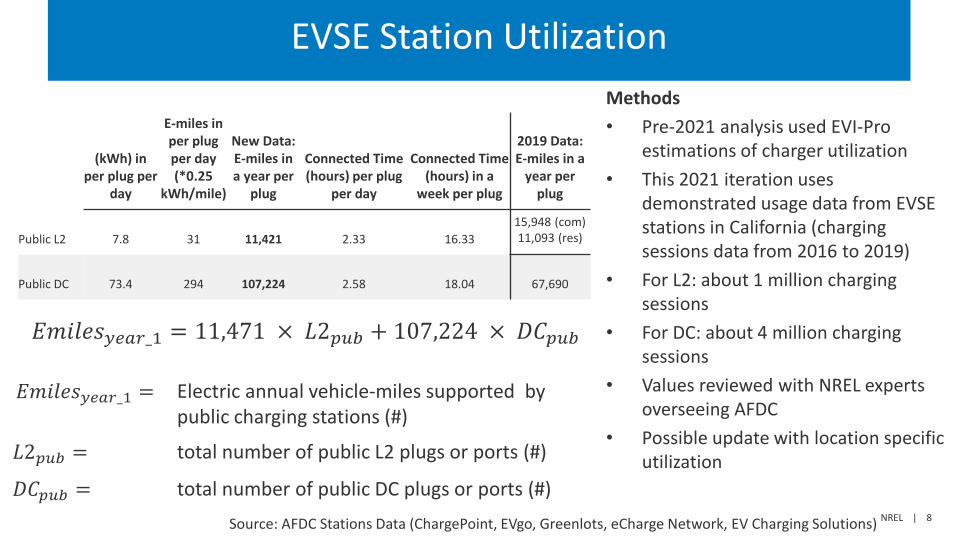
EVSE Station Utilization
(kWh) in per plug per
day
E-miles in per plug per day (*0.25
kWh/mile)
New Data: E-miles in a year per
plug
Connected Time (hours) per plug
per day
Connected Time (hours) in a
week per plug
2019 Data: E-miles in a
year per plug
Public L2 7.8 31 11,421 2.33 16.3315,948 (com)11,093 (res)
Public DC 73.4 294 107,224 2.58 18.04 67,690
Methods• Pre-2021 analysis used EVI-Pro
estimations of charger utilization• This 2021 iteration uses
demonstrated usage data from EVSE stations in California (charging sessions data from 2016 to 2019)
• For L2: about 1 million charging sessions
• For DC: about 4 million charging sessions
• Values reviewed with NREL experts overseeing AFDC
• Possible update with location specific utilization
𝐸𝐸𝐸𝐸𝐸𝐸𝐸𝐸𝐸𝐸𝐸𝐸𝑦𝑦𝑦𝑦𝑦𝑦𝑦𝑦_1 = 11,471 × 𝐿𝐿𝐿𝑝𝑝𝑝𝑝𝑝𝑝 + 107,𝐿𝐿4 × 𝐷𝐷𝐷𝐷𝑝𝑝𝑝𝑝𝑝𝑝
Source: AFDC Stations Data (ChargePoint, EVgo, Greenlots, eCharge Network, EV Charging Solutions)
𝐸𝐸𝐸𝐸𝐸𝐸𝐸𝐸𝐸𝐸𝐸𝐸𝑦𝑦𝑦𝑦𝑦𝑦𝑦𝑦_1 = Electric annual vehicle-miles supported by public charging stations (#)
𝐿𝐿𝐿𝑝𝑝𝑝𝑝𝑝𝑝 = total number of public L2 plugs or ports (#)
𝐷𝐷𝐷𝐷𝑝𝑝𝑝𝑝𝑝𝑝 = total number of public DC plugs or ports (#)
NREL | 9
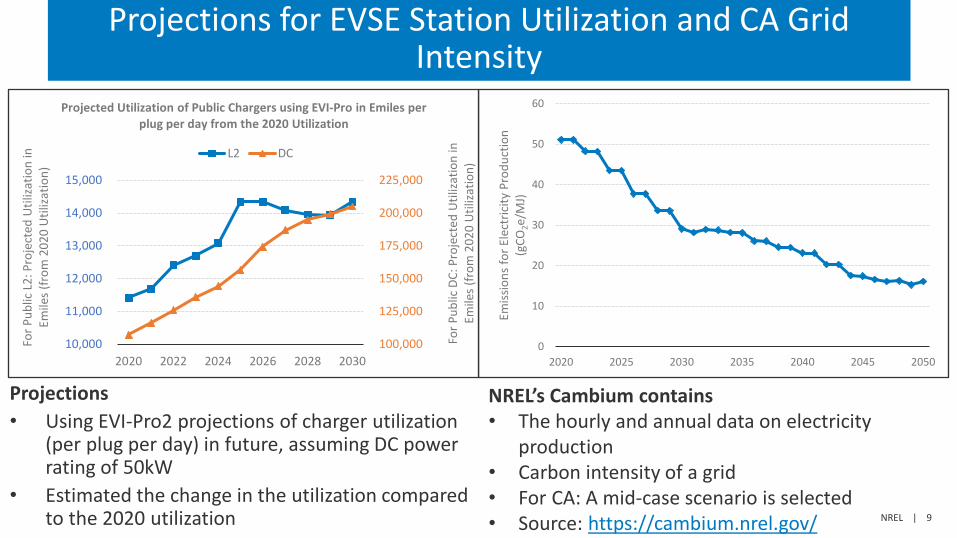
Projections for EVSE Station Utilization and CA Grid Intensity
Projections• Using EVI-Pro2 projections of charger utilization
(per plug per day) in future, assuming DC power rating of 50kW
• Estimated the change in the utilization compared to the 2020 utilization
0
10
20
30
40
50
60
2020 2025 2030 2035 2040 2045 2050
Emiss
ions
for E
lect
ricity
Pro
duct
ion
(gCO
2e/M
J)
NREL’s Cambium contains• The hourly and annual data on electricity
production• Carbon intensity of a grid• For CA: A mid-case scenario is selected• Source: https://cambium.nrel.gov/
100,000
125,000
150,000
175,000
200,000
225,000
10,000
11,000
12,000
13,000
14,000
15,000
2020 2022 2024 2026 2028 2030
For P
ublic
DC:
Pro
ject
ed U
tiliza
tion
in
Emile
s (fr
om 2
020
Util
izatio
n)
For P
ublic
L2:
Pro
ject
ed U
tiliza
tion
in
Emile
s (fr
om 2
020
Util
izatio
n)
Projected Utilization of Public Chargers using EVI-Pro in Emiles per plug per day from the 2020 Utilization
L2 DC
NREL | 10
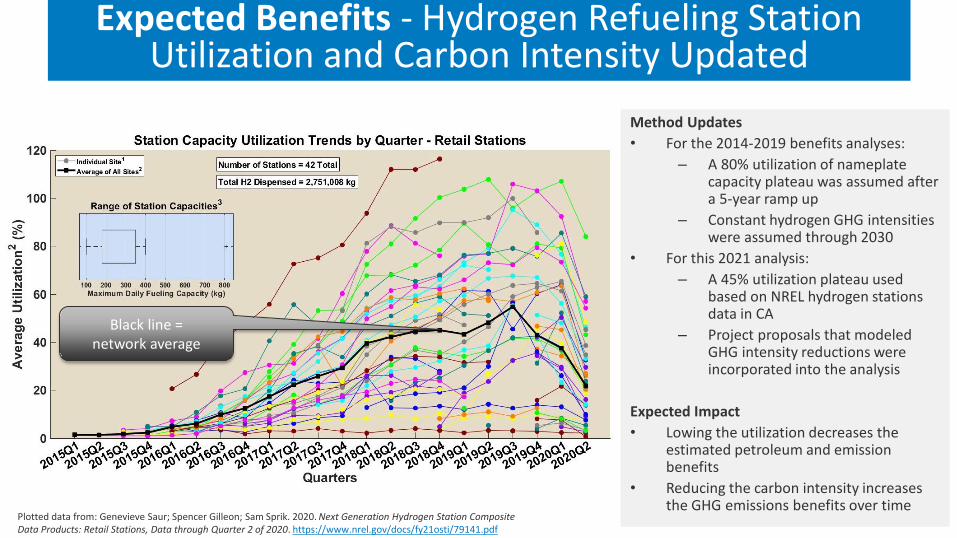
Expected Benefits - Hydrogen Refueling Station Utilization and Carbon Intensity Updated
Method Updates• For the 2014-2019 benefits analyses:
– A 80% utilization of nameplate capacity plateau was assumed after a 5-year ramp up
– Constant hydrogen GHG intensities were assumed through 2030
• For this 2021 analysis: – A 45% utilization plateau used
based on NREL hydrogen stations data in CA
– Project proposals that modeled GHG intensity reductions were incorporated into the analysis
Expected Impact• Lowing the utilization decreases the
estimated petroleum and emission benefits
• Reducing the carbon intensity increases the GHG emissions benefits over time
Black line = network average
Plotted data from: Genevieve Saur; Spencer Gilleon; Sam Sprik. 2020. Next Generation Hydrogen Station Composite Data Products: Retail Stations, Data through Quarter 2 of 2020. https://www.nrel.gov/docs/fy21osti/79141.pdf
NREL | 11
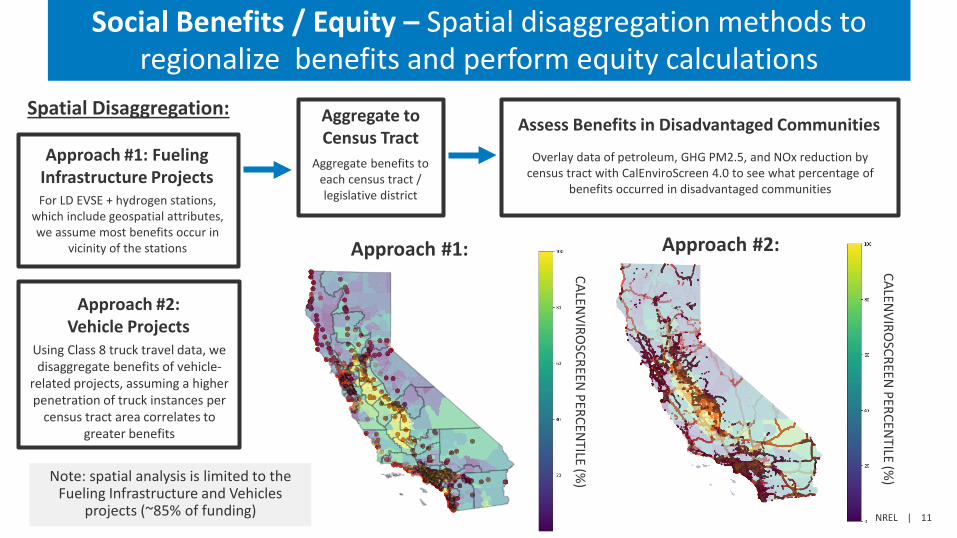
Social Benefits / Equity – Spatial disaggregation methods to regionalize benefits and perform equity calculations
CALENVIRO
SCREEN PERCEN
TILE (%)
Approach #1: Fueling Infrastructure Projects
CALENVIRO
SCREEN PERCEN
TILE (%)
Assess Benefits in Disadvantaged CommunitiesAggregate to Census Tract
For LD EVSE + hydrogen stations, which include geospatial attributes, we assume most benefits occur in
vicinity of the stations
Approach #2: Vehicle Projects
Using Class 8 truck travel data, we disaggregate benefits of vehicle-
related projects, assuming a higher penetration of truck instances per
census tract area correlates to greater benefits
Aggregate benefits to each census tract / legislative district
Overlay data of petroleum, GHG PM2.5, and NOx reduction by census tract with CalEnviroScreen 4.0 to see what percentage of
benefits occurred in disadvantaged communities
Approach #1: Approach #2:
Spatial Disaggregation:
Note: spatial analysis is limited to the Fueling Infrastructure and Vehicles
projects (~85% of funding)
NREL | 12
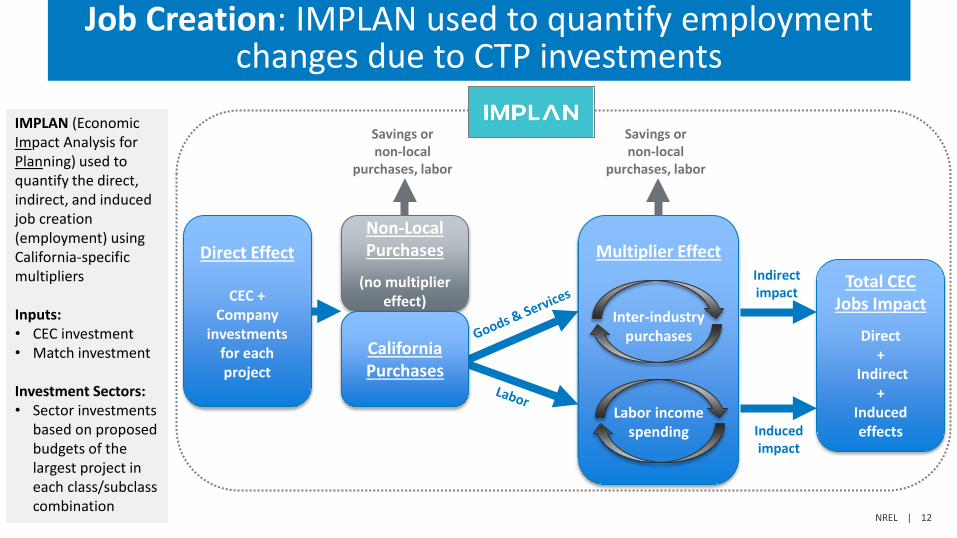
Job Creation: IMPLAN used to quantify employment changes due to CTP investments
Direct Effect
CEC + Company
investments for each project
Non-Local Purchases
(no multiplier effect)
Savings or non-local
purchases, labor
Multiplier Effect
Inter-industry purchases
Labor income spending
Savings or non-local
purchases, labor
Indirect impact
Induced impact
Total CEC Jobs Impact
Direct +
Indirect +
Inducedeffects
IMPLAN (Economic Impact Analysis for Planning) used to quantify the direct, indirect, and induced job creation (employment) using California-specific multipliers
Inputs: • CEC investment• Match investment
Investment Sectors:• Sector investments
based on proposed budgets of the largest project in each class/subclass combination
California Purchases
NREL | 13
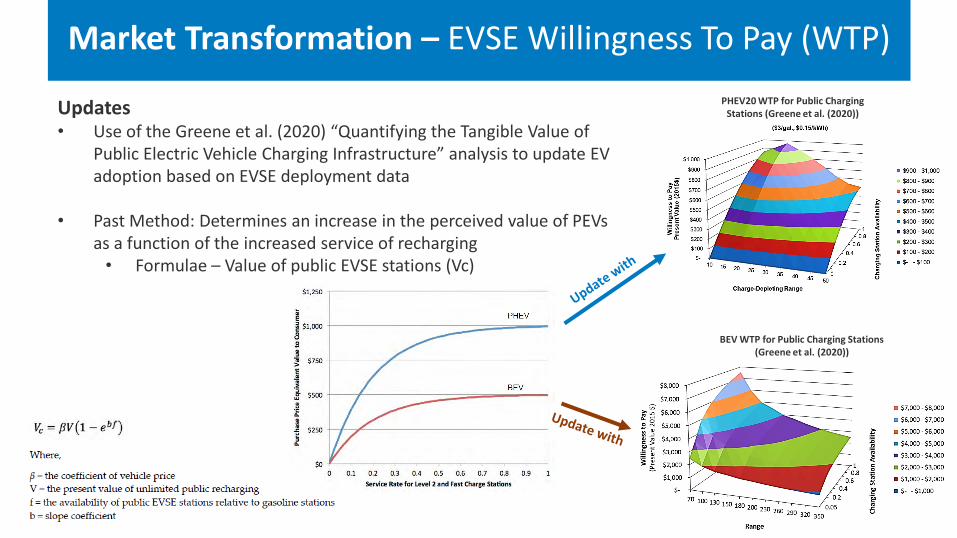
Market Transformation – EVSE Willingness To Pay (WTP)
Updates• Use of the Greene et al. (2020) “Quantifying the Tangible Value of
Public Electric Vehicle Charging Infrastructure” analysis to update EV adoption based on EVSE deployment data
• Past Method: Determines an increase in the perceived value of PEVs as a function of the increased service of recharging
• Formulae – Value of public EVSE stations (Vc)
PHEV20 WTP for Public Charging Stations (Greene et al. (2020))
BEV WTP for Public Charging Stations (Greene et al. (2020))
NREL | 14
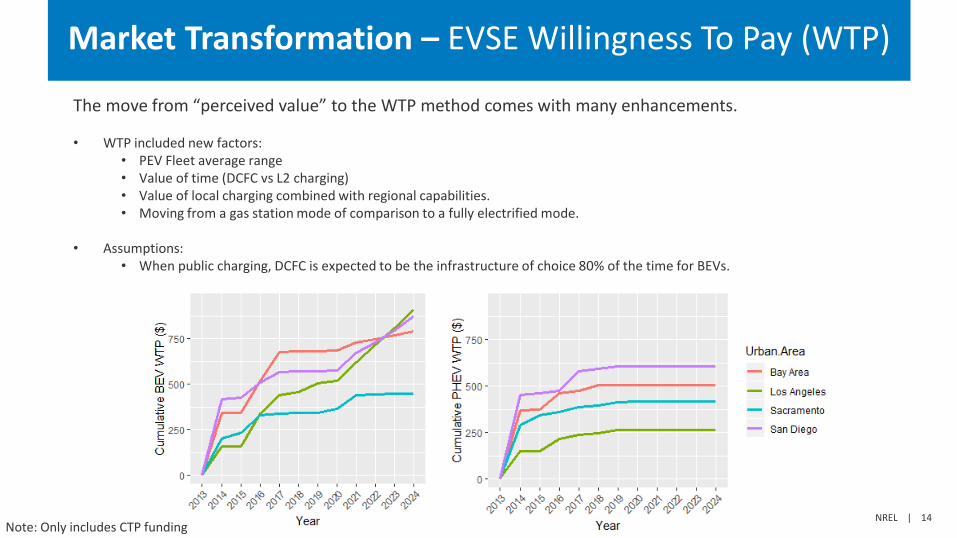
Market Transformation – EVSE Willingness To Pay (WTP)
The move from “perceived value” to the WTP method comes with many enhancements.
• WTP included new factors:• PEV Fleet average range• Value of time (DCFC vs L2 charging)• Value of local charging combined with regional capabilities.• Moving from a gas station mode of comparison to a fully electrified mode.
• Assumptions:• When public charging, DCFC is expected to be the infrastructure of choice 80% of the time for BEVs.
Note: Only includes CTP funding
NREL | 15
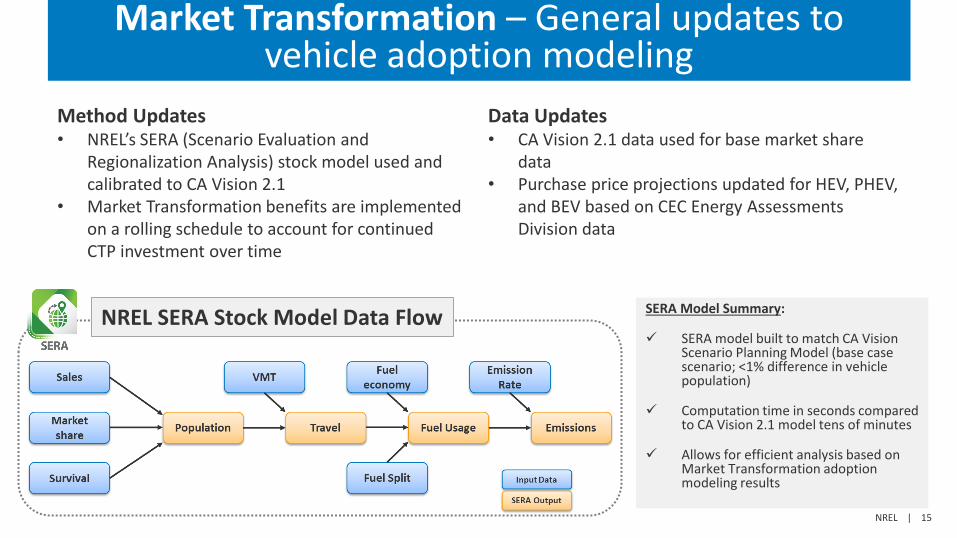
Market Transformation – General updates to vehicle adoption modeling
Method Updates• NREL’s SERA (Scenario Evaluation and
Regionalization Analysis) stock model used and calibrated to CA Vision 2.1
• Market Transformation benefits are implemented on a rolling schedule to account for continued CTP investment over time
Data Updates• CA Vision 2.1 data used for base market share
data• Purchase price projections updated for HEV, PHEV,
and BEV based on CEC Energy Assessments Division data
NREL SERA Stock Model Data Flow SERA Model Summary:
SERA model built to match CA Vision Scenario Planning Model (base case scenario; <1% difference in vehicle population)
Computation time in seconds compared to CA Vision 2.1 model tens of minutes
Allows for efficient analysis based on Market Transformation adoption modeling results
Executive Summary – IEPR Workshop
OverviewMethods UpdatesExpected Benefits ResultsMarket Transformation Results

NREL | 17
CTP Project Funding Summary
$934M accounted for (vs $671M in the 2019 CTP Benefits Report)
NREL | 18
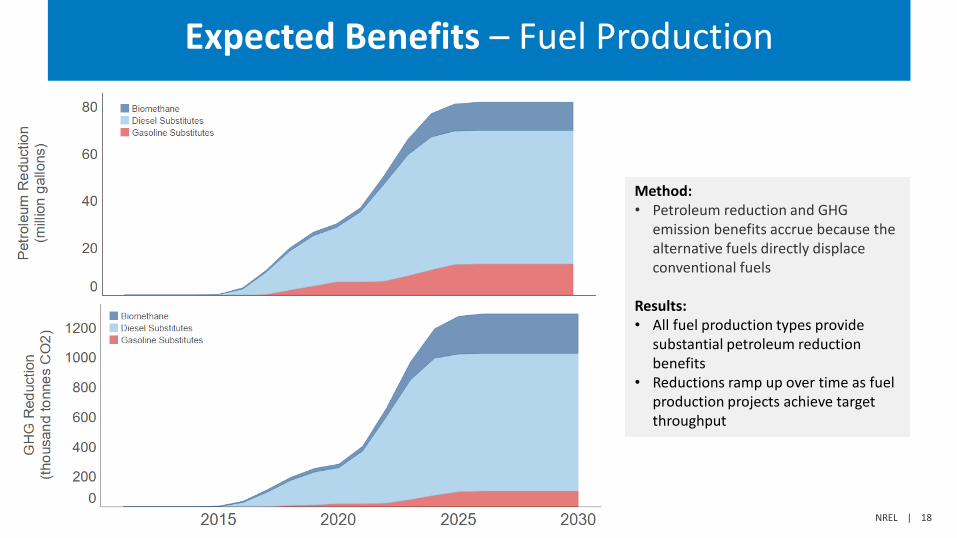
Expected Benefits – Fuel Production
Method: • Petroleum reduction and GHG
emission benefits accrue because the alternative fuels directly displace conventional fuels
Results: • All fuel production types provide
substantial petroleum reduction benefits
• Reductions ramp up over time as fuel production projects achieve target throughput
NREL | 19
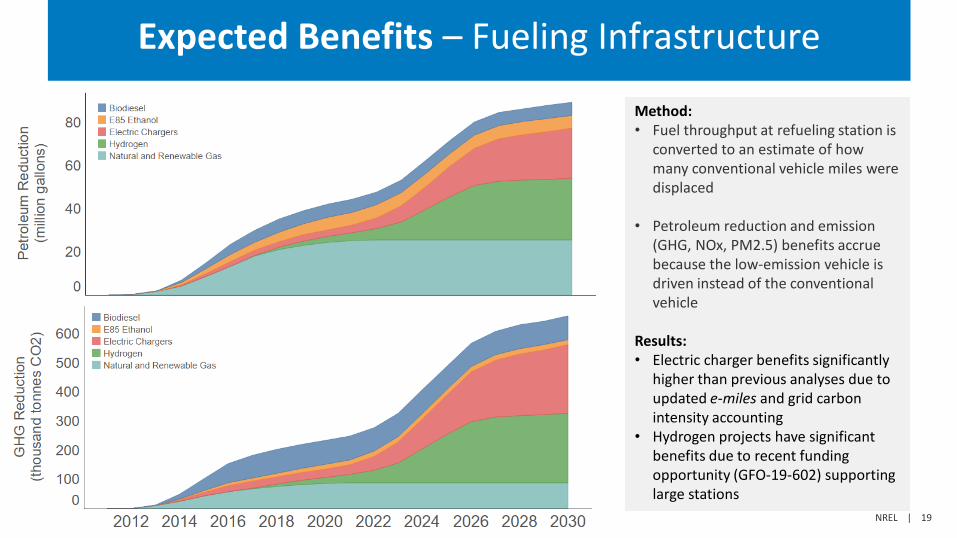
Expected Benefits – Fueling Infrastructure
Method: • Fuel throughput at refueling station is
converted to an estimate of how many conventional vehicle miles were displaced
• Petroleum reduction and emission (GHG, NOx, PM2.5) benefits accrue because the low-emission vehicle is driven instead of the conventional vehicle
Results: • Electric charger benefits significantly
higher than previous analyses due to updated e-miles and grid carbon intensity accounting
• Hydrogen projects have significant benefits due to recent funding opportunity (GFO-19-602) supporting large stations
NREL | 20
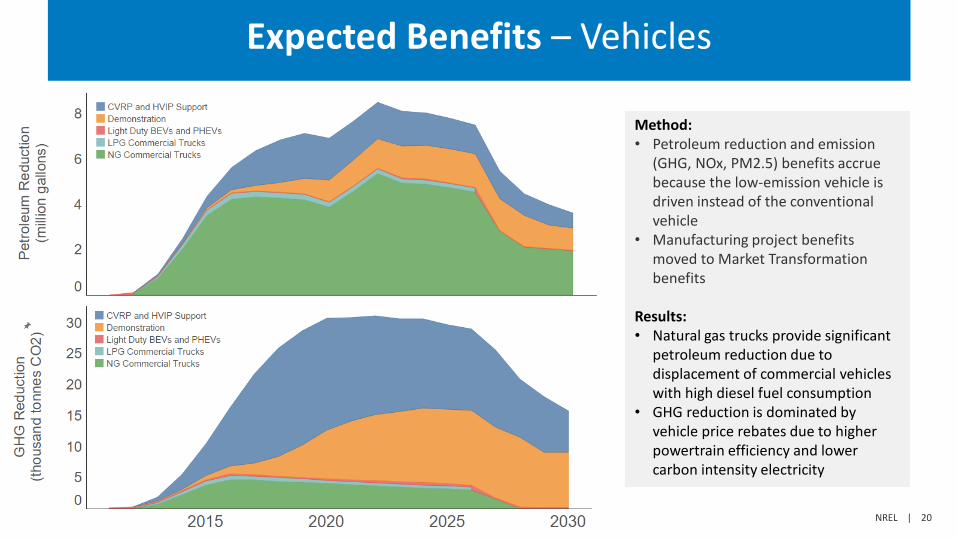
Expected Benefits – Vehicles
Method: • Petroleum reduction and emission
(GHG, NOx, PM2.5) benefits accrue because the low-emission vehicle is driven instead of the conventional vehicle
• Manufacturing project benefits moved to Market Transformation benefits
Results: • Natural gas trucks provide significant
petroleum reduction due to displacement of commercial vehicles with high diesel fuel consumption
• GHG reduction is dominated by vehicle price rebates due to higher powertrain efficiency and lower carbon intensity electricity
NREL | 21
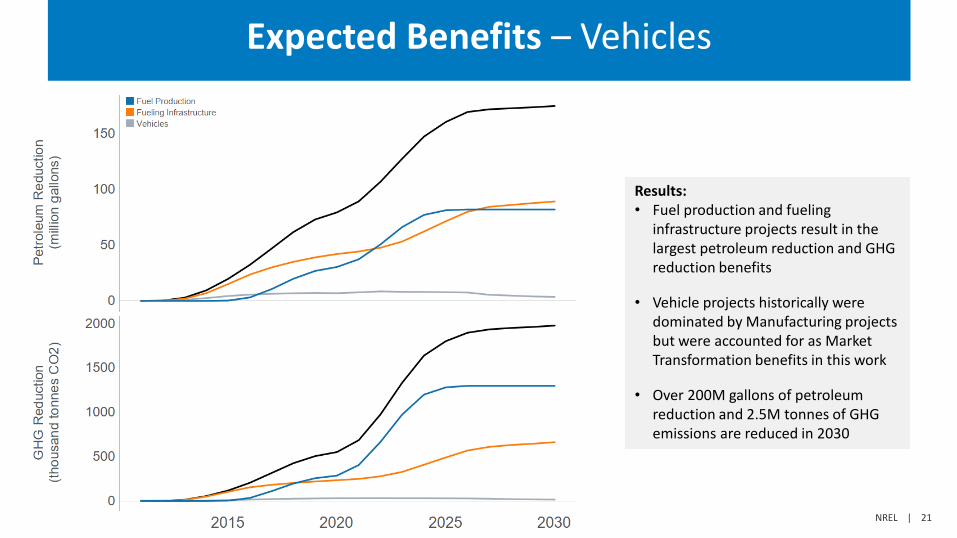
Expected Benefits – Vehicles
Results: • Fuel production and fueling
infrastructure projects result in the largest petroleum reduction and GHG reduction benefits
• Vehicle projects historically were dominated by Manufacturing projects but were accounted for as Market Transformation benefits in this work
• Over 200M gallons of petroleum reduction and 2.5M tonnes of GHG emissions are reduced in 2030
NREL | 22
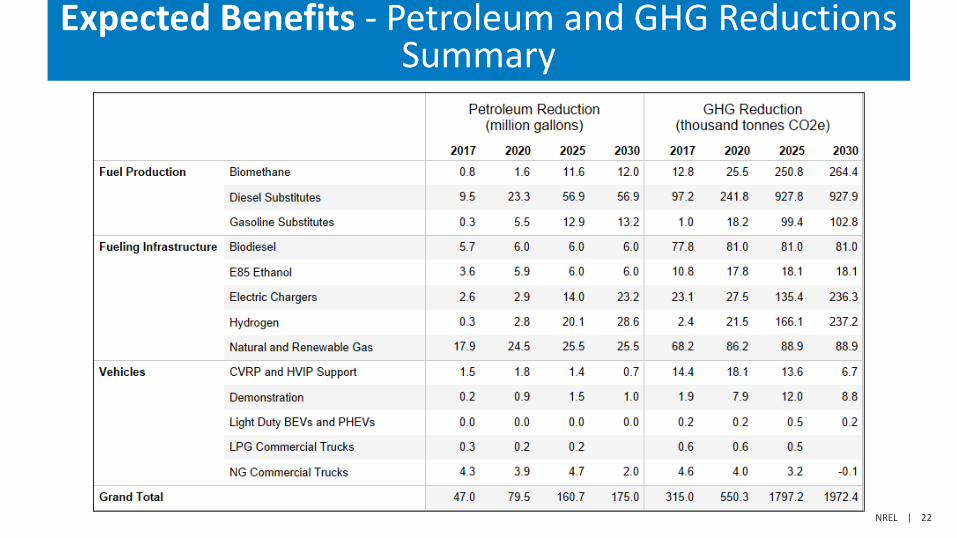
Expected Benefits - Petroleum and GHG Reductions Summary
NREL | 23
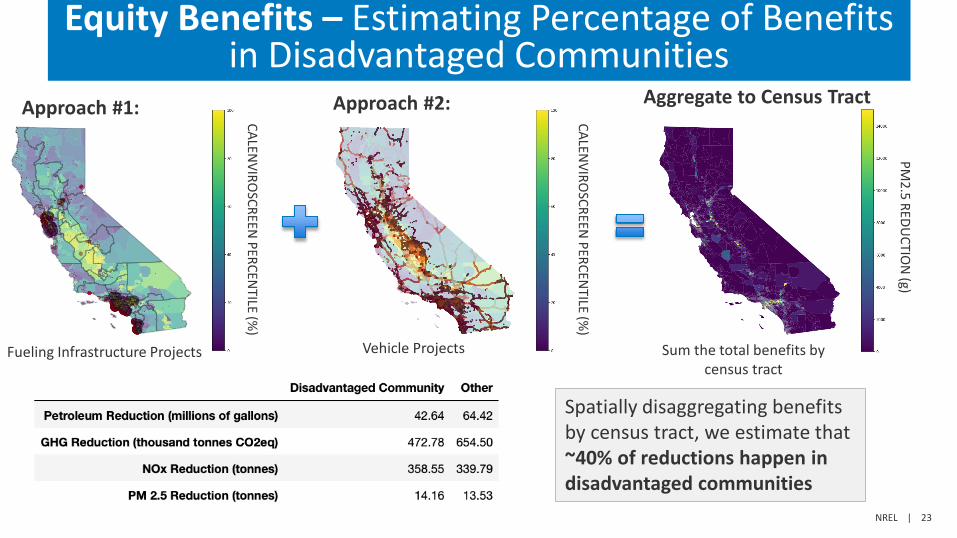
Equity Benefits – Estimating Percentage of Benefits in Disadvantaged Communities
Spatially disaggregating benefits by census tract, we estimate that ~40% of reductions happen in disadvantaged communities
CALENVIRO
SCREEN PERCEN
TILE (%)
CALENVIRO
SCREEN PERCEN
TILE (%)
Approach #1: Approach #2:
PM2.5 REDU
CTION
(g)
Aggregate to Census Tract
Fueling Infrastructure Projects Vehicle Projects Sum the total benefits by census tract
NREL | 24
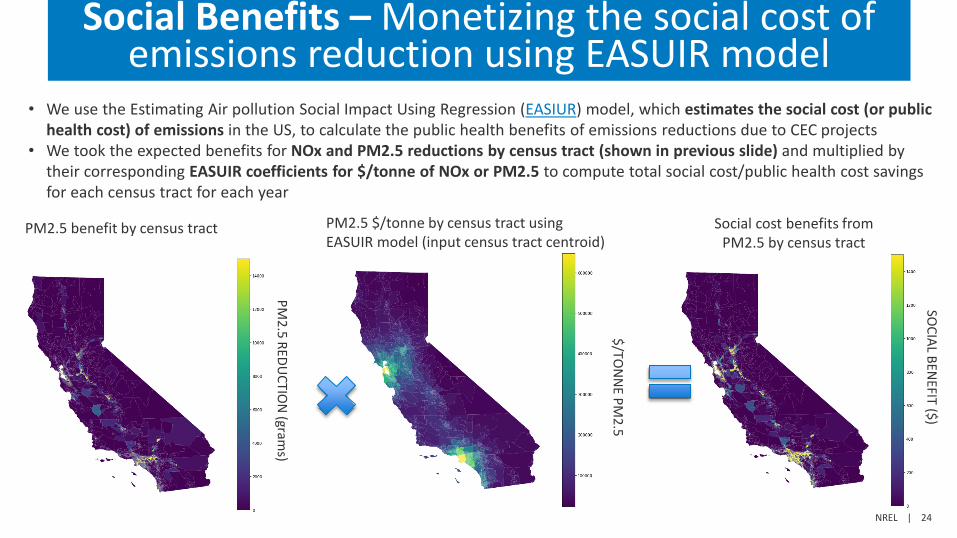
Social Benefits – Monetizing the social cost of emissions reduction using EASUIR model
• We use the Estimating Air pollution Social Impact Using Regression (EASIUR) model, which estimates the social cost (or public health cost) of emissions in the US, to calculate the public health benefits of emissions reductions due to CEC projects
• We took the expected benefits for NOx and PM2.5 reductions by census tract (shown in previous slide) and multiplied by their corresponding EASUIR coefficients for $/tonne of NOx or PM2.5 to compute total social cost/public health cost savings for each census tract for each year
PM2.5 $/tonne by census tract using EASUIR model (input census tract centroid)
PM2.5 benefit by census tract Social cost benefits from PM2.5 by census tract
$/TON
NE PM
2.5
PM2.5 REDU
CTION
(grams)
SOCIAL BEN
EFIT ($)
NREL | 25
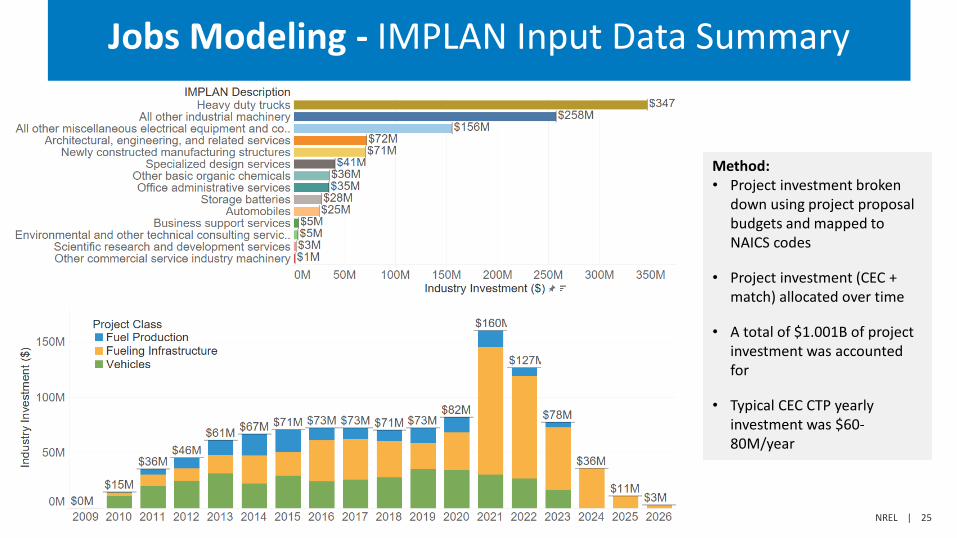
Jobs Modeling - IMPLAN Input Data Summary
Method: • Project investment broken
down using project proposal budgets and mapped to NAICS codes
• Project investment (CEC + match) allocated over time
• A total of $1.001B of project investment was accounted for
• Typical CEC CTP yearly investment was $60-80M/year
NREL | 26
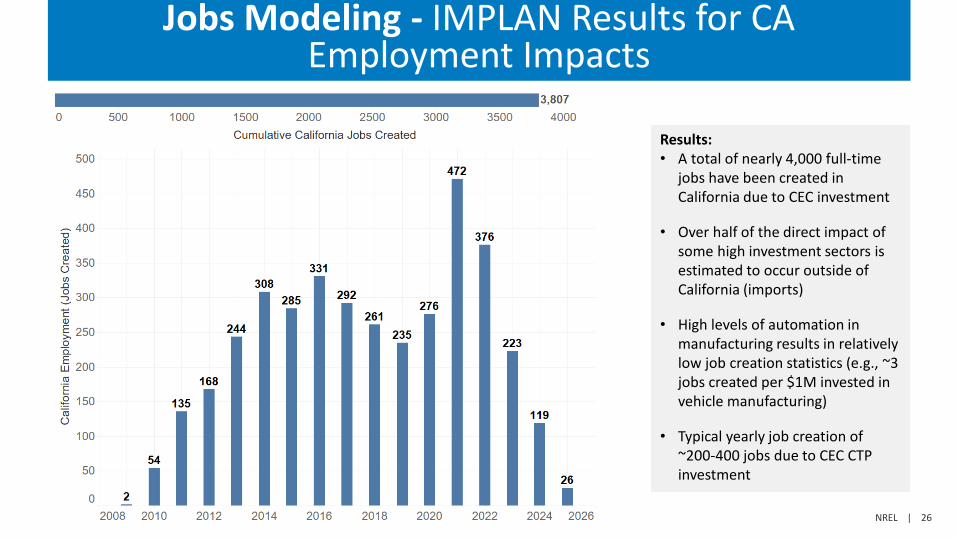
Jobs Modeling - IMPLAN Results for CA Employment Impacts
Results: • A total of nearly 4,000 full-time
jobs have been created in California due to CEC investment
• Over half of the direct impact of some high investment sectors is estimated to occur outside of California (imports)
• High levels of automation in manufacturing results in relatively low job creation statistics (e.g., ~3 jobs created per $1M invested in vehicle manufacturing)
• Typical yearly job creation of ~200-400 jobs due to CEC CTP investment
Executive Summary – IEPR Workshop
OverviewMethods UpdatesExpected Benefits ResultsMarket Transformation Results
NREL | 28
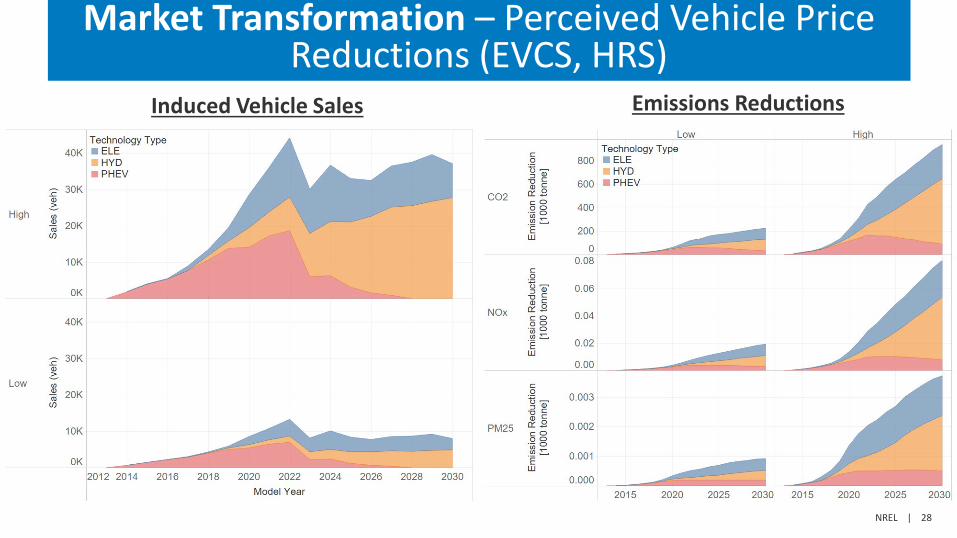
Market Transformation – Perceived Vehicle Price Reductions (EVCS, HRS)
Induced Vehicle Sales Emissions Reductions
NREL | 29
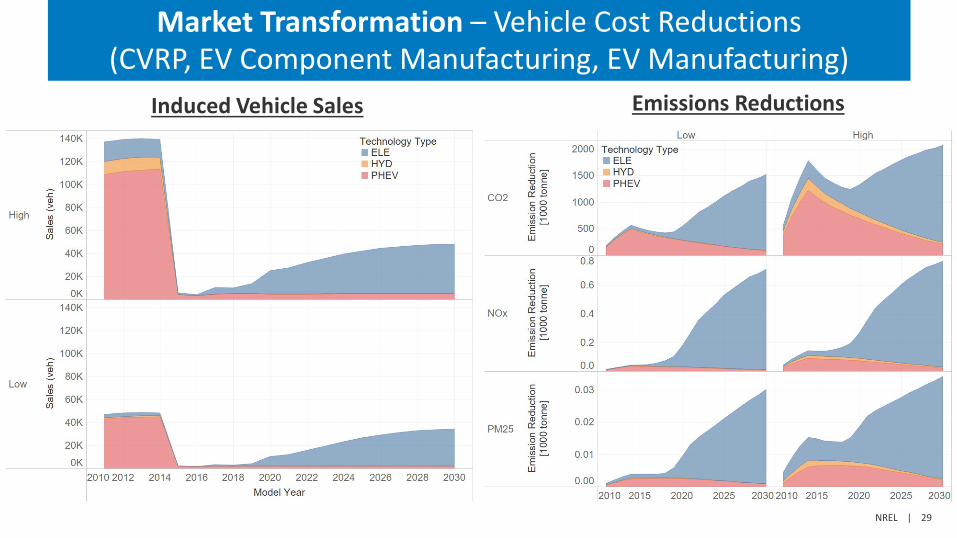
Market Transformation – Vehicle Cost Reductions (CVRP, EV Component Manufacturing, EV Manufacturing)
Induced Vehicle Sales Emissions Reductions
NREL | 30
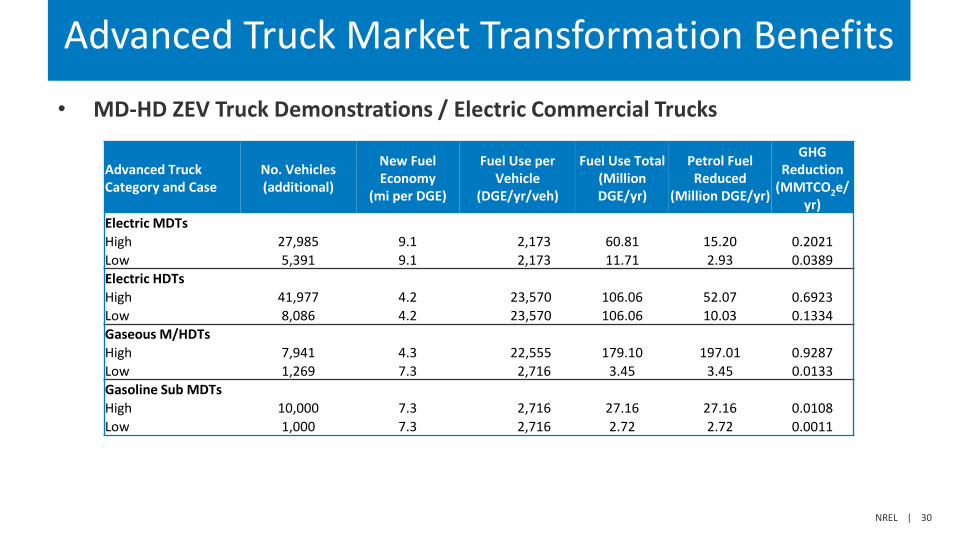
Advanced Truck Market Transformation Benefits
• MD-HD ZEV Truck Demonstrations / Electric Commercial Trucks
Advanced Truck Category and Case
No. Vehicles (additional)
New Fuel Economy
(mi per DGE)
Fuel Use per Vehicle
(DGE/yr/veh)
Fuel Use Total (Million DGE/yr)
Petrol Fuel Reduced
(Million DGE/yr)
GHG Reduction
(MMTCO2e/yr)
Electric MDTsHigh 27,985 9.1 2,173 60.81 15.20 0.2021Low 5,391 9.1 2,173 11.71 2.93 0.0389Electric HDTsHigh 41,977 4.2 23,570 106.06 52.07 0.6923Low 8,086 4.2 23,570 106.06 10.03 0.1334Gaseous M/HDTsHigh 7,941 4.3 22,555 179.10 197.01 0.9287Low 1,269 7.3 2,716 3.45 3.45 0.0133Gasoline Sub MDTsHigh 10,000 7.3 2,716 27.16 27.16 0.0108Low 1,000 7.3 2,716 2.72 2.72 0.0011
NREL | 31
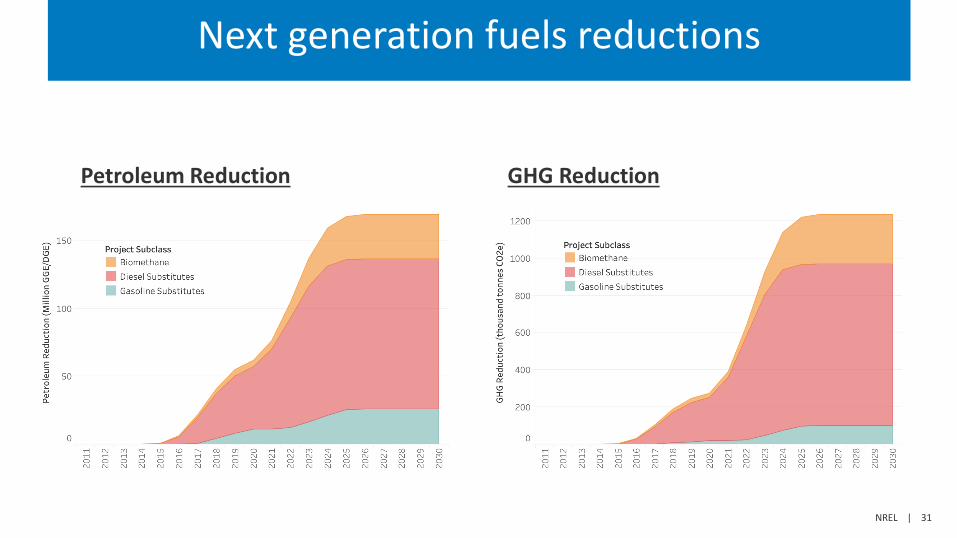
Next generation fuels reductions
Petroleum Reduction GHG Reduction

NREL | 32
Market Transformation Results Summary (2030)Market
Transformation Influence
Case Petroleum Displacement (M gal)
GHG Reduction (thousand tonnes
CO2e)
NOx Reduction (tonnes)
PM 2.5 Reduction (tonnes)
Perceived Vehicle Price Reductions High 75 974 84 3.9Perceived Vehicle Price Reductions Low 19 237 20 1Vehicle Cost Reduction High 120 2064 767 34.1Vehicle Cost Reduction Low 71 1522 707 30.2Next-Generation Trucks High 292 1825 NA NANext-Generation Trucks Low 19 187 NA NANext-Generation Fuels High 237 1630 NA NANext-Generation Fuels Low 59 404 NA NA
Total High 724 6493 851 38
Total Low 168 2350 727 31