Embed Size (px)
Citation preview

National Pollutant Discharge Elimination System (NPDES)/
State Disposal System (SDS) Permit Program Fact Sheet
Permit Reissuance
MN0020222
Permittee: City of Saint Michael 11800 Town Center Dr NE Ste 300 Saint Michael, Minnesota 55376
Facility name: Saint Michael Wastewater Treatment Facility 3320 Lander Ave NE Saint Michael, Minnesota 55376
Current permit expiration date: June 30, 2015
Public comment period begins:
Public comment period ends:
Receiving water:
Permitting contact:
September 13, 2017
November 13, 2017
CrowRiver ‐ Class2B,3C,4A,4B,5,6water
HollyMikkelson714LakeAvenue,Suite220DetroitLakes,MN56501218‐846‐[email protected]

Table of Contents Page
Purposeandparticipation................................................................................................................................................................................... 3
Applicable statutes.............................................................................................................................................................................................. 3
Receivingwater(s)................................................................................................................................................................................................11
Use classification ...............................................................................................................................................................................................11
Impairments ........................................................................................................................................................................................................11
Existingpermiteffluentlimits .........................................................................................................................................................................11
Technology based effluent limits (TBELs) ................................................................................................................................................11
State Discharge Restrictions (SDRs)...........................................................................................................................................................11
Water quality based effluent limits (WQBELs).......................................................................................................................................11
Proposedpermiteffluentlimits ......................................................................................................................................................................13
Technology based effluent limits .................................................................................................................................................................13
State Discharge Restrictions (SDRs)...........................................................................................................................................................13
Additionalrequirements....................................................................................................................................................................................21
Compliance Schedule........................................................................................................................................................................................23
Variances ..............................................................................................................................................................................................................23
Totalfacilityrequirements(TFR)...................................................................................................................................................................23
Nondegredationandanti‐backsliding ..........................................................................................................................................................23
Purpose.................................................................................................................................................................................................................... 3
Public participation ............................................................................................................................................................................................ 3
FacilityDescription................................................................................................................................................................................................. 5
Components and treatment technology ...................................................................................................................................................... 5
Facility and outfall location............................................................................................................................................................................. 5
Map of permitted facility .................................................................................................................................................................................. 6
Flow schematic ..................................................................................................................................................................................................... 7
Changes to facility or operation..................................................................................................................................................................... 8
Recent compliance history ............................................................................................................................................................................... 8
Table 1. Recent monitoring history............................................................................................................................................................... 9
Water quality based limits .............................................................................................................................................................................14
Table 5: SD001 Proposed Effluent Limits and Monitoring Requirements .......................................................................................20

NPDES/SDSPermitProgram Fact Sheet MN0020222 Permit Reissuance Page 3 of 21
Purpose and participation
Applicable statutes This fact sheet has been prepared according to the 40 CFR § 124.8 and 124.56 and Minn R. 7001.0100, subp. 3 in regards to a draft National Pollutant Discharge Elimination System (NPDES)/State Disposal System (SDS) permit to construct and/or operate wastewater treatment facilities and to discharge into waters of the State of Minnesota.
Purpose This fact sheet outlines the principal issues related to the preparation of this draft permit and documents the decisions that were made in the determination of the effluent limitations and conditions of this permit.
Public participation You may submit written comments on the terms of the draft permit or on the Commissioner’s preliminary determination. Your written comments must include the following:
1. A statement of your interest in the permit application or the draft permit. 2. A statement of the action you wish the Minnesota Pollution Control Agency (MPCA) to take, including specific
references to sections of the draft permit that you believe should be changed. 3. The reasons supporting your position, stated with sufficient specificity as to allow the Commissioner to
investigate the merits of your position.
You may also request that the MPCA Commissioner hold a public informational meeting. A public informational meeting is an informal meeting which the MPCA may hold to help clarify and resolve issues.
In accordance with Minn. R. 7000.0650 and Minn. R. 7001.0110, your petition requesting a public informational meeting must identify the matter of concern and must include the following: items one through three identified above; a statement of the reasons the MPCA should hold the meeting; and the issues you would like the MPCA to address at the meeting.
In addition, you may submit a petition for a contested case hearing. A contested case hearing is a formal hearing before an administrative law judge. Your petition requesting a contested case hearing must include a statement of reasons or proposed findings supporting the MPCA decision to hold a contested case hearing pursuant to the criteria identified in Minn. R. 7000.1900, subp. 1 and a statement of the issues proposed to be addressed by a contested case hearing and the specific relief requested. To the extent known, your petition should include a proposed list of witnesses to be presented at the hearing, a proposed list of publications, references or studies to be introduced at the hearing, and an estimate of time required for you to present the matter at hearing.
You must submit all comments, requests, and petitions during the public comment period identified on page one of this notice. All written comments, requests, and petitions received during the public comment period will be considered in the final decisions regarding the permit. If the MPCA does not receive any written comments, requests, or petitions during the public comment period, the Commissioner or other MPCA staff as authorized by the Commissioner will make the final decision concerning the draft permit.
Comments, petitions, and/or requests must be submitted by the last day of the public comment period to:
Holly Mikkelson Minnesota Pollution Control Agency 714 Lake Avenue, Ste 220 Detroit Lakes, MN 56501

NPDES/SDSPermitProgram Fact Sheet MN0020222 Permit Reissuance Page 4 of 21
The permit will be reissued if the MPCA determines that the proposed Permittee or Permittees will, with respect to the facility or activity to be permitted, comply or undertake a schedule to achieve compliance with all applicable state and federal pollution control statutes and rules administered by the MPCA and the conditions of the permit and that all applicable requirements of Minn. Stat. ch. 116D and the rules promulgated thereunder have been fulfilled.
More detail on all requirements placed on the facility may be found in the Permit document.

NPDES/SDSPermitProgram Fact Sheet MN0020222 Permit Reissuance Page 5 of 21
Facility Description
TheFacilityconsistsofaninfluent wetweather pumpingstation,mechanicalbar screen,flowsplitter,twoextended aeration basins followedby clarifiersdesignedtotreat 1/3 ofthe design flow, two880,000 gallon sequencing batchreactor (SBR)tanks capable of biologicalphosphorusremoval,and one 369,000 gallonsurge tank.TheSBReffluent flowsto one70‐footdiametertertiary clarifier,achemicalfeed systemforphosphorusremoval,anultraviolet(UV)lightdisinfectionsystem,andan effluentaerationcascadestructureforfinaldischargetothe Crow River.SBRandtertiaryclarifiersolids arestored inone 471,000gallon sludgestoragetankfor thickening andappliedto 16reedbed biosolidsstabilizationcells.ThisisaClassBFacility.
The Facility hasa continuousdischarge(SD001) tothe CrowRiver(Class 2B,3C,4A, 4B, 5,6 Water) andis designedtotreat an averageannual wetweather flow of 2.445 million gallonsperday(mgd),a peak hourlywet weatherflow of 6.4 mgdand an averageannualdryweather flow of2.077mgd.TheFacilityisalsodesignedto treat aninfluentloadof4,250pounds perday (lbs/day)of 5‐daycarbonaceousbiochemicaloxygendemand(CBOD5),4,500lbs/dayoftotalsuspendedsolids(TSS),600lbs/dayoftotal Kjeldahlnitrogen(TKN) and200 lbs/dayoftotalphosphorus.
The MPCA hasevaluated thetreatment componentsofthe Facility withregardstothetotal phosphorusmasslimits inthe permit. Atthe time ofpermitissuance,the facilityis operatingat less thanthepermittedAWWDFof 2.445 mgd andisdemonstrating the capabilityof meetingthetotalphosphoruseffluent limitsof 5.18 kg/day(calendarmonth average)and2,702kg/yr(12month movingtotal).Asthe facilityapproachesit’sAWWDFitmayneedinfrastructure improvementsand/oroperational changes tomaintaincompliance.Requirements 5.3.33 and 5.3.34 ofthispermit includeadditionalreportingrequirementstoassurecompliancewiththephosphoruseffluent limits asthe facility’sinfluentflowsand/or pollutantloadingsincrease.
Components and treatment technologyMajorcomponents ofthefacilityinclude:•Activated Sludge‐ extendedaeration•Activated Sludge‐sequencing batch reactor•Collectionsystem(gravity and/or pressure)•Disinfection(ultravioletlight)•PhosphorusRemoval (chemicaladdition)•Postaeration(lessthan twohoursdetention)•Preliminary treatment‐flowequalization •Preliminary treatment‐mechanical barscreen•Secondary Clarification•SolidsHandling‐Reed Beds•SolidsHandling–2 Storage Tanks• TertiaryClarification
Facility and outfall locationThe Facilityislocated at 3320 Lander Ave NE,Saint Michael,Minnesota 55376, Wright County.Theoutfall(SD001) islocatedin theSE QuarterofSection 13, Township120North, Range 24 West.

NPDES/SDSPermitProgram Fact Sheet MN0020222 Permit Reissuance Page 6 of 21
Map of permitted facility

NPDES/SDSPermitProgram Fact Sheet MN0020222 Permit Reissuance Page 7 of 21
Flow schematic

NPDES/SDSPermitProgram Fact Sheet MN0020222 Permit Reissuance Page 8 of 21
Changes to facility or operationThisdraft permitcontains acompliancescheduleforthefacility to meet a newcopperlimit.Shouldthefacility not be able to meetthe newlimitbycompletingsource reduction or operational changes,facilitymodificationswillbe required.Seethecompliancescheduleinthedraft permit forcompletedetails.
Significant industrial users (SIUs) The Facility does not accept wastewater from any SIUs.
Recent compliance history The Facility was last inspected on September 28, 2015 which included a visual inspection and a review of the monthly Discharge Monitoring Reports for the time period of September 2012 through September 2015. The results of the inspection showed two violations: two late submittals of discharge monitoring reports and failure to maintain records for a minimum of three years as required. The Permittee completed the corrective actions and was returned to compliance on January 29, 2016.

NPDES/SDSPermitProgram Fact Sheet MN0020222 Permit Reissuance Page 9 of 21
Table 1. Recent monitoring history
Parameter Desc Limit Units Nov Dec Jan Feb Mar Apr May Jun Jul Aug Sep Oct Bicarbonates (HCO3) mg/L 412 401 425 406 430 391 428 421 396 417 405 439 CBOD5 15 mg/L 2.2 1.6 1.9 1.9 3 3 2 3 CBOD5 25 mg/L 1.1 1.5 2.5 2 CBOD5 138.6 kg/d 8.6 5.7 7.2 7.1 11.3 11 9.1 11.8 CBOD5 231 kg/d 4.6 5.4 10.7 8.9 CBOD5 25 mg/L 3.9 2.1 3.2 3.4 5 4 4 4 CBOD5 40 mg/L 1.5 1.9 2.9 2.5 CBOD5 231 kg/d 14.9 7.7 13.2 12.9 17.7 13 13.5 21.7 CBOD5 369.6 kg/d 6.9 7.7 16.6 10.6 CBOD5 % Removal 85 % 99.5 99.1 99.6 99.5 99.5 99.5 99 97.1 98 98.9 98.5 98.8 Calcium, Total mg/L 100 97 102 96.2 93.7 91.6 96.8 96 102 91.2 85.4 99.3 Chloride, Total mg/L 522 599 564 604 607 582 532 693 821 569 530 505 Fecal Coliform 200 #/100ml 10 6.3 16 10 5 30 76 Effluent Flow mgd 1.043 1.018 0.976 0.966 0.957 0.963 0.99 0.971 0.93 1.04 1.061 1.023 Effluent Flow Mgal 31.301 31.551 30.27 28.028 29.672 28.895 30.69 29.115 28.842 32.2554 31.816 31.703 Hardness, Calcium & Magnesium
mg/L 414 393 406 387 385 383 394 400 419 396 349 379
Magnesium, Total mg/L 40 37 37 35.6 36.7 37.4 36.9 39 39.7 41 32.9 31.8 Mercury, Dissolved ng/L 0.5 0.5 0.5 0.5 Mercury, Total ng/L 0.5 0.937 0.791 0.5 Nitrite Plus Nitrate, Total
mg/L 6.15 5.46
Nitrogen, Ammonia, Total
kg/d 1.35 1 1.64 0.99
Nitrogen, Ammonia, Total
mg/L 0.3 0.3 0.37 0.27
Nitrogen, Ammonia, Total
3 mg/L 0.7 0.4 0.5 0.823
Nitrogen, Ammonia, Total
5 mg/L 0.94 0.9 2.1 2.8
Nitrogen, Ammonia, Total
27.7 kg/d 2.7 1.4 1.74 3.29
Nitrogen, Ammonia, Total
46.2 kg/d 3.78 3.41 8.14 10.4

NPDES/SDSPermitProgram Fact Sheet MN0020222 Permit Reissuance Page 10 of 21
Nitrogen, Kjeldahl, Total
mg/L 1.8 2.57
Oxygen, Dissolved mg/L 9.2 9.3 9.01 8.69 Oxygen, Dissolved 5 mg/L 9.67 9.8 9.6 9.4 8.8 8.7 8.64 8.76 pH maximum 9 SU 7.4 7.5 7.6 7.5 7.5 7.5 7.5 7.5 7.43 7.44 7.46 7.6 pH minimum 6 SU 7.2 7.2 7.1 7.2 7.1 7.1 7.1 7.1 7.2 7.07 7.16 7.22 Phosphorus, Total 1 mg/L 0.7 0.6 0.75 0.7 0.7 0.7 0.7 0.7 0.683 0.65 0.6 0.63 Phosphorus, Total 3,371 kg/mo 74.28 Phosphorus, Total 3,371 kg/yr 987.46 1,008 968.54 956.3 933.7 928.5 918.43 1,160 812.24 738.26 755.1 800.99 Phosphorus, Total mg/L 0.6 0.7 0.7 0.6 0.5 0.4 0.6 0.6 0.62 0.56 0.68 0.96 Phosphorus, Total kg/mo 69.307 82.921 62.2 61.208 47.3 68.8 77.51 67.68 68.73 81.29 115.2 Potassium, Total mg/L 19.1 17.9 14.8 16.8 18.6 17.9 15 15.9 17.9 18.9 14.6 16 Sodium, Total mg/L 404 412 409 429 428 381 353 355 396 385 325 327 Solids, Total Dissolved mg/L 1,300 1,330 1,310 1,380 1,384 1,320 1,264 1,256 1,464 1,284 1,262 1,242 TSS 30 mg/L 7 8.7 9.9 11.1 10.2 8.6 7.3 7 6 5 6 8 TSS 277.3 kg/d 28.9 34.2 35.9 40.7 37.7 32 31.2 26.9 21.1 21.8 25 28.8 TSS 45 mg/L 8.5 11.5 12 14.5 13 11.5 10 9 12 6 7 11 TSS 415.9 kg/d 36.1 49.7 43 52 41.2 42.2 47 36.3 45.6 24.35 28.1 45.1 TSS % Removal 85 % 98.7 98.5 99 98.9 99.4 98.6 97.1 96.5 98.1 98 97.6 97.4 TSS, grab (Mercury) mg/L 9 15 8 7 Specific Conductance umhos/cm 2,260 2,290 2,210 2,360 2,390 2,230 2,020 2,100 2,330 2,260 2,200 2,220 Sulfate, Total mg/L 19 17.9 15 78.1 92.7 89.6 15 108 95.5 88.5 15.2 67.1

NPDES/SDSPermitProgram Fact Sheet MN0020222 Permit Reissuance Page 11 of 21
Receiving water(s)
Use classification This Facility discharges to the Crow River. This reach is classified as a 2B, 3C, 4A, 4B, 5 and 6 Water. This classification indicates that the body of water is capable of sustaining aquatic life and recreation. More information on the classification of waters can be found in Minn. R. 7050.0140.
Impairments Downstream impairments in the Crow River include fecal coliform, turbidity, nutrients, fishes bioassessments, and aquatic macroinvertebrate bioassessments. Following are the Total Maximum Daily Load (TMDL) Studies currently approved or underway (including wasteload allocations) to address these impairments.
Wasteload Allocations (WLAs): North Fork Lower Crow River Bacteria, Turbidity and Dissolved Oxygen TMDL WLA for E. coli = 11.7 billion organisms per day April through October (Table 2.6, page 2‐8)
The load allocation was calculated using the facility’s design flow and the E. coli standard of 126 cfu/100 ml. The WLA is equivalent to the permit’s 200 organisms/100 ml fecal coliform effluent limit at design flow (mgd).
WLA for TSS = 0.306 tons per day (Table 3.6, page 3‐10) 0.306 tons per day = 277.7 kg/day The load allocation was calculated using the facility’s design flow and the permitted TSS concentration limit. The WLA is equivalent to the Facility’s current permitted TSS effluent limit.
Mercury in Fish Tissue and Mercury in Water Column Impairments Permit limits and monitoring requirements should be in accordance with the Permit Writers Guidance for
implementing the Mercury Permitting Strategy.
South Metro Mississippi TMDL Turbidity Impairment TSS WLA = 277.30 kg/day and 101,215 kg/year (Appendix A, page 101). The WLA is equivalent to the Facility’s
current permitted TSS effluent limit and no reductions are required (page 77).
Draft Lake Pepin – Excess Nutrients TMDL A water quality based effluent limit has been derived from the draft WLA.
Existing permit effluent limits Technology based effluent limits (TBELs) The total suspended solids (TSS), potential for hydrogen (pH), and the percent removal limits are technology based limits developed for achieving secondary treatment standards. These limits are specified in 40 CFR §133.102 and Minn. R. 7050.0211 and Minn. R. 7053.0215
State Discharge Restrictions (SDRs) Following are the parameters with SDRs: fecal coliform and phosphorus (1.0 mg/L 12 month moving average). These limits are specified in 7053.0215 and Minn. R. 7053.0255.
Water quality based effluent limits (WQBELs) WQBELs in the existing permit have been developed for five‐day carbonaceous biochemical oxygen demand (CBOD5), ammonia nitrogen (December through March and June through September), dissolved oxygen (December through March), and phosphorus (3,371 kg/yr January through December). These limits are determined necessary to protect the

NPDES/SDSPermitProgram Fact Sheet MN0020222 Permit Reissuance Page 12 of 21
use classification of the receiving water and downstream waterbodies. These limits are based on Minn. R. 7053.0235 Minn. R. 7053.0245, Minn. R. 7053.0205, Minn. R. 7053.0220, and Minn. R. 7050.0222.
Table 2. Existing Permit Effluent Limits and Monitoring Requirements

NPDES/SDSPermitProgram Fact Sheet MN0020222 Permit Reissuance Page 13 of 21
Proposed permit effluent limits This discharge is located on the Crow River. The facility has an average dry weather design flow (ADWDF) of 2.077 mgd and an average wet weather design flow (AWWDF) of 2.445 mgd. The low flow condition is defined by the once in ten‐year weekly average flow (7Q10), which is determined to be 12.1 mgd (18.8 cfs) at the discharge location.
This is a permit reissuance and no modifications were made to the wastewater treatment facility that would alter the quality of the effluent. The effluent water quality data collected in the past permit cycle were combined with the data from this permit cycle for the reasonable potential analysis.
Technology based effluent limits The total suspended solids (TSS), potential for hydrogen (pH), and the percent removal limits are technology based limits developed for achieving secondary treatment standards. These limits are specified in 40 CFR §133.102 and Minn. R. 7050.0211 and Minn. R. 7053.0215
State Discharge Restrictions (SDRs) Following are the parameters with SDRs: fecal coliform and phosphorus (1.0 mg/L 12 month moving average). These limits are specified in 7053.0215 and Minn. R. 7053.0255.
NPDES/SDSPermitProgram Fact Sheet MN0020222 Permit Reissuance Page 14 of 21
Water quality based limits WQBELs in the existing permit have been developed for five‐day carbonaceous biochemical oxygen demand (CBOD5), ammonia nitrogen (December through March and June through September), dissolved oxygen (December through March), copper, and phosphorus (5.18 kg/day June through September and 2,702 kg/yr 12 month moving total). These limits are determined necessary to protect the use classification of the receiving water and downstream waterbodies. These limits are based on Minn. R. 7053.0235 Minn. R. 7053.0245, Minn. R. 7053.0205, Minn. R. 7053.0220, and Minn. R. 7050.0222.
The 5 mg/L minimum dissolved oxygen (DO) effluent limit is intended to prevent violations of the DO water quality standard during periods of low stream flow in the summer and ice cover in the winter. Winter discharges have the potential to create lengthy DO impact zones. Under winter conditions, aquatic vegetation is either dormant or produces insignificant amounts of oxygen. A stream’s winter ice cap is a physical barrier that prevents interaction with oxygen in the atmosphere. Under such conditions, when a stream’s DO is depressed, it takes 20‐40 miles for the DO to recover to headwater concentrations. This contrasts with only 3‐6 miles for typical summer low dilution ratio conditions. The agency’s field surveys document such instances. When the DO was depressed below the 5 mg/L water quality standard, it took from 6‐20 miles before the DO concentration recovered to the 5 mg/L standard.
Ammonia nitrogen limits and CBOD5 limits are based on the nitrogen linkage. The winter and summer limits are more restrictive than in spring and fall due to the low flow characteristics in the receiving water during the winter/summer period.
Reasonable Potential Analyses The receiving water quality is part of the reasonable potential analysis. Receiving water quality data were obtained from several sources. Metal data were obtained from station S000‐615, North Fork of the Crow R. CSAH‐14 Bridge, 4 mi North of Rockford (1979‐1987); hardness, alkalinity, and specific conductance data were obtained from the whole effluent toxicity test reports (2007‐2014); chloride data were obtained from station S000‐050, South Fork of the Crow River SH‐55 at Rockford (2001‐2002); sulfate data were obtained from station S000‐164 South Fork of the Crow River 3 mi South of Delano (1969‐1976). TDS data were derived from the specific conductance.
The facility has submitted four priority pollutant scans since the last permit cycle. Most of the organic pollutants reported in the priority pollutant scans were below the respective levels of detection and reasonable potential could not be determined. Cyanide (CN), chloroform and bis(2‐Ethylhexyl) phthalate (DEHP) were below detection or not measured in the past permit cycle. In the current permit cycle, two total CN concentrations and two DEHP readings were above non detect and three chloroform readings were also above nondetect. Total CN was higher than the free CN chronic water quality standard (5.2 µg/L) and DEHP was higher than DEHP chronic water quality standard (1.9 µg/L). The draft permit requires free CN and DEHP monitoring every six months. These values need to be reported as single values. The laboratory must utilize methods that are approved for use under the Clean Water Act of 1977. Examples of these methods for free cyanide are ASTM D‐4282‐02, ASTM D‐7237‐10, and OIA‐1677‐09. The laboratory needs to use a method that has a reporting level of 10 µg/L for free cyanide. The laboratory may use EPA Method 625 for DEHP (with a method detection level around 2.5 µg/L to 5 µg/L). Total cyanide was high (highest concentration 22.7 µg/L). It is recommended that the City checks the following dischargers going into the sewer line which could contribute CN to the waste stream: plant nurseries and greenhouses; metal manufacturing shops; welding shops or electroplating shops; any kind of metal shop that hardens steel or iron. DEHP measured concentrations were high (the highest was 86.6 µg/L), most of the time when DEHP is measured in a sample, it is consequence of lab contamination.
Antimony (Sb), arsenic (As), chromium (Cr), copper (Cu), lead (Pb), nickel (Ni), silver (Ag), and zinc (Zn) were above the level of detection either in this cycle or in the past permit cycle. All but Ag were evaluated using reasonable potential procedures. There is a single Ag reading above nondetect. For pollutants that are at low enough levels not to be detected, reasonable potential to cause or contribute to a water quality standards excursion could not be determined.

NPDES/SDSPermitProgram Fact Sheet MN0020222 Permit Reissuance Page 15 of 21
The following table contains the inputs to the reasonable potential analysis for the metals mentioned above. The analysis is made with effluent data that is expressed as total metal.
Table 3. Reasonable Potential
Parameter As
(µg/L)
Cr6
(µg/L)
Cu
(µg/L)
Pb
(µg/L)
Ni
(µg/L)
Sb
(µg/L)
Zn
(µg/L)
Hg
(ng/L)
Max Measured Value
# data points
PEQ
1.7
8
3.2
1.2
8
2.3
84
8
159.6
0.49
8
0.93
9.8
8
18.6
0.38
8
0.7
50.4
8
95.8
4.8
18
6.7
Plant flow ADW (mgd) 2.08 2.08 2.08 2.08 2.08 2.08 2.08 2.08
Rec. water flow, 7Q10 (mgd) 12.13 12.13 12.13 12.13 12.13 12.13 12.13 12.13
Background conc. 3.1 0.5 0.8 0.2 1.1 0 1.7 6.9
Continuous std (cs)
292 ppm hardness
53.0 11.0 19.1 12.4 297.0 5.5 262.8 6.9
Maximum std (ms)
292 ppm hardness
360.0 16.0 48.6 319.4 3511.3 90.0 290.1 2400
Final acute value (FAV)
388 ppm hardness
720 32 127 920 8931 180 738 4900
Mass balance –cs 344.0 72.2 125.8 83.9 2022.6 37.6 1785.5 6.9
Mass balance ‐ms 2441.3 106.4 327.7 2181.0 23981.7 614.9 1972.1 16355
Coeff. of variation (CV) 0.60 0.60 0.60 0.60 0.60 0.60 0.60 0.55
Long Term Avg‐cs
Long Term Avg‐ms
181.4 38.1 66.4 44.2 1066.8 19.8 941.7 5.5
783.9 34.2 105.2 700.3 7700.4 197.4 633.2 5625
Preliminary Effl. limits:
Daily max.
Monthly avg. (2x/month)
565
326
106
61
207
119
138
80
3322
1918
62
36
1972
1138
16
9.5
Reasonable Potential

NPDES/SDSPermitProgram Fact Sheet MN0020222 Permit Reissuance Page 16 of 21
PEQ>Daily max.
PEQ>Monthly avg.
PEQ> FAV
Final Reasonable Potential
FALSE
FALSE
FALSE
No
FALSE
FALSE
FALSE
No
FALSE
TRUE
FALSE
Yes
FALSE
FALSE
FALSE
No
FALSE
FALSE
FALSE
No
FALSE
FALSE
FALSE
No
FALSE
FALSE
FALSE
No
FALSE
FALSE
FALSE
No
In the table above Sb, As, Cr, Pb, Ni, Ag, and Zn indicated no reasonable potential to cause or contribute to an excursion above the applicable water quality standard. No effluent limits are needed. All pollutants can be monitored at the frequency specified by the priority pollutant scans in the reissued permit. On the other hand, Cu indicates reasonable potential and a daily maximum limit (207 ug/L) and an average monthly limit (119 ug/L) are needed. Copper will need to be sampled monthly, January through December.
The facility collected 60 effluent samples to monitor the salty parameters during the past permit cycle and measured bicarbonates, hardness, chloride (Cl‐), sulfate (SO4
2‐), total dissolved solids (TDS) and specific conductance. The reasonable potential analysis was done (see the next table) and none of the analytes showed reasonable potential to cause an exceedance of their respective water quality standard. No limits are needed.
Table 4. Salty Discharge Parameters, Reasonable Potential
Parameter
Bicarbonates
as HCO3
(meq/L)
Hardness
(mg/L)
Class 2
Cl
(mg/L)
Class 3
Cl
(mg/L)
Sulfate
(mg/L)
TDS
(mg/L)
Specific
conductance
(umhos/cm)
WET
(TUc)
Max. measured
Value
# data points
PEQ
10.6
60
10.6
442
60
442
786
60
786
786
60
786
346
60
346
1492
60
1492
2710
60
2710
1.16
9
1.28
Plant flow ADW
(mgd) 2.08 2.08 2.08 2.08 2.08 2.08 2.08 2.08
Rec. water flow,
7Q10 (mgd) 12.1 12.1 12.1 12.1 12.1 12.1 12.1 12.1
Background conc. 4 308 23 23 140 502.4 628 0
Continuous std (cs)
292 ppm hard
5 500 230 250 1000 700 1000 1
Maximum Std (ms)
292 ppm hard
NA NA 860 NA NA NA NA 1
Final acute value
(FAV) NA NA NA NA NA NA NA NA

NPDES/SDSPermitProgram Fact Sheet MN0020222 Permit Reissuance Page 17 of 21
388 ppm hard
Mass Balance ‐cs 10.8 1619.7 1437.2 1573.8 6015.3 1852.4 3169.4 5.8
Mass Balance ‐ms NA NA 5741.16 NA NA NA NA 5.81
Coeff of variation
(CV) 0.15 0.05 0.12 0.12 0.95 0.06 0.08 0.07
Long Term Avg‐cs
Long Term Avg‐ms
NA NA NA NA NA NA NA NA
NA NA 4426.54 NA NA NA NA 4.99
Preliminary Effl.
limits:
Daily Max
Monthly Ave
(2x/month)
14.2
12.01
1768
1676
1634
1435
1944
1708
19127
9262
2088
1940
3654
3349
5.8
NA
Reasonable
Potential
PEQ>Daily max
PEQ>Monthly Ave.
PEQ> FAV
Final Reasonable
Potential
FALSE
FALSE
NA
No
FALSE
FALSE
NA
No
FALSE
FALSE
FALSE
No
FALSE
FALSE
NA
No
FALSE
FALSE
NA
No
FALSE
FALSE
NA
No
FALSE
FALSE
NA
No
FALSE
NA
FALSE
No
Mercury The data were analyzed and no reasonable potential was found. No limit is necessary. The permittee needs to monitor total mercury, dissolved mercury and total suspended solids (grab) in the effluent twice per year. Mercury shall be analyzed as total mercury, using EPA method 1631, with clean techniques method 1669 and any revisions to those methods. EPA 1631 method level of detection is 0.2 ηg/L.
Whole Effluent Toxicity The facility has a chronic whole effluent toxicity (WET) monitoring requirement because the ratio of the Crow River low flow 7Q10 (12.1 mgd) to the facility’s ADWDF (2.03 mgd) is less than 20:1. The discharger has submitted 4 WET tests since the past permit cycle. The WET test done in 2011 indicated an IC25 of 88.5% for Ceriodaphina dubia and fathead minnow (Pimephales promelas). This was the only test that showed any toxicity and a reasonable potential study was done. The results are reported in the table above. The data indicate no reasonable potential for the effluent to exceed a water quality‐based effluent limit. The monitoring threshold value is 6.8 TUc. The TUc is a monitoring threshold value, not a WET limit.

NPDES/SDSPermitProgram Fact Sheet MN0020222 Permit Reissuance Page 18 of 21
Total Phosphorus WQBEL Federal law [40 CFR 122.44(d)] restricts mass increases of pollutants upstream of an impaired water and requires water quality based effluent limits (WQBEL) to be established for pollutant parameters where it is found that a NPDES/SDS discharger has the reasonable potential (RP) to cause or contribute to an excursion above a state water quality standard (WQS). An effluent limits analysis was completed on the St. Michael Wastewater Treatment Facility (WWTF) to determine if the WWTF’s discharge has RP to cause or contribute to an exceedance of a state water quality standard or contribute to any downstream impairment. As a result of the analysis, total phosphorus effluent limits were established for the St. Michael WWTF to ensure protection of downstream waters and to comply with: Lake Eutrophication Standards, River Eutrophication Standards, Site Specific Standard, and State Discharge Restrictions. A summary of the effluent limits analysis and the assigned total phosphorus limits are included below. For additional details regarding the effluent limits analysis, please see the “Total phosphorus effluent limit review: North Fork Crow River Watershed”. A copy of the MPCA memorandum is available upon request.
Lake Eutrophication Standards Effluent from the St. Michael Wastewater Treatment Facility (WWTF) is discharged upstream of Lake Pepin which currently exceeds numeric lake eutrophication standards (LES). Lake Pepin is a shallow lake located in the Northern Lakes and Forest, North Central Hardwood Forest, and the Western Corn Belt Plains Ecoregions. Eutrophication standards for lakes, shallow lakes, and reservoirs can be found in Minn. R. 7050.0222 (https://www.revisor.mn.gov/rules/?id=7050.0222). Federal law [40 CFR 122.44(d)] restricts mass increases upstream of impaired waters and states that NPDES/SDS permits for all dischargers that have the reasonable potential (RP) to cause or contribute to downstream impaired waters are required to contain water quality effluent based limits (WQBELs) derived from the water quality standard (WQS). When determining RP, the Code of Federal Regulations also states that MPCA shall use procedures which account for existing controls on point and nonpoint sources of pollution. Permittees are found to have RP for total phosphorus (TP) if: 1) they discharge upstream of a nutrient impaired waterbody, 2) they discharge at TP concentrations greater than the ambient target, and 3) there is no geographical barrier capable of trapping a significant mass of nutrients between the outfall and the impairment. For all reasons listed above, the St. Michael WWTF is found to have RP for TP upstream of Lake Pepin. Therefore, the St. Michael WWTF is assigned a 12‐month moving total mass TP WQBEL as a result of the Waste Load Allocation (WLA) derived from the WQS. Draft WLAs in combination with other point and nonpoint allocations are calculated to achieve the nutrient/eutrophication WQS for Lake Pepin.
Currently there are over 500 dischargers upstream of Lake Pepin with RP. The gross WLA was split between the affected dischargers, in consideration of facility size and type. More detail regarding the method used to split the gross WLA into individual WLAs is provided in the MPCA memorandum for the watershed effluent limit analysis.
The TP effluent limit assigned to the St. Michael WWTF to protect for eutrophication impairment in Lake Pepin is 2,702 kg/yr as a 12‐month moving total.
River Eutrophication Standards (RES) The St. Michael Wastewater Treatment Facility (WWTF) is one of 6 WWTFs located within the North Fork Crow River Watershed. A watershed scale analysis was completed to determine if total phosphorus (TP) effluent limits were necessary for the WWTFs located within the watershed to protect for RES. Guidance for the analysis, determination of reasonable potential (RP), and water quality based effluent limit (WQBEL) setting process is defined in the Procedures for Implementing River Eutrophication Standards for NPDES Wastewater Permits in Minnesota (MPCA 2015), which can be found at: https://www.pca.state.mn.us/sites/default/files/wq‐wwprm2‐15.pdf. The complete “Total phosphorus effluent limit review: North Fork Crow River Watershed” memorandum is available upon request from the MPCA.
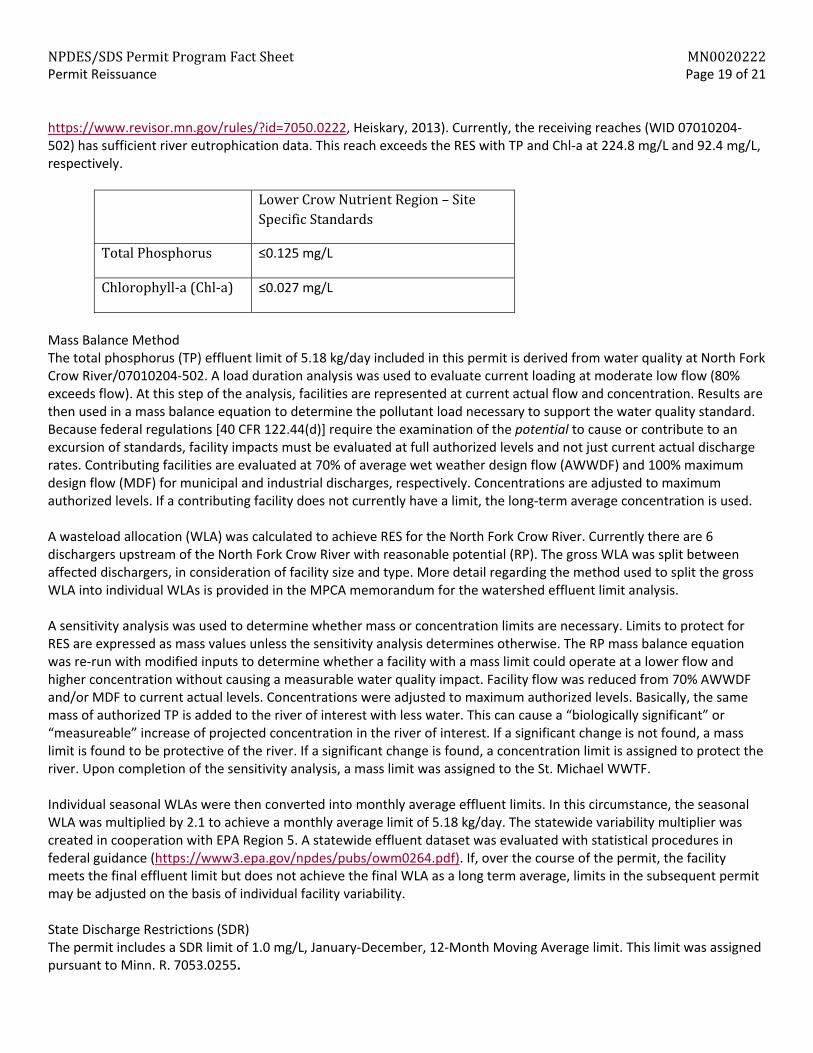
The receiving water for the St. Michael WWTF is site specific River Nutrient Region “Lower Crow Nutrient Region” and has standards of ≤0.125 mg/L TP and ≤0.027 mg/L Chl‐a (Minn. R. 7050.0222
NPDES/SDSPermitProgram Fact Sheet MN0020222 Permit Reissuance Page 19 of 21
https://www.revisor.mn.gov/rules/?id=7050.0222, Heiskary, 2013). Currently, the receiving reaches (WID 07010204‐502) has sufficient river eutrophication data. This reach exceeds the RES with TP and Chl‐a at 224.8 mg/L and 92.4 mg/L, respectively.
LowerCrowNutrientRegion–SiteSpecificStandards
TotalPhosphorus ≤0.125 mg/L
Chlorophyll‐a(Chl‐a) ≤0.027 mg/L
Mass Balance Method The total phosphorus (TP) effluent limit of 5.18 kg/day included in this permit is derived from water quality at North Fork Crow River/07010204‐502. A load duration analysis was used to evaluate current loading at moderate low flow (80% exceeds flow). At this step of the analysis, facilities are represented at current actual flow and concentration. Results are then used in a mass balance equation to determine the pollutant load necessary to support the water quality standard. Because federal regulations [40 CFR 122.44(d)] require the examination of the potential to cause or contribute to an excursion of standards, facility impacts must be evaluated at full authorized levels and not just current actual discharge rates. Contributing facilities are evaluated at 70% of average wet weather design flow (AWWDF) and 100% maximum design flow (MDF) for municipal and industrial discharges, respectively. Concentrations are adjusted to maximum authorized levels. If a contributing facility does not currently have a limit, the long‐term average concentration is used.
A wasteload allocation (WLA) was calculated to achieve RES for the North Fork Crow River. Currently there are 6 dischargers upstream of the North Fork Crow River with reasonable potential (RP). The gross WLA was split between affected dischargers, in consideration of facility size and type. More detail regarding the method used to split the gross WLA into individual WLAs is provided in the MPCA memorandum for the watershed effluent limit analysis.
A sensitivity analysis was used to determine whether mass or concentration limits are necessary. Limits to protect for RES are expressed as mass values unless the sensitivity analysis determines otherwise. The RP mass balance equation was re‐run with modified inputs to determine whether a facility with a mass limit could operate at a lower flow and higher concentration without causing a measurable water quality impact. Facility flow was reduced from 70% AWWDF and/or MDF to current actual levels. Concentrations were adjusted to maximum authorized levels. Basically, the same mass of authorized TP is added to the river of interest with less water. This can cause a “biologically significant” or “measureable” increase of projected concentration in the river of interest. If a significant change is not found, a mass limit is found to be protective of the river. If a significant change is found, a concentration limit is assigned to protect the river. Upon completion of the sensitivity analysis, a mass limit was assigned to the St. Michael WWTF.
Individual seasonal WLAs were then converted into monthly average effluent limits. In this circumstance, the seasonal WLA was multiplied by 2.1 to achieve a monthly average limit of 5.18 kg/day. The statewide variability multiplier was created in cooperation with EPA Region 5. A statewide effluent dataset was evaluated with statistical procedures in federal guidance (https://www3.epa.gov/npdes/pubs/owm0264.pdf). If, over the course of the permit, the facility meets the final effluent limit but does not achieve the final WLA as a long term average, limits in the subsequent permit may be adjusted on the basis of individual facility variability.
State Discharge Restrictions (SDR) The permit includes a SDR limit of 1.0 mg/L, January‐December, 12‐Month Moving Average limit. This limit was assigned pursuant to Minn. R. 7053.0255.

NPDES/SDSPermitProgram Fact Sheet MN0020222 Permit Reissuance Page 20 of 21
Proposed Permit Effluent Limits and Monitoring
Table 5: SD001 Proposed Effluent Limits and Monitoring Requirements Parameter Discharge limitations Monitoring requirements
Limit and Units Frequency Sample type Effective period
Bis(2‐ethylhexyl) phthalate
Monitor only. calendar month maximum Micrograms per liter
Once per month
Grab Mar, Sept
BOD, Carbonaceous 05 25 calendar month 40 maximum calendar milligrams per 2 times per 24‐Hour Flow Apr‐May, Oct‐Day (20 Deg C) average week average liter week Composite Nov BOD, Carbonaceous 05 Day (20 Deg C)
231 calendar month average
369.6 maximum calendar week average
kilograms per day
2 times per week
24‐Hour Flow Composite
Apr‐May, Oct‐Nov
BOD, Carbonaceous 05 15 calendar month 25 maximum calendar milligrams per 2 times per 24‐Hour Flow Jun‐Sep, Dec‐Day (20 Deg C) average week average liter week Composite Mar BOD, Carbonaceous 05 Day (20 Deg C)
138.6 calendar month average
231 maximum calendar week average
kilograms per day
2 times per week
24‐Hour Flow Composite
Jun‐Sep, Dec‐Mar
BOD, Carbonaceous 05 85 minimum calendar month average percent 3 times per Calculation Jan‐Dec (Sep‐Day % Removal week Aug) (Oct‐Sep) Copper, Total Phase 1 Monitor only. calendar month average Micrograms per
liter Once per month
Grab Jan‐Dec (Sep‐Aug) (Oct‐Sep)
Copper, Total Phase 2 119‐calendar 207 daily maximum Micrograms per Once per Grab Jan‐Dec (Sep‐month average liter month Aug) (Oct‐Sep)
Cyanide, Free Monitor only. calendar month maximum Micrograms per liter
Once per month
Grab Mar, Sep
Fecal Coliform, MPN or 200 calendar month geometric mean organisms per 2 times per Grab Apr‐Oct Membrane Filter 44.5C 100 milliliter week Flow Monitor only.
calendar month average
Monitor only. calendar month maximum
million gallons per day
once per day
Measurement, Continuous
Jan‐Dec (Sep‐Aug) (Oct‐Sep)
Flow Monitor only. calendar month total million gallons once per Measurement, Jan‐Dec (Sep‐day Continuous Aug) (Oct‐Sep)
Mercury, Dissolved (as Hg)
Monitor only. calendar month maximum nanograms per liter
once per month
Grab May, Sep
Mercury, Total (as Hg) Monitor only. calendar month maximum nanograms per once per Grab May, Sep liter month
Nitrite Plus Nitrate, Total (as N)
Monitor only. calendar month average milligrams per liter
once per month
24‐Hour Flow Composite
Jan‐Dec (Sep‐Aug) (Oct‐Sep)
Nitrogen, Ammonia, 27.7 calendar month average Kilograms per Twice per 24‐Hour Flow Jun‐Sep Total (as N) day week Composite Nitrogen, Ammonia, Total (as N)
3 calendar month average milligrams per liter
Twice per week
24‐Hour Flow Composite
Jun‐Sep
Nitrogen, Ammonia, Monitor only. calendar month average Kilograms per Twice per 24‐Hour Flow Apr‐May, Oct‐Total (as N) day week Composite Nov Nitrogen, Ammonia, Total (as N)
Monitor only. calendar month average milligrams per liter
Twice per week
24‐Hour Flow Composite
Apr‐May, Oct‐Nov
Nitrogen, Ammonia, Total (as N)
46.2 calendar month average
Kilograms per day
Twice per week
24‐Hour Flow Composite
Dec‐Mar
Nitrogen, Ammonia, Total (as N)
5 calendar month average milligrams per liter
Twice per week
24‐Hour Flow Composite
Dec‐Mar
Nitrogen, Kjeldahl, Monitor only. calendar month average milligrams per once per 24‐Hour Flow Jan‐Dec (Sep‐Total liter month Composite Aug) (Oct‐Sep) Nitrogen, Total (as N) Monitor only. calendar month average milligrams per
liter once per month
24‐Hour Flow Composite
Jan‐Dec (Sep‐Aug) (Oct‐Sep)
Oxygen, Dissolved 5.0 daily minimum milligrams per once per Grab Jun‐Sep, Dec‐liter day Mar
Oxygen, Dissolved Monitor only. Daily minimum milligrams per liter
once per day
Grab Apr‐May, Oct‐Nov
pH 6.0 calendar month 9.0 calendar month standard units once per Grab Jan‐Dec (Sep‐minimum maximum day Aug) (Oct‐Sep)

NPDES/SDSPermitProgram Fact Sheet MN0020222 Permit Reissuance Page 21 of 21
Phosphorus, Total (as P)
Monitor only. calendar month average milligrams per liter
once per week
24‐Hour Flow Composite
Jan‐Dec (Sep‐Aug) (Oct‐Sep)
Phosphorus, Total (as 5.18 calendar month average kilograms per once per 24‐Hour Flow Jun‐Sep P) day week Composite Phosphorus, Total (as P)
2702 12‐month moving total
kilograms per year
1.0 12‐month moving average
milligrams per liter
once per month
Calculation Jan‐Dec (Sep‐Aug) (Oct‐Sep)
Solids, Total Dissolved Monitor only. calendar month average milligrams per once per 24‐Hour Flow Mar, Sep (TDS) liter month Composite Solids, Total Suspended (TSS)
30 calendar month average
45 maximum calendar week average
milligrams per liter
2 times per week
24‐Hour Flow Composite
Jan‐Dec (Sep‐Aug) (Oct‐Sep)
TSS 277.3 calendar 415.9 maximum calendar kilograms per 2 times per 24‐Hour Flow Jan‐Dec (Sep‐month average week average day week Composite Aug) (Oct‐Sep)
TSS % Removal 85 minimum calendar month average percent 2 times per week
Calculation Jan‐Dec (Sep‐Aug) (Oct‐Sep)
TSS, grab (Mercury) Monitor only. calendar month maximum milligrams per once per Grab May, Sep liter month
Additional requirements Mercury Minimization Plan This permit contains requirements for mercury monitoring. These requirements were added in response to the U.S. Environmental Protection Agency’s approval of the Minnesota state‐wide Mercury Total Maximum Daily Load (TMDL) plan. More information on the TMDL can be found on the MPCA internet site at http://www.pca.state.mn.us/wfhy9ef. Specific mercury monitoring requirements are found in the Surface Discharge Station Chapter of this permit. Those requirements include sampling for TSS via a grab sample taken at the same time as the Total and Dissolved mercury grab samples are taken. You are also required to submit a Mercury Minimization Plan (MMP) or updated MMP. Guidance for completing the MMP is available on the MPCA internet site at http://www.pca.state.mn.us/gp0rb25.
Phosphorus Phosphorus is a common constituent in many wastewater discharges and a pollutant that has the potential to negatively impact the quality of Minnesota’s lakes, wetlands, rivers, and streams. Phosphorus promotes algae and aquatic plant growth often resulting in decreased water clarity and oxygen levels. In addition to creating general aesthetic problems, these conditions can also impact a water body’s ability to support healthy fish and other aquatic species. Therefore, phosphorus discharges are being carefully evaluated throughout the state.
You are required to meet a phosphorus limit as specified in the limits and monitoring section of this permit. Although you are not required to prepare a Phosphorus Management Plan, elimination or reduction of phosphorus at the source will decrease the influent load to the wastewater treatment facility and has the potential to improve treatment efficiency and reduce treatment costs. The MPCA strongly encourages you to identify and eliminate/reduce sources of phosphorus to, and optimize phosphorus management within, your wastewater treatment facility.
All phosphorus samples must be analyzed by a certified laboratory and the data submitted to the MPCA. If your laboratory would like more information about becoming certified, please call the Environmental Laboratory Certification Unit at 612‐676‐5200. Samples must be collected in a clean bottle (preferably cleaned by a certified laboratory) that was not washed with phosphate detergent. Also, a sulfuric acid preservative must be added immediately after the sample is collected, and it must be stored at four degrees Celsius until analysis. If a contract laboratory is used, the bottle and preservative would typically be provided by the laboratory analyzing the sample.
Nitrogen Nitrogen is a pollutant that can negatively impact the quality of Minnesota’s water resources, including water used for drinking. Studies have shown that nitrogen in lakes and streams has a toxic effect on aquatic life such as fish. Like phosphorus, nitrogen is a nutrient that promotes algae and aquatic plant growth often resulting in decreased water

NPDES/SDSPermitProgram Fact Sheet MN0020222 Permit Reissuance Page 22 of 21
clarity and oxygen levels. In September 2014, the MPCA completed the final draft of the Statewide Nutrient Reduction Strategy (http://www.pca.state.mn.us/zihy1146 ) which identifies goals and milestones for nitrogen reductions for both point and non‐point nitrogen sources within Minnesota. To gain a better understanding of the current nitrogen concentrations and loadings received by and discharged from your Facility additional influent and effluent nitrogen monitoring has been added to the Permit. This monitoring has been added in accordance with Minnesota Statues Chapter 115.03. The Permit includes influent and effluent monitoring for Nitrite plus Nitrate‐Nitrogen, Total Kjeldahl Nitrogen, and Total Nitrogen at a frequency of once per month for the five‐year term of the Permit. There is no nitrogen limit in the Permit.
Additional Total Dissolved Solids (TDS) Monitoring Requirement The draft permit requires additional monitoring for TDS at a frequency of two times per year for the five‐year term of the permit. The data will be recorded on a custom supplemental form provided by the MPCA and must be submitted with the DMR for the month when the sample is collected/or should be submitted via sample values with the DMR for the month when the sample is collected. These additional parameters are being added to every permitted municipal facility with an average wet weather design flow of 100,000 gallons per day or greater.
Industrial Stormwater On April 5, 2010, the Industrial Stormwater General Permit (MNR050000) was issued. This permit addresses stormwater discharges associated with industrial activity for facilities that discharge stormwater to waters of the state, including Municipal Separate Storm Sewer Systems. The General Permit also addressed stormwater discharges associated with industrial activities at facilities that provide on‐site infiltration of industrial stormwater discharges associated with the facility.
For both industrial and municipal wastewater facilities, in lieu of obtaining coverage under both the General Permit and the individual NPDES permit, the MPCA has added the necessary industrial stormwater requirements language and limits and monitoring to this permit so that coverage under this NPDES permit alone will cover both permits. An additional discharge station (SD003) has been created with specific limits and monitoring, and a DMR is required to be submitted annually. There is also an Industrial Stormwater Section specific to your facility. References are made to an Inspection Report and Annual Report that can be found on the MPCA’s website. Finally, there is a Benchmark Monitoring Factsheet on the website that must be used to ensure compliance with the limits and monitoring requirements for the facility.
The Permittee shall develop and implement a Stormwater Pollution Prevention Plan (Plan) to address the specific conditions at the industrial facility. The goal of the Plan is to eliminate or minimize contact of stormwater with significant materials that may result in pollution of the runoff. The Plan shall be developed and implemented within 180 days after permit issuance and shall be available for inspection.
The Permittee is required to submit a request for permit termination if it is currently covered under a general industrial stormwater permit. The application form to request permit terminations can be found at http://www.pca.state.mn.us/index.php/water/water‐permits‐and‐rules/water‐permits‐and‐forms/water‐permit‐application‐forms.html.
Priority Pollutants – Monitoring Requirements This permit provides the requirements for priority pollutant monitoring on the effluent three times during the life of the permit. Sampling events will need to be done at least one year apart. This permit includes requirements to fulfill the priority pollutant monitoring requirements in the current U.S. Environmental Protection Agency (EPA) application form (EPA Form 3510‐2A).

NPDES/SDSPermitProgram Fact Sheet MN0020222 Permit Reissuance Page 23 of 21
Chronic Whole Effluent Toxicity (WET) Testing Requirements An annual requirement to submit chronic toxicity test batteries now appears in the limits and monitoring section of your permit. The first set of annual chronic WET results are due six months after permit issuance and annually thereafter. However, the requirement will not appear on your Discharge Monitoring Report (DMR) forms. Please note this change in the submittal dates and plan your test batteries accordingly.
Biosolids Land Application This permit requires biosolids to be treated to meet specific standards, and specifies monitoring, recordkeeping, reporting, and general requirements for biosolids that are applied to the land. Unless they are exceptional quality biosolids, sites to which biosolids are applied are approved by the MPCA by the procedures found in Minn. R. 7041.0800.
Compliance Schedule An analysis of the Permittee’s priority pollutant scans was completed, including total copper. Copper results were above the level of detection and indicates reasonable potential to exceed the water quality standard. A daily maximum limit (207 ug/L) and an average monthly limit (119 ug/L) are required for this permit.
In a letter dated May 11, 2016, the Permittee requested a higher frequency of copper monitoring during the permit cycle to analyze the discharge levels, identify potential sources from industrial users, determine the types of facility modifications that may be necessary and actually complete those potential upgrades to the system. The Permittee believes, and the MPCA agrees, that the end of the permit cycle is as soon as possible for them to meet the final limits, which complies with 40 CFR 122.2 and 40 CFR 122.47. Therefore, a compliance construction schedule is included in the permit.
The compliance construction schedule includes collecting copper samples on a monthly basis and submitting annual reports for the first two years of the permit cycle. The Permittee is then required to submit a final report and determine whether modifications to the facility are necessary to meet the final limits. If no modifications are needed, the final limits go into effect immediately. If not, the Permittee continues with the schedule to upgrade the facility and the final limits go into effect on March 21, 2023.
With the exception of copper, the limits and monitoring requirements at the end of the permit are required for the full permit cycle. For total copper, from the time of permit issuance until the final copper limits become effective, the Phase 1 copper monitoring is required. At the time the final limits become effective, the Phase 2 copper limits and monitoring are required.
Variances This permit does not include any variances.
Total facility requirements (TFR) All NPDES/SDS permits issued in the state of Minnesota contain certain conditions that remain the same regardless of the size, location, or type of discharge. The standard conditions satisfy the requirements outlined in 40 CFR 122.41, Minn. R. 7001.0150, and Minn. R. 7001.1090. These conditions are listed in the Total Facility Requirements chapter of the NPDES/SDS permit. These requirements cover a wide range of areas, including recordkeeping, sampling, equipment calibration, equipment maintenance, reporting, facility upsets, bypasses, solids handling, changes in operation, facility inspections, and permit modification and reissuance.
Nondegredation and anti‐backsliding Changes to the facility may result in an increase in pollutant loading to surface waters or other causes of degradation to surface waters. If a change to the facility will result in a net increase in pollutant loading or other causes of degradation

NPDES/SDSPermitProgram Fact Sheet MN0020222 Permit Reissuance Page 24 of 21
that exceed the maximum loading authorized through conditions specified in the existing permit, the changes to the facility are subject to antidegradation requirements found in Minn. R. 7050.0250 to 7050.0335
This Permit complies with Minn. R. 7053.0275 regarding anti‐backsliding.
Any point source discharger of sewage, industrial, or other wastes for which a NPDES permit has been issued by the agency that contains effluent limits more stringent than those that would be established by Minn. R. 7053.0215 to 7053.0265 shall continue to meet the effluent limits established by the permit, unless the permittee establishes that less stringent effluent limits are allowable pursuant to federal law, under section 402(o) of the Clean Water Act, United States Code, title 33, section 1342.