Embed Size (px)
Citation preview

1
PHD Research Bureau | November 2016
NNoovveemmbbeerr 22001166

2
PHD Research Bureau | November 2016
For details please contact: Ms. Surbhi Sharma, Sr. Research Officer, Tel- +91-11-49545454 (Ext 131), Email- [email protected]
PHD CHAMBER OF COMMERCE AND INDUSTRY PHD House, 4/2 Siri Institutional Area, August Kranti Marg, New Delhi– 110016 | Tel: +91-1126863801-04 | Fax: +91-11-26855450 | Website: www.phdcci.in
3
PHD Research Bureau | November 2016
EXECUTIVE SUMMARY
TIF November 2016
A fascinating feature of Indian Foreign Trade policy is continuity wherein remarkable alterations are
pursued in a series of timely micro changes. Consequently, these recent proactive edifications corroborated
the merchandize trade deficit for the period April – October 2016 to get softened by 52.91% to value at
USD 20.81 billion compared to USD 44.19 billion during April – October 2015.
The export of services during September 2016 was valued at USD 13.773 billion, registering a growth rate of
2.93% compared to 4.74% during August 2016. Non-petroleum exports in October 2016 are valued at USD
20.797 billion against USD 18.923 billion in October 2015, an increase of 9.9 %.
Global scenario for Indian exports witnessed a shift in trend. China has agreed to import rice from 14 Indian
firms. Indian tea exports registered a decline by 2% during the first six months of 2016-17. Government has
disclosed plans to bring on a single online platform about 200 agencies that issue certificates to exporters to
help them avail duty benefits at the destination or importing country, another move aimed at improving ease of
doing business in India. Share of textiles and apparel in total exports in India rose to 15% during 2015-16.
Exports of IT software services from units under the government's Software Technology Parks (STP) scheme is
estimated to have grown by nearly 9% to Rs 3.19 lakh crore in 2015-16.
On the imports front, Indian flour mills imported 17.2 lakh tonnes of wheat from Ukraine, Australia and France.
In addition, 6-7 lakh tonnes of wheat shipments are expected to arrive in the coming months. India's total palm
oil imports stood at 739,159 tonnes, according to traders, and are expected to fall to 650,000 tonnes in
November and by another 20 % from there in December.
According to World Bank, India needs to enhance productivity of its firms and bring about policy action to
become one of the key exporting countries from the South Asian region. India has improved its ranking by 4
places to jump at 102nd position among 136 countries in terms of enabling cross border trade, according to the
recently published estimates by World Economic Forum.
Investment climate in India accentuated further in 2016. India attracted around USD 29.02 billion FDI during
April – September 2016, wherein USD 21.64 billion was in the form of Equity inflows. The value registered
growth of nearly 30% during the aforementioned period compared to same period previous year. According to
Reserve Bank, India's foreign exchange reserves declined by USD 1.19 billion to USD 367.041 billion in the week
to November 11 on account of fall in foreign currency assets.
Moreover, India – Japan sealed 10 vital agreements; Covered civil nuclear deal, railways, agriculture. Further, an
online portal for facilitating trade between India and Iran was launched recently. According to Minister of
Commerce and Industry Shrimati Nirmala Sitharaman, India is ready to submit to the World Trade Organisation a
formal proposal on trade facilitation in the services sector.
To bolster existing trade numbers, relaxation in physical presentation of documents for customs clearances were
undertaken by the Government to boost Ease of Doing Business; the Goods and Services Network (GSTN) has
signed a Memorandum of Understanding (MoU) with Director General of Foreign Trade (DGFT) for sharing of
foreign exchange realization and Import Export code data. The Government has also liberalized its FDI policy on
Other Financial Services and Non-Banking Finance Companies (NBFCs).

4
PHD Research Bureau | November 2016
Table of Contents
S. No. Topic Page No.
1. Development in India’s Foreign Trade 5
2. Developments in India’s Foreign Investments 10
3. Developments in Bilateral trade and Investments 11
4. India and WTO 14
5. Policy Developments 14
6. Macroeconomic Developments 16
7. Miscellaneous 17
Trade Acronyms
Article
India UK Trade: Potential Waiting to be Unlocked 19

5
PHD Research Bureau | November 2016
1. Developments in India’s Foreign Trade
1.1 Exports
Indian exports grew by 9.59% in October 2016: India’s merchandize exports have continued with commendable growth rate in two straight months, registering growth figure of 9.59% in October 2016 to value at USD 23,512.70 million compared to USD 21,456.11 million during October 2015.
Services exports grew by 2.93% during September 2016: The export of services during September 2016 was valued at USD 13.773 billion, registering a growth rate of 2.93% compared to 4.74% during August 2016; and Import of services were valued at USD 8.304 billion, registering a growth rate of 3.10% compared to 8.71% during August 2016. The trade balance in Services (i.e. net export of Services) for September, 2016 was estimated at USD 5.469 billion.
India’s Trade at a Glance
Merchandise Jul-16 Aug-16 Sep-16 Oct-16 Apr-Oct 2016
Exports (USD billion) 21.69 21.52 22.9 23.5 154.91
Growth (%) -6.84 -0.30 4.62 9.59 -0.17
Imports (USD billion) 29.45 29.19 31.2 33.7 208.08
Growth (%) -19.03 -14.09 -2.54 8.11 -10.85
Trade Balance (USD billion) -7.76 -7.67 -8.3 - 10.16 -53.16
Services Jun-16 Jul-16 Aug-16 Sep-16
Exports (Receipts) (USD billion) 13.322 12.775 13.381 13.77
Imports (Payments) (USD billion) 8.389 7.409 8.054 8.30
Trade Balance (USD billion) 4.933 5.366 5.327 5.46
Source: PHD Research Bureau; Compiled from Ministry of Commerce and Industry
Cumulative exports grew by (-) 0.17% during April-October 2016: The cumulative value of exports for
the period April-October 2016-17 stood at USD 154.913 billion as against USD 155.179 billion registering a
negative growth of 0.17% over the same period last year.
-40
-30
-20
-10
0
10
20
30
Ap
r-1
4
May
-14
Jun
-14
Jul-
14
Au
g-1
4
Sep
-14
Oct
-14
No
v-1
4
De
c-1
4
Jan
-15
Feb
-15
Mar
-15
Ap
r-1
5
May
-15
Jun
-15
Jul-
15
Au
g-1
5
Sep
-15
Oct
-15
No
v-1
5
De
c-1
5
Jan
-16
Feb
-16
Mar
-16
Ap
r-1
6
May
-16
Jun
-16
Jul-
16
Au
g-1
6
Sep
-16
Oct
-16
Trend in Exports-Imports growth (%)
Export Growth (%) Import Growth (%)

6
PHD Research Bureau | November 2016
Non-petroleum exports grew by 9.9% in October 2016: Non-petroleum exports in October 2016 are
valued at USD 20.797 billion against USD 18.923 billion in October 2015, an increase of 9.9 %. Non-
petroleum exports during April-October 2016 are valued at USD 138.111 billion as compared to USD 135.691
billion for the corresponding period in 2015, an increase of 1.8%.
Exports of Non-petroleum products jumped by 5.44% in Sep 2016: India registered a jump in non-
petroleum exports from USD 19.282 billion in September 2015 to USD 20.330 billion in September 2016.
Aggregate non-petroleum exports for the period April – September 2016 stood at USD 117.314 billion
compared to 116.767 billion during the same period previous year, growing by 0.47%.
Overall exports volume for USA, EU, and Japan expanded during August 2016: As per WTO
Statistics, Exports volume for USA, EU, and Japan registered a growth figures, growing by 0.2%, 5.78%, and
10.03%, respectively. On the other hand, China exhibited negative growth figures of -3.01% in export growth
for August 2016 over the corresponding period previous year.
14 Indian firms given nod to export rice to China: China has agreed to import rice from 14 Indian firms
such as Best foods, Sarveshwar foods, LT foods, SSA International, Sunstar Overseas, KRBL, Kohinoor Foods,
Ebro India Pvt, Amira Pure Foods Pvt, Pari India, DRRK Foods (Pvt), Nature Bio Foods, Oversease Pvt, and
United Exports. China is one of the world’s largest importers of rice. India exports around 4000-5000 tonnes
of basmati rice annually to China via Hong Kong. In addition, India produces over 70% of the world’s basmati
and it constitutes 6% of the rice grown in India. Basmati accounts for 57% of the India’s rice exports in 2014-
15.
Suspension of Indian cotton imports by Pakistan: Indian cotton exporters see brighter opportunities in
neighbouring China and other promising markets such as Vietnam, Indonesia and Brazil as local cotton prices
provide parity with international prices. Pakistan’s ‘undeclared’ suspension of cotton imports from India
after tensions across the border is not likely to affect shipments of the fibre. Indian exporters see cotton
shipments in 2016-17 in the range of 5.5-6 million bales (of 170 kg each). Presently, international prices
hover in the range of about Rs. 38,500 per candy (of 356 kg each). Currently, domestic cotton prices are in
the range of Rs. 38,100-39,100 a candy.
India’s tea exports fell by 2% during April-September 2016: India's tea exports declined by 2% to Rs
2,084.06 crore in the first six months of the current fiscal. In terms of quantity, the exports have dipped to
101.04 million kg from 106.36 million kg in the corresponding period last fiscal. The export realization was
Rs 206.26 per kg as against Rs 199.79 per kg a year ago. Tea production is estimated to have been 795.89
million kg in the first six months of 2016-17, which is almost same as it was in the year-ago period. India is
the second-largest tea producer in the world after China, with over 70% of the beverage produced, being
consumed in the country itself. In the full 2015-16 fiscal, the country sold 232.92 million kg in the overseas
market and the export realization was about Rs 4,493.10 crore.
Government to integrate portals to certify exporters: Government has disclosed plans to bring on a
single online platform about 200 agencies that issue certificates to exporters to help them avail duty
benefits at the destination or importing country, another move aimed at improving ease of doing business in
India. At present, the Directorate General of Foreign Trade, the Export Inspection Council (EIC), various

7
PHD Research Bureau | November 2016
commodity boards, export promotion councils, the Federation of Indian Export Organizations, and industry
chambers at national and city level issue these certificates.
Share of textiles and apparel in total exports in India rose to 15% during 2015-16: According to
Textiles Ministry, share of textiles and apparel in total exports in India rose to 15% during 2015-16 compared
to 13% during 2013-14. FDI equity inflow grew by 16 per cent in the 2015-16 over fiscal 2013-14 and the
government has also approved a special package of Rs 6,000 crore for the sector. Categories like readymade
garments, wool and woolen textiles, silk, carpets, handicrafts and coir and coir products recorded the
highest export growth. Textile and apparel exports are estimated to reach $62 billion by 2021 from 438
billion in 2016. While Europe and America are the key markets for India, new markets such as Iran, Russia
and South America are opening up new possibilities.
Finance and Railways ministry working in tandem to reduce the cost of logistics to boost exports:
In order to boost Indian exports, Finance and Railways ministry working in tandem to provide a robust
mechanism that will reduce the logistics cost and make them competitive.
Software service exports up by 9% from STP units in 2015-16: Exports of IT software services from
units under the government's Software Technology Parks (STP) scheme is estimated to have grown by nearly
9% to Rs 3.19 lakh crore in 2015-16. IT software services exports from STP units have grown steadily during
the last three years from Rs 2.73 lakh crore in 2013-14 to Rs 2.93 lakh crore in 2014-15. STP scheme is one
of them under which IT-ITeS units are eligible for various benefits like customs duty exemption on imported
goods, reimbursement of Central Sales Tax (CST) and Excise Duty exemptions on procurement of
indigenously manufactured goods.
Indian fruits and vegetables exports grew by 9% in H1 2016-17: Exports of fruits and vegetables saw a
sharp increase of 9% to Rs.4,228 crore in comparison to last year. On the other hand, India’s farm and processed
foods exports had fallen to Rs.1.06 lakh crore in FY16 against Rs.1.31 lakh crore in FY15.
Productivity enhancement a must to boost Indian exports: According to World Bank, India needs to
enhance productivity of its firms and bring about policy action to become one of the key exporting countries
from the South Asian region. South Asia could become the fastest growing exporting region of the world if
India and its South Asian neighbours enhance productivity of their firms by at least two percentage points
each year.
Oil meal exports zoom 98% in October 2016: According to Solvent Extractors Association of India, oil
meal exports made a turnaround of sorts after a gap of two months as total shipments shot up 98 per cent
to 67,779 tonnes in October on higher demand for rapeseed meal and castor seed meal. The oil meal
exports have revived after two months. Exports had come in at 63,123 tonnes in August and 96,223 tonnes
in September this year, but the growth was muted in year-on-year terms.
1.2 Imports
India’s merchandize imports grew by 8.11% during October 2016: India’s imports witnessed
expansion, growing by 8.11% to value at USD 33,673.53 million in October 2016 compared to USD 31,148.33
million during same period previous year. The Cumulative value of imports for the period April-October

8
PHD Research Bureau | November 2016
2016-17 was USD 208.083 billion as against USD 233.417 billion registering a negative growth of 10.85%
over the same period last year.
Overall Trade Deficit lowers by 52.91% during April-October 2016 period: A significant improvement
has been witnessed in overall trade balance, viz. taking merchandize and services trade together. Overall
trade deficit for April – October 2016-17 is estimated at USD 20.81 billion, which is 52.91% lower than the
level of USD 44.19 billion during April – October 2015-16.
Point of Sale (POS) Devices and Goods required for their manufacture exempted from Central
Excise Duty till March 31, 2017: The Government has laid increased emphasis on promoting digital
payments. Point of Sale (POS) devices are used for cashless transactions, both for making payments or
disbursing cash. POS do not attract any basic customs duty. To further reduce the cost of such devices and
thereby encourage digital payments, the Government has exempted such devices from Central Excise Duty.
Consequently, these devices will also be exempt from Additional Duty of Customs [commonly known as
CVD] and additional duty of customs [commonly known as SAD]. Simultaneously, to encourage domestic
manufacturers of such devices, all goods required for the manufacture of POS devices have also been
exempted from excise duty, and consequently from CVD and SAD. These exemptions will be valid till 31st
March 2017.
India imports 17.2 lakh tonnes of wheat during FY 2015-16: According to Roller Flour Millers’
Federation of India, on the backdrop of domestic shortages Indian flour mills imported 17.2 lakh tonnes of
wheat from Ukraine, Australia and France. In addition, 6-7 lakh tonnes of wheat shipments are expected to
arrive in the coming months. Imported red wheat was costing Rs 1,880 per quintal for delivery in Bengaluru,
while the local wheat was quoting higher at Rs 2,060 per quintal. Similarly, imported white wheat was
costing Rs 2,080 per quintal compared to Rs 2,400 per quintal delivered from Uttar Pradesh.
Continuation of Minimum Import Price on 19 products of Iron and Steel Chapter: DGFT has
proposed to continue with the minimum import price (MIP) on 19 HS Codes of Iron and steel under chapter
72 of ITC (HS), 2012 – Schedule 1 (Import Policy) for two months, viz. till 4th February 2017.
India ranked 102nd on Enabling Cross Border Trade as per the estimates of World Economic
Forum: India has improved its ranking by 4 places to jump at 102nd position among 136 countries in terms of
enabling cross border trade, according to the recently published estimates by World Economic Forum. With
regard to India, the report said most problematic factors for import include high cost or delays caused by
domestic transportation, crime and theft, corruption on the border and burdensome import procedures.
Taiwan to export USD 500 million textile products to India in the next 5 years: According to the
Taiwan Textile Federation, the organization is bullish on exporting textiles products worth around $500
million to India in the next five years. The bilateral trade between India and Taiwan has grown from $1.19
billion in 2001 to $6 billion in 2014. Taiwanese textile industry is known in the world for its innovative and
high-quality products and is sourced by leading global brands for sports and active wear, outdoor wear,
functional wear, formal wear, suiting and shirting by leading global brands.
Domestic Tyre industry seeks safeguarding measures from government on radial tyre imports:
According to Automotive Tyre Manufacturers’ Association (ATMA), import of truck and bus radial tyres have
9
PHD Research Bureau | November 2016
gone up by 30% during the first half of FY 2016-17. The domestic tyre industry has asked the Centre to take
urgent safeguard measures, considering the surging imports of truck and bus radial tyres (TBR) in the
country. ATMA alleged that most TBR imports from China are being dumped in India as TBR export prices
from China are significantly lower than the price of such tyres in the Chinese domestic market. While import
duty on natural rubber is 25 per cent in India, import of tyres from China attracts just 7 per cent duty.
Steps taken by government to boost trade of food products in India: The government has taken the
following steps to facilitate trade and import of food products into the country:
Customs, in consultation with FSSAI, has introduced Risk Management System (RMS) which will
eventually reduce the sampling.
Draft Food Safety and Standards (Food Import) Regulations, 2016 has been notified on 25.10.2016.
To streamline the functioning of NABL (National Accreditation Board for Testing and Calibration
Laboratories), accredited labs (which test the import samples) and to reduce the time taken in testing,
new labs (increased to 112 NABL-accredited labs) have been notified for testing of imported samples.
Besides, 14 referral labs have been notified for re-testing of import samples. The samples are referred
through random selection by FICS (Food Import Clearance System) to maintain integrity of testing
procedures.
Further, Provisional NOC (PNOC) is issued immediately for imported food items having very short shelf-
life (less than7 days) such as fresh fruit, processed cheese, etc.
FSSAI has issued ad hoc instructions related to re-sampling and re-testing of food grains, including pulses
consignments, permitting cleaning of pulses/cereals consignments at Custom-bonded warehouses.
FSSAI has allowed withdrawal of single sample out of the commingled cargo of pulses, oils and other
food grains such as cereals for multiple importers with same IGM number vide order dated 12.09.2016
and 10.11.2016
In case of primary food like food grains, pulses, fruits, dry fruits, whole spices, etc., imported in
packages, labeling requirement of name and address of the importer has been exempted and can be
verified from accompanying documents of the consignment
FSSAI has shared the microbiological parameters for testing of meat and meat products and fish and
fishery products with the Department of Animal Husbandry, Dairying and Fisheries.
Indian Palm oil imports expected to fell by 20% in the Q3-2016-17: India's total palm oil imports
stood at 739,159 tonnes, according to traders, and are expected to fall to 650,000 tonnes in November and
by another 20 % from there in December. In India - top importer of vegetable oils - traders are forecasting
up to a 20 percent drop in crude and refined palm oil imports for December from the previous month, with
edible oil refiners reducing purchases as the cash crunch weakens retail demand. Traders in Malaysia, India's
largest palm oil supplier taking up half of its imports last year, say the absence of the large bills has already
impacted sales. Indian buyers are delaying shipments and cancelling vessel space bookings, and the traders
expect them to hold back further in the month ahead.
Import of 11 major product groups, manufactured by Indian MSMEs, accounted for 74% of
import from China in 2015-16: As per the statistics compiled by DGCIS, Imports in respect of 11 major
product groups from sectors such as Electrical and Electronics, Mechanical and Metallurgical products etc,
10
PHD Research Bureau | November 2016
which are largely manufactured by the micro, small and medium enterprises (MSMEs) in India, accounted
for 74% of India’s total imports from China in 2015-16.
Spice trade hit on the back of cash withdrawal limits: The spices trade in general and the pepper in
particular has been hit badly by the withdrawal limit, according to primary market traders. There were
buyers for high range pepper at Rs. 66,500 a quintal while the sellers were at Rs67,500 a quintal. Spot prices
remained unchanged at Rs. 65,200 (ungarbled) and Rs68,200 (garbled) a quintal. December contract on the
IPSTA moved up by Rs. 1,000 a quintal to close at Rs. 67,000 while January and February stayed steady at Rs.
59,000 and 56,000 a quintal respectively. Indian export prices were at USD 10,450 a tonne cif for Europe and
USD 10,700 a tonne cif for USA. e.o.m.
Vegetable oil imports projected at 150 lakh tonnes in 2016-17: Driven by a surge in import of soya oil
and sunflower oil, India’s vegetable oil imports are likely to rise by 200,000 tonnes to touch 150 lakh tonnes
in oil year (November to October) 2016-17. According to the Solvent Extractors’ Association of India (SEA),
India imported more edible oil in the last few years due to stagnant oilseed production and rising domestic
demand. India’s dependence on imported oil has risen to 70 per cent. Soft oils include soya bean oil,
sunflower oil and rapeseed oil. Import of soft oils grew 42 per cent in 2015-16, the highest in five years,
while palm oil imports slowed to 58 per cent, against 66 per cent in 2014-15.
2. Developments in India’s Foreign Investments
Total Foreign Direct Inflow into India stood at USD 29.02 billion during April-September 2016:
India attracted around USD 29.02 billion FDI during April – September 2016, wherein USD 21.64 billion were
in the form of Equity inflows. The value registered growth of nearly 30% during the aforementioned period
compared to same period previous year. Top investors during April-September 2016 were Mauritius (USD
5.85 billion); Singapore (USD 4.68 billion); Japan (USD 2.79 billion); Netherlands (USD 1.61 billion) among
others.
Services segment attracted majority of the FDI equity inflow during April-September 2016: During
April-September 2016, Services segment attracted USD 5.28 billion FDI equity inflows; followed by
Telecommunications (USD 2.78 billion), Trading (USD 1.48 billion) and Computer software and hardware
(USD 1.03 billion) among others.
Maharashtra, Dadra and Nagar Haveli, and Daman & Diu attracted majority of FDI equity inflows:
During April-September 2016, Maharashtra, Dadra and Nagar Haveli, and Daman & Diu attracted USD 10.21
billion FDI equity inflow, followed by Delhi, parts of UP and Haryana (USD 3.49 billion); Andhra Pradesh (USD
1.07 billion); and Karnataka (USD 1.07 billion) among others.
Softbank to invest USD 10 billion in India: Softbank has already invested one-fifth of the pledged USD
10 billion in India, mostly in the internet and solar power sectors. It also aims to focus the investments on
clean technology and manufacturing.
Foreign exchange reserves down $1.19 billion: According to Reserve Bank, India's foreign exchange
reserves declined by $1.19 billion to $367.041 billion in the week to November 11 on account of fall in
foreign currency assets. In the previous week, the reserves had increased by $1.074 billion to $368.231
11
PHD Research Bureau | November 2016
billion. They had touched life- time high of $371.99 billion in the week to September 30, this year. Foreign
currency assets (FCAs), a major component of overall reserves, dipped $1.155 billion to $342.772 billion.
Government approves four FDI proposals: The Central Government has approved four FDI proposals
based on the recommendations of 241st Meeting of Foreign Investment Promotion Board (FIPB) held on
27th October 2016. The four proposals are that of BMJ Group lndia Pvt Ltd, Oxford University Press, Dr.
Reddy's Laboratories Ltd and Quintillion Business Media Pvt. Ltd
3. Developments in Bilateral Trade and Investments
India’s trade deficit with China rose to USD 52.69 billion in 2015-16: India’s trade deficit with China
increased to USD 52.69 billion in 2015-16 from USD 48.48 billion in the previous financial year. During the
April-September period of 2016-17, the deficit is at USD 25.22 billion. Minister of Commerce and Industry
Shrimati Nirmala Sitharaman said the increasing trade deficit with China can be attributed primarily to the
fact that Chinese exports to India rely strongly on manufactured items to meet the demand of fast
expanding sectors like telecom and power.
India, Qatar ink five pacts on visas, cyber security, investments: Hon’ble Prime Minister Shri Narendra
Modi and the Qatari Prime Minister discussed enhancing cooperation in defence and security, in particular
in cyber security and agreed on joint action to tackle money laundering and terrorist financing. The two
sides inked five pacts including in the field of visas, cyberspace and investments. Five agreements were
signed in areas such as visa exemption for holders of diplomatic, special and official passports; technical
cooperation in cyberspace and combating cybercrime, letter of intent regarding negotiations on an
agreement on grant of e-visa for businessmen and tourists, and an MoU between the Supreme Committee
for Delivery and Legacy of Qatar and CII.
India – Japan sealed 10 vital agreements; Covered civil nuclear deal, railways, agriculture: Hon’ble
Prime Minister Shri Narendra Modi and Hon’ble Prime Minister Shinzo Abe signed 10 key pacts during the
former’s recent visit to Japan. In a move to bolster existing bilateral economic and security ties, India and
Japan inked 10 vital pacts including the Civil Nuclear Cooperation pact. The India-Japan relationship
witnessed a paradigm shift post recent meet in Japan towards at a new high.
Details of the MOUs/MOCs signed between India and Japan:
National Investment and Infrastructure Fund (NIIF) Limited and Japan Overseas Infrastructure Investment Corporation for Transport and Urban Development to enable cooperation and promote investment in infrastructure projects in railways & transportation; port terminals; toll roads; airport terminals and urban development.
Two memorandums of understanding were signed to boost cooperation in space technology. One of the MoUs, between Indian Space Research Organisation (ISRO) and Japan Aerospace Exploration Agency (JAXA), concerned cooperation in outer space in satellite navigation and planetary exploration. It provides for cooperation in satellite navigation, planetary exploration and space industry promotion; joint missions and studies; joint use of ground systems for mutual support; joint workshops and training; and personnel exchange.
One MoU was signed between India's Ministry of Earth Sciences and the Japan Agency for Marine-Earth Science, aims to promote cooperation in areas of joint survey and research, and exchange of scientific visits by researchers and experts.
12
PHD Research Bureau | November 2016
One memorandum of cooperation (MoC) was signed between India's Ministry of Skill Development and Entrepreneurship and Japan's Ministry of Economy, Trade and Industry on the manufacturing skill transfer promotion programme.
One MoC was signed between India's Ministry of Agriculture and Farmers Welfare and Japan's Ministry of Agriculture, Forestry and Fisheries to deepen the bilateral cooperation in the fields of agriculture and food industries that includes food value chain networking and protecting geographical indication (GI) of agriculture products.
One MoU was signed between India's Ministry of Textiles and the Japan Textiles Products Quality and Technology Centre (QTEC) is aimed at improving quality of Indian textiles for conformity assessment for the Japanese market.
One MoC was signed to promote bilateral cooperation in the field of art and culture which includes exchange of exhibitions and personnel in performing and visual arts; cooperation in preserving the cultural heritage; exchange of exhibitions and experts from museums; and to promote people-to-people exchanges.
One MoC was signed between India's Ministry of Youth Affairs and Sports and Japan's Ministry of Education, Culture, Sports, Science and Technology seeks to provide a framework for bilateral cooperation in the field of sports ahead of the forthcoming 2020 Tokyo Olympics and Paralympics.
One MoU was signed between the Gujarat government and Hyogo prefectural government of Japan to promote mutual cooperation between them in the fields of academics, business, cultural cooperation, disaster management and environmental protection.
India to levy tax on investments from Cyprus from April 2017 onwards: India and Cyprus have signed
the revised tax treaty, along with the protocol, plugging a gap that allowed investments routed through the
country to escape tax in India. India has similarly updated its tax treaty with Mauritius, which has a 32.8%
share in FDI into India since April 2000. Cyprus has a 2.88% share over the same period.
India-Iran launched online portal to bolster trade further: An Online Portal for facilitating trade
between India and Iran was launched by Department of Commerce in the presence of Ambassador of
Islamic Republic of Iran, Mr. Khaleel Rahim, CMD, STC, and other Directors of STC. The Hind-Iran portal
(hindirantrade.org) is a joint initiative of STC and Douman Queshm, Iran. The objective of the trade portal is
to disseminate information relevant to Indo-Iran Trade, and to provide an e-marketplace for the buyers and
sellers of the two countries.
India to sign FTA with Eurasian Union by end of 2016-17: According to the Ambassador of Kazakhstan
in India, the discussions for a Free Trade Agreement (FTA) with Eurasian region and India are in final stages.
By the end of this year, India will be ready to sign it. Kazakhstan is part of the Eurasian economic union -
Kazakhstan, Russia, Belarus, Armenia and Kyrgyzstan. A special working group has been created for the
same.
India to extend the quality checks for pickles and chutneys exports: India is likely to extend the ambit
of the Export of Fruit and Vegetable Products Rules that prohibit fruit and vegetable product exports
without a certificate to countries which require such a document to 15 categories of processed foods. In
order to reduce rejections faced by exporters of products made from fruits and vegetables, India has put in
place a set of quality control rules in cases where importing countries ask for such kind of a certification. In
the first five months of FY2016-17 till August, India’s exports of processed vegetables rose 2.3% to $108.5
million from $106 million in the year ago period.

13
PHD Research Bureau | November 2016
USFDA to visit Indian food firms for food safety-related inspections: The United States Food and
Drug Administration (USFDA) issued a notification stating that its officials will visit Indian companies for food
safety-related inspections. In a letter to the Food Safety and Standards Authority of India (FSSAI), its
representative at the US embassy in New Delhi asked for preparedness with respect to the proposed visit.
However the timings of the visit were not disclosed as yet.
India-Bhutan Sign new bilateral agreement: India and Bhutan signed a new bilateral trade agreement to
enhance trade between the two countries through trade facilitation by improving procedures. The bilateral
agreement aims at cutting down on documentation and adding additional exit and entry points for Bhutan’s
trade with other countries. It is also expected to further strengthen the excellent relations between the two
countries. The first agreement on trade and commerce between Bhutan and India was signed in 1972. Since
then, the agreement has been renewed four times. The last agreement was renewed on July 28, 2006 and
was valid till July 29, 2016. The validity of the agreement was extended for a period of one year or till the
date of coming into force of the new agreement, whichever is earlier, by exchange of diplomatic notes
between the two countries.
Turkey eager to start FTA talks with India: Turkey wants India to start talks on a proposed Free Trade
Agreement (FTA) soon and said the ongoing political turmoil will not impact foreign investment flows. The
feasibility and possibility of concluding a Comprehensive Economic Partnership Agreement” (CEPA, or in
other words an FTA), there have been no dates yet for starting the FTA negotiations. In FY’16, India-Turkey
trade had shrunk nearly 28 per cent year-on-year to $4.91 billion, of which India’s exports to Turkey were
$4.14 billion (contraction of 22.7 per cent), while Turkey’s exports to India fell 47 per cent to $776 million.
New Revised Double Taxation Avoidance Agreement (DTAA) between India and Republic of
Korea comes into force with effect from 12th September, 2016: A new revised Double Taxation
Avoidance Agreement (DTAA) between India and Korea for the Avoidance of Double Taxation and the
Prevention of Fiscal evasion with respect to taxes on income was signed on 18th May 2015 during the visit
of the Prime Minister Shri Narendra Modi to Seoul. It has now come into force on 12th September 2016, on
completion of procedural requirements by both countries.
India, New Zealand agrees to amend tax treaty, boost trade: India and New Zealand decided to
amend the bilateral tax treaty and expressed commitment to work towards a comprehensive free trade
agreement with a view to boost economic ties. The two-way trade between the countries stood at USD1.8
billion, showing an increase of 42 per cent in the past five years. The two countries also agreed to amend the
bilateral Double Taxation Agreement to bring its tax cooperation provisions into line with international best-
practice.
Government of India and Asian Development Bank (ADB) sign $48 Million Loan to improve
Assam’s Power Distribution System: The Asian Development Bank (ADB) and the Government of India
yesterday signed a $48 million loan to help Assam state continue its drive to improve access to efficient and
reliable power in the national capital. This is the second tranche loan of the $300 million multi tranche
financing facility for the Assam Power Sector Investment Program that was approved by the ADB Board in
July 2014. The project will help Assam to enhance capacity and efficiency of its power distribution system to
improve electricity service to end users. The first tranche loan of $50 million was signed in February 2015.
14
PHD Research Bureau | November 2016
4. India and WTO
India to submit formal proposal on Services to WTO: According to Minister of Commerce and Industry
Shrimati Nirmala Sitharaman, India is ready to submit to the World Trade Organisation a formal proposal on
trade facilitation in the services sector — which pushes for a liberal work-visa regime and totalisation pacts
among other measures — as the process of legal vetting of the document is over. The Minister said that
while India will insist on the implementation of the Doha Development Agenda, talks were also taking place
on the new work that WTO should do.
India safeguarding Generic drug industry at WTO: India took a strong stand to safeguard the interests
of generic drug industry while evoking transparent health assessment. The impact assessments should
verify that the increased trade and economic benefits are not endangering or impeding the human rights
and public health obligations of a nation and its people before entering into commitments.
India renews pledge of Doha agenda at WTO meet: India has reiterated its commitment for a
successful conclusion of the 2001 Doha Development Agenda (DDA) and other issues of interest to
developing countries at the World Trade Organization (WTO), and made a fresh pitch for a global agreement
on trade facilitation in services. The Doha round of negotiations have remained stalled since 2008, primarily
over the issue of huge trade-distorting subsidies being given to farmers by the rich countries. While India
and other developing nations want a reaffirmation to conclude the DDA first, developed countries seek to
mostly dilute the negotiations and widen the mandate with new issues. India has also been seeking concrete
work plans on a special safeguard mechanism for developing countries to protect their farmers from a spurt
in imports, and on a permanent solution to the issue of its official grain procurement and food security in
the country, as agreed on in the Bali ministerial.
5. Policy Developments
Relaxation in physical presentation of documents for customs clearances to boost Ease of Doing
Business: The submission of paper documents such as GAR 7 forms / TR 6 Challans, Trans-Shipment Permit
(TP), Shipping Bill (exchange control copy and export promotion copy) and Bill of entry (exchange control
copy) to Banks/DGFT/Customs ports etc. has been completely eliminated, and will become operational
from December 1, 2016.
AEO Tiers 2, 3 can make deferred customs duty payment: As per the notification of CBEC, Every
importer certified as AEO-T2/AEO-T3 shall obtain ICEGATE Login which is essential to avail benefits
envisaged in the AEO Programme.
In order to avail the facility of deferred payment, every AEOT2/AEO-T3 is advised to nominate a nodal
person on their establishment who would be responsible for authenticating all the customs related
transactions on behalf of the AEO.
Since the option of deferred payment has been extended only to AEO (Tier-Two) and AEO (Tier-Three), it
is important for the AEO to exercise due caution in nominating the AEO nodal person to prevent misuse
of facility of deferred payment.
The contact details of AEO nodal person shall also be provided in ICEGATE login to ensure that the
information reaches in time at their registered mail for authentication.
15
PHD Research Bureau | November 2016
The eligible importer who intends to make deferred payment shall indicate the same using flag “D” in
the Payment Method column of Bill of Entry filed.
In order to ensure that the facility of deferred payment is availed only by the eligible importer, option
has been provided in ICEGATE Login for AEO Nodal person to acknowledge such intent and authenticate
using One Time Password (OTP) sent to his registered e-mail address.
The Nodal person would be able to authenticate multiple Bills of Entry at once. Only on such
authentication by the eligible AEO importer, customs clearance would be provided for the consignment
under deferred payment of duty Rules.
The eligible importer can pay duty on the dates as specified in Rule 6 which details the following:
for goods corresponding to Bill of Entry returned for payment from 1st to 15th day of the month,
duty can be paid on the 17th day of that month
for goods corresponding to Bill of Entry returned for payment from the 16th till the last day of the
month, the duty shall be paid on the 2nd day of the following month
In the month of March,for goods corresponding to Bill of Entry returned for payment from 16th to
29th shall be paid by March 31st.
for goods corresponding to Bill of Entry returned for payment from 30th to 31st of March shall be
paid by April 2nd.
The eligible importer also has an option to select the challans belonging to the deferred period and pay
at anytime, even before the due date at their convenience.
Textile ministry seeks Rs 1,750 crore to settle duty drawback refunds: The textile ministry has sought
Rs. 1,750 crore in supplementary grant from the finance ministry to settle claims of refunds under the new
duty drawback scheme — announced as part of a special package for the garments industry in June — in the
current fiscal. The ministry has so far received claims to the tune of Rs. 160 crore from garment exporters
since the scheme was notified in late September.
India seeks inputs from 200 countries for amending drugs and cosmetics act: The Indian
government is roping in around 200 countries and their regulators to pitch in recommendations to amend
the drugs and cosmetics act. These countries are those to which Indian pharmaceutical companies export
their drugs. Among the biggest markets for Indian players is the United States as well as the European
market. The central drug safety regulator in India has been trying to also bring in line India's good
manufacturing standards to global standards.
Govt mandates 20 per cent local components in mobiles for export aid: Government has mandated
the use of over 20 per cent indigenous components in mobile devices and 40 per cent in telecom equipment
made in the country for companies seeking 3 per cent interest subsidy on exports. The order also mandates
that only those companies will be eligible for the interest subsidies who are involved in complete
manufacturing of products in the country over those who only assemble their products. The CIF (Cost
Insurance & Freight) value of the foreign inputs used directly or indirectly in the exported product should be
less than 60 per cent of the FOB (Free on Board) value.
Government announces revised rates of Duty Drawback for 2016-17: The new All Industry Rate of
Duty Drawback for 2016-17 to be made effective from 15th November 2016 for various export products
including handicrafts have been announced by the Department of the Revenue, Government of India. As per

16
PHD Research Bureau | November 2016
the Department of Revenue, the rates for Glass art ware, Papier Machie, Lace and Lace goods and Stone Art
ware have been increased marginally, however, for the remaining handicraft items the rates have been
marginally decreased on percentage basis or kept the same as last year. A new entry i.e. Glass Art ware /
Handicrafts with glass chatons (702005) has been added in the drawback schedule, said apex handicraft
exporters body, Export Promotion Council for Handicrafts (EPCH).
GSTN signs MOU with DGFT for sharing of foreign exchange realization data: The Goods and
Services Network (GSTN) has signed a Memorandum of Understanding (MoU) with Director General of
Foreign Trade (DGFT) for sharing of foreign exchange realization and Import Export code data, a move that is
expected to strengthen processing of export transactions of taxpayers under GST, increase transparency and
reduce human interface. So far 100 banks operating in India, including foreign banks and cooperative banks
have uploaded more than 1.9 Crore e-BRCs on to the DGFT server.
Anti-dumping duty on 21 flat-rolled products of non-alloy steel in offing: According to steel
secretary Shri Aruna Sharm, anti-dumping duty on 21 flat-rolled products of non-alloy steel such as
corrugated sheets are in the offing, the notified provisional anti-dumping duty on 15 wire rod of alloy or
non-alloy products would be implemented soon. Following the imposition of minimum import price (MIP)
on 173 steel products in the range of $341-752 per tonne for six months in February, aimed at containing
imports, the government in August imposed anti-dumping duty on 107 of these products and extended MIP
on the remaining 66 items twice each time for two months in August and in October.
Government notifies 100% Foreign Direct Investment (FDI) in Other Financial Services : The
Government has liberalized its FDI policy on Other Financial Services and Non-Banking Finance Companies
(NBFCs) which includes Financial Services activities regulated by financial sector regulators, viz., RBI, SEBI,
IRDA, PFRDA, NHB or any other financial sector regulator as may be notified by the Government of India.
100% of Equity/FDI Cap has been allowed in Other Financial Services through automatic route.
6. Macroeconomic Developments
India’s GDP grows at 7.3% in Q2 2016-17: GDP at constant (2011-12) prices in Q2 of 2016-17 is
estimated at Rs. 29.63 lakh crore, as against Rs. 27.62 lakh crore in Q2 of 2015-16, showing a growth rate of
7.3 percent. Quarterly GVA at Basic Price at constant (2011-12) prices for Q2 of 2016-17 is estimated at Rs.
27.33 lakh crore, as against Rs. 25.52 lakh crore in Q2 of 2015-16, showing a growth rate of 7.1 % over the
corresponding quarter of previous year.
October core infra grows at 6.6% The core infrastructure grows at 6.6% in October 2016 as against 5% in
September 2016. The combined Index of Eight Core Industries stands at 188.1 in October, 2016 with a
growth of 6.6% as compared to index of October 2015. Crude Oil and Natural gas growth stands at (-) 3.2%
and (-) 1.4% respectively in the month of October 2016. In cumulative terms, core infrastructure industries
registered a growth of 4.9% during April-Oct 2016-17 as against 2.8% during the corresponding period of the
previous year.
September 2016 fiscal deficit registered at 83.9% of actual to BEs: The gross fiscal deficit of the
Central government stands at 83.9% of the actuals to budget estimates at the end of September 2016 as
compared to 68.1% of the actuals to budget estimates in the corresponding period of the previous year.
17
PHD Research Bureau | November 2016
The primary deficit was registered at 569.3% of the actuals to budget estimates at the end of September
2016 as compared to 181.8% of the actuals to budget estimates during corresponding period of the
previous year
October 2016 CPI inflation stands at 4.2%: The all India general CPI (Combined) for October 2016 stands
at 4.2% as compared to 4.4% in September 2016. The inflation rates for rural and urban areas for October
2016 are 4.78% and 3.54% as compared to 5.04% and 3.64% respectively, for September 2016. Rate of
inflation during October 2016 for pulses and products stands at 4.11%, Sugar and Confectionary at 23.62%,
Egg at 9.42% and Vegetables at (-) 5.74%.
October 2016 WPI inflation stands at 3.39%: Driven by the fall in the prices of rice, wheat, pulses,
potato, fruits, egg, meat and fish, WPI inflation stands at 3.39% in October 2016 as compared to 3.57% (Y-
O-Y) in September 2016. The index for this major group rose by 0.1% to 182.9 from 182.8 for the previous
month. Build up inflation rate in the financial year so far was 4.34% as compared to a build up rate of
0.45% in the corresponding period of the previous year.
India’s External Commercial Borrowings (ECBs) stood at USD 1.5 billion during October 2016:
Indian firms have raised about USD 1.5 billion through external commercial borrowings (ECBs) in the month
of October 2016 as against USD 2.1 billion during October 2015 by automatic and approval route. The
borrowings stood at USD 1.6 billion in September 2016.
Public Debt Management for the Second (Q2) Quarter (July-September, 2016) released: During Q2
of FY17, the Government issued dated securities worth Rs. 176,000 crore taking the gross borrowings during
H1 FY17 to Rs. 341,000 crore or 56.8 per cent of BE, vis-a-vis 58.5 per cent of BE in H1 FY 16. Net market
borrowings during H1 FY 17 was at Rs.124,777crore, 55.1 per cent of BE. Auctions, both Government dated
Securities and Treasury Bills, during Q2 of FY17 were held in accordance with the pre-announced issuance
calendar.
India picture gets brightens as PMI, auto sales rise: According to the Nikkei purchasing managers’
index (PMI) survey, the manufacturing sector growth touched a 22-month high during the month on the
back of a rise in new orders, output and stocks of purchases. The headline manufacturing PMI touched 54.4
in October, compared with 52.1 in the previous month. Any reading above 50 points indicates expansion,
while one below that mark suggests contraction. The manufacturing PMI is a composite index comprising
five individual indexes such as new orders, output, employment, suppliers’ delivery time and stock of items
purchased.
7. Miscellaneous Developments
Cabinet approves liberalization, simplification and rationalization of Visa regime in India: The
Union Cabinet chaired by the Prime Minister Shri Narendra Modi has given its approval for liberalization,
simplification and rationalization of the existing visa regime in India, and incremental changes in the visa
policy decided by the Ministry of Home Affairs in consultation with various stakeholders and with approval
of the Home Minister. The approval will facilitate entry of foreigners for tourism, business and medical
purposes. This is expected to stimulate economic growth, increase earnings from export of services like

18
PHD Research Bureau | November 2016
tourism, medical value travel and travel on account of business and to make ‘Skill India’, ‘Digital India’,
‘Make in India’ and other such flagship initiatives of the Government successful.
Ministry of Petroleum and Natural Gas and Ministry of Skill Development and Entrepreneurship
sign MoU to boost to skill initiatives in the Hydrocarbon Sector: The Ministry of Petroleum & Natural
Gas (MoPNG) and Ministry of Skill Development & Entrepreneurship (MSDE) signed a Memorandum of
Understanding (MoU) to scale up skill development initiatives in the Hydrocarbon and allied sectors among
other areas of cooperation. Under the MoU, MoPNG will continue to support the growth of the
Hydrocarbon Sector Skill Council and align with the NSQF for skill development programs. Additionally,
MoPNG will encourage Oil & Gas Companies and related contractors to hire skilled personnel, incentivize
skill training & certification, promote apprenticeship programs, undertake Recognition of Prior Learning
(RPL) programs in the sector and setup institutes focused on various sub-sectors and allied trades. MoPNG
will catalyse these initiatives in the Hydrocarbon sector, through its various agencies and PSUs, and develop
a plan in close alignment with the Skill India mission.
Delhi overtook Mumbai to become India’s economic capital: Delhi has been ranked 30th in Oxford
Economics’ study of the top 50 metropolitan entities globally for the year 2015, whereas the country’s
financial capital, Mumbai, is ranked 31st. According to Oxford Economics findings, Delhi Extended Urban
Agglomeration (EUA) consisting of Delhi, Gurgaon, Faridabad, Noida and Ghaziabad had a GDP of USD 370
billion, in terms of purchasing power parity (PPP). In comparison, the GDP of Mumbai EUA (Mumbai, Navi
Mumbai, Thane, Vasai, Virar, Bhiwandi and Panvel) was pegged at USD 368 billion.
World cotton stocks to dip 7% in 2016-17: According to International Cotton Advisory Committee
(ICAC), World ending stocks of cotton are forecast to decrease by 7 per cent to 17.8 million tons at the end
of 2016-17 as China continues to reduce its stocks. Ending stocks in China, where much of the excess stocks
are held, dipped 13 per cent to 11.3 million tons as the government sold over 2 million tons from its reserves
from May through September 2016. From 2009-10 to 2014-15, world ending stocks increased by 140 per
cent and reached a world record of 22.2 million tons. In 2015-16, the drop in world production led to a 14
per cent reduction in stocks to 19.1 million tons.
Surge in Foreign Tourist Arrivals (FTAs) by 13.4% in Sep – 2016: India witnessed 6.15 lakh Foreign
Tourist Arrivals (FTAs) during September 2016, compared to 5.42 lakh during the month of September 2015,
and 5.09 lakh in September 2014. In addition, FTAs in India during January – September 2016 stood at 62.07
lakh, registering a growth of 10.5% as compared to 56.15 lakh with growth of 4.8% in January – September
2015 over January – September 2014.

19
PHD Research Bureau | November 2016
PPHHDD RReesseeaarrcchh BBuurreeaauu
PPHHDD CChhaammbbeerr ooff CCoommmmeerrccee aanndd IInndduussttrryy
20
PHD Research Bureau | November 2016
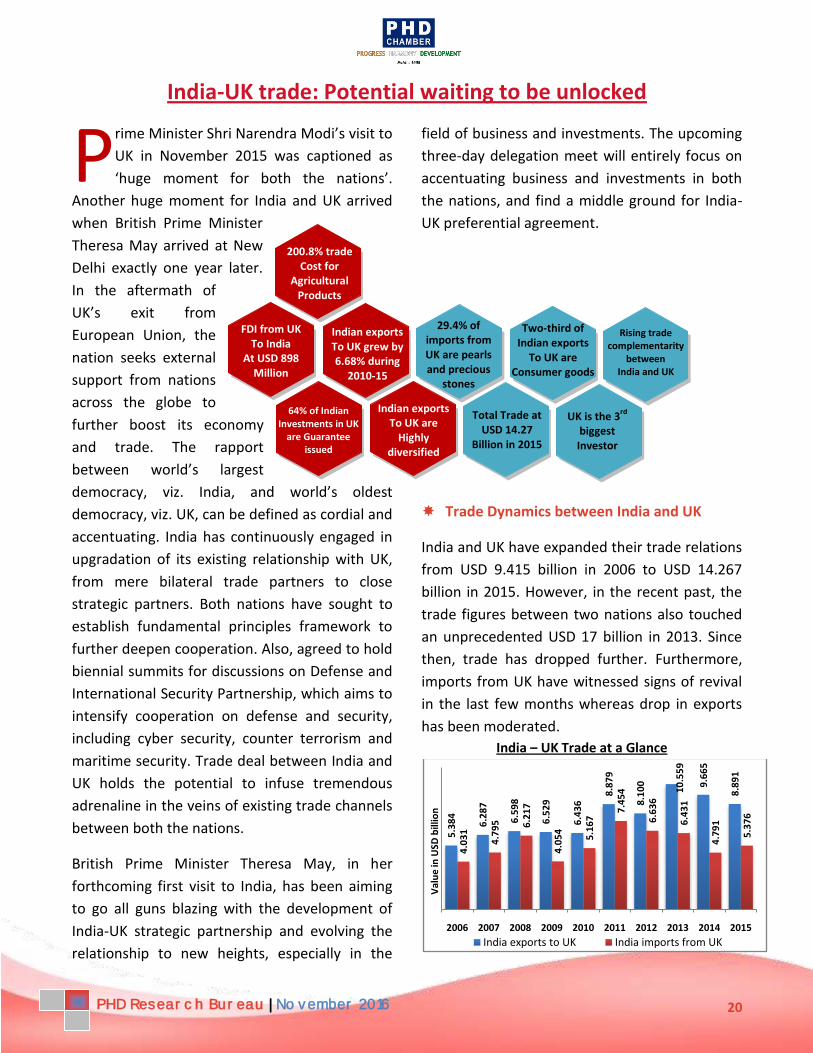
India-UK trade: Potential waiting to be unlocked
rime Minister Shri Narendra Modi’s visit to
UK in November 2015 was captioned as
‘huge moment for both the nations’.
Another huge moment for India and UK arrived
when British Prime Minister
Theresa May arrived at New
Delhi exactly one year later.
In the aftermath of
UK’s exit from
European Union, the
nation seeks external
support from nations
across the globe to
further boost its economy
and trade. The rapport
between world’s largest
democracy, viz. India, and world’s oldest
democracy, viz. UK, can be defined as cordial and
accentuating. India has continuously engaged in
upgradation of its existing relationship with UK,
from mere bilateral trade partners to close
strategic partners. Both nations have sought to
establish fundamental principles framework to
further deepen cooperation. Also, agreed to hold
biennial summits for discussions on Defense and
International Security Partnership, which aims to
intensify cooperation on defense and security,
including cyber security, counter terrorism and
maritime security. Trade deal between India and
UK holds the potential to infuse tremendous
adrenaline in the veins of existing trade channels
between both the nations.
British Prime Minister Theresa May, in her
forthcoming first visit to India, has been aiming
to go all guns blazing with the development of
India-UK strategic partnership and evolving the
relationship to new heights, especially in the
field of business and investments. The upcoming
three-day delegation meet will entirely focus on
accentuating business and investments in both
the nations, and find a middle ground for India-
UK preferential agreement.
Trade Dynamics between India and UK
India and UK have expanded their trade relations
from USD 9.415 billion in 2006 to USD 14.267
billion in 2015. However, in the recent past, the
trade figures between two nations also touched
an unprecedented USD 17 billion in 2013. Since
then, trade has dropped further. Furthermore,
imports from UK have witnessed signs of revival
in the last few months whereas drop in exports
has been moderated.
India – UK Trade at a Glance
5.3
84
6.2
87
6.5
98
6.5
29
6.4
36
8.8
79
8.1
00
10
.55
9
9.6
65
8.8
91
4.0
31
4.7
95 6.2
17
4.0
54
5.1
67
7.4
54
6.6
36
6.4
31
4.7
91
5.3
76
2006 2007 2008 2009 2010 2011 2012 2013 2014 2015
Val
ue
in U
SD b
illio
n
India exports to UK India imports from UK
P
Total Trade at USD 14.27
Billion in 2015
Two-third of Indian exports
To UK are Consumer goods
29.4% of imports from UK are pearls and precious
stones
Rising trade complementarity
between India and UK
200.8% trade Cost for
Agricultural Products
FDI from UK To India
At USD 898 Million
64% of Indian Investments in UK
are Guarantee issued
Indian exports To UK are
Highly diversified
Indian exports To UK grew by 6.68% during
2010-15
UK is the 3rd
biggest Investor in India
21
PHD Research Bureau | November 2016
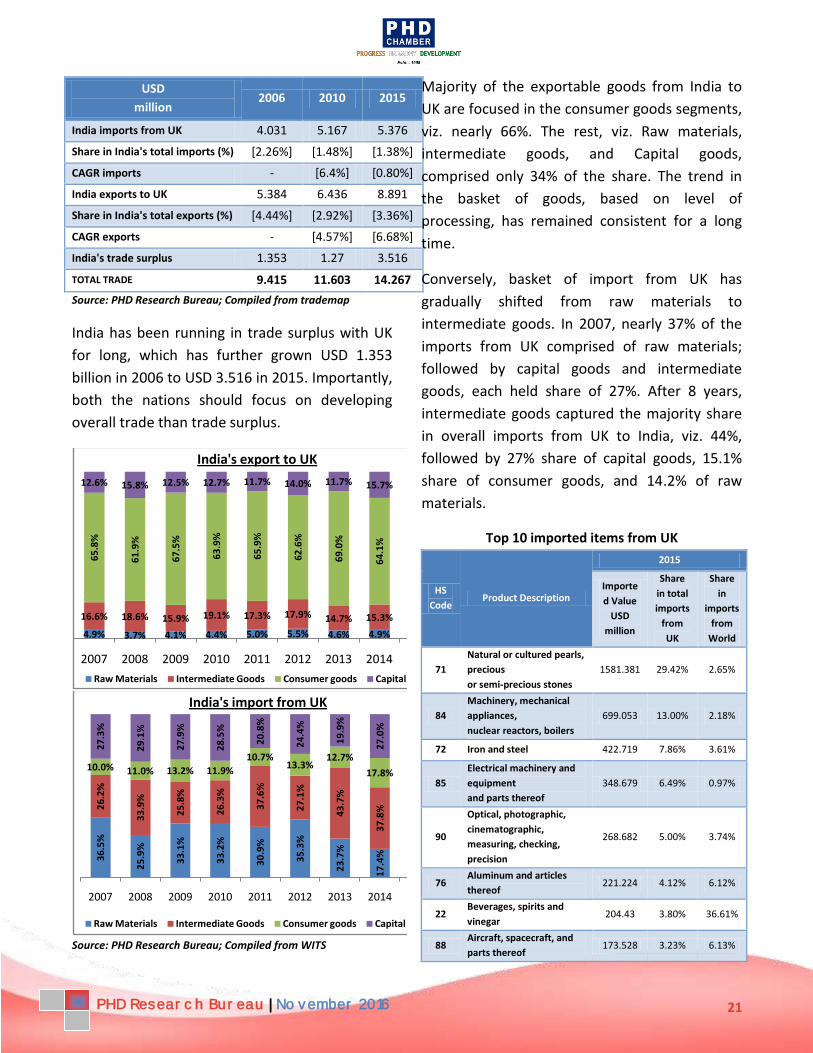
USD
million 2006 2010 2015
India imports from UK 4.031 5.167 5.376
Share in India's total imports (%) [2.26%] [1.48%] [1.38%]
CAGR imports - [6.4%] [0.80%]
India exports to UK 5.384 6.436 8.891
Share in India's total exports (%) [4.44%] [2.92%] [3.36%]
CAGR exports - [4.57%] [6.68%]
India's trade surplus 1.353 1.27 3.516
TOTAL TRADE 9.415 11.603 14.267
Source: PHD Research Bureau; Compiled from trademap
India has been running in trade surplus with UK
for long, which has further grown USD 1.353
billion in 2006 to USD 3.516 in 2015. Importantly,
both the nations should focus on developing
overall trade than trade surplus.
Source: PHD Research Bureau; Compiled from WITS
Majority of the exportable goods from India to
UK are focused in the consumer goods segments,
viz. nearly 66%. The rest, viz. Raw materials,
intermediate goods, and Capital goods,
comprised only 34% of the share. The trend in
the basket of goods, based on level of
processing, has remained consistent for a long
time.
Conversely, basket of import from UK has
gradually shifted from raw materials to
intermediate goods. In 2007, nearly 37% of the
imports from UK comprised of raw materials;
followed by capital goods and intermediate
goods, each held share of 27%. After 8 years,
intermediate goods captured the majority share
in overall imports from UK to India, viz. 44%,
followed by 27% share of capital goods, 15.1%
share of consumer goods, and 14.2% of raw
materials.
Top 10 imported items from UK
HS
Code Product Description
2015
Importe
d Value
USD
million
Share
in total
imports
from
UK
Share
in
imports
from
World
71
Natural or cultured pearls,
precious
or semi-precious stones
1581.381 29.42% 2.65%
84
Machinery, mechanical
appliances,
nuclear reactors, boilers
699.053 13.00% 2.18%
72 Iron and steel 422.719 7.86% 3.61%
85
Electrical machinery and
equipment
and parts thereof
348.679 6.49% 0.97%
90
Optical, photographic,
cinematographic,
measuring, checking,
precision
268.682 5.00% 3.74%
76 Aluminum and articles
thereof 221.224 4.12% 6.12%
22 Beverages, spirits and
vinegar 204.43 3.80% 36.61%
88 Aircraft, spacecraft, and
parts thereof 173.528 3.23% 6.13%
4.9% 3.7% 4.1% 4.4% 5.0% 5.5% 4.6% 4.9% 4.7%
16.6% 18.6% 15.9% 19.1% 17.3% 17.9% 14.7% 15.3% 15.3%
65
.8%
61
.9%
67
.5%
63
.9%
65
.9%
62
.6%
69
.0%
64
.1%
12.6% 15.8% 12.5% 12.7% 11.7% 14.0% 11.7% 15.7% 14.6%
2007 2008 2009 2010 2011 2012 2013 2014 2015
India's export to UK
Raw Materials Intermediate Goods Consumer goods Capital goods
36
.5%
25
.9%
33
.1%
33
.2%
30
.9%
35
.3%
23
.7%
17
.4%
26
.2%
33
.9%
25
.8%
26
.3%
37
.6%
27
.1%
43
.7%
37
.8%
10.0% 11.0% 13.2% 11.9%
10.7%13.3%
12.7%
17.8% 15.1%
27
.3%
29
.1%
27
.9%
28
.5%
20
.8%
24
.4%
19
.9%
27
.0%
2007 2008 2009 2010 2011 2012 2013 2014 2015
India's import from UK
Raw Materials Intermediate Goods Consumer goods Capital goods

22
PHD Research Bureau | November 2016
39 Plastics and articles
thereof 133.063 2.48% 1.17%
87
Vehicles other than
railway or tramway
rolling stock, and parts
and accessories thereof
107.711 2.00% 2.18%
Source: PHD Research Bureau; Compiled from trademap
Top imported items from UK comprised of
natural pearls and precious stones (29.42%),
followed by machinery and mechanical
appliances (13%), iron and steel (7.86%),
electrical machinery and equipment (6.49%)
among others. Interestingly, beverages, spirits
and vinegar imports from UK form a significant
share in the overall imports from world. Around
37% of the imports of beverages, spirits, and
vinegar in India are from UK.
Top 10 exported items to UK
HS
Code Product Description
2015
Exported
Value
USD
million
Share
in total
exports
to UK
Share in
overall
imports
in UK
62
Articles of apparel and
clothing accessories,
not knitted or crocheted
909.339 10.23% 6.93%
61
Articles of apparel and
clothing accessories,
knitted or crocheted
897.695 10.10% 6.72%
84
Machinery, mechanical
appliances,
nuclear reactors, boilers
678.888 7.64% 0.88%
71
Natural or cultured
pearls, precious or
semi-precious stones
522.723 5.88% 1.63%
87
Vehicles other than
railway or tramway
rolling stock, and parts
and accessories thereof
491.600 5.53% 0.63%
64
Footwear, gaiters and the
like;
parts of such articles
483.730 5.44% 6.62%
30 Pharmaceutical products 457.815 5.15% 1.36%
85
Electrical machinery and
equipment
and parts thereof
399.089 4.49% 0.66%
73 Articles of iron or steel 307.013 3.45% 3.38%
42
Articles of leather;
saddlery and
harness; travel goods,
292.514 3.29% 8.02%
etc.
Source: PHD Research Bureau; Compiled from trademap
Among top exported items to UK, Apparels and
clothing accessories, both knitted and non-
knitted, attained the top position.
Approximately, 21% of the Indian exports to UK
are in the form of apparels and clothing
accessories. It is followed by machinery (7.64%),
natural pearls and precious stones (5.88%), and
others.
Other top products exported by India to UK’s
market include vehicles, footwear,
pharmaceuticals, iron and steel articles. It can
also be highlighted that around 13.5% of the
overall UK’s import demand for apparels and
clothing accessories is fulfilled by India. Similarly,
around 8% of the UK’s import demand of leather
articles, travel goods, etc is fulfilled by India.
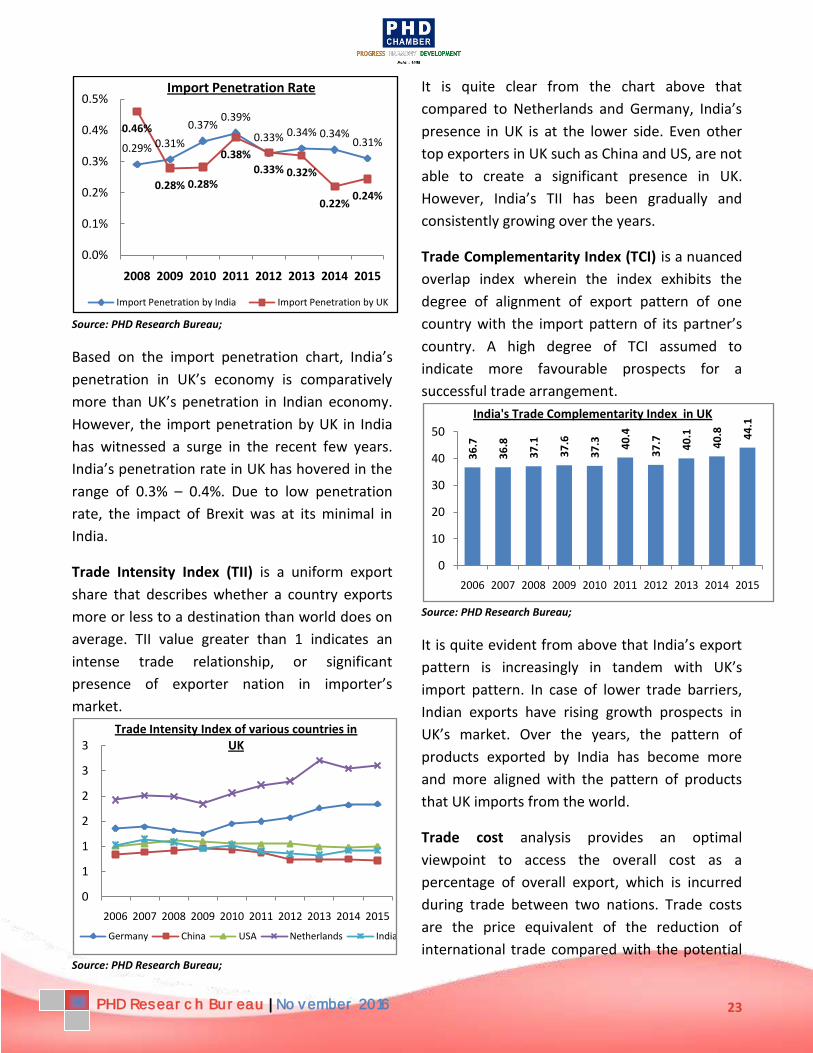
Bilateral Trade Analysis and Interpretation
Import Penetration (IP) Rate examines the
degree of domestic demand (the difference
between GDP and net exports) is satisfied by
imports. It is also termed as self-sufficiency ratio
at the sectoral level. At bilateral level, it is the
ratio of total imports from trade partner to
domestic demand, as a percentage. It provides a
broad scenario of the degree of vulnerability to
certain types of shocks in the partner’s economy.
IP rate lies between 0 (no imports) to 100%1
(when all domestic demand is satisfied by
imports only) – a case of no-domestic
production.
1 During application, Index can go beyond 100% if re-
exports are not accounted for.
23
PHD Research Bureau | November 2016
Source: PHD Research Bureau;
Based on the import penetration chart, India’s
penetration in UK’s economy is comparatively
more than UK’s penetration in Indian economy.
However, the import penetration by UK in India
has witnessed a surge in the recent few years.
India’s penetration rate in UK has hovered in the
range of 0.3% – 0.4%. Due to low penetration
rate, the impact of Brexit was at its minimal in
India.
Trade Intensity Index (TII) is a uniform export
share that describes whether a country exports
more or less to a destination than world does on
average. TII value greater than 1 indicates an
intense trade relationship, or significant
presence of exporter nation in importer’s
market.
Source: PHD Research Bureau;
It is quite clear from the chart above that
compared to Netherlands and Germany, India’s
presence in UK is at the lower side. Even other
top exporters in UK such as China and US, are not
able to create a significant presence in UK.
However, India’s TII has been gradually and
consistently growing over the years.
Trade Complementarity Index (TCI) is a nuanced
overlap index wherein the index exhibits the
degree of alignment of export pattern of one
country with the import pattern of its partner’s
country. A high degree of TCI assumed to
indicate more favourable prospects for a
successful trade arrangement.
Source: PHD Research Bureau;
It is quite evident from above that India’s export
pattern is increasingly in tandem with UK’s
import pattern. In case of lower trade barriers,
Indian exports have rising growth prospects in
UK’s market. Over the years, the pattern of
products exported by India has become more
and more aligned with the pattern of products
that UK imports from the world.
Trade cost analysis provides an optimal
viewpoint to access the overall cost as a
percentage of overall export, which is incurred
during trade between two nations. Trade costs
are the price equivalent of the reduction of
international trade compared with the potential
0.29% 0.31%
0.37%0.39%
0.33% 0.34% 0.34%0.31%
0.46%
0.28% 0.28%
0.38%
0.33% 0.32%
0.22%0.24%
0.0%
0.1%
0.2%
0.3%
0.4%
0.5%
2008 2009 2010 2011 2012 2013 2014 2015
Import Penetration Rate
Import Penetration by India Import Penetration by UK
0
1
1
2
2
3
3
2006 2007 2008 2009 2010 2011 2012 2013 2014 2015
Trade Intensity Index of various countries in UK
Germany China USA Netherlands India
36
.7
36
.8
37
.1
37
.6
37
.3 40
.4
37
.7 40
.1
40
.8 44
.1
0
10
20
30
40
50
2006 2007 2008 2009 2010 2011 2012 2013 2014 2015
India's Trade Complementarity Index in UK

24
PHD Research Bureau | November 2016
implied by domestic production and
consumption in the origin and destination
markets. Higher bilateral trade costs result in
smaller bilateral trade flows.
Source: PHD Research Bureau
The major impediment faced by Indian products
is from the category of Agricultural products. On
an average, agricultural products face a
staggering 200% of trade cost. On the other side,
manufacturing products face one of the lowest
trade cost, viz. around 92% in 2014.
In a nutshell, at an aggregate level, trade cost has
witnessed a sudden surge in 2014 primarily on
the back of rising agricultural trade cost and
abrupt rise in manufacturing trade cost as well.
Grubel – Lloyd Index (GLI) is an indicator to
measure the scale of intra-industry trade
between nations. Nations can hugely benefit
from intra-industry trade due to exploitation of
economies of scale. GLI lie between 0 and 100%,
wherein 0 indicates pure inter-industry trade and
100% indicates pure intra-industry trade.
Adjustments are made if there are any total
trade imbalances in a country.
India and Pakistan’s intra industry trade have
remained on the moderate side. Although,
satisfactory performance at IIT level, trend in
adjusted GLI suggests a significant drop since
2008.
Source: PHD Research Bureau;
Based on the adjusted GLI numbers, around
27.9% of the trade is intra-industry trade form in
2015. Intra-industry trade between India and UK,
however, witnessed a drop in rate from 31% in
2014. To develop trade further, it is essential for
both the nations to continuously indulge in high
intra-industry trade to exploit the economies of
scale.
Sectoral Hirschman Index (SHI) indicates the
sectoral concentration of a region’s exports. It
describes the degree to which a nation’s exports
are dispersed across different economic
activities. SHI lie between 0 and 1 wherein value
closer to 1 indicates that exports are
concentrated in fewer sectors.
Source: PHD Research Bureau;
26.3%
30.6%
27.1%
23.8%
28.2%
26.8%
31.0%
27.9%
2008 2009 2010 2011 2012 2013 2014 2015
Adjusted Grubel - Lloyd Index of IIT
0.230.21
0.230.26
0.24
0.29
0.19
0.25
0.14 0.14 0.130.16
0.13
0.18
0.12 0.12
2008 2009 2010 2011 2012 2013 2014 2015
SHI of India's imports and exports with UK
SHI Imports SHI Exports
102.27106.88107.46100.23
105.94103.0993.76
100.02
84.2391.57
206.84200.01205.08
197.68193.74197.10188.35192.60
198.70200.80
107.60111.51111.98104.72
110.48107.6597.97
104.3792.32
99.13
2005 2006 2007 2008 2009 2010 2011 2012 2013 2014
Advalorem Trade Cost between India and UK
Manufacturing Agriculture Total Trade

25
PHD Research Bureau | November 2016
Compared to imports from UK, India’s exports
are more diversified. Although both imports and
exports from UK are on the lower plane for
degree of concentration, imports witnessed a
plummet in diversification in the basket of
products from UK. Thus, imports from UK are
relatively more focused on fewer products than
India’s export to UK.
The crux of the above trade analysis suggest that
there lies huge potential of growth in trade
between India and UK, on the back of rising trade
complementarity, intensity and moderation in
trade costs. To further trade prospects, a serious
attempt has to be made by both nations to
develop intra-industry trade, viz. continuously
engage in trading of products from similar
industries.
The Investment Story
During the launch of the
marquee “Make in India”
campaign, Prime Minister
Shri Narendra Modi
asserted that FDI is a
responsibility of Indians
and an opportunity for
the world. The definition
of FDI, in his dictionary,
for the people of India is
‘First Develop India’.
Undoubtedly, collaboration of India and UK in
the realm of investment and business can truly
transform both the nation’s entrepreneurial
ecosystem.
In the past 16 years, UK has invested nearly USD
22 billion in various forms of Foreign Direct
Investment in India. It has been ranked 3rd
biggest investor in India, preceded by Mauritius
and Singapore.
Source: PHD Research Bureau;
Based on recent FDI statistics, India has been
able to attract USD 898 million during April 2015-
March 2016. Compared to the investments by UK
in 2011-12, the share in 2015-16 is miniscule.
Source: PHD Research Bureau;
As far as share goes, in the overall FDI attracted
by India, the numbers registered mundane
performance. Although UK is the third biggest
investor in India, there is an urgent need to
revive the falling share of UK in the recent past.
However, recently implemented conducive
business policies and initiatives such as liberation
of FDI norms, forthcoming GST mechanism,
among others will truly propel the inward
investments in a fast mode.
8981447
3215
1080
7874
755657
2015-162014-152013-142012-132011-122010-112009-11
Val
ue
in U
SD m
illio
n
Inward Investment from UK
2.24%
4.68%
13.23%
4.82%
22.42%
3.89%2.54%
2015-162014-152013-142012-132011-122010-112009-11
UK's share in Total FDI in India
Britain has invested nearly USD 22.002 billion as FDI in various forms. Of total FDI, Britain ranked 3rd with of 8.93%, preceded by Mauritius and Singapore.
26
PHD Research Bureau | November 2016
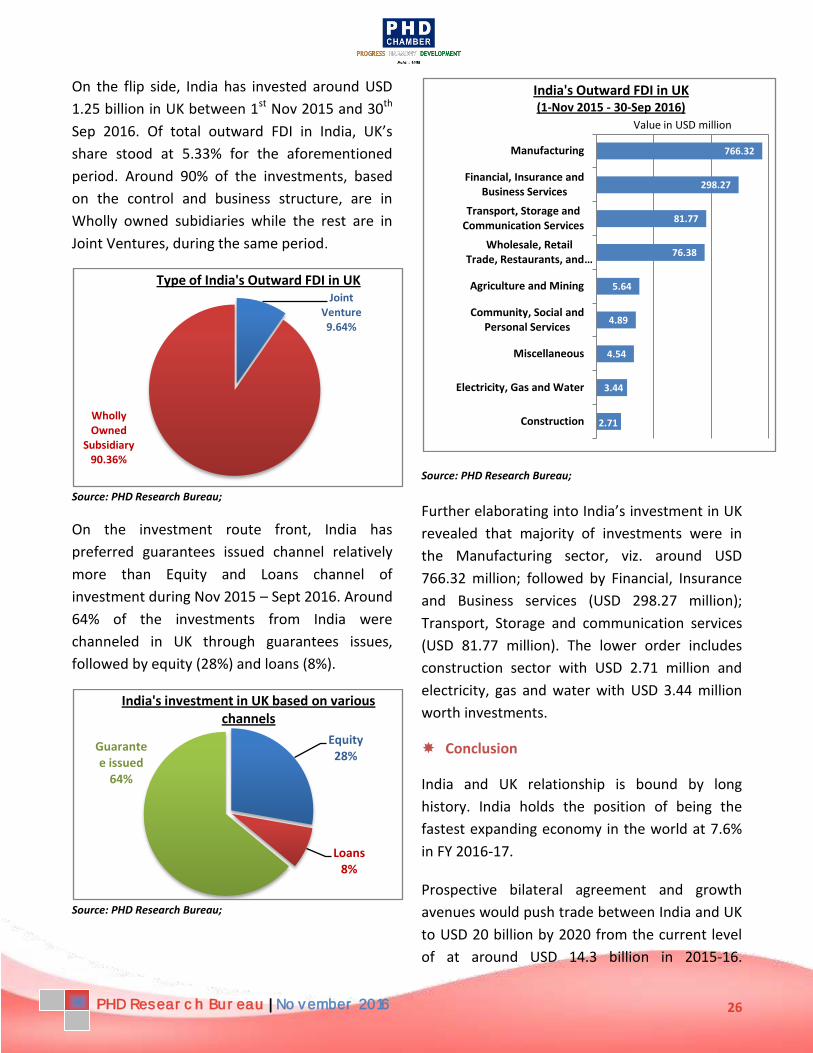
On the flip side, India has invested around USD
1.25 billion in UK between 1st Nov 2015 and 30th
Sep 2016. Of total outward FDI in India, UK’s
share stood at 5.33% for the aforementioned
period. Around 90% of the investments, based
on the control and business structure, are in
Wholly owned subidiaries while the rest are in
Joint Ventures, during the same period.
Source: PHD Research Bureau;
On the investment route front, India has
preferred guarantees issued channel relatively
more than Equity and Loans channel of
investment during Nov 2015 – Sept 2016. Around
64% of the investments from India were
channeled in UK through guarantees issues,
followed by equity (28%) and loans (8%).
Source: PHD Research Bureau;
Source: PHD Research Bureau;
Further elaborating into India’s investment in UK
revealed that majority of investments were in
the Manufacturing sector, viz. around USD
766.32 million; followed by Financial, Insurance
and Business services (USD 298.27 million);
Transport, Storage and communication services
(USD 81.77 million). The lower order includes
construction sector with USD 2.71 million and
electricity, gas and water with USD 3.44 million
worth investments.
Conclusion
India and UK relationship is bound by long
history. India holds the position of being the
fastest expanding economy in the world at 7.6%
in FY 2016-17.
Prospective bilateral agreement and growth
avenues would push trade between India and UK
to USD 20 billion by 2020 from the current level
of at around USD 14.3 billion in 2015-16.
Joint Venture9.64%
Wholly Owned
Subsidiary90.36%
Type of India's Outward FDI in UK
Equity28%
Loans8%
Guarantee issued
64%
India's investment in UK based on various channels
766.32
298.27
81.77
76.38
5.64
4.89
4.54
3.44
2.71
Manufacturing
Financial, Insurance and Business Services
Transport, Storage and Communication Services
Wholesale, Retail Trade, Restaurants, and …
Agriculture and Mining
Community, Social and Personal Services
Miscellaneous
Electricity, Gas and Water
Construction
Value in USD million
India's Outward FDI in UK (1-Nov 2015 - 30-Sep 2016)
27
PHD Research Bureau | November 2016
Indian exports into UK are mainly focused on
Consumer Goods, viz. nearly 65% of the total
exports. On the other hand, nearly 43.5% of the
total imports from UK are focused on
Intermediate goods.
Although the trend in India’s exports to UK has
remained in favour of consumer goods over the
years, India’s import from UK underwent
dramatic shift from raw materials, viz. 36.5% of
the overall imports from UK during 2007, to
intermediate goods, viz. 43.5% presently.
India’s penetration in the UK’s market has
remained consistent, UK’s penetration rate
revealed signs of substantial revival in the recent
past. Also, Indian products hold significant
footprint in the UK’s market based on the
intensity index of India in UK.
India’s export pattern has become more and
more aligned with the import pattern of UK over
time. Both nations witnessed a favorable
complementarity scenario, which exhibits
substantial potential trade gains for both the
nations.
Also, the basket of exportable products from
India remained opulently diversified compared
to the importable basket from UK over time,
thereby rendering Indian exporters relatively less
susceptible to volatility in a turbulent trade
scenario.
It has been indicated by Grubel-Lloyd Index that
India-UK trade emanates lower than expected
intra-industry trade figures and to push trade
further, both nations must engage in higher
intra-industry trade in the medium to long run.
Also, it is essential to reduce the exorbitant trade
cost between India and UK for agricultural
products to provide that much needed impetus
to the agrarian exports.
With further liberalization of FDI policy in
different segments and the advent of GST next
year, FDI from UK is expected to touch a new
growth trajectory. Undoubtedly, collaboration of
India and UK in the realm of investment and
business can truly transform both the nation’s
entrepreneurial ecosystem.
Going ahead, it is essential for both the parts to
become proactive and become prompt in
finalizing the bilateral agreement to rejuvenate
the falling trend in trade. Both nations should
continuously meet and engage in discussions
related to mitigating bilateral trade issues,
defense ties, renewable energy, skill
development and other vital areas.
Going ahead, growth prospects for trade and
development between two countries are very
promising and sustainable, not only for the
coming years but for the coming decades.

28
PHD Research Bureau | November 2016

29
PHD Research Bureau | November 2016
Trade Acronyms
ACP African, Caribbean and Pacific Group of States AD Anti-Dumping, AFTA ASEAN Free Trade Area APEC Asia-Pacific Economic Cooperation ASEAN Association of South East Asian Nations BIT bilateral investment treaty BOP Balance of Payments BRICS Brazil, Russian Federation, India, China, South Africa CACM Central American Common Market CAGR Compound Annual Growth Rate CARICOM Caribbean Common Market CEMAC Economic and Monetary Community of Central Africa CETA Comprehensive Economic and Trade Agreement CFC controlled foreign company CFIA Cooperative and Facilitation Investment Agreement CFTA African Continental Free Trade Agreement CIS Commonwealth of Independent States COMESA Common Market for Eastern and Southern Africa CPI Consumer Price Index CSR corporate social responsibility CV Countervailing Duties, DOB Denial Of Benefits DTT double-taxation treaty EAC East African Community ECCAS Economic Community of Central African States ECOWAS Economic Community of West African States EFTA European Free Trade Association EPA economic partnership agreement ERP Effective Rate of Protection ES Export Subsidies, EU European Union FDI Foreign Direct Investment FTA Free Trade Agreement GATS General Agreement on Trade in Services GCC Gulf Co-operation Council GCR Global Competitiveness Report GDP Gross Domestic Product GLI Grubel Lloyd Index GTIS Global Trade Information Services GVC global value chain HHI Hirschman Index HS Harmonized Commodity Description and Coding System IEA International Energy Agency IIA international investment agreement IMF International Monetary Fund IPA investment promotion agency IPFSD Investment Policy Framework for Sustainable Development ISDS investor–State dispute settlement ISIC International Standard Industrial Classification JV joint venture LDC least developed country LLDC landlocked developing country

30
PHD Research Bureau | November 2016
M Imports M&As mergers and acquisitions MERCOSUR Southern Common Market MFN Most Favoured Nation MNE multinational enterprise NAFTA North American Free Trade Agreement NES Not Elsewhere Specified NTM Non-Tariff Measures or Non-Tariff Barriers OECD Organization for Economic Cooperation and Development OFC offshore financial centre OIA outward investment agency PAIC Pan-African Investment Code PR Preference Tariff Rate PTA Preferential Trade Agreement QM Quality Margin QR Quantitative Restrictions, RCEP Regional Comprehensive Economic Partnership RTIA regional trade and investment agreements SAARC South Asian Association for Regional Co-operation SADC South African Development Community SAPTA South Asian Preferential Trade Arrangement SBA substantial business activities SDGs Sustainable Development Goals SEZ Special Economic Zone SG Safeguard measures, SHI Sectoral Hirschman Index SITC Standard International Trade Classification SPE special purpose entity SPS Sanitary and Phytosanitary Measures SSG Special Safeguard Measures, STE State Trading Enterprises TBT Technical Barriers to Trade TCI Trade Complementarity Index TIFA trade and investment framework agreement TII Trade Intensity Index TIP treaty with investment provision TISA Trade in Services Agreement TPP Trans-Pacific Partnership Agreement TRQ Tariff-rate Quotas, TTIP Transatlantic Trade and Investment Partnership UNCITRAL United Nations Commission on International Trade Law UNCTAD United Nations Conference on Trade and Development UNECE United Nations Economic Commission for Europe UNECLAC United Nations Economic Commission for Latin America and the Caribbean UNIDO United Nation Industrial Development Organization UNSD United Nations Statistics Division USD United States Dollar UV Unit Value WAEMU West African Economic and Monetary Union WEF World Economic Forum WIPS World Investment Prospects Survey WITS World Integrated Trade Solution WTO World Trade Organization X Exports
31
PHD Research Bureau | November 2016
Study/Project Team
Dr. S P Sharma
Chief Economist and Director of Research
Mr. Rohit Singh
Research Associate
Disclaimer
“Trade and Investment Facilitator” is prepared by PHD Chamber of Commerce and Industry to provide
a broad view of India’s foreign trade and investments developments. This newsletter may not be
reproduced, wholly or partly in any material form, or modified, without prior approval from the
Chamber.
It may be noted that this book is for guidance and information purposes only. Though due care has
been taken to ensure accuracy of information to the best of the PHD Chamber’s knowledge and belief,
it is strongly recommended that readers should seek specific professional advice before taking any
decisions.
Please note that the PHD Chamber of Commerce and Industry does not take any responsibility for
outcome of decisions taken as a result of relying on the content of this book. PHD Chamber of
Commerce and Industry shall in no way, be liable for any direct or indirect damages that may arise due
to any act or omission on the part of the Reader or User due to any reliance placed or guidance taken
from any portion of this book.
Copyright 2016
PHD Chamber of Commerce and Industry
ALL RIGHTS RESERVED.
No part of this book including the cover, shall be reproduced, stored in a retrieval system, or
transmitted by any means, electronic, mechanical, photocopying, recording or otherwise, without the
prior written permission of, and acknowledgement of the publisher (PHD Chamber of Commerce and
Industry).
32
PHD Research Bureau | November 2016
PHD Research Bureau
PHD Research Bureau; the research arm of the PHD Chamber of Commerce and Industry was
constituted in 2010 with the objective to review the economic situation and policy developments at
sub-national, national and international levels and comment on them in order to update the
members from time to time, to present suitable memoranda to the government as and when
required, to prepare State Profiles and to conduct thematic research studies on various socio-
economic and business developments.
The Research Bureau has been instrumental in forecasting various lead economic indicators national
and sub-national. Many of its research reports have been widely covered by media and leading
business newspapers.
Research
Activities
Comments on Economic
Developments Newsletters Consultancy
Research Studies Macro Economy Economic Affairs
Newsletter (EAC)
Trade & Inv.
Facilitation
Services (TIFS)
State Profiles States Development Economic & Business
Outlook (EBO)
Business
Research
Consultancy
Impact
Assessments
Infrastructure Global Economic
Monitor (GEM)
Forex Helpline
Thematic Research
Reports
Foreign exchange
market
Forex Newsletter Investment
Advisory
Services
Releases on
Economic
Developments
International Trade Trade & Inv.
Facilitator (TIF)
Global Economy State Development
Monitor (SDM)

33
PHD Research Bureau | November 2016
Team, PHD Research Bureau
Dr. S P Sharma
Chief Economist & Director of Research
Email id: [email protected]
Ms. Megha Kaul Associate Economist Economic reforms, Growth & Development
Ms. Rashmi Singh Associate Economist Global Economic Developments
Ms. Surbhi Sharma Sr. Research Officer Banking & Financial Markets
Ms. Mahima Kaushal Research Associate Economic & Business policy environment
Mr. Rohit Singh Research Associate International trade & Investments
Ms. Areesha Research Associate Infrastructure, Agriculture & Rural Development
Ms. Smriti Sharma Research Assistant Macro-Economic Developments
Ms. Abha Chauhan Research Assistant Macro-Economic Developments (State)
Ms. Sunita Gosain Secretarial Assistant Secretarial & Administrative processes
34
PHD Research Bureau | November 2016
Studies Undertaken by PHD Research Bureau
A: Thematic research reports
1. Comparative study on power situation in Northern and Central states of India (September
2011)
2. Economic Analysis of State (October 2011)
3. Growth Prospects of the Indian Economy, Vision 2021 (December 2011)
4. Budget 2012-13: Move Towards Consolidation (March 2012)
5. Emerging Trends in Exchange Rate Volatility (Apr 2012)
6. The Indian Direct Selling Industry Annual Survey 2010-11 (May 2012)
7. Global Economic Challenges: Implications for India (May 2012)
8. India Agronomics: An Agriculture Economy Update (August 2012)
9. Reforms to Push Growth on High Road (September 2012)
10. The Indian Direct Selling Industry Annual Survey 2011-12: Beating Slowdown (March 2013)
11. Budget 2013-14: Moving on reforms (March 2013)
12. India- Africa Promise Diverse Opportunities (November 2013)
13. India- Africa Promise Diverse Opportunities: Suggestions Report (November 2013)
14. Annual survey of Indian Direct Selling Industry-2012-13 (December 2013)
15. Imperatives for Double Digit Growth (December 2013)
16. Women Safety in Delhi: Issues and Challenges to Employment (March 2014)
17. Emerging Contours in the MSME sector of Uttarakhand (April 2014)
18. Roadmap for New Government (May 2014)
19. Youth Economics (May 2014)
20. Economy on the Eve of Union Budget 2014-15 (July 2014)
21. Budget 2014-15: Promise of Progress (July 2014)
22. Agronomics 2014: Impact on economic growth and inflation (August 2014)
23. 100 Days of new Government (September 2014)
24. Make in India: Bolstering Manufacturing Sector (October 2014)
25. The Indian Direct Selling Industry Annual Survey 2013-14 (November 2014)
26. Participated in a survey to audit SEZs in India with CAG Office of India (November 2014)
27. Role of MSMEs in Make in India with reference to Ease of Doing Business in Ghaziabad
(Nov 2014)
28. Exploring Prospects for Make in India and Made in India: A Study (January 2015)
29. SEZs in India: Criss-Cross Concerns (February 2015)
30. Socio-Economic Impact of Check Dams in Sikar District of Rajasthan (February 2015)
31. India - USA Economic Relations (February 2015)
32. Economy on the Eve of Union Budget 2015-16 (February 2015)
33. Budget Analysis (2015-16)
34. Druzhba-Dosti: India's Trade Opportunities with Russia (April 2015)

35
PHD Research Bureau | November 2016
35. Impact of Labour Reforms on Industry in Rajasthan: A survey study (July 2015)
36. Progress of Make in India (September 2015)
37. Grown Diamonds, A Sunrise Industry in India: Prospects for Economic Growth
(November 2015)
38. Annual survey of Indian Direct Selling Industry 2014-15 (December 2015)
39. India’s Foreign Trade Policy Environment Past, Present and Future (December 2015)
40. Revisiting the emerging economic powers as drivers in promoting global economic growth
(February 2016)
41. Bolstering MSMEs for Make in India with special focus on CSR (March 2016)
42. BREXIT impact on Indian Economy (July 2016)
43. India’s Exports Outlook (August 2016)
B: State profiles
44. Rajasthan: The State Profile (April 2011)
45. Uttarakhand: The State Profile (June 2011)
46. Punjab: The State Profile (November 2011)
47. J&K: The State Profile (December 2011)
48. Uttar Pradesh: The State Profile (December 2011)
49. Bihar: The State Profile (June 2012)
50. Himachal Pradesh: The State Profile (June 2012)
51. Madhya Pradesh: The State Profile (August 2012)
52. Resurgent Bihar (April 2013)
53. Life ahead for Uttarakhand (August 2013)
54. Punjab: The State Profile (February 2014)
55. Haryana: Bolstering Industrialization (May 2015)
56. Progressive Uttar Pradesh: Building Uttar Pradesh of Tomorrow (August 2015),
57. Suggestions for Progressive Uttar Pradesh (August 2015)
58. State profile of Telangana- The dynamic state of India (April 2016)
59. Smart Infrastructure Summit 2016- Transforming Uttar Pradesh (August 2016)
36
PHD Research Bureau | November 2016


