Embed Size (px)
Citation preview

1
Taklimat Laporan Tahunan 2009 dan Laporan Kestabilan Kewangan & Sistem Pembayaran 2009
Gabenor Bank Negara Malaysia24 Mac 2010
Embargo
Not for publication or broadcast before 1800 hours on Wednesday, 24 March 2010

2 Please check against delivery
Uneven global economic recovery in 2010
•
The global economy is on a recovery path:–
The advanced economies to record modest growth, supported by stimulus measures
– The emerging economies, particularly Asia, to lead the global growth
•
Global financial conditions have stabilised–
But lending activity in the advanced economies remains constrained

3 Please check against delivery
•
Modest growth in the advanced economies due to:
−
Persistent high unemployment
−
Restricted access to credit
−
Sluggish housing market
−
Continued de-leveraging by the private sector
−
Fiscal consolidation plans
Global Growth Projection for 2010
•
Better growth prospects in the emerging economies:
−
Stronger domestic demand
−
Robust financial sector
−
Growing intra-regional trade
Emerging economies leading the recovery
Source: IMF World Economic Outlook (WEO) (January 2010 Update), National
authorities, BNM estimates
2008 2009e 2010f
Annual change (%)
World GDP 3.0 -0.8 3.9
World Trade 2.8 -12.3 5.8
US 0.4 -2.4 2.7
Euro area 0.6 -4.1 1.0
Japan -1.2 -5.2 1.7
East Asia 6.9 5.1 7.7~7.9
Asian NIEs 1.7 -0.9 4.6~4.9
China 9.6 8.7 10.0
ASEAN-4 4.6 1.1 4.4~5.2
India 7.4 6.5 7.7

4 Please check against delivery
Financial conditions have improved but lending activities in the advanced economies yet to resume
-10
-5
0
5
10
15
20
25
Mar
-07
Jun-
07
Sep
-07
Dec
-07
Mar
-08
Jun-
08
Sep
-08
Dec
-08
Mar
-09
Jun-
09
Sep
-09
Dec
-09
yoy, %
Source: National authorities & Haver
1
Lending to non-financial corporations
Credit growth to private sector
UK1
Euro area
US0
0.5
1
1.5
2
2.5
3
3.5
4
4.5
5
Jan-
2007
Apr
-200
7
Jul-2
007
Oct
-200
7
Jan-
2008
Apr
-200
8
Jul-2
008
Oct
-200
8
Jan-
2009
Apr
-200
9
Jul-2
009
Oct
-200
9
Jan-
2010
LIBOR-OISTED spread
basis points
Source: Bloomberg
Interbank market spreads
Spreads have narrowed But credit growth remains negative

5 Please check against delivery
0
300
600
900
1200
1500
Prior 3Q07
4Q07
1Q08
2Q08
3Q08
4Q08
1Q09
2Q09
3Q09
4Q09
USD bn
0
50
100
150
200
250
300
350
400
450USD bn
Advanced economies losses
Advanced economies capital
Advanced economies cumulative losses (LHS)
Advanced economies cumulative capital (LHS)
Slow progress in financial sector resolution
•
Cumulative bank losses for
advanced economies expected to
reach USD2.6 trillion1
•
As at end-2009, realised
losses have reached USD1.7 trillion2
(65% of expected losses)
•
Continued deleveraging
process
•
Banks remain cautious in view of the ongoing financial reforms
Advanced economies refer to US and EuropeSource: Bloomberg and BNM calculations
1
Based on IMF estimate (October 2009 GFSR)2
BNM calculations based on Bloomberg data
Cumulative bank losses exceeding capital raised

6 Please check against delivery
Source: IMF and national authorities
•
Unprecedented stimulus measures during the crisis have led to rising fiscal deficit in many countries
•
Growing sovereign debt problems and fiscal consolidation may affect strength of growth
Fiscal balance as % of GDP
Large fiscal deficits and rising public debt levels in several advanced economies
-15
-13
-11
-9
-7
-5
-3
-1
Gre
ece
US
Irela
nd
UK
Spai
n
Japa
n
Por
tuga
l
2008 2009e

7 Please check against delivery
3Q 09 4Q 09 2009 2010f
Annual change (%)
Region1 5.5 8.6 5.1 7.7 ~ 7.9PR China 9.1 10.7 8.7 10.0
India 7.9 6.0 6.5 7.7
Indonesia 4.2 5.4 4.5 5.5 ~ 6.0
Singapore 0.6 4.0 -2.0 4.5 ~ 6.5Malaysia -1.2 4.5 -1.7 4.5 ~ 5.5Chinese Taipei -1.0 9.2 -1.9 4.7Korea 0.9 6.0 0.2 4.6
Hong Kong SAR -2.2 2.3 -2.7 4.0 ~ 5.0
Thailand -2.7 5.8 -2.3 3.5 ~ 4.5
Philippines 0.4 1.8 0.9 2.6 ~ 3.6f
forecast 1 excluding IndiaSource: National authorities, IMF
Regional economies to lead global growth Asian Region: Growth Outlook for 2010

8 Please check against delivery
Modest inflation in 2010
-6
-4
-2
0
2
4
6
8
10
Jan-
09
Feb-
09
Mar
-09
Apr
-09
May
-09
Jun-
09
Jul-0
9
Aug
-09
Sep
-09
Oct
-09
Nov
-09
Dec
-09
Jan-
10
Feb-
10
Indonesia Thailand PhilippinesSingapore Malaysia China
yoy,%
Regional inflation rates rising moderately •
Global inflation is expected to rise, albeit moderately in 2010 :
– Improving demand conditions
– Upward trend in commodity prices
•
But, underlying inflation is expected to remain contained

9 Please check against delivery
Uneven recovery to lead to differences in thrust of policy
0
2
4
6
8
10
2008 2009 2010
China
Thailand
Indonesia
Korea
%
Philippines
Malaysia
0
1
2
3
4
5
6
2008 2009 2010
%
US
Euro area
UKJapan
Regional economies: Stronger growth expected
Advanced economies: Recovery and improving financial conditions
Key interest rates, % Key interest rates, %

10 Please check against delivery
The Malaysian economy is projected to grow by 4.5% to 5.5% in 2010
•
Growth will be underpinned by strengthening domestic demand and an improving external environment
•
The underlying strong fundamentals will provide support to a private sector-led recovery
•
Continued access to financing key in supporting private sector-led growth
-2
-1
0
1
2
3
4
5
6
7
2001
2002
2003
2004
2005
2006
2007
2008
2009
p/
2010
f/
Annual change (%)
Source: Department of Statistics, Malaysia and Bank Negara Malaysia
4.5%
5.5%

11 Please check against delivery
Strengthening domestic demand to drive growth, reinforced by external demand
2009p 2010f 2009p 2010f
Annual change (%) Contribution to growth (p.p)
Domestic demand -0.4 3.2 -0.3 2.8Private sector -3.4 3.3 -2.2 2.1
Consumption 0.8 3.8 0.4 2.0Investment -21.8 0.7 -2.6 0.1
Public sector 7.7 2.7 1.9 0.7Consumption 3.7 -2.7 0.5 -0.4
Investment 12.9 9.3 1.3 1.1Net exports 8.4 -18.6 1.1 -2.7
Exports of G&S -10.1 7.7 -12.0 8.3Imports of G&S -12.5 11.7 -13.1 11.0
Real GDP -1.7 4.5 ~ 5.5 -1.7 4.5 ~ 5.5
12 Please check against delivery
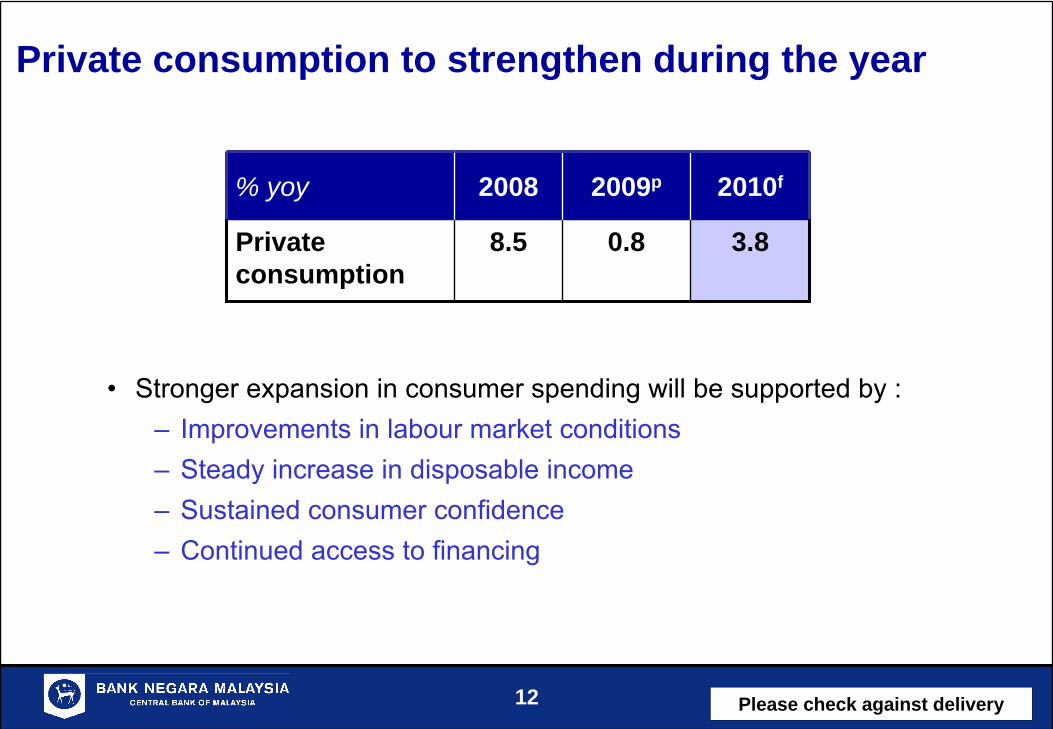
Private consumption to strengthen during the year
% yoy 2008 2009p 2010f
Private consumption
8.5 0.8 3.8
•
Stronger expansion in consumer spending will be supported by :–
Improvements in labour market conditions
– Steady increase in disposable income
– Sustained consumer confidence
– Continued access to financing

13 Please check against delivery
Improving labour market conditions in 2010
2.4
3.1
3.43.6
3.6
3.3
3.7
1.5
2.0
2.5
3.0
3.5
4.019
97
1998
1999
2000
2001
2002
2003
2004
2005
2006
2007
2008
2009
e
2010
f
Unemployment rate (as % of labour force)
-4
-2
0
2
4
6
8
10
annual change (%)
Employment (RHS) Labour force(RHS) Unemployment rate (LHS)
Lower unemployment rate in 2010
e Estimatef Forecast
Source: Economic Planning Unit

14 Please check against delivery
Private investment to recover gradually
% yoy 2008 2009p 2010f
Real private investment 0.8 -21.8 0.7
•
Capital spending is forecast to
recover
with the
strengthening of domestic and external demand
•
Improved business optimism and resumption of projects that have been deferred
Nominal Private Investment
0102030405060708090
2006 2007 2008 2009p/ 2010f/
RM billion
Agriculture Mining ManufacturingConstruction Services
Source: Department of Statistics, Malaysia and BNM
62.1
77.0 80.6
62.565.4

15 Please check against delivery
Gross FDI inflows sustained in 2010
• Gross inflows of FDI at RM32.4 billion in 2010
• Inflows into the manufacturing, services, and oil and gas sectors
Gross FDI inflows into Malaysia
32.4
25.4 27.1
37.3
46.2
31.6
49.0
0
10
20
30
40
50
2004 2005 2006 2007 2008 2009p 2010f
RM billion
p/ preliminary; f/ forecast
Source: Department of Statistics, Malaysia and Bank Negara Malaysia

16 Please check against delivery
Public sector to continue to support domestic demand in 2010
2009p 2010f
Annual change (%)
Public sector 7.7 2.7
Consumption 3.7 -2.7
Investment 12.9 9.3
Contribution to growth (p.p)
Public sector 1.9 0.7

17 Please check against delivery
External trade to expand in 2010Broad-based expansion in external trade
-30
-20
-10
0
10
20
30
2005 2006 2007 2008 2009e/ 2010f/
yoy (%)
-200
-100
0
100
200
RMb
Trade balance (RHS)Exports (LHS)Imports (LHS)
2009e 2010f
Annual change (%)
Gross exports -16.6 11.2
ManufacturedE&E
Non E&ECommodities
AgricultureMinerals
-12.5-11.0-14.5-27.6-21.6-32.2
10.110.010.316.312.819.4
Source: Department of Statistics, Malaysia and Bank Negara Malaysiae/ estimate f/ forecast
-16.6%
11.2%14.6%
-16.6%
RM116.7b
•
Export expansion to be more broad-based:
– Stronger external demand, particularly from the region
– Higher commodity prices
•
Imports to expand faster than exports:
– expansion in manufactured exports
– higher imports of consumption & capital goods

18 Please check against delivery
Source: Department Statistics, Malaysia and Bank Negara Malaysiap/ preliminary f/ forecast
Current account surplus to narrow but remains significant
•
Trade surplus to narrow as imports expand faster than exports
•
Recovery in external trade and outbound tourism will result in a marginal services deficit
•
Income deficit to widen due mainly to repatriation of profits and dividends by MNCs operating in Malaysia
Narrowing current account surplus
-50
-20
10
40
70
100
130
160
190
220
2006 2007 2008 2009p/ 2010f/
RMb
-5
0
5
10
15
20% GNI
Goods ServicesIncome Current transfersCurrent Account, % GNI (RHS)
14.3%17%
RM112.7b RM103.8b

19 Please check against delivery
Annual change (%) 2009p 2010f
Agriculture 0.4 3.1
Mining -3.8 2.5
Manufacturing -9.3 6.5
Construction 5.7 3.7
Services 2.6 4.9
Real GDP -1.7 4.5 ~ 5.5
Broad-based growth across all sectors

20 Please check against delivery
Services sector to be a key contributor to growth
Sub-sector2009p 2010f
Annual change (%)
Total Services 2.6 4.9
Finance & insurance 4.4 5.2
Real estate & business services 2.1 7.0
Wholesale & retail trade 1.2 4.4
Accommodation & restaurant 2.7 4.8
Transport & storage -2.8 4.8
Communication 6.0 6.5
Utilities 0.4 5.0
Other services 4.4 5.1
Government services 3.0 3.0
•
Higher demand for consumption-related services
•
Continued lending and financial intermediation activities
•
Recovery in trade and manufacturing-related services

21 Please check against delivery
Strong recovery in the manufacturing sector
•
Broad-based expansion across all clusters, reflecting:
Improved external demand
Strengthening of domestic demand
Value-added growth (% yoy)
2009p 2010f
Total Manufacturing -9.3 6.5
Export-oriented -11.7 6.7
E&E -18.7 9.6
Primary-related (e.g. chemicals, petroleum, rubber,
wood)-5.1 4.3
Domestic-oriented -4.5 6.2
Construction-related(e.g. iron & steel, cement)
-2.6 6.5
Consumer-related(e.g. food & beverages,transport equipment)
-9.4 5.4

22
Better performance in the agriculture and mining sectors
% yoy 2009p 2010f
Agriculture 0.4 3.1
Palm oil -1.0 1.1
Rubber -20.2 20.3
Mining -3.8 2.5
Crude Oil -4.4 1.8
Natural gas -4.0 2.5
Agriculture•
Production of palm oil and rubber are expected to increase to meet higher demand
Mining•
Higher crude oil production with the recovery in demand
•
Higher gas output partly reflecting LNG exports to China

23 Please check against delivery
Construction sector to maintain growth momentum
•
Growth supported by the second stimulus package, benefiting the civil engineering and non- residential sub-sectors, and the remaining projects under the Ninth Malaysia Plan
•
Continued growth in residential
sub-sector due to stronger demand
2.1
5.7
3.7
4.7
0
1
2
3
4
5
6
2007 2008 2009p/ 2010f/
% yoy
Growth in the Construction Sector

24 Please check against delivery
Headline inflation to remain modest at 2.0 – 2.5% in 2010
0
1
2
3
4
5
6
2005 2006 2007 2008 2009 2010/f
Annual change
(%)
Inflation Forecast for 2010
2.0 – 2.5%
• Price increase in 2010 modest reflecting :
– Improving demand conditions
– Potential adjustments to administered prices

25 Please check against delivery
OPR
2.0%
3.5%
2.25%
1.0
1.5
2.0
2.5
3.0
3.5
4.0
4.5
5.0
Jan-
08
Mar
-08
May
-08
Jul-0
8
Sep
-08
Nov
-08
Jan-
09
Mar
-09
May
-09
Jul-0
9
Sep
-09
Nov
-09
Jan-
10
Mar
-10
%
Monetary policy remains supportive of economic growth
The OPR was raised by 25 bps in March •
OPR was reduced to a historic low in early 2009 under extraordinary conditions
•
Given improved economic outlook, the OPR was adjusted in March 2010 to:
o
normalise monetary conditions
o
prevent the risk of financial imbalances that could undermine the economic recovery process
•
Monetary policy continues to remain accommodative to provide support to domestic economic activity

26 Please check against delivery
Continued access to financing is a key support to economic recovery
Net financing through banking system loans and PDS
Feb-109.9%
56789
1011121314
Jan-
09
Feb-
09
Mar
-09
Apr
-09
May
-09
Jun-
09
Jul-0
9
Aug
-09
Sep
-09
Oct
-09
Nov
-09
Dec
-09
Jan-
10
Feb-
10
yoy, %
Q3 09: 7.2%
Q4 09: 8.5%
•
Financing to businesses and households increasing, supported by :–
continued access to financing
– ample liquidity
– low interest rate environment
•
Expansion in other sources of financing
Domestic Sources of Financing for the Private Sector as at end 2009
PDS19%
DFIs6%
Other financial intermediaries
9%
Equities13%
Banking system loans53%

27 Please check against delivery
Commercial Banks' Lending Rates
4.85%
Average Lending Rate
5.76%
Base Lending Rate
4
6
8
10
12
14
Jan
95
Mar
96
May
97
Jul 9
8
Sep
99
Nov
00
Jan
02
Mar
03
May
04
Jul 0
5
Sep
06
Nov
07
Jan
09
Mar
10
%
15 M
ar 1
0p
Cost of financing remains low
• BLR responded to OPR adjustments
• Lending rates remained near historical lows :
– Base lending rate: 5.76% (15 March 2010)
– Average lending rate: 4.85% (end-Feb 2010)
P
Preliminary

28 Please check against delivery
Deposit rates have increased
Term Structure of FD rates
2.052.042.032.00
2.50
2.35
2.32.25
2.35
2.66
1.9
2.0
2.1
2.2
2.3
2.4
2.5
2.6
2.7
1 3 6 9 12
mths
% p.a.
Post OPR hike(15 Mar '10p)
Pre-OPR hike(Feb '10)
P
Preliminary
•
FD rates raised by 16-30 bps following increase in OPR

29 Please check against delivery
Domestic equity market recovered on improving economic conditions
KLCI and Bursa Malaysia sectoral indices
30
40
50
60
70
80
90
100
110
120
Jan-
08M
ar-0
8M
ay-0
8Ju
l-08
Sep
-08
Nov
-08
Jan-
09M
ar-0
9M
ay-0
9Ju
l-09
Sep
-09
Nov
-09
Jan-
10M
ar-1
0
Finance
KLCIIndustrial
Construction
Plantations
Index(Jan 2008=100)
Performance of Major Indices (% growth)
-50.6
-46.0
-49.2
-47.6
-48.3
-48.3
-40.7
-39.3
-38.5
-31.3
-42.1
87.0
78.3
64.5
63.2
63.0
52.0
49.7
45.2
23.5
22.1
19.0
-60 -40 -20 0 20 40 60 80 100
Indon
Taiwan
Spore
Thai
Phil
HK
Korea
Msia
US
UK
Jpn
%
2008 2009

30 Please check against delivery
Ringgit performance driven by external developments and improving domestic fundamentals
•
Ringgit was on a broad appreciating trend, in tandem with regional currencies
•
Generally, orderly ringgit adjustment
Regional: CNY, IDR, KRW, PHP, SGD, TWD, THBMajor: AUD, JPY, EUR, GBP
Movement of Currencies against USD (31 Dec 2008 - 23 Mar 2010)
90
95
100
105
110
115
Dec
-08
Jan-
09
Feb-
09
Mar
-09
Apr
-09
May
-09
Jun-
09
Jul-0
9
Aug
-09
Sep
-09
Oct
-09
Nov
-09
Dec
-09
Jan-
10
Feb-
10
Index 31 Dec 08 =100
Appreciation against USD
RegionalMajor
Ringgit

31 Please check against delivery
For Malaysia, policies will focus on strengthening private sector led growth
•
Strategies being put in place to transition Malaysia to ahigh value-added, high income economy
•
Measures to promote private investment –
incentives for high growth sectors
–
liberalisation of the economy–
privatisation of Government-owned corporations
•
Monetary policy to remain supportive of growth
•
Ensure continued access to financing

32
Bank Negara Malaysia Annual Accounts 2009

33 Please check against delivery
•
Total assets of BNM increased by RM18.5 billion to RM363 billion with international reserves of RM331.3 billion (USD96.7 billion)
•
Net profit of RM7.7 billion
•
Dividend paid amounted to RM2 billion
Financial position of the Bank remained strong in 2009

34
FINANCIAL STABILITY AND PAYMENT SYSTEMS REPORT 2009

35
Financial system stability was preserved, supported by a well- functioning financial intermediation process and orderly financial markets

36 Please check against delivery
High degree of financial system resilienceBanking sector (%) Dec 08 Jan 10Risk-weighted capital ratio 12.6 14.8
Core capital ratio 10.6 13.3Capital buffer (RM billion) 38.7 60.3Insurance sector (%) Dec 08 Dec 09Capital adequacy ratio 187.6 230.0
Capital buffer (RM billion) 12.3 18.6
•
Strong solvency position–
Forward looking capital management since 2008
–
High quality of capital
•
Loan quality intact–
Improved underwriting standards
–
Pro-active management of debts
–
Historical high provisions
•
Profitability sustained–
RoE
of 13.9% and RoA
of 1.2%0
2
4
6
8
10
12
2001 2002 2003 2004 2005 2006 2007 2008 2009 Jan'10
%Net NPL ratio
1.7%1.8%2.2%3.2%

37 Please check against delivery
0
2
4
6
8
10
12
Jan Feb Mar Apr May Jun Jul Aug Sep Oct Nov Dec
RM billionPDS issued
Loans approved - Large Businesses
2009
0
5
10
15
20
25
Jan Feb Mar Apr May Jun Jul Aug Sep Oct Nov Dec
RM billionLoans approved - HouseholdsLoans approved - SMEs
2009
Access to financing supported early recovery

38 Please check against delivery
Improving quality of loan portfolio
0
10
20
30
40
1Q 2Q 3Q 4Q 1Q 2Q 3Q 4Q 1Q 2Q 3Q 4Q
RM billion
0
1
2
3
4
5%
2- <3 month1- <2 month2- <3 month (% of total loans)1- <2 month (% of total loans)
2007 2008 20090
2
4
6
8
10
12
1Q 2Q 3Q 4Q 1Q 2Q 3Q 4Q 1Q 2Q 3Q 4Q
%
Large businesses SMEs Households2007 2008 2009
Stable loans-in-arrearsNPL ratio on steady decreasing trend

39 Please check against delivery
Financial stability supported by supervisory vigilance and robust prudential framework•
Early and prompt detection and management of emerging risks–
Enhanced surveillance and stress testing –
Strengthening of home-host supervisory engagementto support consolidated supervision
•
Improved risk management and governance practices–
Implementation of more sophisticated approaches to assessments of capital adequacy under Basel II and Risk-Based Capital Framework
–
Continued strengthening of capital buffers to withstand potential shocks–
Enhanced liquidity framework to address market disruptions and foreign currency exposures
–
Continued improvements in governance practices–
Strengthened oversight capability of boards of financial institutions

40 Please check against delivery
Policy measures to enhance access to financing
•
Special funds–
SME Assistance Guarantee Scheme (RM 2 billion)
–
Working Capital Guarantee Scheme (RM 7 billion)–
Industry Restructuring Guarantee Scheme (RM 3 billion)
•
Avenues for debt restructuring–
Large corporations: Corporate Debt Restructuring Committee (CDRC)
–
SMEs
: Small Debt Resolution Scheme (SDRS)–
Individuals
: Agensi
Kaunseling
dan
Pengurusan
Kredit
(AKPK)
•
Avenues for complaints and financial advice–
BNM Integrated Contact Centre
–
ABMConnect
•
Introduction of credit enhancement agency in 2009–
Danajamin
Nasional
Berhad

41 Please check against delivery
Developmental strategies continued to be pursued - In addition to institutional arrangements, mechanisms and schemes for access to financing
• Enhance interlinkages with international economies
–
Liberalisation
plan for financial sector–
MoUs
to strengthen bilateral and multilateral cooperation–
Reinforce international dimension of Islamic finance
• Promote financial inclusion
–
Raise level of financial literacy –
Operational flexibilities for new branches and bancassurance
arrangements for insurance companies and takaful
operators
• Continuous priority on human capital development
–
Asian Institute of Finance (AIF) fully operationalised
to coordinate human capital development initiatives
–
Continuous enhancement to FSTEP programme
design and delivery–
Enhance FIDE programme
for boards of financial institutions

42 Please check against delivery
Outlook for domestic financial stability
•
Malaysian financial system has adequate buffers to withstand external risks and domestic challenges–
Banking system capitalisation expected to remain >10% under most
challenging stress test scenario
•
Downside risks mainly stem from external environment–
Sustainability of global economic recovery
–
Orderly exit from unconventional support measures
–
Reforms in global prudential regulations and regulatory structure
–
Destabilising capital flows

43 Please check against delivery
Supported by strengthened financial stability framework under Central Bank of Malaysia Act 2009
•
Greater clarity in mandates, functions and power
•
Captures core elements of macroprudential stability–
Ex-ante surveillance powers for timely risks identification
– Pre-emptive powers to avert or mitigate systemic risks
– Ex-post powers for resolution to reduce impact of instability
•
Complemented by strengthened framework for governance, transparency and accountability
•
Positions the Bank to effectively address current and future challenges

44 Please check against delivery
Areas of focus for financial sector in 2010•
Blueprint for financial sector development–
Develop a strong and stable financial sector that best serves Malaysia
–
Competitive, dynamic and inclusive financial system
•
Comprehensive review of existing legislations to ensure an effective and efficient legislative framework to: –
Align legislation with more principle-based and differentiated supervisory approaches
–
Enhance appropriate enforcement and resolution framework –
Achieve more consistent legal framework across different financial sectors
–
Strengthen market conduct regulation and supervision
•
Transition to enhanced deposit guarantee scheme
•
Greater internationalisation of sukuk
market

45 Please check against delivery
Thank you