Embed Size (px)
Citation preview
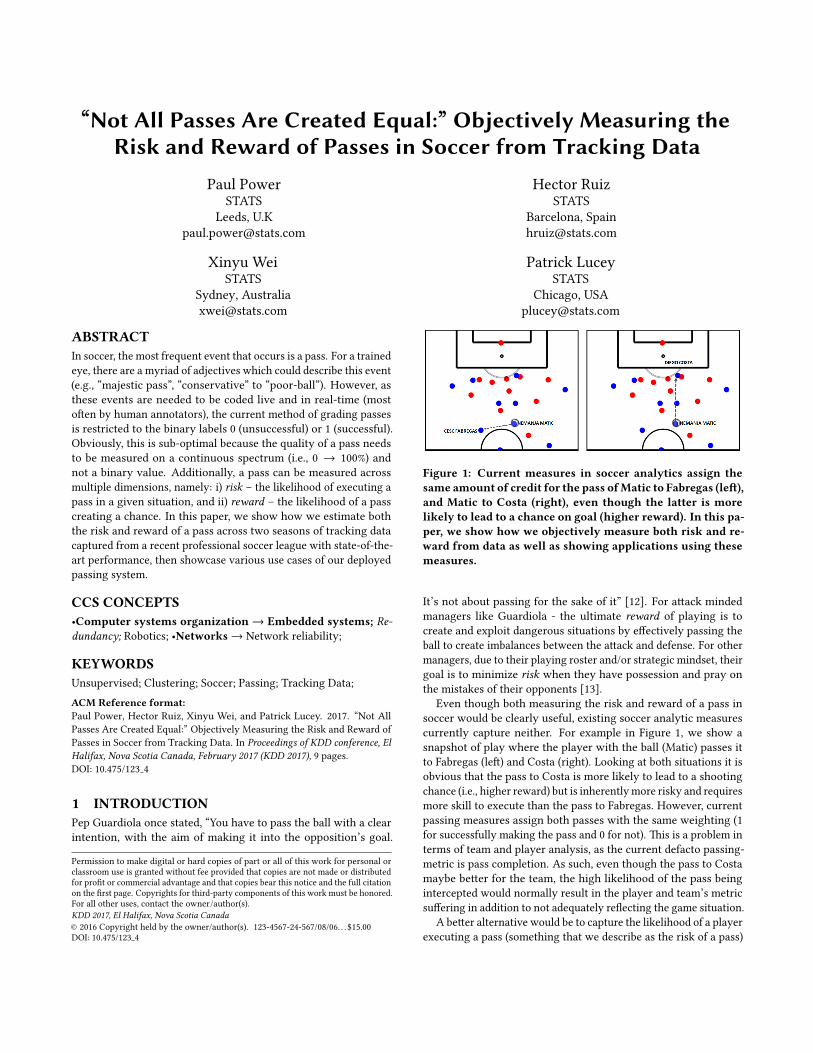
“Not All Passes Are Created Equal:” Objectively Measuring theRisk and Reward of Passes in Soccer from Tracking Data
Paul PowerSTATS
Leeds, [email protected]
Hector RuizSTATS
Barcelona, [email protected]
Xinyu WeiSTATS
Sydney, [email protected]
Patrick LuceySTATS
Chicago, [email protected]
ABSTRACTIn soccer, the most frequent event that occurs is a pass. For a trainedeye, there are a myriad of adjectives which could describe this event(e.g., “majestic pass”, “conservative” to “poor-ball”). However, asthese events are needed to be coded live and in real-time (mosto�en by human annotators), the current method of grading passesis restricted to the binary labels 0 (unsuccessful) or 1 (successful).Obviously, this is sub-optimal because the quality of a pass needsto be measured on a continuous spectrum (i.e., 0 ! 100%) andnot a binary value. Additionally, a pass can be measured acrossmultiple dimensions, namely: i) risk – the likelihood of executing apass in a given situation, and ii) reward – the likelihood of a passcreating a chance. In this paper, we show how we estimate boththe risk and reward of a pass across two seasons of tracking datacaptured from a recent professional soccer league with state-of-the-art performance, then showcase various use cases of our deployedpassing system.
CCS CONCEPTS•Computer systems organization ! Embedded systems; Re-dundancy; Robotics; •Networks ! Network reliability;
KEYWORDSUnsupervised; Clustering; Soccer; Passing; Tracking Data;ACM Reference format:Paul Power, Hector Ruiz, Xinyu Wei, and Patrick Lucey. 2017. “Not AllPasses Are Created Equal:” Objectively Measuring the Risk and Reward ofPasses in Soccer from Tracking Data. In Proceedings of KDD conference, ElHalifax, Nova Scotia Canada, February 2017 (KDD 2017), 9 pages.DOI: 10.475/123 4
1 INTRODUCTIONPep Guardiola once stated, “You have to pass the ball with a clearintention, with the aim of making it into the opposition’s goal.
Permission to make digital or hard copies of part or all of this work for personal orclassroom use is granted without fee provided that copies are not made or distributedfor pro�t or commercial advantage and that copies bear this notice and the full citationon the �rst page. Copyrights for third-party components of this work must be honored.For all other uses, contact the owner/author(s).KDD 2017, El Halifax, Nova Scotia Canada© 2016 Copyright held by the owner/author(s). 123-4567-24-567/08/06. . .$15.00DOI: 10.475/123 4
Figure 1: Current measures in soccer analytics assign thesame amount of credit for the pass ofMatic to Fabregas (le�),and Matic to Costa (right), even though the latter is morelikely to lead to a chance on goal (higher reward). In this pa-per, we show how we objectively measure both risk and re-ward from data as well as showing applications using thesemeasures.
It’s not about passing for the sake of it” [12]. For a�ack mindedmanagers like Guardiola - the ultimate reward of playing is tocreate and exploit dangerous situations by e�ectively passing theball to create imbalances between the a�ack and defense. For othermanagers, due to their playing roster and/or strategic mindset, theirgoal is to minimize risk when they have possession and pray onthe mistakes of their opponents [13].
Even though both measuring the risk and reward of a pass insoccer would be clearly useful, existing soccer analytic measurescurrently capture neither. For example in Figure 1, we show asnapshot of play where the player with the ball (Matic) passes itto Fabregas (le�) and Costa (right). Looking at both situations it isobvious that the pass to Costa is more likely to lead to a shootingchance (i.e., higher reward) but is inherentlymore risky and requiresmore skill to execute than the pass to Fabregas. However, currentpassing measures assign both passes with the same weighting (1for successfully making the pass and 0 for not). �is is a problem interms of team and player analysis, as the current defacto passing-metric is pass completion. As such, even though the pass to Costamaybe be�er for the team, the high likelihood of the pass beingintercepted would normally result in the player and team’s metricsu�ering in addition to not adequately re�ecting the game situation.
A be�er alternative would be to capture the likelihood of a playerexecuting a pass (something that we describe as the risk of a pass)

KDD 2017, February 2017, El Halifax, Nova Scotia Canada P. Power et. al.
Figure 2: Shows the pass with the least amount of “risk” (i.e.,likelihood of successfully executing a pass) –Matic to to Fab-regas, as well as the pass with the highest “reward” (i.e., like-lihood of a pass creating a chance on goal) – Matic to Costa.
as well as the likelihood that the pass will create a chance on goal(something that we describe as the reward of a pass). Figure 2showcases an example where such a metric could be useful inanalyzing the quality of a pass given the di�culty of each passingoption and the probability of the pass leading to a shot in a givensituation. We can now clearly capture that the pass to Costa isboth more di�cult to complete (40% vs 98%) and also increases theprobability of a shot occurring compared to the pass to Fabregas(+31% vs -2%). In this paper, we showcase how we can estimateboth the risk and reward of a pass in an objective manner.
At a high-level, there are two potential ways which we could�rst estimate the risk of a pass: i) human-labeled – where a humanexpert assigns a quality rating to each pass (e.g. bad/average/goodor 0-10) and we train a classi�er to emulate that expert (or hostof experts), or ii) event-outcome-labeled – where we optimize anobjective function which uses the outcome of pass event (e.g., 0 =unsuccessful pass, 1= successful pass).
While both approaches are valid, the event-outcome labeledapproach is preferred as the human-labeled approach is still inher-ently subjective (even at the expert level, consensus on what a goodpass is, is still ambiguous). �is is an important point, as if we aredeploying this at scale across many teams the idea of “the oracleof passing” is unsatisfying. A more satisfying explanation is to saythat our passing quality measure correlates with the likelihood ofexecuting a pass. Additionally, this approach allows us to start tomeasure the reward of the pass by correlating pass reward withother concrete events such as shot on goal.
In this paper, we show how we can objectively measure the riskand reward of a pass using player tracking and ball event data, aswell as applications of our deployed system across a host of usecases.
2 RELATEDWORKAlthough there is yet to be a large publicly available dataset forresearchers to compare ideas and methods on, some data has be-come available through vendors, which has facilitated with recentadvances in soccer analysis. �e majority of these works havesolely focused on using ball-event data, again because this has beenthe most common form of data. As such, some really good analysisof passes and team-play have occurred. Notable works includingLucey et al., [8, 9], which used an aggregated method of describ-ing passes to identity the characteristic playing pa�erns of teams.Gyramati et al. [4] and Wang et al. [15] conducted similar analysis.More recently Brooks et al., [2] describe a novel player rankingsystem based entirely on the value of passes completed.
In terms of directly measuring the passing quality through theuse of a supervised learning methodology, Horton et al., used do-main experts to create ground truth labels of good, OK and badfor passes in order to train a supervised learning model to clas-sify passing quality [6]. �e authors took inspiration from Takiand Hasegawa [14] work which looked to measure the dominantregion of a player in order to model the probability of a playersregion intercepting that of the ball. �e authors highlighted theissue of having con�icting agreement between the experts creatingthe training labels. �e same level of agreement was also capturedthrough the model as the experts however, the paper helped tohighlight the issue of relying upon expert opinion to create “theoracle of passing”. Link et al., [7] hand cra�ed a set of featuresusing player and ball spatial-temporal data; pressure, density, zoneand control to measure the dangerousness of a pass in the a�acking3rd of the pitch. McHale et al., [10] used a generalized additivemixed model to measure the probability of completing a pass whilsta�empting to control for the random e�ect of the team and player.Gyramati et al., [5] recently proposed a “QPass” method to quantifythe quality of a pass. Outside of soccer, Cervone et al., [3] proposeda model to capture an ’expected possession value’ to measure how aplayers decision increased or decreased the teams chance of scoringa point in basketball.
While these papers have helped to advance the techniques usedto measure the quality and e�ect of a pass, nearly all of thesemethods do not take into account both the game and team context- mainly due to the absence of tracking data which captures theseimportant contextual cues. We believe our paper advances theunderstanding of the game because of this added information.
3 MEASURING PASS RISK AND REWARD3.1 Data InventoryIn this paper, we used ball event data and player tracking datafrom the English Premier League games between 2014/15-2015/16seasons totaling 726 matches. Each match contains the trajectoriesof each player including; X and Y location sampled at 10hz; timestamp; player name; team name and match name. Event data�les include; the event name (e.g. pass, shot, tackle); ball X andY position for the origin and destination; ball time stamp; teamand player in possession; match name and identity of the opposingplayer involved in any duel situation such as a tackle or header.
In terms of passes within the sample for the two full seasons,571,287 passes were a�empted with 468,265 being successful with
Not All Passes Are Created Equally KDD 2017, February 2017, El Halifax, Nova Scotia Canada
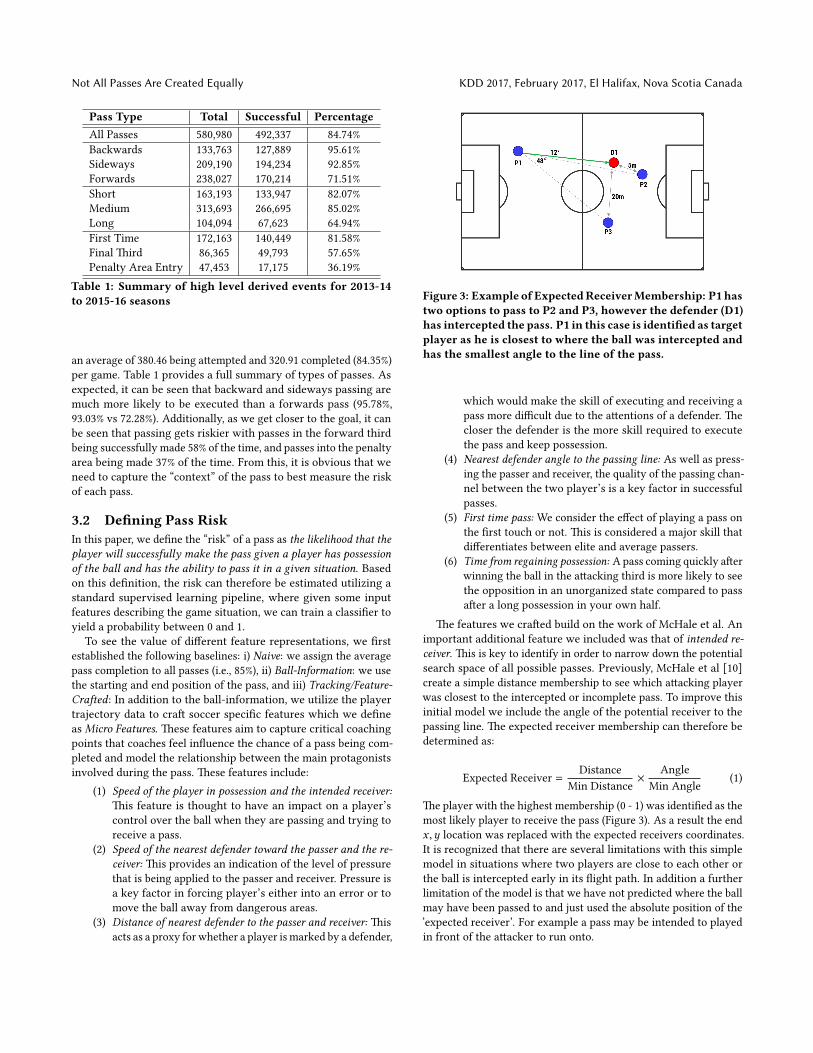
Pass Type Total Successful PercentageAll Passes 580,980 492,337 84.74%Backwards 133,763 127,889 95.61%Sideways 209,190 194,234 92.85%Forwards 238,027 170,214 71.51%Short 163,193 133,947 82.07%Medium 313,693 266,695 85.02%Long 104,094 67,623 64.94%First Time 172,163 140,449 81.58%Final�ird 86,365 49,793 57.65%Penalty Area Entry 47,453 17,175 36.19%
Table 1: Summary of high level derived events for 2013-14to 2015-16 seasons
an average of 380.46 being a�empted and 320.91 completed (84.35%)per game. Table 1 provides a full summary of types of passes. Asexpected, it can be seen that backward and sideways passing aremuch more likely to be executed than a forwards pass (95.78%,93.03% vs 72.28%). Additionally, as we get closer to the goal, it canbe seen that passing gets riskier with passes in the forward thirdbeing successfully made 58% of the time, and passes into the penaltyarea being made 37% of the time. From this, it is obvious that weneed to capture the “context” of the pass to best measure the riskof each pass.
3.2 De�ning Pass RiskIn this paper, we de�ne the “risk” of a pass as the likelihood that theplayer will successfully make the pass given a player has possessionof the ball and has the ability to pass it in a given situation. Basedon this de�nition, the risk can therefore be estimated utilizing astandard supervised learning pipeline, where given some inputfeatures describing the game situation, we can train a classi�er toyield a probability between 0 and 1.
To see the value of di�erent feature representations, we �rstestablished the following baselines: i) Naive: we assign the averagepass completion to all passes (i.e., 85%), ii) Ball-Information: we usethe starting and end position of the pass, and iii) Tracking/Feature-Cra�ed: In addition to the ball-information, we utilize the playertrajectory data to cra� soccer speci�c features which we de�neas Micro Features. �ese features aim to capture critical coachingpoints that coaches feel in�uence the chance of a pass being com-pleted and model the relationship between the main protagonistsinvolved during the pass. �ese features include:
(1) Speed of the player in possession and the intended receiver:�is feature is thought to have an impact on a player’scontrol over the ball when they are passing and trying toreceive a pass.
(2) Speed of the nearest defender toward the passer and the re-ceiver: �is provides an indication of the level of pressurethat is being applied to the passer and receiver. Pressure isa key factor in forcing player’s either into an error or tomove the ball away from dangerous areas.
(3) Distance of nearest defender to the passer and receiver: �isacts as a proxy for whether a player is marked by a defender,
Figure 3: Example of ExpectedReceiverMembership: P1 hastwo options to pass to P2 and P3, however the defender (D1)has intercepted the pass. P1 in this case is identi�ed as targetplayer as he is closest to where the ball was intercepted andhas the smallest angle to the line of the pass.
which would make the skill of executing and receiving apass more di�cult due to the a�entions of a defender. �ecloser the defender is the more skill required to executethe pass and keep possession.
(4) Nearest defender angle to the passing line: As well as press-ing the passer and receiver, the quality of the passing chan-nel between the two player’s is a key factor in successfulpasses.
(5) First time pass: We consider the e�ect of playing a pass onthe �rst touch or not. �is is considered a major skill thatdi�erentiates between elite and average passers.
(6) Time from regaining possession: A pass coming quickly a�erwinning the ball in the a�acking third is more likely to seethe opposition in an unorganized state compared to passa�er a long possession in your own half.
�e features we cra�ed build on the work of McHale et al. Animportant additional feature we included was that of intended re-ceiver. �is is key to identify in order to narrow down the potentialsearch space of all possible passes. Previously, McHale et al [10]create a simple distance membership to see which a�acking playerwas closest to the intercepted or incomplete pass. To improve thisinitial model we include the angle of the potential receiver to thepassing line. �e expected receiver membership can therefore bedetermined as:
Expected Receiver =Distance
Min Distance⇥ AngleMin Angle
(1)
�e player with the highest membership (0 - 1) was identi�ed as themost likely player to receive the pass (Figure 3). As a result the endx ,� location was replaced with the expected receivers coordinates.It is recognized that there are several limitations with this simplemodel in situations where two players are close to each other orthe ball is intercepted early in its �ight path. In addition a furtherlimitation of the model is that we have not predicted where the ballmay have been passed to and just used the absolute position of the’expected receiver’. For example a pass may be intended to playedin front of the a�acker to run onto.

KDD 2017, February 2017, El Halifax, Nova Scotia Canada P. Power et. al.
In terms of classi�ers used, we deployed a logistic regressor.�e reason why we chose a logistic regressor over a non linearblack box model, such as a random decision forest, is we wantedthe model to be interpretable. �is is an import feature of ourmodel as it is vital that a coach can understand what is drivingthe passing performance of a player. As such a coe�cient can bethought of as a coaching point. By using a linear model, we enforcethe linearization of the data to be done in the feature space (seenext subsection). To train the classi�ers we used 352,466 examples,and tuned the parameters on our evaluation set which consistedof 114,257 examples. We tested the various feature sets on 114,257examples. In terms of labels, all successfully executed passes werelabeled as positive examples, and all unsuccessful passes were thenegative examples.
3.3 De�ning Pass RewardWe de�ne the “reward” of a pass as given a player has possessionof the ball and has the ability to pass it in a given situation, passreward is estimating the likelihood that the pass made will resultin a shot within the next 10 seconds. We used a similar supervisedlearning approach but instead of using the labels of successful andunsuccessful passes, we used the labels of whether a shot occurredwithin 10 seconds of the pass or not. We chose a 10 second windowdue it being previously used to analyze shot outcome in recentliterature [11] and is heuristically a period of time used by coachesin practice.
As shots occur very sparsely, an obvious drawback is the in-balance in number of positive/negative examples in training theclassi�er. In our training set we had 7427 positive and 136180negative examples. In our test set we had a split of 3062 positiveand 58484 negative examples. �e performance of the classi�ersare shown in the right columns of Table 2, and it can be seen thatusing the tracking data obtains the best performance.
4 INCORPORATING CONTEXT4.1 Learning Context Directly from DataAs shown in Table 1 there is tremendous variation in the passingexecution rates depending on the context on where the pass istaken (e.g., backwards pass (⇡ 96%) vs pen-area entry (⇡ 37%)).Even though the features cra�ed from the tracking data capture thecontext at a micro-level, having high-level contextual informationat the team level may improve prediction – as well as provide usefulcontextual information for the coaches.
Features Pass Risk Pass RewardLog-Loss RMSE Log-Loss RMSE
Naive 0.4317 0.3621 0.1977 0.2174Ball-Only 0.3623 0.3306 0.1771 0.2185Tracking 0.3268 0.3194 0.1566 0.2045Tracking + Tactics 0.2918 0.2960 0.1560 0.2420Tracking + Formation 0.2125 0.2438 0.1391 0.1939
Table 2: Results of the various features used to describe passrisk.
As soccer is a highly strategic sport, capturing the strategicfeatures of teams is important in contextualizing analysis. As suchwe can think of our approach to creating a passing dictionaryas a set of leaf nodes within a tree structure (Figure 5). In theprevious section we have done a reasonable job of capturing themicrofeatures from the raw data. We need to now capture thetactical features (i.e., game-state) as well as the formation features(i.e., team-structure).
As we are only interested in analyzing passes, we focused solelyon open-play scenarios. In soccer coaching analysis, three distinctgame-states are used for analysis: i) build-up, ii) counter-a�ack,iii) unstructured-play. Not only does this approach enable the con-textualization of analysis, it also linearizes the data which shouldimprove our overall estimations of risk and reward. To test outthis method, we compared our previous models described in theprevious section to a model which incorporated these contextualfeatures. Initially, we only tested using the tactical features (track-ing + tactics). As can be seen in the bo�om half of Table 2 we showthat the overall prediction of risk and reward improved.
To obtain further contextual information, we then captured for-mation features - which is essentially ge�ing an indication of thelocation and spread of the players within the team structure. Todo this, we employed a formation clustering method described byBialkowski et al., [1].
By aligning players to a speci�c role it allows use to �nd similarsituations by using the XY positions of all players to describe theformation structure for both the a�acking and defending teams.�is is important as we can now capture if a pass is being playedbetween the lines of mid�elders and defenders or if a pass is at-tempting to break the �nal line of defenders. As we have alignedeach player to a role we can teach the model the spatial relationshipfor all players in relation to the goal by calculating the polar coordi-nates of all player to the goal being a�acked. Finally as we want tounderstand how di�erent roles impact the chances of completingpasses we calculate the polar coordinates of the defenders to thepasser and receiver.
A key tactical in�uence on the type of pass a�empted and there-fore the risk of completing a pass is the defensive block. A defensiveblock can be split into high-block, medium-block, and low-block.In order to generate a label for this we performed kmeans cluster-ing on the aligned player and ball data. Employing this approachyielded be�er risk and reward estimation (tracking + formation).
Examples of our tactical and formation features can be show inFigure 4. In the �rst example, we show a typical counter-a�ackwhere the ball has been regained by the blue team’s goal-keeperand quickly moved forward before the defense can reorganize. Wecan see by the player traces that the possession started in a highblock situation, we also see that due to the defenders being out ofposition the average passing risk was low while the average passreward was high due to their progressive nature. In the secondexample, shows a possession in the build-up phase in a mid-blockwhere the red team has passed the ball laterally to try and unlock ahighly organized defense. Due to the lateral nature of the passesthe average pass danger is lower. However, because the numberof defenders in front of the ball is higher than our counter a�ackexample, the skill level required to complete a more penetrativepass is larger.

Not All Passes Are Created Equally KDD 2017, February 2017, El Halifax, Nova Scotia Canada
Figure 4: Examples of possessions highlighting di�erent match contexts: (Le�) Counter-Attack - High Block, and (Right)Build-Up - Low Block. �e yellow line represents the Pass Risk and Pass Reward for each situation.
Figure 5: Our tree based method to add contextual featuresfor each model.
Figure 6: Above the line: An example of the standard statsprovided shows a basic summary of passing stats. Below theline: An example of advanced passing stats.
5 APPLICATION I: GAME ANALYSIS5.1 Match AnalysisExisting match summaries fail to provide a true insight into thestrategic concepts used by teams and how well they were able to ex-ecute them. Take Figure 6 for example, which illustrates the typicalpost-game summary of passing performance of two teams. Usingthe basic statistics, we can see that Manchester City dominatedpossession (55% vs 45%), and had more passes (402 vs 266) and ahigher completion rate (88% vs 82%). However, Manchester Unitedactually won the game 1-0. �is begs the question, were ManchesterUnited lucky or were they more e�ective in their possession comparedto City?. By using our pass risk and reward models we get a morerevealing picture.
�e two obvious measures to include are that of average passrisk and pass danger – the la�er is a synonym for pass reward,with higher values corresponding with more passes the team hasmade that leads to potential shots on goal. Additionally, we de�nedangerous pass which, is a pass that is in the top 25th percentileof passes with the highest reward. �is threshold is determinedfrom the training/evaluation set and not within game (i.e., it is a�xed threshold for all games). Using these values, we can see thatalthough Manchester City played nearly twice as many dangerouspasses than Manchester United (131 v 72), their passes were gener-ally less risky (14% v 17%) and more dangerous (16% v 13.5%). Fromthese measures, we can now get a sense of how the game is beingplayed.
5.2 Speci�c Play Analysis�e ability to play the critical pass that unlocks a defense is one ofthe most highly sort a�er skills in soccer. Currently, these passesare manually de�ned during the game by a human judge, whichis highly subjective and variable. Sometimes these passes are ex-tremely obvious (e.g. a pass that leads directly to a shot) but atother times they could be the third or fourth previous pass thatwas the critical moment in the move. By assessing the rewardof each pass during a play, we can objectively assess who is re-sponsible for changing the a�acking momentum in a possession.Figure 8 provides an example of a such a play. In the time line it

KDD 2017, February 2017, El Halifax, Nova Scotia Canada P. Power et. al.
Figure 7: Top 5 players with the most risky and rewarding(dangerous) passes.
Figure 8: Example of a play with timeline underneath thatdescribes when the critical pass was made during the move– the critical pass (or pass with the highest reward) was theone Fabregas played to Willian 15 seconds before the actuallast pass was made.
can be seen that even though Willian makes the �nal assist (keypass), we can see that Fabregas played the critical pass during themove, increasing the probability of a shot occurring from 0.13 to0.21. Willian�s ability to maintain the ball in a dangerous area is
vital but we can now identify and credit Fabregas as playing themost critical pass in the move. As such we are now able to notjust capture the outcome of a possession but the process the led toend outcome. By combining the passing risk and passing rewardmodels we can now learn a new dictionary of objectively measureddangerous or critical passes.
6 APPLICATION II: SEASON-WIDE PLAYERANALYSIS
6.1 Ranking the Riskiest PlayersBy modeling the risk associated with completing a pass given aspeci�c context, we can measure the average skill required to com-plete a pass – our pass risk prediction estimates what the averageplayer will do in that situation. �e intuition is that a player withmore talent would be more likely to execute a risky pass comparedto a player with less skill. To do this we create a new statisticcalled Passing Plus Minus (PPM). Given that we have a pass riskprediction for each pass, �risk, we can simply calculate the PPM as:
Passing Plus/Minus =S’s=1
(1 � �
srisk) �
U’u=1
(�urisk � 1) (2)
where S andU are the number of successful and unsuccessful passes.For example, if a player completes a pass with �
srisk = 0.9 they
are awarded a credit of +0.1 but if the pass is unsuccessful theypenalized �0.9. PPM is simply the di�erence of the aggregatedcredits and penalties and is normalized per 90 minutes (i.e., thelength of a game) to enable comparisons between players. �isis important if a player has played only a portion of the game.PPM allows coaches/analysts to quickly assess which players arecompleting more passes than an average player (positive score) andwho is completing less passes than an average player (negativescore). A player with a score of 0 can be thought as an averageplayer.
�e second new metric we introduce is Di�cult Pass Com-pletion (DP%) which measures both how many high risk passes aplayer makes and completes. A di�cult pass is de�ned as a passwho’s probability is in the 75th percentile of the most high riskpasses (the least likely to be completed). We calculate DP% asfollows:
Di�cult Pass Completion =Õni=1 i = DPSÕni=1 i = DPA
(3)
where DPS is the number of di�cult passes completed and DPA isthe number of di�cult passes a�empted. �is measure showswhichplayers are able to a�empt and complete the most risky/di�cultpasses.
Figure 9 (le�) shows the distribution of passing ability for allout�eld players who played over 1800 minutes (20 games) in theEnglish Premier League for the 2015-2016 season. �e X-axis showsPPM, with the Y-axis showing DP%. We can see that there is a posi-tive correlation between the two metrics which intuitively makessense as players who are completing more passes than expectedshould be completing more di�cult passes than average. Unsur-prisingly creative players such as Cesc Fabregas (+1.19/90%), MesutOezil (+0.96/95%), and Eden Hazard (+0.79/65%) feature as players
Not All Passes Are Created Equally KDD 2017, February 2017, El Halifax, Nova Scotia Canada
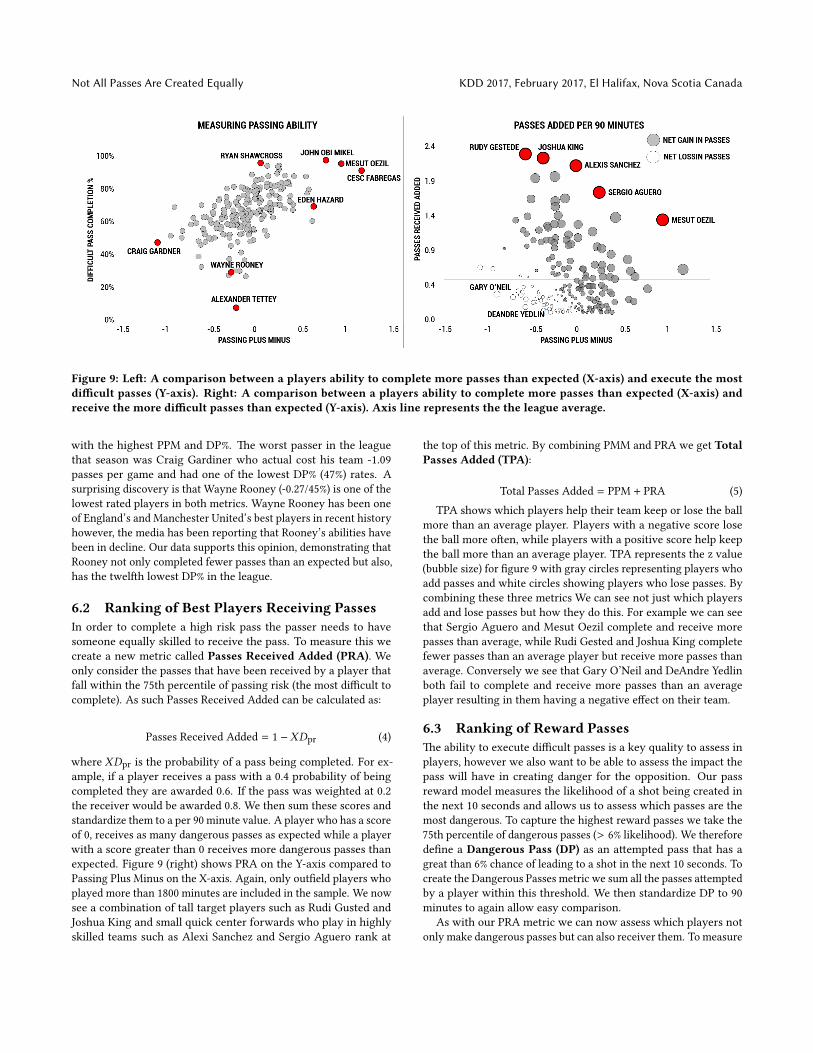
Figure 9: Le�: A comparison between a players ability to complete more passes than expected (X-axis) and execute the mostdi�cult passes (Y-axis). Right: A comparison between a players ability to complete more passes than expected (X-axis) andreceive the more di�cult passes than expected (Y-axis). Axis line represents the the league average.
with the highest PPM and DP%. �e worst passer in the leaguethat season was Craig Gardiner who actual cost his team -1.09passes per game and had one of the lowest DP% (47%) rates. Asurprising discovery is that Wayne Rooney (-0.27/45%) is one of thelowest rated players in both metrics. Wayne Rooney has been oneof England’s and Manchester United’s best players in recent historyhowever, the media has been reporting that Rooney’s abilities havebeen in decline. Our data supports this opinion, demonstrating thatRooney not only completed fewer passes than an expected but also,has the twel�h lowest DP% in the league.
6.2 Ranking of Best Players Receiving PassesIn order to complete a high risk pass the passer needs to havesomeone equally skilled to receive the pass. To measure this wecreate a new metric called Passes Received Added (PRA). Weonly consider the passes that have been received by a player thatfall within the 75th percentile of passing risk (the most di�cult tocomplete). As such Passes Received Added can be calculated as:
Passes Received Added = 1 � XDpr (4)
where XDpr is the probability of a pass being completed. For ex-ample, if a player receives a pass with a 0.4 probability of beingcompleted they are awarded 0.6. If the pass was weighted at 0.2the receiver would be awarded 0.8. We then sum these scores andstandardize them to a per 90 minute value. A player who has a scoreof 0, receives as many dangerous passes as expected while a playerwith a score greater than 0 receives more dangerous passes thanexpected. Figure 9 (right) shows PRA on the Y-axis compared toPassing Plus Minus on the X-axis. Again, only out�eld players whoplayed more than 1800 minutes are included in the sample. We nowsee a combination of tall target players such as Rudi Gusted andJoshua King and small quick center forwards who play in highlyskilled teams such as Alexi Sanchez and Sergio Aguero rank at
the top of this metric. By combining PMM and PRA we get TotalPasses Added (TPA):
Total Passes Added = PPM + PRA (5)TPA shows which players help their team keep or lose the ball
more than an average player. Players with a negative score losethe ball more o�en, while players with a positive score help keepthe ball more than an average player. TPA represents the z value(bubble size) for �gure 9 with gray circles representing players whoadd passes and white circles showing players who lose passes. Bycombining these three metrics We can see not just which playersadd and lose passes but how they do this. For example we can seethat Sergio Aguero and Mesut Oezil complete and receive morepasses than average, while Rudi Gested and Joshua King completefewer passes than an average player but receive more passes thanaverage. Conversely we see that Gary O’Neil and DeAndre Yedlinboth fail to complete and receive more passes than an averageplayer resulting in them having a negative e�ect on their team.
6.3 Ranking of Reward Passes�e ability to execute di�cult passes is a key quality to assess inplayers, however we also want to be able to assess the impact thepass will have in creating danger for the opposition. Our passreward model measures the likelihood of a shot being created inthe next 10 seconds and allows us to assess which passes are themost dangerous. To capture the highest reward passes we take the75th percentile of dangerous passes (> 6% likelihood). We thereforede�ne a Dangerous Pass (DP) as an a�empted pass that has agreat than 6% chance of leading to a shot in the next 10 seconds. Tocreate the Dangerous Passes metric we sum all the passes a�emptedby a player within this threshold. We then standardize DP to 90minutes to again allow easy comparison.
As with our PRA metric we can now assess which players notonly make dangerous passes but can also receiver them. To measure

KDD 2017, February 2017, El Halifax, Nova Scotia Canada P. Power et. al.
Figure 10: A comparison between players who receive andmake dangerous passes. Bubble size equals total dangerouspasses and received. Players below the line make more dan-gerous passes. Players above receivemore dangerous passes.
this we create a new metric called Receiving Dangerous Passes(RDP). As with DP we only consider the passes a player receiversthat have a greater than 6% likelihood of leading to a shot in thenext 10 seconds. As such we just simply count the number ofthese dangerous passes received and normalize for 90 minutes. Weare now able to asses which players create and exploit the mostdangerous passes.
Figure 10 shows the distribution of all out�eld players whoplayed more than 1800 minutes for the season. We see a di�er-ent ordering compared to the players who had high scores for PPMand TPA. Based on the danger of a pass (X axis) David Silva andMesut Oezil are the most dangerous players in possession of theball. As we would expect, a�acking players make up the major-ity of players executing high reward passes, however we also seeAlexander Kolarov, a full back, feature high in the metric. Anotherinteresting discovery is that Wesley Hoolahann is ranked 19th fordangerous passes made. �is is interesting as Norwich City wererelegated in this season yet had one of the most dangerous play-ers in the league. When looking at players who receive the mostdangerous passes (Y axis), we also see Alexander Kolarov featuresagain indicating his ability to not only make dangerous passes butto receive them as well. �is is critical information for an opposingcoach who may not automatically assess a full back such as Kolarovas being a main threat to sti�e.
In addition to analyzing future opponents, we can also use thesenew metrics to be�er assess a player a team may be looking torecruit. For example a team with a low budget may not have beenaware how e�ective Wesley Hoolahan was in playing dangerouspasses and could consequently ’beat the market’ in signing such aplayer from a team who has dropped out of the league for a lowertransfer fee.
7 APPLICATION III: TEAM-BASED ANALYSISWith teams playing two games a week a critical element of theanalysis process for a coach is to quickly �nd pa�erns a team willuse and understand how dangerous these pa�erns are. Given thatwe can now assign a risk and reward rating for each pass andcapture the tactical context of the pass, we can now measure thepassing style of a team. To do this, we segmented the the mostdangerous passes (greater than 6% likelihood of leading to a shot),and applied k-means clustering on the XY coordinates of the originand destination of the pass. It was decided that 16 clusters wasoptimal based on the coaches identifying that the clusters identi�edprovided the optimal amount information without being overloadedwith information. Figure 11 (right) shows the 16 cluster centroidswith the color re�ecting the average reward.
We can immediately see that the most dangerous passes occuraround the edge of the penalty area (cluster 1,2 and 3). Whilethese passes have the highest reward they are also have the highestrisk, requiring high levels of skill (�gure 11). Interestingly, whenexamining the centroids, we can see that the average position of thepass types are not symmetrical with cluster 4 being more dangerousthan cluster 9 (19% vs 10%) for example. We can also see that theleast riskiest pass (cluster 10) has an average risk of 3% and anaverage reward of 12% which is higher than six other clusters.Passes from clusters including 8, 10 and 16 may be a be�er optionto use for less skilled teams as there is a lower risk but still relativelyhigh reward.
Figure 11 visualizes the passing tendencies of all teams in theleague via a Hinton diagram. Each columns is standardized to theleague with the size of the square indicating a team makes morepasses while the intensity of the color shows how dangerous a teamis on average when using that pass.In this case the redder a squarethe more dangerous a team is. Immediately, it can be seen whichteams dominate possession with the like of Manchester City andArsenal having consistently larger squares. While certain teamsmay have more possession we can also see if they are e�ective inusing these passes. Arsenal for example have the most passes inclusters 2 and 3 yet Leicester City (Cluster 2) and West Ham United(Cluster 3) are more dangerous. Looking at Leicester City in moredetail we can see that they had a highly e�ective mix of combininghigh risk and high reward passes (Clusters 1 and 2) and low riskmedium reward passes (Cluster 6 and 12).
�e ability to quickly �nd how an opponent plays and wherethey are most dangerous is a key break through in the analysis ofpassing.
8 SUMMARYIn this paper, we presented an objective method of estimating therisk and reward of all passes using a supervised learning approach.We showed that adding contextual features improved the predictionperformance in addition to giving semantic information to eachpass. We then showcased four applications that covered how thesetools can be used to describe individual match and play analysis,in addition to player and team analysis. Not only can it be used todescribe the o�ensive behavior of players and teams, it can also beused to describe the defensive behavior as well.

Not All Passes Are Created Equally KDD 2017, February 2017, El Halifax, Nova Scotia Canada
Figure 11: Hinton Diagram depicting how o�en team use a type of pass and the average reward of each pass. �e larger thesquare the more number of passes a team uses, and the more intense the color corresponds to the higher average reward ofthat pass.
REFERENCES[1] A. Bialkowski, P. Lucey, P. Carr, Y. Yue, S. Sridharan, and year=2014 I. Ma�hews,
booktitle=ICDM. Large-scale analysis of soccer matches using spatiotemporaltracking data.
[2] J. Brooks, M. Kerr, and J. Gutag. 2016. Developing a Data-Driven Player Rankingin Soccer Using Predictive Model Weights. In KDD.
[3] Daniel Cervone, Alex D�Amour, Luke Bornn, and Kirk Goldsberry. 2016. AMultiresolution Stochastic Process Model for Predicting Basketball PossessionOutcomes. J. Amer. Statist. Assoc. 111, 514 (2016), 585–599.
[4] L. Gyarmati and X. Anguera. 2015. Automatic Extraction of the Passing Strategiesof Soccer Teams. In KDD Workshop on Large-Scale Sports Analytics.
[5] L. Gyarmati and R. Stanojevic. 2016. QPass: a Merit-based Evaluation of SoccerPasses. In KDD Workshop on Large-Scale Sports Analytics.
[6] M. Horton, J. Gudmundsson, S. Chawla, and J. Estephan. 2014. Classi�cationof passes in football matches using spatiotemporal data. In KDD Workshop onLarge-Scale Sports Analytics.
[7] D. Link, S. Lang, and P. Seidenschwarz. 2016. Real Time �anti�cation ofDangerousity in Football Using Spatiotemporal Tracking Data. PLoS ONE (2016).
[8] P. Lucey, A. Bialkowski, P. Carr, E. Foote, and I. Ma�hews. 2012. CharacterizingMulti-Agent Team Behavior from Partial Team Tracings: Evidence from theEnglish Premier League.
[9] P. Lucey, D. Oliver, P. Carr, J. Roth, and I. Ma�hews. 2013. Assessing teamstrategy using spatiotemporal data. In KDD.
[10] I McHale and L Szczepanski. 2015. Beyond completion rate: evaluating passingability of footballers. Royal Statistical Society, Series A. (2015).
[11] M. Monfort P. Carr P. Lucey, A. Bialkowski and I. Ma�hews. 2015. �alityvs�antity: Improved shot prediction in soccer using strategic features fromspatiotemporal data. In MIT Sloan Sports Analytics Conference.
[12] Marti Perarnau. 2014. Pep Con�dential: Inside Pep Guardiola’s First Season atBayern Munich. Birlinn.
[13] J. Skyes and N. Paine. How One Man�s Bad Math Helped RuinDecades Of English Soccer. (��). h�ps://�vethirtyeight.com/features/how-one-mans-bad-math-helped-ruin-decades-of-english-soccer/
[14] T. Taki and J. Hasegawa. 2000. Visualization of dominant region in team gamesand its application to teamwork analysis. In Computer Graphics International.227–235.
[15] Qing Wang, Hengshu Zhu, Wei Hu, Zhiyong Shen, and Yuan Yao. 2015. Discern-ing Tactical Pa�erns for Professional Soccer Teams: An Enhanced Topic Modelwith Applications. In KDD.