Embed Size (px)
Citation preview
OFFICE OF MANAGEMENT AND BUDGET
600 EAST BOULEVARD AVE — DEPT. 110 BISMARCK, ND 58505-0400
North Dakota REV-E-NEWS
MESSAGE FROM THE DIRECTOR
June 2016 Pam Sharp, Director
Comments or Questions? Contact Pam Sharp, Director Phone: 701-328-2680 Fax : 701-328-3230 E-mail: [email protected] Visit OMB’s website www.nd.gov/omb
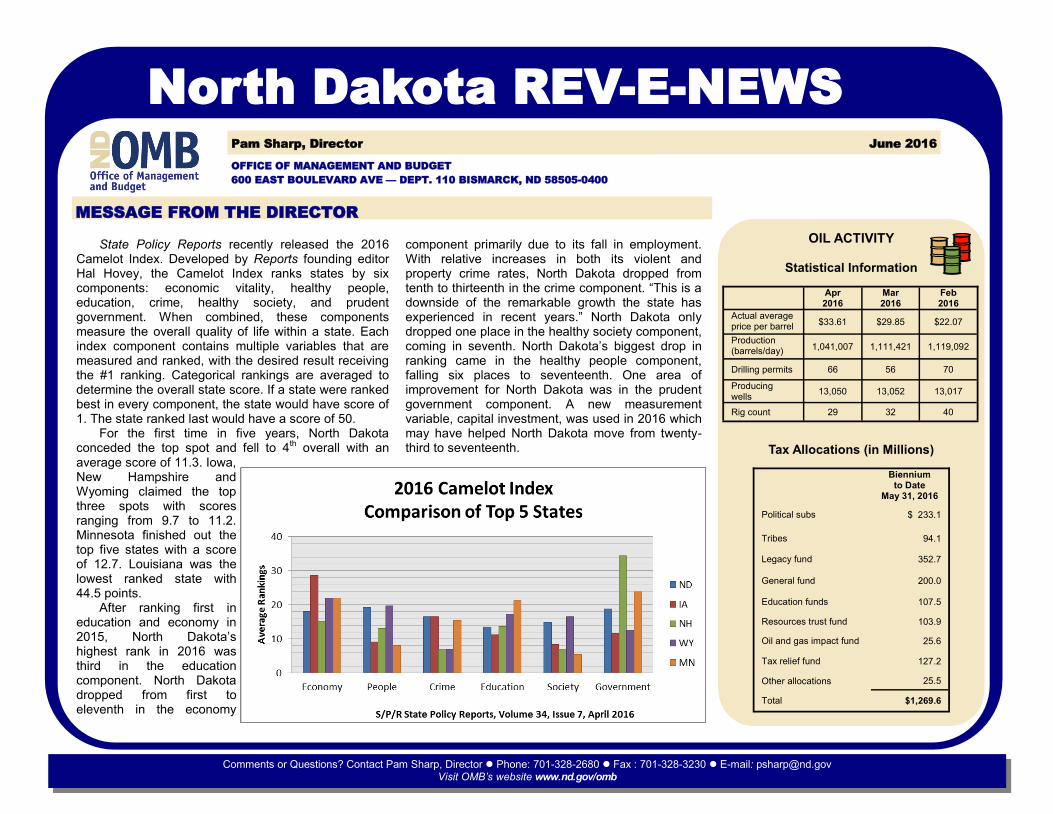
OIL ACTIVITY
Statistical Information
Tax Allocations (in Millions)
Biennium to Date
May 31, 2016
Political subs $ 233.1
Tribes 94.1
Legacy fund 352.7
General fund 200.0
Education funds 107.5
Resources trust fund 103.9
Oil and gas impact fund 25.6
Tax relief fund 127.2
Other allocations 25.5
Total $1,269.6
Apr 2016
Mar 2016
Feb 2016
Actual average price per barrel
$33.61 $29.85 $22.07
Production (barrels/day) 1,041,007 1,111,421 1,119,092
Drilling permits 66 56 70
Producing wells
13,050 13,052 13,017
Rig count 29 32 40
State Policy Reports recently released the 2016 Camelot Index. Developed by Reports founding editor Hal Hovey, the Camelot Index ranks states by six components: economic vitality, healthy people, education, crime, healthy society, and prudent government. When combined, these components measure the overall quality of life within a state. Each index component contains multiple variables that are measured and ranked, with the desired result receiving the #1 ranking. Categorical rankings are averaged to determine the overall state score. If a state were ranked best in every component, the state would have score of 1. The state ranked last would have a score of 50. For the first time in five years, North Dakota conceded the top spot and fell to 4th overall with an average score of 11.3. Iowa, New Hampshire and Wyoming claimed the top three spots with scores ranging from 9.7 to 11.2. Minnesota finished out the top five states with a score of 12.7. Louisiana was the lowest ranked state with 44.5 points. After ranking first in education and economy in 2015, North Dakota’s highest rank in 2016 was third in the education component. North Dakota dropped from first to eleventh in the economy
component primarily due to its fall in employment. With relative increases in both its violent and property crime rates, North Dakota dropped from tenth to thirteenth in the crime component. “This is a downside of the remarkable growth the state has experienced in recent years.” North Dakota only dropped one place in the healthy society component, coming in seventh. North Dakota’s biggest drop in ranking came in the healthy people component, falling six places to seventeenth. One area of improvement for North Dakota was in the prudent government component. A new measurement variable, capital investment, was used in 2016 which may have helped North Dakota move from twenty-third to seventeenth.
June 2016 North Dakota REV-E-NEWS
Caption describing picture or graphic.
OFF
IC
E O
F M
AN
AG
EM
EN
T A
ND
B
UD
GE
T
600
E
AS
T B
OU
LE
VA
RD
A
VE
—
D
EP
T. 1
10
BIS
MA
RC
K, N
D 585
05
-0
400
North Dakota REV-E-NEWS June 2016
http
://ww
w.n
d.g
ov/o
mb
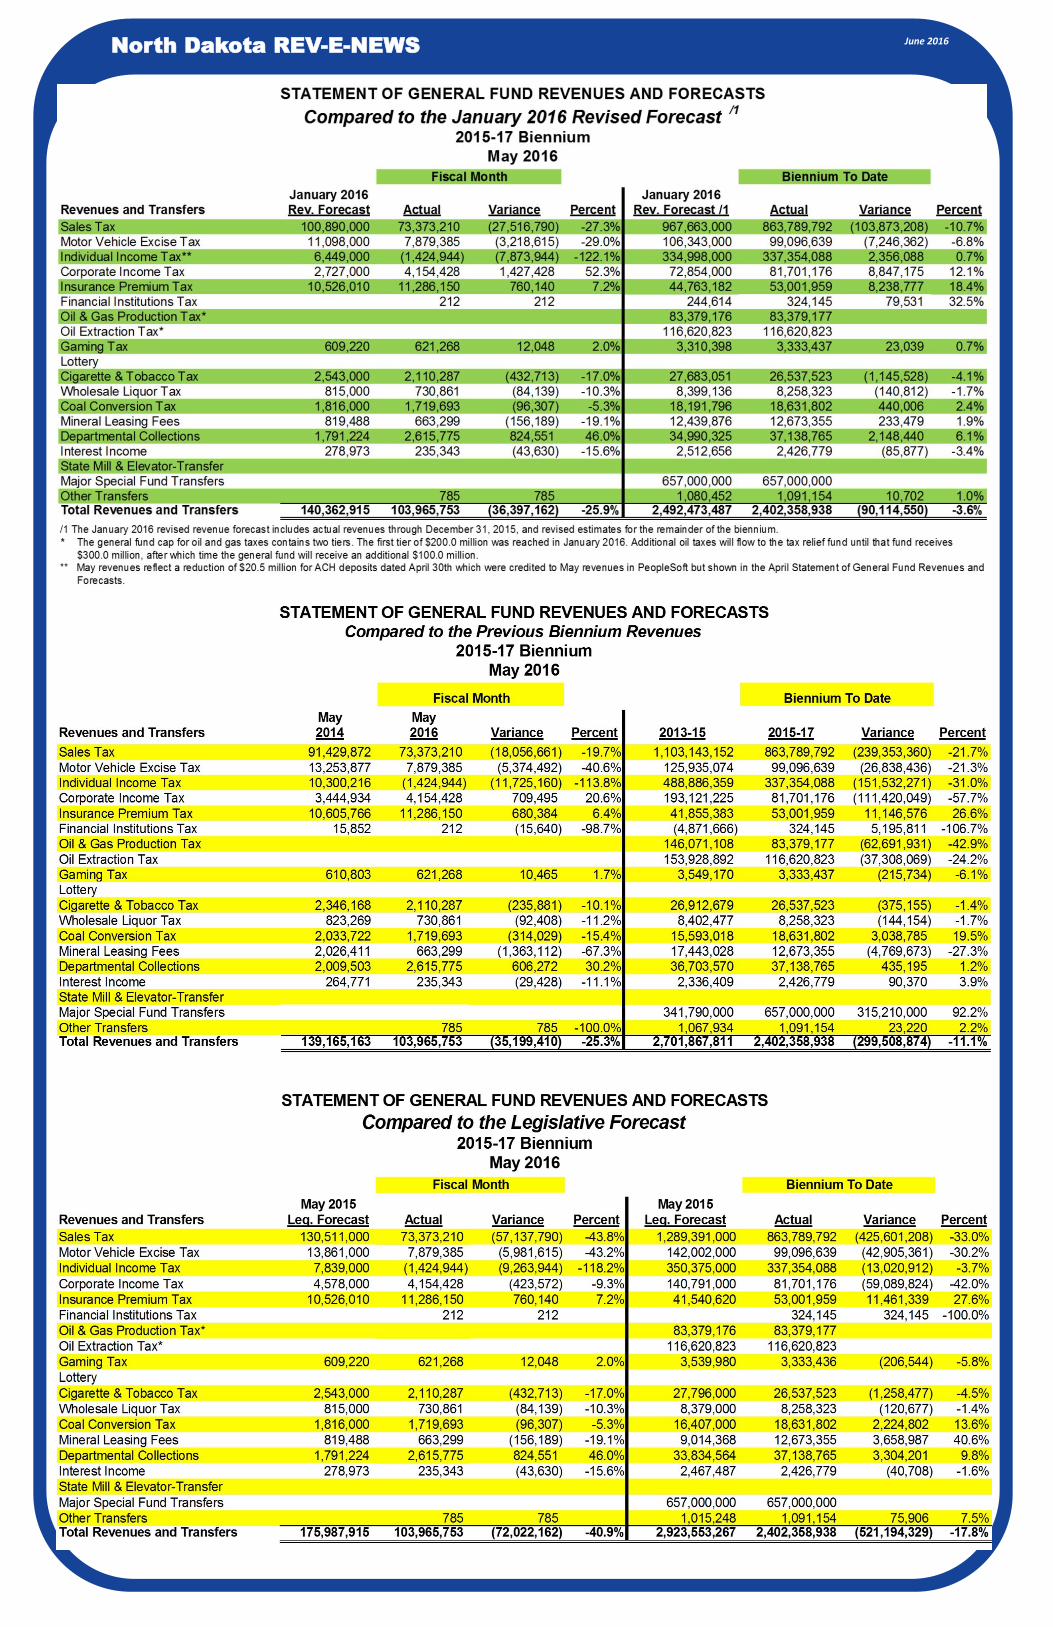
VARIANCES (Compared to January 2016 Revised Forecast) May 2016 revenues totaled $103.9 million, which is $36.4 million, or 25.9 percent below forecast. Biennium-to-date revenues of $2.40 billion are $90.1 million, or 3.6 percent, less than projected. When transfers from the tax relief fund are excluded, 2015-17 revenues to date are tracking 26.0 percent behind the same time period in the 2013-15 biennium. Significant monthly variances are as follows:
Sales tax collections of $73.4 million were $27.5 million, or 27.3 percent, less than anticipated for the month due in large part to low oil prices and reduced rig counts and low agriculture prices. Biennium-to-date revenues are 10.7 percent below forecast and 21.7 percent less than the same time period in the 2013-15 biennium.
Motor vehicle excise tax
collections of $7.9 million were $3.2 million, or 29.0 percent, less than the forecast for the month. Total revenues to date of $99.1 million are 6.8 percent behind projections and 21.3 percent less than the same period in the 2013-15 biennium. It appears that this
variance is related to low oil and agriculture prices.
Individual income tax collections were $7.9 million, or 122.1 percent, less than the monthly projection due to increased transfers to the refund fund. Biennium to date collections of $337.4 million are $2.4 million, or .7 percent, above forecast. Tax rate reductions and above average set-aside for refund reserves resulted in collections that were 29.2 percent lower than the same time period in the 2013-15 biennium.
Corporate income tax collections totaling $4.2 million were $1.4 million, or 52.3 percent, above forecast due to strong audit collections. Biennium to date collections are 12.1 percent above forecast and 57.7 percent less than the same time period in the 2013-15 biennium.
Oil and gas taxes collections reached $200.0 million in January - the first tier of the biennial cap. The state share will be deposited in the tax relief fund until that fund reaches its cap of $300 million, after which the general fund will receive an additional $100.0 million.