Embed Size (px)
Citation preview
Nortel Ethernet Routing Switch 5000 Series
Configuration — SystemMonitoringRelease: 6.1Document Revision: 05.01
www.nortel.com
NN47200-505.
Nortel Ethernet Routing Switch 5000 SeriesRelease: 6.1Publication: NN47200-505Document release date: 25 May 2009
Copyright © 2005 -2009 Nortel Networks. All Rights Reserved.
While the information in this document is believed to be accurate and reliable, except as otherwise expresslyagreed to in writing NORTEL PROVIDES THIS DOCUMENT "AS IS" WITHOUT WARRANTY OR CONDITIONOFANY KIND, EITHER EXPRESS OR IMPLIED. The information and/or products described in this document aresubject to change without notice.
Nortel, Nortel Networks, the Nortel logo, and the Globemark are trademarks of Nortel Networks.
All other trademarks are the property of their respective owners.
.

3.
ContentsNew in this release 9Features 9
Stack Health Check 9Stack environmental information 9
Introduction 11NNCLI command modes 11
System monitoring fundamentals 15System logging 15Remote logging 15Alarms 16How RMON alarms work 16Creating alarms 17Trap Web page 18Management Information Base Web page 18IGMP and the system event log 19Port mirroring 21
Port-based mirroring configuration 21Address-based mirroring configuration 22
Many-to-Many Port Mirroring 23Port-based modes 23MAC address-based modes 24Many-to-many port mirroring functionality 24Many-to-many port mirroring restrictions 24
Stack loopback tests 25Stack monitor 26CPU and memory utilization 26Light Emitting Diode display 27Power over Ethernet allocations 27
Displaying PoE allocations using NNCLI 27Displaying PoE allocations using Web-based management 28
IP Flow Information Export 28Remote Network Monitoring 29Stack Health Check 29
Nortel Ethernet Routing Switch 5000 SeriesConfiguration — System MonitoringNN47200-505 05.01 25 May 2009
Copyright © 2005 -2009 Nortel Networks. All Rights Reserved.
.
4
Displaying environmental information 30
System diagnostics and statistics using NNCLI 31Navigation 31Port statistics 31
Viewing port-statistics 31Configuring Stack Monitor 32
Viewing the stack-monitor 32Configuring the stack-monitor 32Setting default stack-monitor values 33Disabling the stack monitor 33
Viewing Stack Port Counters 34Clearing stack port counters 35Using the stack loopback test 36Displaying port operational status 37Validating port operational status 38Showing port information 38Showing stack health information 40
Job aid 40Job aid 43
Viewing environmental information 43Job aid 43Job aid 44
System diagnostics and statistics using Web-basedmanagement 45Navigation 45Viewing port statistics using Web-based management 45Viewing all port errors 47Displaying port-mirroring using Web-based management 48Configuring port-mirroring using Web-based management 48Viewing interface statistics 49Viewing Ethernet error statistics 50Viewing transparent bridging statistics 52Monitoring MLT traffic 53Viewing stack health 53
Job aid 54
System diagnostics and statistics using Device Manager 55Navigation 55Configuring Stack Monitor with Device Manager 55
Network monitoring configuration using NNCLI 57Viewing CPU utilization 57Viewing memory utilization 58Configuring the system log 58
Nortel Ethernet Routing Switch 5000 SeriesConfiguration — System MonitoringNN47200-505 05.01 25 May 2009
Copyright © 2005 -2009 Nortel Networks. All Rights Reserved.
.

5
Displaying the system log 58Configuring the system log 59Disabling the system log 59Setting the system log to default 59Clearing the system log 60
Configuring remote logging 60Displaying logging 60Enabling remote logging 61Disabling remote logging 61Setting the remote logging address 61Clearing the remote server IP address 62Setting the log severity 62Resetting the severity level 63Setting the default remote logging level 63
Configuring port mirroring 63Displaying the port-mirroring configuration 63Configure port-mirroring 64Disabling port-mirroring 65
Displaying Many-to-Many port-mirroring 66Configuring Many-to-Many port-mirroring 66Disabling Many-to-Many port-mirroring 67
Network monitoring configuration using Device Manager 69CPU and memory utilization 69Configuring the system log with Device Manager 70
Job aid 70Creating a graph 71Graphing switch chassis data 71
Viewing the OSPF tab 79Viewing the VRRP tab 80
Graphing switch port data 80Viewing Ethernet Errors tab 82Viewing the Rmon tab 86Viewing the EAPOL Stats tab 87Viewing the EAPOL Diag tab 88Viewing the LACP tab 92Viewing the Misc tab 93
Graphing multilink trunk statistics 94Viewing the Ethernet Errors tab 95
Graphing VLAN DHCP statistics 98Viewing unit statistics 99
Job aid 99
Nortel Ethernet Routing Switch 5000 SeriesConfiguration — System MonitoringNN47200-505 05.01 25 May 2009
Copyright © 2005 -2009 Nortel Networks. All Rights Reserved.
.
6
Network monitoring configuration using Web-basedmanagement 101Viewing CPU and memory utilization 101Viewing the system log in the Web-based management 102Clearing system log messages using Web-based management 102Using the MIB Web page for SNMP Get and Get-Next 104Using the MIB Web page for SNMP walk 104Using the trap Web page to identify trap receivers 105
RMON configuration using NNCLI 107Configuring RMON with the NNCLI 107
Viewing RMON alarms 107Viewing RMON events 107Viewing RMON history 107Viewing RMON statistics 108Setting RMON alarms 108Deleting RMON alarm table entries 109Configuring RMON event log and traps 110Deleting RMON event table entries 110Configuring RMON history 111Deleting RMON history table entries. 111Configuring RMON statistics 112Disabling RMON statistics 112
RMON configuration using Device Manager 115Configuring RMON with the Device Manager 115
Working with RMON information 115Alarm Manager 122Events 126Viewing log information 129
RMON configuration using Web-based management 131Configuring RMON with the Web-based management 131
Configuring RMON alarm parameters 131Deleting an RMON alarm configuration 132Creating events 133Viewing the RMON fault event log 134
IPFIX Configuration using NNCLI 135Configuring IPFIX collectors 135Enabling IPFIX globally 136Configuring unit specific IPFIX 136Enabling IPFIX on the interface 137Enabling IPFIX export through ports 137Deleting the IPFIX information for a port 138
Nortel Ethernet Routing Switch 5000 SeriesConfiguration — System MonitoringNN47200-505 05.01 25 May 2009
Copyright © 2005 -2009 Nortel Networks. All Rights Reserved.
.
7
Viewing the IPFIX table 138
IPFIX configuration using Device Manager 141Global IPFIX configuration 141
Global configuration using the DM 141Configuring IPFIX flows 141
Configuring flows using DM 141Configuring IPFIX collectors 143Configuring IPFIX ports 144Graphing Exporter Statistics 145Exporter Stats Clear Time 146
IPFIX configuration using the Web-based management 147Global configuration using the Web-based management 147Configuring flows using the Web-based management 147Viewing IPFIX data 148
Nortel Ethernet Routing Switch 5000 SeriesConfiguration — System MonitoringNN47200-505 05.01 25 May 2009
Copyright © 2005 -2009 Nortel Networks. All Rights Reserved.
.

8
Nortel Ethernet Routing Switch 5000 SeriesConfiguration — System MonitoringNN47200-505 05.01 25 May 2009
Copyright © 2005 -2009 Nortel Networks. All Rights Reserved.
.
9.
New in this releaseThe following sections detail what’s new in Nortel Ethernet Routing Switch5000 Series Configuration — System Monitoring (NN47200-505) forRelease 6.1.
FeaturesSee the following sections for information about feature changes:
• “Stack Health Check” (page 9)
• “Stack environmental information” (page 9)
Stack Health CheckThe Stack Health Check feature provides information on the stacking stateof each switch rear port. It is used to run a high-level test to monitor therear port status for each unit, confirm the number of switching units instack, detect if the stack runs with a temporary base unit, and to monitorstack continuity. For more information, see:
• “Stack Health Check” (page 29)
• “Showing stack health information” (page 40)
• “Viewing stack health” (page 53)
Stack environmental informationThis feature provides information on the status of the environment of eachunit in a stack. For more information, see:
• “Displaying environmental information” (page 30)
• “Viewing environmental information” (page 43)
Nortel Ethernet Routing Switch 5000 SeriesConfiguration — System MonitoringNN47200-505 05.01 25 May 2009
Copyright © 2005 -2009 Nortel Networks. All Rights Reserved.
.

10 New in this release
Nortel Ethernet Routing Switch 5000 SeriesConfiguration — System MonitoringNN47200-505 05.01 25 May 2009
Copyright © 2005 -2009 Nortel Networks. All Rights Reserved.
.
11.
IntroductionThis document provides information you need to configure and use systemmonitoring for the Ethernet Routing Switch 5000 Series.
NNCLI command modesNNCLI provides the following command modes:
• User Executive
• Privileged Executive
• Global Configuration
• Interface Configuration
• Router Configuration
Mode access is determined by access permission levels and passwordprotection.
If no password is set, you can enter NNCLI in User Executive mode anduse the enable command to move to the next level (Privileged Executivemode). However, if you have read-only access, you cannot progressbeyond User Executive mode, the default mode. If you have read-writeaccess you can progress from the default mode through all of the availablemodes.
With sufficient permission, you can use the rules in the following table tomove between the command modes.
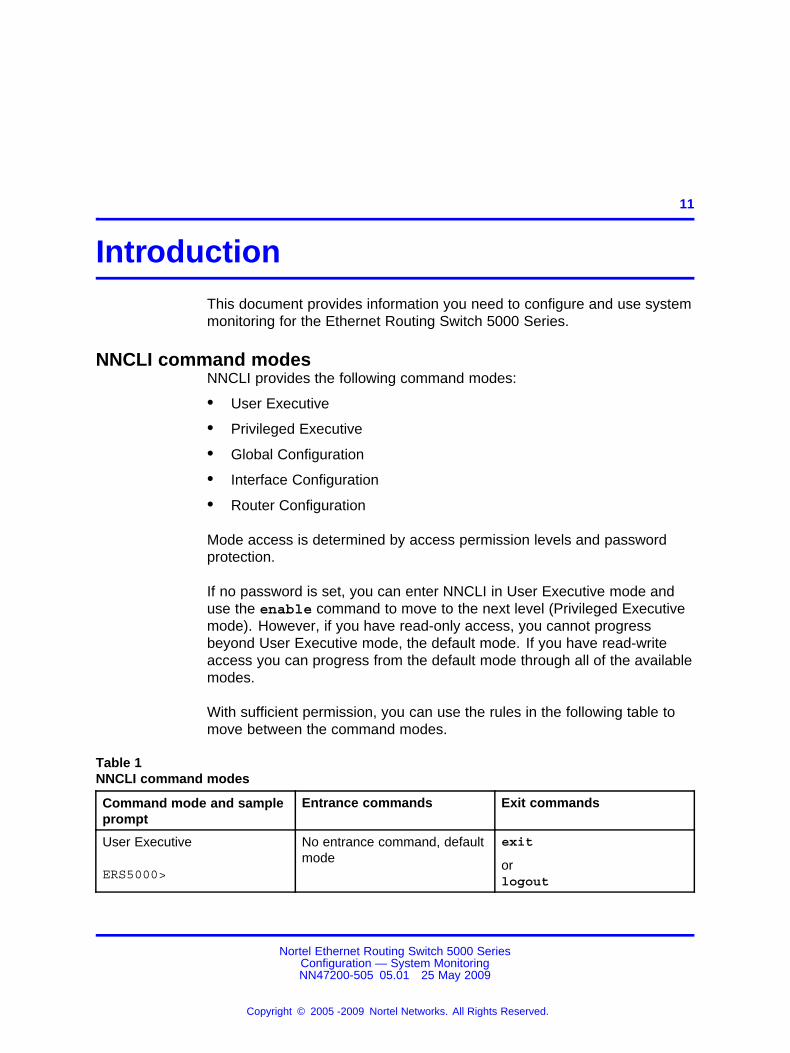
Table 1NNCLI command modes
Command mode and sampleprompt
Entrance commands Exit commands
User Executive
ERS5000>
No entrance command, defaultmode
exit
orlogout
Nortel Ethernet Routing Switch 5000 SeriesConfiguration — System MonitoringNN47200-505 05.01 25 May 2009
Copyright © 2005 -2009 Nortel Networks. All Rights Reserved.
.

12 Introduction
Command mode and sampleprompt
Entrance commands Exit commands
Privileged Executive
ERS5000#
enable exit
orlogout
Global Configuration
ERS5000(config)#
From Privileged Executivemode, enter:configure
To return to PrivilegedExecutive mode, enter:
end
orexit
To exit NNCLI completely,enter:
logout
Interface Configuration
ERS5000(config-if)#
From Global Configurationmode:To configure a port, enter:interface fastethernet <portnumber>To configure a VLAN, enter:interface vlan <vlan number>
To return to GlobalConfiguration mode, enter:
exit
To return to PrivilegedExecutive mode, enter:
end
To exit NNCLI completely,enter:
logout
Router ConfigurationERS5000(config-router)#
From Global Configurationmode:
To configure router OSPF,type:router ospf
To configure router RIP, type:router rip
To configure router VRRP,type:router vrrp
To return to GlobalConfiguration mode, enter:exit
To return to Privileged EXECmode, type:end
To exit NNCLI completely,type:logout
See Nortel Ethernet Routing Switch <2500/4500/5000> SeriesFundamentals <NN47215-102/NN47205-102/NN47200-104>
Nortel Ethernet Routing Switch 5000 SeriesConfiguration — System MonitoringNN47200-505 05.01 25 May 2009
Copyright © 2005 -2009 Nortel Networks. All Rights Reserved.
.
Navigation 13
Navigation• “System diagnostics and statistics using NNCLI” (page 31)
• “System diagnostics and statistics using Web-based management”(page 45)
• “System diagnostics and statistics using Device Manager” (page 55)
• “Network monitoring configuration using NNCLI” (page 57)
• “Network monitoring configuration using Device Manager” (page 69)
• “Network monitoring configuration using Web-based management”(page 101)
• “RMON configuration using NNCLI” (page 107)
• “RMON configuration using Device Manager” (page 115)
• “RMON configuration using Web-based management” (page 131)
• “IPFIX Configuration using NNCLI” (page 135)
• “IPFIX configuration using Device Manager” (page 141)
• “IPFIX configuration using the Web-based management” (page 147)
Nortel Ethernet Routing Switch 5000 SeriesConfiguration — System MonitoringNN47200-505 05.01 25 May 2009
Copyright © 2005 -2009 Nortel Networks. All Rights Reserved.
.

14 Introduction
Nortel Ethernet Routing Switch 5000 SeriesConfiguration — System MonitoringNN47200-505 05.01 25 May 2009
Copyright © 2005 -2009 Nortel Networks. All Rights Reserved.
.

15.
System monitoring fundamentalsSystem monitoring is an important aspect of switch operation. The NortelEthernet Routing Switch 5500 Series provides a wide range of systemmonitoring options that you can use to closely monitor the operation of aswitch or stack.
This chapter describes two general system monitoring aspects thatyou must consider when you use the Ethernet Routing Switch 5000Series: system logging and port mirroring. Subsequent chapters provideinformation about specific system monitoring tools and how to use them.
System loggingThe Nortel Ethernet Routing Switch 5500 Series supports system logging(syslog), a software tool to log system events for debugging and analysis.
The syslog tool can log application events. The logged events are storedin volatile RAM, nonvolatile RAM, or in a remote host. You can select thestorage location by using the Nortel Networks command line interface(NNCLI) or DM.
Remote loggingStarting with release 5.0, the remote logging feature provides an enhancedlevel of logging by replicating system messages on a syslog server.System log messages from several switches can be collected at acentral location to alleviate you from individually querying each switch tointerrogate the log files.
You must configure the remote syslog server on the unit to loginformational, serious, and critical messages to this remote server. TheUDP packet is sent to port 514 of the configured remote syslog server.
After the IP address is in the system, syslog messages can be sentto the remote syslog server. If a syslog message is generated prior tocapturing the IP address of the server is captured the system stores up to10 messages that are sent after the IP address of the remote server is onthe system.
Nortel Ethernet Routing Switch 5000 SeriesConfiguration — System MonitoringNN47200-505 05.01 25 May 2009
Copyright © 2005 -2009 Nortel Networks. All Rights Reserved.
.
16 System monitoring fundamentals
To configure this feature, enable remote logging, specify the IP address ofthe remote syslog server, and specify theseverity level of the messages tobe sent to the remote server.
AlarmsAlarms are useful for identifying values of a variable that have gone outof range. Define an RMON alarm for a MIB variable that resolves to aninteger value. String variables cannot be used. All alarms share thefollowing characteristics:
• An upper and lower threshold value is defined.
• A corresponding rising and falling event occurs.
• An alarm interval or polling period is reached.
After alarms are activated, view the activity in a log or a trap log, or a scriptcan be created to provide notification by beeping a console, sending e-mailmessages, or calling a pager.
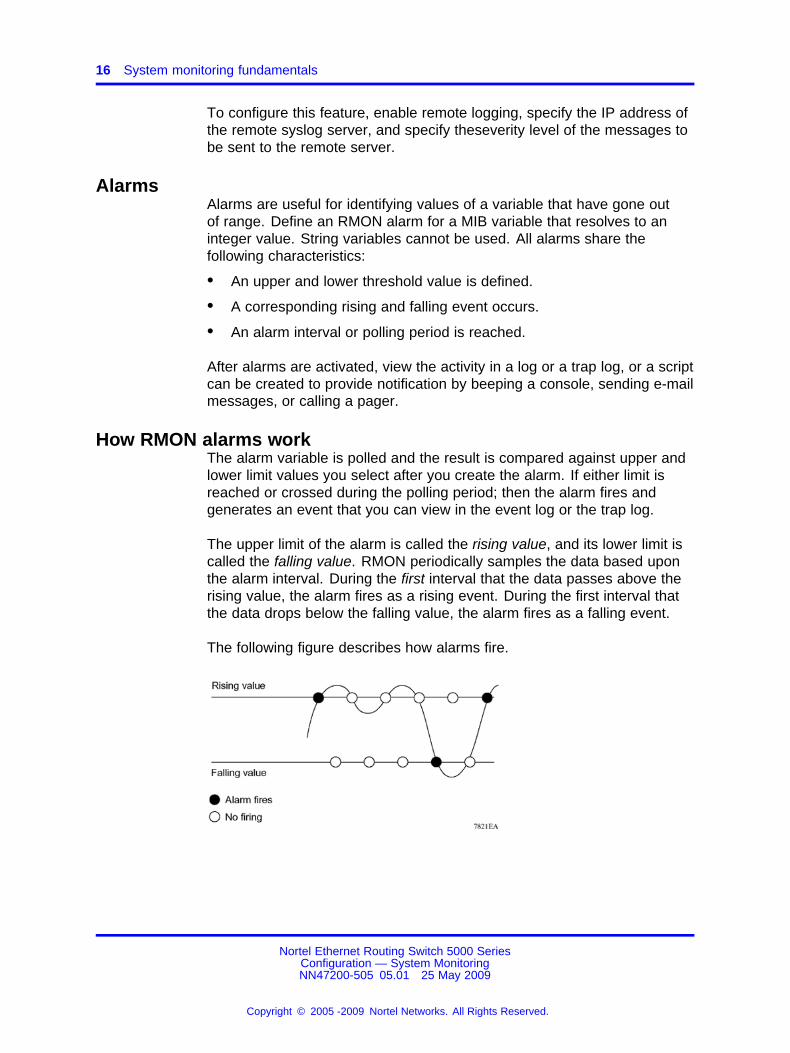
How RMON alarms workThe alarm variable is polled and the result is compared against upper andlower limit values you select after you create the alarm. If either limit isreached or crossed during the polling period; then the alarm fires andgenerates an event that you can view in the event log or the trap log.
The upper limit of the alarm is called the rising value, and its lower limit iscalled the falling value. RMON periodically samples the data based uponthe alarm interval. During the first interval that the data passes above therising value, the alarm fires as a rising event. During the first interval thatthe data drops below the falling value, the alarm fires as a falling event.
The following figure describes how alarms fire.
Nortel Ethernet Routing Switch 5000 SeriesConfiguration — System MonitoringNN47200-505 05.01 25 May 2009
Copyright © 2005 -2009 Nortel Networks. All Rights Reserved.
.
Creating alarms 17
The alarm fires during the first interval that the sample goes out of range.No additional events are generated for that threshold until the oppositethreshold is crossed. Therefore, it is important to carefully define the risingand falling threshold values for alarms to work as expected. Otherwise,incorrect thresholds cause an alarm to fire at every alarm interval.
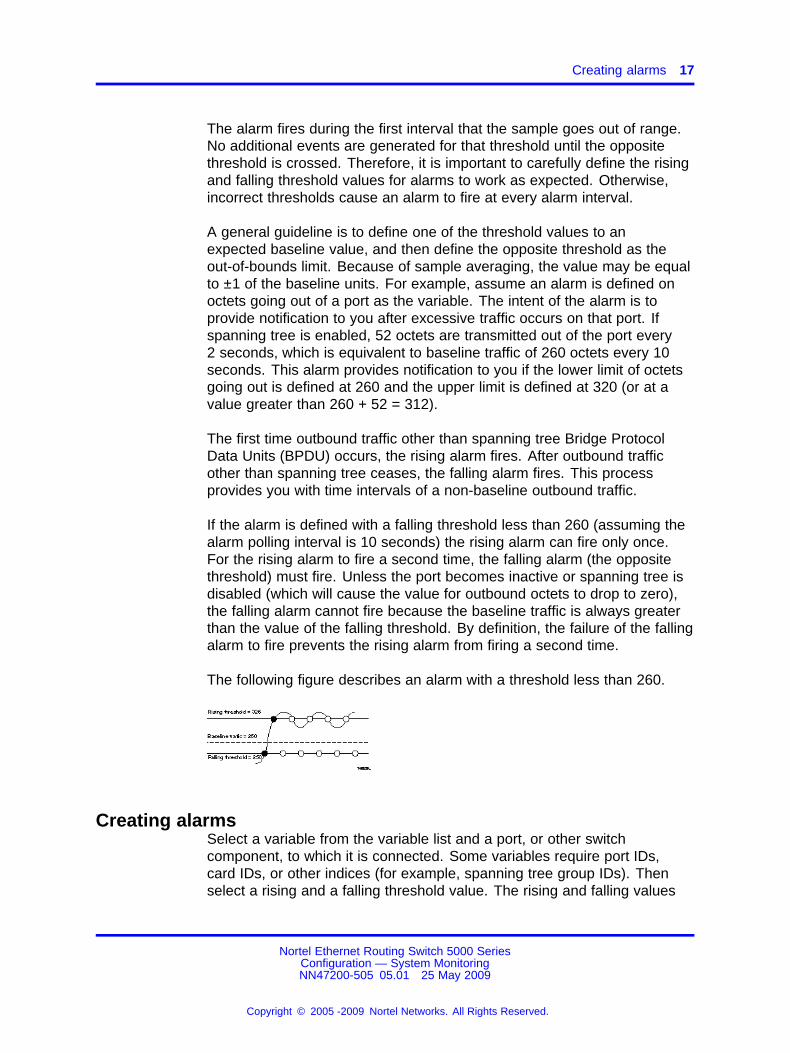
A general guideline is to define one of the threshold values to anexpected baseline value, and then define the opposite threshold as theout-of-bounds limit. Because of sample averaging, the value may be equalto ±1 of the baseline units. For example, assume an alarm is defined onoctets going out of a port as the variable. The intent of the alarm is toprovide notification to you after excessive traffic occurs on that port. Ifspanning tree is enabled, 52 octets are transmitted out of the port every2 seconds, which is equivalent to baseline traffic of 260 octets every 10seconds. This alarm provides notification to you if the lower limit of octetsgoing out is defined at 260 and the upper limit is defined at 320 (or at avalue greater than 260 + 52 = 312).
The first time outbound traffic other than spanning tree Bridge ProtocolData Units (BPDU) occurs, the rising alarm fires. After outbound trafficother than spanning tree ceases, the falling alarm fires. This processprovides you with time intervals of a non-baseline outbound traffic.
If the alarm is defined with a falling threshold less than 260 (assuming thealarm polling interval is 10 seconds) the rising alarm can fire only once.For the rising alarm to fire a second time, the falling alarm (the oppositethreshold) must fire. Unless the port becomes inactive or spanning tree isdisabled (which will cause the value for outbound octets to drop to zero),the falling alarm cannot fire because the baseline traffic is always greaterthan the value of the falling threshold. By definition, the failure of the fallingalarm to fire prevents the rising alarm from firing a second time.
The following figure describes an alarm with a threshold less than 260.
Creating alarmsSelect a variable from the variable list and a port, or other switchcomponent, to which it is connected. Some variables require port IDs,card IDs, or other indices (for example, spanning tree group IDs). Thenselect a rising and a falling threshold value. The rising and falling values
Nortel Ethernet Routing Switch 5000 SeriesConfiguration — System MonitoringNN47200-505 05.01 25 May 2009
Copyright © 2005 -2009 Nortel Networks. All Rights Reserved.
.
18 System monitoring fundamentals
are compared against the actual value of the variable that you choose. Ifthe variable falls outside of the rising or falling value range, an alarm istriggered and an event is logged or trapped.
After an alarm is created a sample type is also selected, which can beeither absolute or delta. Absolute alarms are defined on the cumulativevalue of the alarm variable. An example of an alarm defined with absolutevalue is card operating status. Because this value is not cumulative, butinstead represents states, such as card up (value 1) and card down (value2), you set it for absolute value. You can create an alarm with a risingvalue of 2 and a falling value of 1 to alert a user to whether the card is upor down.
Most alarm variables related to Ethernet traffic are set to delta value.Delta alarms are defined based on the difference in the value of the alarmvariable between the start of the polling period and the end of the pollingperiod. Delta alarms are sampled twice for each polling period. For eachsample, the last two values are added together and compared to thethreshold values. This process increases precision and allows for thedetection of threshold crossings that span the sampling boundary. If youtrack the current values of a delta-valued alarm and add them together,therefore, the result is twice the actual value. (This result is not an errorin the software.)
Trap Web pageSNMP Trap web page provides a graphical method to enable or disabletraps you want to send. In case multiple trap receivers are selected youcan specify which traps are sent to which receiver. The selection of trapsto be sent to a certain receiver can be based on criteria like security,network connectivity, or other information that might be important to thatparticular receiver.
You can access a separate Trap web page for every host, from which youcan enable or disable any of the listed traps. The access to those pages isthrough the SNMP Trap Web page, which contains two options for everytrap. The first option enables the trap. The second option disables thetrap. Select an option to enable or disable a specific trap for a specifichost.
Management Information Base Web pageWith Web-based management, you can see the response of an SNMP Getand Get-Next request for an Object Identifier (OID) or object name.
With the SNMP walk, you can retrieve a subtree of the ManagementInformation Base (MIB) that has the object as root by using Get-Nextrequests.
Nortel Ethernet Routing Switch 5000 SeriesConfiguration — System MonitoringNN47200-505 05.01 25 May 2009
Copyright © 2005 -2009 Nortel Networks. All Rights Reserved.
.
IGMP and the system event log 19
The MIB Web page does not support the following features:
• SNMP SET requests
• displaying SNMP tables
• translating MIB enumerations that are displaying the name(interpretation) of number values of objects defined as enumerations inthe MIB
IGMP and the system event logIGMP uses the components provided by the syslog tool. The syslog toolperforms functions, such as storing messages in the NVRAM or remotehost and displaying these log messages through the NNCLI, consolemenu, or Telnet.
The IGMP log events can be in one of the following three categories basedon their severity:
• Critical
• Serious
• Informational
IGMP logs the messages whenever any of the following types of eventsoccur in the system:
• IGMP initialization
• Configuration changes from the user
• Stack Join events
• IGMP messages: Report, Leave and Query messages received by theswitch
Events such as reception of IGMP messages occur frequently in the switchwhenever a new host joins or leaves a group. Logging such messagesconsumes a large amount of log memory.
Therefore, such messages should not be logged in all the time. By default,such message logging is disabled. You must enable this feature throughthe NNCLI to view the messages.
In Table 2 " IGMP syslog messages" (page 20):
• %d represents a decimal value for the preceding parameter. Forexample, 5 for VLAN 5
• %x represents a hexadecimal value for the preceding parameter. Forexample, 0xe0000a01 for Group 224.0.10.1
Nortel Ethernet Routing Switch 5000 SeriesConfiguration — System MonitoringNN47200-505 05.01 25 May 2009
Copyright © 2005 -2009 Nortel Networks. All Rights Reserved.
.

20 System monitoring fundamentals
Table 2 " IGMP syslog messages" (page 20) describes the IGMP syslogmessages and the severity.
Table 2IGMP syslog messages
Severity Log messages
Informational IGMP initialization success
Critical IGMP initialization failed: Error code %d
Informational IGMP policy initialized
Informational IGMP configuration loaded successfully
Informational IGMP configuration failed. Loaded to factory default
Informational IGMP configuration changed: Snooping enabled on VLAN %d
Informational IGMP configuration changed: Snooping disabled on VLAN %d
Informational IGMP configuration changed: Proxy enabled on VLAN %d
Informational IGMP configuration changed: Proxy disabled on VLAN %d
Informational IGMP configuration changed: Query time set to %d on VLAN%d
Informational IGMP configuration changed: Robust value set to %d on VLAN%d
Informational IGMP configuration changed: Version %d router port mask0x%x set on VLAN %d
Informational IGMP configuration changed: Unknown multicast filter enabled
Informational IGMP configuration changed: Unknown multicast filter enabled
Informational IGMP configuration changed: Trunk %d created for IGMP
Informational IGMP configuration changed: Trunk %d removed for IGMPports
Informational IGMP configuration changed: Mirror ports set
Informational IGMP configuration changed: Port %d added to VLAN %d
Informational IGMP configuration changed: Port %d removed from VLAN %d
Informational IGMP new Querier IP %x learned on port %d
Informational IGMP exchange database sent by unit %d
Informational IGMP exchange database received on unit %d from %d
Informational IGMP exchange database done
Informational IGMP stack join completed
Serious IGMP not able to join stack: Error code %d
Informational IGMP exchange group database sent by unit %d
Informational IGMP exchange group database received on unit %d from %d
Nortel Ethernet Routing Switch 5000 SeriesConfiguration — System MonitoringNN47200-505 05.01 25 May 2009
Copyright © 2005 -2009 Nortel Networks. All Rights Reserved.
.
Port mirroring 21
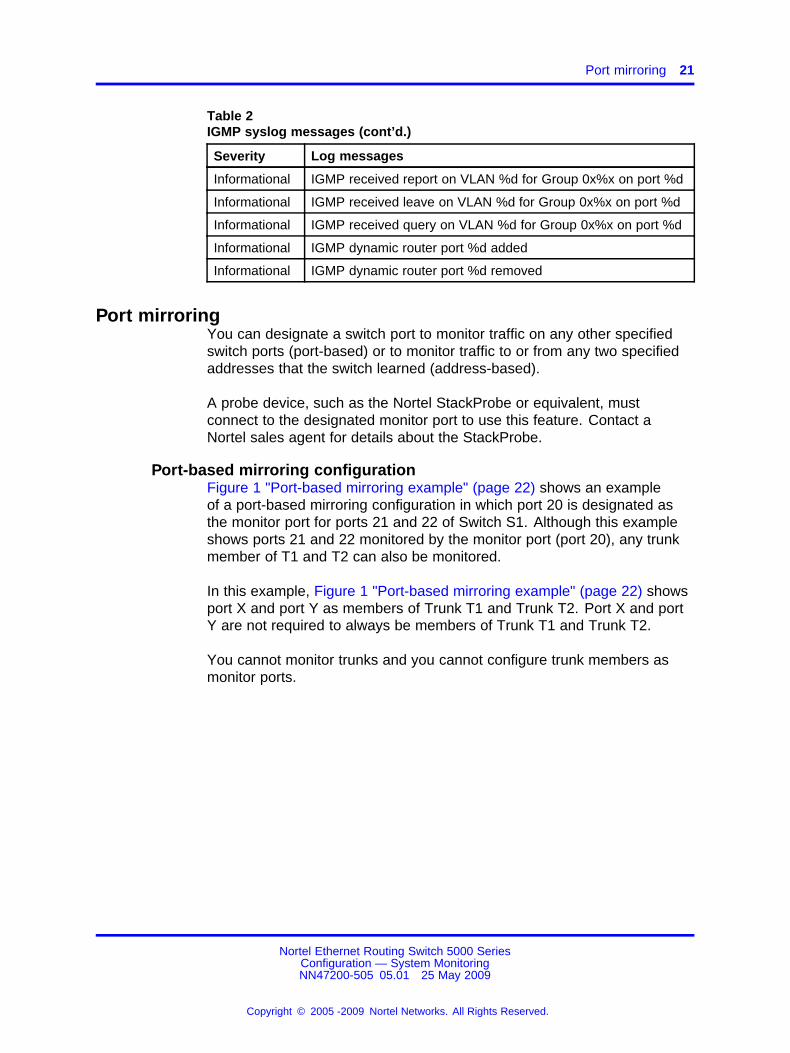
Table 2IGMP syslog messages (cont’d.)
Severity Log messages
Informational IGMP received report on VLAN %d for Group 0x%x on port %d
Informational IGMP received leave on VLAN %d for Group 0x%x on port %d
Informational IGMP received query on VLAN %d for Group 0x%x on port %d
Informational IGMP dynamic router port %d added
Informational IGMP dynamic router port %d removed
Port mirroringYou can designate a switch port to monitor traffic on any other specifiedswitch ports (port-based) or to monitor traffic to or from any two specifiedaddresses that the switch learned (address-based).
A probe device, such as the Nortel StackProbe or equivalent, mustconnect to the designated monitor port to use this feature. Contact aNortel sales agent for details about the StackProbe.
Port-based mirroring configurationFigure 1 "Port-based mirroring example" (page 22) shows an exampleof a port-based mirroring configuration in which port 20 is designated asthe monitor port for ports 21 and 22 of Switch S1. Although this exampleshows ports 21 and 22 monitored by the monitor port (port 20), any trunkmember of T1 and T2 can also be monitored.
In this example, Figure 1 "Port-based mirroring example" (page 22) showsport X and port Y as members of Trunk T1 and Trunk T2. Port X and portY are not required to always be members of Trunk T1 and Trunk T2.
You cannot monitor trunks and you cannot configure trunk members asmonitor ports.
Nortel Ethernet Routing Switch 5000 SeriesConfiguration — System MonitoringNN47200-505 05.01 25 May 2009
Copyright © 2005 -2009 Nortel Networks. All Rights Reserved.
.

22 System monitoring fundamentals
Figure 1Port-based mirroring example
In the preceding configuration example , you can configure the designatedmonitor port (port 20) to monitor traffic in any of the following modes:
• Monitor all traffic received by port X.
• Monitor all traffic transmitted by port X.
• Monitor all traffic received and transmitted by port X.
• Monitor all traffic received by port X or transmitted by port Y.
• Monitor all traffic received by port X (destined to port Y) and thentransmitted by port Y.
• Monitor all traffic received or transmitted by port X and transmitted orreceived by port Y (conversations between port X and port Y).
• Monitor all traffic received on many ports.
• Monitor all traffic transmitted on many ports.
• Monitor all traffic received or transmitted on many ports.
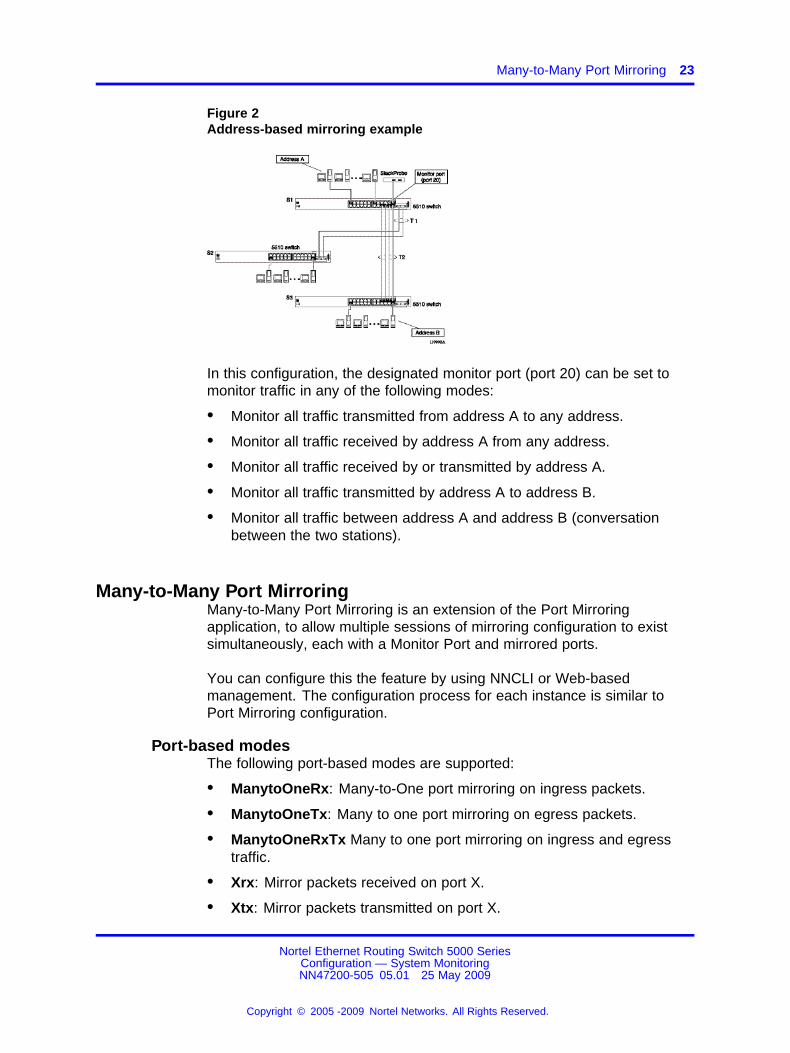
Address-based mirroring configurationThe following example shows an address-based mirroring configuration inwhich port 20, the designated monitor port for Switch S1, monitors trafficoccurring between address A and address B.
Nortel Ethernet Routing Switch 5000 SeriesConfiguration — System MonitoringNN47200-505 05.01 25 May 2009
Copyright © 2005 -2009 Nortel Networks. All Rights Reserved.
.
Many-to-Many Port Mirroring 23
Figure 2Address-based mirroring example
In this configuration, the designated monitor port (port 20) can be set tomonitor traffic in any of the following modes:
• Monitor all traffic transmitted from address A to any address.
• Monitor all traffic received by address A from any address.
• Monitor all traffic received by or transmitted by address A.
• Monitor all traffic transmitted by address A to address B.
• Monitor all traffic between address A and address B (conversationbetween the two stations).
Many-to-Many Port MirroringMany-to-Many Port Mirroring is an extension of the Port Mirroringapplication, to allow multiple sessions of mirroring configuration to existsimultaneously, each with a Monitor Port and mirrored ports.
You can configure this the feature by using NNCLI or Web-basedmanagement. The configuration process for each instance is similar toPort Mirroring configuration.
Port-based modesThe following port-based modes are supported:
• ManytoOneRx: Many-to-One port mirroring on ingress packets.
• ManytoOneTx: Many to one port mirroring on egress packets.
• ManytoOneRxTx Many to one port mirroring on ingress and egresstraffic.
• Xrx: Mirror packets received on port X.
• Xtx: Mirror packets transmitted on port X.
Nortel Ethernet Routing Switch 5000 SeriesConfiguration — System MonitoringNN47200-505 05.01 25 May 2009
Copyright © 2005 -2009 Nortel Networks. All Rights Reserved.
.
24 System monitoring fundamentals
• XrxOrXtx: Mirror packets received or transmitted on port X.
• XrxYtx: Mirror packets received on port X and transmitted on port Y.
• XrxYtxOrYrxXtx: Mirror packets received on port X and transmitted onport Y or packets received on port Y and transmitted on port X.
• XrxOrYtx: Mirror packets received on port X or transmitted on port Y
MAC address-based modes
• Asrc: Mirror packets with source MAC address A.
• Adst: Mirror packets with destination MAC address A
• AsrcOrAdst: Mirror packets with source or destination MAC addressA.
• AsrcBdst: Mirror packets with source MAC address A and destinationMAC address B.
• AsrcBdstOrBsrcAdst: Mirror packets with source MAC address A anddestination MAC address B or packets with source MAC address Band destination MAC address A.
Many-to-many port mirroring functionalityMany-to-Many Port Mirroring builds on the existing Port Mirroringapplication. Multiple instances are each configurable by using the existinginterface. Each instance is attached to one Monitor Port (MTP). In somecases a monitor port can be used in more than one instance. Up to fourinstances are available.
The ports which are configured as MTP are not allowed to be part of aMLT group.
Many-to-many port mirroring restrictionsMany-to-Many Port Mirroring is only available on pure Ethernet RoutingSwitch 5600 Series stacks or stand-alone Ethernet Routing Switch 5600Switches.
On startup, if a hybrid stack or standalone 5500 series unit is detected(stack oper-mode should be configured to hybrid), only the default instanceis available and the user interface does not provide a way to configureanother instance. An error message is returned if this is attempted.
If a 5500 series unit is inserted in a pure 5600 stack (stack oper-modeshould be configured to hybrid), and multiple instances of Port Mirroringare configured on the stack, because the stack is now a hybrid one, onlythe default instance is kept active and the user interface changes such that
Nortel Ethernet Routing Switch 5000 SeriesConfiguration — System MonitoringNN47200-505 05.01 25 May 2009
Copyright © 2005 -2009 Nortel Networks. All Rights Reserved.
.
Stack loopback tests 25
only this instance is applied and can be configured. If this is the case, theuser can only use only this instance entirely. If all the 5500 series units areremoved from a Stack (stack oper-mode should be changed to pure) allthe enabled instances are re-applied.
In a hybrid stack if all 5500 series units are removed and only one 5600series unit remains all port mirroring instances will become available. (the5600 series unit remains in standalone mode and stack oper-mode has nosense in this case).
An MTP cannot be a mirrored port for another MTP. Frames mirrored toone MTP are not taken into account in MAC address-based mirroring onanother MTP.
A port cannot be configured as MTP in an instance if it is already amirrored port in another instance.
If a port is egress-mirrored in one instance, it cannot be egress-mirrored inanother instance (to another MTP). The same applies to ingress-mirroredports. A port can be ingress-mirrored in one instance and egress-mirroredin another.
The ports that are configured as MTP cannot participate in a normal frameswitching operation.
Stack loopback testsYou can quickly test your stack ports and stack cable by using thestack loopback test. The stack loopback test is useful after you need todetermine whether the source of the problem is a defective stack cable ora damaged stack port. The test can help prevent unnecessarily sendingswitches for service.
Two types of loopback tests exist. The internal loopback test verifies thatthe stack ports are functional.
The external loopback test checks the stack cable to determine if it is thesource of the problem. Perform the external loopback test by connectingthe stack uplink port with the stack downlink port, sending a packet fromthe uplink port, and verifying that the packet is received on the downlinkport.
Always run the internal test first. Because the cable tests are notconclusive until you ensure the stack ports work correctly.
Nortel Ethernet Routing Switch 5000 SeriesConfiguration — System MonitoringNN47200-505 05.01 25 May 2009
Copyright © 2005 -2009 Nortel Networks. All Rights Reserved.
.
26 System monitoring fundamentals
Stack monitorThe Stack Monitor uses a set of control values to enable its operation, toset the expected stack size, and to control the frequency of trap sending.The stack monitor, if enabled, detects problems with the units in the stackand sends a trap.
The stack monitor sends a trap for the following events.
• The number of units in a stack changes.
• The trap sending timer expires.
Each time the number of units in a stack changes, the trap sending timerresets and the stack monitor compares the current number of stack unitswith the configured number of stack units. If the values are not equal, theswitch sends a trap and logs a message to syslog. The stack monitorsends traps from a stand-alone unit or the base unit of the stack.
After the trap sending timer reaches the configured number of secondsat which traps are sent, the switch sends a trap and logs a message tosyslog and restarts the trap sending timer. The syslog message is notrepeated unless the stack configuration changes. To prevent the log frombeing filled with stack configuration messages.
After you enable the stack monitor on a stack, the stack monitor capturesthe current stack size and uses it as the expected stack size. You canchoose a different value and set it after you enable the feature.
CPU and memory utilizationThe CPU utilization feature provides data for CPU and memory utilization.You can view CPU utilization information for the past 10 seconds (s),1 minute (min), 1 hour (hr), 24 hr, or since system startup. The switchdisplays CPU utilization as a percentage. With CPU utilization informationyou can see how the CPU was used during a specific time interval.
The memory utilization provides information about the percentage ofthe dynamic memory currently used by the system. The switch displaysmemory utilization in terms of the lowest percentage of dynamic memoryavailable since system startup.
No configuration is required for this display-only feature.
Nortel Ethernet Routing Switch 5000 SeriesConfiguration — System MonitoringNN47200-505 05.01 25 May 2009
Copyright © 2005 -2009 Nortel Networks. All Rights Reserved.
.

Power over Ethernet allocations 27
Light Emitting Diode displayThe device displays diagnostic and operation information though theLight Emitting Diodes (LED) on the unit. Familiarize yourself with theinterpretation of the LEDs on the Ethernet Routing Switch 5000 Seriesdevice. For information about the LED display seeNortel Ethernet RoutingSwitch 5000 Series — Installation (NN47200-300).
Power over Ethernet allocationsDevices such as IP phones, Web cameras, wireless access points thatutilize Power over Ethernet (PoE). The switch displays the PoE allocationsfor each port. The PoE standard (802.3af) imposes the Power Devices(PD) that require power to run at 48 V and not draw more than 16 W.
The switch has multiple ports that are PoE capable. You must makeconsideration for the total power and maximum power provided requiredfor each port and unit. Another important aspect is that of device priority.You must decide which device receives power when there is not enoughfor all.
Use the syslog to check the parameters. The following traps are logged:
• pethPsePortOnOffNotification: indicates if the switch port deliverspower to the connected device. This notification is sent on every statuschange except in the search mode.
• pethMainPowerUsageOnNotification: indicates that the switchthreshold usage indication is on and the usage power is higher thanthe threshold.
• pethMainPowerUsageOffNotification : indicates that the switchthreshold usage indication is off and the usage power is lower than thethreshold.
Displaying PoE allocations using NNCLIUse this procedure to display the PoE status for the switch.
Procedure Steps
Step Action
1 Use the show poe-main-status command to display theoverall status of PoE.
2 Observe the NNCLI output.
3 Use the show poe-port-status command to display theport-level PoE status.
4 Observe the NNCLI output.
Nortel Ethernet Routing Switch 5000 SeriesConfiguration — System MonitoringNN47200-505 05.01 25 May 2009
Copyright © 2005 -2009 Nortel Networks. All Rights Reserved.
.

28 System monitoring fundamentals
5 Use the show poe-power-measurement command to displaypower allocations on the switch.
6 Observe the NNCLI output.
--End--
Displaying PoE allocations using Web-based managementUse the Web-based management to display the PoE status for the switch.Use the dialogue boxes to configure and to observe current PoE status.
Step Action
1 Navigate to Configuration, PoE Management, Global PowerMgmt to view overall PoE status on the switch.
2 Observe the information in the dialogue box.
3 Navigate to Configuration, PoE Management, Port Property toview port-level PoE information.
4 Observe the information in the dialogue box.
--End--
IP Flow Information ExportIP Flow Information Export (IPFIX) is a protocol used to export flowinformation from traffic observed on a switch. Because IPFIX is still indevelopment with the IETF, the current implementation is based onNetflow Version 9.
IP traffic is sampled and classified into various flows based the followingparameters:
• protocol type
• destination IP address
• source IP address.
• ingress port
• TOS
You can not use IPFIX on secondary interfaces.
If the protocol type is TCP or UDP, a flow is defined by two additionalparameters:
Nortel Ethernet Routing Switch 5000 SeriesConfiguration — System MonitoringNN47200-505 05.01 25 May 2009
Copyright © 2005 -2009 Nortel Networks. All Rights Reserved.
.
Stack Health Check 29
• source port
• destination port
Release 5.0and later supports IPFIX through the creation and displayof sampled information as well as the ability to export this sampledinformation. You can access IPFIX accessed through Device Manager orWeb-based management.
The IPFIX feature shares resources with QoS. If the IPFIX feature isenabled, a QoS policy precedence is used. For further informationabout QoS policies, see the Nortel Ethernet Routing Switch 5500 SeriesConfiguration — Quality of Service () (NN47200-504).
Remote Network MonitoringThe Remote Network Monitoring (RMON) MIB is an interface between theRMON agent on the Nortel Ethernet Routing Switch 5500 Series and anRMON management application, such as the Device Manager.
RMON defines objects that are suitable for managing any type of network,but some groups are targeted specifically for Ethernet networks.
The RMON agent continuously collects statistics and monitors switchperformance.
RMON has three major functions:
• creating and displaying alarms for user-defined events
• gathering cumulative statistics for Ethernet interfaces
• tracking a history of statistics for Ethernet interfaces
Stack Health CheckThe Stack Health Check feature provides information on the stacking stateof each switch rear port. It is used to run a high-level test to monitor therear port status for each unit, confirm the number of switching units instack, detect if the stack runs with a temporary base unit, and to monitorstack continuity.
This feature is available through the NNCLI and Web-based management.
Nortel Ethernet Routing Switch 5000 SeriesConfiguration — System MonitoringNN47200-505 05.01 25 May 2009
Copyright © 2005 -2009 Nortel Networks. All Rights Reserved.
.
30 System monitoring fundamentals
Displaying environmental informationThis feature provides information on the status of the environment of eachunit in a stack. It is used to perform the following tasks:
• Monitor the hardware status for each unit.
• Detect the presence of AC, DC, or AC/DC power.
• Monitor the CPUs temperature.
• Identify damaged or missing hardware.
Nortel Ethernet Routing Switch 5000 SeriesConfiguration — System MonitoringNN47200-505 05.01 25 May 2009
Copyright © 2005 -2009 Nortel Networks. All Rights Reserved.
.
31.
System diagnostics and statisticsusing NNCLI
This chapter describes the procedures you can use to perform systemdiagnostics and gather statistics using NNCLI.
Navigation• “Port statistics” (page 31)
• “Configuring Stack Monitor” (page 32)
• “Viewing Stack Port Counters ” (page 34)
• “Clearing stack port counters ” (page 35)
• “Clearing stack port counters ” (page 35)
• “Using the stack loopback test” (page 36)
• “Displaying port operational status” (page 37)
• “Validating port operational status ” (page 38)
• “Showing port information ” (page 38)
• “Showing stack health information” (page 40)
• “Viewing environmental information” (page 43)
Port statisticsUse the NNCLI commands in this section to derive port statistics from theswitch.
Viewing port-statisticsUse this procedure to view the statistics for the port on both received andtransmitted traffic.
Nortel Ethernet Routing Switch 5000 SeriesConfiguration — System MonitoringNN47200-505 05.01 25 May 2009
Copyright © 2005 -2009 Nortel Networks. All Rights Reserved.
.
32 System diagnostics and statistics using NNCLI
Procedure steps
Step Action
1 Enter Global Configuration mode.
2 Enter the show port-statistics [port <portlist>]command.
--End--
Variable definitionsThe following table describes the command parameters.
Variable Definition
port <portlist> The ports to display statistics for. When noport list is specified, all ports are shown.
Configuring Stack MonitorThe following NNCLI commands are used to configure the Stack Monitor.
Viewing the stack-monitorUse this procedure to display the status of the Stack Monitor.
Procedure Steps
Step Action
1 Enter Privileged Executive mode.
2 Enter the show stack monitor command.
--End--
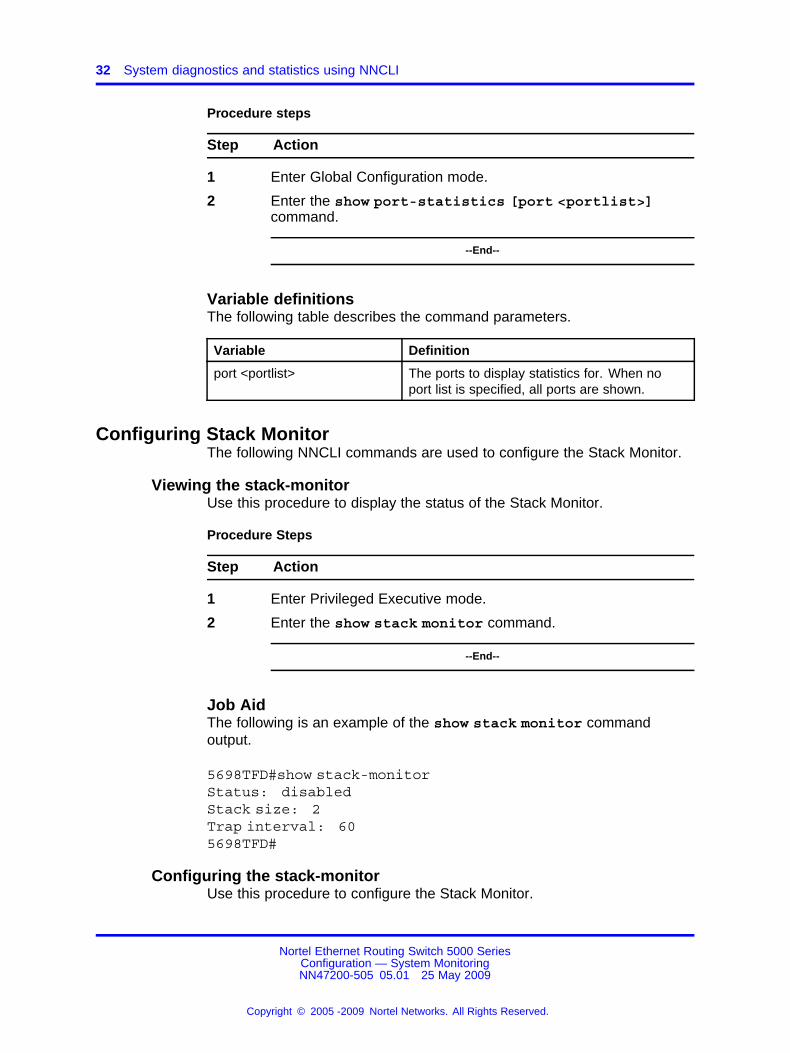
Job AidThe following is an example of the show stack monitor commandoutput.
5698TFD#show stack-monitorStatus: disabledStack size: 2Trap interval: 605698TFD#
Configuring the stack-monitorUse this procedure to configure the Stack Monitor.
Nortel Ethernet Routing Switch 5000 SeriesConfiguration — System MonitoringNN47200-505 05.01 25 May 2009
Copyright © 2005 -2009 Nortel Networks. All Rights Reserved.
.
Configuring Stack Monitor 33
ATTENTIONIf you do not specify a parameter for this command, all Stack Monitorparameters are set to their default values.
Procedure Steps
Step Action
1 Enter Global Configuration mode.
2 Enter the stack-monitor [enable] [stack-size <2-8>][trap-interval <30-300> command.
--End--
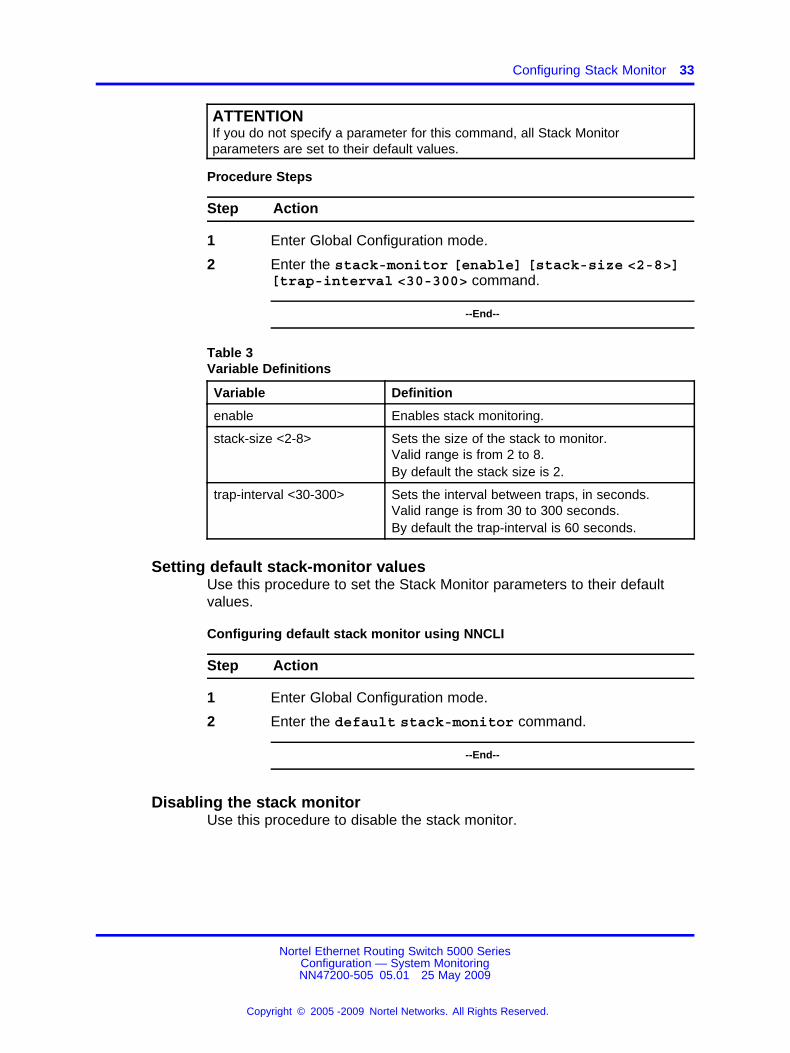
Table 3Variable Definitions
Variable Definition
enable Enables stack monitoring.
stack-size <2-8> Sets the size of the stack to monitor.Valid range is from 2 to 8.By default the stack size is 2.
trap-interval <30-300> Sets the interval between traps, in seconds.Valid range is from 30 to 300 seconds.By default the trap-interval is 60 seconds.
Setting default stack-monitor valuesUse this procedure to set the Stack Monitor parameters to their defaultvalues.
Configuring default stack monitor using NNCLI
Step Action
1 Enter Global Configuration mode.
2 Enter the default stack-monitor command.
--End--
Disabling the stack monitorUse this procedure to disable the stack monitor.
Nortel Ethernet Routing Switch 5000 SeriesConfiguration — System MonitoringNN47200-505 05.01 25 May 2009
Copyright © 2005 -2009 Nortel Networks. All Rights Reserved.
.
34 System diagnostics and statistics using NNCLI
Procedure Steps
Step Action
1 Enter Global Configuration mode.
2 Enter the no stack monitor command.
--End--
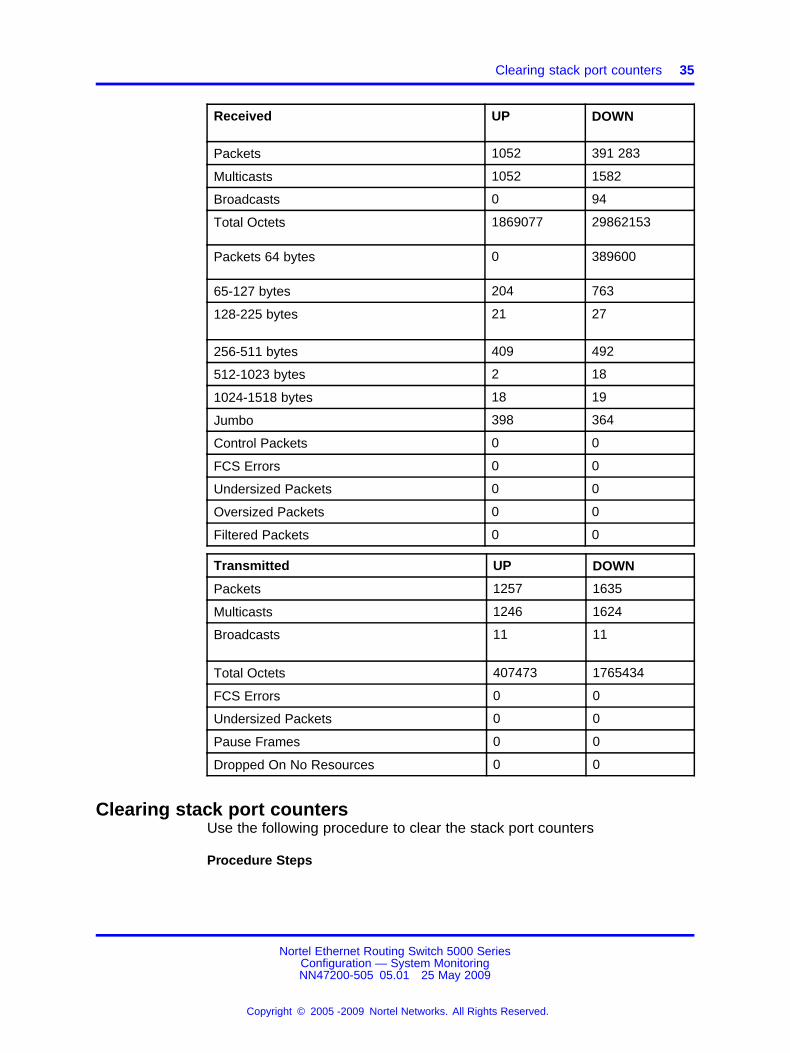
Viewing Stack Port CountersUse this procedure to configure the stack port counters.
ATTENTIONThe stack counters measure the size of packets received on HiGig ports. Thesize of these packets is greater than the size of the packets received on frontpanel ports since ASIC HiGig+ header is added to each of them. The size of thisheader is 12 bytes, therefore another range of stack counters is incrementedwhen sending packets having length close to the stack counters upper intervalslimit.
ATTENTIONThe number of received/transmitted packets can be greater than the numberof packets transmitted on front panel ports since there are different stackmanagement packets transmitted/received.
Procedure Steps
Step Action
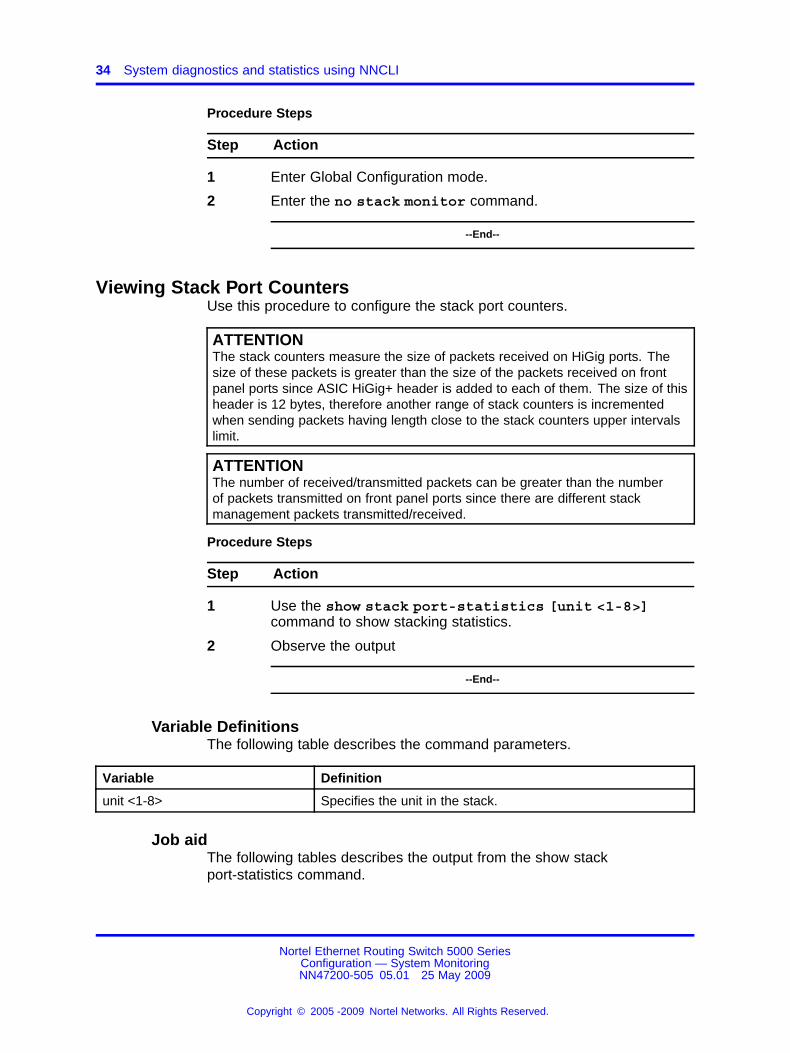
1 Use the show stack port-statistics [unit <1-8>]command to show stacking statistics.
2 Observe the output
--End--
Variable DefinitionsThe following table describes the command parameters.
Variable Definition
unit <1-8> Specifies the unit in the stack.
Job aidThe following tables describes the output from the show stackport-statistics command.
Nortel Ethernet Routing Switch 5000 SeriesConfiguration — System MonitoringNN47200-505 05.01 25 May 2009
Copyright © 2005 -2009 Nortel Networks. All Rights Reserved.
.
Clearing stack port counters 35
Received UP DOWN
Packets 1052 391 283
Multicasts 1052 1582
Broadcasts 0 94
Total Octets 1869077 29862153
Packets 64 bytes 0 389600
65-127 bytes 204 763
128-225 bytes 21 27
256-511 bytes 409 492
512-1023 bytes 2 18
1024-1518 bytes 18 19
Jumbo 398 364
Control Packets 0 0
FCS Errors 0 0
Undersized Packets 0 0
Oversized Packets 0 0
Filtered Packets 0 0
Transmitted UP DOWN
Packets 1257 1635
Multicasts 1246 1624
Broadcasts 11 11
Total Octets 407473 1765434
FCS Errors 0 0
Undersized Packets 0 0
Pause Frames 0 0
Dropped On No Resources 0 0
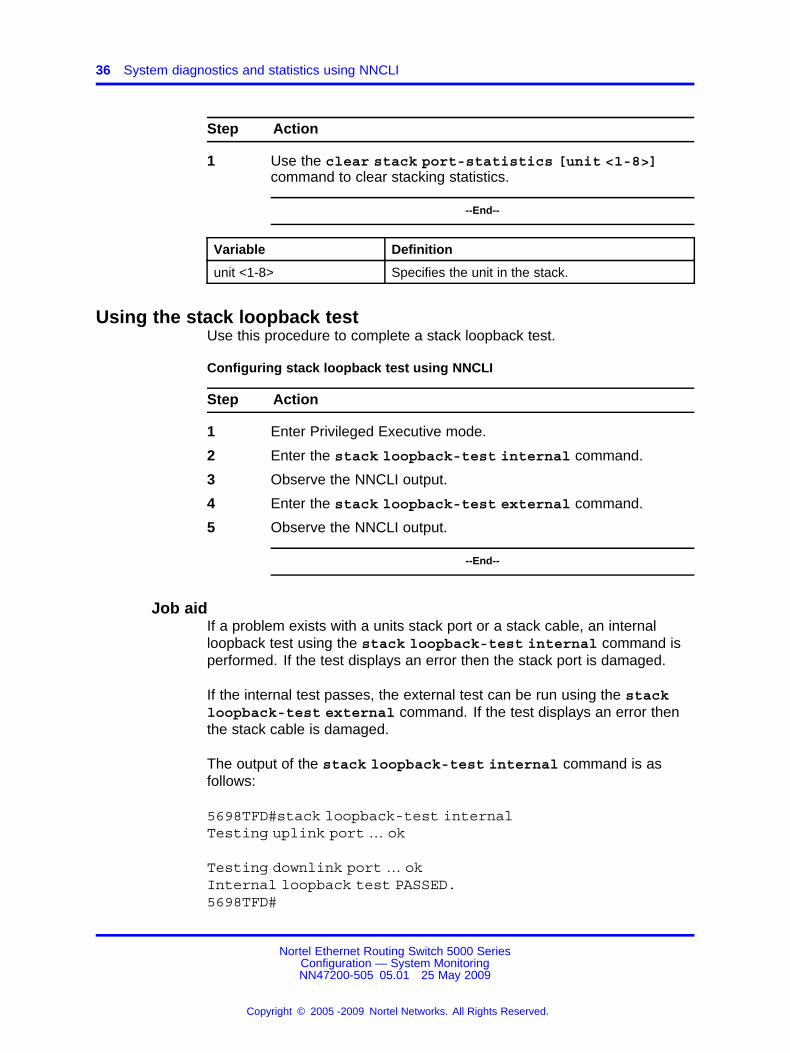
Clearing stack port countersUse the following procedure to clear the stack port counters
Procedure Steps
Nortel Ethernet Routing Switch 5000 SeriesConfiguration — System MonitoringNN47200-505 05.01 25 May 2009
Copyright © 2005 -2009 Nortel Networks. All Rights Reserved.
.
36 System diagnostics and statistics using NNCLI
Step Action
1 Use the clear stack port-statistics [unit <1-8>]command to clear stacking statistics.
--End--
Variable Definition
unit <1-8> Specifies the unit in the stack.
Using the stack loopback testUse this procedure to complete a stack loopback test.
Configuring stack loopback test using NNCLI
Step Action
1 Enter Privileged Executive mode.
2 Enter the stack loopback-test internal command.
3 Observe the NNCLI output.
4 Enter the stack loopback-test external command.
5 Observe the NNCLI output.
--End--
Job aidIf a problem exists with a units stack port or a stack cable, an internalloopback test using the stack loopback-test internal command isperformed. If the test displays an error then the stack port is damaged.
If the internal test passes, the external test can be run using the stackloopback-test external command. If the test displays an error thenthe stack cable is damaged.
The output of the stack loopback-test internal command is asfollows:
5698TFD#stack loopback-test internalTesting uplink port … ok
Testing downlink port … okInternal loopback test PASSED.5698TFD#
Nortel Ethernet Routing Switch 5000 SeriesConfiguration — System MonitoringNN47200-505 05.01 25 May 2009
Copyright © 2005 -2009 Nortel Networks. All Rights Reserved.
.
Displaying port operational status 37
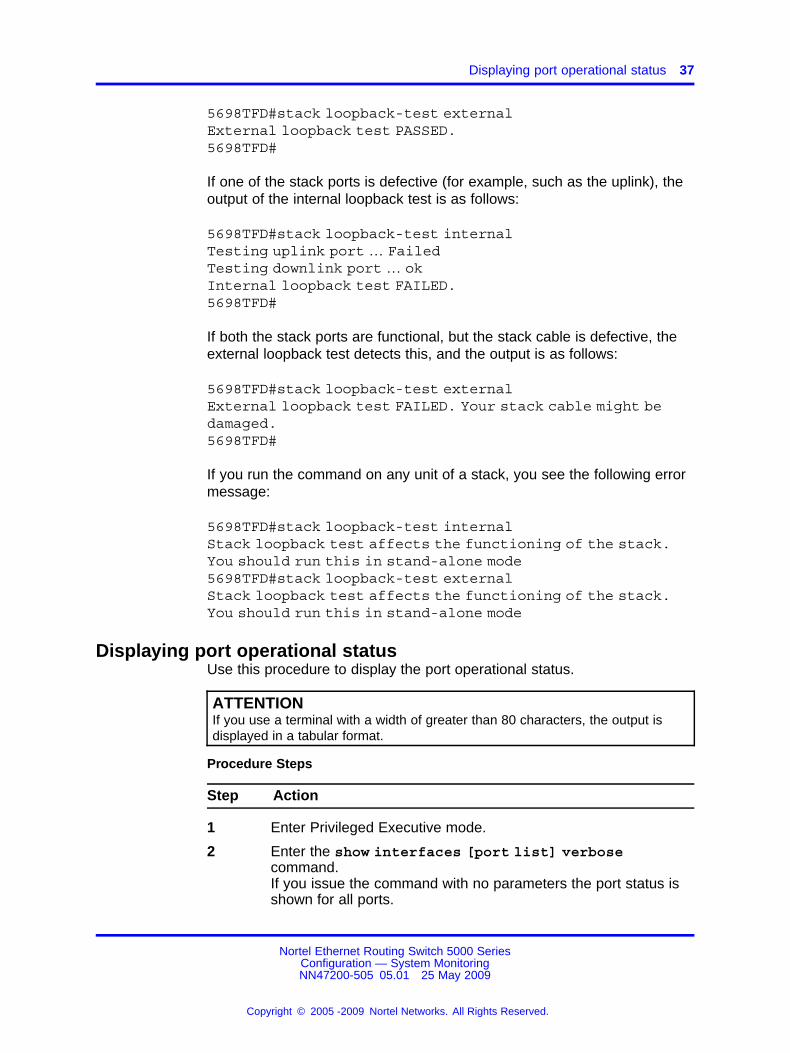
5698TFD#stack loopback-test externalExternal loopback test PASSED.5698TFD#
If one of the stack ports is defective (for example, such as the uplink), theoutput of the internal loopback test is as follows:
5698TFD#stack loopback-test internalTesting uplink port … FailedTesting downlink port … okInternal loopback test FAILED.5698TFD#
If both the stack ports are functional, but the stack cable is defective, theexternal loopback test detects this, and the output is as follows:
5698TFD#stack loopback-test externalExternal loopback test FAILED. Your stack cable might bedamaged.5698TFD#
If you run the command on any unit of a stack, you see the following errormessage:
5698TFD#stack loopback-test internalStack loopback test affects the functioning of the stack.You should run this in stand-alone mode5698TFD#stack loopback-test externalStack loopback test affects the functioning of the stack.You should run this in stand-alone mode
Displaying port operational statusUse this procedure to display the port operational status.
ATTENTIONIf you use a terminal with a width of greater than 80 characters, the output isdisplayed in a tabular format.
Procedure Steps
Step Action
1 Enter Privileged Executive mode.
2 Enter the show interfaces [port list] verbosecommand.If you issue the command with no parameters the port status isshown for all ports.
Nortel Ethernet Routing Switch 5000 SeriesConfiguration — System MonitoringNN47200-505 05.01 25 May 2009
Copyright © 2005 -2009 Nortel Networks. All Rights Reserved.
.
38 System diagnostics and statistics using NNCLI
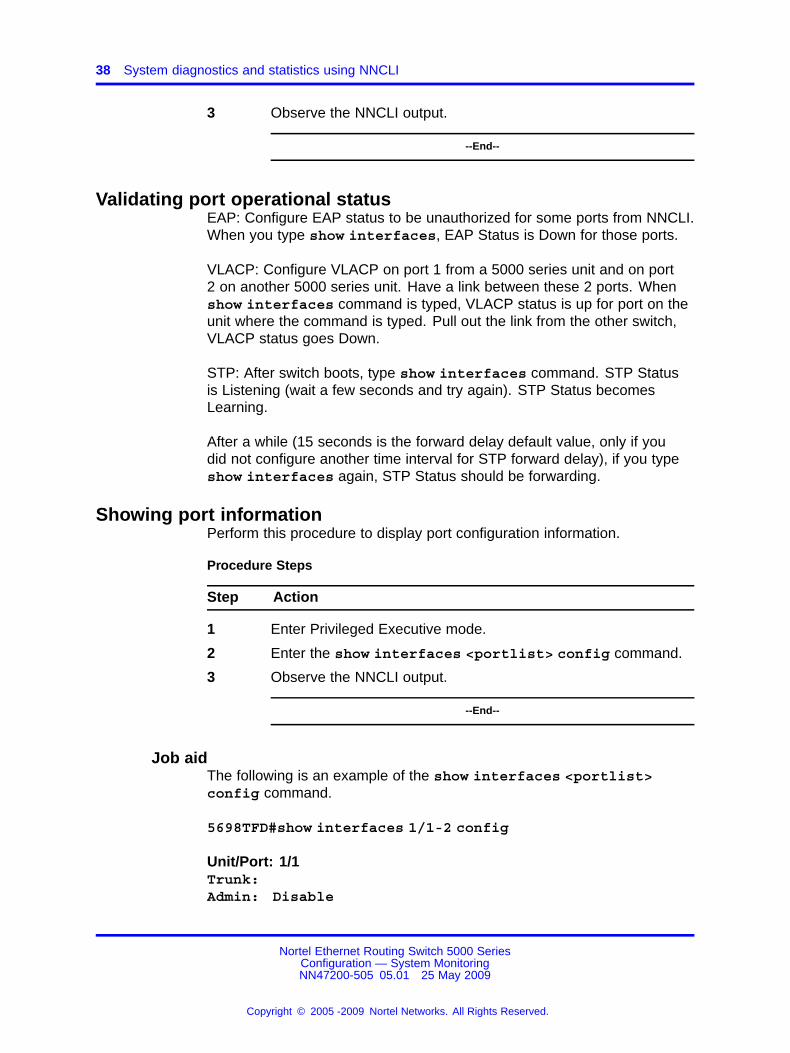
3 Observe the NNCLI output.
--End--
Validating port operational statusEAP: Configure EAP status to be unauthorized for some ports from NNCLI.When you type show interfaces, EAP Status is Down for those ports.
VLACP: Configure VLACP on port 1 from a 5000 series unit and on port2 on another 5000 series unit. Have a link between these 2 ports. Whenshow interfaces command is typed, VLACP status is up for port on theunit where the command is typed. Pull out the link from the other switch,VLACP status goes Down.
STP: After switch boots, type show interfaces command. STP Statusis Listening (wait a few seconds and try again). STP Status becomesLearning.
After a while (15 seconds is the forward delay default value, only if youdid not configure another time interval for STP forward delay), if you typeshow interfaces again, STP Status should be forwarding.
Showing port informationPerform this procedure to display port configuration information.
Procedure Steps
Step Action
1 Enter Privileged Executive mode.
2 Enter the show interfaces <portlist> config command.
3 Observe the NNCLI output.
--End--
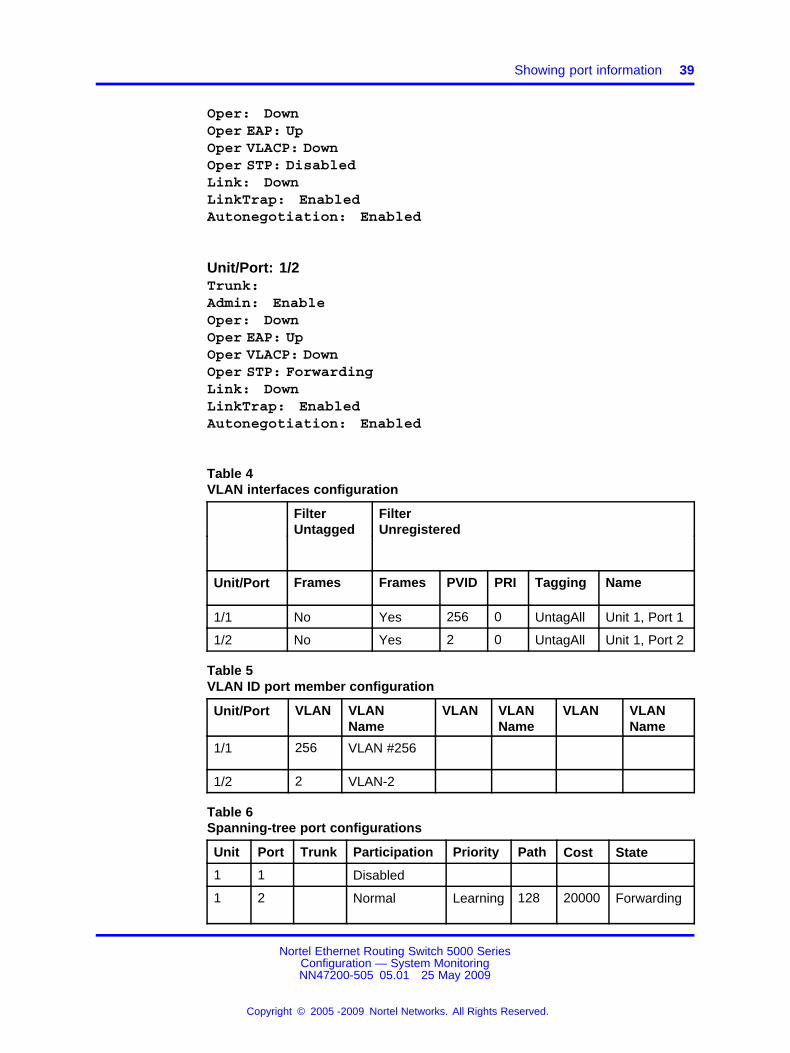
Job aidThe following is an example of the show interfaces <portlist>config command.
5698TFD#show interfaces 1/1-2 config
Unit/Port: 1/1Trunk:Admin: Disable
Nortel Ethernet Routing Switch 5000 SeriesConfiguration — System MonitoringNN47200-505 05.01 25 May 2009
Copyright © 2005 -2009 Nortel Networks. All Rights Reserved.
.
Showing port information 39
Oper: DownOper EAP: UpOper VLACP: DownOper STP: DisabledLink: DownLinkTrap: EnabledAutonegotiation: Enabled
Unit/Port: 1/2Trunk:Admin: EnableOper: DownOper EAP: UpOper VLACP: DownOper STP: ForwardingLink: DownLinkTrap: EnabledAutonegotiation: Enabled
Table 4VLAN interfaces configuration
FilterUntagged
FilterUnregistered
Unit/Port Frames Frames PVID PRI Tagging Name
1/1 No Yes 256 0 UntagAll Unit 1, Port 1
1/2 No Yes 2 0 UntagAll Unit 1, Port 2
Table 5VLAN ID port member configuration
Unit/Port VLAN VLANName
VLAN VLANName
VLAN VLANName
1/1 256 VLAN #256
1/2 2 VLAN-2
Table 6Spanning-tree port configurations
Unit Port Trunk Participation Priority Path Cost State
1 1 Disabled
1 2 Normal Learning 128 20000 Forwarding
Nortel Ethernet Routing Switch 5000 SeriesConfiguration — System MonitoringNN47200-505 05.01 25 May 2009
Copyright © 2005 -2009 Nortel Networks. All Rights Reserved.
.
40 System diagnostics and statistics using NNCLI
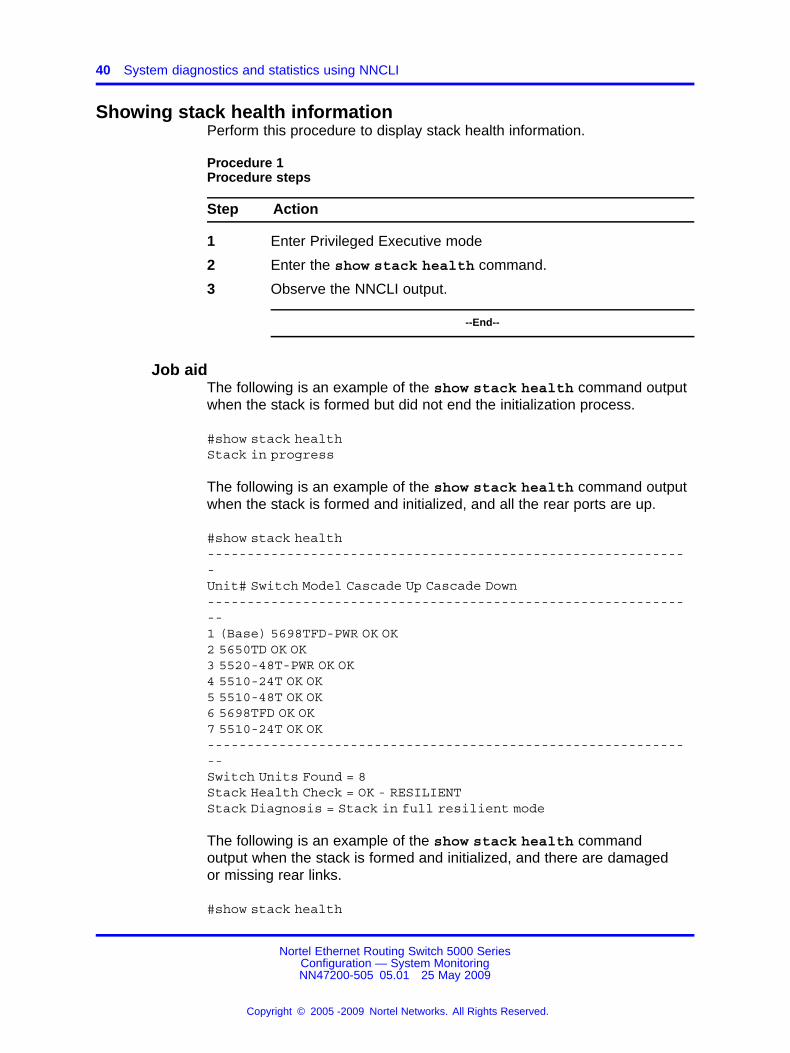
Showing stack health informationPerform this procedure to display stack health information.
Procedure 1Procedure steps
Step Action
1 Enter Privileged Executive mode
2 Enter the show stack health command.
3 Observe the NNCLI output.
--End--
Job aidThe following is an example of the show stack health command outputwhen the stack is formed but did not end the initialization process.
#show stack healthStack in progress
The following is an example of the show stack health command outputwhen the stack is formed and initialized, and all the rear ports are up.
#show stack health-------------------------------------------------------------Unit# Switch Model Cascade Up Cascade Down--------------------------------------------------------------1 (Base) 5698TFD-PWR OK OK2 5650TD OK OK3 5520-48T-PWR OK OK4 5510-24T OK OK5 5510-48T OK OK6 5698TFD OK OK7 5510-24T OK OK--------------------------------------------------------------Switch Units Found = 8Stack Health Check = OK - RESILIENTStack Diagnosis = Stack in full resilient mode
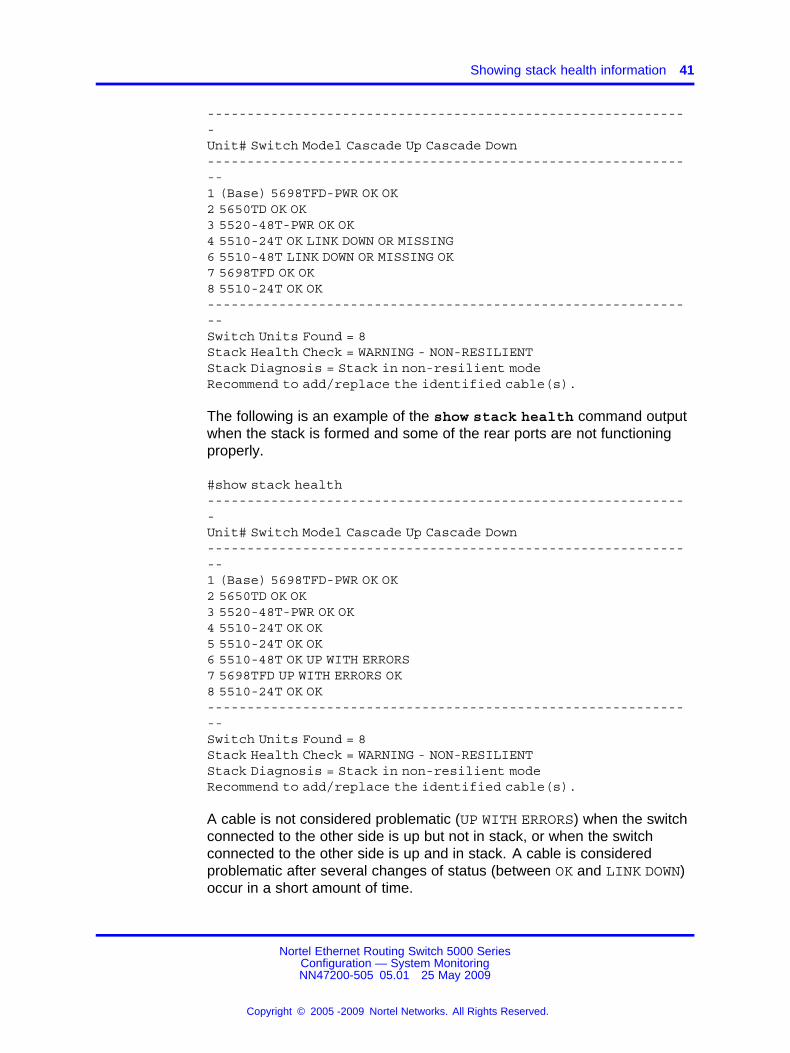
The following is an example of the show stack health commandoutput when the stack is formed and initialized, and there are damagedor missing rear links.
#show stack health
Nortel Ethernet Routing Switch 5000 SeriesConfiguration — System MonitoringNN47200-505 05.01 25 May 2009
Copyright © 2005 -2009 Nortel Networks. All Rights Reserved.
.
Showing stack health information 41
-------------------------------------------------------------Unit# Switch Model Cascade Up Cascade Down--------------------------------------------------------------1 (Base) 5698TFD-PWR OK OK2 5650TD OK OK3 5520-48T-PWR OK OK4 5510-24T OK LINK DOWN OR MISSING6 5510-48T LINK DOWN OR MISSING OK7 5698TFD OK OK8 5510-24T OK OK--------------------------------------------------------------Switch Units Found = 8Stack Health Check = WARNING - NON-RESILIENTStack Diagnosis = Stack in non-resilient modeRecommend to add/replace the identified cable(s).
The following is an example of the show stack health command outputwhen the stack is formed and some of the rear ports are not functioningproperly.
#show stack health-------------------------------------------------------------Unit# Switch Model Cascade Up Cascade Down--------------------------------------------------------------1 (Base) 5698TFD-PWR OK OK2 5650TD OK OK3 5520-48T-PWR OK OK4 5510-24T OK OK5 5510-24T OK OK6 5510-48T OK UP WITH ERRORS7 5698TFD UP WITH ERRORS OK8 5510-24T OK OK--------------------------------------------------------------Switch Units Found = 8Stack Health Check = WARNING - NON-RESILIENTStack Diagnosis = Stack in non-resilient modeRecommend to add/replace the identified cable(s).
A cable is not considered problematic (UP WITH ERRORS) when the switchconnected to the other side is up but not in stack, or when the switchconnected to the other side is up and in stack. A cable is consideredproblematic after several changes of status (between OK and LINK DOWN)occur in a short amount of time.
Nortel Ethernet Routing Switch 5000 SeriesConfiguration — System MonitoringNN47200-505 05.01 25 May 2009
Copyright © 2005 -2009 Nortel Networks. All Rights Reserved.
.
42 System diagnostics and statistics using NNCLI
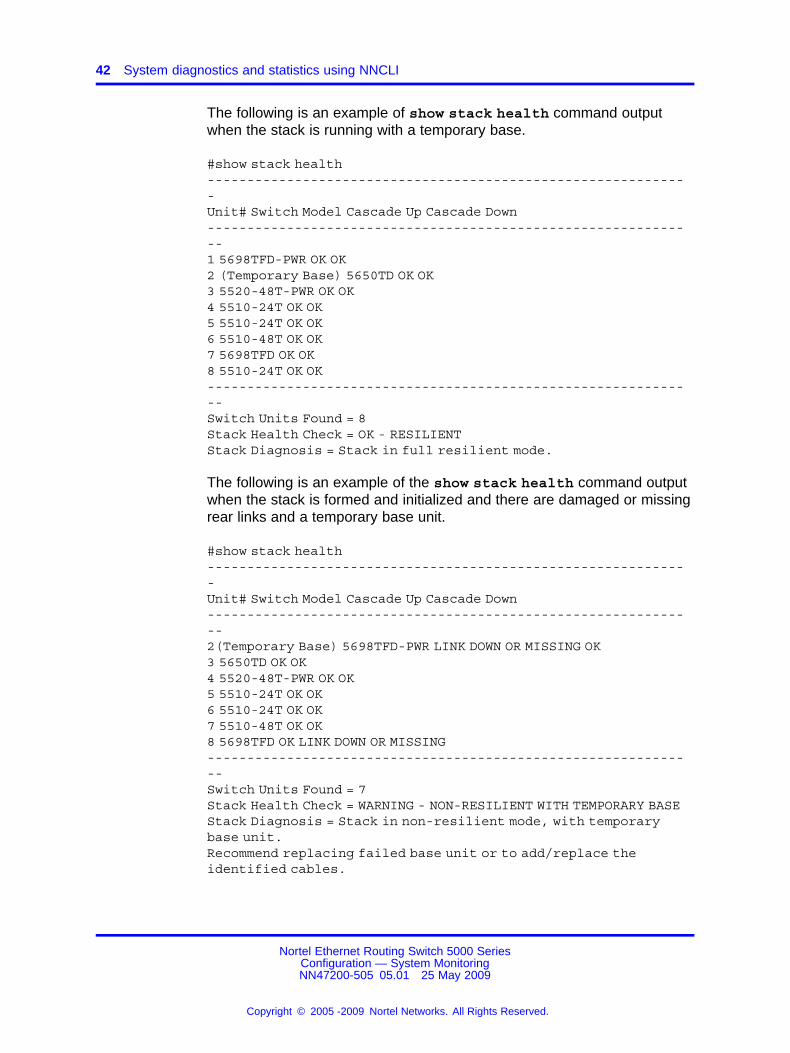
The following is an example of show stack health command outputwhen the stack is running with a temporary base.
#show stack health-------------------------------------------------------------Unit# Switch Model Cascade Up Cascade Down--------------------------------------------------------------1 5698TFD-PWR OK OK2 (Temporary Base) 5650TD OK OK3 5520-48T-PWR OK OK4 5510-24T OK OK5 5510-24T OK OK6 5510-48T OK OK7 5698TFD OK OK8 5510-24T OK OK--------------------------------------------------------------Switch Units Found = 8Stack Health Check = OK - RESILIENTStack Diagnosis = Stack in full resilient mode.
The following is an example of the show stack health command outputwhen the stack is formed and initialized and there are damaged or missingrear links and a temporary base unit.
#show stack health-------------------------------------------------------------Unit# Switch Model Cascade Up Cascade Down--------------------------------------------------------------2(Temporary Base) 5698TFD-PWR LINK DOWN OR MISSING OK3 5650TD OK OK4 5520-48T-PWR OK OK5 5510-24T OK OK6 5510-24T OK OK7 5510-48T OK OK8 5698TFD OK LINK DOWN OR MISSING--------------------------------------------------------------Switch Units Found = 7Stack Health Check = WARNING - NON-RESILIENT WITH TEMPORARY BASEStack Diagnosis = Stack in non-resilient mode, with temporarybase unit.Recommend replacing failed base unit or to add/replace theidentified cables.
Nortel Ethernet Routing Switch 5000 SeriesConfiguration — System MonitoringNN47200-505 05.01 25 May 2009
Copyright © 2005 -2009 Nortel Networks. All Rights Reserved.
.
Viewing environmental information 43
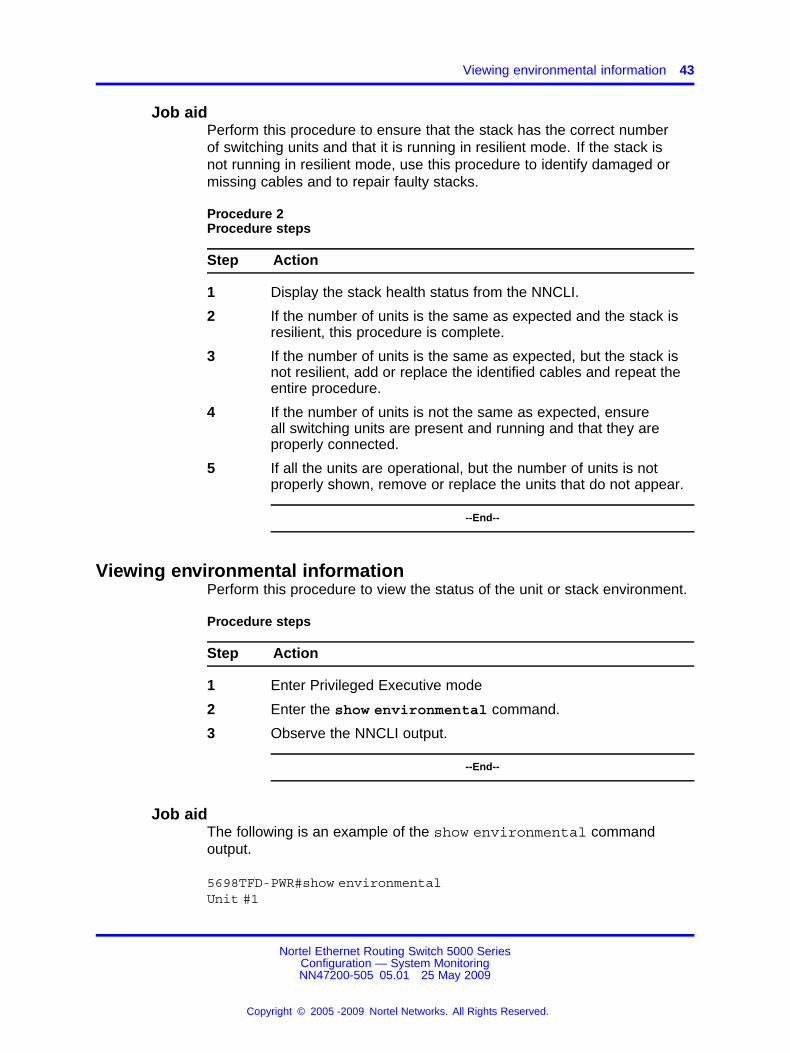
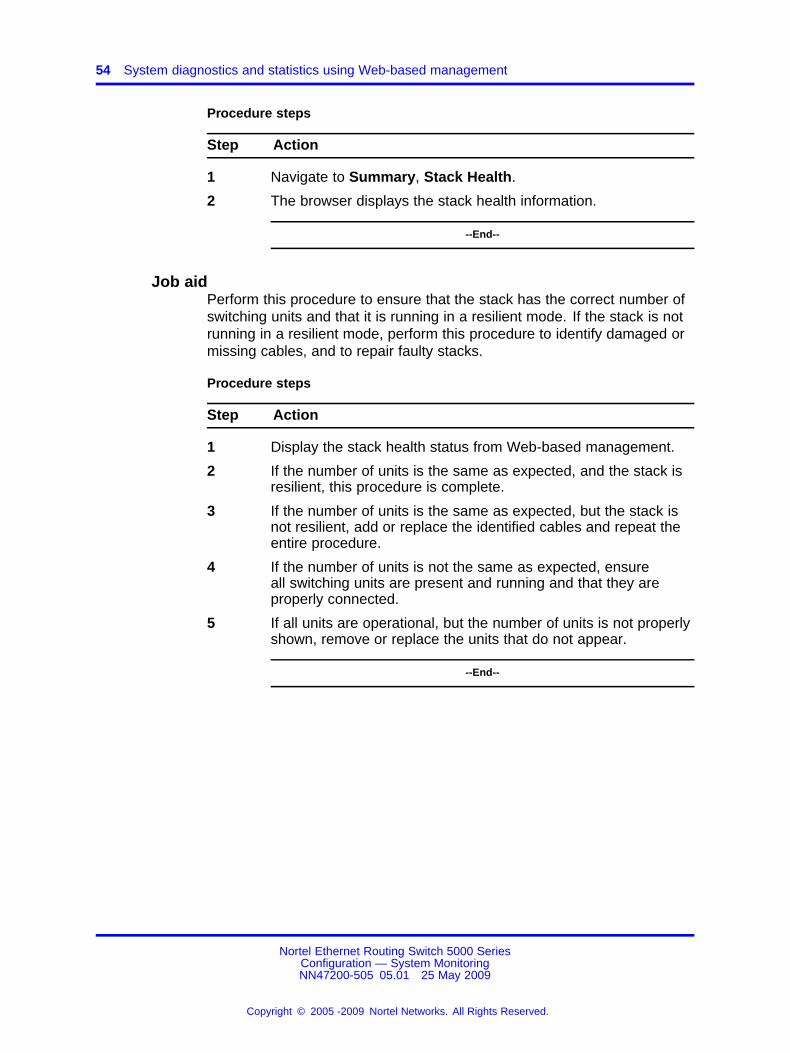
Job aidPerform this procedure to ensure that the stack has the correct numberof switching units and that it is running in resilient mode. If the stack isnot running in resilient mode, use this procedure to identify damaged ormissing cables and to repair faulty stacks.
Procedure 2Procedure steps
Step Action
1 Display the stack health status from the NNCLI.
2 If the number of units is the same as expected and the stack isresilient, this procedure is complete.
3 If the number of units is the same as expected, but the stack isnot resilient, add or replace the identified cables and repeat theentire procedure.
4 If the number of units is not the same as expected, ensureall switching units are present and running and that they areproperly connected.
5 If all the units are operational, but the number of units is notproperly shown, remove or replace the units that do not appear.
--End--
Viewing environmental informationPerform this procedure to view the status of the unit or stack environment.
Procedure steps
Step Action
1 Enter Privileged Executive mode
2 Enter the show environmental command.
3 Observe the NNCLI output.
--End--
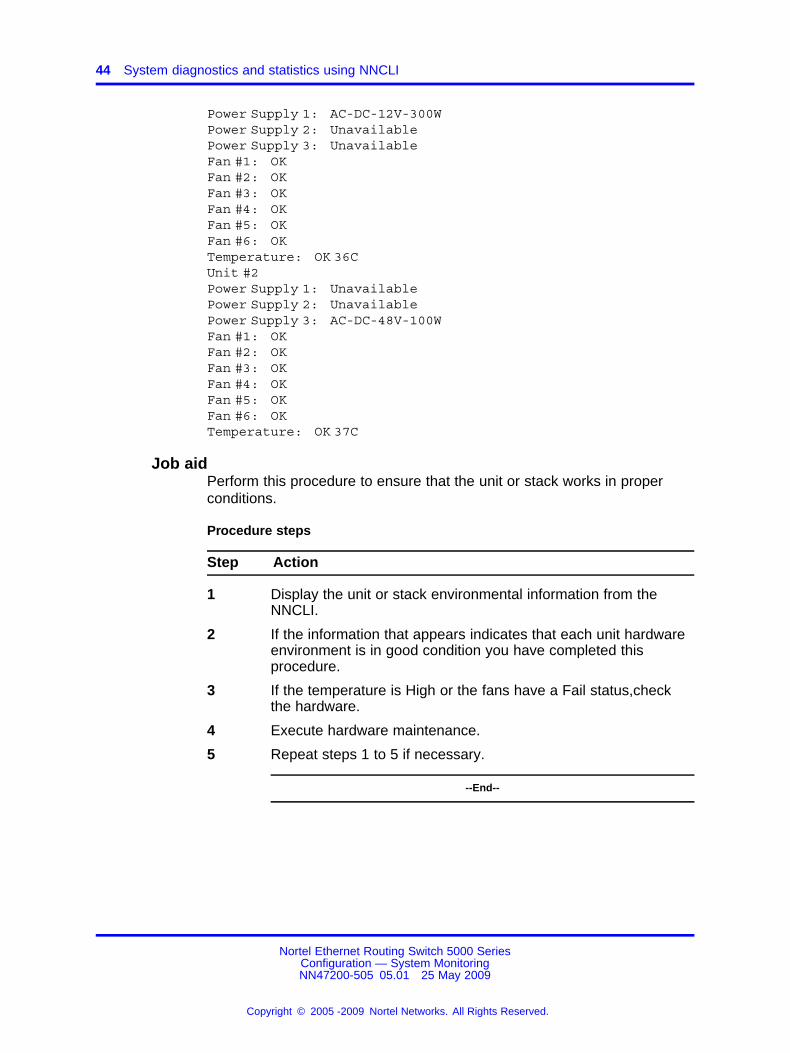
Job aidThe following is an example of the show environmental commandoutput.
5698TFD-PWR#show environmentalUnit #1
Nortel Ethernet Routing Switch 5000 SeriesConfiguration — System MonitoringNN47200-505 05.01 25 May 2009
Copyright © 2005 -2009 Nortel Networks. All Rights Reserved.
.
44 System diagnostics and statistics using NNCLI
Power Supply 1: AC-DC-12V-300WPower Supply 2: UnavailablePower Supply 3: UnavailableFan #1: OKFan #2: OKFan #3: OKFan #4: OKFan #5: OKFan #6: OKTemperature: OK 36CUnit #2Power Supply 1: UnavailablePower Supply 2: UnavailablePower Supply 3: AC-DC-48V-100WFan #1: OKFan #2: OKFan #3: OKFan #4: OKFan #5: OKFan #6: OKTemperature: OK 37C
Job aidPerform this procedure to ensure that the unit or stack works in properconditions.
Procedure steps
Step Action
1 Display the unit or stack environmental information from theNNCLI.
2 If the information that appears indicates that each unit hardwareenvironment is in good condition you have completed thisprocedure.
3 If the temperature is High or the fans have a Fail status,checkthe hardware.
4 Execute hardware maintenance.
5 Repeat steps 1 to 5 if necessary.
--End--
Nortel Ethernet Routing Switch 5000 SeriesConfiguration — System MonitoringNN47200-505 05.01 25 May 2009
Copyright © 2005 -2009 Nortel Networks. All Rights Reserved.
.

45.
System diagnostics and statisticsusing Web-based management
This chapter contains information regarding using Web-basedmanagement for system diagnostics and statistics.
Navigation• “Viewing port statistics using Web-based management” (page 45)
• “Viewing all port errors” (page 47)
• “Displaying port-mirroring using Web-based management” (page 48)
• “Configuring port-mirroring using Web-based management” (page 48)
• “Viewing interface statistics” (page 49)
• “Viewing Ethernet error statistics” (page 50)
• “Viewing transparent bridging statistics” (page 52)
• “Monitoring MLT traffic” (page 53)
• “Viewing stack health” (page 53)
Viewing port statistics using Web-based managementView statistical data about a selected port.
Procedure Steps
Step Action
1 To open the Port Statistics window, select Statistics, Port fromthe menu.
2 Select a port from the Port list in the Port Statistics (View By)section.
3 Click Update to refresh the statistical information.
4 Click Zero Port to reset the counters for the selected port.
Nortel Ethernet Routing Switch 5000 SeriesConfiguration — System MonitoringNN47200-505 05.01 25 May 2009
Copyright © 2005 -2009 Nortel Networks. All Rights Reserved.
.
46 System diagnostics and statistics using Web-based management
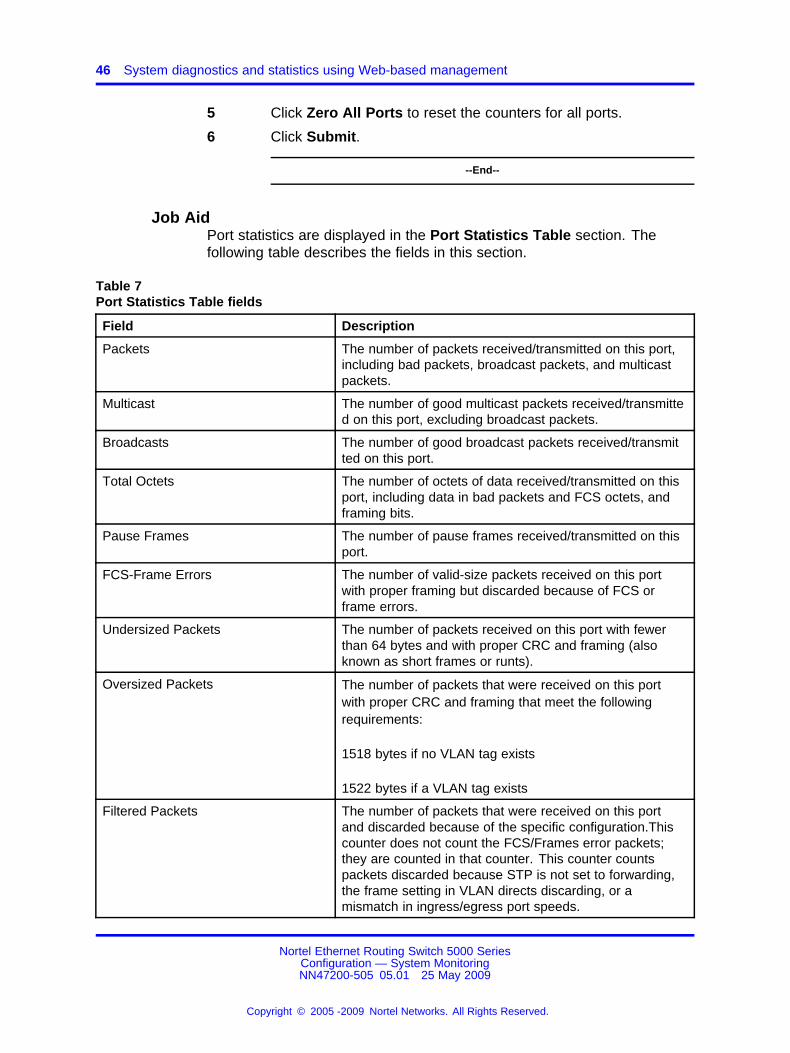
5 Click Zero All Ports to reset the counters for all ports.
6 Click Submit.
--End--
Job AidPort statistics are displayed in the Port Statistics Table section. Thefollowing table describes the fields in this section.
Table 7Port Statistics Table fields
Field Description
Packets The number of packets received/transmitted on this port,including bad packets, broadcast packets, and multicastpackets.
Multicast The number of good multicast packets received/transmitted on this port, excluding broadcast packets.
Broadcasts The number of good broadcast packets received/transmitted on this port.
Total Octets The number of octets of data received/transmitted on thisport, including data in bad packets and FCS octets, andframing bits.
Pause Frames The number of pause frames received/transmitted on thisport.
FCS-Frame Errors The number of valid-size packets received on this portwith proper framing but discarded because of FCS orframe errors.
Undersized Packets The number of packets received on this port with fewerthan 64 bytes and with proper CRC and framing (alsoknown as short frames or runts).
Oversized Packets The number of packets that were received on this portwith proper CRC and framing that meet the followingrequirements:
1518 bytes if no VLAN tag exists
1522 bytes if a VLAN tag exists
Filtered Packets The number of packets that were received on this portand discarded because of the specific configuration.Thiscounter does not count the FCS/Frames error packets;they are counted in that counter. This counter countspackets discarded because STP is not set to forwarding,the frame setting in VLAN directs discarding, or amismatch in ingress/egress port speeds.
Nortel Ethernet Routing Switch 5000 SeriesConfiguration — System MonitoringNN47200-505 05.01 25 May 2009
Copyright © 2005 -2009 Nortel Networks. All Rights Reserved.
.
Viewing all port errors 47
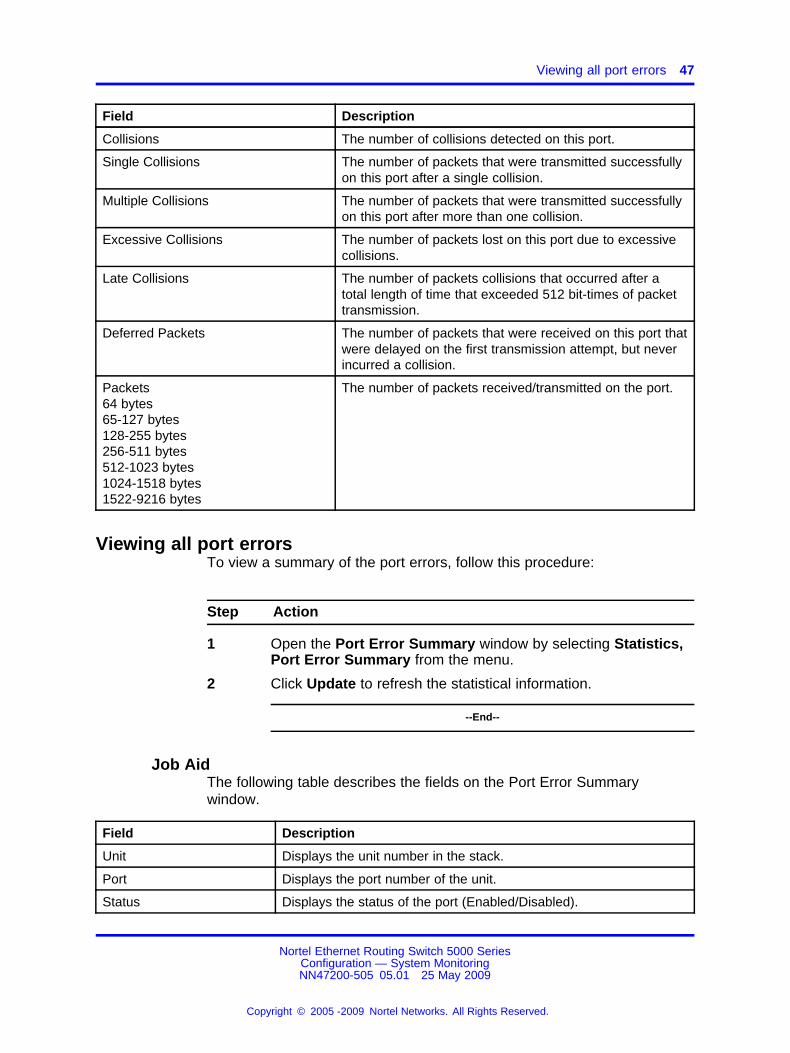
Field Description
Collisions The number of collisions detected on this port.
Single Collisions The number of packets that were transmitted successfullyon this port after a single collision.
Multiple Collisions The number of packets that were transmitted successfullyon this port after more than one collision.
Excessive Collisions The number of packets lost on this port due to excessivecollisions.
Late Collisions The number of packets collisions that occurred after atotal length of time that exceeded 512 bit-times of packettransmission.
Deferred Packets The number of packets that were received on this port thatwere delayed on the first transmission attempt, but neverincurred a collision.
Packets64 bytes65-127 bytes128-255 bytes256-511 bytes512-1023 bytes1024-1518 bytes1522-9216 bytes
The number of packets received/transmitted on the port.
Viewing all port errorsTo view a summary of the port errors, follow this procedure:
Step Action
1 Open the Port Error Summary window by selecting Statistics,Port Error Summary from the menu.
2 Click Update to refresh the statistical information.
--End--
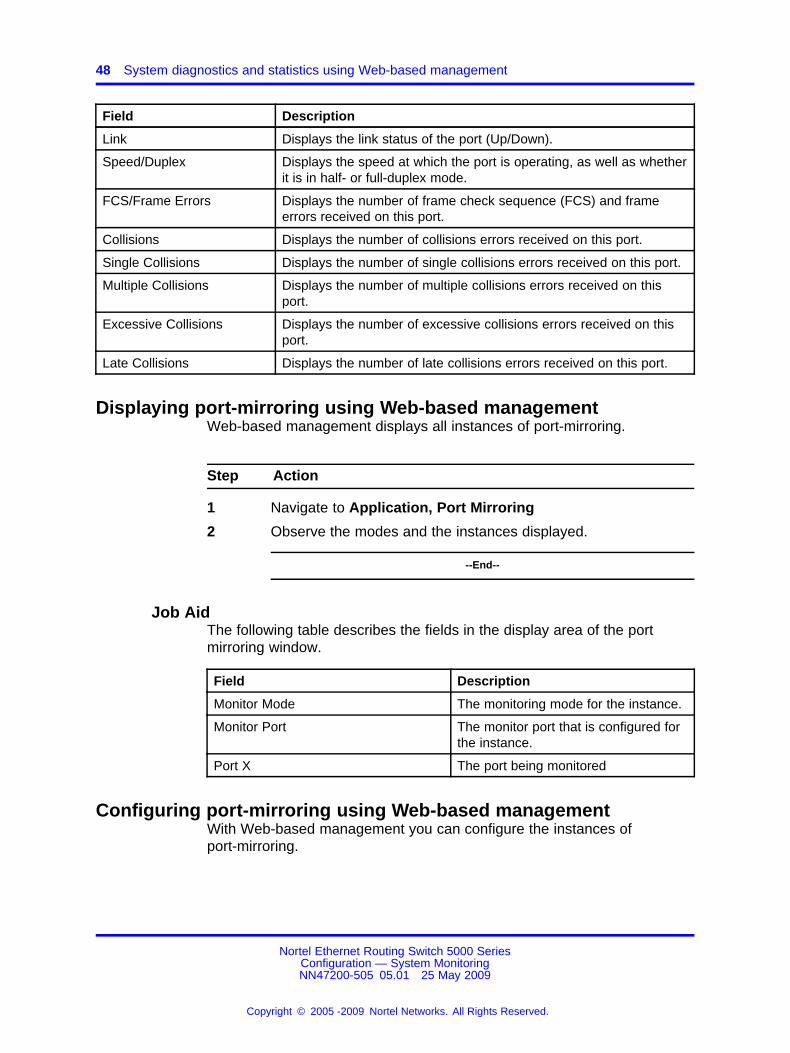
Job AidThe following table describes the fields on the Port Error Summarywindow.
Field Description
Unit Displays the unit number in the stack.
Port Displays the port number of the unit.
Status Displays the status of the port (Enabled/Disabled).
Nortel Ethernet Routing Switch 5000 SeriesConfiguration — System MonitoringNN47200-505 05.01 25 May 2009
Copyright © 2005 -2009 Nortel Networks. All Rights Reserved.
.
48 System diagnostics and statistics using Web-based management
Field Description
Link Displays the link status of the port (Up/Down).
Speed/Duplex Displays the speed at which the port is operating, as well as whetherit is in half- or full-duplex mode.
FCS/Frame Errors Displays the number of frame check sequence (FCS) and frameerrors received on this port.
Collisions Displays the number of collisions errors received on this port.
Single Collisions Displays the number of single collisions errors received on this port.
Multiple Collisions Displays the number of multiple collisions errors received on thisport.
Excessive Collisions Displays the number of excessive collisions errors received on thisport.
Late Collisions Displays the number of late collisions errors received on this port.
Displaying port-mirroring using Web-based managementWeb-based management displays all instances of port-mirroring.
Step Action
1 Navigate to Application, Port Mirroring
2 Observe the modes and the instances displayed.
--End--
Job AidThe following table describes the fields in the display area of the portmirroring window.
Field Description
Monitor Mode The monitoring mode for the instance.
Monitor Port The monitor port that is configured forthe instance.
Port X The port being monitored
Configuring port-mirroring using Web-based managementWith Web-based management you can configure the instances ofport-mirroring.
Nortel Ethernet Routing Switch 5000 SeriesConfiguration — System MonitoringNN47200-505 05.01 25 May 2009
Copyright © 2005 -2009 Nortel Networks. All Rights Reserved.
.
Viewing interface statistics 49
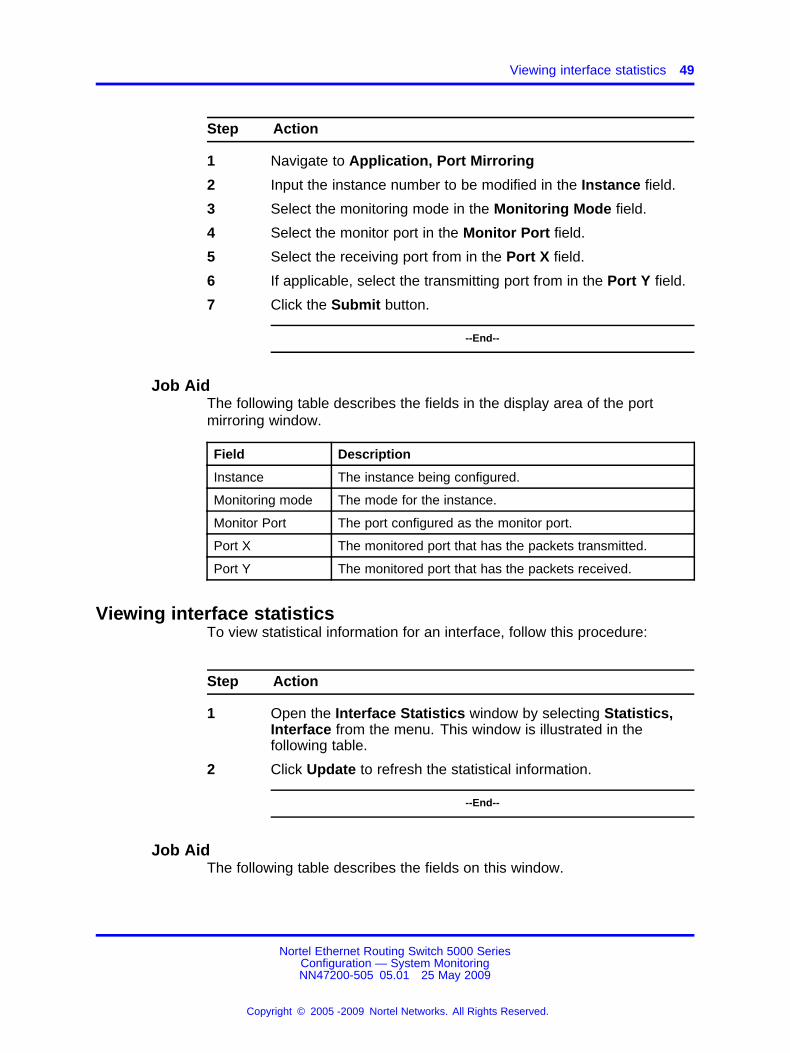
Step Action
1 Navigate to Application, Port Mirroring
2 Input the instance number to be modified in the Instance field.
3 Select the monitoring mode in the Monitoring Mode field.
4 Select the monitor port in the Monitor Port field.
5 Select the receiving port from in the Port X field.
6 If applicable, select the transmitting port from in the Port Y field.
7 Click the Submit button.
--End--
Job AidThe following table describes the fields in the display area of the portmirroring window.
Field Description
Instance The instance being configured.
Monitoring mode The mode for the instance.
Monitor Port The port configured as the monitor port.
Port X The monitored port that has the packets transmitted.
Port Y The monitored port that has the packets received.
Viewing interface statisticsTo view statistical information for an interface, follow this procedure:
Step Action
1 Open the Interface Statistics window by selecting Statistics,Interface from the menu. This window is illustrated in thefollowing table.
2 Click Update to refresh the statistical information.
--End--
Job AidThe following table describes the fields on this window.
Nortel Ethernet Routing Switch 5000 SeriesConfiguration — System MonitoringNN47200-505 05.01 25 May 2009
Copyright © 2005 -2009 Nortel Networks. All Rights Reserved.
.
50 System diagnostics and statistics using Web-based management
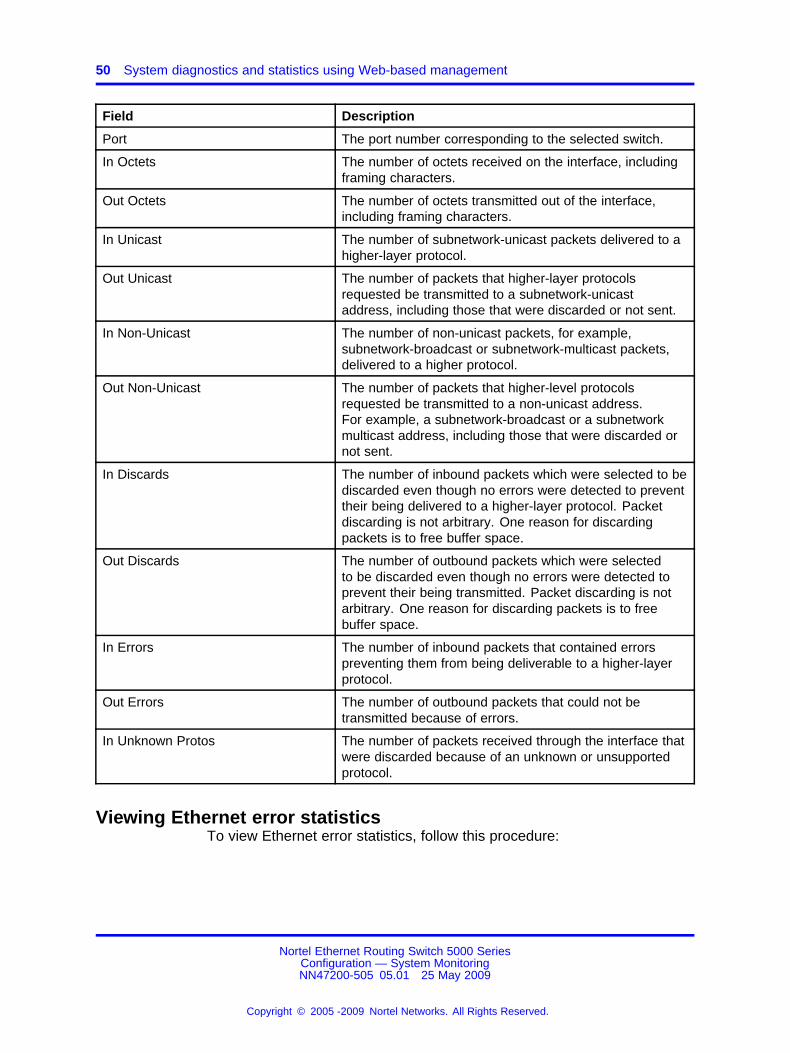
Field Description
Port The port number corresponding to the selected switch.
In Octets The number of octets received on the interface, includingframing characters.
Out Octets The number of octets transmitted out of the interface,including framing characters.
In Unicast The number of subnetwork-unicast packets delivered to ahigher-layer protocol.
Out Unicast The number of packets that higher-layer protocolsrequested be transmitted to a subnetwork-unicastaddress, including those that were discarded or not sent.
In Non-Unicast The number of non-unicast packets, for example,subnetwork-broadcast or subnetwork-multicast packets,delivered to a higher protocol.
Out Non-Unicast The number of packets that higher-level protocolsrequested be transmitted to a non-unicast address.For example, a subnetwork-broadcast or a subnetworkmulticast address, including those that were discarded ornot sent.
In Discards The number of inbound packets which were selected to bediscarded even though no errors were detected to preventtheir being delivered to a higher-layer protocol. Packetdiscarding is not arbitrary. One reason for discardingpackets is to free buffer space.
Out Discards The number of outbound packets which were selectedto be discarded even though no errors were detected toprevent their being transmitted. Packet discarding is notarbitrary. One reason for discarding packets is to freebuffer space.
In Errors The number of inbound packets that contained errorspreventing them from being deliverable to a higher-layerprotocol.
Out Errors The number of outbound packets that could not betransmitted because of errors.
In Unknown Protos The number of packets received through the interface thatwere discarded because of an unknown or unsupportedprotocol.
Viewing Ethernet error statisticsTo view Ethernet error statistics, follow this procedure:
Nortel Ethernet Routing Switch 5000 SeriesConfiguration — System MonitoringNN47200-505 05.01 25 May 2009
Copyright © 2005 -2009 Nortel Networks. All Rights Reserved.
.
Viewing Ethernet error statistics 51
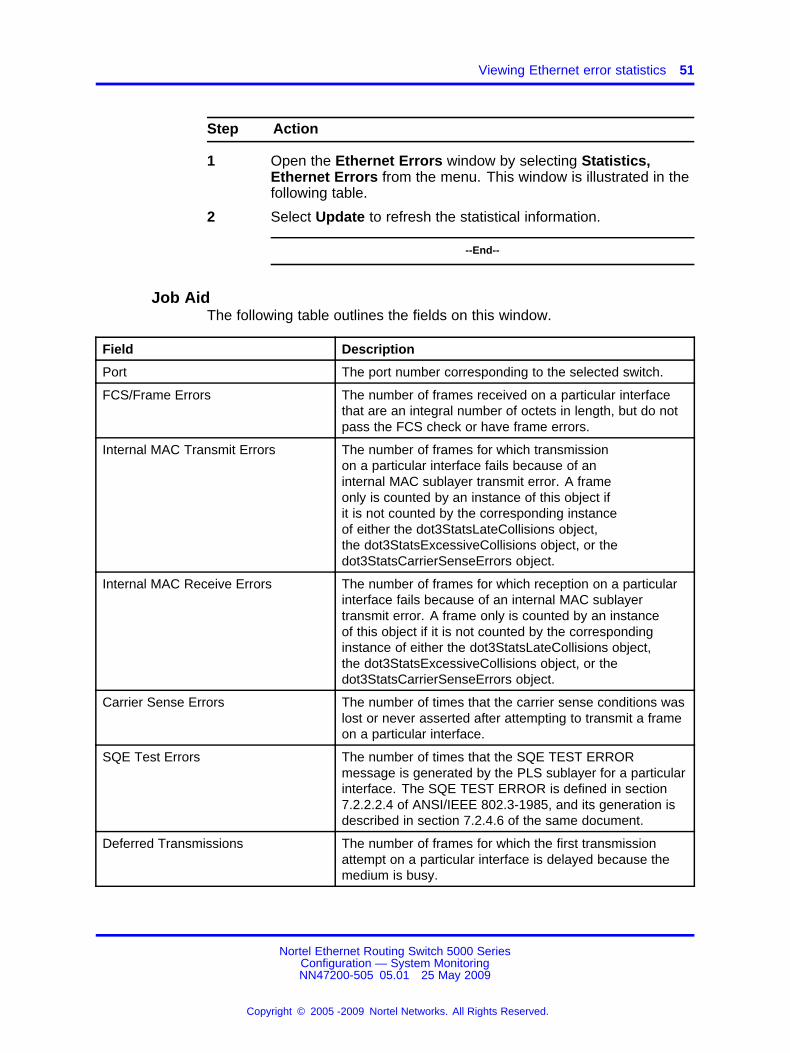
Step Action
1 Open the Ethernet Errors window by selecting Statistics,Ethernet Errors from the menu. This window is illustrated in thefollowing table.
2 Select Update to refresh the statistical information.
--End--
Job AidThe following table outlines the fields on this window.
Field Description
Port The port number corresponding to the selected switch.
FCS/Frame Errors The number of frames received on a particular interfacethat are an integral number of octets in length, but do notpass the FCS check or have frame errors.
Internal MAC Transmit Errors The number of frames for which transmissionon a particular interface fails because of aninternal MAC sublayer transmit error. A frameonly is counted by an instance of this object ifit is not counted by the corresponding instanceof either the dot3StatsLateCollisions object,the dot3StatsExcessiveCollisions object, or thedot3StatsCarrierSenseErrors object.
Internal MAC Receive Errors The number of frames for which reception on a particularinterface fails because of an internal MAC sublayertransmit error. A frame only is counted by an instanceof this object if it is not counted by the correspondinginstance of either the dot3StatsLateCollisions object,the dot3StatsExcessiveCollisions object, or thedot3StatsCarrierSenseErrors object.
Carrier Sense Errors The number of times that the carrier sense conditions waslost or never asserted after attempting to transmit a frameon a particular interface.
SQE Test Errors The number of times that the SQE TEST ERRORmessage is generated by the PLS sublayer for a particularinterface. The SQE TEST ERROR is defined in section7.2.2.2.4 of ANSI/IEEE 802.3-1985, and its generation isdescribed in section 7.2.4.6 of the same document.
Deferred Transmissions The number of frames for which the first transmissionattempt on a particular interface is delayed because themedium is busy.
Nortel Ethernet Routing Switch 5000 SeriesConfiguration — System MonitoringNN47200-505 05.01 25 May 2009
Copyright © 2005 -2009 Nortel Networks. All Rights Reserved.
.

52 System diagnostics and statistics using Web-based management
Field Description
Single Collision Frames The number of successfully transmitted frames on aparticular interface for which transmission is inhibited bymore than one collision.
Multiple Collision Frames The number of successfully transmitted frames on aparticular interface for which transmission is inhibited by asingle collision.
Late Collisions The number of times a collision is detected on a particularinterface later than 512 bit-times into the transmission ofa packet.
Excessive Collisions The number of frames for which transmission on aparticular interface fails due to excessive collisions.
Viewing transparent bridging statisticsTo view transparent bridging statistics, follow this procedure:
Step Action
1 Open the Transparent Bridging window by selecting Statistics,Transparent Bridging from the menu.
2 Click Update to refresh the statistical information.
--End--
Job AidThe following table describes the fields on the Transparent Bridgingwindow.
Field Description
Port The port number that corresponds to the selected switch.
In Frames(dot1dTpPortInFrames)
The number of frames that have been received by thisport from its segment. A frame received on the interfacecorresponding to this port is counted only if it is for aprotocol being processed by the local bridging function,including bridge management errors.
Out Frames(dot1dTpPortOutFrames)
The number of frames that have been transmitted by thisport from its segment. A frame received on the interfacecorresponding to this port is counted only if it is for aprotocol being processed by the local bridging function,including bridge management errors.
In Discards(dot1dTpPortInDiscards)
The number of valid frames received which werediscarded by the forwarding process.
Nortel Ethernet Routing Switch 5000 SeriesConfiguration — System MonitoringNN47200-505 05.01 25 May 2009
Copyright © 2005 -2009 Nortel Networks. All Rights Reserved.
.
Viewing stack health 53
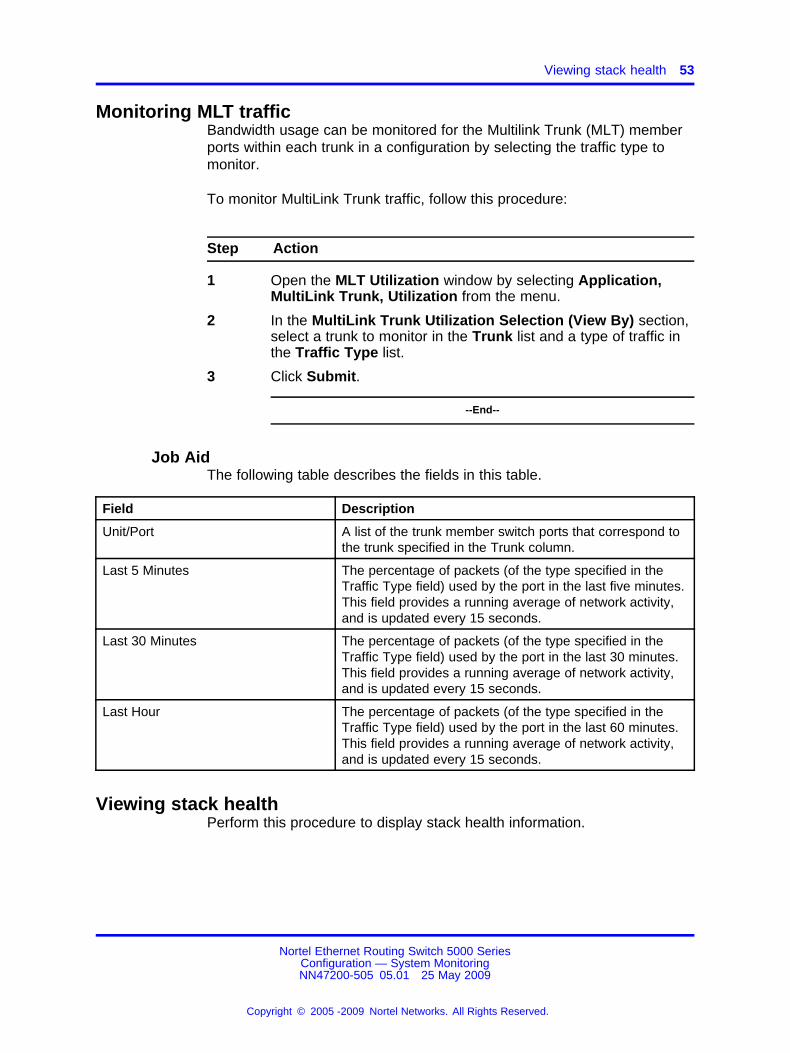
Monitoring MLT trafficBandwidth usage can be monitored for the Multilink Trunk (MLT) memberports within each trunk in a configuration by selecting the traffic type tomonitor.
To monitor MultiLink Trunk traffic, follow this procedure:
Step Action
1 Open the MLT Utilization window by selecting Application,MultiLink Trunk, Utilization from the menu.
2 In the MultiLink Trunk Utilization Selection (View By) section,select a trunk to monitor in the Trunk list and a type of traffic inthe Traffic Type list.
3 Click Submit.
--End--
Job AidThe following table describes the fields in this table.
Field Description
Unit/Port A list of the trunk member switch ports that correspond tothe trunk specified in the Trunk column.
Last 5 Minutes The percentage of packets (of the type specified in theTraffic Type field) used by the port in the last five minutes.This field provides a running average of network activity,and is updated every 15 seconds.
Last 30 Minutes The percentage of packets (of the type specified in theTraffic Type field) used by the port in the last 30 minutes.This field provides a running average of network activity,and is updated every 15 seconds.
Last Hour The percentage of packets (of the type specified in theTraffic Type field) used by the port in the last 60 minutes.This field provides a running average of network activity,and is updated every 15 seconds.
Viewing stack healthPerform this procedure to display stack health information.
Nortel Ethernet Routing Switch 5000 SeriesConfiguration — System MonitoringNN47200-505 05.01 25 May 2009
Copyright © 2005 -2009 Nortel Networks. All Rights Reserved.
.
54 System diagnostics and statistics using Web-based management
Procedure steps
Step Action
1 Navigate to Summary, Stack Health.
2 The browser displays the stack health information.
--End--
Job aidPerform this procedure to ensure that the stack has the correct number ofswitching units and that it is running in a resilient mode. If the stack is notrunning in a resilient mode, perform this procedure to identify damaged ormissing cables, and to repair faulty stacks.
Procedure steps
Step Action
1 Display the stack health status from Web-based management.
2 If the number of units is the same as expected, and the stack isresilient, this procedure is complete.
3 If the number of units is the same as expected, but the stack isnot resilient, add or replace the identified cables and repeat theentire procedure.
4 If the number of units is not the same as expected, ensureall switching units are present and running and that they areproperly connected.
5 If all units are operational, but the number of units is not properlyshown, remove or replace the units that do not appear.
--End--
Nortel Ethernet Routing Switch 5000 SeriesConfiguration — System MonitoringNN47200-505 05.01 25 May 2009
Copyright © 2005 -2009 Nortel Networks. All Rights Reserved.
.
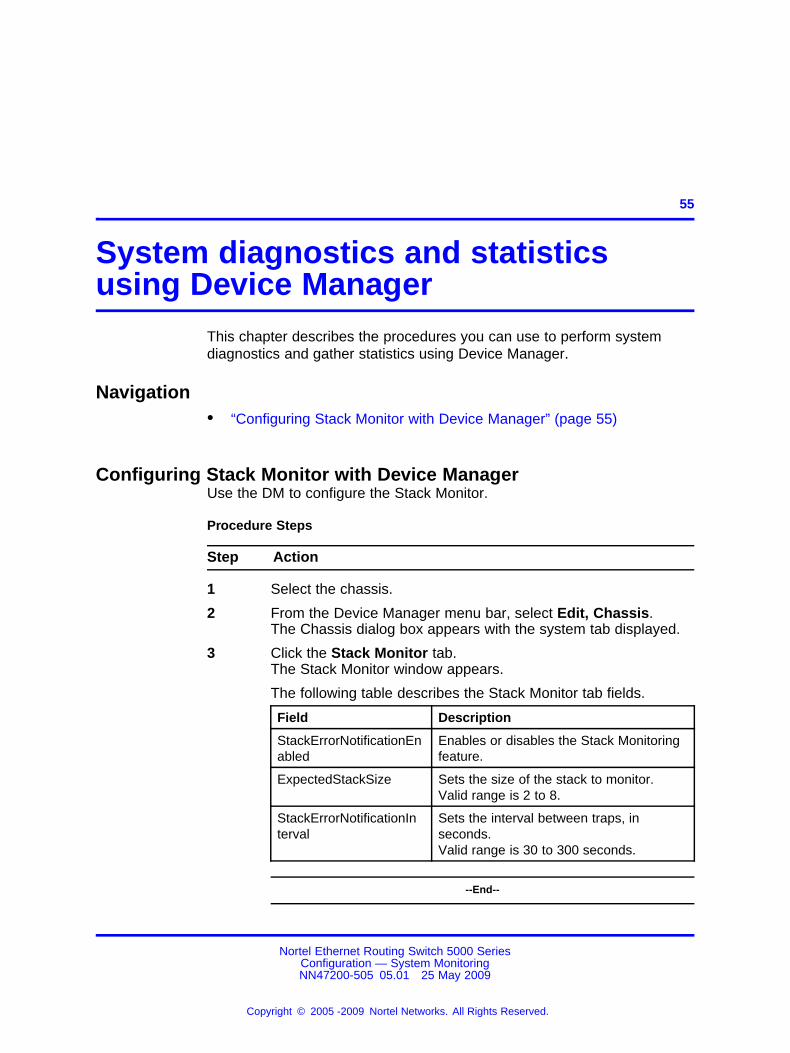
55.
System diagnostics and statisticsusing Device Manager
This chapter describes the procedures you can use to perform systemdiagnostics and gather statistics using Device Manager.
Navigation• “Configuring Stack Monitor with Device Manager” (page 55)
Configuring Stack Monitor with Device ManagerUse the DM to configure the Stack Monitor.
Procedure Steps
Step Action
1 Select the chassis.
2 From the Device Manager menu bar, select Edit, Chassis.The Chassis dialog box appears with the system tab displayed.
3 Click the Stack Monitor tab.The Stack Monitor window appears.
The following table describes the Stack Monitor tab fields.
Field Description
StackErrorNotificationEnabled
Enables or disables the Stack Monitoringfeature.
ExpectedStackSize Sets the size of the stack to monitor.Valid range is 2 to 8.
StackErrorNotificationInterval
Sets the interval between traps, inseconds.Valid range is 30 to 300 seconds.
--End--
Nortel Ethernet Routing Switch 5000 SeriesConfiguration — System MonitoringNN47200-505 05.01 25 May 2009
Copyright © 2005 -2009 Nortel Networks. All Rights Reserved.
.

56 System diagnostics and statistics using Device Manager
Nortel Ethernet Routing Switch 5000 SeriesConfiguration — System MonitoringNN47200-505 05.01 25 May 2009
Copyright © 2005 -2009 Nortel Networks. All Rights Reserved.
.
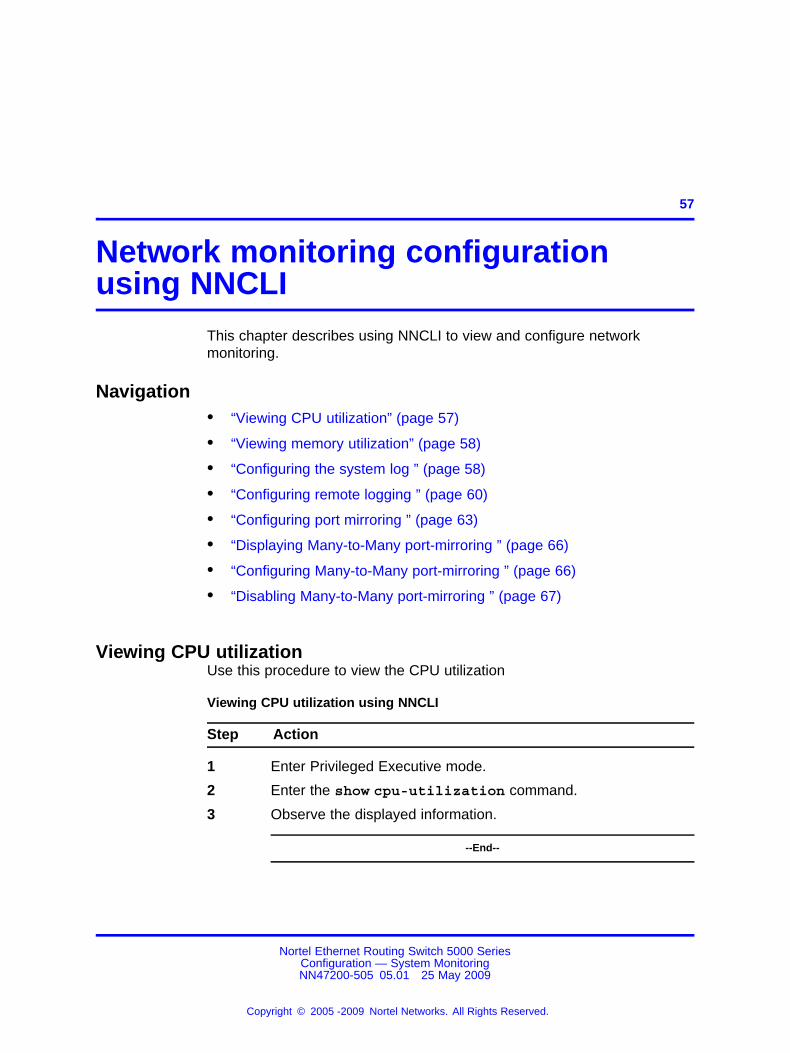
57.
Network monitoring configurationusing NNCLI
This chapter describes using NNCLI to view and configure networkmonitoring.
Navigation• “Viewing CPU utilization” (page 57)
• “Viewing memory utilization” (page 58)
• “Configuring the system log ” (page 58)
• “Configuring remote logging ” (page 60)
• “Configuring port mirroring ” (page 63)
• “Displaying Many-to-Many port-mirroring ” (page 66)
• “Configuring Many-to-Many port-mirroring ” (page 66)
• “Disabling Many-to-Many port-mirroring ” (page 67)
Viewing CPU utilizationUse this procedure to view the CPU utilization
Viewing CPU utilization using NNCLI
Step Action
1 Enter Privileged Executive mode.
2 Enter the show cpu-utilization command.
3 Observe the displayed information.
--End--
Nortel Ethernet Routing Switch 5000 SeriesConfiguration — System MonitoringNN47200-505 05.01 25 May 2009
Copyright © 2005 -2009 Nortel Networks. All Rights Reserved.
.
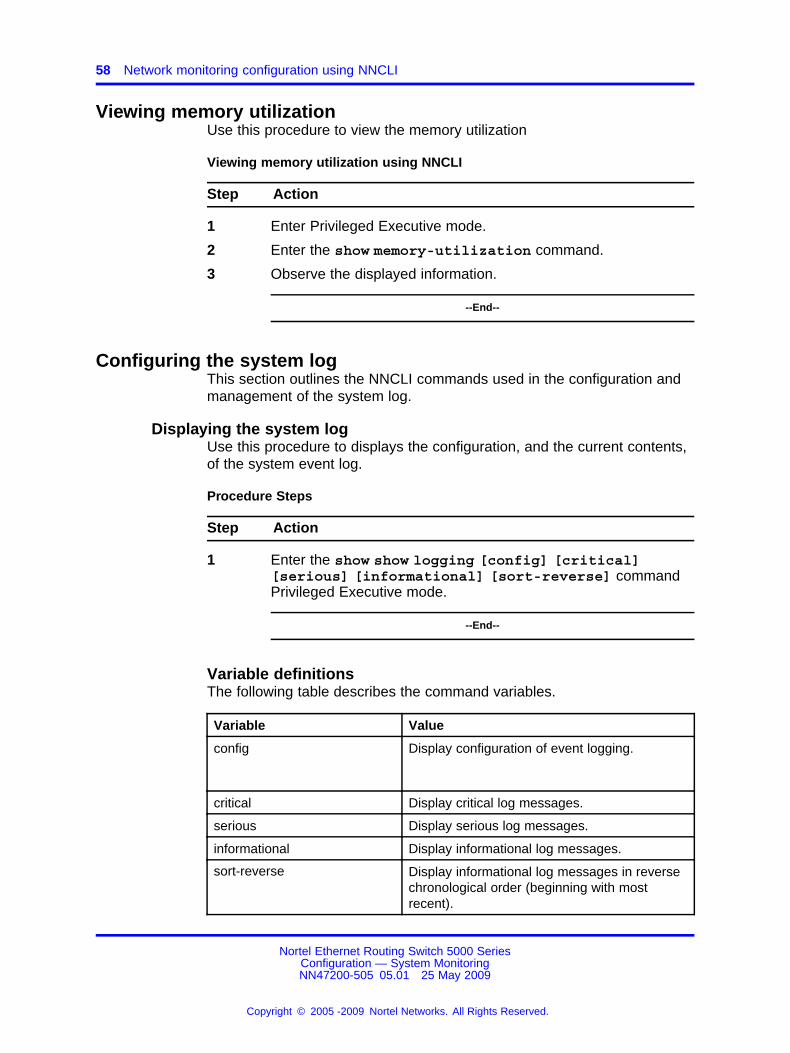
58 Network monitoring configuration using NNCLI
Viewing memory utilizationUse this procedure to view the memory utilization
Viewing memory utilization using NNCLI
Step Action
1 Enter Privileged Executive mode.
2 Enter the show memory-utilization command.
3 Observe the displayed information.
--End--
Configuring the system logThis section outlines the NNCLI commands used in the configuration andmanagement of the system log.
Displaying the system logUse this procedure to displays the configuration, and the current contents,of the system event log.
Procedure Steps
Step Action
1 Enter the show show logging [config] [critical][serious] [informational] [sort-reverse] commandPrivileged Executive mode.
--End--
Variable definitionsThe following table describes the command variables.
Variable Value
config Display configuration of event logging.
critical Display critical log messages.
serious Display serious log messages.
informational Display informational log messages.
sort-reverse Display informational log messages in reversechronological order (beginning with mostrecent).
Nortel Ethernet Routing Switch 5000 SeriesConfiguration — System MonitoringNN47200-505 05.01 25 May 2009
Copyright © 2005 -2009 Nortel Networks. All Rights Reserved.
.

Configuring the system log 59
Configuring the system logUse this procedure to configure the system settings for the system eventlog.
Procedure Steps
Step Action
1 Enter the logging [enable | disable] [level critical |serious | informational | none] [nv-level critical| serious | none] command Privileged Executive mode.
--End--
Variable definitionsThe following table describes the command variables.
Variable Value
enable | disable Enables or disables the event log (default isEnabled).
level critical | serious |informational | none
Specifies the level of logging stored in DRAM.
nv-level critical | serious |none
Specifies the level of logging stored inNVRAM.
Disabling the system logUse this procedure to disable the system event log.
Procedure Steps
Step Action
1 Enter the no logging command in global configuration mode.
--End--
Setting the system log to defaultUse this procedure to default the system event log configuration.
Nortel Ethernet Routing Switch 5000 SeriesConfiguration — System MonitoringNN47200-505 05.01 25 May 2009
Copyright © 2005 -2009 Nortel Networks. All Rights Reserved.
.
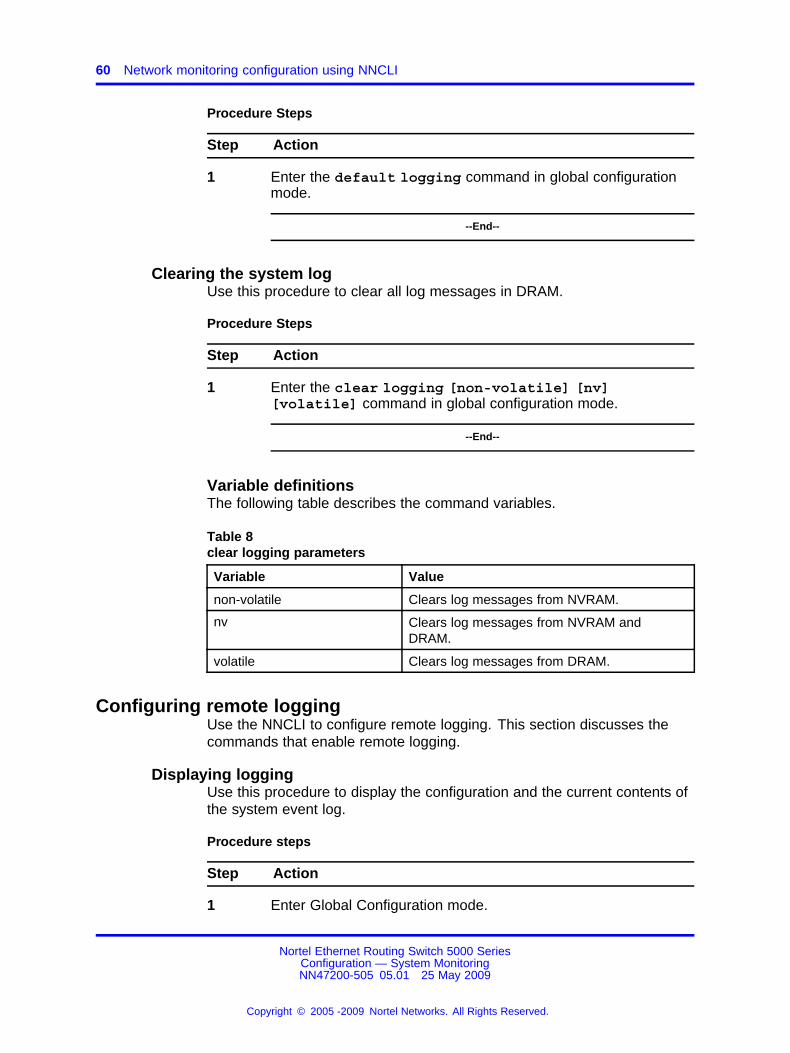
60 Network monitoring configuration using NNCLI
Procedure Steps
Step Action
1 Enter the default logging command in global configurationmode.
--End--
Clearing the system logUse this procedure to clear all log messages in DRAM.
Procedure Steps
Step Action
1 Enter the clear logging [non-volatile] [nv][volatile] command in global configuration mode.
--End--
Variable definitionsThe following table describes the command variables.
Table 8clear logging parameters
Variable Value
non-volatile Clears log messages from NVRAM.
nv Clears log messages from NVRAM andDRAM.
volatile Clears log messages from DRAM.
Configuring remote loggingUse the NNCLI to configure remote logging. This section discusses thecommands that enable remote logging.
Displaying loggingUse this procedure to display the configuration and the current contents ofthe system event log.
Procedure steps
Step Action
1 Enter Global Configuration mode.
Nortel Ethernet Routing Switch 5000 SeriesConfiguration — System MonitoringNN47200-505 05.01 25 May 2009
Copyright © 2005 -2009 Nortel Networks. All Rights Reserved.
.
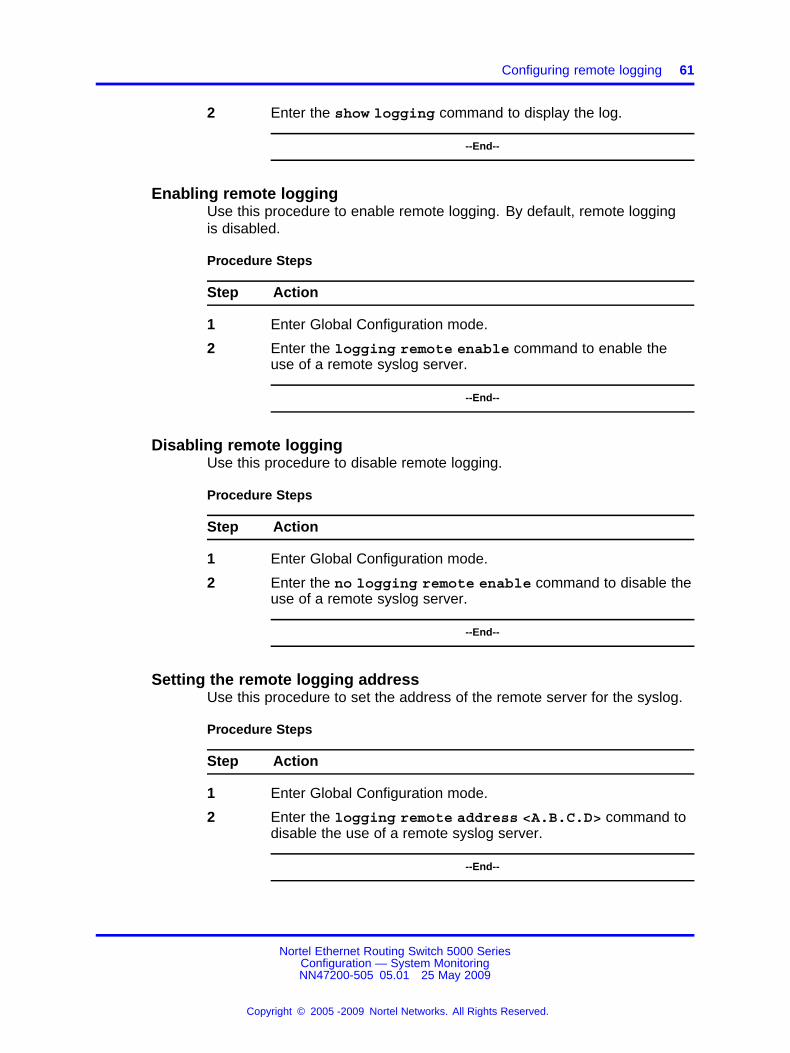
Configuring remote logging 61
2 Enter the show logging command to display the log.
--End--
Enabling remote loggingUse this procedure to enable remote logging. By default, remote loggingis disabled.
Procedure Steps
Step Action
1 Enter Global Configuration mode.
2 Enter the logging remote enable command to enable theuse of a remote syslog server.
--End--
Disabling remote loggingUse this procedure to disable remote logging.
Procedure Steps
Step Action
1 Enter Global Configuration mode.
2 Enter the no logging remote enable command to disable theuse of a remote syslog server.
--End--
Setting the remote logging addressUse this procedure to set the address of the remote server for the syslog.
Procedure Steps
Step Action
1 Enter Global Configuration mode.
2 Enter the logging remote address <A.B.C.D> command todisable the use of a remote syslog server.
--End--
Nortel Ethernet Routing Switch 5000 SeriesConfiguration — System MonitoringNN47200-505 05.01 25 May 2009
Copyright © 2005 -2009 Nortel Networks. All Rights Reserved.
.
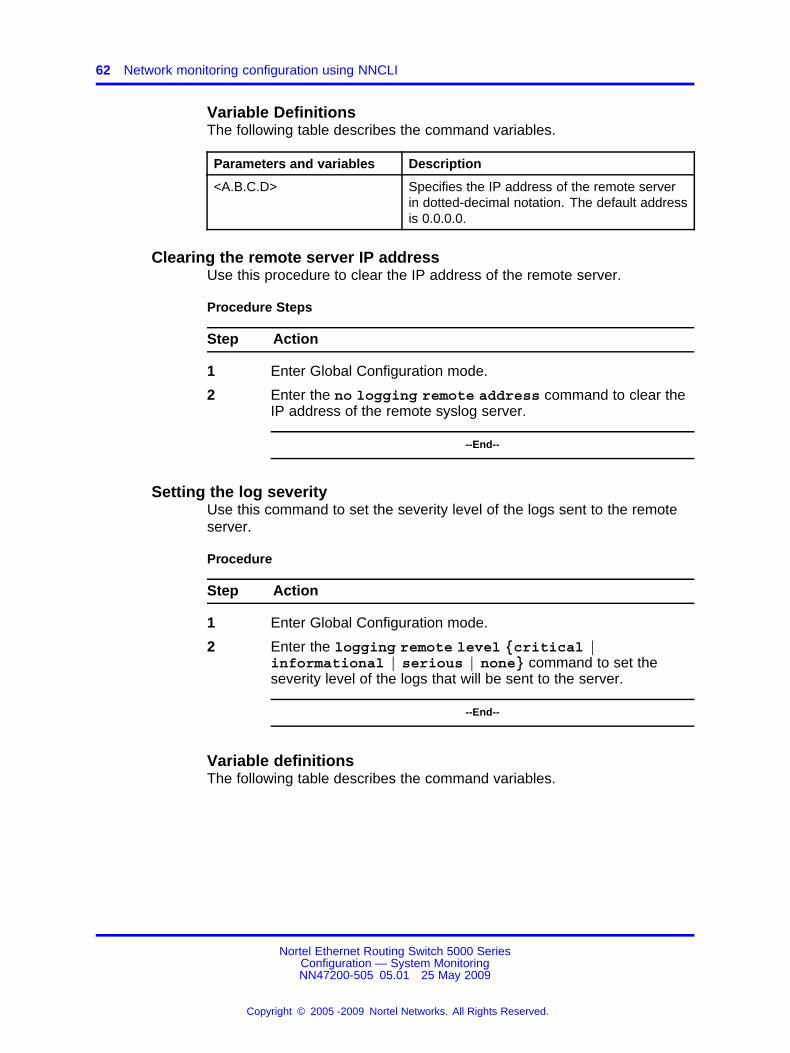
62 Network monitoring configuration using NNCLI
Variable DefinitionsThe following table describes the command variables.
Parameters and variables Description
<A.B.C.D> Specifies the IP address of the remote serverin dotted-decimal notation. The default addressis 0.0.0.0.
Clearing the remote server IP addressUse this procedure to clear the IP address of the remote server.
Procedure Steps
Step Action
1 Enter Global Configuration mode.
2 Enter the no logging remote address command to clear theIP address of the remote syslog server.
--End--
Setting the log severityUse this command to set the severity level of the logs sent to the remoteserver.
Procedure
Step Action
1 Enter Global Configuration mode.
2 Enter the logging remote level {critical |informational | serious | none} command to set theseverity level of the logs that will be sent to the server.
--End--
Variable definitionsThe following table describes the command variables.
Nortel Ethernet Routing Switch 5000 SeriesConfiguration — System MonitoringNN47200-505 05.01 25 May 2009
Copyright © 2005 -2009 Nortel Networks. All Rights Reserved.
.
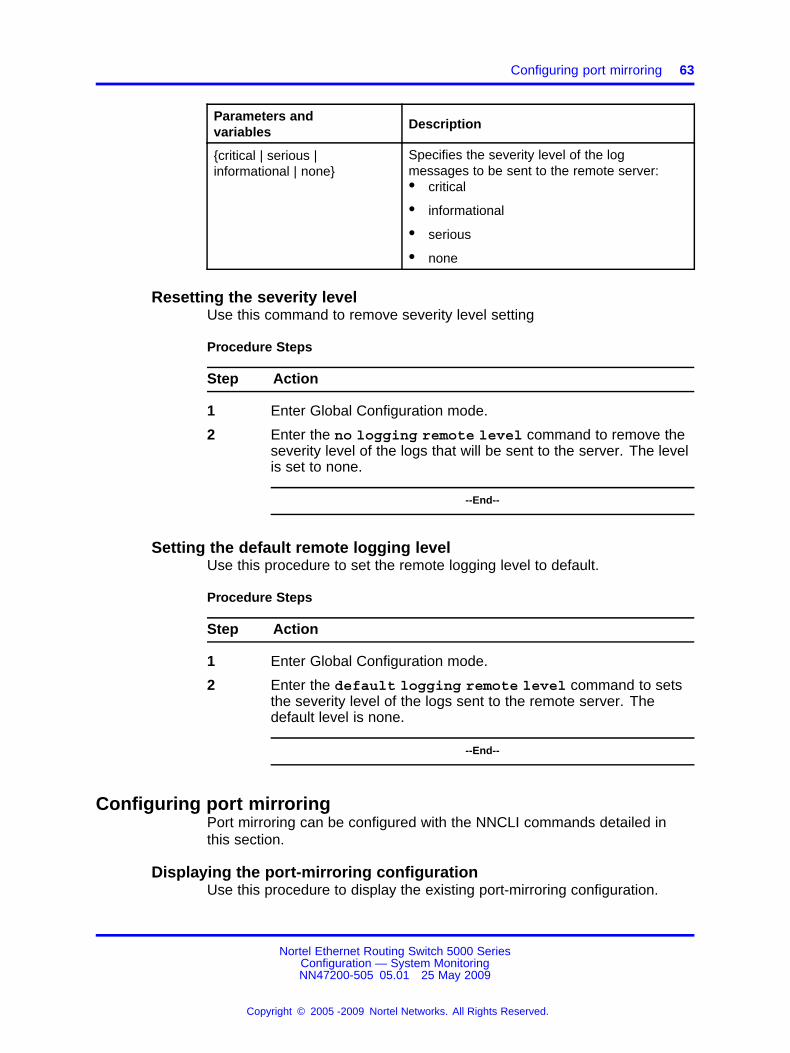
Configuring port mirroring 63
Parameters andvariables
Description
{critical | serious |informational | none}
Specifies the severity level of the logmessages to be sent to the remote server:• critical
• informational
• serious
• none
Resetting the severity levelUse this command to remove severity level setting
Procedure Steps
Step Action
1 Enter Global Configuration mode.
2 Enter the no logging remote level command to remove theseverity level of the logs that will be sent to the server. The levelis set to none.
--End--
Setting the default remote logging levelUse this procedure to set the remote logging level to default.
Procedure Steps
Step Action
1 Enter Global Configuration mode.
2 Enter the default logging remote level command to setsthe severity level of the logs sent to the remote server. Thedefault level is none.
--End--
Configuring port mirroringPort mirroring can be configured with the NNCLI commands detailed inthis section.
Displaying the port-mirroring configurationUse this procedure to display the existing port-mirroring configuration.
Nortel Ethernet Routing Switch 5000 SeriesConfiguration — System MonitoringNN47200-505 05.01 25 May 2009
Copyright © 2005 -2009 Nortel Networks. All Rights Reserved.
.
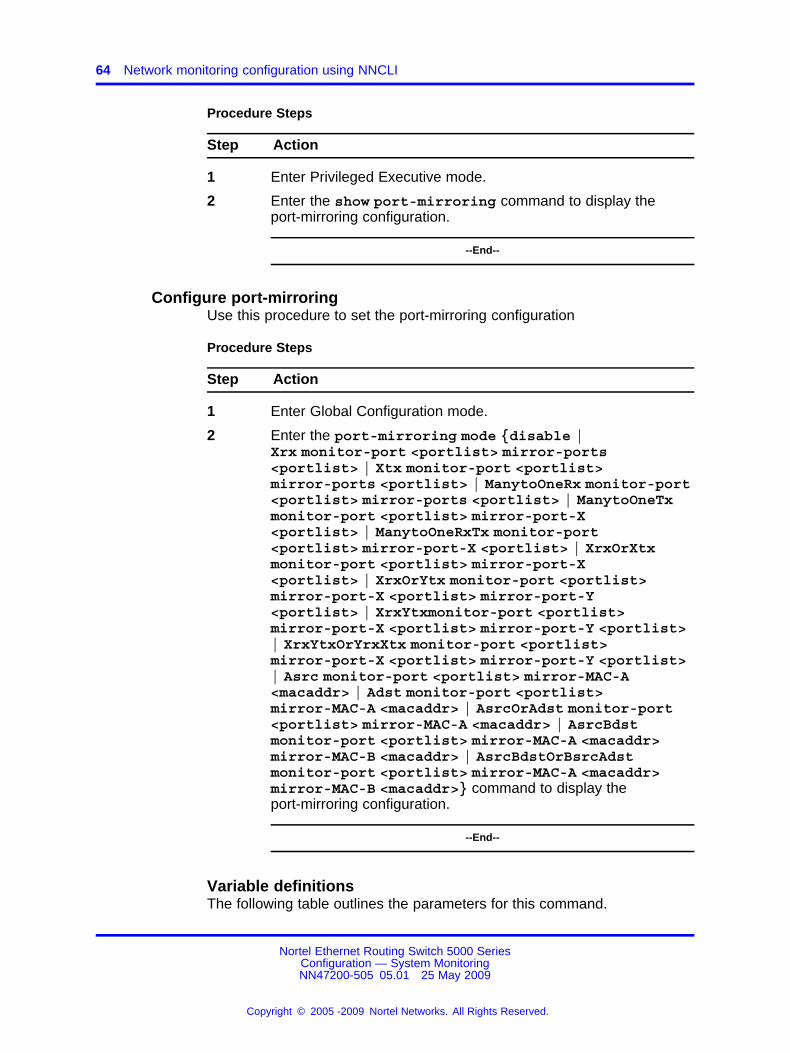
64 Network monitoring configuration using NNCLI
Procedure Steps
Step Action
1 Enter Privileged Executive mode.
2 Enter the show port-mirroring command to display theport-mirroring configuration.
--End--
Configure port-mirroringUse this procedure to set the port-mirroring configuration
Procedure Steps
Step Action
1 Enter Global Configuration mode.
2 Enter the port-mirroring mode {disable |Xrx monitor-port <portlist> mirror-ports<portlist> | Xtx monitor-port <portlist>mirror-ports <portlist> | ManytoOneRx monitor-port<portlist> mirror-ports <portlist> | ManytoOneTxmonitor-port <portlist> mirror-port-X<portlist> | ManytoOneRxTx monitor-port<portlist> mirror-port-X <portlist> | XrxOrXtxmonitor-port <portlist> mirror-port-X<portlist> | XrxOrYtx monitor-port <portlist>mirror-port-X <portlist> mirror-port-Y<portlist> | XrxYtxmonitor-port <portlist>mirror-port-X <portlist> mirror-port-Y <portlist>| XrxYtxOrYrxXtx monitor-port <portlist>mirror-port-X <portlist> mirror-port-Y <portlist>| Asrc monitor-port <portlist> mirror-MAC-A<macaddr> | Adst monitor-port <portlist>mirror-MAC-A <macaddr> | AsrcOrAdst monitor-port<portlist> mirror-MAC-A <macaddr> | AsrcBdstmonitor-port <portlist> mirror-MAC-A <macaddr>mirror-MAC-B <macaddr> | AsrcBdstOrBsrcAdstmonitor-port <portlist> mirror-MAC-A <macaddr>mirror-MAC-B <macaddr>} command to display theport-mirroring configuration.
--End--
Variable definitionsThe following table outlines the parameters for this command.
Nortel Ethernet Routing Switch 5000 SeriesConfiguration — System MonitoringNN47200-505 05.01 25 May 2009
Copyright © 2005 -2009 Nortel Networks. All Rights Reserved.
.
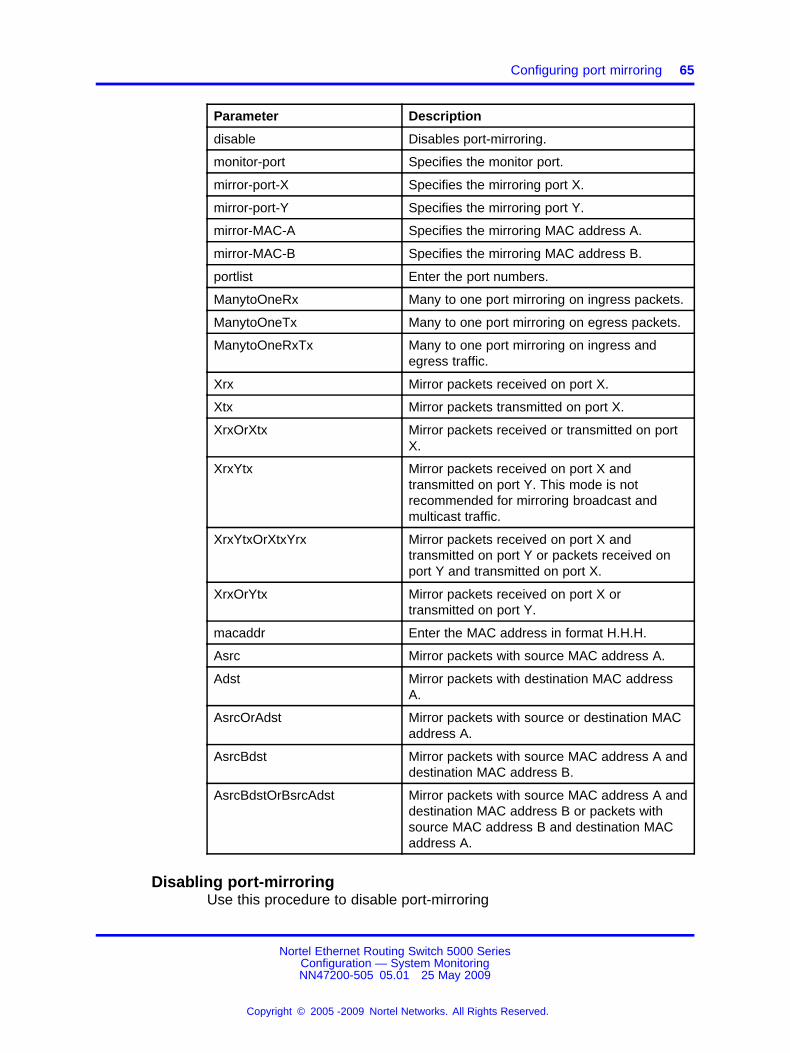
Configuring port mirroring 65
Parameter Description
disable Disables port-mirroring.
monitor-port Specifies the monitor port.
mirror-port-X Specifies the mirroring port X.
mirror-port-Y Specifies the mirroring port Y.
mirror-MAC-A Specifies the mirroring MAC address A.
mirror-MAC-B Specifies the mirroring MAC address B.
portlist Enter the port numbers.
ManytoOneRx Many to one port mirroring on ingress packets.
ManytoOneTx Many to one port mirroring on egress packets.
ManytoOneRxTx Many to one port mirroring on ingress andegress traffic.
Xrx Mirror packets received on port X.
Xtx Mirror packets transmitted on port X.
XrxOrXtx Mirror packets received or transmitted on portX.
XrxYtx Mirror packets received on port X andtransmitted on port Y. This mode is notrecommended for mirroring broadcast andmulticast traffic.
XrxYtxOrXtxYrx Mirror packets received on port X andtransmitted on port Y or packets received onport Y and transmitted on port X.
XrxOrYtx Mirror packets received on port X ortransmitted on port Y.
macaddr Enter the MAC address in format H.H.H.
Asrc Mirror packets with source MAC address A.
Adst Mirror packets with destination MAC addressA.
AsrcOrAdst Mirror packets with source or destination MACaddress A.
AsrcBdst Mirror packets with source MAC address A anddestination MAC address B.
AsrcBdstOrBsrcAdst Mirror packets with source MAC address A anddestination MAC address B or packets withsource MAC address B and destination MACaddress A.
Disabling port-mirroringUse this procedure to disable port-mirroring
Nortel Ethernet Routing Switch 5000 SeriesConfiguration — System MonitoringNN47200-505 05.01 25 May 2009
Copyright © 2005 -2009 Nortel Networks. All Rights Reserved.
.

66 Network monitoring configuration using NNCLI
Procedure Steps
Step Action
1 Enter Global Configuration mode
2 Enter the no port-mirroring command to disableport-mirroring.
--End--
Displaying Many-to-Many port-mirroringUse this procedure to display Many-to-Many port-mirroring settings
Procedure Steps
Step Action
1 Enter Privileged Executive mode
2 Enter the show port-mirroring command.
3 Observe the displayed information.
--End--
Configuring Many-to-Many port-mirroringUse this procedure to configure Many-to-Many port-mirroring
Procedure Steps
Step Action
1 Enter Global Configuration mode
2 Enter the port-mirroring <1-4> mode {disable | Adst |Asrc | AsrcBdst | AsrcBdstOrBsrcAdst | AsrcOrAdst |ManyToOneRx | ManyToOneRxTx | ManyToOneTx | Xrx |XrxOrXtx | XrxOrYtx | XrxYtx | XrxYtxOrYrxXtx | Xtx}command.
3 Enter the command from step 2 for up to four instances.
--End--
Variable definitionsThe following table describes the command variables
Nortel Ethernet Routing Switch 5000 SeriesConfiguration — System MonitoringNN47200-505 05.01 25 May 2009
Copyright © 2005 -2009 Nortel Networks. All Rights Reserved.
.

Disabling Many-to-Many port-mirroring 67
Variable Value
disable Disable mirroring.
Adst Mirror packets with destination MACaddress A
Asrc Mirror packets with source MACaddress A.
AsrcBdst Mirror packets with source MACaddress A and destination MACaddress B.
AsrcBdstOrBsrcAdst Mirror packets with source MACaddress A and destination MACaddress B or packets with sourceMAC address B and destination MACaddress A.
AsrcOrAdst Mirror packets with source ordestination MAC address A.
ManyToOneRx Mirror many to one port mirroring oningress packets.
ManyToOneRxTx Mirror many to one port mirroring oningress and egress packets.
ManyToOneTx Mirror many to one port mirroring onegress packets.
Xrx Mirror packets received on port X.
XrxOrXtx Mirror packets received on port X andtransmitted on port Y.
XrxYtx Mirror packets received on port X andtransmitted on port Y.
XrxYtxOrYrxXtx Mirror packets received on port Xand transmitted on port Y or packetsreceived on port Y and transmitted onport X.
Xtx Mirror packets received on port X ortransmitted on port Y
Disabling Many-to-Many port-mirroringProcedure Steps
Step Action
1 Enter Global Configuration mode
2 Enter the port-mirroring [<1-4>] mode disable or noport-mirroring [<1-4>] command to disable a specificinstance.
Nortel Ethernet Routing Switch 5000 SeriesConfiguration — System MonitoringNN47200-505 05.01 25 May 2009
Copyright © 2005 -2009 Nortel Networks. All Rights Reserved.
.
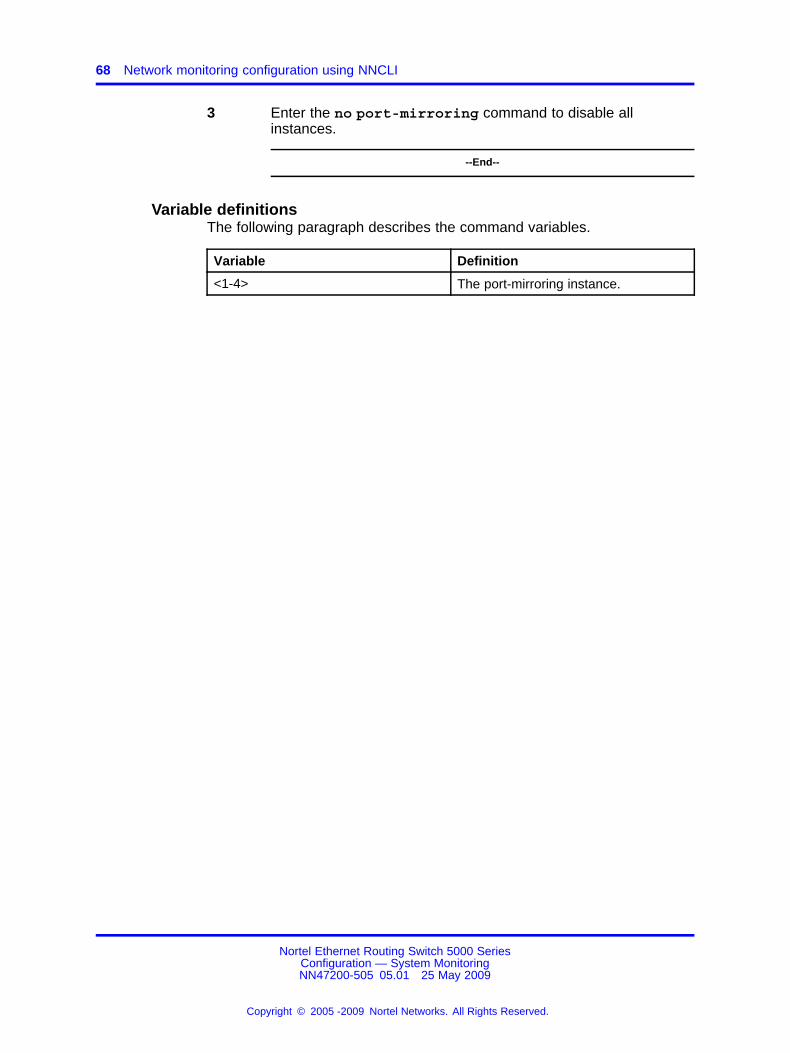
68 Network monitoring configuration using NNCLI
3 Enter the no port-mirroring command to disable allinstances.
--End--
Variable definitionsThe following paragraph describes the command variables.
Variable Definition
<1-4> The port-mirroring instance.
Nortel Ethernet Routing Switch 5000 SeriesConfiguration — System MonitoringNN47200-505 05.01 25 May 2009
Copyright © 2005 -2009 Nortel Networks. All Rights Reserved.
.

69.
Network monitoring configurationusing Device Manager
CPU and memory utilizationUse this procedure to view both CPU and memory utilization.
Step Action
1 Navigate to Edit, Chassis
2 Select the CPU/Mem Utilization tab
3 Click the Refresh button to update the data.
--End--
Job AidThe following table describes the fields on the CPU/Mem Utilization tab.
Field Description
Unit The numerical representation of theunit.
Last10Seconds CPU usage, in percentage, for the last10 seconds.
Last1Minute CPU usage, in percentage, for the lastminute.
Last10Minutes CPU usage, in percentage, for the last10 minutes.
Last1Hour CPU usage, in percentage, for the lasthour.
Last24Hours CPU usage, in percentage, for the last24 hours.
TotalCPUUsage Memory usage in megabytes.
Nortel Ethernet Routing Switch 5000 SeriesConfiguration — System MonitoringNN47200-505 05.01 25 May 2009
Copyright © 2005 -2009 Nortel Networks. All Rights Reserved.
.
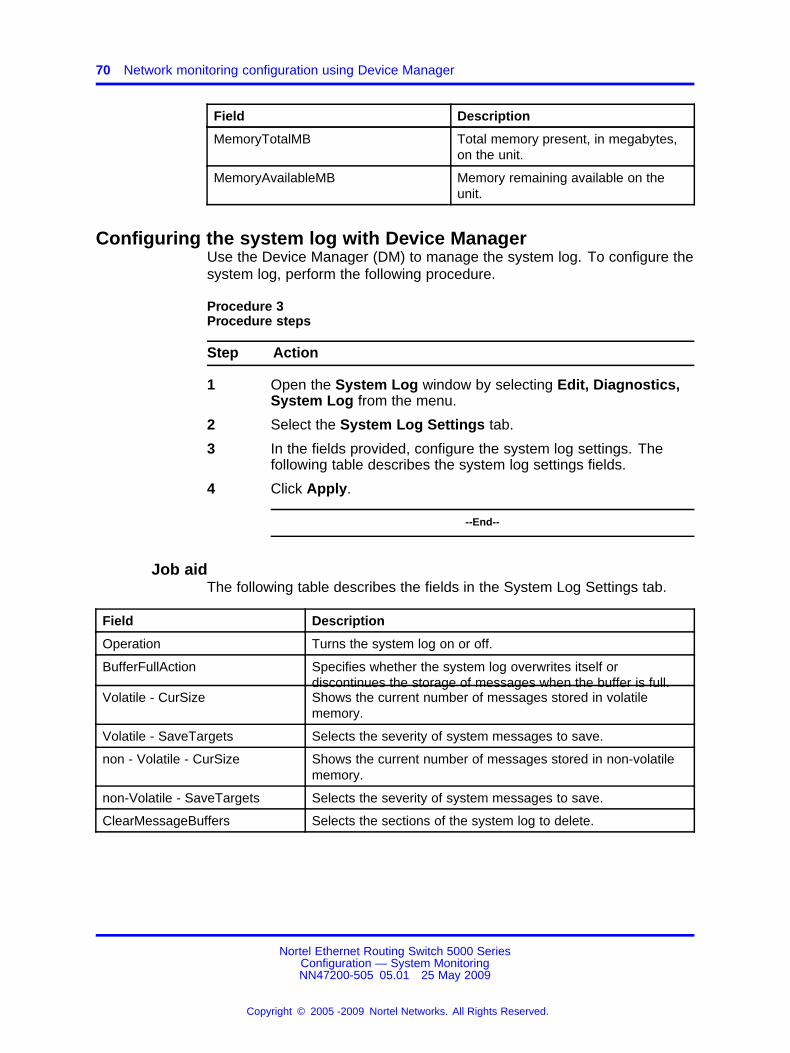
70 Network monitoring configuration using Device Manager
Field Description
MemoryTotalMB Total memory present, in megabytes,on the unit.
MemoryAvailableMB Memory remaining available on theunit.
Configuring the system log with Device ManagerUse the Device Manager (DM) to manage the system log. To configure thesystem log, perform the following procedure.
Procedure 3Procedure steps
Step Action
1 Open the System Log window by selecting Edit, Diagnostics,System Log from the menu.
2 Select the System Log Settings tab.
3 In the fields provided, configure the system log settings. Thefollowing table describes the system log settings fields.
4 Click Apply.
--End--
Job aidThe following table describes the fields in the System Log Settings tab.
Field Description
Operation Turns the system log on or off.
BufferFullAction Specifies whether the system log overwrites itself ordiscontinues the storage of messages when the buffer is full.
Volatile - CurSize Shows the current number of messages stored in volatilememory.
Volatile - SaveTargets Selects the severity of system messages to save.
non - Volatile - CurSize Shows the current number of messages stored in non-volatilememory.
non-Volatile - SaveTargets Selects the severity of system messages to save.
ClearMessageBuffers Selects the sections of the system log to delete.
Nortel Ethernet Routing Switch 5000 SeriesConfiguration — System MonitoringNN47200-505 05.01 25 May 2009
Copyright © 2005 -2009 Nortel Networks. All Rights Reserved.
.
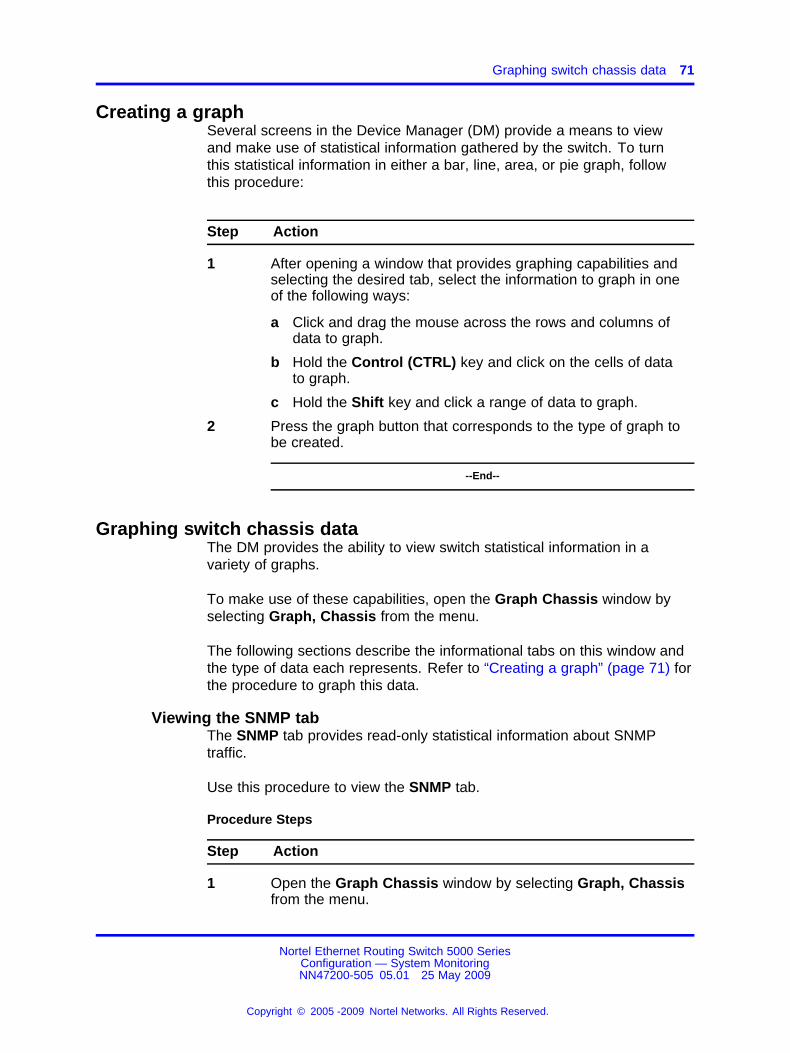
Graphing switch chassis data 71
Creating a graphSeveral screens in the Device Manager (DM) provide a means to viewand make use of statistical information gathered by the switch. To turnthis statistical information in either a bar, line, area, or pie graph, followthis procedure:
Step Action
1 After opening a window that provides graphing capabilities andselecting the desired tab, select the information to graph in oneof the following ways:
a Click and drag the mouse across the rows and columns ofdata to graph.
b Hold the Control (CTRL) key and click on the cells of datato graph.
c Hold the Shift key and click a range of data to graph.
2 Press the graph button that corresponds to the type of graph tobe created.
--End--
Graphing switch chassis dataThe DM provides the ability to view switch statistical information in avariety of graphs.
To make use of these capabilities, open the Graph Chassis window byselecting Graph, Chassis from the menu.
The following sections describe the informational tabs on this window andthe type of data each represents. Refer to “Creating a graph” (page 71) forthe procedure to graph this data.
Viewing the SNMP tabThe SNMP tab provides read-only statistical information about SNMPtraffic.
Use this procedure to view the SNMP tab.
Procedure Steps
Step Action
1 Open the Graph Chassis window by selecting Graph, Chassisfrom the menu.
Nortel Ethernet Routing Switch 5000 SeriesConfiguration — System MonitoringNN47200-505 05.01 25 May 2009
Copyright © 2005 -2009 Nortel Networks. All Rights Reserved.
.
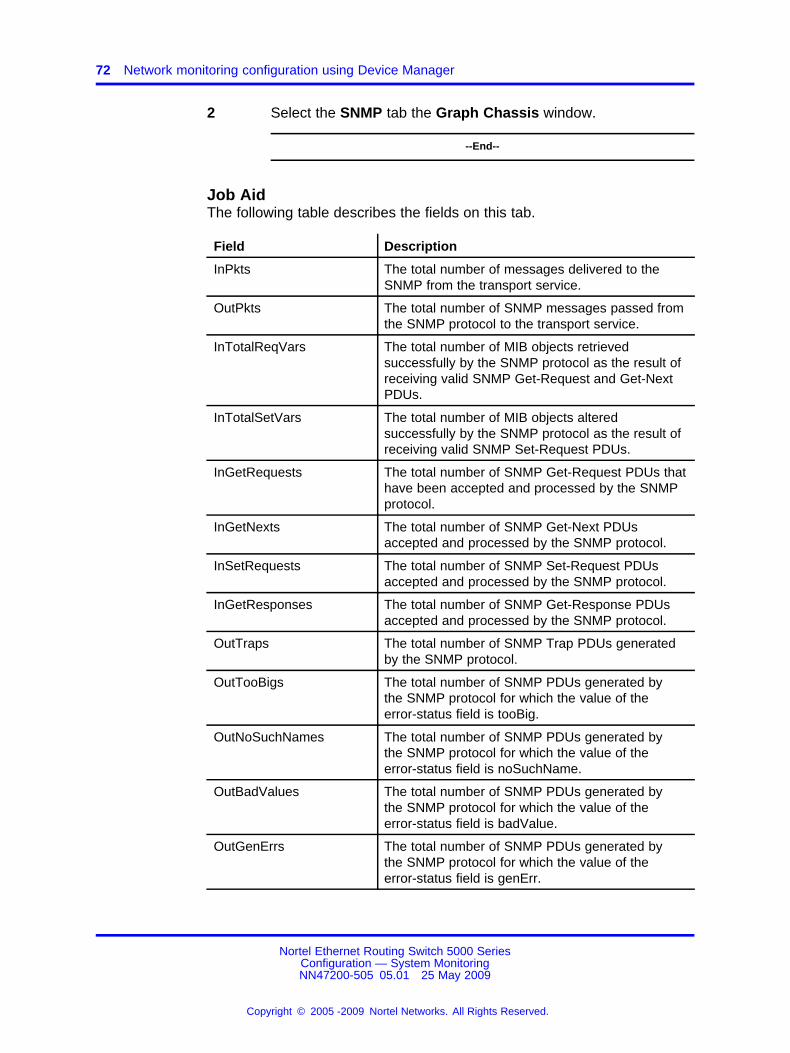
72 Network monitoring configuration using Device Manager
2 Select the SNMP tab the Graph Chassis window.
--End--
Job AidThe following table describes the fields on this tab.
Field Description
InPkts The total number of messages delivered to theSNMP from the transport service.
OutPkts The total number of SNMP messages passed fromthe SNMP protocol to the transport service.
InTotalReqVars The total number of MIB objects retrievedsuccessfully by the SNMP protocol as the result ofreceiving valid SNMP Get-Request and Get-NextPDUs.
InTotalSetVars The total number of MIB objects alteredsuccessfully by the SNMP protocol as the result ofreceiving valid SNMP Set-Request PDUs.
InGetRequests The total number of SNMP Get-Request PDUs thathave been accepted and processed by the SNMPprotocol.
InGetNexts The total number of SNMP Get-Next PDUsaccepted and processed by the SNMP protocol.
InSetRequests The total number of SNMP Set-Request PDUsaccepted and processed by the SNMP protocol.
InGetResponses The total number of SNMP Get-Response PDUsaccepted and processed by the SNMP protocol.
OutTraps The total number of SNMP Trap PDUs generatedby the SNMP protocol.
OutTooBigs The total number of SNMP PDUs generated bythe SNMP protocol for which the value of theerror-status field is tooBig.
OutNoSuchNames The total number of SNMP PDUs generated bythe SNMP protocol for which the value of theerror-status field is noSuchName.
OutBadValues The total number of SNMP PDUs generated bythe SNMP protocol for which the value of theerror-status field is badValue.
OutGenErrs The total number of SNMP PDUs generated bythe SNMP protocol for which the value of theerror-status field is genErr.
Nortel Ethernet Routing Switch 5000 SeriesConfiguration — System MonitoringNN47200-505 05.01 25 May 2009
Copyright © 2005 -2009 Nortel Networks. All Rights Reserved.
.
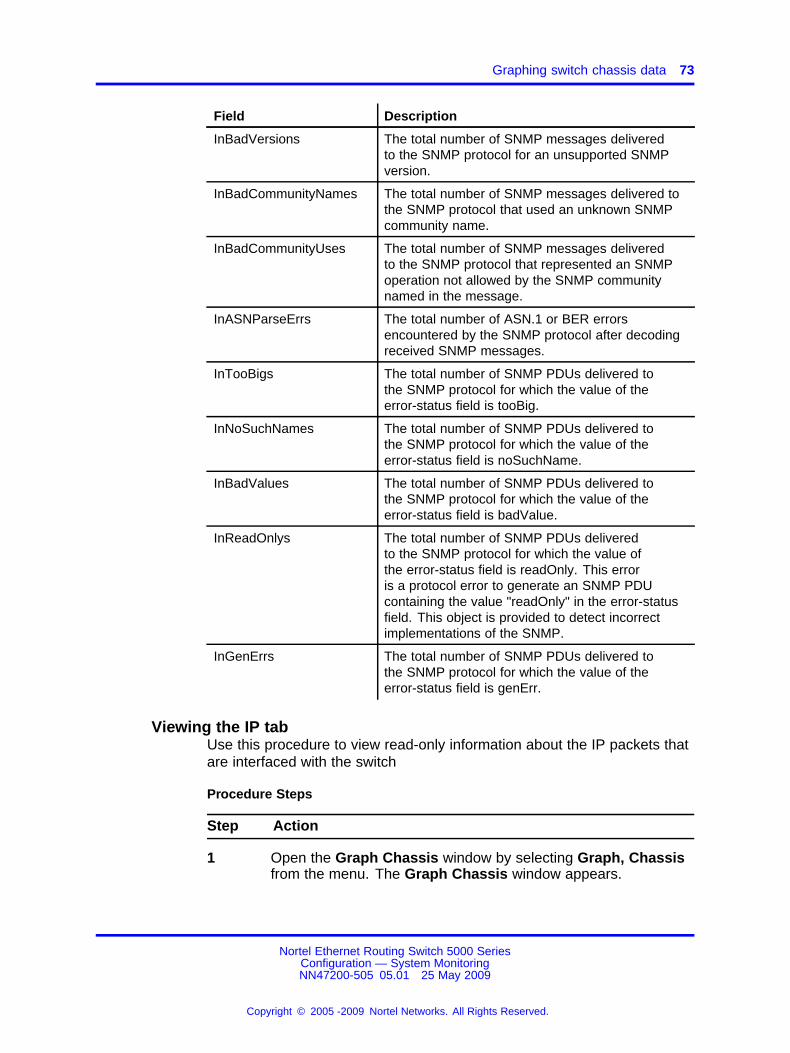
Graphing switch chassis data 73
Field Description
InBadVersions The total number of SNMP messages deliveredto the SNMP protocol for an unsupported SNMPversion.
InBadCommunityNames The total number of SNMP messages delivered tothe SNMP protocol that used an unknown SNMPcommunity name.
InBadCommunityUses The total number of SNMP messages deliveredto the SNMP protocol that represented an SNMPoperation not allowed by the SNMP communitynamed in the message.
InASNParseErrs The total number of ASN.1 or BER errorsencountered by the SNMP protocol after decodingreceived SNMP messages.
InTooBigs The total number of SNMP PDUs delivered tothe SNMP protocol for which the value of theerror-status field is tooBig.
InNoSuchNames The total number of SNMP PDUs delivered tothe SNMP protocol for which the value of theerror-status field is noSuchName.
InBadValues The total number of SNMP PDUs delivered tothe SNMP protocol for which the value of theerror-status field is badValue.
InReadOnlys The total number of SNMP PDUs deliveredto the SNMP protocol for which the value ofthe error-status field is readOnly. This erroris a protocol error to generate an SNMP PDUcontaining the value "readOnly" in the error-statusfield. This object is provided to detect incorrectimplementations of the SNMP.
InGenErrs The total number of SNMP PDUs delivered tothe SNMP protocol for which the value of theerror-status field is genErr.
Viewing the IP tabUse this procedure to view read-only information about the IP packets thatare interfaced with the switch
Procedure Steps
Step Action
1 Open the Graph Chassis window by selecting Graph, Chassisfrom the menu. The Graph Chassis window appears.
Nortel Ethernet Routing Switch 5000 SeriesConfiguration — System MonitoringNN47200-505 05.01 25 May 2009
Copyright © 2005 -2009 Nortel Networks. All Rights Reserved.
.
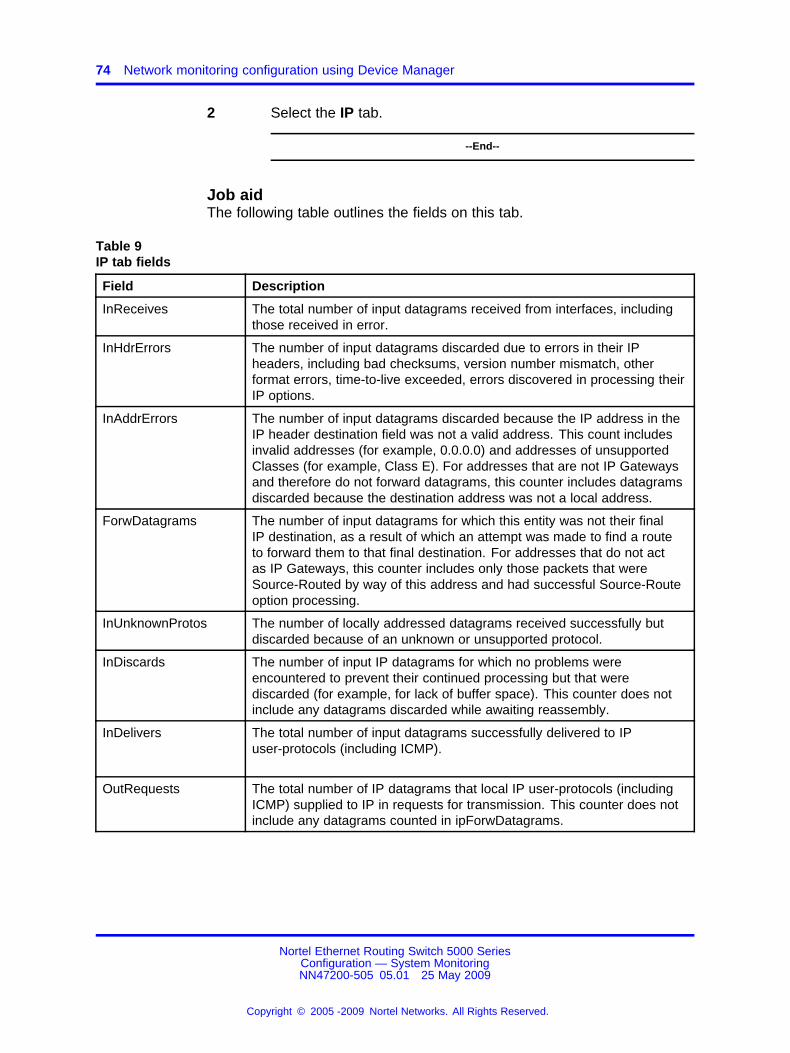
74 Network monitoring configuration using Device Manager
2 Select the IP tab.
--End--
Job aidThe following table outlines the fields on this tab.
Table 9IP tab fields
Field Description
InReceives The total number of input datagrams received from interfaces, includingthose received in error.
InHdrErrors The number of input datagrams discarded due to errors in their IPheaders, including bad checksums, version number mismatch, otherformat errors, time-to-live exceeded, errors discovered in processing theirIP options.
InAddrErrors The number of input datagrams discarded because the IP address in theIP header destination field was not a valid address. This count includesinvalid addresses (for example, 0.0.0.0) and addresses of unsupportedClasses (for example, Class E). For addresses that are not IP Gatewaysand therefore do not forward datagrams, this counter includes datagramsdiscarded because the destination address was not a local address.
ForwDatagrams The number of input datagrams for which this entity was not their finalIP destination, as a result of which an attempt was made to find a routeto forward them to that final destination. For addresses that do not actas IP Gateways, this counter includes only those packets that wereSource-Routed by way of this address and had successful Source-Routeoption processing.
InUnknownProtos The number of locally addressed datagrams received successfully butdiscarded because of an unknown or unsupported protocol.
InDiscards The number of input IP datagrams for which no problems wereencountered to prevent their continued processing but that werediscarded (for example, for lack of buffer space). This counter does notinclude any datagrams discarded while awaiting reassembly.
InDelivers The total number of input datagrams successfully delivered to IPuser-protocols (including ICMP).
OutRequests The total number of IP datagrams that local IP user-protocols (includingICMP) supplied to IP in requests for transmission. This counter does notinclude any datagrams counted in ipForwDatagrams.
Nortel Ethernet Routing Switch 5000 SeriesConfiguration — System MonitoringNN47200-505 05.01 25 May 2009
Copyright © 2005 -2009 Nortel Networks. All Rights Reserved.
.
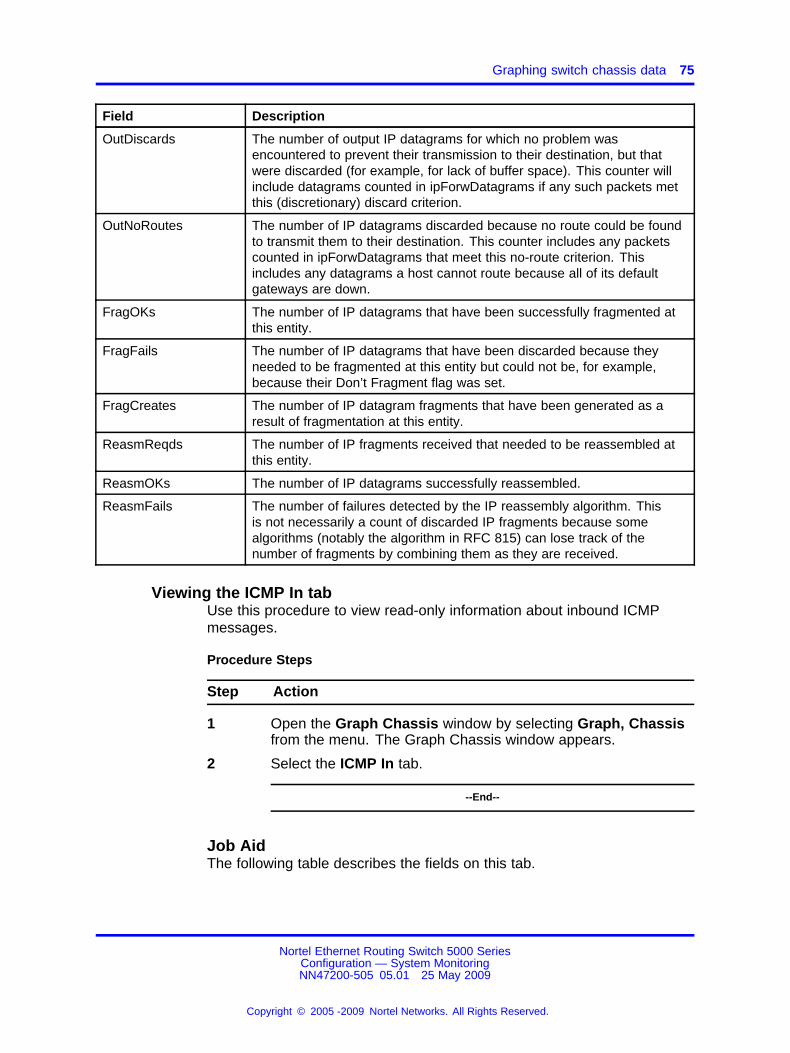
Graphing switch chassis data 75
Field Description
OutDiscards The number of output IP datagrams for which no problem wasencountered to prevent their transmission to their destination, but thatwere discarded (for example, for lack of buffer space). This counter willinclude datagrams counted in ipForwDatagrams if any such packets metthis (discretionary) discard criterion.
OutNoRoutes The number of IP datagrams discarded because no route could be foundto transmit them to their destination. This counter includes any packetscounted in ipForwDatagrams that meet this no-route criterion. Thisincludes any datagrams a host cannot route because all of its defaultgateways are down.
FragOKs The number of IP datagrams that have been successfully fragmented atthis entity.
FragFails The number of IP datagrams that have been discarded because theyneeded to be fragmented at this entity but could not be, for example,because their Don’t Fragment flag was set.
FragCreates The number of IP datagram fragments that have been generated as aresult of fragmentation at this entity.
ReasmReqds The number of IP fragments received that needed to be reassembled atthis entity.
ReasmOKs The number of IP datagrams successfully reassembled.
ReasmFails The number of failures detected by the IP reassembly algorithm. Thisis not necessarily a count of discarded IP fragments because somealgorithms (notably the algorithm in RFC 815) can lose track of thenumber of fragments by combining them as they are received.
Viewing the ICMP In tabUse this procedure to view read-only information about inbound ICMPmessages.
Procedure Steps
Step Action
1 Open the Graph Chassis window by selecting Graph, Chassisfrom the menu. The Graph Chassis window appears.
2 Select the ICMP In tab.
--End--
Job AidThe following table describes the fields on this tab.
Nortel Ethernet Routing Switch 5000 SeriesConfiguration — System MonitoringNN47200-505 05.01 25 May 2009
Copyright © 2005 -2009 Nortel Networks. All Rights Reserved.
.
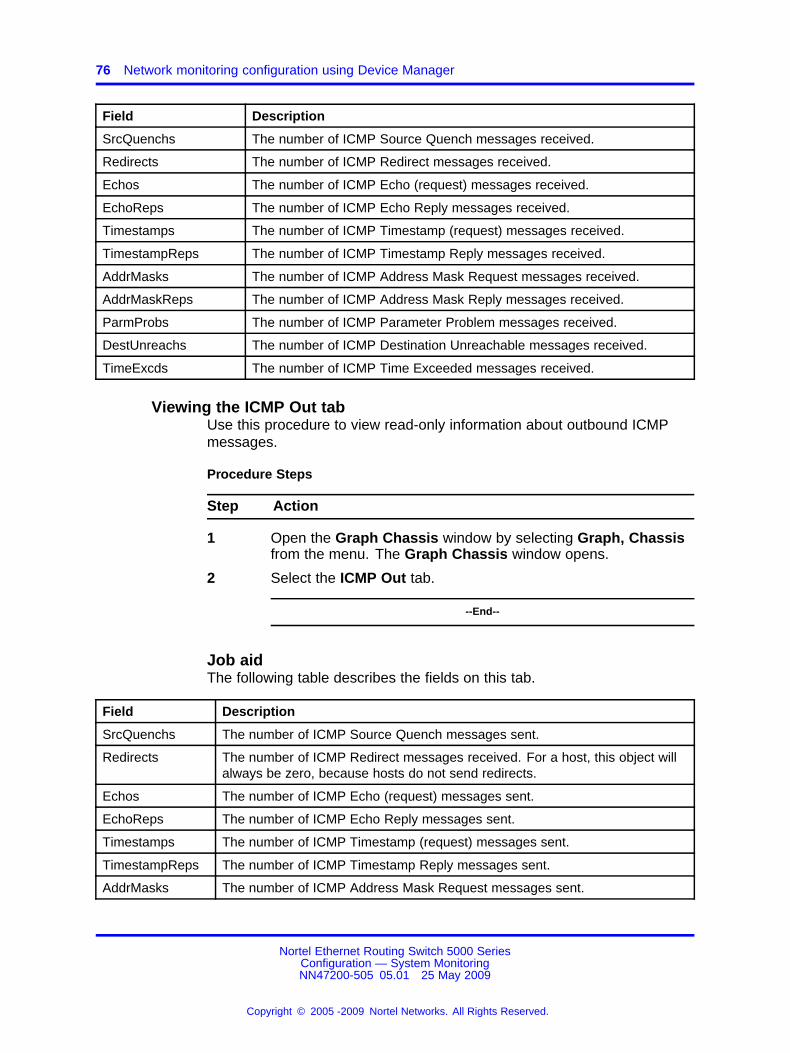
76 Network monitoring configuration using Device Manager
Field Description
SrcQuenchs The number of ICMP Source Quench messages received.
Redirects The number of ICMP Redirect messages received.
Echos The number of ICMP Echo (request) messages received.
EchoReps The number of ICMP Echo Reply messages received.
Timestamps The number of ICMP Timestamp (request) messages received.
TimestampReps The number of ICMP Timestamp Reply messages received.
AddrMasks The number of ICMP Address Mask Request messages received.
AddrMaskReps The number of ICMP Address Mask Reply messages received.
ParmProbs The number of ICMP Parameter Problem messages received.
DestUnreachs The number of ICMP Destination Unreachable messages received.
TimeExcds The number of ICMP Time Exceeded messages received.
Viewing the ICMP Out tabUse this procedure to view read-only information about outbound ICMPmessages.
Procedure Steps
Step Action
1 Open the Graph Chassis window by selecting Graph, Chassisfrom the menu. The Graph Chassis window opens.
2 Select the ICMP Out tab.
--End--
Job aidThe following table describes the fields on this tab.
Field Description
SrcQuenchs The number of ICMP Source Quench messages sent.
Redirects The number of ICMP Redirect messages received. For a host, this object willalways be zero, because hosts do not send redirects.
Echos The number of ICMP Echo (request) messages sent.
EchoReps The number of ICMP Echo Reply messages sent.
Timestamps The number of ICMP Timestamp (request) messages sent.
TimestampReps The number of ICMP Timestamp Reply messages sent.
AddrMasks The number of ICMP Address Mask Request messages sent.
Nortel Ethernet Routing Switch 5000 SeriesConfiguration — System MonitoringNN47200-505 05.01 25 May 2009
Copyright © 2005 -2009 Nortel Networks. All Rights Reserved.
.
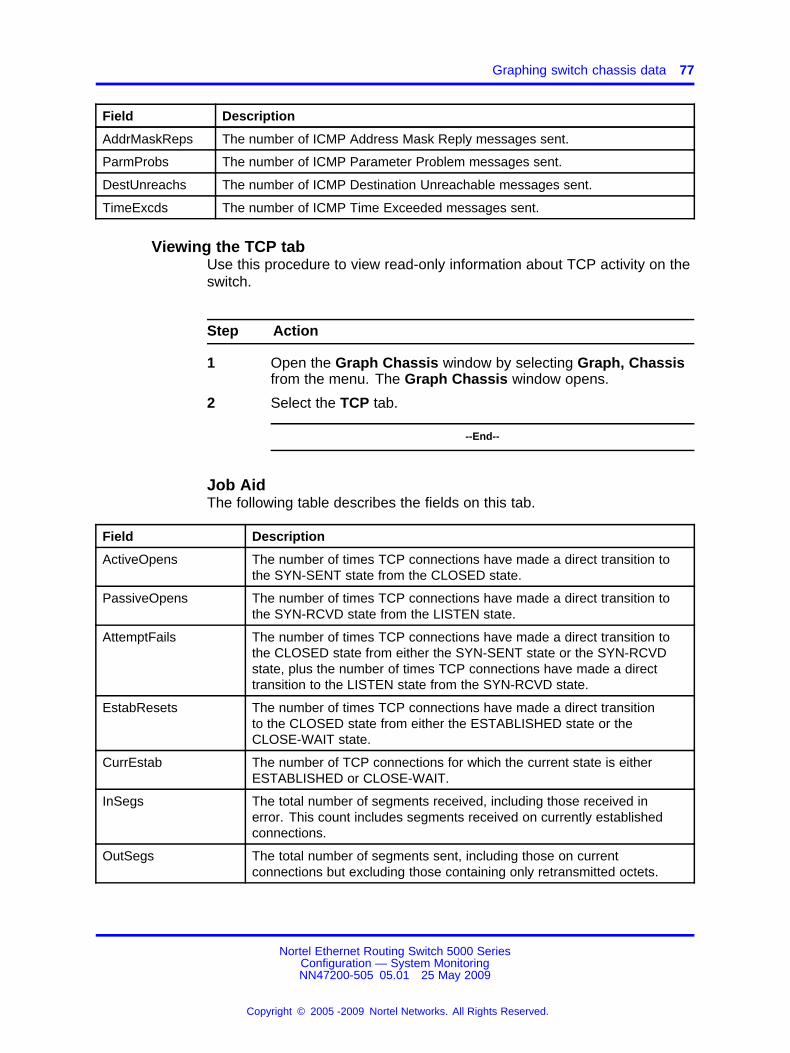
Graphing switch chassis data 77
Field Description
AddrMaskReps The number of ICMP Address Mask Reply messages sent.
ParmProbs The number of ICMP Parameter Problem messages sent.
DestUnreachs The number of ICMP Destination Unreachable messages sent.
TimeExcds The number of ICMP Time Exceeded messages sent.
Viewing the TCP tabUse this procedure to view read-only information about TCP activity on theswitch.
Step Action
1 Open the Graph Chassis window by selecting Graph, Chassisfrom the menu. The Graph Chassis window opens.
2 Select the TCP tab.
--End--
Job AidThe following table describes the fields on this tab.
Field Description
ActiveOpens The number of times TCP connections have made a direct transition tothe SYN-SENT state from the CLOSED state.
PassiveOpens The number of times TCP connections have made a direct transition tothe SYN-RCVD state from the LISTEN state.
AttemptFails The number of times TCP connections have made a direct transition tothe CLOSED state from either the SYN-SENT state or the SYN-RCVDstate, plus the number of times TCP connections have made a directtransition to the LISTEN state from the SYN-RCVD state.
EstabResets The number of times TCP connections have made a direct transitionto the CLOSED state from either the ESTABLISHED state or theCLOSE-WAIT state.
CurrEstab The number of TCP connections for which the current state is eitherESTABLISHED or CLOSE-WAIT.
InSegs The total number of segments received, including those received inerror. This count includes segments received on currently establishedconnections.
OutSegs The total number of segments sent, including those on currentconnections but excluding those containing only retransmitted octets.
Nortel Ethernet Routing Switch 5000 SeriesConfiguration — System MonitoringNN47200-505 05.01 25 May 2009
Copyright © 2005 -2009 Nortel Networks. All Rights Reserved.
.

78 Network monitoring configuration using Device Manager
Field Description
RetransSegs The total number of segments retransmitted -- that is, the number of TCPsegments transmitted containing one or more previously transmittedoctets.
InErrs The total number of segments received in error (for example, bad TCPchecksums).
OutRsts The number of TCP segments sent containing the RST flag.
HCInSegs The number of segments received, including those received in error. Thiscount includes segments received on currently established connections.This object is the 64-bit equivalent of InSegs.
HCOutSegs The number of segments sent, including those on current connections,but excluding those containing only retransmitted octets. This object isthe 64-bit equivalent of OutSegs.
Viewing the UDP tabUse this procedure to view read-only information about UDP activity on theswitch.
Procedure Steps
Step Action
1 Open the Graph Chassis window by selecting Graph, Chassisfrom the menu. The Graph Chassis window appears.
2 Select the UDP tab.
--End--
Job AidThe following table describes the fields on this tab.
Table 10UDP tab fields
Field Description
InDatagrams The total number of UDP datagrams delivered to UDP users
NoPorts The total number of received UDP datagrams for which there wasno application at the destination port.
InErrors The number of received UDP datagrams that could not bedelivered for reasons other than the lack of an application at thedestination port.
OutDatagrams The total number of UDP datagrams sent from this entity.
Nortel Ethernet Routing Switch 5000 SeriesConfiguration — System MonitoringNN47200-505 05.01 25 May 2009
Copyright © 2005 -2009 Nortel Networks. All Rights Reserved.
.
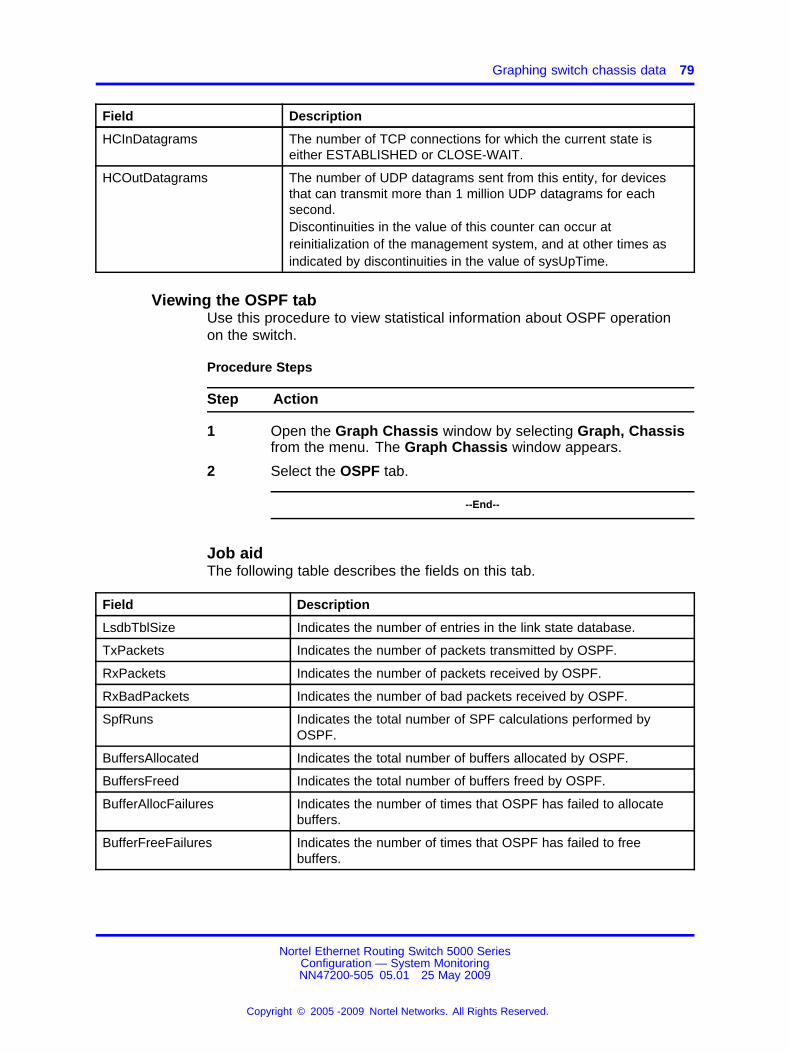
Graphing switch chassis data 79
Field Description
HCInDatagrams The number of TCP connections for which the current state iseither ESTABLISHED or CLOSE-WAIT.
HCOutDatagrams The number of UDP datagrams sent from this entity, for devicesthat can transmit more than 1 million UDP datagrams for eachsecond.Discontinuities in the value of this counter can occur atreinitialization of the management system, and at other times asindicated by discontinuities in the value of sysUpTime.
Viewing the OSPF tabUse this procedure to view statistical information about OSPF operationon the switch.
Procedure Steps
Step Action
1 Open the Graph Chassis window by selecting Graph, Chassisfrom the menu. The Graph Chassis window appears.
2 Select the OSPF tab.
--End--
Job aidThe following table describes the fields on this tab.
Field Description
LsdbTblSize Indicates the number of entries in the link state database.
TxPackets Indicates the number of packets transmitted by OSPF.
RxPackets Indicates the number of packets received by OSPF.
RxBadPackets Indicates the number of bad packets received by OSPF.
SpfRuns Indicates the total number of SPF calculations performed byOSPF.
BuffersAllocated Indicates the total number of buffers allocated by OSPF.
BuffersFreed Indicates the total number of buffers freed by OSPF.
BufferAllocFailures Indicates the number of times that OSPF has failed to allocatebuffers.
BufferFreeFailures Indicates the number of times that OSPF has failed to freebuffers.
Nortel Ethernet Routing Switch 5000 SeriesConfiguration — System MonitoringNN47200-505 05.01 25 May 2009
Copyright © 2005 -2009 Nortel Networks. All Rights Reserved.
.

80 Network monitoring configuration using Device Manager
Viewing the VRRP tabUse this procedure to view statistical information about VRRP operationon the switch.
Procedure Steps
Step Action
1 Open the Graph Chassis window by selecting Graph, Chassisfrom the menu. The Graph Chassis window appears.
2 Select the VRRP tab.
--End--
Job aidThe following table describes the fields on this tab.
Field Description
RouterChecksumErrors The total number of VRRP packets received with an invalid VRRPchecksum value.
RouterVersionErrors The total number of VRRP packets received with an unknown orunsupported version number.
RouterVrIdErrors The total number of VRRP packets received with an invalid VRIDfor this virtual router."
Graphing switch port dataThis section describes the use of Device Manager (DM) to view portstatistical information in a variety of graphs.
Use the following procedure to select a port or ports to graph.
Procedure Steps
Step Action
1 Select one or multiple ports on the device view.
2 Select Graph, Port from the menu.
--End--
The following sections describe the informational tabs on this window andwhat type of data each represents. Refer to “Creating a graph” (page71) for the procedure to graph this data.
Some statistics are only available after a single port is graphed.
Nortel Ethernet Routing Switch 5000 SeriesConfiguration — System MonitoringNN47200-505 05.01 25 May 2009
Copyright © 2005 -2009 Nortel Networks. All Rights Reserved.
.
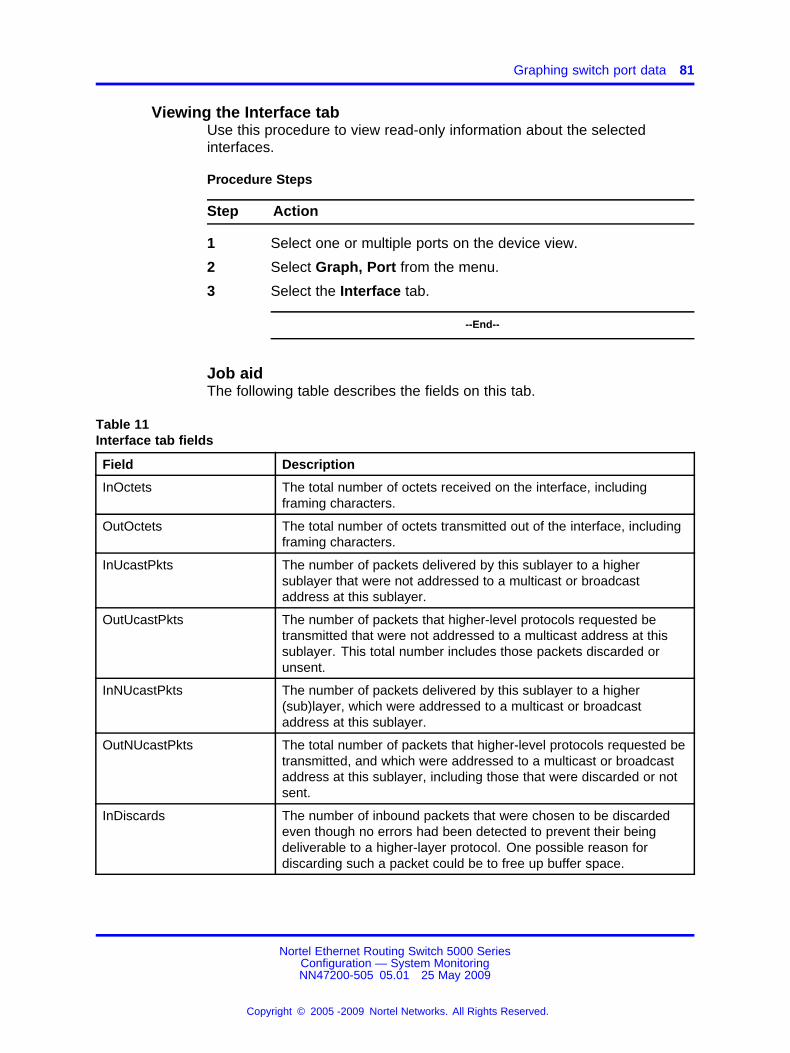
Graphing switch port data 81
Viewing the Interface tabUse this procedure to view read-only information about the selectedinterfaces.
Procedure Steps
Step Action
1 Select one or multiple ports on the device view.
2 Select Graph, Port from the menu.
3 Select the Interface tab.
--End--
Job aidThe following table describes the fields on this tab.
Table 11Interface tab fields
Field Description
InOctets The total number of octets received on the interface, includingframing characters.
OutOctets The total number of octets transmitted out of the interface, includingframing characters.
InUcastPkts The number of packets delivered by this sublayer to a highersublayer that were not addressed to a multicast or broadcastaddress at this sublayer.
OutUcastPkts The number of packets that higher-level protocols requested betransmitted that were not addressed to a multicast address at thissublayer. This total number includes those packets discarded orunsent.
InNUcastPkts The number of packets delivered by this sublayer to a higher(sub)layer, which were addressed to a multicast or broadcastaddress at this sublayer.
OutNUcastPkts The total number of packets that higher-level protocols requested betransmitted, and which were addressed to a multicast or broadcastaddress at this sublayer, including those that were discarded or notsent.
InDiscards The number of inbound packets that were chosen to be discardedeven though no errors had been detected to prevent their beingdeliverable to a higher-layer protocol. One possible reason fordiscarding such a packet could be to free up buffer space.
Nortel Ethernet Routing Switch 5000 SeriesConfiguration — System MonitoringNN47200-505 05.01 25 May 2009
Copyright © 2005 -2009 Nortel Networks. All Rights Reserved.
.
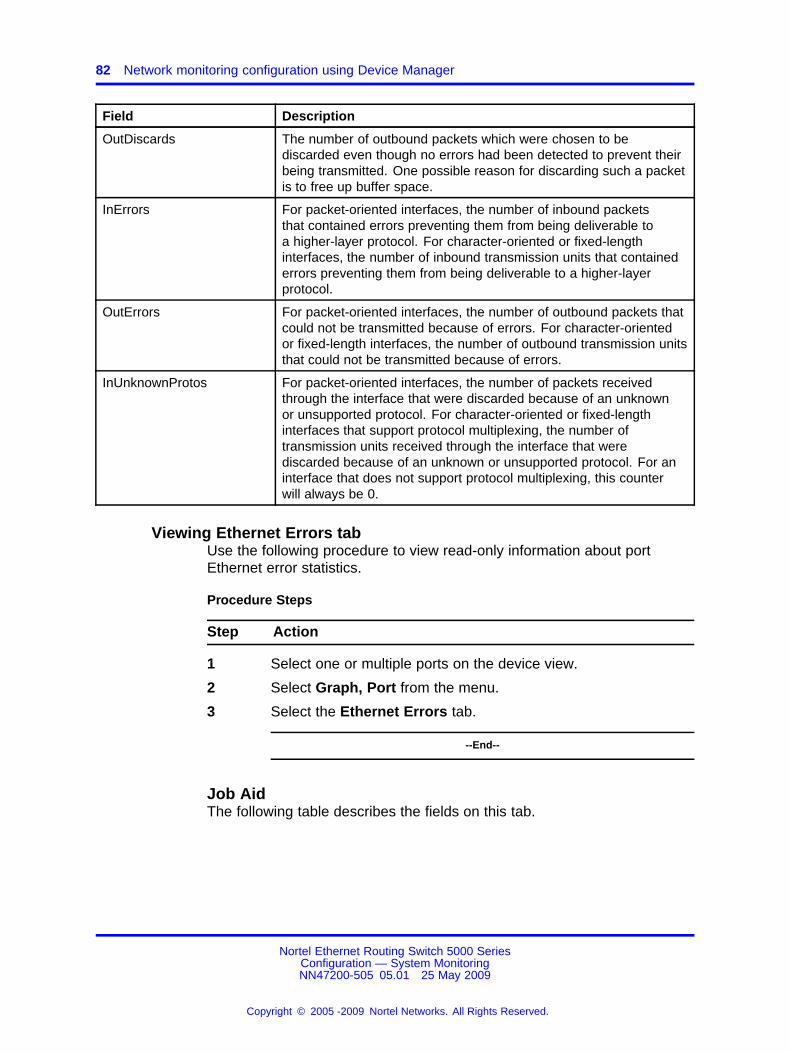
82 Network monitoring configuration using Device Manager
Field Description
OutDiscards The number of outbound packets which were chosen to bediscarded even though no errors had been detected to prevent theirbeing transmitted. One possible reason for discarding such a packetis to free up buffer space.
InErrors For packet-oriented interfaces, the number of inbound packetsthat contained errors preventing them from being deliverable toa higher-layer protocol. For character-oriented or fixed-lengthinterfaces, the number of inbound transmission units that containederrors preventing them from being deliverable to a higher-layerprotocol.
OutErrors For packet-oriented interfaces, the number of outbound packets thatcould not be transmitted because of errors. For character-orientedor fixed-length interfaces, the number of outbound transmission unitsthat could not be transmitted because of errors.
InUnknownProtos For packet-oriented interfaces, the number of packets receivedthrough the interface that were discarded because of an unknownor unsupported protocol. For character-oriented or fixed-lengthinterfaces that support protocol multiplexing, the number oftransmission units received through the interface that werediscarded because of an unknown or unsupported protocol. For aninterface that does not support protocol multiplexing, this counterwill always be 0.
Viewing Ethernet Errors tabUse the following procedure to view read-only information about portEthernet error statistics.
Procedure Steps
Step Action
1 Select one or multiple ports on the device view.
2 Select Graph, Port from the menu.
3 Select the Ethernet Errors tab.
--End--
Job AidThe following table describes the fields on this tab.
Nortel Ethernet Routing Switch 5000 SeriesConfiguration — System MonitoringNN47200-505 05.01 25 May 2009
Copyright © 2005 -2009 Nortel Networks. All Rights Reserved.
.
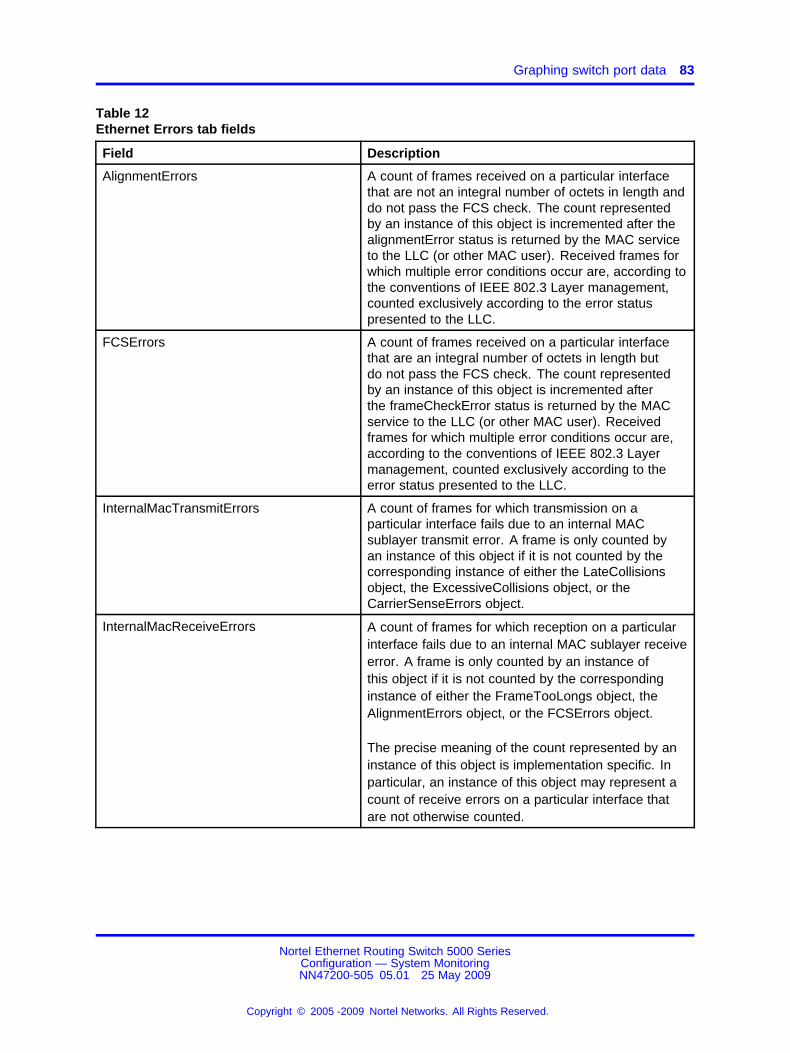
Graphing switch port data 83
Table 12Ethernet Errors tab fields
Field Description
AlignmentErrors A count of frames received on a particular interfacethat are not an integral number of octets in length anddo not pass the FCS check. The count representedby an instance of this object is incremented after thealignmentError status is returned by the MAC serviceto the LLC (or other MAC user). Received frames forwhich multiple error conditions occur are, according tothe conventions of IEEE 802.3 Layer management,counted exclusively according to the error statuspresented to the LLC.
FCSErrors A count of frames received on a particular interfacethat are an integral number of octets in length butdo not pass the FCS check. The count representedby an instance of this object is incremented afterthe frameCheckError status is returned by the MACservice to the LLC (or other MAC user). Receivedframes for which multiple error conditions occur are,according to the conventions of IEEE 802.3 Layermanagement, counted exclusively according to theerror status presented to the LLC.
InternalMacTransmitErrors A count of frames for which transmission on aparticular interface fails due to an internal MACsublayer transmit error. A frame is only counted byan instance of this object if it is not counted by thecorresponding instance of either the LateCollisionsobject, the ExcessiveCollisions object, or theCarrierSenseErrors object.
InternalMacReceiveErrors A count of frames for which reception on a particularinterface fails due to an internal MAC sublayer receiveerror. A frame is only counted by an instance ofthis object if it is not counted by the correspondinginstance of either the FrameTooLongs object, theAlignmentErrors object, or the FCSErrors object.
The precise meaning of the count represented by aninstance of this object is implementation specific. Inparticular, an instance of this object may represent acount of receive errors on a particular interface thatare not otherwise counted.
Nortel Ethernet Routing Switch 5000 SeriesConfiguration — System MonitoringNN47200-505 05.01 25 May 2009
Copyright © 2005 -2009 Nortel Networks. All Rights Reserved.
.
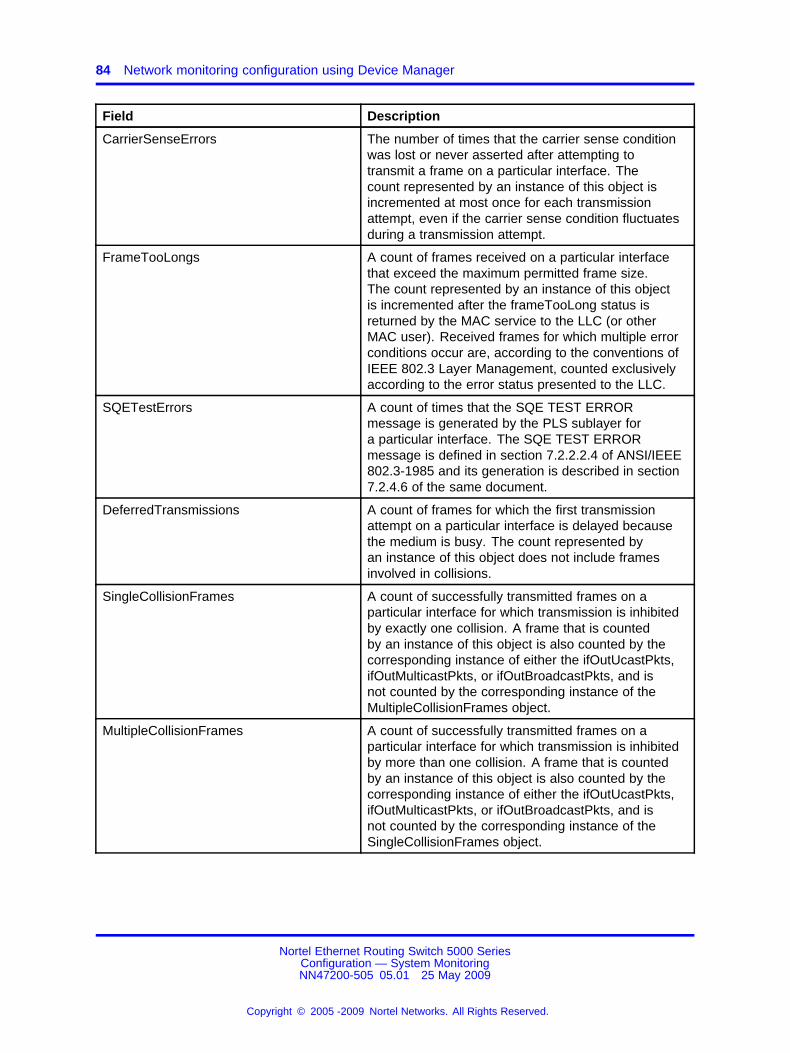
84 Network monitoring configuration using Device Manager
Field Description
CarrierSenseErrors The number of times that the carrier sense conditionwas lost or never asserted after attempting totransmit a frame on a particular interface. Thecount represented by an instance of this object isincremented at most once for each transmissionattempt, even if the carrier sense condition fluctuatesduring a transmission attempt.
FrameTooLongs A count of frames received on a particular interfacethat exceed the maximum permitted frame size.The count represented by an instance of this objectis incremented after the frameTooLong status isreturned by the MAC service to the LLC (or otherMAC user). Received frames for which multiple errorconditions occur are, according to the conventions ofIEEE 802.3 Layer Management, counted exclusivelyaccording to the error status presented to the LLC.
SQETestErrors A count of times that the SQE TEST ERRORmessage is generated by the PLS sublayer fora particular interface. The SQE TEST ERRORmessage is defined in section 7.2.2.2.4 of ANSI/IEEE802.3-1985 and its generation is described in section7.2.4.6 of the same document.
DeferredTransmissions A count of frames for which the first transmissionattempt on a particular interface is delayed becausethe medium is busy. The count represented byan instance of this object does not include framesinvolved in collisions.
SingleCollisionFrames A count of successfully transmitted frames on aparticular interface for which transmission is inhibitedby exactly one collision. A frame that is countedby an instance of this object is also counted by thecorresponding instance of either the ifOutUcastPkts,ifOutMulticastPkts, or ifOutBroadcastPkts, and isnot counted by the corresponding instance of theMultipleCollisionFrames object.
MultipleCollisionFrames A count of successfully transmitted frames on aparticular interface for which transmission is inhibitedby more than one collision. A frame that is countedby an instance of this object is also counted by thecorresponding instance of either the ifOutUcastPkts,ifOutMulticastPkts, or ifOutBroadcastPkts, and isnot counted by the corresponding instance of theSingleCollisionFrames object.
Nortel Ethernet Routing Switch 5000 SeriesConfiguration — System MonitoringNN47200-505 05.01 25 May 2009
Copyright © 2005 -2009 Nortel Networks. All Rights Reserved.
.
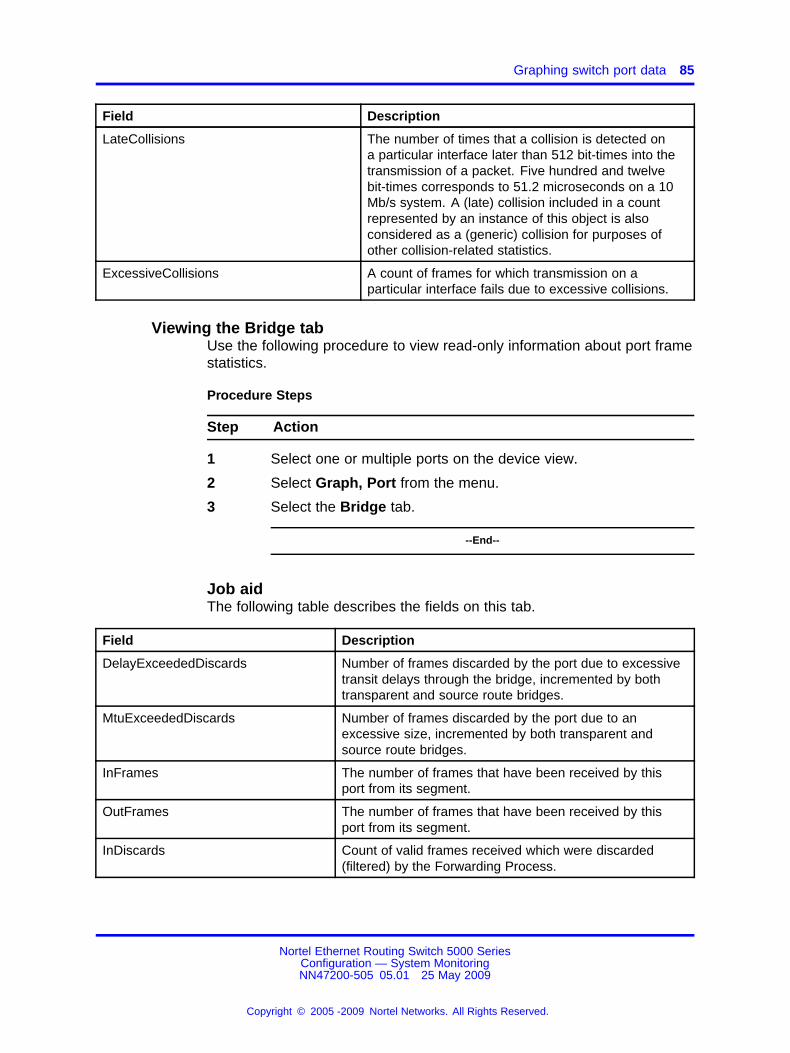
Graphing switch port data 85
Field Description
LateCollisions The number of times that a collision is detected ona particular interface later than 512 bit-times into thetransmission of a packet. Five hundred and twelvebit-times corresponds to 51.2 microseconds on a 10Mb/s system. A (late) collision included in a countrepresented by an instance of this object is alsoconsidered as a (generic) collision for purposes ofother collision-related statistics.
ExcessiveCollisions A count of frames for which transmission on aparticular interface fails due to excessive collisions.
Viewing the Bridge tabUse the following procedure to view read-only information about port framestatistics.
Procedure Steps
Step Action
1 Select one or multiple ports on the device view.
2 Select Graph, Port from the menu.
3 Select the Bridge tab.
--End--
Job aidThe following table describes the fields on this tab.
Field Description
DelayExceededDiscards Number of frames discarded by the port due to excessivetransit delays through the bridge, incremented by bothtransparent and source route bridges.
MtuExceededDiscards Number of frames discarded by the port due to anexcessive size, incremented by both transparent andsource route bridges.
InFrames The number of frames that have been received by thisport from its segment.
OutFrames The number of frames that have been received by thisport from its segment.
InDiscards Count of valid frames received which were discarded(filtered) by the Forwarding Process.
Nortel Ethernet Routing Switch 5000 SeriesConfiguration — System MonitoringNN47200-505 05.01 25 May 2009
Copyright © 2005 -2009 Nortel Networks. All Rights Reserved.
.

86 Network monitoring configuration using Device Manager
Viewing the Rmon tabUse the following procedure to view read-only remote monitoring statistics.
Procedure Steps
Step Action
1 Select one or multiple ports on the device view.
2 Select Graph, Port from the menu.
3 Select the Rmon tab.
--End--
Job aidThe following table describes the fields on this tab.
Table 13RMON tab fields
Field Description
Octets The total number of octets of data (including those in bad packets)received on the network (excluding framing bits but includingFCS octets). You can use this object as a reasonable estimate ofEthernet utilization. For greater precision, sample the etherStatsPktsand etherStatsOctets objects before and after a common interval.
Pkts The total number of packets (including bad packets, broadcastpackets, and multicast packets) received.
BroadcastPkts The total number of good packets received that were directed to thebroadcast address. This does not include multicast packets.
MulticastPkts The total number of good packets received that were directed to amulticast address. This number does not include packets directedto the broadcast address.
CRCAlignErrors The total number of packets received that had a length (excludingframing bits, but including FCS octets) of between 64 and 1518octets, inclusive, but had either a bad Frame Check Sequence(FCS) with an integral number of octets (FCS Error) or a bad FCSwith a nonintegral number of octets (Alignment Error).
UndersizePkts The total number of packets received that were less than 64 octetslong (excluding framing bits but including FCS octets) and wereotherwise well formed.
OversizePkts The total number of packets received that were longer than 1518octets (excluding framing bits but including FCS octets) and wereotherwise well formed.
Nortel Ethernet Routing Switch 5000 SeriesConfiguration — System MonitoringNN47200-505 05.01 25 May 2009
Copyright © 2005 -2009 Nortel Networks. All Rights Reserved.
.

Graphing switch port data 87
Field Description
Fragments The total number of packets received that were less than 64 octetsin length (excluding framing bits but including FCS octets) andhad either a bad Frame Check Sequence (FCS) with an integralnumber of octets (FCS Error) or a bad FCS with a nonintegralnumber of octets (Alignment Error). Normal behavior is foretherStatsFragments is to increment because it counts both runts(which are normal occurrences due to collisions) and noise hits.
Collisions The best estimate of the total number of collisions on this Ethernetsegment.
Jabbers The total number of packets received that were longer than 1518octets (excluding framing bits, but including FCS octets), and hadeither a bad Frame Check Sequence (FCS) with an integral numberof octets (FCS Error) or a bad FCS with a non-integral number ofoctets (Alignment Error). Jabber is defined as the condition wherea packet exceeds 20 ms. The allowed range to detect jabber isbetween 20 ms and 150 ms.
1..64 The total number of packets (including bad packets) received thatwere between 1 and 64 octets in length (excluding framing bits butincluding FCS octets).
65..127 The total number of packets (including bad packets) received thatwere between 65 and 127 octets in length (excluding framing bitsbut including FCS octets).
128..255 The total number of packets (including bad packets) received thatwere between 128 and 255 octets in length (excluding framing bitsbut including FCS octets).
256..511 The total number of packets (including bad packets) received thatwere between 256 and 511 octets in length (excluding framing bitsbut including FCS octets).
511..1023 The total number of packets (including bad packets) received thatwere between 511 and 1023 octets in length (excluding framing bitsbut including FCS octets).
1024..1518 The total number of packets (including bad packets) received thatwere between 1024 and 1518 octets in length (excluding framingbits but including FCS octets).
Viewing the EAPOL Stats tabUse the following procedure to view read-only EAPOL statistics.
Procedure Steps
Step Action
1 Select one or multiple ports on the device view.
2 Select Graph, Port from the menu.
Nortel Ethernet Routing Switch 5000 SeriesConfiguration — System MonitoringNN47200-505 05.01 25 May 2009
Copyright © 2005 -2009 Nortel Networks. All Rights Reserved.
.
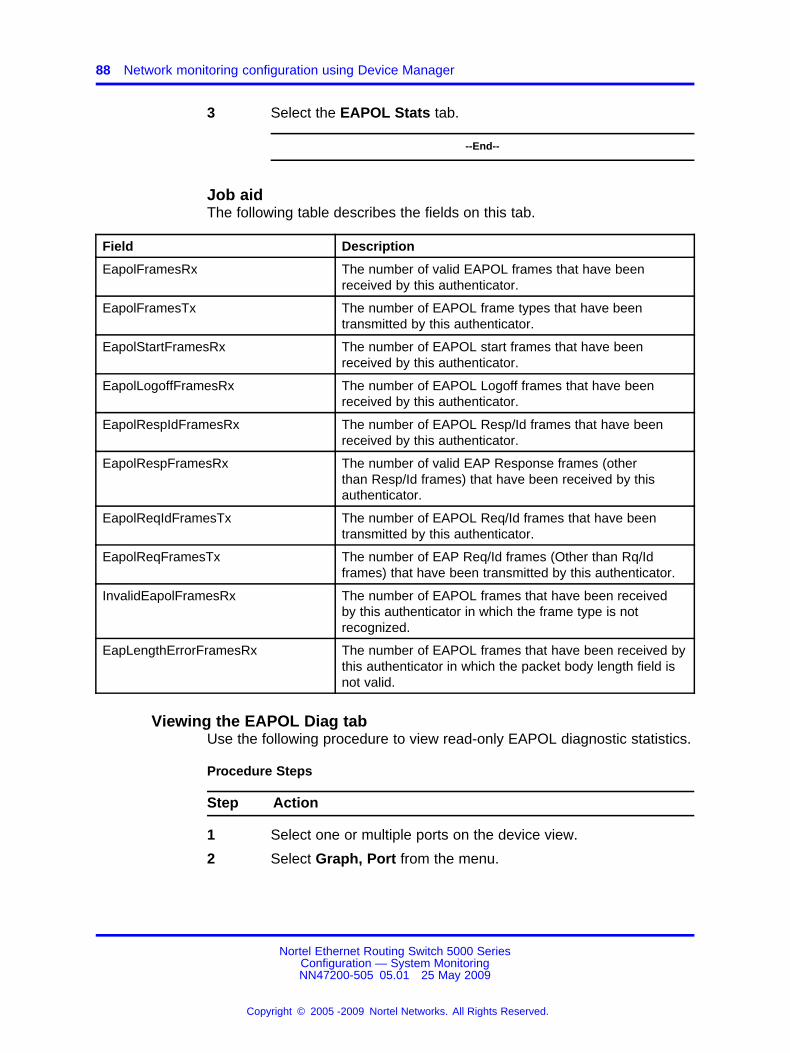
88 Network monitoring configuration using Device Manager
3 Select the EAPOL Stats tab.
--End--
Job aidThe following table describes the fields on this tab.
Field Description
EapolFramesRx The number of valid EAPOL frames that have beenreceived by this authenticator.
EapolFramesTx The number of EAPOL frame types that have beentransmitted by this authenticator.
EapolStartFramesRx The number of EAPOL start frames that have beenreceived by this authenticator.
EapolLogoffFramesRx The number of EAPOL Logoff frames that have beenreceived by this authenticator.
EapolRespIdFramesRx The number of EAPOL Resp/Id frames that have beenreceived by this authenticator.
EapolRespFramesRx The number of valid EAP Response frames (otherthan Resp/Id frames) that have been received by thisauthenticator.
EapolReqIdFramesTx The number of EAPOL Req/Id frames that have beentransmitted by this authenticator.
EapolReqFramesTx The number of EAP Req/Id frames (Other than Rq/Idframes) that have been transmitted by this authenticator.
InvalidEapolFramesRx The number of EAPOL frames that have been receivedby this authenticator in which the frame type is notrecognized.
EapLengthErrorFramesRx The number of EAPOL frames that have been received bythis authenticator in which the packet body length field isnot valid.
Viewing the EAPOL Diag tabUse the following procedure to view read-only EAPOL diagnostic statistics.
Procedure Steps
Step Action
1 Select one or multiple ports on the device view.
2 Select Graph, Port from the menu.
Nortel Ethernet Routing Switch 5000 SeriesConfiguration — System MonitoringNN47200-505 05.01 25 May 2009
Copyright © 2005 -2009 Nortel Networks. All Rights Reserved.
.

Graphing switch port data 89
3 Select the EAPOL Diag tab.
--End--
Job aidThe following table describes the fields on this tab.
Table 14EAPOL Diag tab fields
Field Description
EntersConnecting Counts the number of timesthat the Authenticator PAEstate machine transitions tothe Connecting state fromanother state.
EapLogoffsWhileConnecting Counts the number of timesthat the Authenticator PAEstate machine transitionsfrom Connected toDisconnected as a result ofreceiving an EAPOL-Logoffmessage.
EntersAuthenticating Counts the number of timesthat the AuthenticatorPAE state machinetransitions from Connectingto Authenticating as aresult of receiving anEAP-Response/Identitymessage from thesupplicant.
AuthSuccessWhileAuthenticating Counts the number of timesthat the Authenticator PAEstate machine transitionsfrom Authenticating toAuthenticated as a result ofthe Backend authenticationstate machine indicatingsuccessful authentication ofthe supplicant.
Nortel Ethernet Routing Switch 5000 SeriesConfiguration — System MonitoringNN47200-505 05.01 25 May 2009
Copyright © 2005 -2009 Nortel Networks. All Rights Reserved.
.
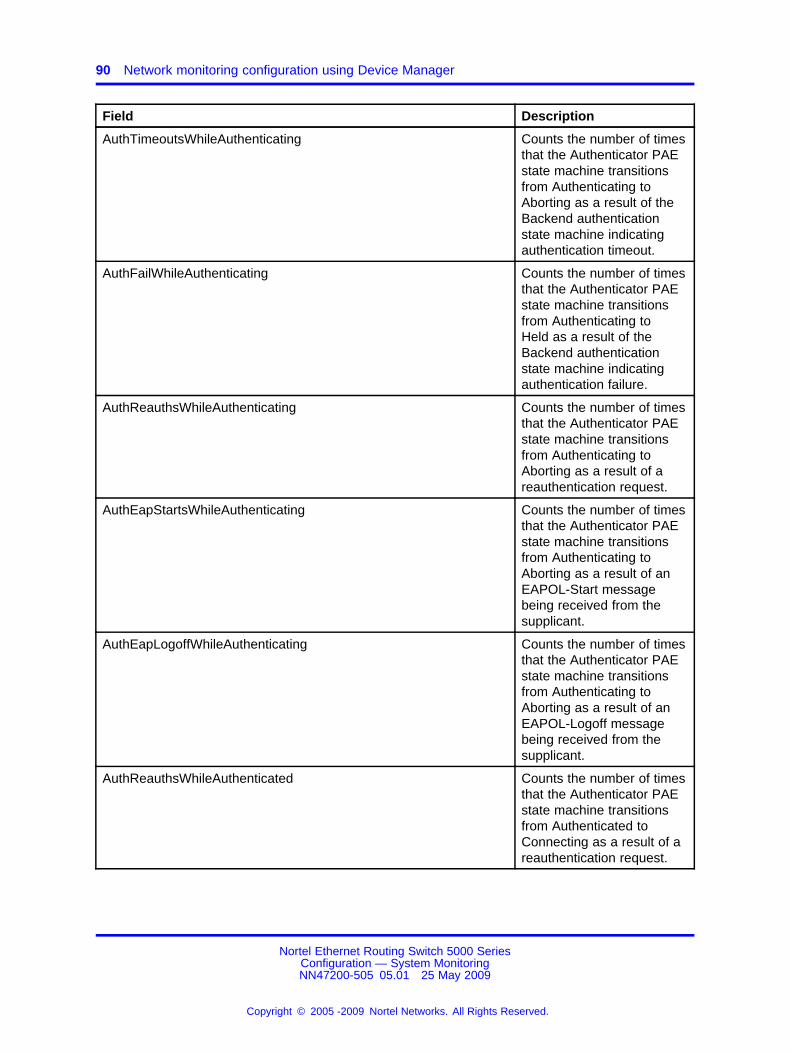
90 Network monitoring configuration using Device Manager
Field Description
AuthTimeoutsWhileAuthenticating Counts the number of timesthat the Authenticator PAEstate machine transitionsfrom Authenticating toAborting as a result of theBackend authenticationstate machine indicatingauthentication timeout.
AuthFailWhileAuthenticating Counts the number of timesthat the Authenticator PAEstate machine transitionsfrom Authenticating toHeld as a result of theBackend authenticationstate machine indicatingauthentication failure.
AuthReauthsWhileAuthenticating Counts the number of timesthat the Authenticator PAEstate machine transitionsfrom Authenticating toAborting as a result of areauthentication request.
AuthEapStartsWhileAuthenticating Counts the number of timesthat the Authenticator PAEstate machine transitionsfrom Authenticating toAborting as a result of anEAPOL-Start messagebeing received from thesupplicant.
AuthEapLogoffWhileAuthenticating Counts the number of timesthat the Authenticator PAEstate machine transitionsfrom Authenticating toAborting as a result of anEAPOL-Logoff messagebeing received from thesupplicant.
AuthReauthsWhileAuthenticated Counts the number of timesthat the Authenticator PAEstate machine transitionsfrom Authenticated toConnecting as a result of areauthentication request.
Nortel Ethernet Routing Switch 5000 SeriesConfiguration — System MonitoringNN47200-505 05.01 25 May 2009
Copyright © 2005 -2009 Nortel Networks. All Rights Reserved.
.
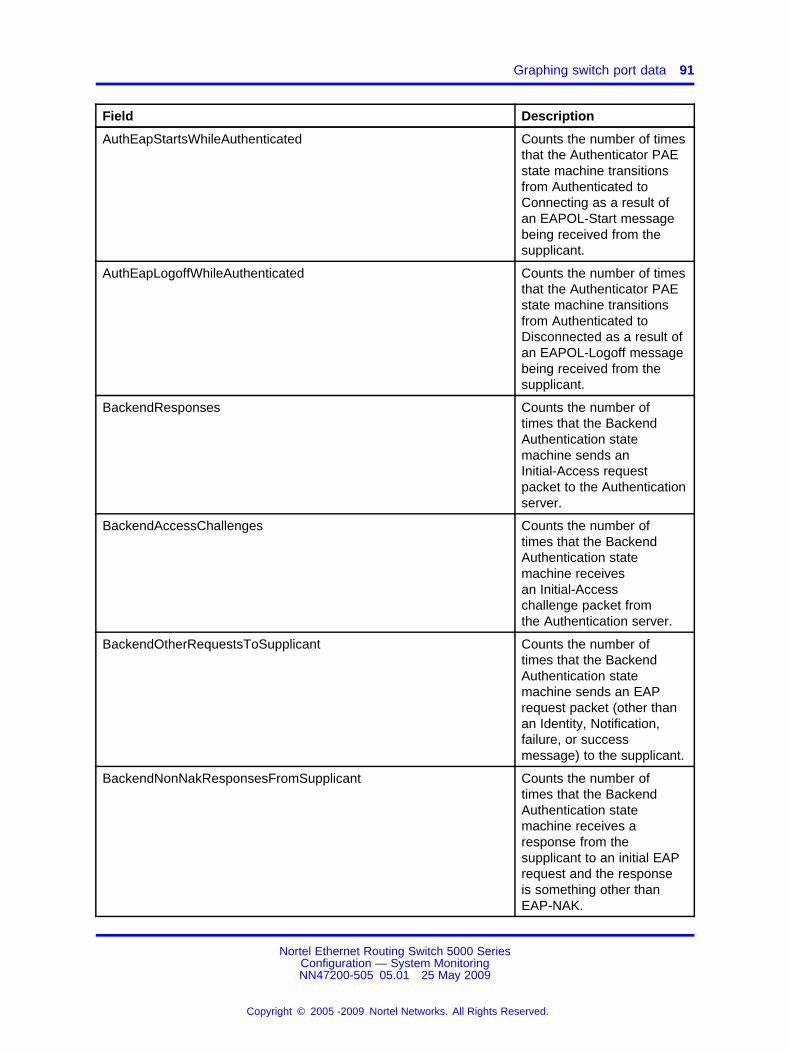
Graphing switch port data 91
Field Description
AuthEapStartsWhileAuthenticated Counts the number of timesthat the Authenticator PAEstate machine transitionsfrom Authenticated toConnecting as a result ofan EAPOL-Start messagebeing received from thesupplicant.
AuthEapLogoffWhileAuthenticated Counts the number of timesthat the Authenticator PAEstate machine transitionsfrom Authenticated toDisconnected as a result ofan EAPOL-Logoff messagebeing received from thesupplicant.
BackendResponses Counts the number oftimes that the BackendAuthentication statemachine sends anInitial-Access requestpacket to the Authenticationserver.
BackendAccessChallenges Counts the number oftimes that the BackendAuthentication statemachine receivesan Initial-Accesschallenge packet fromthe Authentication server.
BackendOtherRequestsToSupplicant Counts the number oftimes that the BackendAuthentication statemachine sends an EAPrequest packet (other thanan Identity, Notification,failure, or successmessage) to the supplicant.
BackendNonNakResponsesFromSupplicant Counts the number oftimes that the BackendAuthentication statemachine receives aresponse from thesupplicant to an initial EAPrequest and the responseis something other thanEAP-NAK.
Nortel Ethernet Routing Switch 5000 SeriesConfiguration — System MonitoringNN47200-505 05.01 25 May 2009
Copyright © 2005 -2009 Nortel Networks. All Rights Reserved.
.
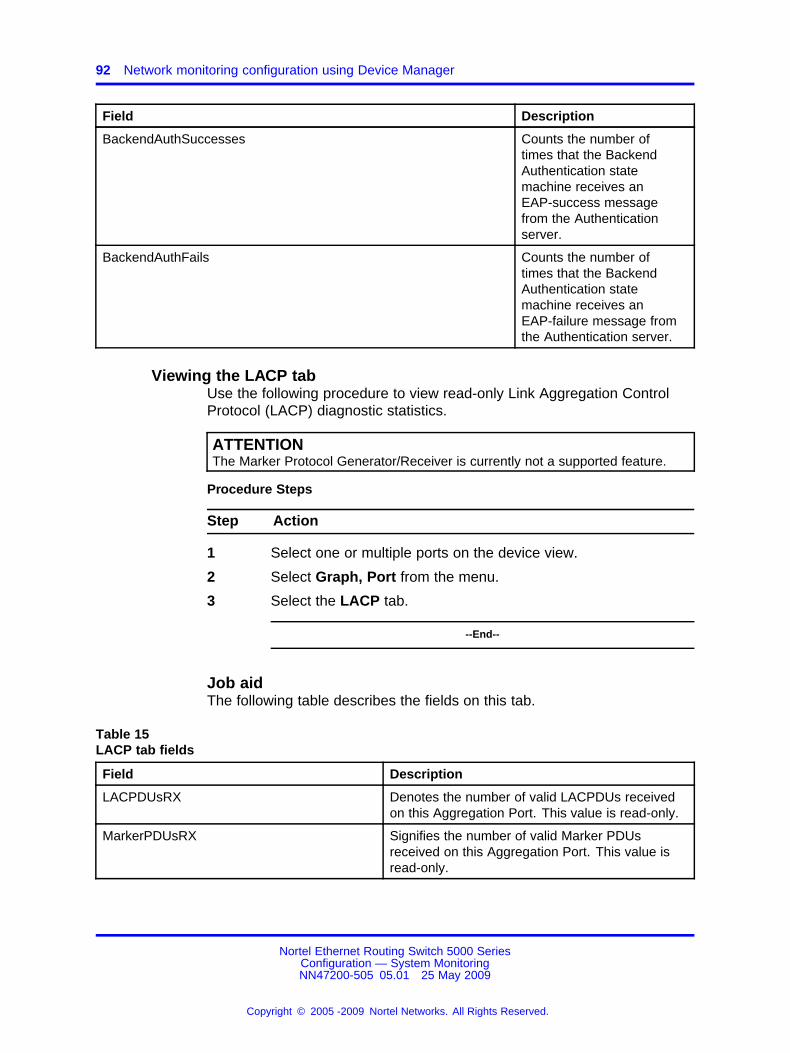
92 Network monitoring configuration using Device Manager
Field Description
BackendAuthSuccesses Counts the number oftimes that the BackendAuthentication statemachine receives anEAP-success messagefrom the Authenticationserver.
BackendAuthFails Counts the number oftimes that the BackendAuthentication statemachine receives anEAP-failure message fromthe Authentication server.
Viewing the LACP tabUse the following procedure to view read-only Link Aggregation ControlProtocol (LACP) diagnostic statistics.
ATTENTIONThe Marker Protocol Generator/Receiver is currently not a supported feature.
Procedure Steps
Step Action
1 Select one or multiple ports on the device view.
2 Select Graph, Port from the menu.
3 Select the LACP tab.
--End--
Job aidThe following table describes the fields on this tab.
Table 15LACP tab fields
Field Description
LACPDUsRX Denotes the number of valid LACPDUs receivedon this Aggregation Port. This value is read-only.
MarkerPDUsRX Signifies the number of valid Marker PDUsreceived on this Aggregation Port. This value isread-only.
Nortel Ethernet Routing Switch 5000 SeriesConfiguration — System MonitoringNN47200-505 05.01 25 May 2009
Copyright © 2005 -2009 Nortel Networks. All Rights Reserved.
.
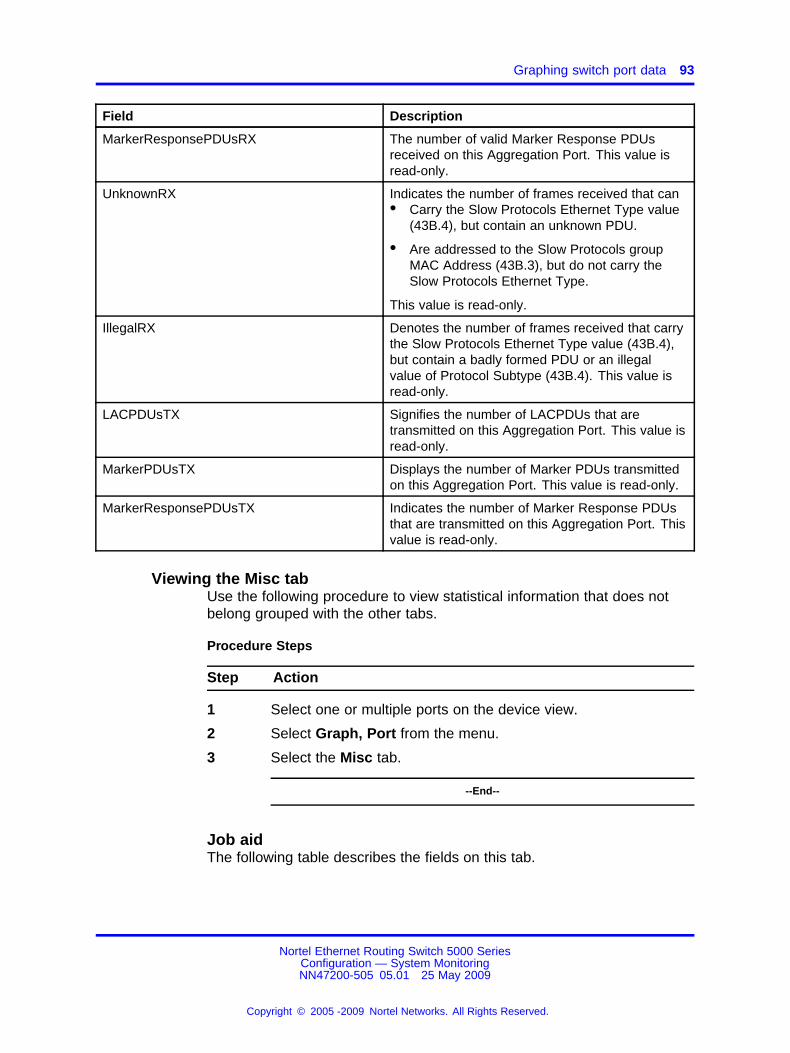
Graphing switch port data 93
Field Description
MarkerResponsePDUsRX The number of valid Marker Response PDUsreceived on this Aggregation Port. This value isread-only.
UnknownRX Indicates the number of frames received that can• Carry the Slow Protocols Ethernet Type value
(43B.4), but contain an unknown PDU.
• Are addressed to the Slow Protocols groupMAC Address (43B.3), but do not carry theSlow Protocols Ethernet Type.
This value is read-only.
IllegalRX Denotes the number of frames received that carrythe Slow Protocols Ethernet Type value (43B.4),but contain a badly formed PDU or an illegalvalue of Protocol Subtype (43B.4). This value isread-only.
LACPDUsTX Signifies the number of LACPDUs that aretransmitted on this Aggregation Port. This value isread-only.
MarkerPDUsTX Displays the number of Marker PDUs transmittedon this Aggregation Port. This value is read-only.
MarkerResponsePDUsTX Indicates the number of Marker Response PDUsthat are transmitted on this Aggregation Port. Thisvalue is read-only.
Viewing the Misc tabUse the following procedure to view statistical information that does notbelong grouped with the other tabs.
Procedure Steps
Step Action
1 Select one or multiple ports on the device view.
2 Select Graph, Port from the menu.
3 Select the Misc tab.
--End--
Job aidThe following table describes the fields on this tab.
Nortel Ethernet Routing Switch 5000 SeriesConfiguration — System MonitoringNN47200-505 05.01 25 May 2009
Copyright © 2005 -2009 Nortel Networks. All Rights Reserved.
.
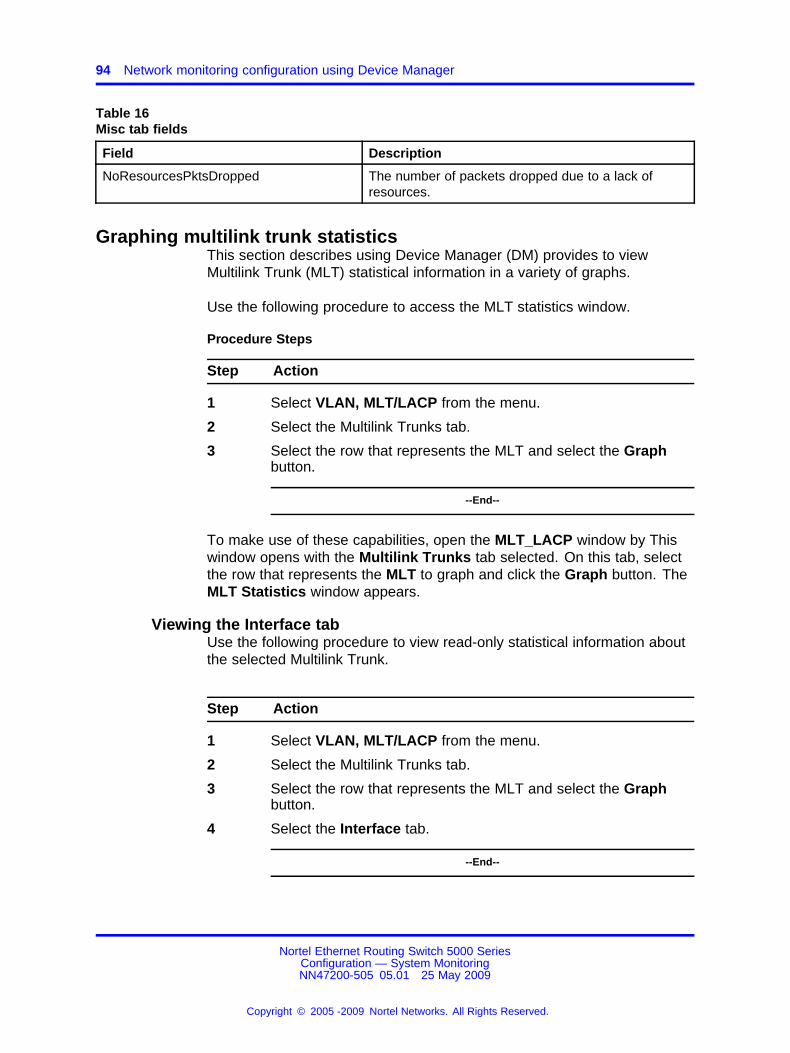
94 Network monitoring configuration using Device Manager
Table 16Misc tab fields
Field Description
NoResourcesPktsDropped The number of packets dropped due to a lack ofresources.
Graphing multilink trunk statisticsThis section describes using Device Manager (DM) provides to viewMultilink Trunk (MLT) statistical information in a variety of graphs.
Use the following procedure to access the MLT statistics window.
Procedure Steps
Step Action
1 Select VLAN, MLT/LACP from the menu.
2 Select the Multilink Trunks tab.
3 Select the row that represents the MLT and select the Graphbutton.
--End--
To make use of these capabilities, open the MLT_LACP window by Thiswindow opens with the Multilink Trunks tab selected. On this tab, selectthe row that represents the MLT to graph and click the Graph button. TheMLT Statistics window appears.
Viewing the Interface tabUse the following procedure to view read-only statistical information aboutthe selected Multilink Trunk.
Step Action
1 Select VLAN, MLT/LACP from the menu.
2 Select the Multilink Trunks tab.
3 Select the row that represents the MLT and select the Graphbutton.
4 Select the Interface tab.
--End--
Nortel Ethernet Routing Switch 5000 SeriesConfiguration — System MonitoringNN47200-505 05.01 25 May 2009
Copyright © 2005 -2009 Nortel Networks. All Rights Reserved.
.
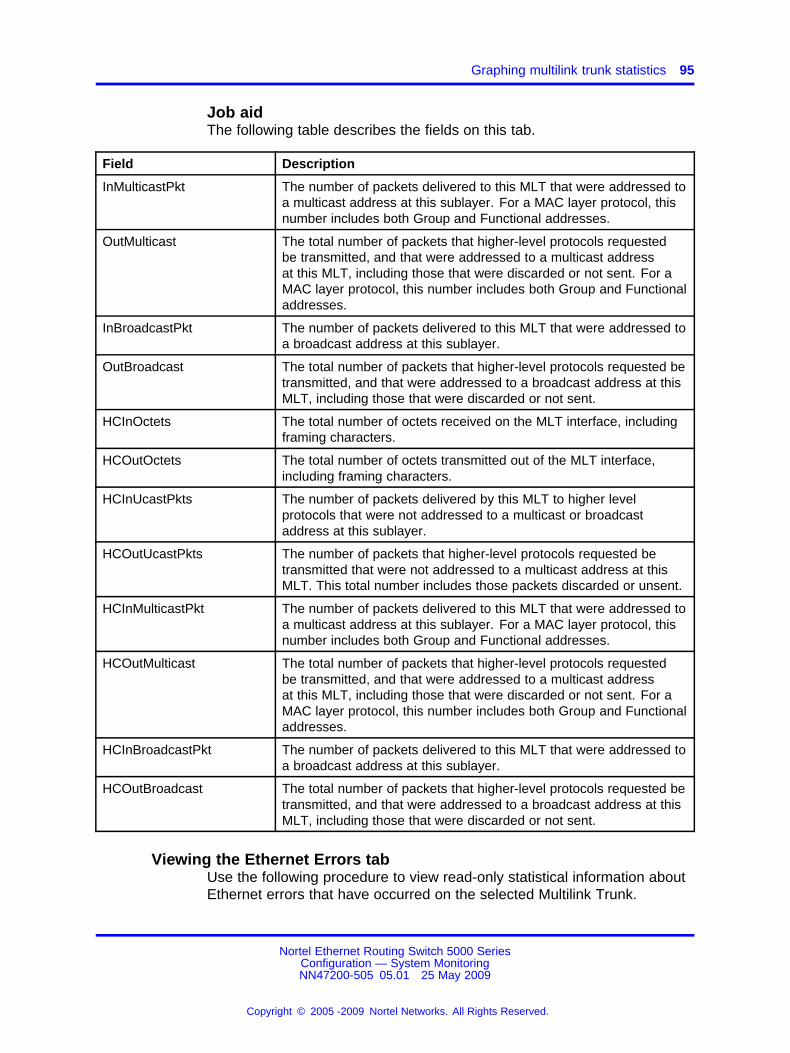
Graphing multilink trunk statistics 95
Job aidThe following table describes the fields on this tab.
Field Description
InMulticastPkt The number of packets delivered to this MLT that were addressed toa multicast address at this sublayer. For a MAC layer protocol, thisnumber includes both Group and Functional addresses.
OutMulticast The total number of packets that higher-level protocols requestedbe transmitted, and that were addressed to a multicast addressat this MLT, including those that were discarded or not sent. For aMAC layer protocol, this number includes both Group and Functionaladdresses.
InBroadcastPkt The number of packets delivered to this MLT that were addressed toa broadcast address at this sublayer.
OutBroadcast The total number of packets that higher-level protocols requested betransmitted, and that were addressed to a broadcast address at thisMLT, including those that were discarded or not sent.
HCInOctets The total number of octets received on the MLT interface, includingframing characters.
HCOutOctets The total number of octets transmitted out of the MLT interface,including framing characters.
HCInUcastPkts The number of packets delivered by this MLT to higher levelprotocols that were not addressed to a multicast or broadcastaddress at this sublayer.
HCOutUcastPkts The number of packets that higher-level protocols requested betransmitted that were not addressed to a multicast address at thisMLT. This total number includes those packets discarded or unsent.
HCInMulticastPkt The number of packets delivered to this MLT that were addressed toa multicast address at this sublayer. For a MAC layer protocol, thisnumber includes both Group and Functional addresses.
HCOutMulticast The total number of packets that higher-level protocols requestedbe transmitted, and that were addressed to a multicast addressat this MLT, including those that were discarded or not sent. For aMAC layer protocol, this number includes both Group and Functionaladdresses.
HCInBroadcastPkt The number of packets delivered to this MLT that were addressed toa broadcast address at this sublayer.
HCOutBroadcast The total number of packets that higher-level protocols requested betransmitted, and that were addressed to a broadcast address at thisMLT, including those that were discarded or not sent.
Viewing the Ethernet Errors tabUse the following procedure to view read-only statistical information aboutEthernet errors that have occurred on the selected Multilink Trunk.
Nortel Ethernet Routing Switch 5000 SeriesConfiguration — System MonitoringNN47200-505 05.01 25 May 2009
Copyright © 2005 -2009 Nortel Networks. All Rights Reserved.
.
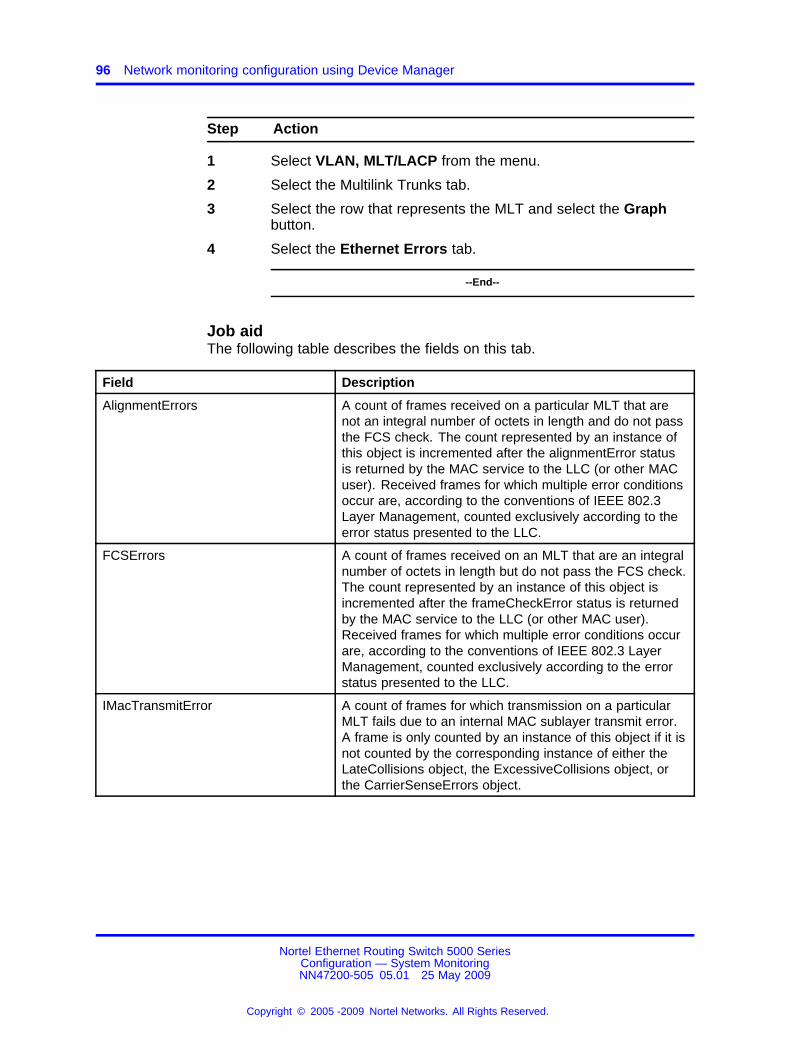
96 Network monitoring configuration using Device Manager
Step Action
1 Select VLAN, MLT/LACP from the menu.
2 Select the Multilink Trunks tab.
3 Select the row that represents the MLT and select the Graphbutton.
4 Select the Ethernet Errors tab.
--End--
Job aidThe following table describes the fields on this tab.
Field Description
AlignmentErrors A count of frames received on a particular MLT that arenot an integral number of octets in length and do not passthe FCS check. The count represented by an instance ofthis object is incremented after the alignmentError statusis returned by the MAC service to the LLC (or other MACuser). Received frames for which multiple error conditionsoccur are, according to the conventions of IEEE 802.3Layer Management, counted exclusively according to theerror status presented to the LLC.
FCSErrors A count of frames received on an MLT that are an integralnumber of octets in length but do not pass the FCS check.The count represented by an instance of this object isincremented after the frameCheckError status is returnedby the MAC service to the LLC (or other MAC user).Received frames for which multiple error conditions occurare, according to the conventions of IEEE 802.3 LayerManagement, counted exclusively according to the errorstatus presented to the LLC.
IMacTransmitError A count of frames for which transmission on a particularMLT fails due to an internal MAC sublayer transmit error.A frame is only counted by an instance of this object if it isnot counted by the corresponding instance of either theLateCollisions object, the ExcessiveCollisions object, orthe CarrierSenseErrors object.
Nortel Ethernet Routing Switch 5000 SeriesConfiguration — System MonitoringNN47200-505 05.01 25 May 2009
Copyright © 2005 -2009 Nortel Networks. All Rights Reserved.
.

Graphing multilink trunk statistics 97
Field Description
IMacReceiveError A count of frames for which reception on a particular MLTfails due to an internal MAC sublayer receive error. Aframe is only counted by an instance of this object if it isnot counted by the corresponding instance of either theFrameTooLongs object, the AlignmentErrors object, or theFCSErrors object.
The precise meaning of the count represented by aninstance of this object is implementation specific. Inparticular, an instance of this object may represent a countof receive errors on a particular interface that are nototherwise counted.
CarrierSenseErrors The number of times that the carrier sense conditionwas lost or never asserted after attempting to transmita frame on a particular MLT. The count represented byan instance of this object is incriminated at most oncefor each transmission attempt, even if the carrier sensecondition fluctuates during a transmission attempt.
FrameTooLong A count of frames received on a particular MLT thatexceed the maximum permitted frame size. The countrepresented by an instance of this object is incrementedafter the frameTooLong status is returned by the MACservice to the LLC (or other MAC user). Received framesfor which multiple error conditions occur are, accordingto the conventions of IEEE 802.3 Layer Management,counted exclusively according to the error statuspresented to the LLC.
SQETestError A count of times that the SQE TEST ERROR messageis generated by the PLS sublayer for a particular MLT.The SQE TEST ERROR message is defined in section7.2.2.2.4 of ANSI/IEEE 802.3-1985 and its generation isdescribed in section 7.2.4.6 of the same document.
DeferredTransmiss A count of frames for which the first transmission attempton a particular MLT is delayed because the medium isbusy. The count represented by an instance of this objectdoes not include frames involved in collisions.
SingleCollFrames A count of successfully transmitted frames on a particularMLT for which transmission is inhibited by exactlyone collision. A frame that is counted by an instanceof this object is also counted by the correspondinginstance of either the ifOutUcastPkts, ifOutMulticastPkts,or ifOutBroadcastPkts, and is not counted by thecorresponding instance of the MultipleCollisionFramesobject.
Nortel Ethernet Routing Switch 5000 SeriesConfiguration — System MonitoringNN47200-505 05.01 25 May 2009
Copyright © 2005 -2009 Nortel Networks. All Rights Reserved.
.
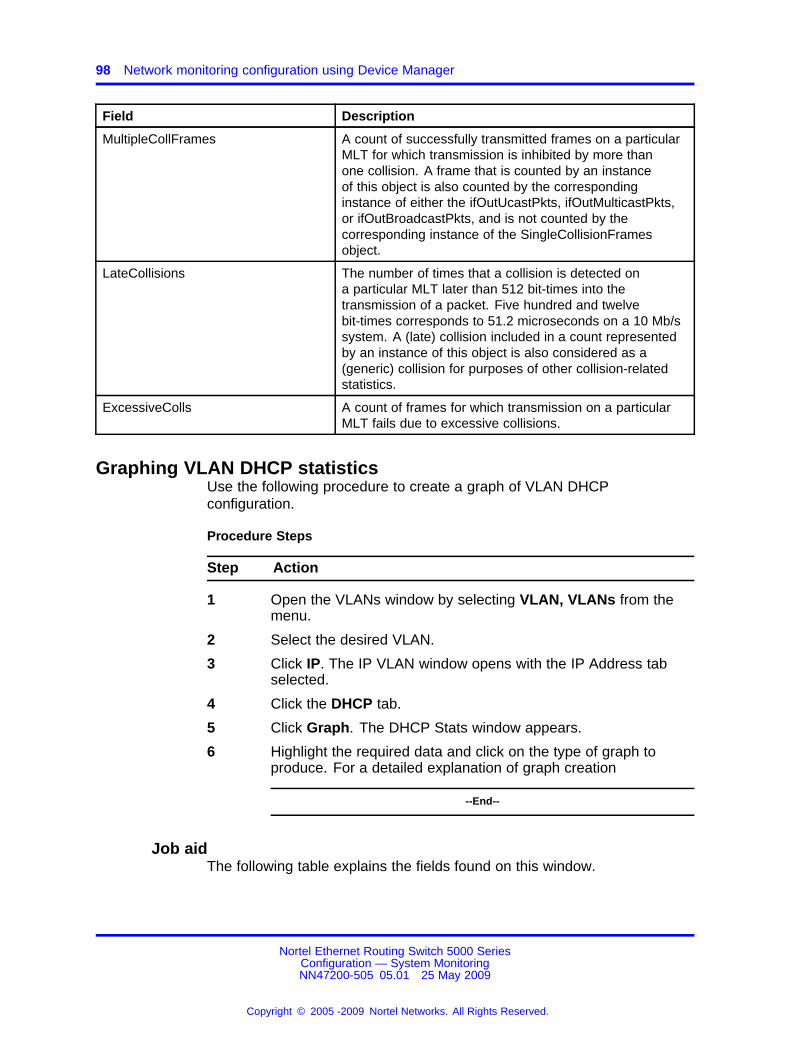
98 Network monitoring configuration using Device Manager
Field Description
MultipleCollFrames A count of successfully transmitted frames on a particularMLT for which transmission is inhibited by more thanone collision. A frame that is counted by an instanceof this object is also counted by the correspondinginstance of either the ifOutUcastPkts, ifOutMulticastPkts,or ifOutBroadcastPkts, and is not counted by thecorresponding instance of the SingleCollisionFramesobject.
LateCollisions The number of times that a collision is detected ona particular MLT later than 512 bit-times into thetransmission of a packet. Five hundred and twelvebit-times corresponds to 51.2 microseconds on a 10 Mb/ssystem. A (late) collision included in a count representedby an instance of this object is also considered as a(generic) collision for purposes of other collision-relatedstatistics.
ExcessiveColls A count of frames for which transmission on a particularMLT fails due to excessive collisions.
Graphing VLAN DHCP statisticsUse the following procedure to create a graph of VLAN DHCPconfiguration.
Procedure Steps
Step Action
1 Open the VLANs window by selecting VLAN, VLANs from themenu.
2 Select the desired VLAN.
3 Click IP. The IP VLAN window opens with the IP Address tabselected.
4 Click the DHCP tab.
5 Click Graph. The DHCP Stats window appears.
6 Highlight the required data and click on the type of graph toproduce. For a detailed explanation of graph creation
--End--
Job aidThe following table explains the fields found on this window.
Nortel Ethernet Routing Switch 5000 SeriesConfiguration — System MonitoringNN47200-505 05.01 25 May 2009
Copyright © 2005 -2009 Nortel Networks. All Rights Reserved.
.

Viewing unit statistics 99
Field Description
NumRequests The number of DHCP requests handled.
NumReplies The number of DHCP replies handled.
Viewing unit statisticsUse this procedure to view the statistical information of a unit.
Procedure 4Procedure steps
Step Action
1 Select a unit on the device view.
2 Select Edit > Unit from the menu.
3 Select the Unit Stats tab.
--End--
Job aidThe following table describes the fields in this tab.
Field Description
Absolute Value The counter value of packets dropped for the unit.
Cumulative The total value of packets dropped seen since dialog displayed.
Average/sec The average value of packets dropped per second.
Minimum/sec The smallest value of packets dropped seen per second.
Maximum/sec The largest value of packets dropped seen per second.
LastVal/sec The last value of packets dropped seen per second.
Nortel Ethernet Routing Switch 5000 SeriesConfiguration — System MonitoringNN47200-505 05.01 25 May 2009
Copyright © 2005 -2009 Nortel Networks. All Rights Reserved.
.
100 Network monitoring configuration using Device Manager
Nortel Ethernet Routing Switch 5000 SeriesConfiguration — System MonitoringNN47200-505 05.01 25 May 2009
Copyright © 2005 -2009 Nortel Networks. All Rights Reserved.
.

101.
Network monitoring configurationusing Web-based management
Viewing CPU and memory utilizationUse this procedure to display both CPU and memory utilization.
Procedure Steps
Step Action
1 Open Web-based management
2 Navigate to Administration, CPU / Memory Utilization
3 Observe the displayed CPU and memory utilization in thewindow.
--End--
Job aidThe following table describes the fields in the window.
Field Description
From System Boot-Up CPU utilization since system boot-up
Last 10 Seconds CPU utilization for the last 10 seconds
Last 1 Minute CPU utilization for the last minute
Last 10 Minutes CPU utilization for the last 10 minutes
Last 60 Minutes CPU utilization for the last 60 minutes
Last 24 Hours CPU utilization for the last 24 hours
Total Total memory in the device
Used Amount of memory in use
Free Amount of memory available
Nortel Ethernet Routing Switch 5000 SeriesConfiguration — System MonitoringNN47200-505 05.01 25 May 2009
Copyright © 2005 -2009 Nortel Networks. All Rights Reserved.
.
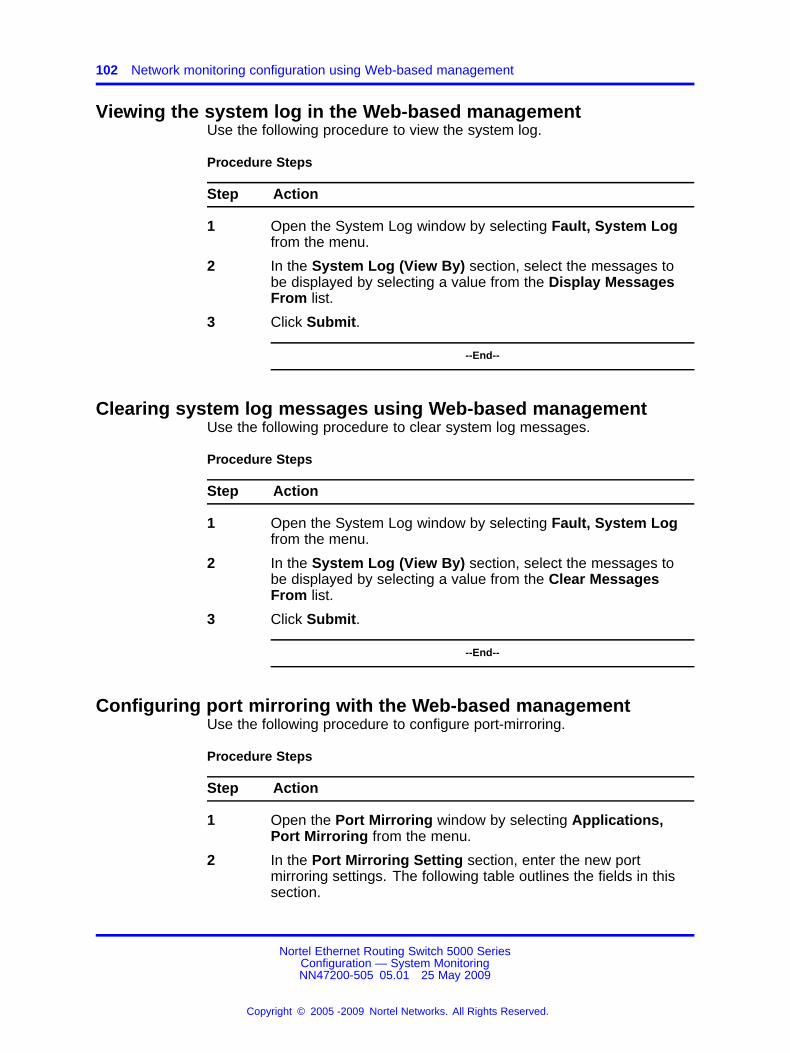
102 Network monitoring configuration using Web-based management
Viewing the system log in the Web-based managementUse the following procedure to view the system log.
Procedure Steps
Step Action
1 Open the System Log window by selecting Fault, System Logfrom the menu.
2 In the System Log (View By) section, select the messages tobe displayed by selecting a value from the Display MessagesFrom list.
3 Click Submit.
--End--
Clearing system log messages using Web-based managementUse the following procedure to clear system log messages.
Procedure Steps
Step Action
1 Open the System Log window by selecting Fault, System Logfrom the menu.
2 In the System Log (View By) section, select the messages tobe displayed by selecting a value from the Clear MessagesFrom list.
3 Click Submit.
--End--
Configuring port mirroring with the Web-based managementUse the following procedure to configure port-mirroring.
Procedure Steps
Step Action
1 Open the Port Mirroring window by selecting Applications,Port Mirroring from the menu.
2 In the Port Mirroring Setting section, enter the new portmirroring settings. The following table outlines the fields in thissection.
Nortel Ethernet Routing Switch 5000 SeriesConfiguration — System MonitoringNN47200-505 05.01 25 May 2009
Copyright © 2005 -2009 Nortel Networks. All Rights Reserved.
.
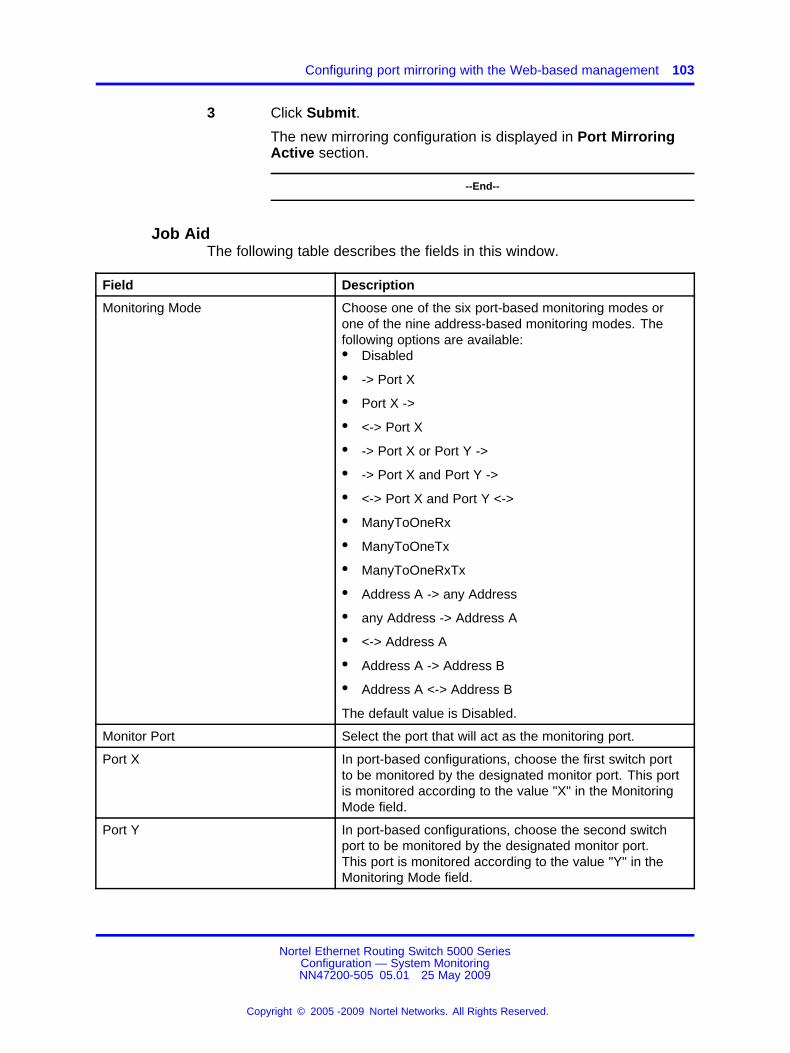
Configuring port mirroring with the Web-based management 103
3 Click Submit.
The new mirroring configuration is displayed in Port MirroringActive section.
--End--
Job AidThe following table describes the fields in this window.
Field Description
Monitoring Mode Choose one of the six port-based monitoring modes orone of the nine address-based monitoring modes. Thefollowing options are available:• Disabled
• -> Port X
• Port X ->
• <-> Port X
• -> Port X or Port Y ->
• -> Port X and Port Y ->
• <-> Port X and Port Y <->
• ManyToOneRx
• ManyToOneTx
• ManyToOneRxTx
• Address A -> any Address
• any Address -> Address A
• <-> Address A
• Address A -> Address B
• Address A <-> Address B
The default value is Disabled.
Monitor Port Select the port that will act as the monitoring port.
Port X In port-based configurations, choose the first switch portto be monitored by the designated monitor port. This portis monitored according to the value "X" in the MonitoringMode field.
Port Y In port-based configurations, choose the second switchport to be monitored by the designated monitor port.This port is monitored according to the value "Y" in theMonitoring Mode field.
Nortel Ethernet Routing Switch 5000 SeriesConfiguration — System MonitoringNN47200-505 05.01 25 May 2009
Copyright © 2005 -2009 Nortel Networks. All Rights Reserved.
.

104 Network monitoring configuration using Web-based management
Field Description
Address A In address-based configurations, type the MAC addressto monitor by the designated monitor port. This addressis monitored according to the value "Address A" in theMonitoring Mode field.
Address B In address-based configurations, type the MAC addressto monitor by the designated monitor port. This addressis monitored according to the value "Address B" in theMonitoring Mode field.
Using the MIB Web page for SNMP Get and Get-NextUse the following procedure to retrieve the value of a SNMP object byname or OID.
Step Action
1 Navigate to the Administration, Mib Web Page window.
2 Enter the object name or OID in the SNMP Object Name/ OIDfield.
3 Click the Get button.
4 Observe the information displayed in the Result area of thewindow.
5 Click the Get Next button to retrieve the information of the nextobject in the MIB.
6 Observe the information displayed in the Result area of thewindow. Repeat this step for as long as required.
--End--
Using the MIB Web page for SNMP walkUse the following procedure to retrieve the value of a SNMP object byname or OID.
Step Action
1 Navigate to the Administration, SNMP Mib Walk window.
2 Enter the object name or OID in the SNMP Object Name/ OIDfield.
3 Click the Walk button.
4 Observe the information displayed in the Result area of thewindow.
Nortel Ethernet Routing Switch 5000 SeriesConfiguration — System MonitoringNN47200-505 05.01 25 May 2009
Copyright © 2005 -2009 Nortel Networks. All Rights Reserved.
.

Using the trap Web page to identify trap receivers 105
5 Click Next or Previous to view the next or previous twelveobjects in the MIB.
--End--
Using the trap Web page to identify trap receiversUse the following procedure to identify the trap receivers.
Configuring traps using the Trap Web Page
Step Action
1 Navigate to Configuration, SNMP Trap to view the SNMP trappage.
2 In the Trap Web Page area, select the trap receiver you wishto view.
3 Enable or disable the traps as required.
4 Click the Submit button.
--End--
Nortel Ethernet Routing Switch 5000 SeriesConfiguration — System MonitoringNN47200-505 05.01 25 May 2009
Copyright © 2005 -2009 Nortel Networks. All Rights Reserved.
.

106 Network monitoring configuration using Web-based management
Nortel Ethernet Routing Switch 5000 SeriesConfiguration — System MonitoringNN47200-505 05.01 25 May 2009
Copyright © 2005 -2009 Nortel Networks. All Rights Reserved.
.

107.
RMON configuration using NNCLI
Configuring RMON with the NNCLIThis section describes the NNCLI commands used to configure andmanage RMON.
Viewing RMON alarmsUse the following procedure to view RMON alarms.
Procedure Steps
Step Action
1 Enter Privileged Executive mode.
2 Use the show rmon alarm command to display informationabout RMON alarms.
--End--
Viewing RMON eventsUse the following procedure to display information regarding RMONevents.
Procedure Steps
Step Action
1 Enter Privileged Executive mode.
2 Enter the show rmon event command.
--End--
Viewing RMON historyUse this procedure to display information regarding the configuration ofRMON history.
Nortel Ethernet Routing Switch 5000 SeriesConfiguration — System MonitoringNN47200-505 05.01 25 May 2009
Copyright © 2005 -2009 Nortel Networks. All Rights Reserved.
.
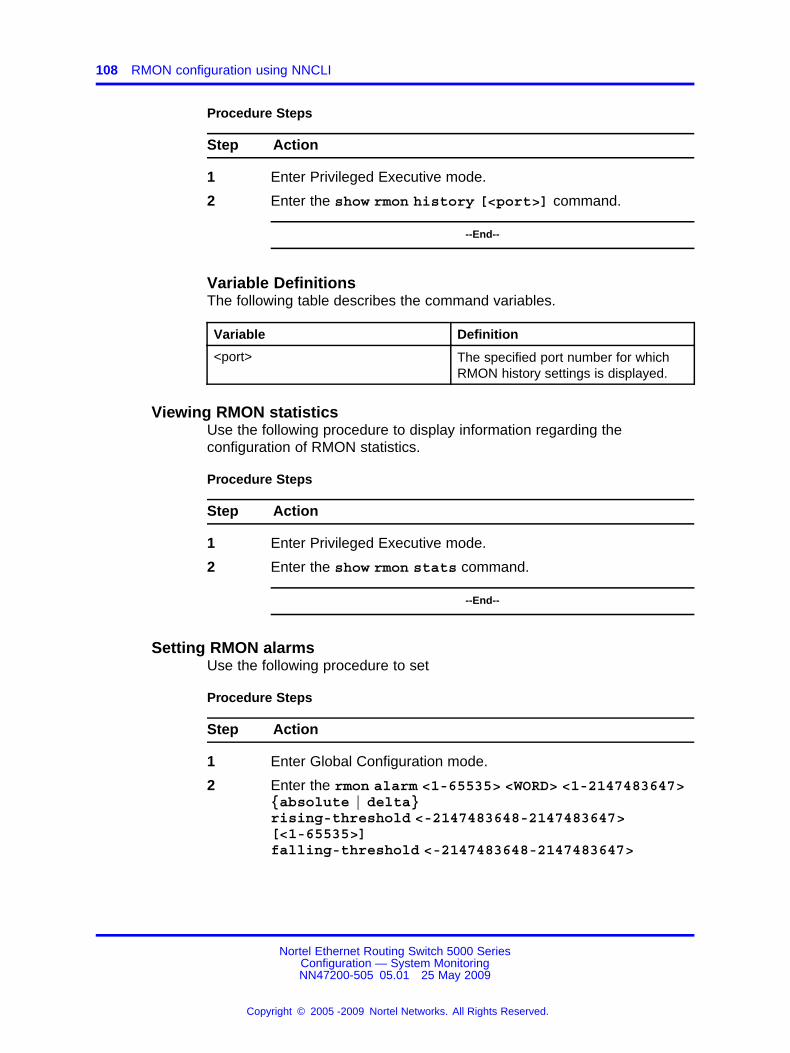
108 RMON configuration using NNCLI
Procedure Steps
Step Action
1 Enter Privileged Executive mode.
2 Enter the show rmon history [<port>] command.
--End--
Variable DefinitionsThe following table describes the command variables.
Variable Definition
<port> The specified port number for whichRMON history settings is displayed.
Viewing RMON statisticsUse the following procedure to display information regarding theconfiguration of RMON statistics.
Procedure Steps
Step Action
1 Enter Privileged Executive mode.
2 Enter the show rmon stats command.
--End--
Setting RMON alarmsUse the following procedure to set
Procedure Steps
Step Action
1 Enter Global Configuration mode.
2 Enter the rmon alarm <1-65535> <WORD> <1-2147483647>{absolute | delta}rising-threshold <-2147483648-2147483647>[<1-65535>]falling-threshold <-2147483648-2147483647>
Nortel Ethernet Routing Switch 5000 SeriesConfiguration — System MonitoringNN47200-505 05.01 25 May 2009
Copyright © 2005 -2009 Nortel Networks. All Rights Reserved.
.
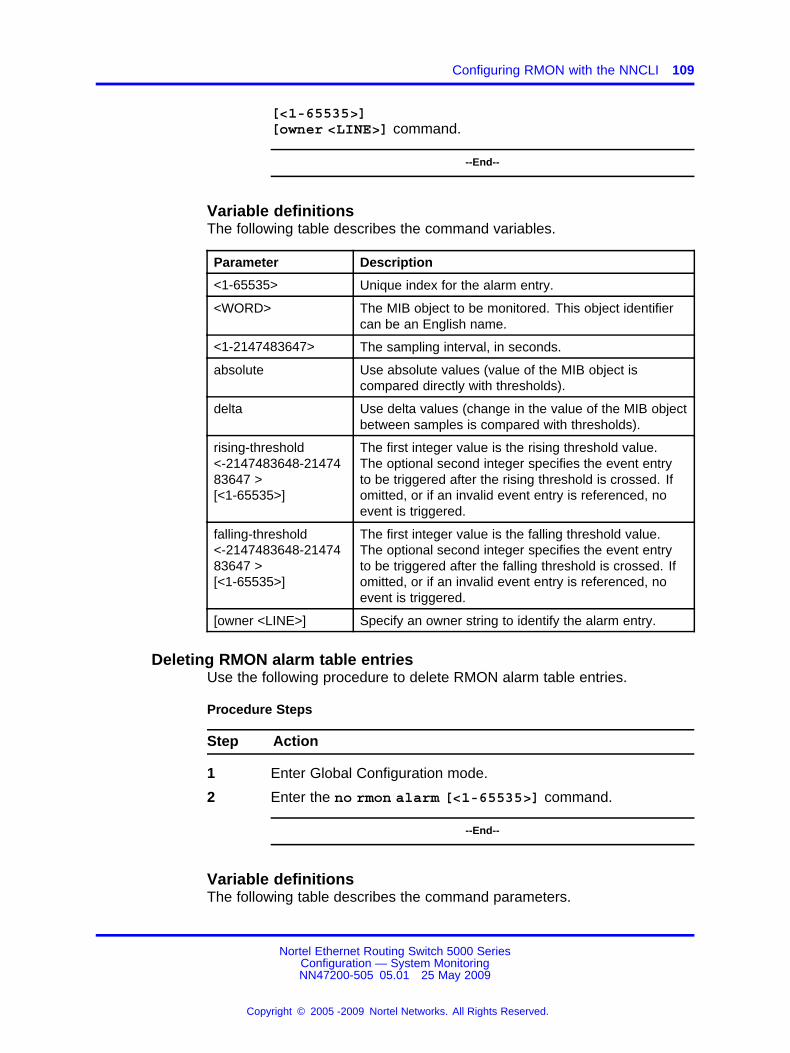
Configuring RMON with the NNCLI 109
[<1-65535>][owner <LINE>] command.
--End--
Variable definitionsThe following table describes the command variables.
Parameter Description
<1-65535> Unique index for the alarm entry.
<WORD> The MIB object to be monitored. This object identifiercan be an English name.
<1-2147483647> The sampling interval, in seconds.
absolute Use absolute values (value of the MIB object iscompared directly with thresholds).
delta Use delta values (change in the value of the MIB objectbetween samples is compared with thresholds).
rising-threshold<-2147483648-2147483647 >[<1-65535>]
The first integer value is the rising threshold value.The optional second integer specifies the event entryto be triggered after the rising threshold is crossed. Ifomitted, or if an invalid event entry is referenced, noevent is triggered.
falling-threshold<-2147483648-2147483647 >[<1-65535>]
The first integer value is the falling threshold value.The optional second integer specifies the event entryto be triggered after the falling threshold is crossed. Ifomitted, or if an invalid event entry is referenced, noevent is triggered.
[owner <LINE>] Specify an owner string to identify the alarm entry.
Deleting RMON alarm table entriesUse the following procedure to delete RMON alarm table entries.
Procedure Steps
Step Action
1 Enter Global Configuration mode.
2 Enter the no rmon alarm [<1-65535>] command.
--End--
Variable definitionsThe following table describes the command parameters.
Nortel Ethernet Routing Switch 5000 SeriesConfiguration — System MonitoringNN47200-505 05.01 25 May 2009
Copyright © 2005 -2009 Nortel Networks. All Rights Reserved.
.
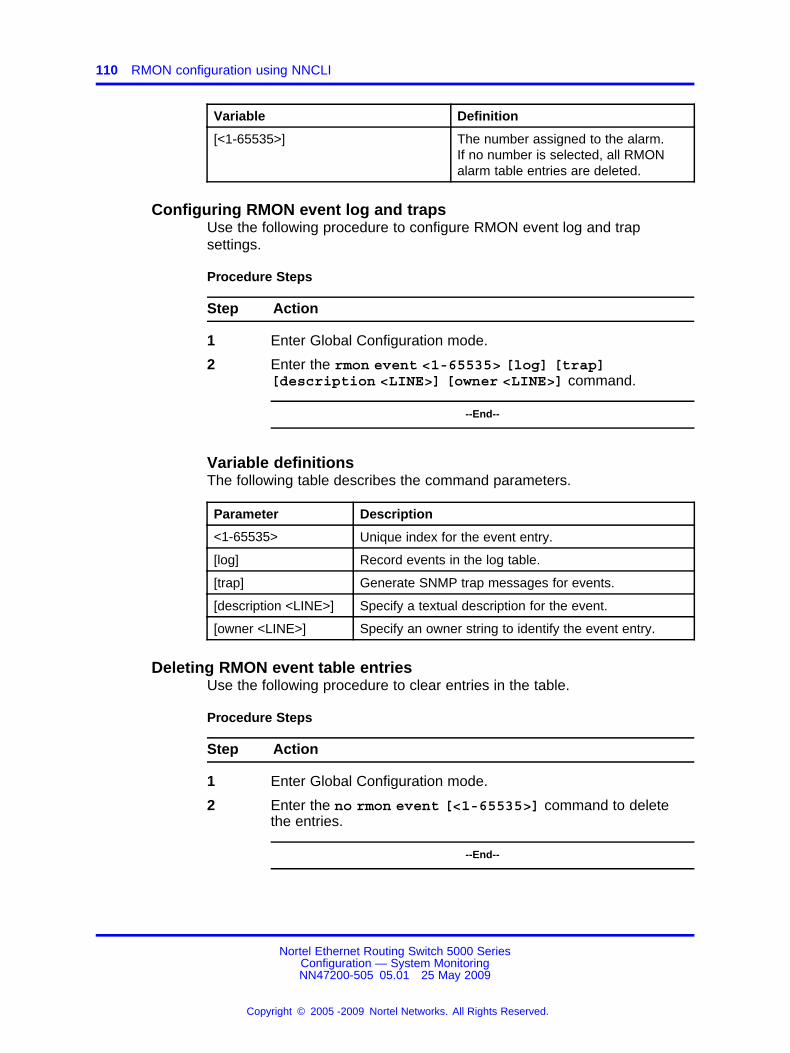
110 RMON configuration using NNCLI
Variable Definition
[<1-65535>] The number assigned to the alarm.If no number is selected, all RMONalarm table entries are deleted.
Configuring RMON event log and trapsUse the following procedure to configure RMON event log and trapsettings.
Procedure Steps
Step Action
1 Enter Global Configuration mode.
2 Enter the rmon event <1-65535> [log] [trap][description <LINE>] [owner <LINE>] command.
--End--
Variable definitionsThe following table describes the command parameters.
Parameter Description
<1-65535> Unique index for the event entry.
[log] Record events in the log table.
[trap] Generate SNMP trap messages for events.
[description <LINE>] Specify a textual description for the event.
[owner <LINE>] Specify an owner string to identify the event entry.
Deleting RMON event table entriesUse the following procedure to clear entries in the table.
Procedure Steps
Step Action
1 Enter Global Configuration mode.
2 Enter the no rmon event [<1-65535>] command to deletethe entries.
--End--
Nortel Ethernet Routing Switch 5000 SeriesConfiguration — System MonitoringNN47200-505 05.01 25 May 2009
Copyright © 2005 -2009 Nortel Networks. All Rights Reserved.
.
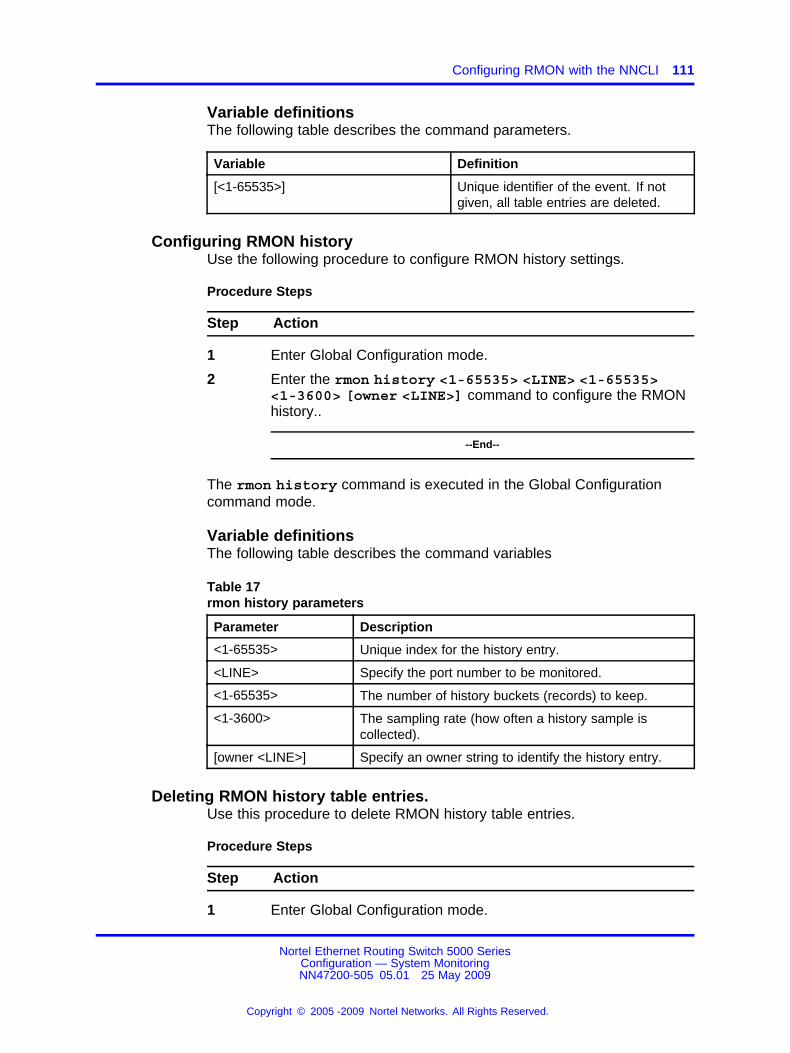
Configuring RMON with the NNCLI 111
Variable definitionsThe following table describes the command parameters.
Variable Definition
[<1-65535>] Unique identifier of the event. If notgiven, all table entries are deleted.
Configuring RMON historyUse the following procedure to configure RMON history settings.
Procedure Steps
Step Action
1 Enter Global Configuration mode.
2 Enter the rmon history <1-65535> <LINE> <1-65535><1-3600> [owner <LINE>] command to configure the RMONhistory..
--End--
The rmon history command is executed in the Global Configurationcommand mode.
Variable definitionsThe following table describes the command variables
Table 17rmon history parameters
Parameter Description
<1-65535> Unique index for the history entry.
<LINE> Specify the port number to be monitored.
<1-65535> The number of history buckets (records) to keep.
<1-3600> The sampling rate (how often a history sample iscollected).
[owner <LINE>] Specify an owner string to identify the history entry.
Deleting RMON history table entries.Use this procedure to delete RMON history table entries.
Procedure Steps
Step Action
1 Enter Global Configuration mode.
Nortel Ethernet Routing Switch 5000 SeriesConfiguration — System MonitoringNN47200-505 05.01 25 May 2009
Copyright © 2005 -2009 Nortel Networks. All Rights Reserved.
.
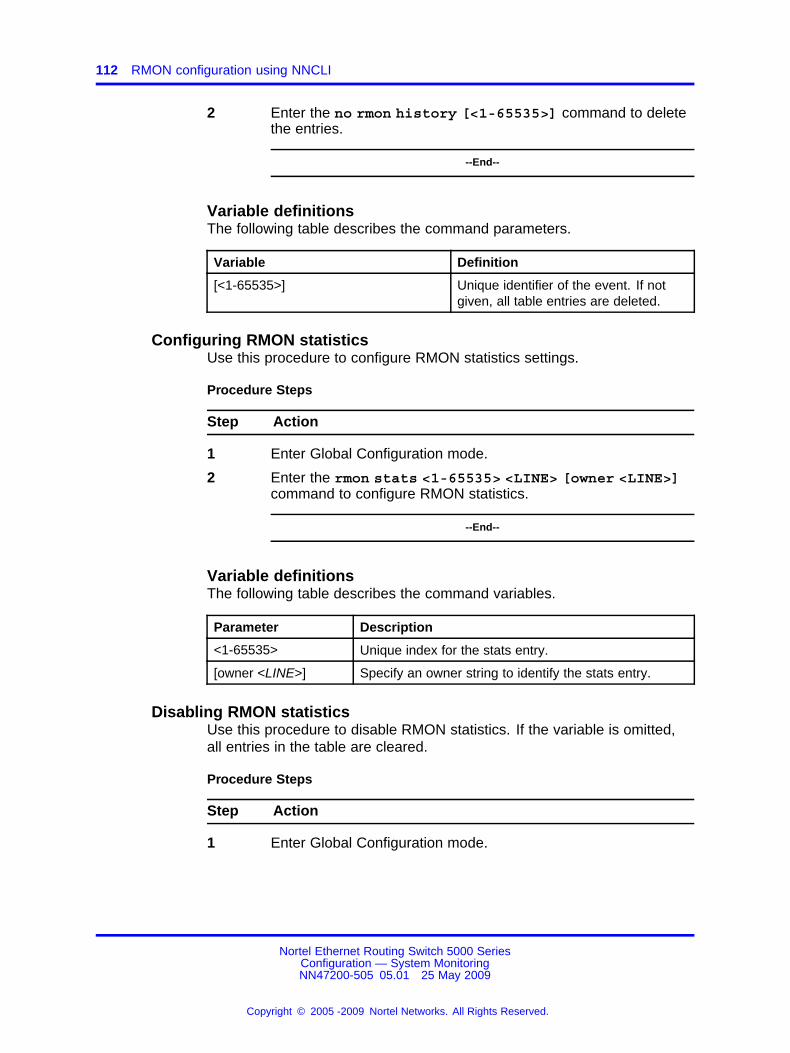
112 RMON configuration using NNCLI
2 Enter the no rmon history [<1-65535>] command to deletethe entries.
--End--
Variable definitionsThe following table describes the command parameters.
Variable Definition
[<1-65535>] Unique identifier of the event. If notgiven, all table entries are deleted.
Configuring RMON statisticsUse this procedure to configure RMON statistics settings.
Procedure Steps
Step Action
1 Enter Global Configuration mode.
2 Enter the rmon stats <1-65535> <LINE> [owner <LINE>]command to configure RMON statistics.
--End--
Variable definitionsThe following table describes the command variables.
Parameter Description
<1-65535> Unique index for the stats entry.
[owner <LINE>] Specify an owner string to identify the stats entry.
Disabling RMON statisticsUse this procedure to disable RMON statistics. If the variable is omitted,all entries in the table are cleared.
Procedure Steps
Step Action
1 Enter Global Configuration mode.
Nortel Ethernet Routing Switch 5000 SeriesConfiguration — System MonitoringNN47200-505 05.01 25 May 2009
Copyright © 2005 -2009 Nortel Networks. All Rights Reserved.
.
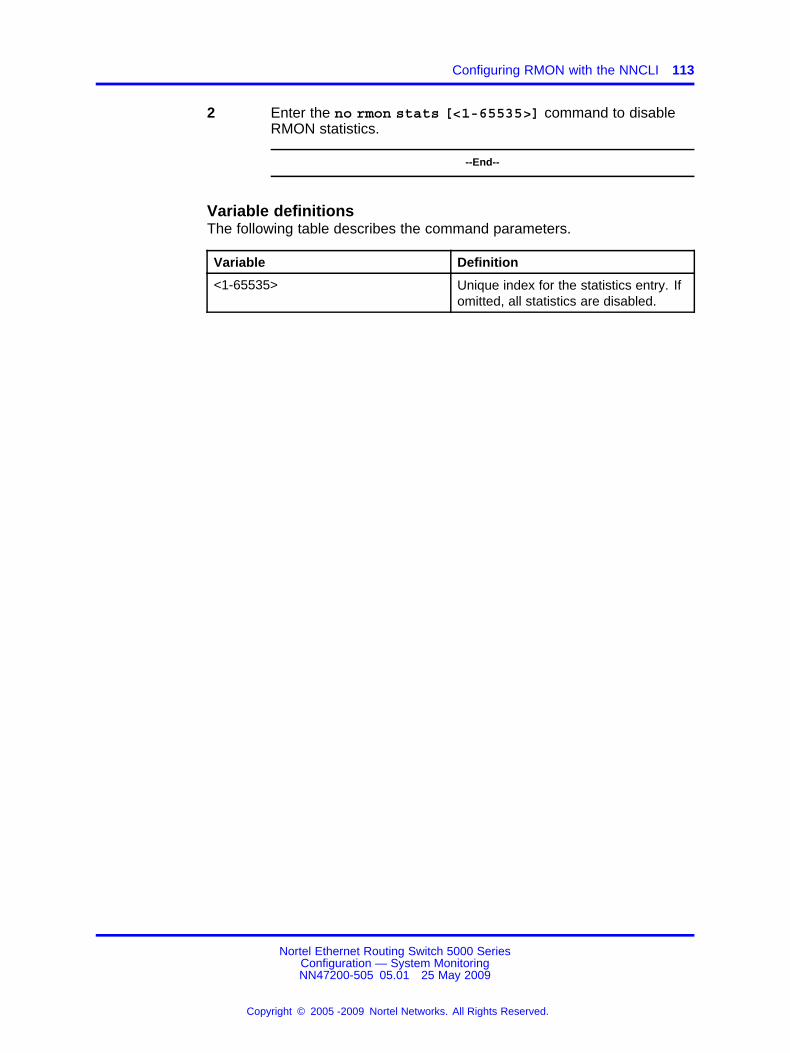
Configuring RMON with the NNCLI 113
2 Enter the no rmon stats [<1-65535>] command to disableRMON statistics.
--End--
Variable definitionsThe following table describes the command parameters.
Variable Definition
<1-65535> Unique index for the statistics entry. Ifomitted, all statistics are disabled.
Nortel Ethernet Routing Switch 5000 SeriesConfiguration — System MonitoringNN47200-505 05.01 25 May 2009
Copyright © 2005 -2009 Nortel Networks. All Rights Reserved.
.

114 RMON configuration using NNCLI
Nortel Ethernet Routing Switch 5000 SeriesConfiguration — System MonitoringNN47200-505 05.01 25 May 2009
Copyright © 2005 -2009 Nortel Networks. All Rights Reserved.
.
115.
RMON configuration using DeviceManager
Configuring RMON with the Device ManagerThis section describes the configuration and management of RMON usingDevice Manager.
Working with RMON informationRMON information is viewed by looking at the graphing informationassociated with the port or chassis.
Viewing statisticsThe DM gathers Ethernet statistics that can be graphed in a variety offormats or saved to a file that can be exported to an outside presentationor graphing application.
To view RMON ethernet statistics:
Procedure Steps
Step Action
1 Select a port.
2 Do one of the following:
a From the shortcut menu, choose Graph.
b Select Graph, Port from the menu.
c On the toolbar, click the Graph button.
3 The Graph Port window appears. Click the RMON tab.
--End--
Job Aid The following table describes the fields on the RMON tab.
Nortel Ethernet Routing Switch 5000 SeriesConfiguration — System MonitoringNN47200-505 05.01 25 May 2009
Copyright © 2005 -2009 Nortel Networks. All Rights Reserved.
.

116 RMON configuration using Device Manager
Field Descriptions
Octets The total number of octets of data (including those in bad packets)received on the network (excluding framing bits but includingFCS octets). You can use this object as a reasonable estimate ofEthernet utilization. For greater precision, sample the etherStatsPktsand etherStatsOctets objects before and after a common interval.
Pkts The total number of packets (including bad packets, broadcastpackets, and multicast packets) received.
BroadcastPkts The total number of good packets received that were directed to thebroadcast address. This does not include multicast packets.
MulticastPkts The total number of good packets received that were directed to amulticast address. This number does not include packets directedto the broadcast address.
CRCAlignErrors The total number of packets received that had a length (excludingframing bits, but including FCS octets) of between 64 and 1518octets, inclusive, but had either a bad Frame Check Sequence(FCS) with an integral number of octets (FCS Error) or a bad FCSwith a nonintegral number of octets (Alignment Error).
UndersizePkts The total number of packets received that were less than 64 octetslong (excluding framing bits but including FCS octets) and wereotherwise well formed.
OversizePkts The total number of packets received that were longer than 1518octets (excluding framing bits but including FCS octets) and wereotherwise well formed.
Fragments The total number of packets received that were less than 64 octetsin length (excluding framing bits but including FCS octets) and hadeither a bad Frame Check Sequence (FCS) with an integral numberof octets (FCS Error) or a bad FCS with a nonintegral number ofoctets (Alignment Error). Normal behavior for etherStatsFragmentsis to increment because it counts both runts (which are normaloccurrences due to collisions) and noise hits.
Collisions The best estimate of the total number of collisions on this Ethernetsegment.
Jabbers The total number of packets received that were longer than 1518octets (excluding framing bits, but including FCS octets), and hadeither a bad Frame Check Sequence (FCS) with an integral numberof octets (FCS Error) or a bad FCS with a non-integral number ofoctets (Alignment Error). Jabber is defined as the condition wherea packet exceeds 20 ms. The allowed range to detect jabber isbetween 20 ms and 150 ms.
1..64 The total number of packets (including bad packets) that weretransmitted and received on this port between 1 and 64 octets inlength (excluding framing bits but including FCS octets).
Nortel Ethernet Routing Switch 5000 SeriesConfiguration — System MonitoringNN47200-505 05.01 25 May 2009
Copyright © 2005 -2009 Nortel Networks. All Rights Reserved.
.
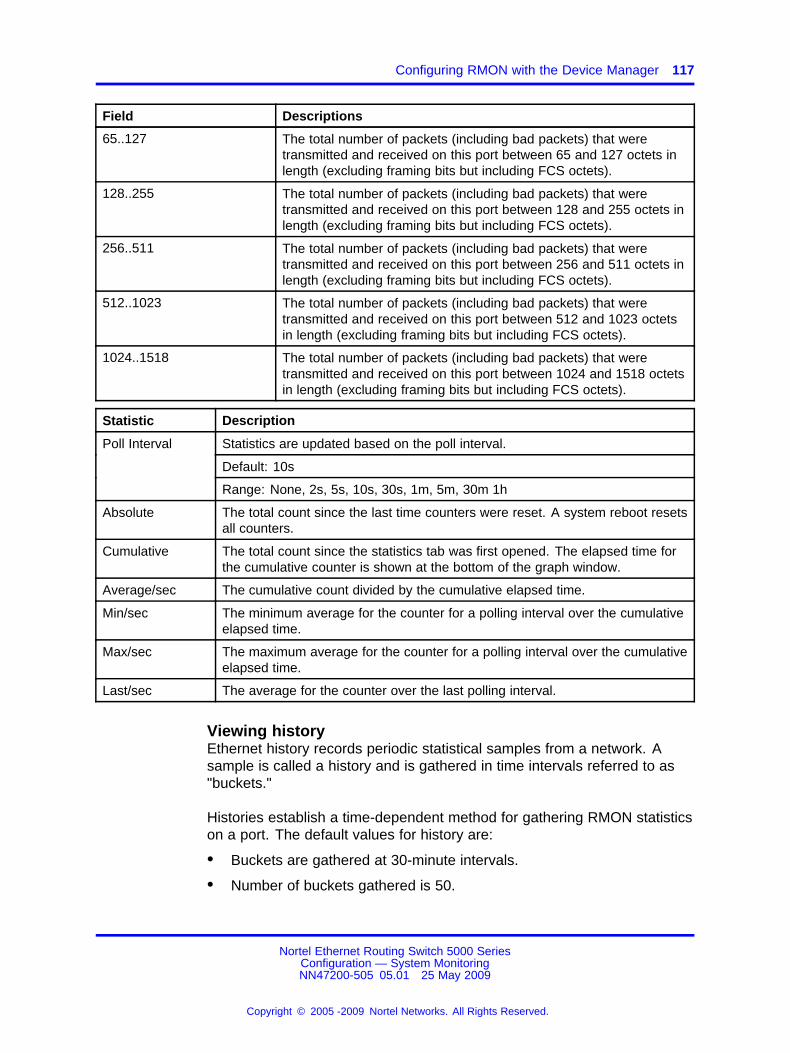
Configuring RMON with the Device Manager 117
Field Descriptions
65..127 The total number of packets (including bad packets) that weretransmitted and received on this port between 65 and 127 octets inlength (excluding framing bits but including FCS octets).
128..255 The total number of packets (including bad packets) that weretransmitted and received on this port between 128 and 255 octets inlength (excluding framing bits but including FCS octets).
256..511 The total number of packets (including bad packets) that weretransmitted and received on this port between 256 and 511 octets inlength (excluding framing bits but including FCS octets).
512..1023 The total number of packets (including bad packets) that weretransmitted and received on this port between 512 and 1023 octetsin length (excluding framing bits but including FCS octets).
1024..1518 The total number of packets (including bad packets) that weretransmitted and received on this port between 1024 and 1518 octetsin length (excluding framing bits but including FCS octets).
Statistic Description
Statistics are updated based on the poll interval.
Default: 10s
Poll Interval
Range: None, 2s, 5s, 10s, 30s, 1m, 5m, 30m 1h
Absolute The total count since the last time counters were reset. A system reboot resetsall counters.
Cumulative The total count since the statistics tab was first opened. The elapsed time forthe cumulative counter is shown at the bottom of the graph window.
Average/sec The cumulative count divided by the cumulative elapsed time.
Min/sec The minimum average for the counter for a polling interval over the cumulativeelapsed time.
Max/sec The maximum average for the counter for a polling interval over the cumulativeelapsed time.
Last/sec The average for the counter over the last polling interval.
Viewing historyEthernet history records periodic statistical samples from a network. Asample is called a history and is gathered in time intervals referred to as"buckets."
Histories establish a time-dependent method for gathering RMON statisticson a port. The default values for history are:
• Buckets are gathered at 30-minute intervals.
• Number of buckets gathered is 50.
Nortel Ethernet Routing Switch 5000 SeriesConfiguration — System MonitoringNN47200-505 05.01 25 May 2009
Copyright © 2005 -2009 Nortel Networks. All Rights Reserved.
.
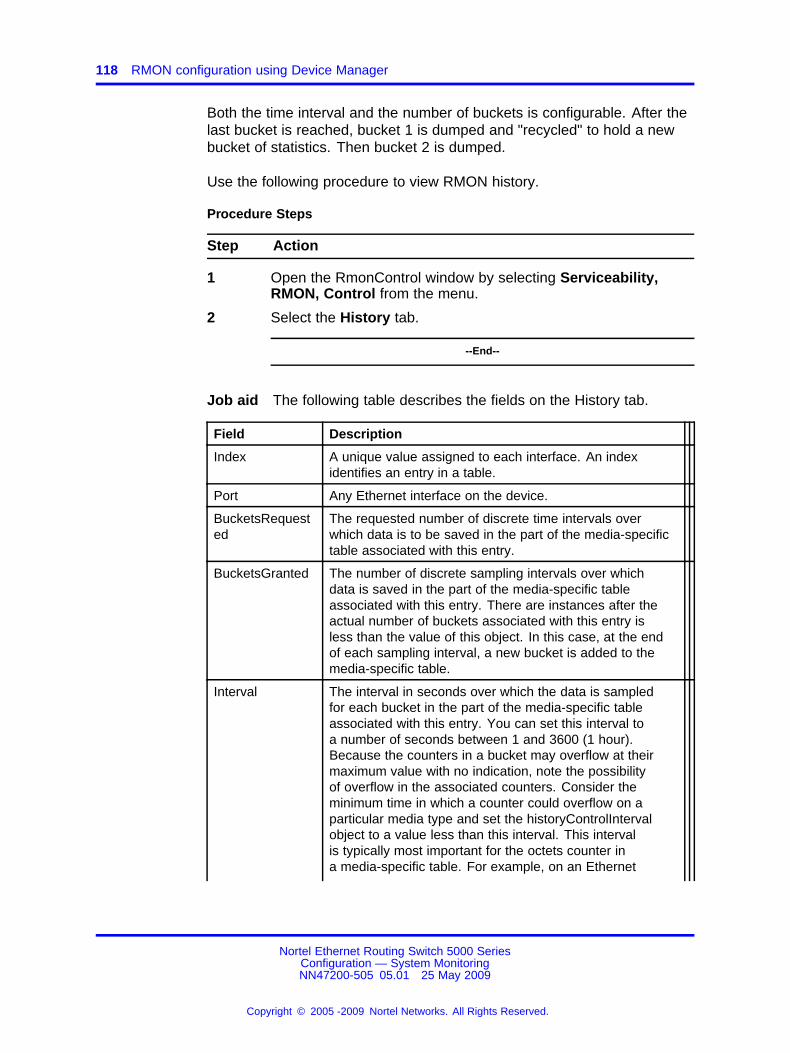
118 RMON configuration using Device Manager
Both the time interval and the number of buckets is configurable. After thelast bucket is reached, bucket 1 is dumped and "recycled" to hold a newbucket of statistics. Then bucket 2 is dumped.
Use the following procedure to view RMON history.
Procedure Steps
Step Action
1 Open the RmonControl window by selecting Serviceability,RMON, Control from the menu.
2 Select the History tab.
--End--
Job aid The following table describes the fields on the History tab.
Field Description
Index A unique value assigned to each interface. An indexidentifies an entry in a table.
Port Any Ethernet interface on the device.
BucketsRequested
The requested number of discrete time intervals overwhich data is to be saved in the part of the media-specifictable associated with this entry.
BucketsGranted The number of discrete sampling intervals over whichdata is saved in the part of the media-specific tableassociated with this entry. There are instances after theactual number of buckets associated with this entry isless than the value of this object. In this case, at the endof each sampling interval, a new bucket is added to themedia-specific table.
Interval The interval in seconds over which the data is sampledfor each bucket in the part of the media-specific tableassociated with this entry. You can set this interval toa number of seconds between 1 and 3600 (1 hour).Because the counters in a bucket may overflow at theirmaximum value with no indication, note the possibilityof overflow in the associated counters. Consider theminimum time in which a counter could overflow on aparticular media type and set the historyControlIntervalobject to a value less than this interval. This intervalis typically most important for the octets counter ina media-specific table. For example, on an Ethernet
Nortel Ethernet Routing Switch 5000 SeriesConfiguration — System MonitoringNN47200-505 05.01 25 May 2009
Copyright © 2005 -2009 Nortel Networks. All Rights Reserved.
.
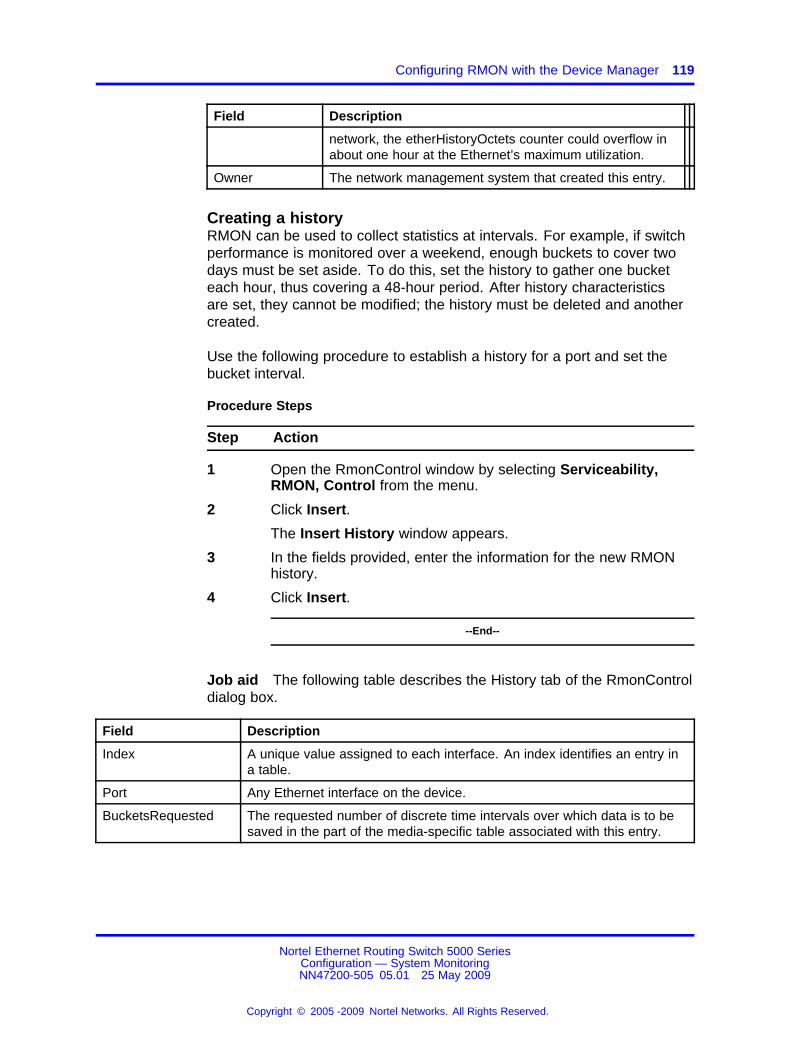
Configuring RMON with the Device Manager 119
Field Description
network, the etherHistoryOctets counter could overflow inabout one hour at the Ethernet’s maximum utilization.
Owner The network management system that created this entry.
Creating a historyRMON can be used to collect statistics at intervals. For example, if switchperformance is monitored over a weekend, enough buckets to cover twodays must be set aside. To do this, set the history to gather one bucketeach hour, thus covering a 48-hour period. After history characteristicsare set, they cannot be modified; the history must be deleted and anothercreated.
Use the following procedure to establish a history for a port and set thebucket interval.
Procedure Steps
Step Action
1 Open the RmonControl window by selecting Serviceability,RMON, Control from the menu.
2 Click Insert.
The Insert History window appears.
3 In the fields provided, enter the information for the new RMONhistory.
4 Click Insert.
--End--
Job aid The following table describes the History tab of the RmonControldialog box.
Field Description
Index A unique value assigned to each interface. An index identifies an entry ina table.
Port Any Ethernet interface on the device.
BucketsRequested The requested number of discrete time intervals over which data is to besaved in the part of the media-specific table associated with this entry.
Nortel Ethernet Routing Switch 5000 SeriesConfiguration — System MonitoringNN47200-505 05.01 25 May 2009
Copyright © 2005 -2009 Nortel Networks. All Rights Reserved.
.
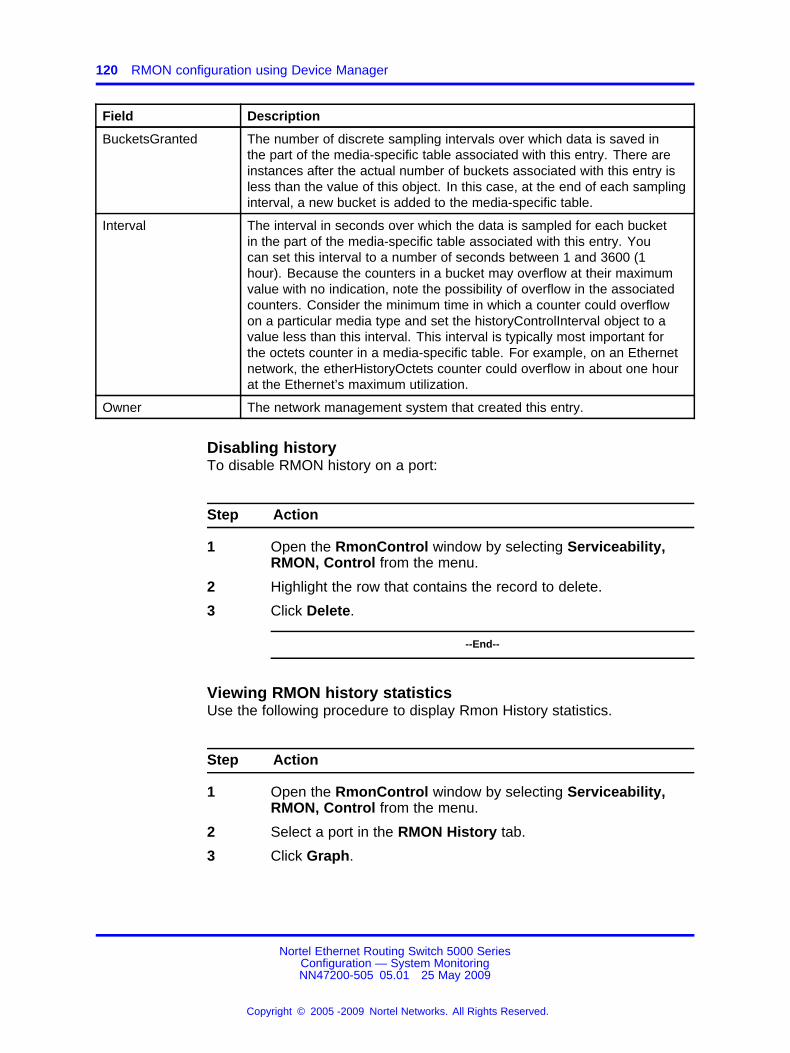
120 RMON configuration using Device Manager
Field Description
BucketsGranted The number of discrete sampling intervals over which data is saved inthe part of the media-specific table associated with this entry. There areinstances after the actual number of buckets associated with this entry isless than the value of this object. In this case, at the end of each samplinginterval, a new bucket is added to the media-specific table.
Interval The interval in seconds over which the data is sampled for each bucketin the part of the media-specific table associated with this entry. Youcan set this interval to a number of seconds between 1 and 3600 (1hour). Because the counters in a bucket may overflow at their maximumvalue with no indication, note the possibility of overflow in the associatedcounters. Consider the minimum time in which a counter could overflowon a particular media type and set the historyControlInterval object to avalue less than this interval. This interval is typically most important forthe octets counter in a media-specific table. For example, on an Ethernetnetwork, the etherHistoryOctets counter could overflow in about one hourat the Ethernet’s maximum utilization.
Owner The network management system that created this entry.
Disabling historyTo disable RMON history on a port:
Step Action
1 Open the RmonControl window by selecting Serviceability,RMON, Control from the menu.
2 Highlight the row that contains the record to delete.
3 Click Delete.
--End--
Viewing RMON history statisticsUse the following procedure to display Rmon History statistics.
Step Action
1 Open the RmonControl window by selecting Serviceability,RMON, Control from the menu.
2 Select a port in the RMON History tab.
3 Click Graph.
Nortel Ethernet Routing Switch 5000 SeriesConfiguration — System MonitoringNN47200-505 05.01 25 May 2009
Copyright © 2005 -2009 Nortel Networks. All Rights Reserved.
.
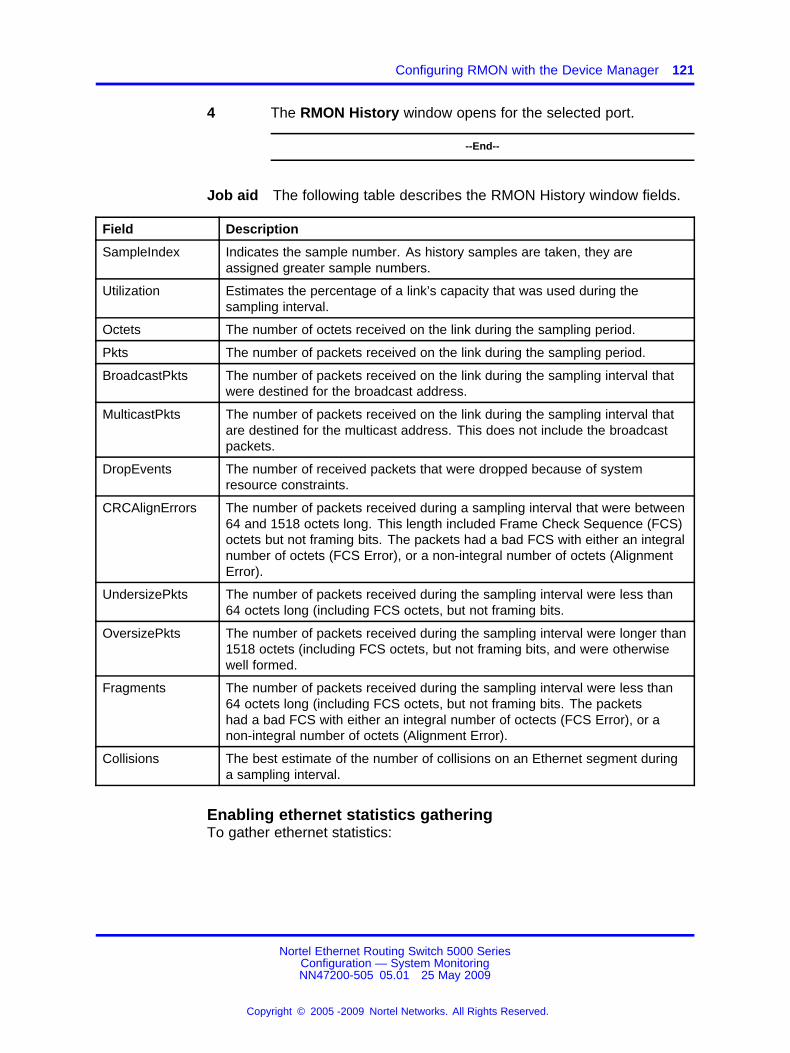
Configuring RMON with the Device Manager 121
4 The RMON History window opens for the selected port.
--End--
Job aid The following table describes the RMON History window fields.
Field Description
SampleIndex Indicates the sample number. As history samples are taken, they areassigned greater sample numbers.
Utilization Estimates the percentage of a link’s capacity that was used during thesampling interval.
Octets The number of octets received on the link during the sampling period.
Pkts The number of packets received on the link during the sampling period.
BroadcastPkts The number of packets received on the link during the sampling interval thatwere destined for the broadcast address.
MulticastPkts The number of packets received on the link during the sampling interval thatare destined for the multicast address. This does not include the broadcastpackets.
DropEvents The number of received packets that were dropped because of systemresource constraints.
CRCAlignErrors The number of packets received during a sampling interval that were between64 and 1518 octets long. This length included Frame Check Sequence (FCS)octets but not framing bits. The packets had a bad FCS with either an integralnumber of octets (FCS Error), or a non-integral number of octets (AlignmentError).
UndersizePkts The number of packets received during the sampling interval were less than64 octets long (including FCS octets, but not framing bits.
OversizePkts The number of packets received during the sampling interval were longer than1518 octets (including FCS octets, but not framing bits, and were otherwisewell formed.
Fragments The number of packets received during the sampling interval were less than64 octets long (including FCS octets, but not framing bits. The packetshad a bad FCS with either an integral number of octects (FCS Error), or anon-integral number of octets (Alignment Error).
Collisions The best estimate of the number of collisions on an Ethernet segment duringa sampling interval.
Enabling ethernet statistics gatheringTo gather ethernet statistics:
Nortel Ethernet Routing Switch 5000 SeriesConfiguration — System MonitoringNN47200-505 05.01 25 May 2009
Copyright © 2005 -2009 Nortel Networks. All Rights Reserved.
.
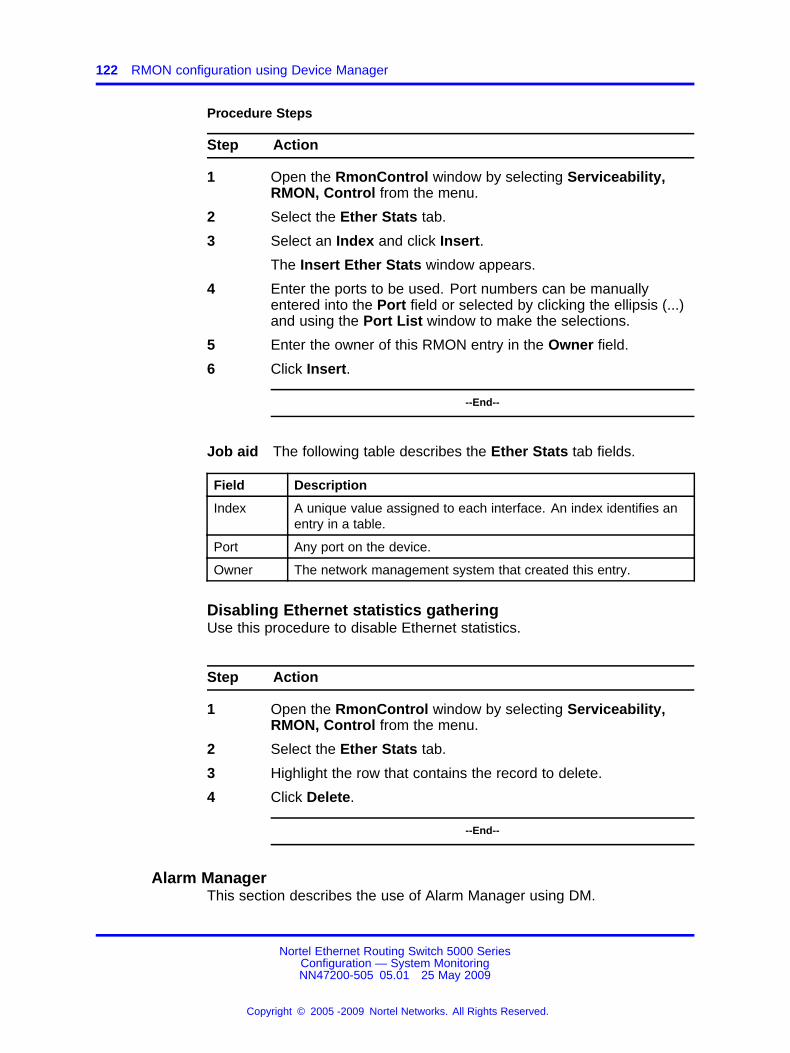
122 RMON configuration using Device Manager
Procedure Steps
Step Action
1 Open the RmonControl window by selecting Serviceability,RMON, Control from the menu.
2 Select the Ether Stats tab.
3 Select an Index and click Insert.
The Insert Ether Stats window appears.
4 Enter the ports to be used. Port numbers can be manuallyentered into the Port field or selected by clicking the ellipsis (...)and using the Port List window to make the selections.
5 Enter the owner of this RMON entry in the Owner field.
6 Click Insert.
--End--
Job aid The following table describes the Ether Stats tab fields.
Field Description
Index A unique value assigned to each interface. An index identifies anentry in a table.
Port Any port on the device.
Owner The network management system that created this entry.
Disabling Ethernet statistics gatheringUse this procedure to disable Ethernet statistics.
Step Action
1 Open the RmonControl window by selecting Serviceability,RMON, Control from the menu.
2 Select the Ether Stats tab.
3 Highlight the row that contains the record to delete.
4 Click Delete.
--End--
Alarm ManagerThis section describes the use of Alarm Manager using DM.
Nortel Ethernet Routing Switch 5000 SeriesConfiguration — System MonitoringNN47200-505 05.01 25 May 2009
Copyright © 2005 -2009 Nortel Networks. All Rights Reserved.
.

Configuring RMON with the Device Manager 123
Creating an AlarmUse the following procedure to create an alarm to receive statistics andhistory using default values.
Step Action
1 Selecting Serviceability, RMON, Alarm Manager from themenu.
2 In the Variable field, select a variable and a port (or other ID)from the list to set the alarm.
Alarm variables are in three formats, depending on the type:
• A chassis alarm ends in .x where the x index is hard-coded.No further information is required.
• A card, spanning tree group (STG) or EtherStat alarmends with a dot (.). A card number, STG ID, IP address, orEtherStat information must be entered.
• A port alarm ends with no dot or index and requires using theport shortcut menu. An example of a port alarm is ifInOctets(interface incoming octet count).
3 In the remaining fields, enter the information for the alarm.
4 Click Insert.
--End--
Job aid The following table describes the RMON Insert Alarm dialogbox fields.
Table 18RMON Insert Alarm dialog box fields
Field Description
Variable Name and type of alarm--indicated by the format:
alarmname.x where x=0 indicates a chassis alarm.
alarmname. where the user must specify the index. This index is a cardnumber for module-related alarms, an STG ID for spanning tree group alarms(the default STG is 1, other STG IDs are user-configured), or the EtherStatistics Control Index for RMON Stats alarms
alarmname with no dot or index is a port-related alarm and results in display ofthe port selection tool.
Nortel Ethernet Routing Switch 5000 SeriesConfiguration — System MonitoringNN47200-505 05.01 25 May 2009
Copyright © 2005 -2009 Nortel Networks. All Rights Reserved.
.
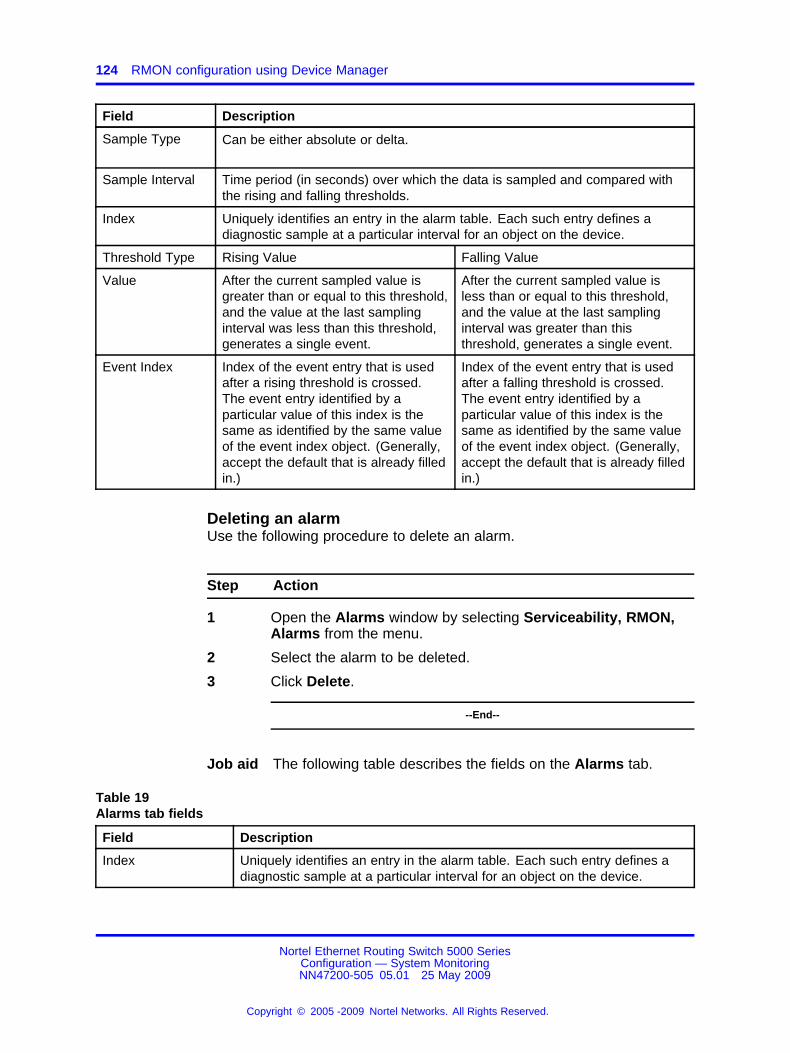
124 RMON configuration using Device Manager
Field Description
Sample Type Can be either absolute or delta.
Sample Interval Time period (in seconds) over which the data is sampled and compared withthe rising and falling thresholds.
Index Uniquely identifies an entry in the alarm table. Each such entry defines adiagnostic sample at a particular interval for an object on the device.
Threshold Type Rising Value Falling Value
Value After the current sampled value isgreater than or equal to this threshold,and the value at the last samplinginterval was less than this threshold,generates a single event.
After the current sampled value isless than or equal to this threshold,and the value at the last samplinginterval was greater than thisthreshold, generates a single event.
Event Index Index of the event entry that is usedafter a rising threshold is crossed.The event entry identified by aparticular value of this index is thesame as identified by the same valueof the event index object. (Generally,accept the default that is already filledin.)
Index of the event entry that is usedafter a falling threshold is crossed.The event entry identified by aparticular value of this index is thesame as identified by the same valueof the event index object. (Generally,accept the default that is already filledin.)
Deleting an alarmUse the following procedure to delete an alarm.
Step Action
1 Open the Alarms window by selecting Serviceability, RMON,Alarms from the menu.
2 Select the alarm to be deleted.
3 Click Delete.
--End--
Job aid The following table describes the fields on the Alarms tab.
Table 19Alarms tab fields
Field Description
Index Uniquely identifies an entry in the alarm table. Each such entry defines adiagnostic sample at a particular interval for an object on the device.
Nortel Ethernet Routing Switch 5000 SeriesConfiguration — System MonitoringNN47200-505 05.01 25 May 2009
Copyright © 2005 -2009 Nortel Networks. All Rights Reserved.
.
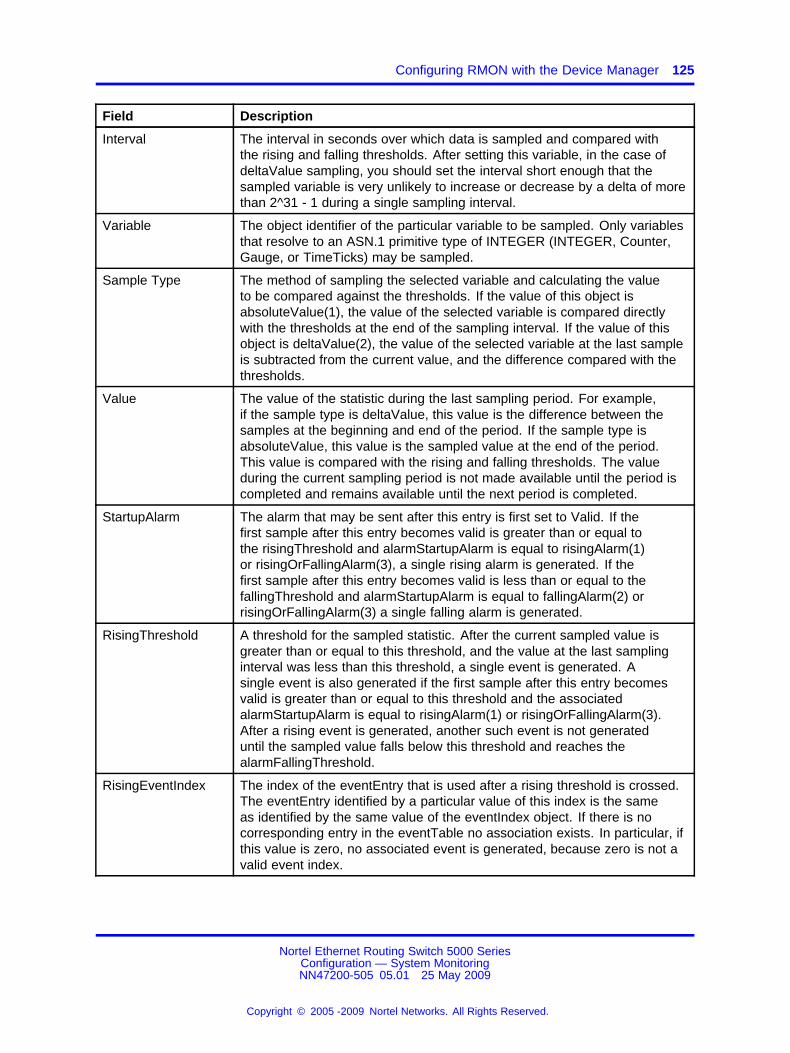
Configuring RMON with the Device Manager 125
Field Description
Interval The interval in seconds over which data is sampled and compared withthe rising and falling thresholds. After setting this variable, in the case ofdeltaValue sampling, you should set the interval short enough that thesampled variable is very unlikely to increase or decrease by a delta of morethan 2^31 - 1 during a single sampling interval.
Variable The object identifier of the particular variable to be sampled. Only variablesthat resolve to an ASN.1 primitive type of INTEGER (INTEGER, Counter,Gauge, or TimeTicks) may be sampled.
Sample Type The method of sampling the selected variable and calculating the valueto be compared against the thresholds. If the value of this object isabsoluteValue(1), the value of the selected variable is compared directlywith the thresholds at the end of the sampling interval. If the value of thisobject is deltaValue(2), the value of the selected variable at the last sampleis subtracted from the current value, and the difference compared with thethresholds.
Value The value of the statistic during the last sampling period. For example,if the sample type is deltaValue, this value is the difference between thesamples at the beginning and end of the period. If the sample type isabsoluteValue, this value is the sampled value at the end of the period.This value is compared with the rising and falling thresholds. The valueduring the current sampling period is not made available until the period iscompleted and remains available until the next period is completed.
StartupAlarm The alarm that may be sent after this entry is first set to Valid. If thefirst sample after this entry becomes valid is greater than or equal tothe risingThreshold and alarmStartupAlarm is equal to risingAlarm(1)or risingOrFallingAlarm(3), a single rising alarm is generated. If thefirst sample after this entry becomes valid is less than or equal to thefallingThreshold and alarmStartupAlarm is equal to fallingAlarm(2) orrisingOrFallingAlarm(3) a single falling alarm is generated.
RisingThreshold A threshold for the sampled statistic. After the current sampled value isgreater than or equal to this threshold, and the value at the last samplinginterval was less than this threshold, a single event is generated. Asingle event is also generated if the first sample after this entry becomesvalid is greater than or equal to this threshold and the associatedalarmStartupAlarm is equal to risingAlarm(1) or risingOrFallingAlarm(3).After a rising event is generated, another such event is not generateduntil the sampled value falls below this threshold and reaches thealarmFallingThreshold.
RisingEventIndex The index of the eventEntry that is used after a rising threshold is crossed.The eventEntry identified by a particular value of this index is the sameas identified by the same value of the eventIndex object. If there is nocorresponding entry in the eventTable no association exists. In particular, ifthis value is zero, no associated event is generated, because zero is not avalid event index.
Nortel Ethernet Routing Switch 5000 SeriesConfiguration — System MonitoringNN47200-505 05.01 25 May 2009
Copyright © 2005 -2009 Nortel Networks. All Rights Reserved.
.
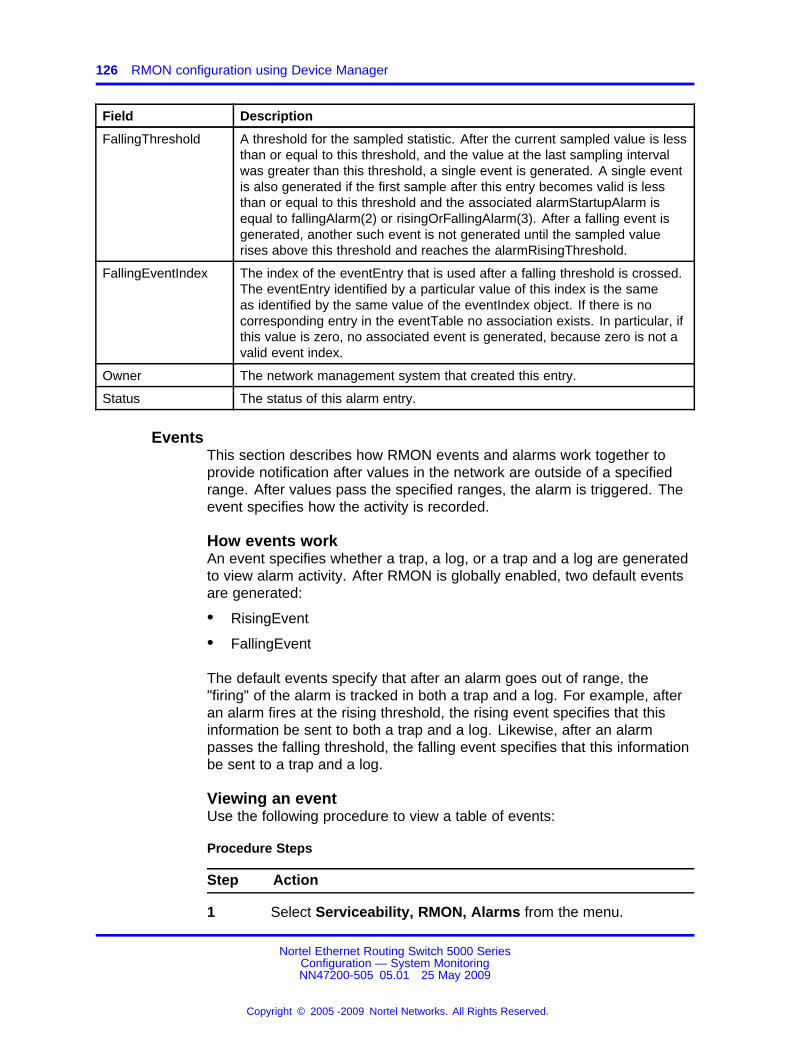
126 RMON configuration using Device Manager
Field Description
FallingThreshold A threshold for the sampled statistic. After the current sampled value is lessthan or equal to this threshold, and the value at the last sampling intervalwas greater than this threshold, a single event is generated. A single eventis also generated if the first sample after this entry becomes valid is lessthan or equal to this threshold and the associated alarmStartupAlarm isequal to fallingAlarm(2) or risingOrFallingAlarm(3). After a falling event isgenerated, another such event is not generated until the sampled valuerises above this threshold and reaches the alarmRisingThreshold.
FallingEventIndex The index of the eventEntry that is used after a falling threshold is crossed.The eventEntry identified by a particular value of this index is the sameas identified by the same value of the eventIndex object. If there is nocorresponding entry in the eventTable no association exists. In particular, ifthis value is zero, no associated event is generated, because zero is not avalid event index.
Owner The network management system that created this entry.
Status The status of this alarm entry.
EventsThis section describes how RMON events and alarms work together toprovide notification after values in the network are outside of a specifiedrange. After values pass the specified ranges, the alarm is triggered. Theevent specifies how the activity is recorded.
How events workAn event specifies whether a trap, a log, or a trap and a log are generatedto view alarm activity. After RMON is globally enabled, two default eventsare generated:
• RisingEvent
• FallingEvent
The default events specify that after an alarm goes out of range, the"firing" of the alarm is tracked in both a trap and a log. For example, afteran alarm fires at the rising threshold, the rising event specifies that thisinformation be sent to both a trap and a log. Likewise, after an alarmpasses the falling threshold, the falling event specifies that this informationbe sent to a trap and a log.
Viewing an eventUse the following procedure to view a table of events:
Procedure Steps
Step Action
1 Select Serviceability, RMON, Alarms from the menu.
Nortel Ethernet Routing Switch 5000 SeriesConfiguration — System MonitoringNN47200-505 05.01 25 May 2009
Copyright © 2005 -2009 Nortel Networks. All Rights Reserved.
.
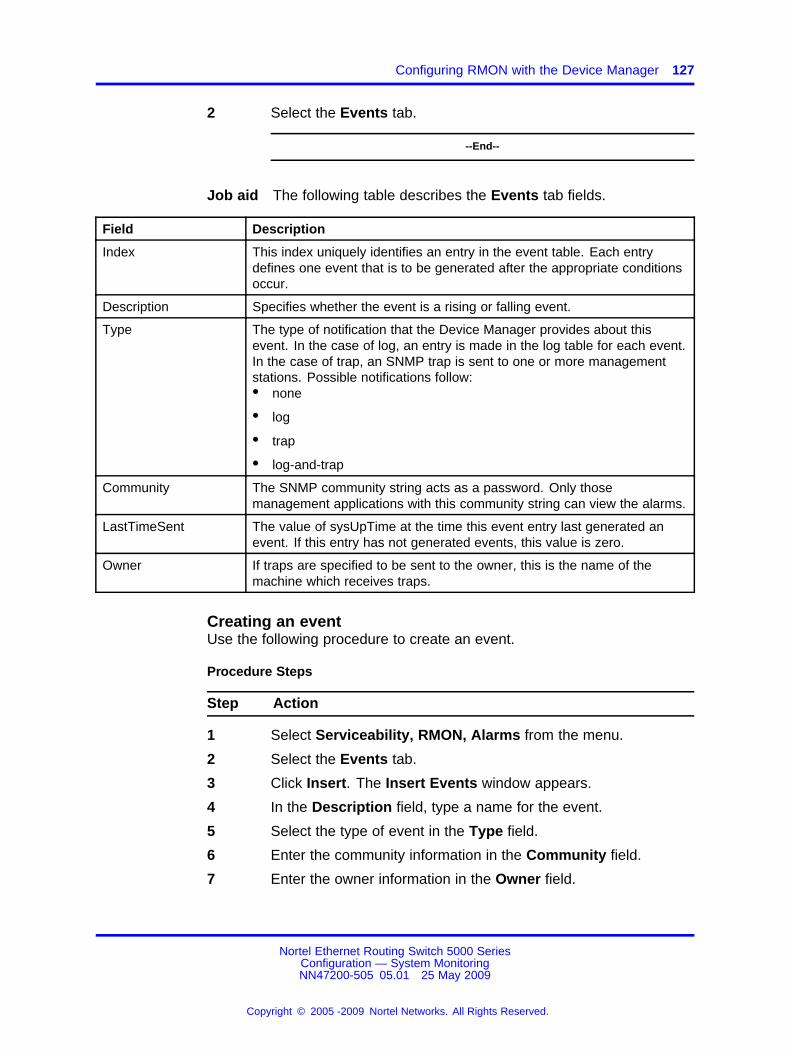
Configuring RMON with the Device Manager 127
2 Select the Events tab.
--End--
Job aid The following table describes the Events tab fields.
Field Description
Index This index uniquely identifies an entry in the event table. Each entrydefines one event that is to be generated after the appropriate conditionsoccur.
Description Specifies whether the event is a rising or falling event.
Type The type of notification that the Device Manager provides about thisevent. In the case of log, an entry is made in the log table for each event.In the case of trap, an SNMP trap is sent to one or more managementstations. Possible notifications follow:• none
• log
• trap
• log-and-trap
Community The SNMP community string acts as a password. Only thosemanagement applications with this community string can view the alarms.
LastTimeSent The value of sysUpTime at the time this event entry last generated anevent. If this entry has not generated events, this value is zero.
Owner If traps are specified to be sent to the owner, this is the name of themachine which receives traps.
Creating an eventUse the following procedure to create an event.
Procedure Steps
Step Action
1 Select Serviceability, RMON, Alarms from the menu.
2 Select the Events tab.
3 Click Insert. The Insert Events window appears.
4 In the Description field, type a name for the event.
5 Select the type of event in the Type field.
6 Enter the community information in the Community field.
7 Enter the owner information in the Owner field.
Nortel Ethernet Routing Switch 5000 SeriesConfiguration — System MonitoringNN47200-505 05.01 25 May 2009
Copyright © 2005 -2009 Nortel Networks. All Rights Reserved.
.
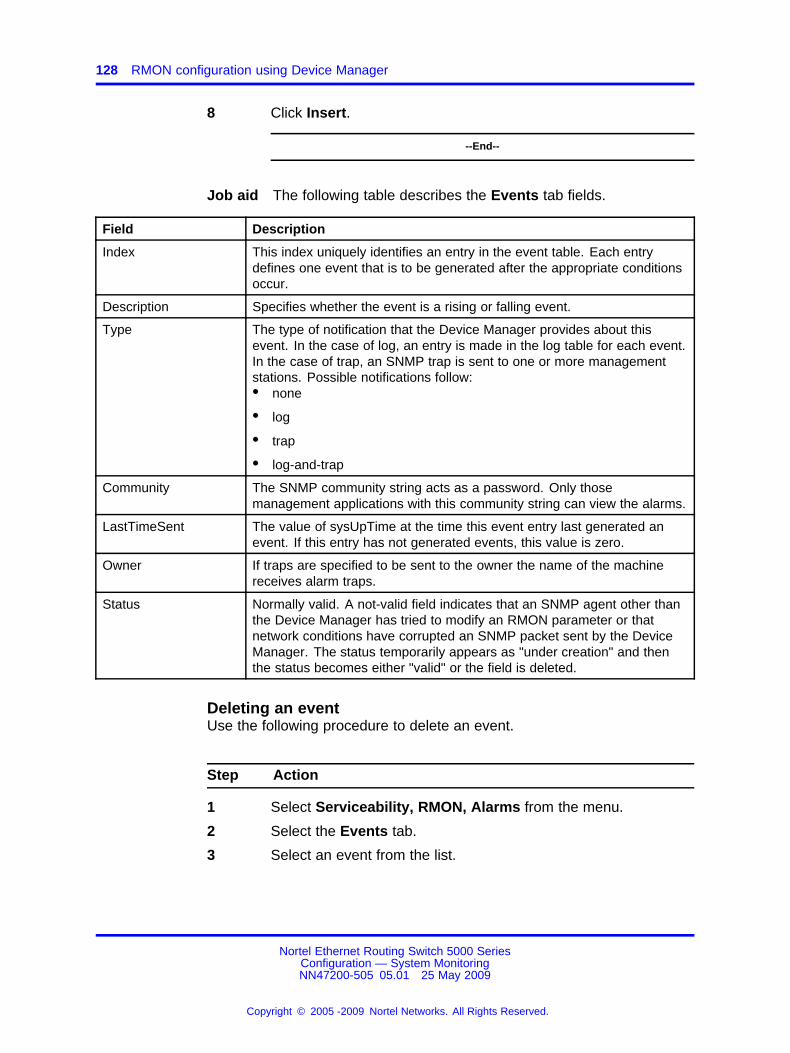
128 RMON configuration using Device Manager
8 Click Insert.
--End--
Job aid The following table describes the Events tab fields.
Field Description
Index This index uniquely identifies an entry in the event table. Each entrydefines one event that is to be generated after the appropriate conditionsoccur.
Description Specifies whether the event is a rising or falling event.
Type The type of notification that the Device Manager provides about thisevent. In the case of log, an entry is made in the log table for each event.In the case of trap, an SNMP trap is sent to one or more managementstations. Possible notifications follow:• none
• log
• trap
• log-and-trap
Community The SNMP community string acts as a password. Only thosemanagement applications with this community string can view the alarms.
LastTimeSent The value of sysUpTime at the time this event entry last generated anevent. If this entry has not generated events, this value is zero.
Owner If traps are specified to be sent to the owner the name of the machinereceives alarm traps.
Status Normally valid. A not-valid field indicates that an SNMP agent other thanthe Device Manager has tried to modify an RMON parameter or thatnetwork conditions have corrupted an SNMP packet sent by the DeviceManager. The status temporarily appears as "under creation" and thenthe status becomes either "valid" or the field is deleted.
Deleting an eventUse the following procedure to delete an event.
Step Action
1 Select Serviceability, RMON, Alarms from the menu.
2 Select the Events tab.
3 Select an event from the list.
Nortel Ethernet Routing Switch 5000 SeriesConfiguration — System MonitoringNN47200-505 05.01 25 May 2009
Copyright © 2005 -2009 Nortel Networks. All Rights Reserved.
.
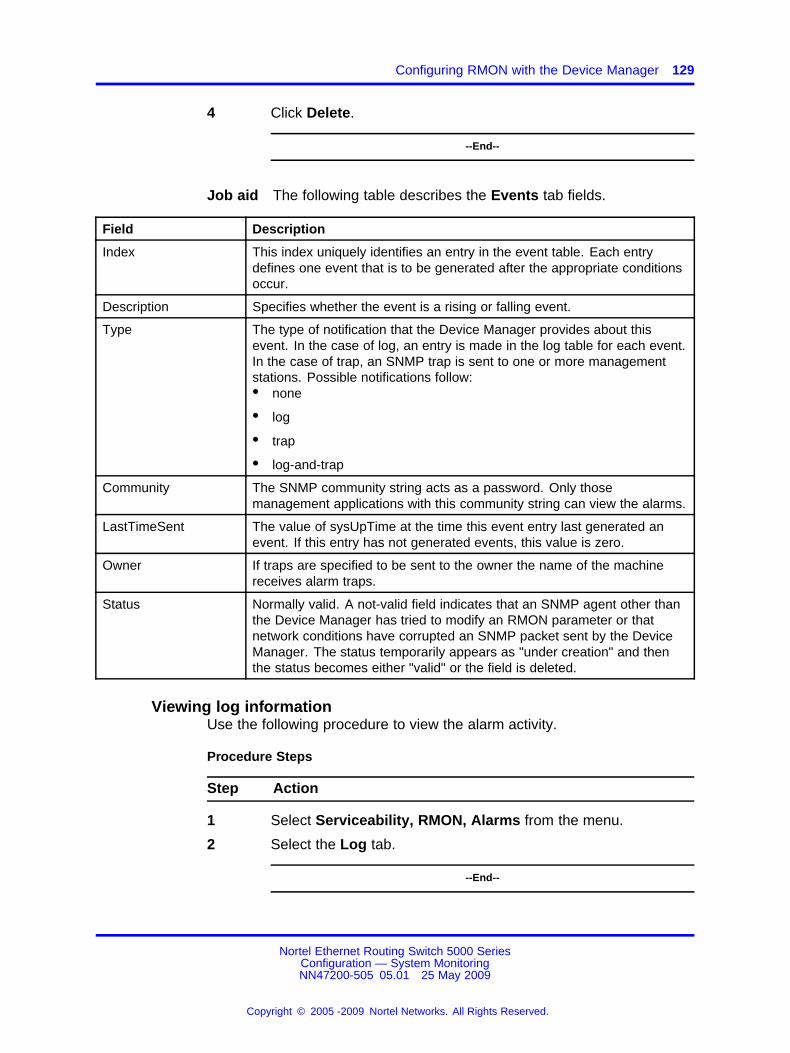
Configuring RMON with the Device Manager 129
4 Click Delete.
--End--
Job aid The following table describes the Events tab fields.
Field Description
Index This index uniquely identifies an entry in the event table. Each entrydefines one event that is to be generated after the appropriate conditionsoccur.
Description Specifies whether the event is a rising or falling event.
Type The type of notification that the Device Manager provides about thisevent. In the case of log, an entry is made in the log table for each event.In the case of trap, an SNMP trap is sent to one or more managementstations. Possible notifications follow:• none
• log
• trap
• log-and-trap
Community The SNMP community string acts as a password. Only thosemanagement applications with this community string can view the alarms.
LastTimeSent The value of sysUpTime at the time this event entry last generated anevent. If this entry has not generated events, this value is zero.
Owner If traps are specified to be sent to the owner the name of the machinereceives alarm traps.
Status Normally valid. A not-valid field indicates that an SNMP agent other thanthe Device Manager has tried to modify an RMON parameter or thatnetwork conditions have corrupted an SNMP packet sent by the DeviceManager. The status temporarily appears as "under creation" and thenthe status becomes either "valid" or the field is deleted.
Viewing log informationUse the following procedure to view the alarm activity.
Procedure Steps
Step Action
1 Select Serviceability, RMON, Alarms from the menu.
2 Select the Log tab.
--End--
Nortel Ethernet Routing Switch 5000 SeriesConfiguration — System MonitoringNN47200-505 05.01 25 May 2009
Copyright © 2005 -2009 Nortel Networks. All Rights Reserved.
.
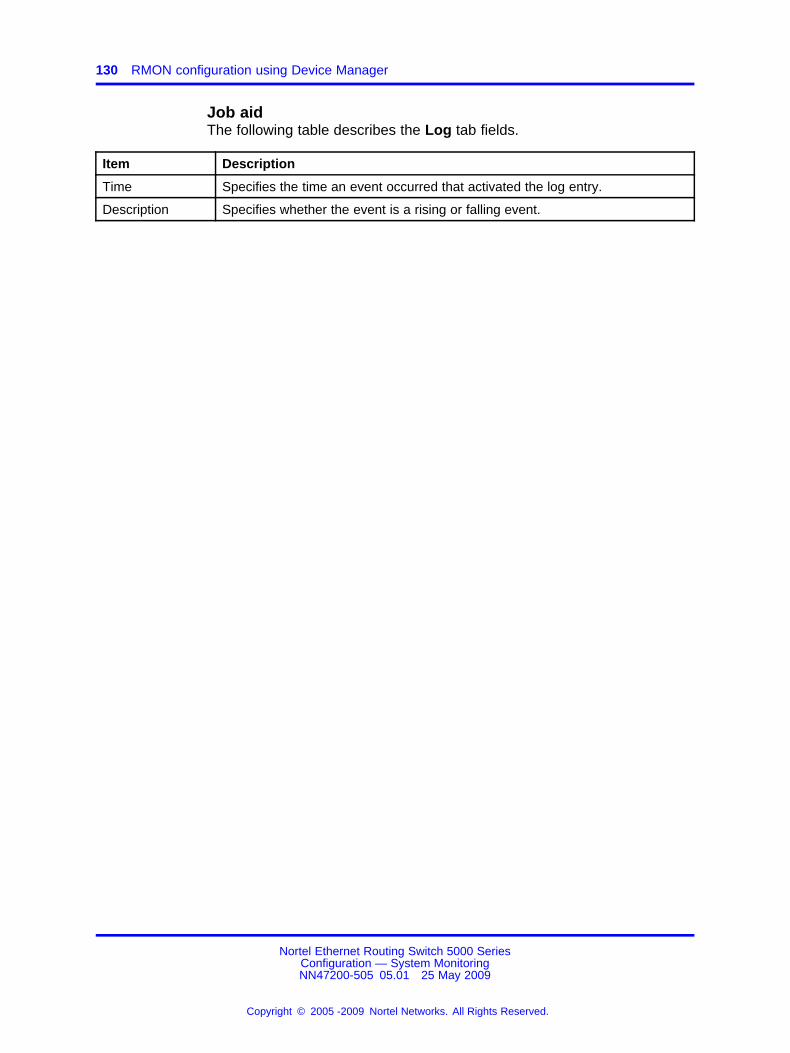
130 RMON configuration using Device Manager
Job aidThe following table describes the Log tab fields.
Item Description
Time Specifies the time an event occurred that activated the log entry.
Description Specifies whether the event is a rising or falling event.
Nortel Ethernet Routing Switch 5000 SeriesConfiguration — System MonitoringNN47200-505 05.01 25 May 2009
Copyright © 2005 -2009 Nortel Networks. All Rights Reserved.
.
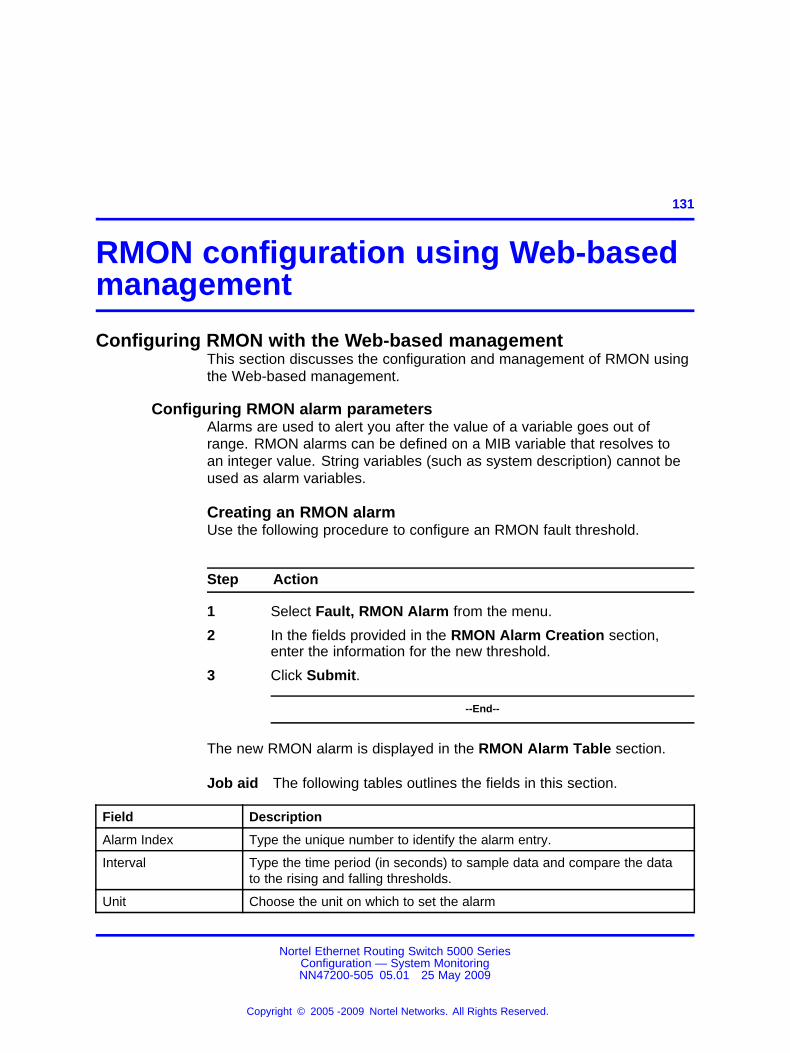
131.
RMON configuration using Web-basedmanagement
Configuring RMON with the Web-based managementThis section discusses the configuration and management of RMON usingthe Web-based management.
Configuring RMON alarm parametersAlarms are used to alert you after the value of a variable goes out ofrange. RMON alarms can be defined on a MIB variable that resolves toan integer value. String variables (such as system description) cannot beused as alarm variables.
Creating an RMON alarmUse the following procedure to configure an RMON fault threshold.
Step Action
1 Select Fault, RMON Alarm from the menu.
2 In the fields provided in the RMON Alarm Creation section,enter the information for the new threshold.
3 Click Submit.
--End--
The new RMON alarm is displayed in the RMON Alarm Table section.
Job aid The following tables outlines the fields in this section.
Field Description
Alarm Index Type the unique number to identify the alarm entry.
Interval Type the time period (in seconds) to sample data and compare the datato the rising and falling thresholds.
Unit Choose the unit on which to set the alarm
Nortel Ethernet Routing Switch 5000 SeriesConfiguration — System MonitoringNN47200-505 05.01 25 May 2009
Copyright © 2005 -2009 Nortel Networks. All Rights Reserved.
.
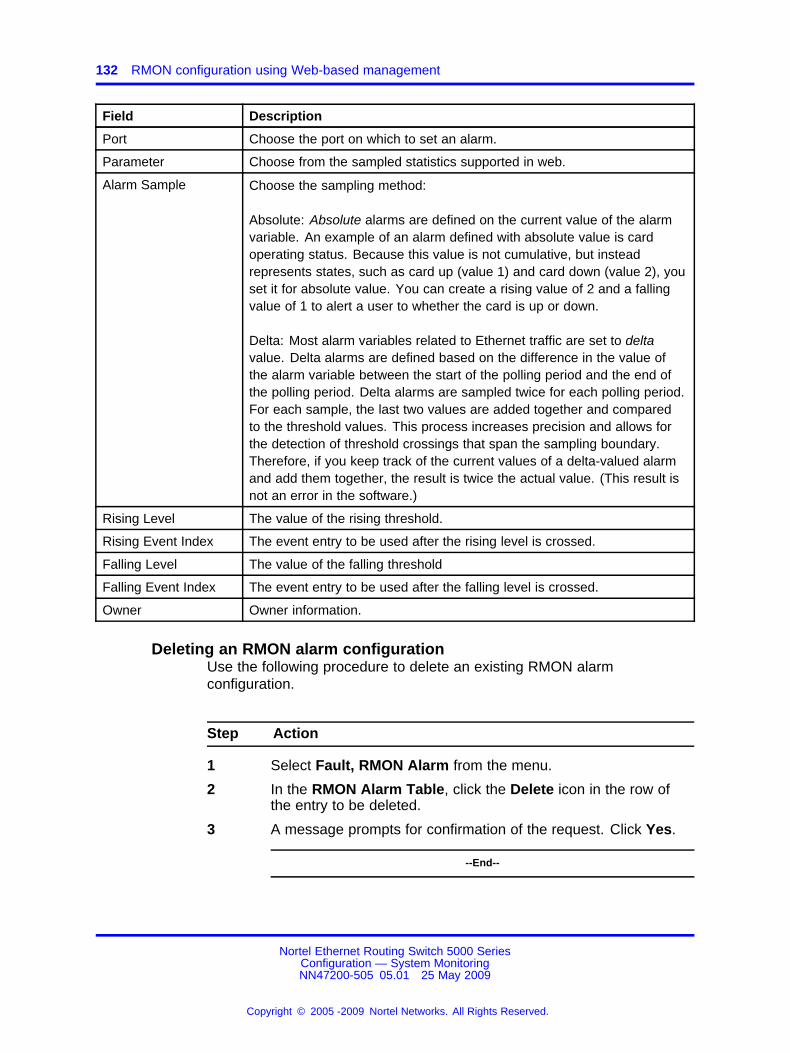
132 RMON configuration using Web-based management
Field Description
Port Choose the port on which to set an alarm.
Parameter Choose from the sampled statistics supported in web.
Alarm Sample Choose the sampling method:
Absolute: Absolute alarms are defined on the current value of the alarmvariable. An example of an alarm defined with absolute value is cardoperating status. Because this value is not cumulative, but insteadrepresents states, such as card up (value 1) and card down (value 2), youset it for absolute value. You can create a rising value of 2 and a fallingvalue of 1 to alert a user to whether the card is up or down.
Delta: Most alarm variables related to Ethernet traffic are set to deltavalue. Delta alarms are defined based on the difference in the value ofthe alarm variable between the start of the polling period and the end ofthe polling period. Delta alarms are sampled twice for each polling period.For each sample, the last two values are added together and comparedto the threshold values. This process increases precision and allows forthe detection of threshold crossings that span the sampling boundary.Therefore, if you keep track of the current values of a delta-valued alarmand add them together, the result is twice the actual value. (This result isnot an error in the software.)
Rising Level The value of the rising threshold.
Rising Event Index The event entry to be used after the rising level is crossed.
Falling Level The value of the falling threshold
Falling Event Index The event entry to be used after the falling level is crossed.
Owner Owner information.
Deleting an RMON alarm configurationUse the following procedure to delete an existing RMON alarmconfiguration.
Step Action
1 Select Fault, RMON Alarm from the menu.
2 In the RMON Alarm Table, click the Delete icon in the row ofthe entry to be deleted.
3 A message prompts for confirmation of the request. Click Yes.
--End--
Nortel Ethernet Routing Switch 5000 SeriesConfiguration — System MonitoringNN47200-505 05.01 25 May 2009
Copyright © 2005 -2009 Nortel Networks. All Rights Reserved.
.
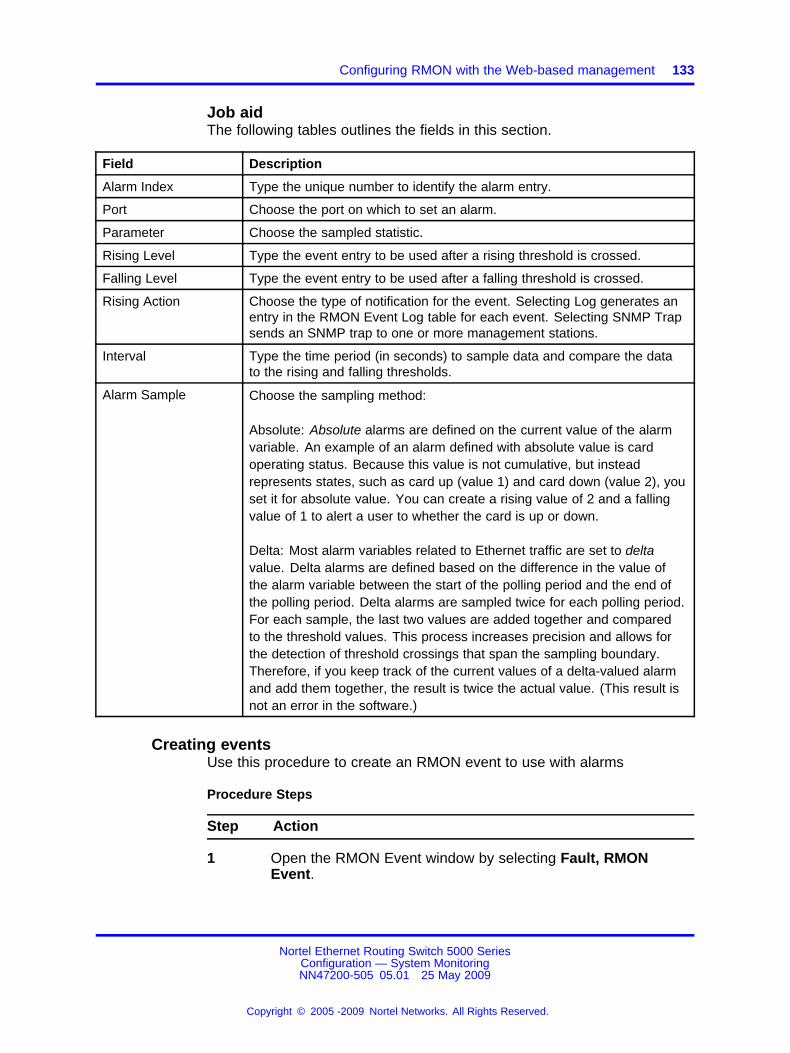
Configuring RMON with the Web-based management 133
Job aidThe following tables outlines the fields in this section.
Field Description
Alarm Index Type the unique number to identify the alarm entry.
Port Choose the port on which to set an alarm.
Parameter Choose the sampled statistic.
Rising Level Type the event entry to be used after a rising threshold is crossed.
Falling Level Type the event entry to be used after a falling threshold is crossed.
Rising Action Choose the type of notification for the event. Selecting Log generates anentry in the RMON Event Log table for each event. Selecting SNMP Trapsends an SNMP trap to one or more management stations.
Interval Type the time period (in seconds) to sample data and compare the datato the rising and falling thresholds.
Alarm Sample Choose the sampling method:
Absolute: Absolute alarms are defined on the current value of the alarmvariable. An example of an alarm defined with absolute value is cardoperating status. Because this value is not cumulative, but insteadrepresents states, such as card up (value 1) and card down (value 2), youset it for absolute value. You can create a rising value of 2 and a fallingvalue of 1 to alert a user to whether the card is up or down.
Delta: Most alarm variables related to Ethernet traffic are set to deltavalue. Delta alarms are defined based on the difference in the value ofthe alarm variable between the start of the polling period and the end ofthe polling period. Delta alarms are sampled twice for each polling period.For each sample, the last two values are added together and comparedto the threshold values. This process increases precision and allows forthe detection of threshold crossings that span the sampling boundary.Therefore, if you keep track of the current values of a delta-valued alarmand add them together, the result is twice the actual value. (This result isnot an error in the software.)
Creating eventsUse this procedure to create an RMON event to use with alarms
Procedure Steps
Step Action
1 Open the RMON Event window by selecting Fault, RMONEvent.
Nortel Ethernet Routing Switch 5000 SeriesConfiguration — System MonitoringNN47200-505 05.01 25 May 2009
Copyright © 2005 -2009 Nortel Networks. All Rights Reserved.
.
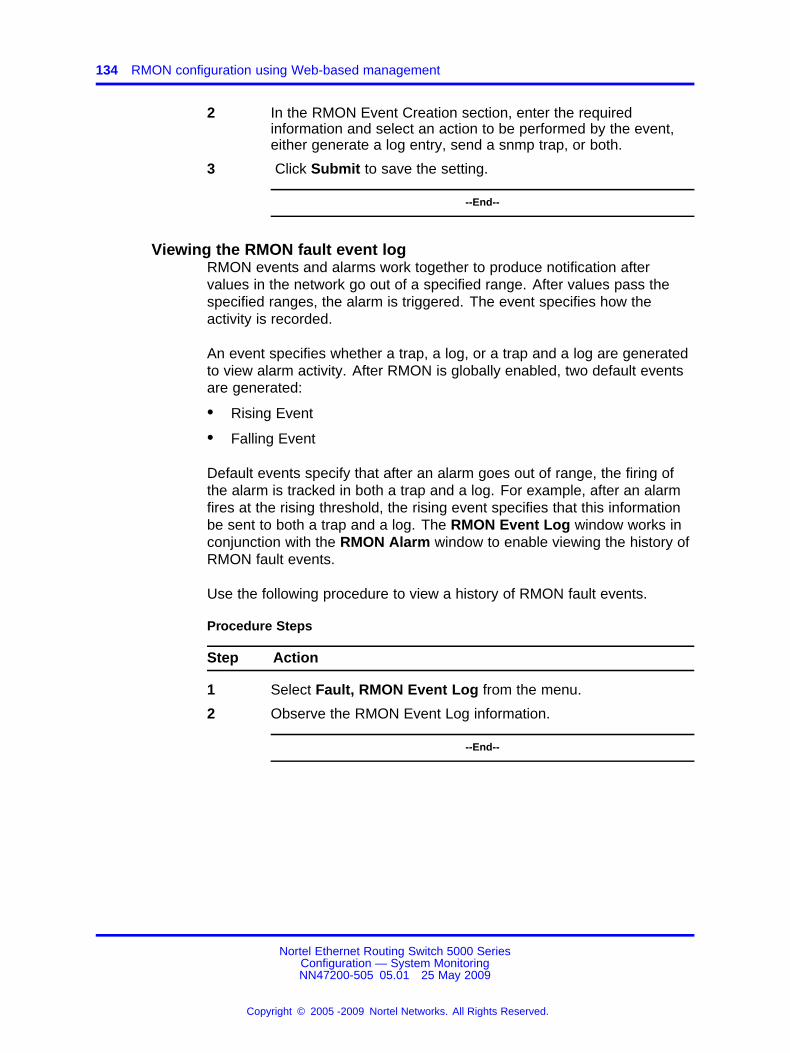
134 RMON configuration using Web-based management
2 In the RMON Event Creation section, enter the requiredinformation and select an action to be performed by the event,either generate a log entry, send a snmp trap, or both.
3 Click Submit to save the setting.
--End--
Viewing the RMON fault event logRMON events and alarms work together to produce notification aftervalues in the network go out of a specified range. After values pass thespecified ranges, the alarm is triggered. The event specifies how theactivity is recorded.
An event specifies whether a trap, a log, or a trap and a log are generatedto view alarm activity. After RMON is globally enabled, two default eventsare generated:
• Rising Event
• Falling Event
Default events specify that after an alarm goes out of range, the firing ofthe alarm is tracked in both a trap and a log. For example, after an alarmfires at the rising threshold, the rising event specifies that this informationbe sent to both a trap and a log. The RMON Event Log window works inconjunction with the RMON Alarm window to enable viewing the history ofRMON fault events.
Use the following procedure to view a history of RMON fault events.
Procedure Steps
Step Action
1 Select Fault, RMON Event Log from the menu.
2 Observe the RMON Event Log information.
--End--
Nortel Ethernet Routing Switch 5000 SeriesConfiguration — System MonitoringNN47200-505 05.01 25 May 2009
Copyright © 2005 -2009 Nortel Networks. All Rights Reserved.
.
135.
IPFIX Configuration using NNCLIThis section describes the commands used in the configuration andmanagement of IP Flow Information Export (IPFIX) using the NNCLI.
Configuring IPFIX collectorsThe ip ipfix collector command is used to configure IPFIXcollectors. IPFIX collectors are used to collect and analyze data exportedfrom an IPFIX compliant switch. In Software Release 5.0, the only externalcollector supported is NetQOS. At this time, up to two collectors can besupported.
IPFIX data is exported from the switch in Netflow version 9 format. Datais exported using UDP port 9995.
IPFIX data is not load balanced when two collectors are in use. Identicalinformation is sent to both collectors.
Use the following procedure to configure the IPFIX collectors.
Procedure Steps
Step Action
1 Enter Global Configuration mode.
2 Use the ip ipfix collector <unit_number><collector_ip_address> command to configure the IPFIXcollector.
--End--
The ip ipfix collector command is executed in the GlobalConfiguration mode.
Variable definitionsThe following table describes the parameters for this command.
Nortel Ethernet Routing Switch 5000 SeriesConfiguration — System MonitoringNN47200-505 05.01 25 May 2009
Copyright © 2005 -2009 Nortel Networks. All Rights Reserved.
.
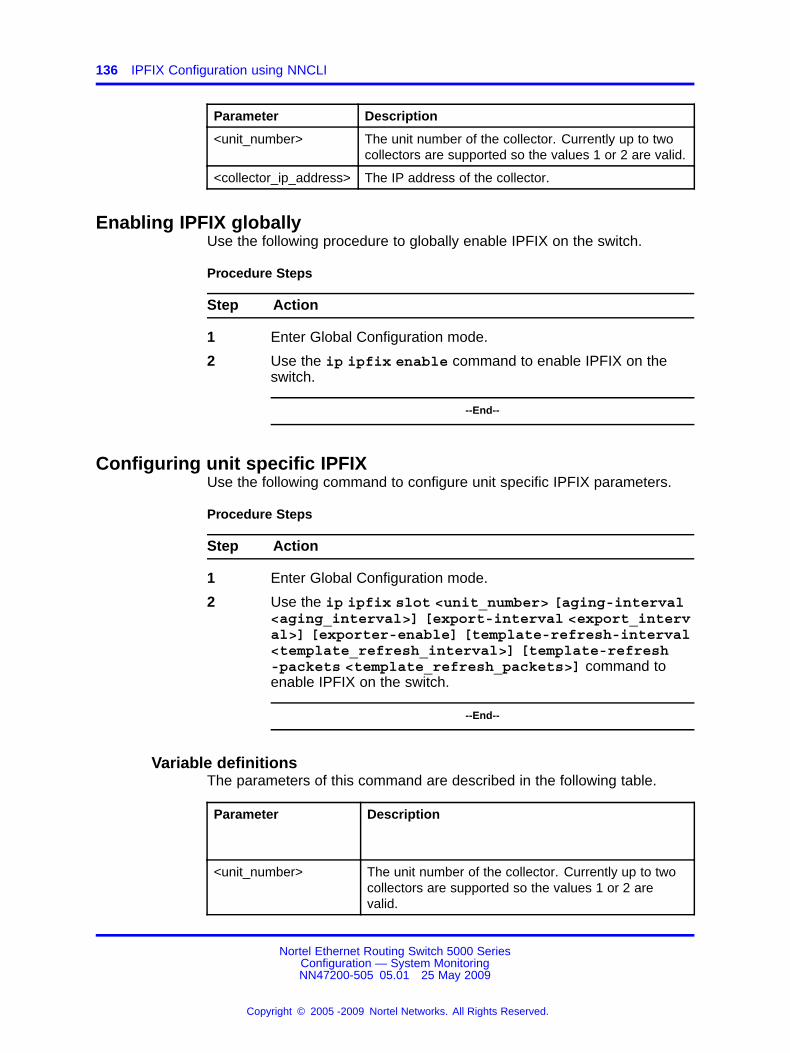
136 IPFIX Configuration using NNCLI
Parameter Description
<unit_number> The unit number of the collector. Currently up to twocollectors are supported so the values 1 or 2 are valid.
<collector_ip_address> The IP address of the collector.
Enabling IPFIX globallyUse the following procedure to globally enable IPFIX on the switch.
Procedure Steps
Step Action
1 Enter Global Configuration mode.
2 Use the ip ipfix enable command to enable IPFIX on theswitch.
--End--
Configuring unit specific IPFIXUse the following command to configure unit specific IPFIX parameters.
Procedure Steps
Step Action
1 Enter Global Configuration mode.
2 Use the ip ipfix slot <unit_number> [aging-interval<aging_interval>] [export-interval <export_interval>] [exporter-enable] [template-refresh-interval<template_refresh_interval>] [template-refresh-packets <template_refresh_packets>] command toenable IPFIX on the switch.
--End--
Variable definitionsThe parameters of this command are described in the following table.
Parameter Description
<unit_number> The unit number of the collector. Currently up to twocollectors are supported so the values 1 or 2 arevalid.
Nortel Ethernet Routing Switch 5000 SeriesConfiguration — System MonitoringNN47200-505 05.01 25 May 2009
Copyright © 2005 -2009 Nortel Networks. All Rights Reserved.
.
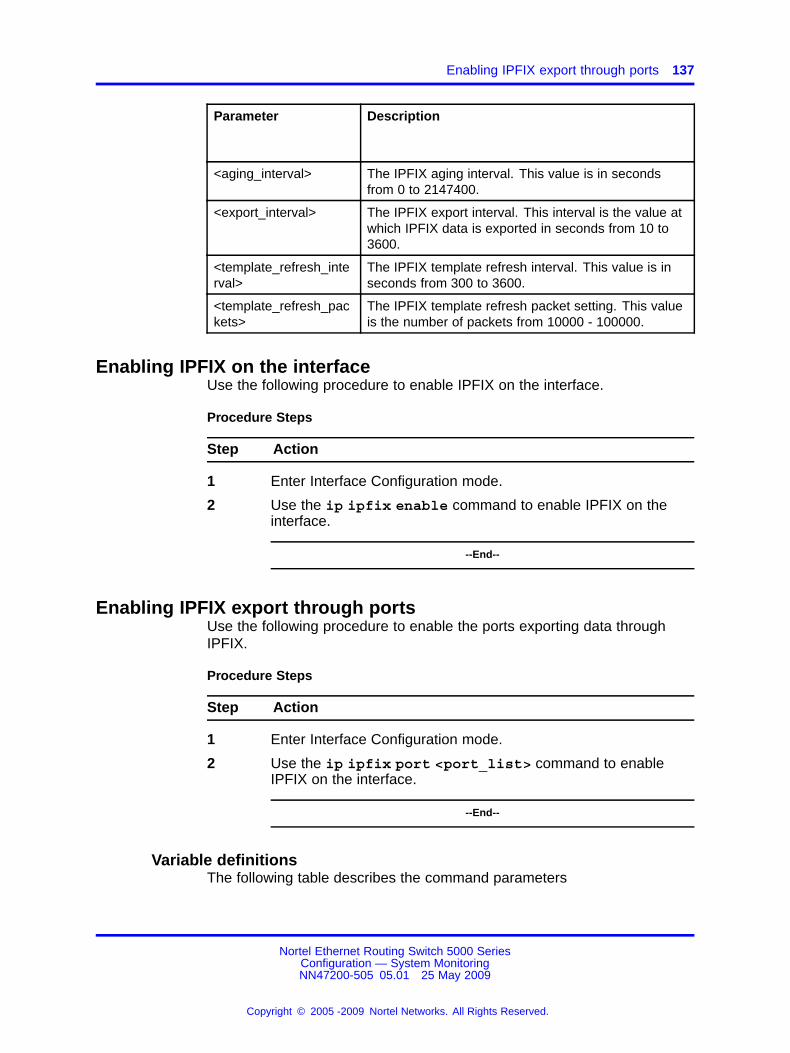
Enabling IPFIX export through ports 137
Parameter Description
<aging_interval> The IPFIX aging interval. This value is in secondsfrom 0 to 2147400.
<export_interval> The IPFIX export interval. This interval is the value atwhich IPFIX data is exported in seconds from 10 to3600.
<template_refresh_interval>
The IPFIX template refresh interval. This value is inseconds from 300 to 3600.
<template_refresh_packets>
The IPFIX template refresh packet setting. This valueis the number of packets from 10000 - 100000.
Enabling IPFIX on the interfaceUse the following procedure to enable IPFIX on the interface.
Procedure Steps
Step Action
1 Enter Interface Configuration mode.
2 Use the ip ipfix enable command to enable IPFIX on theinterface.
--End--
Enabling IPFIX export through portsUse the following procedure to enable the ports exporting data throughIPFIX.
Procedure Steps
Step Action
1 Enter Interface Configuration mode.
2 Use the ip ipfix port <port_list> command to enableIPFIX on the interface.
--End--
Variable definitionsThe following table describes the command parameters
Nortel Ethernet Routing Switch 5000 SeriesConfiguration — System MonitoringNN47200-505 05.01 25 May 2009
Copyright © 2005 -2009 Nortel Networks. All Rights Reserved.
.

138 IPFIX Configuration using NNCLI
Variable Definition
port-list Single or comma-separated list ofports.
Deleting the IPFIX information for a portUse the following procedure to delete the collected IPFIX information for aport.
Procedure Steps
Step Action
1 Enter Privileged Executive mode.
2 Use the ip ipfix flush port <port_list> [export-and-flush] command to delete the collected IPFIX information forthe port or ports.
--End--
Variable definitionsThe following table describes the command parameters.
Variable Definition
port-list Single or comma-separated list ofports.
export-and-flush Export data to a collector before it isdeleted.
Viewing the IPFIX tableUse the following procedure to display IPFIX data collected from theswitch.
Procedure Steps
Step Action
1 Enter Privileged Executive mode.
2 Use the show ip ipfix table <unit_number> sort-by<sort_by> sort-order <sort_order> display<num_entries> command view the IPFIX data.
--End--
Nortel Ethernet Routing Switch 5000 SeriesConfiguration — System MonitoringNN47200-505 05.01 25 May 2009
Copyright © 2005 -2009 Nortel Networks. All Rights Reserved.
.
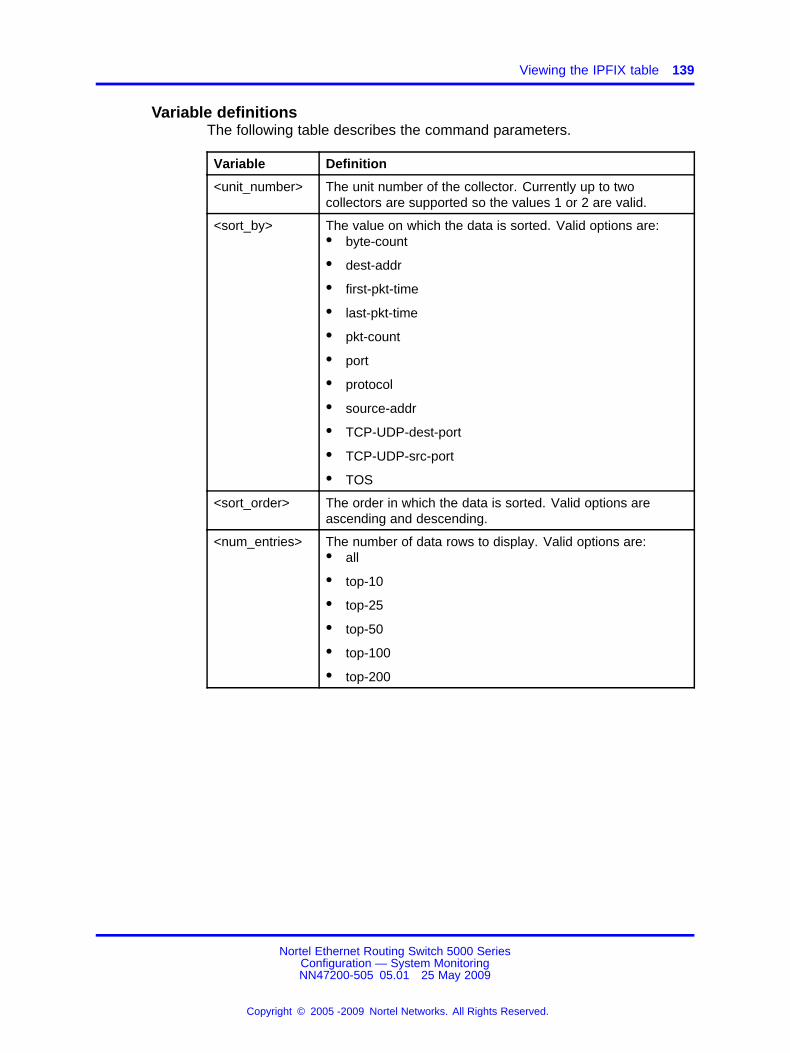
Viewing the IPFIX table 139
Variable definitionsThe following table describes the command parameters.
Variable Definition
<unit_number> The unit number of the collector. Currently up to twocollectors are supported so the values 1 or 2 are valid.
<sort_by> The value on which the data is sorted. Valid options are:• byte-count
• dest-addr
• first-pkt-time
• last-pkt-time
• pkt-count
• port
• protocol
• source-addr
• TCP-UDP-dest-port
• TCP-UDP-src-port
• TOS
<sort_order> The order in which the data is sorted. Valid options areascending and descending.
<num_entries> The number of data rows to display. Valid options are:• all
• top-10
• top-25
• top-50
• top-100
• top-200
Nortel Ethernet Routing Switch 5000 SeriesConfiguration — System MonitoringNN47200-505 05.01 25 May 2009
Copyright © 2005 -2009 Nortel Networks. All Rights Reserved.
.

140 IPFIX Configuration using NNCLI
Nortel Ethernet Routing Switch 5000 SeriesConfiguration — System MonitoringNN47200-505 05.01 25 May 2009
Copyright © 2005 -2009 Nortel Networks. All Rights Reserved.
.
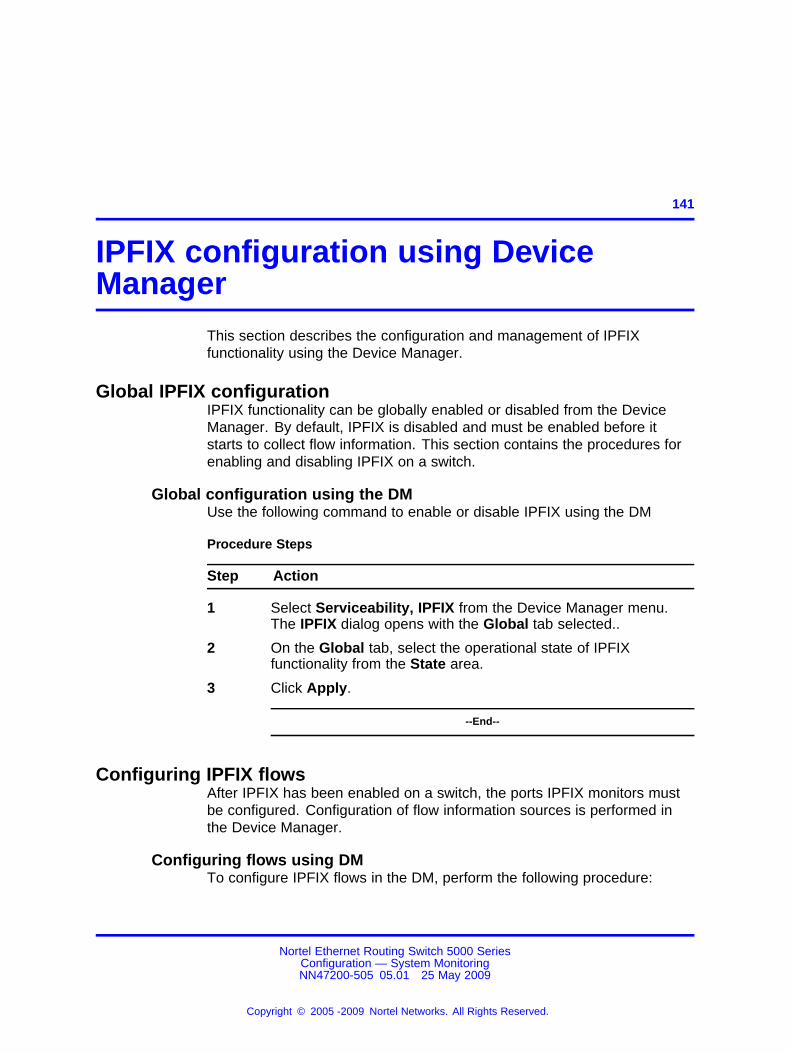
141.
IPFIX configuration using DeviceManager
This section describes the configuration and management of IPFIXfunctionality using the Device Manager.
Global IPFIX configurationIPFIX functionality can be globally enabled or disabled from the DeviceManager. By default, IPFIX is disabled and must be enabled before itstarts to collect flow information. This section contains the procedures forenabling and disabling IPFIX on a switch.
Global configuration using the DMUse the following command to enable or disable IPFIX using the DM
Procedure Steps
Step Action
1 Select Serviceability, IPFIX from the Device Manager menu.The IPFIX dialog opens with the Global tab selected..
2 On the Global tab, select the operational state of IPFIXfunctionality from the State area.
3 Click Apply.
--End--
Configuring IPFIX flowsAfter IPFIX has been enabled on a switch, the ports IPFIX monitors mustbe configured. Configuration of flow information sources is performed inthe Device Manager.
Configuring flows using DMTo configure IPFIX flows in the DM, perform the following procedure:
Nortel Ethernet Routing Switch 5000 SeriesConfiguration — System MonitoringNN47200-505 05.01 25 May 2009
Copyright © 2005 -2009 Nortel Networks. All Rights Reserved.
.
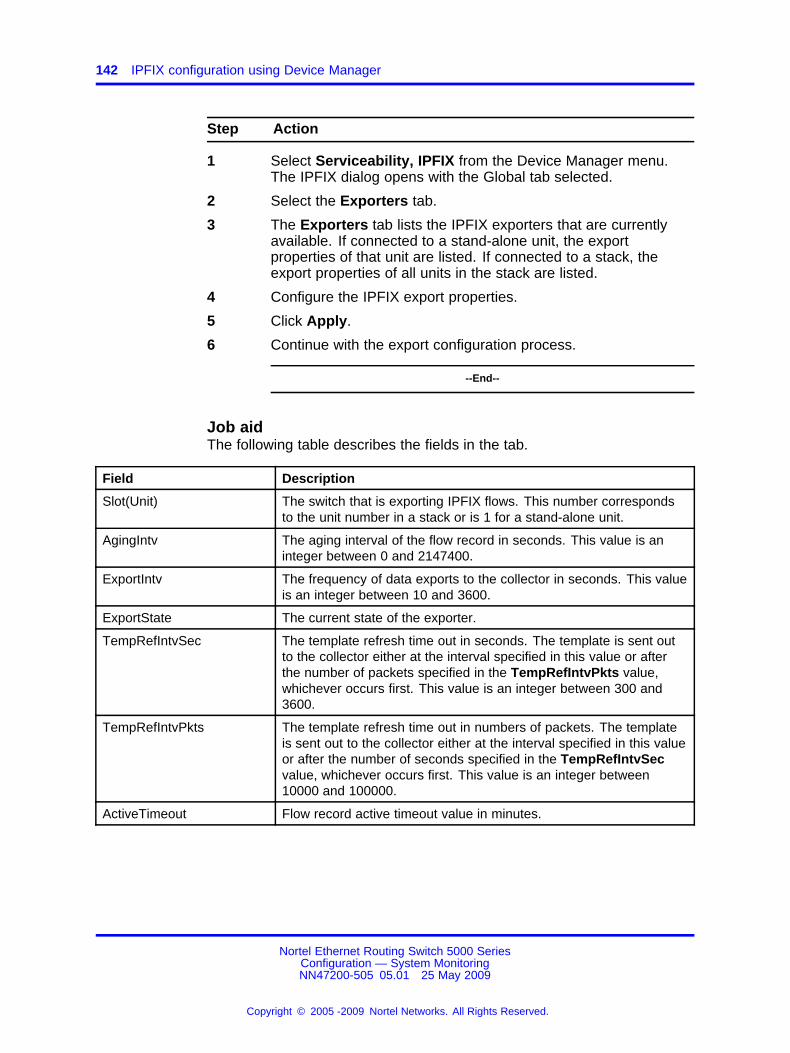
142 IPFIX configuration using Device Manager
Step Action
1 Select Serviceability, IPFIX from the Device Manager menu.The IPFIX dialog opens with the Global tab selected.
2 Select the Exporters tab.
3 The Exporters tab lists the IPFIX exporters that are currentlyavailable. If connected to a stand-alone unit, the exportproperties of that unit are listed. If connected to a stack, theexport properties of all units in the stack are listed.
4 Configure the IPFIX export properties.
5 Click Apply.
6 Continue with the export configuration process.
--End--
Job aidThe following table describes the fields in the tab.
Field Description
Slot(Unit) The switch that is exporting IPFIX flows. This number correspondsto the unit number in a stack or is 1 for a stand-alone unit.
AgingIntv The aging interval of the flow record in seconds. This value is aninteger between 0 and 2147400.
ExportIntv The frequency of data exports to the collector in seconds. This valueis an integer between 10 and 3600.
ExportState The current state of the exporter.
TempRefIntvSec The template refresh time out in seconds. The template is sent outto the collector either at the interval specified in this value or afterthe number of packets specified in the TempRefIntvPkts value,whichever occurs first. This value is an integer between 300 and3600.
TempRefIntvPkts The template refresh time out in numbers of packets. The templateis sent out to the collector either at the interval specified in this valueor after the number of seconds specified in the TempRefIntvSecvalue, whichever occurs first. This value is an integer between10000 and 100000.
ActiveTimeout Flow record active timeout value in minutes.
Nortel Ethernet Routing Switch 5000 SeriesConfiguration — System MonitoringNN47200-505 05.01 25 May 2009
Copyright © 2005 -2009 Nortel Networks. All Rights Reserved.
.
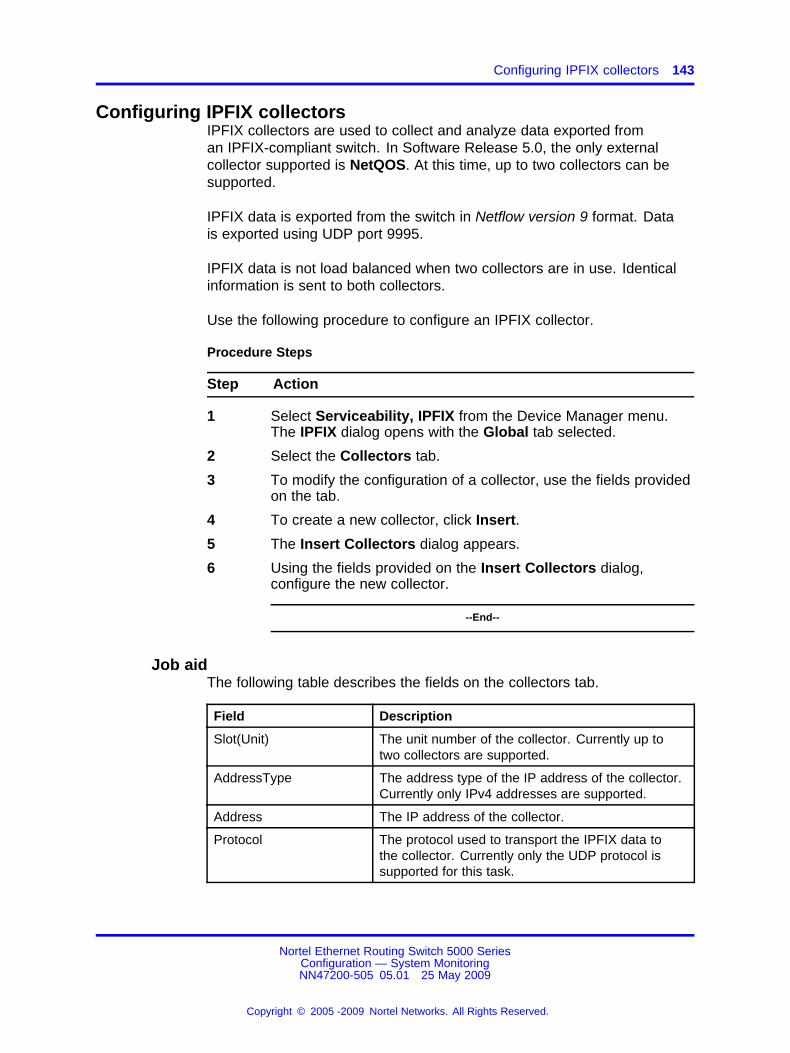
Configuring IPFIX collectors 143
Configuring IPFIX collectorsIPFIX collectors are used to collect and analyze data exported froman IPFIX-compliant switch. In Software Release 5.0, the only externalcollector supported is NetQOS. At this time, up to two collectors can besupported.
IPFIX data is exported from the switch in Netflow version 9 format. Datais exported using UDP port 9995.
IPFIX data is not load balanced when two collectors are in use. Identicalinformation is sent to both collectors.
Use the following procedure to configure an IPFIX collector.
Procedure Steps
Step Action
1 Select Serviceability, IPFIX from the Device Manager menu.The IPFIX dialog opens with the Global tab selected.
2 Select the Collectors tab.
3 To modify the configuration of a collector, use the fields providedon the tab.
4 To create a new collector, click Insert.
5 The Insert Collectors dialog appears.
6 Using the fields provided on the Insert Collectors dialog,configure the new collector.
--End--
Job aidThe following table describes the fields on the collectors tab.
Field Description
Slot(Unit) The unit number of the collector. Currently up totwo collectors are supported.
AddressType The address type of the IP address of the collector.Currently only IPv4 addresses are supported.
Address The IP address of the collector.
Protocol The protocol used to transport the IPFIX data tothe collector. Currently only the UDP protocol issupported for this task.
Nortel Ethernet Routing Switch 5000 SeriesConfiguration — System MonitoringNN47200-505 05.01 25 May 2009
Copyright © 2005 -2009 Nortel Networks. All Rights Reserved.
.
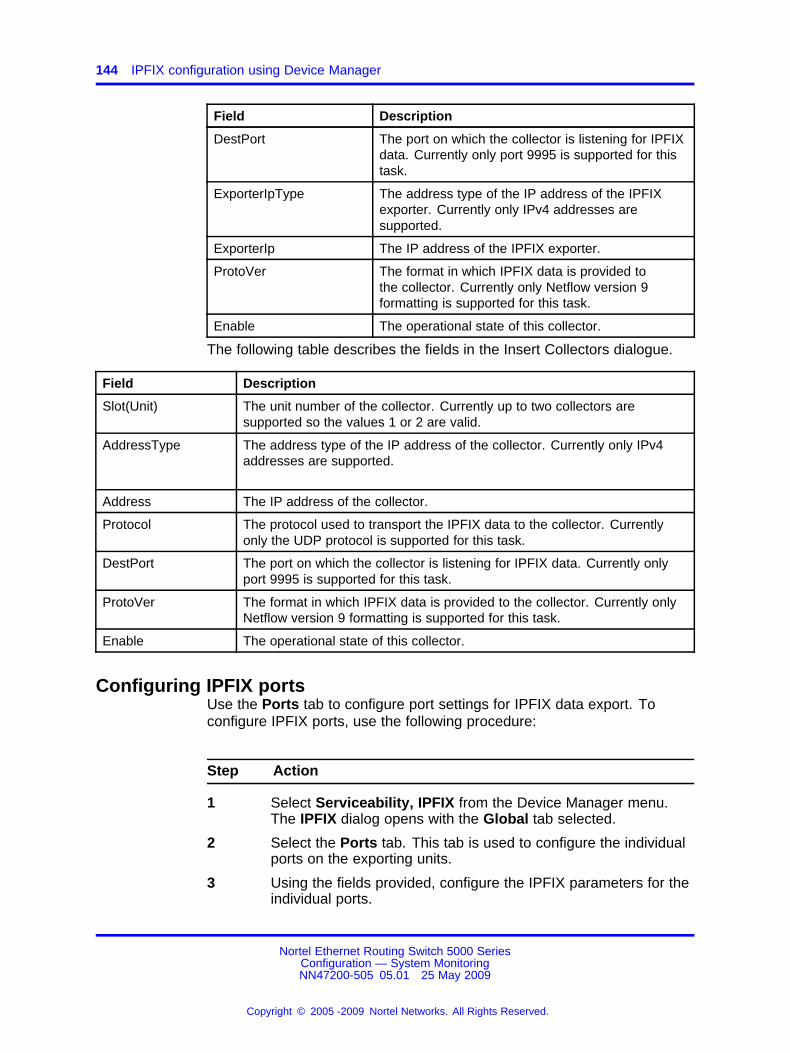
144 IPFIX configuration using Device Manager
Field Description
DestPort The port on which the collector is listening for IPFIXdata. Currently only port 9995 is supported for thistask.
ExporterIpType The address type of the IP address of the IPFIXexporter. Currently only IPv4 addresses aresupported.
ExporterIp The IP address of the IPFIX exporter.
ProtoVer The format in which IPFIX data is provided tothe collector. Currently only Netflow version 9formatting is supported for this task.
Enable The operational state of this collector.
The following table describes the fields in the Insert Collectors dialogue.
Field Description
Slot(Unit) The unit number of the collector. Currently up to two collectors aresupported so the values 1 or 2 are valid.
AddressType The address type of the IP address of the collector. Currently only IPv4addresses are supported.
Address The IP address of the collector.
Protocol The protocol used to transport the IPFIX data to the collector. Currentlyonly the UDP protocol is supported for this task.
DestPort The port on which the collector is listening for IPFIX data. Currently onlyport 9995 is supported for this task.
ProtoVer The format in which IPFIX data is provided to the collector. Currently onlyNetflow version 9 formatting is supported for this task.
Enable The operational state of this collector.
Configuring IPFIX portsUse the Ports tab to configure port settings for IPFIX data export. Toconfigure IPFIX ports, use the following procedure:
Step Action
1 Select Serviceability, IPFIX from the Device Manager menu.The IPFIX dialog opens with the Global tab selected.
2 Select the Ports tab. This tab is used to configure the individualports on the exporting units.
3 Using the fields provided, configure the IPFIX parameters for theindividual ports.
Nortel Ethernet Routing Switch 5000 SeriesConfiguration — System MonitoringNN47200-505 05.01 25 May 2009
Copyright © 2005 -2009 Nortel Networks. All Rights Reserved.
.
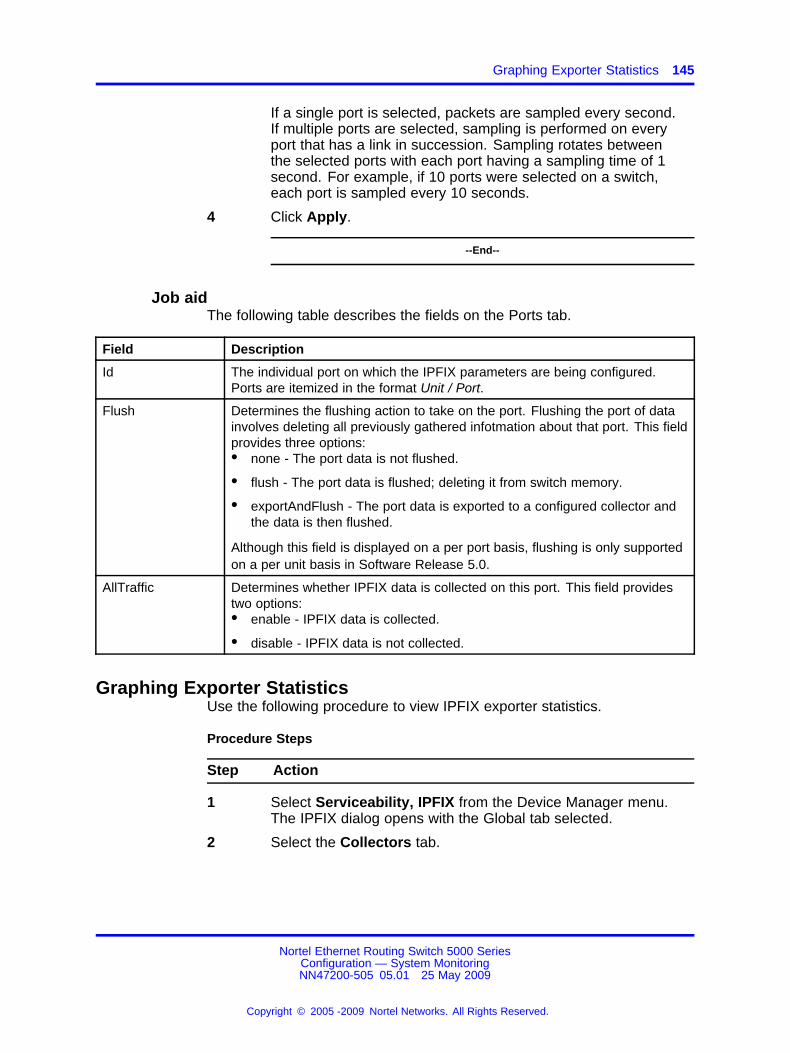
Graphing Exporter Statistics 145
If a single port is selected, packets are sampled every second.If multiple ports are selected, sampling is performed on everyport that has a link in succession. Sampling rotates betweenthe selected ports with each port having a sampling time of 1second. For example, if 10 ports were selected on a switch,each port is sampled every 10 seconds.
4 Click Apply.
--End--
Job aidThe following table describes the fields on the Ports tab.
Field Description
Id The individual port on which the IPFIX parameters are being configured.Ports are itemized in the format Unit / Port.
Flush Determines the flushing action to take on the port. Flushing the port of datainvolves deleting all previously gathered infotmation about that port. This fieldprovides three options:• none - The port data is not flushed.
• flush - The port data is flushed; deleting it from switch memory.
• exportAndFlush - The port data is exported to a configured collector andthe data is then flushed.
Although this field is displayed on a per port basis, flushing is only supportedon a per unit basis in Software Release 5.0.
AllTraffic Determines whether IPFIX data is collected on this port. This field providestwo options:• enable - IPFIX data is collected.
• disable - IPFIX data is not collected.
Graphing Exporter StatisticsUse the following procedure to view IPFIX exporter statistics.
Procedure Steps
Step Action
1 Select Serviceability, IPFIX from the Device Manager menu.The IPFIX dialog opens with the Global tab selected.
2 Select the Collectors tab.
Nortel Ethernet Routing Switch 5000 SeriesConfiguration — System MonitoringNN47200-505 05.01 25 May 2009
Copyright © 2005 -2009 Nortel Networks. All Rights Reserved.
.
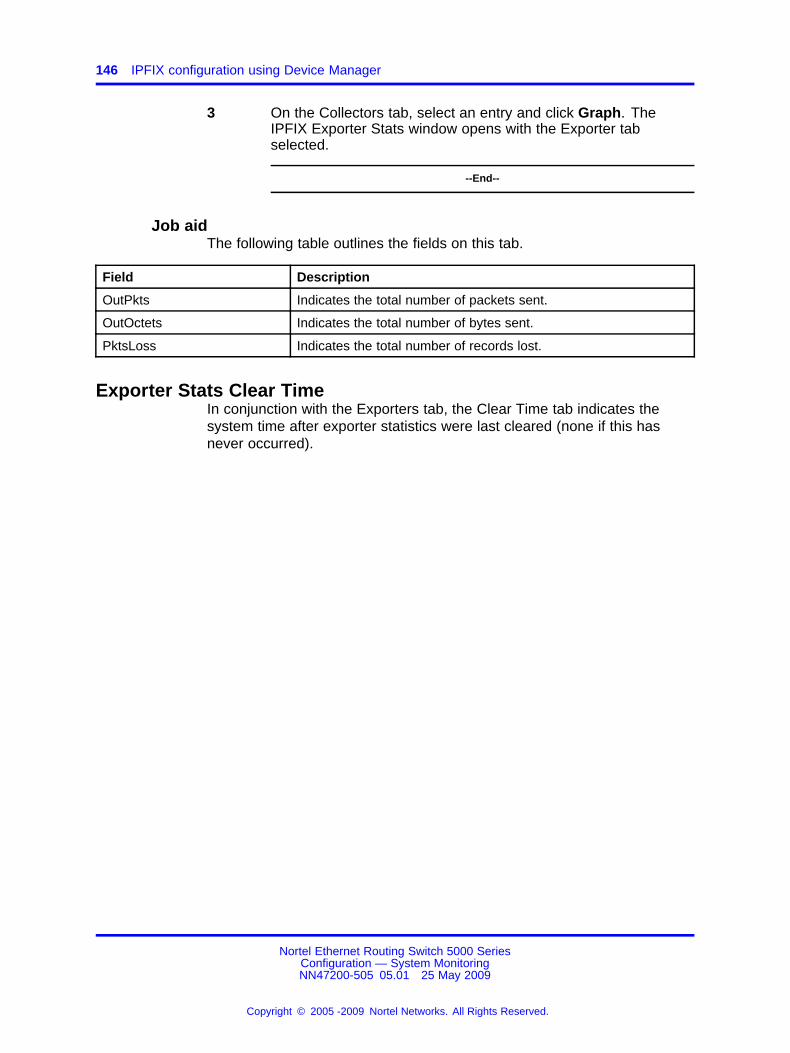
146 IPFIX configuration using Device Manager
3 On the Collectors tab, select an entry and click Graph. TheIPFIX Exporter Stats window opens with the Exporter tabselected.
--End--
Job aidThe following table outlines the fields on this tab.
Field Description
OutPkts Indicates the total number of packets sent.
OutOctets Indicates the total number of bytes sent.
PktsLoss Indicates the total number of records lost.
Exporter Stats Clear TimeIn conjunction with the Exporters tab, the Clear Time tab indicates thesystem time after exporter statistics were last cleared (none if this hasnever occurred).
Nortel Ethernet Routing Switch 5000 SeriesConfiguration — System MonitoringNN47200-505 05.01 25 May 2009
Copyright © 2005 -2009 Nortel Networks. All Rights Reserved.
.

147.
IPFIX configuration using theWeb-based management
This section outlines the configuration of IPFIX using Web-basedmanagement.
Global configuration using the Web-based managementIPFIX functionality can be globally enabled or disabled from theWeb-based management. By default, IPFIX is disabled and must beenabled before it will start to collect flow information. This section containsthe procedures for enabling and disabling IPFIX on a switch.
Use this procedure to enable or disable IPFIX using the Web-basedmanagement.
Procedure
Step Action
1 Select Applications, IP Fix, IP Fix Configuration fromthe Web-based management navigation pane. The IP FixConfiguration page appears.
2 Select the operational state of the IPFIX functionality from the IPFix drop down list in the IP Fix Global Setting area.
3 Click Submit.
--End--
Configuring flows using the Web-based managementAfter IPFIX has been enabled on a switch, the ports IPFIX will monitormust be configured. Configuration of flow information sources can beperformed in the Web-based management.
Flow configuration in the Web-based management is performed on theIP Fix Configuration page.
Nortel Ethernet Routing Switch 5000 SeriesConfiguration — System MonitoringNN47200-505 05.01 25 May 2009
Copyright © 2005 -2009 Nortel Networks. All Rights Reserved.
.
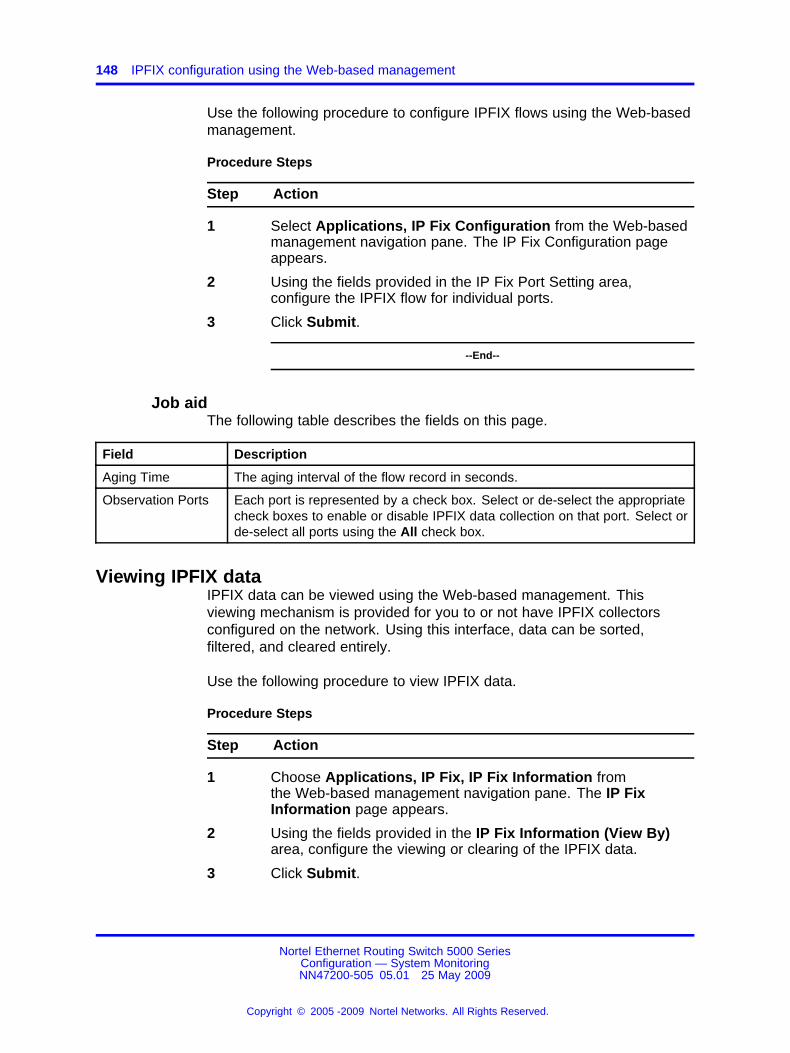
148 IPFIX configuration using the Web-based management
Use the following procedure to configure IPFIX flows using the Web-basedmanagement.
Procedure Steps
Step Action
1 Select Applications, IP Fix Configuration from the Web-basedmanagement navigation pane. The IP Fix Configuration pageappears.
2 Using the fields provided in the IP Fix Port Setting area,configure the IPFIX flow for individual ports.
3 Click Submit.
--End--
Job aidThe following table describes the fields on this page.
Field Description
Aging Time The aging interval of the flow record in seconds.
Observation Ports Each port is represented by a check box. Select or de-select the appropriatecheck boxes to enable or disable IPFIX data collection on that port. Select orde-select all ports using the All check box.
Viewing IPFIX dataIPFIX data can be viewed using the Web-based management. Thisviewing mechanism is provided for you to or not have IPFIX collectorsconfigured on the network. Using this interface, data can be sorted,filtered, and cleared entirely.
Use the following procedure to view IPFIX data.
Procedure Steps
Step Action
1 Choose Applications, IP Fix, IP Fix Information fromthe Web-based management navigation pane. The IP FixInformation page appears.
2 Using the fields provided in the IP Fix Information (View By)area, configure the viewing or clearing of the IPFIX data.
3 Click Submit.
Nortel Ethernet Routing Switch 5000 SeriesConfiguration — System MonitoringNN47200-505 05.01 25 May 2009
Copyright © 2005 -2009 Nortel Networks. All Rights Reserved.
.
Viewing IPFIX data 149
4 The IPFIX data with be filtered and sorted based on theselections.
--End--
Job aidThe following table describes the fields on the IPFIX Information page.
Field Description
Sort On The item of data to sort the IPFIX data on. IPFIX data can be sorted on anyitem that is gathered.
Sort Order The order to apply to the sorted data.
Entries To Display The number of entries to display.
Clear Statistics Whether or not to clear the current statistics from memory.
Nortel Ethernet Routing Switch 5000 SeriesConfiguration — System MonitoringNN47200-505 05.01 25 May 2009
Copyright © 2005 -2009 Nortel Networks. All Rights Reserved.
.
150 IPFIX configuration using the Web-based management
Nortel Ethernet Routing Switch 5000 SeriesConfiguration — System MonitoringNN47200-505 05.01 25 May 2009
Copyright © 2005 -2009 Nortel Networks. All Rights Reserved.
.

Nortel Ethernet Routing Switch 5000 Series
Configuration — System MonitoringRelease: 6.1Publication: NN47200-505Document revision: 05.01Document release date: 25 May 2009
Copyright © 2005 -2009 Nortel Networks. All Rights Reserved.
While the information in this document is believed to be accurate and reliable, except as otherwise expressly agreed to in writingNORTEL PROVIDES THIS DOCUMENT "AS IS" WITHOUT WARRANTY OR CONDITION OFANY KIND, EITHER EXPRESS ORIMPLIED. The information and/or products described in this document are subject to change without notice.
Nortel, Nortel Networks, the Nortel logo, and the Globemark are trademarks of Nortel Networks.
All other trademarks are the property of their respective owners.
To provide feedback or to report a problem in this document, go to www.nortel.com/documentfeedback.
www.nortel.com