Embed Size (px)
Citation preview

Soil Dynamics and Earthquake Engineering 11 (1992) 411-426
Nonstationary ARMA modeling of seismic motions
J.P. Conte Civil Engineering Department, Rice University, Houston, Texas 77251-1892, USA
K.S. Pister University of California, Santa Cruz, California 95064, USA
&
S.A. Mahin Department of Civil Engineering, University of California, Berkeley, California 94720, USA
(Received 30 September 1992; accepted 6 October 1992)
Discrete time-varying autoregressive - - moving average (ARMA) models are used to describe realistic earthquake ground motion time histories. Both amplitude and frequency nonstationarities are incorporated in the model. An iterative Kalman filtering scheme is introduced to identify the time-varying parameters of an ARMA model from an actual earthquake record. Several model verification tests are performed on the identified model. Applications of these identification and verification procedures are given and show that the proposed models and identification algorithms are able to capture accurately the nonstationary features of real earthquake accelerograms, especially the time- variation of the frequency content. The well-known Kanai-Tajimi earthquake model is covariance equivalent with a subset of the low order ARMA(2,1) model. Using the results and methodology of this study, the parameters of a time-varying Kanai-Tajimi earthquake model can be estimated from a target earthquake record or they can be directly associated with characteristic earthquake features such as predominant frequency and frequency bandwidth.
Key words: earthquake ground motion, nonstationary, time-varying ARMA model, identification, verification, Kalman filtering.
I N T R O D U C T I O N
When designing earthquake-resistant structures, the ultimate goal of the earthquake engineer is to save human lives and reduce the extent of structural damage. However, the challenge consists in providing structural safety under economic constraints, which dictates a tolerance for some degree of structural damage inflicted during severe earthquake motions. I f one accepts that part of the seismic input energy in the structure is dissipated by means of ductile inelastic deformations, the seismic loads to which the structure is subjected are
Soil Dynamics and Earthquake Engineering 0267-7261/92/$05.00 © 1992 Elsevier Science Publishers Ltd.
411
reduced (from the elastic condition). Presently, most seismic design codes rely implicitly or explicitly on ductile inelastic structural behavior to withstand severe earthquake motions. The task of the earthquake engineer is further complicated l~y two important facts: (i) the considerable uncertainty associated with the expected seismic excitation, and (ii) the possibility of high sensitivity of inelastic structural behavior with respect to t h e details of the ground motion time history. 3,14
Considerable uncertainty is attached to each level of the ground motion generation mechanism. The precise nature of the fault rupture process, the characteristics of the wave propagat ion path and the local site con- ditions are all very uncertain. The resulting uncertainty
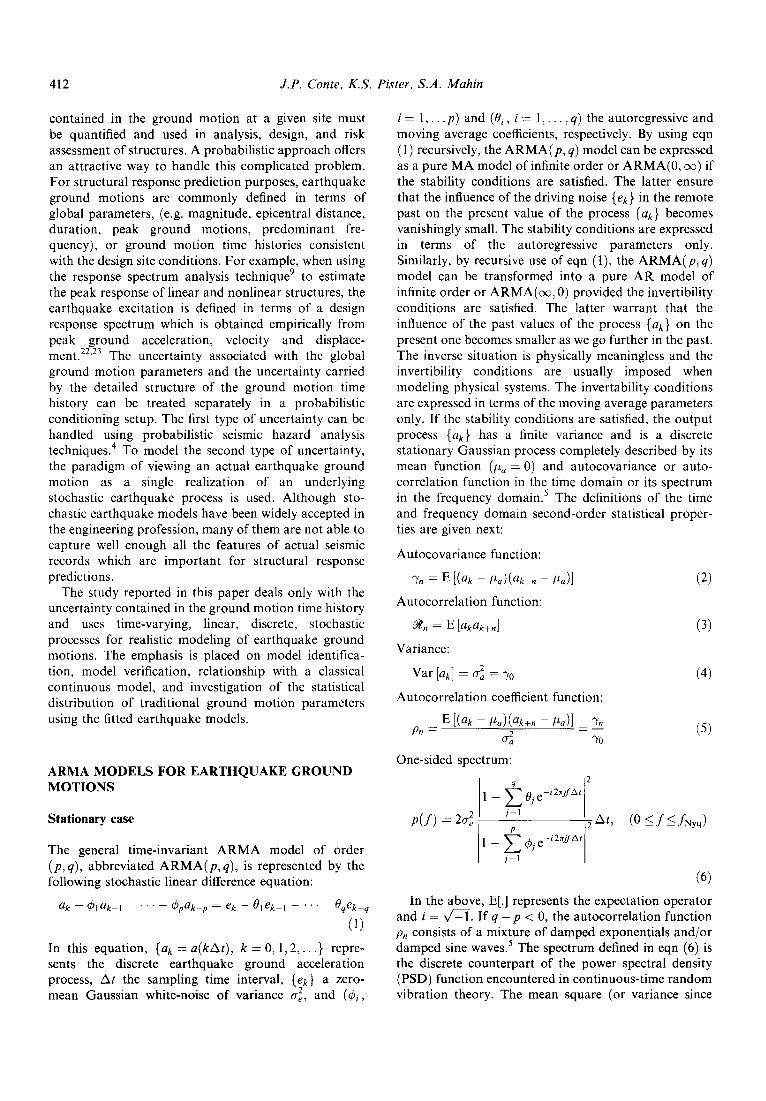
412 J.P. Conte, K.S. Pister, S.A. Mahin
contained in the ground motion at a given site must be quantified and used in analysis, design, and risk assessment of structures. A probabilistic approach offers an attractive way to handle this complicated problem. For structural response prediction purposes, earthquake ground motions are commonly defined in terms of global parameters, (e.g. magnitude, epicentral distance, duration, peak ground motions, predominant fre- quency), or ground motion time histories consistent with the design site conditions. For example, when using the response spectrum analysis technique 9 to estimate the peak response of linear and nonlinear structures, the earthquake excitation is defined in terms of a design response spectrum which is obtained empirically from peak ground acceleration, velocity and displace- ment. 22'23 The uncertainty associated with the global ground motion parameters and the uncertainty carried by the detailed structure of the ground motion time history can be treated separately in a probabilistic conditioning setup. The first type of uncertainty can be handled using probabilistic seismic hazard analysis techniques. 4 To model the second type of uncertainty, the paradigm of viewing an actual earthquake ground motion as a single realization of an underlying stochastic earthquake process is used. Although sto- chastic earthquake models have been widely accepted in the engineering profession, many of them are not able to capture well enough all the features of actual seismic records which are important for structural response predictions.
The study reported in this paper deals only with the uncertainty contained in the ground motion time history and uses time-varying, linear, discrete, stochastic processes for realistic modeling of earthquake ground motions. The emphasis is placed on model identifica- tion, model verification, relationship with a classical continuous model, and investigation of the statistical distribution of traditional ground motion parameters using the fitted earthquake models.
ARMA MODELS FOR EARTHQUAKE GROUND MOTIONS
Stationary case
The general time-invariant ARMA model of order (p, q), abbreviated ARMA(p, q), is represented by the following stochastic linear difference equation:
ak - ~blak_l . . . . . dppak-p = ek -- O l e k - i . . . . . Oqek_q
(1)
In this equation, {ak = a(kAt ) , k = 0, 1 ,2 , . . .} repre- sents the discrete earthquake ground acceleration process, At the sampling time interval, {eg} a zero-
2 and (hi, mean Gaussian white-noise of variance o.e,
i = 1 . . . . p) and (Oi, i = 1 , . . . , q) the autoregressive and moving average coefficients, respectively. By using eqn (1) recursively, the ARMA(p, q) model can be expressed as a pure MA model of infinite order or ARMA(0, oe) if the stability conditions are satisfied. The latter ensure that the influence of the driving noise {ek} in the remote past on the present value of the process {ak} becomes vanishingly small. The stability conditions are expressed in terms of the autoregressive parameters only. Similarly, by recursive use of eqn (1), the ARMA(p, q) model can be transformed into a pure AR model of infinite order or ARMA(ec, 0) provided the invertibility conditions are satisfied. The latter warrant that the influence of the past values of the process {ak} on the present one becomes smaller as we go further in the past. The inverse situation is physically meaningless and the invertibility conditions are usually imposed when modeling physical systems. The invertability conditions are expressed in terms of the moving average parameters only. If the stability conditions are satisfied, the output process {ak} has a finite variance and is a discrete stationary Gaussian process completely described by its mean function (#a = 0) and autocovariance or auto- correlation function in the time domain or its spectrum in the frequency domain. 5 The definitions of the time and frequency domain second-order statistical proper- ties are given next:
Autocovariance function:
7n = E [(a k -- # a ) ( a k + n -- ~a)] (2)
Autocorrelation function:
'~n = E [akak+n] (3)
Variance:
Var [ak] = 0-2a = 70 (4)
Autocorrelation coefficient function:
P, = E [(ak - #a)(ak+, - #a)] = __7" (5) aa 2 70
One-sided spectrum:
q 2 1 - Z Oj e -i2~ffAt
p ( f ) = 20.2 j=l I 1 P 2 - - Z ff)je-i27rffA` At, (0 -< f--< fNyq)
j=l I
(6)
In the above, E[.] represents the expectation operator and i = x/Z1. If q - p < 0, the autocorrelation function On consists of a mixture of damped exponentials and/or damped sine waves. 5 The spectrum defined in eqn (6) is the discrete counterpart of the power spectral density (PSD) function encountered in continuous-time random vibration theory. The mean square (or variance since

Nonstationary A RMA modeling of seismic motions 413
#a = O) of the ARMA process {ak} can be obtained from the one-sided spectrum:
Var [ak] = 2 = p( f ) d f (7)
As indicated by eqn (7), the spectrum p( f ) has a physical interpretation as the distribution of the average energy (or mean square) of the process over the continuous range of frequency [0,fNyq] where fNyq = 1/(2At) stands for the Nyquist frequency or highest frequency which can be observed in the discrete time series {ak}.
Physical interpretation
Under certain conditions, the ARMA processes can be interpreted as continuous-time response processes of dynamic systems uniformly sampled at time interval At. For example, it can be shown 12A9 that the response covariance function of a white-noise excited n-degree-of- freedom (n-dof) continuous-time linear dynamic system discretely coincides with the covariance function of an ARMA(2n, 2 n - 1) discrete process. The parameters of the ARMA(2n, 2 n - 1) model depend on the dynamic characteristics of the covariance-equivalent n-dof sys- tem, (i.e. natural periods and modal damping ratios) and the properties (temporal and spatial) of the white- noise excitation vector. This property represents an important advantage of using discrete ARMA models instead of continuous-time models for earthquake ground motion modeling, since discrete models are easier to identify from real digital seismic data and can still be interpreted in terms of continuous-time dynamic models. As an important illustration, the covariance equivalence existing between the low order ARMA(2, 1) model and the well-known continuous Kanai-Tajimi model is presented in the next section.
ARMA(2, 1) model
The ARMA(2, 1) model is defined by the second order difference equation
a k - - 6 1 a k _ l - - 6 2 a k _ 2 = e k - - O l e k _ 1 (8 )
and is completely characterized by four parameters: 61, 62, 01, and tre 2. The stability region for the autoregressive parameters 61 and ~h2 corresponds to the triangular region shown in Fig. 15 and the invertibility condition is satisfied if 1011 < 1.
The underlying physical system corresponding to the ARMA(2,1) model is the linear viscously damped SDOF system represented in Fig. 2 where m = mass of the SDOF oscillator, k = linear spring stiffness, c = dashpot damping coefficient, X(t) : input displace- ment applied separately to the spring and the dashpot in proportions Cs and Co, respectively, Z(t) = absolute dis- placement of the SDOF system (measured with respect
~2
_l] Fig. 1. Stability region.
to a fixed inertial coordinate frame). The equation of motion of the SDOF system can be written as:
- c [.~(t) - CoX(t)] - k[Z(t) - GX(t)] = mZ(t) (9)
By defining ,;2 = k /m and 2~g~g -- c/m, the equation of motion can be rewritten in the standard form:
Z(t) + 2~g~g2(t) + ~ Z ( t ) = Cs~X(t) + 2Cd~g~g.,~'(t )
(10)
It can be shown 8'1° that if the input acceleration process ~-(t) is a continuous white-noise of constant power spectral density 60, then the continuous response process a(t) = Z(t) is covariance equivalent (discretely coincident) with the discrete ARMA(2, l) process. For the continuous, as well as the discrete case, the autocovariance and autocorrelation functions (ACF) coincide since both input and output have a zero mean. The equivalence between the parameters of the discrete model (¢1,¢2,01,~e 2) and the parameters of the con- tinuous model (~g, ~g, Cs/Cd, 60) is obtained by compar- ing and equating, at all discrete times tn =nAt , n = 0, 1 ,2 , . . . , the autocorrelation functions of the discrete and continuous models. The latter are pre- sented in Tables 1 and 2, respectively, where the autocorrelation function is expressed as the product of the variance (= mean-square value) and the autocorre- lation coefficient function (ACCF) Pn or p(T). In the case of the discrete ARMA(2, 1) model, the ACF can
c s x(t) b k
I, C
z(t)
m
C) O
Fig. 2. Underlying physical system.

414 J.P. Conte, K.S. Pister, S .A. Mahin
Table 1. Discrete autocorrelation coefficient function p.
Zone p, = p(nAt), n = 0, 1,2,...
Pn = en/2 ln(-¢2)COS (nO - - #d) cos ( - m )
// 2Pl_Zel .'~ m =arctantv/_(¢~+402) ), O=arccos
01(1 - - 0 1 2 - 0 1 0 1 ) - 0 1 ( 1 - -02 )
Pl = (1 -- 02)(1 + 02 -- 0101) -- 0101(l + 02)
II
I p~ = e ~" cosh (6n) -¢ e c p l - - cosh ( 6 ) [ sinh (6) sinh (6n)]
01 + q O 2 + 402 c = ½ In (-.2), 6=½In
01 - ~/~ + 402
p~ as for Zone I
III
f p ,=e ~ (-1) ~cosh(6n)+(-l) "+le-cpl +c°sh(6) sinh(6n) [ sinh (6) ]
c, 6, and Pl as for Zone II
IV
Variance:
{ P n = eCn cosh (6n) + (-1) n+le-cpl -cosh (6) sinh (6n) [ sinh (6) ]
, ½In( C = = 01 - - ~ ) , and pl as for Zone I
2 (l -- 02)(1 + 012) 20101 2 (Zones I, II, III, IV) E[a~] = a a = (1 ~- ~ 1 C~)T---~-~ O-e
Table 2. Continuous autocorrelation coefficient function p(T)
Underdamped case: ~g < 1
p(r) = e -~,~,I~I [cos (w# IT] - #o)] [ cos(-~,c) J
- 4 c h ~ ) ~ Wgd = Wg~/1 -- ~g 2, #c = arctan [((CI + 4C~(~) 1 ~ _ ~g 2
Overdamped case: ~g > 1
p(T) = e -~*lTI cosh (~g ~g2 _ llTb) + Cs 2 2 2 -- 4Cd(g ~g
C~ + 4 C ~ ~2g2 1
Variance: E [a(t) 2] = 71"00~3g(c2 2 2 2 (g ' v s +4Cd(g)
- 5 < u ~ < 5
_ _ s i n h ( w g ~g~l~llz])

Nonstationary ARMA modeling of seismic motions 415
Table 3. Discrete/continuous parameter relationships for Zone I (Underdamped case: CC < 1)
Table 4. Discrete/continuous parameter relationships for Zone II (Overdamped case: [, > 1)
Continuous-to-discrete conversion:
c$, = 2e-CaWgA’ cos (ws r
1 - <iAt)
42 = _e-2~~w&~
0, = solution of: 0: + 2PlWf#+&lB +lcO
41 -Pi(l -42) ’
0 < wg 1. & = Nyquist frequency
(1 - 42)(1 + 6 - WJlh 2
(1 + 42)[(1 - d2j2 - dl a, = 9 F (Cs’ + 4ci&
g
Discrete-to-continuous conversion: (4, , c$~, 0,)
ug=j&JM
Eg = Jff$$&g
41 Ad = arccos ~ ( ) 2&i&’
OIXd<”
C#q(l+0:-e,~1)-~,(1-4:)
p1 = (1 - 42)(1 + 0: - wl) - 44+(1 +e2)
take four different forms depending on which subregion of the stability region the autoregressive parameters belong to. These four subregions are referred to as Zones I, II, III, IV, and are shown in Fig. 1. For the
continuous model, both underdamped (5s < 1) and overdamped (& > 1) cases have been considered. By comparing the mathematical expressions in Tables 1 and 2, it can be observed that coincidence of the continuous and discrete ACFs at all discrete times (t, = nAt, n = 0, 1,2, . . .) can exist only in Zones I and II. The terms (- 1)” and (-l)“+’ prevent that discrete coincidence in Zones III and IV. It is also noticed that Zones I and Zone II correspond to the underdamped and overdamped case, respectively. The one-to-one mapping between the continuous and
Continuous-to-discrete conversion:
42 = _e-2LGl
$1 = -cd2 + 5, X = 2e-~s(Es-mAl
8, as in Table 3
PI = a cash (6) +
I
(1 - 42)(1 + 0:) - wlel 2
(1 + 42)[U - 42J2 - dl a, = +O p (CT; + 4C$$)
g
Discrete-to-continuous conversion: ($I, 4b2, 0,) + (%&~)
rg =
\
b (-42)12
[ln(-+2)12 -4[arccosh (&)I2
wg =&i b-42)12 -4[a==h (A)]’
p1 as in Table 3 and 6 as above
discrete parameters is summarized in Tables 3 and 4 for Zone I (underdamped case) and Zone II (over- damped case), respectively. This mapping depends on At, the sampling time interval. In the underdamped case, unicity of the discrete representation is warranted provided that At is sufficient1 small, so that the damped natural frequency (ws J--+ 1 - [s) is smaller than the highest frequency, 1/2At, known as the Nyquist frequency (fNYq). As indicated in Tables 3 and 4, the relationship between the variance of the input discrete white-noise and the power spectral density 4s of the continuous input white-noise is obtained by equating the variances of the discrete and continuous output processes.
The well-known Kanai-Tajimi (K-T) earthquake mode117129 corresponds to the absolute acceleration response at ground level due to a white-noise accelera- tion input at bedrock level, the transfer between bedrock and ground levels being modeled as a linear viscously damped SDOF system. Therefore, the K-T stochastic earthquake model is covariance equivalent with the

416 J . P . Con te , K . S . P i s ter , S . A . M a h i n
Continuous 2o
o 5 1 0 15
Freq (Hertz)
Kanai-Tajimi
2b
2 O
1 0
5
O o
Equivalent ARMA(2,1)
5 1 o 1 5 2 0 2 5
Freq (Hertz)
Fig. 3. Kanai-Tajimi and equivalent ARMA(2,1) power spectra.
subset of the ARMA(2, 1) model corresponding to a unit value of the spring-dashpot input ratio (Cs = Cd = 1). For firm ground conditions, at moder- ate epicentral distance, Kanai and Tajimi have suggested the following parameter values: cog = 57r (or Tg =-0.4sec) and ~g = 0-6. From the continuous-to- discrete conversion in Table 3, the corresponding ARMA(2, 1) parameters are:
(COg = 571-, ~g : 0.60, C s / C d = 1.0, q~0 = 1.0)
(01 = 1.604, 02 = -0.686, 01 = 0"767, a~ = 39'08,
At = 0.02 sec)
The Kanai-Tajimi and ARMA(2, 1) power spectra corresponding to these numerical values are shown in Fig. 3. The K-T spectrum is defined for all frequencies (0<f<_ co), whereas the ARMA(2,1) spectrum is defined for frequencies in the Nyquist range (0 < f_< fNyq)" Therefore, if the value of the K-T power spectrum at the Nyquist frequency is small, the K-T and ARMA(2, 1) spectra practically coincide throughout the whole Nyquist range as in Fig. 3. Otherwise, the ARMA model reproduces the spectral density of the SDOF system only up to the point where the influence of the aliasing phenomenon becomes apparent.
N o n s t a t i o n a r y c a s e
Typical earthquake records exhibit important non- stationarities in amplitude (or intensity) and frequency content as emphasized by Liu. 2° Their taking into
consideration for seismic response prediction of struc- tures is very important, although the nonstationarity in frequency content has often been disregarded in the past. In order to represent these two types of nonstationarity, a time-varying or dynamic version of the ARMA model of eqn (1) is chosen:
a k - Ol,kak_l . . . . . Op,kak_p
= crke k -- Ol,k(Crk_lek_l) . . . . . Oq,k(O-k_qek_q) (l 1)
where now {ek} is a unit-variance discrete Gaussian white-noise. The nonstationarity in amplitude is repre- sented by the variance envelope {a~,k} of the driving noise, whereas the nonstationarity in frequency content is modeled by the time-varying ARMA parameters qSi. k and Oi,k. This uncoupling of the two types of non- stationarity is possible provided that the standard- deviation envelope {~rk} is slowly-varying in time compared to the periods of the earthquake process oscillations.
Motivated by the theoretical spectrum of a stationary ARMA process given in eqn (6), Kitagawa 18 defined the following instantaneous spectrum of a time-varying ARMA process by simply replacing the time-invariant ARMA coefficients with their time-dependent counterparts:
q 2 ~ ' ~ tl - i2r~i fAt l 1 - / _ . . , vj,k~
p ( f , k) -- 2a~, k j=l At, 1 P 2 .4. ~ i2~j , fAt
/__., ~'j,k'~ j = 1
(0 < f < ,)CNyq) (12)
This instantaneous spectrum can be easily interpreted as a non-negative frequency-time decomposition of the expected earthquake energy. It is noteworthy that the above definition of the instantaneous power spectrum is not related to the classical instantaneous power spectrum defined by Page; z4 the latter is a partially negative frequency-time decomposition of the expected energy of a process.
Previous investigators have used time-varying linear time series models to represent and simulate strong earthquake ground motions. Determination of univari- ate and multivariate stationary ARMA models com- patible with a given analytical power spectrum or spectral matrix was presented by Spanos z7 and Spanos & Mignolet. z8 Polhemus & Cakmak, 26 Chang et al., 8
and Cakmak et al. 7 considered ARMA models modulated in amplitude using a variance envelope function. Jurkevics & Ulrych, 16 Gersch & Kitagawa, 13 Deodatis & Shinozuka, 11 and Papadimitriou 25 have used time-varying AR models, nonstationary in both amplitude and frequency content, estimated either directly from real earthquake accelerograms or from specified analytical evolutionary power spectra. In the present study, time-varying ARMA models are con-

Nonstationary ARMA modeling of seismic motions 417
sidered. They are more difficult to determine from earthquake records than AR models, but they have two important advantages compared to AR models: (i) they allow the modeling of sharp dips and sharp peaks of the ground motion power spectrum with fewer parameters since their transfer functions have both poles and zeros, unlike the all-pole AR models; and (ii) under certain conditions, they can be interpreted exactly as sampled output processes from white-noise excited multi-degree- of-freedom systems•
IDENTIFICATION OF TIME-VARYING ARMA MODELS
In this study, two methods were used to estimate the time variation of the parameters of a given ARMA model from an actual earthquake accelerogram. These two methods are described below.
Moving time-window technique and windowed- periodogram spectral estimation
The conventional method, called moving time-window technique, stems from the assumption that the non- stationary time series analysed is approximately station- ary within a time-window of size nwdAt. Standard statistical methods from time series analysis can then be used to estimate the ARMA parameters characterizing this segment of accelerogram. The parameter estimates corresponding to a certain window position are attached to the center point of the window. This stationary parameter estimation is repeated for successive equi- distant window positions. In this study, the subroutine FTML from the IMSL library 15 has been used to perform the maximum likelihood estimation of the ARMA parameters and driving white-noise variance given a stationary time series. The time-window should be short enough to capture rapid changes in frequency content and long enough to provide for stable estimated parameters and the ability to capture low frequency com- ponents. From the experience gained in this research, it seems that a window size of 5"00 sees, corresponding to 251 ground acceleration values and a sampling time interval of 0.02 sec, realizes a good compromise.
The temporal variation of the frequency content of the earthquake record is estimated using the windowed- periodogram spectral estimation technique. The periodogram estimate of the power spectral density 6 of a stationary time series {ak, k = 1 , . . . , L) is defined as:
At A '~ ,.2 e k = P ( ~ g ) = ~ ( ~)1 (13)
where A(~k) is the discrete Fourier transform of {a~}:
L - I a e -i27rnk/L A(~k)=z. .a n , k = 0 , . . . , L - 1 (14)
n=0
and ~k = kA~o, A~ = 2~-Af, A f = 1/LAt = frequency resolution. From the discrete form of the Parseval's theorem which expresses that the total power in a signal is the same whether it is computed in the time domain or in the frequency domain, it follows that:
L-1 L - I L - I p(~k)ALv 1 = 27r ~-~ e ( f k ) A f = -~ ~'~ a 2 (15)
k=0 k=0 k=0
For a zero-mean time series {a~}, the right-hand-side of eqn (15) represents the sample variance. As in the case of a continuous-time stochastic process for which the variance equals the area under the process power spectral density and as in eqn (7), eqn (15) expresses that the area under the periodogram is equal to the variance of the time series and reveals how it is contributed at the various discrete frequencies (fk = k A f , k = 0 , . . . , L - 1 ) . The discrete Fourier transform in eqn (14) is computed using a fast Fourier transform algorithm. To reduce the spectral leakage 6 between neighboring discrete frequencies, the Parzen taper 6 is applied to the segment of data {ak, k = 1 , . . . ,L} prior to computing their Fourier trans- form. In order to reduce the large variance of the periodogram estimate defined in eqn (13), spectral smoothing using the differential weighting [1/4, 1/2, 1/4] is applied. The windowed-periodogram spectral estimation technique consists in evaluating the periodogram over successive overlapping windows of the data {ak}.
Iterative Kalman filtering
The basic idea of a time-adaptive algorithm is to optimally update the system parameters at each time step using the observation at this time step. In this manner, a continuous description of the time-varying properties of the input data is obtained. A technique of adaptive estimation based on Kalman filtering theory is used for the identification of the time-varying ARMA coefficients of the earthquake model represented by eqn (1 1). This technique represents an iterative version of a previous method developed by Nau et al. 21
For application of the Kalman filter, the general dynamic ARMA(p,q) model represented by eqn (11) must be recast in the following discrete state-space f o r m :
{~+~ = {~ + ~ k
T ak+l = Hk+l~k+] + ek+l
where - , • T
~k = [ t~ l ,k , ' " O p , k , - - O l , k , ' ' ' , - - q,k] • ~ T
~k = [61,k , ' " , p+q,k]
H k = [ a k _ l , . . . , a k _ p , e k _ l , . . . , e k _ q ] T
(16)
(17)
(18)
(19)
(20)

418 J.P. Conte, K.S. Pister, S.A. Mahin
In the above equations, the superscript ( ) ~ indicates the transpose operation. The earthquake signal model is thus completely defined by eqn (16), called the transition (or state) equation and which governs the 'motion' in time of the state vector (k, and by eqn (17), called the observation (or measurement) equation. The state vector (k is partitioned in such a way that the first terms are the autoregressive parameters and the remaining terms the moving average parameters. The random vector ~k represents the motion or dynamic noise, also called 'plant' noise in the control literature. The observation ak represents the observed ground acceleration value at time tk = k A t (k = 0, 1 ,2, . . . ) . The vector Hk, called the 'history' vector, gives the ideal (noiseless) connection between the observation ak and the state vector (k at time k. Finally, {ee} represents the nonstationary Gaussian driving white-noise of the ARMA model. The following assumptions are made:
E[6k] : 0, CoV[6k,6ff] = ~6 (21)
E [ek] = 0, Var [ek] = azk (22)
Cov [6k, ek] = 0. (23)
The random walk model for the parameter vector (k adopted in eqn (16) may not appear physically reason- able. However, it is the simplest equation of motion that can be assumed in the absence of detailed prior information about parameter behavior. In this context, it is merely a device for ensuring that the Kalman filter will remain continually adaptive to any changes in the parameters that may occur. The covariance matrix ~6 governs the average step size of the random walk assumed for the parameters and therefore it determines the long-run sensitivity of the filter to changes in the parameters. In this study, it has been assumed that ~ = O-~I, where O-6 is a small number compared to average values of the parameters, (e.g. O-~ < 0.01). The problem of 'tuning' the filter to obtain parameter estimates which on one hand respond quickly to nonstationarities in the data, but on the other hand are not unstable, is difficult and has been tackled by trial-and-error in selecting the parameter a6.
The discrete-time Kalman filter 2'1°'21 provides a set of recursive equations to trace the evolution of the probability distribution of the state vector ~k in time. The expected value of ~k conditional on the observations up to time k - 1 and k are called the prior and posterior expected value of ~k; they are denoted by ~k Ik-1 and ~k Ik, respectively, and are used as estimates of the parameter vector ~k. Let Pk Ik-1 and Pk Ik denote the corresponding estimation error covariance matrices defined by E [((k - ~ k l . . . ) ( ~ k - - ~kl...)T]" At first, ~klk-I and eklk-I are computed using the predictor Kalman filter equations and then ~klk and Pklk are obtained using the updating Kalman filter equations. The presence of moving-average terms in the selected earthquake model introduces some nonlinearity in the filtering problem,
since products of unknown parameters and noise values appear in the observation, eqn (17). Therefore, some form of 'linearization' of the basic Kalman filtering algorithm is required. Note that, in practice, the true measurement noise {ek} is never observed directly. Hence, when implementing the Kalman filter, estimates of the true noise terms (ek, . . . ,ek_q+l) must be substituted in the 'history' vector Hk+l. The residuals corresponding to the difference between prediction and
H T ^ observation, i.e. Ok+l = a k + l - k+l(k+llk+l, are used for this purpose. Furthermore, the variance envelope of the true driving noise {o-e2k} is needed as input to the Kalman filter. Because {~,k} is a priori unknown, the Kalman filter is applied iteratively using a succession of improved estimates of the true noise variance envelope.
O -2 For the first iteration, a rough estimate of { e,k} is obtained by using a scaled version of the variance envelope estimate of the observed process (earthquake record). The variance envelope estimate of the residuals generated by the first application of the Kalman filter is then used as an estimate of the true noise variance envelope during the second application of the Kalman filter. The Kalman filter is applied iteratively until the difference between the assumed noise variance envelope and the variance envelope estimate of the residuals generated by the Kalman filter satisfies a given error tolerance. The non-parametric variance-envelope esti- mation technique developed by Nau e t a l . , 21 called the 'two-stage weighted moving average estimate', has been used in this study. The p initial digital ground acceleration values of the earthquake record analysed are used to build the initial 'history' vector lip = Iap_l, . . . ,ao, O,...,O] r in which the estimates of the initial true noise terms are taken to be zero. Initial conditions for the state v e c t o r , ~p-llp-1, and the error covariance matrix, Pk-~lk-l, are also required. An initial estimate for the state vector is obtained by performing a maximum likelihood estimation within a time window positioned at the beginning of the earthquake record. An initial error covariance matrix equal to the covariance matrix ~:6 of the random walk of the ARMA parameters is chosen. The first observed data used by the Kalman filter is ap. From these initial conditions, the Kalman filter is run recursively until the last data element aN_ 1.
MODEL VERIFICATION
If an ARMA model were to fit perfectly a real earthquake accelerogram, it would map the highly correlated time series corresponding to the actual accelerogram into a realization of a perfectly uncorre- lated stationary Gaussian white-noise. Therefore, the first type of model diagnostic checking is applied to the final (converged) sequence of normalized residuals {ek/6e,k} given by the model estimation procedure.

Nonstationary ARMA modeling of seismic motions 419
These residuals are checked for 'whiteness' or uncorrela- tion and normality. However, a model is never perfect and in the present case, the imperfection can be attri- buted to the following reasons:
• The model estimation procedure generates inaccurate or incorrect results.
• The selected model order (p, q) is not adequate for the nature of the particular earthquake process considered.
• The assumption of a linear earthquake model is too restrictive given the various non-linearities associated with the actual physical earthquake process.
The next question to be addressed is whether the imperfect estimated earthquake model is sufficient for representation of the ground motion variability and the corresponding structural response variability associated with a given real earthquake process. To answer this question, the estimated earthquake model is used further for ground motion and structural response simulation.
The second type of model diagnostic checking is applied to individual or an ensemble of simulated accelerograms to verify the extent to which they resemble the actual 'target' accelerogram. For this pur- pose, the following checking operations are performed:
• Analyse ARMA-model-simulated accelerograms, uti- lizing the analysis and estimation techniques used on the 'target' accelerogram. The objective of this analysis is to verify the accuracy with which the esti- mation techniques can recover the 'true' parameters of the earthquake process when they are known.
• Compare ground velocity and displacement from simulated and 'target' motions. This test is used to insure that not only the simulated ground accel- eration, but also the corresponding ground velocity and displacement time histories are realistic, since the latter two can control the earthquake response of certain structures.
• Compare the Fourier amplitude spectra of the simulated and 'target' ground motions (acceleration, velocity, and displacement). The Fourier amplitude spectra give an indication of the global frequency content over the whole duration of the earthquake.
• Compare the instantaneous spectrum of the fitted ARMA model to the windowed-periodogram esti- mate of the time-varying power spectral density characterizing the 'target' accelerogram.
• Compare the traditional ground motion parameter values of the 'target' earthquake to the statistics of these parameters computed from an ensemble of simu- lated earthquakes. The ground motion parameters considered include: peak ground acceleration (PGA), velocity (PGV) and displacement (PGD), root- mean-square acceleration (RMSA), velocity (RMSV) and displacement (RMSD), and Housner's spectral intensity (SI).
Residual checks
Checking of the normalized residuals (Wk = ek /Oe ,k , k = 0 , . . . , N - 1) for uncorrelation ('whiteness') can be performed either in the time domain, based on the sample autocorrelation coefficient function, or in the frequency domain, based on the periodogram. The sample autocorrelation coefficient function (ACCF) at lag (kAt), f~k, is defined as:
~k = k k l k o (24)
where
1 N-k-I k k = ~[ ~ (Wi-- ~;)(Wi+ k -- ~;)
and ~ = (1/N)EN-lwk. If {Wk} is a purely random (uncorrelated) process, it can be shown 19 that:
,,~ 1 for a l l k ¢ 0 (25) E [tSk] = 0 and Var [t~k] = ~ ,
Hence, on the basis of the asymptotic normal distribu- tion of tSk, an approximate 95% confidence interval for Pk is ( -2xflxf~, 2x/lxf~). Another time domain test for goodness of fit is provided by the so-called 'Portman- teau' statistic: 5
n
O = N Z FSk (26) k = l
where N is the number of data points, and n -~ N/5. Under the hypothesis that the residuals are completely uncorrelated, Q is approximately chi-square distributed with the number of degrees-of-freedom equal to n minus the number of estimated parameters, (p + q). Therefore, an approximate 'Portmanteau' test of the hypothesis of model adequacy may be made by referring an observed value of Q to a table of the percentage points of X 2. However, as a general rule, a value of Q not much larger than the number of DOFs is considered to indicate a good fit. In the frequency domain, visual inspection of the periodogram computed from the normalized residuals is used to check their whiteness. A non- uniform shape of the periodogram reveals the presence of correlation among the residuals.
The normality test of the normalized residuals is performed by visual inspection of their plot on normal probability paper. For this purpose, the ruth value among N residuals (pre-sorted in increasing order) is plotted versus the standard normal value corresponding to the cumulative probability m / ( N + 1). A lack of linearity in the resulting graph of data points suggests that the underlying population is not Gaussian.
Simulation of artificial ground motions
To simulate artificial ground motions, the estimation or analysis procedure is simply reversed. The sequence of

420 J.P. Conte, K.S. Pister, S.A. Mahin
operations performed is: (1) computer generation of a stationary, Gaussian, discrete white-noise; (2) time- modulation using ~e(t); (3) ARMA filtering using (~i(t), i = 1 , . . . , p ) and (Oi(t), i = 1 , . . . , q ) ; and (4) baseline correction using a high-pass Butterworth filter with cut-off frequency at about 0"1 Hz to eliminate part of the low frequency error introduced by the ARMA model. The discrete Gaussian white-noise is generated using the subroutine G G N M L of the IMSL library. 15 Lack of cross-correlation between the members of an ensemble of artificial earthquake records simulated from the same estimated earthquake model is achieved by using a different seed number for each white-noise sequence generation.
Alternatively, artificial ground motions can be simulated based on specified time-varying physical properties of an underlying dynamic system such as the parameters COg(t), ~g(t), and (Cs/Cd)(t) for the ARMA(2, 1) model. The time-varying physical parameters are then converted into the corresponding time-varying ARMA parameters using the continuous- to-discrete parameter conversions. This approach can be generalized to multi-modal higher order ARMA ( 2 n , 2 n - 1 ) models which are exactly covariance- equivalent with the sampled output of white-noise excited n-degree-of-freedom dynamic systems. This simulation procedure allows us to generate artificial ground motions com-patible with given evolutionary spectral properties described in terms of time-varying modal properties which are very meaningful to the dynamist.
APPLICATIONS
Applications of the stochastic model identification pro- cedures described above are presented for two real earthquake accelerograms having very different char- acteristics. The first one corresponds to the north-south component of the moderate magnitude earthquake (ML = 6'5), referred to as Event 39, recorded at the station E-02, classified as a rock site, of the SMART I accelerograph array in Taiwan. 1 The ground accelera- tion, velocity and displacement time histories of this seismic event are shown in Fig. 4. The ground acceleration record has been digitally recorded with a time sampling interval of 0.01 second. Hereafter, this record will be referred to as E02NS. The second target accelerogram corresponds to the north-south com- ponent of the 1940 Imperial Valley earthquake recorded at El Centro, California, on a deep firm alluvion deposit. The ground acceleration, velocity and displacement records are represented in Fig. 5. Only the first 35 seconds of the original record, digitized with a time sampling interval of 0"02 second, are considered in this study.
The parameters of the time-varying ARMA(2,1) model identified from the E02NS record represented in
1oo
- 5 0
-I00 ~ , ' r
5t I~ SMART I : E-02 NS (Ev, 39)
o ~ J" ~ , - ~ f ~ - ~ . . . . .
-,i ] , , , , ~b ~ . . . . . . . !
0 2 4 8 8 10 12 14 16 18 S e e s
Fig. 4. (a) Ground acceleration, (b) velocity, and (c) displacement time histories of the E02NS record.
Fig. 4(a) using both the iterative Kalman filtering scheme and the moving window technique are dis- played in Fig. 6. The results obtained using these two different methods agree overall. To evaluate the variance envelope by 'two-stage weighted moving average', a window size of n = 30 data points was used. For the Kalman filter, a trade-off value of ~r~ = 0"008 was selected by trial-and-error. A value of ~r~ which is too small produces a stable but too slow learning rate of the Kaiman filter, which is unable to capture sharp changes in the structure of the earthquake signal. On the other hand, a value of ~r~ which is too large yields a fast learning rate, which results in very irregular and unrealistic time variations of model parameters. In applying the moving window technique, the following parameters were used: nwdAt = 1.0sec, time interval between successive window positions = 0.25see. The convergence of the iterative Kalman filtering scheme is illustrated in Fig. 7 via the convergence of the standard deviation envelope estimate ~,~ of the driving noise. In all cases considered in this study, a few iterations sufficed to obtain convergence. By using the discrete-to-
150 NTR 194 N ~ooJ I ELCE o o -s
"oo so ! '
._~ -so I ~ l ~ l ~ . . . . . . . . -ioo I (a) -t50 , , • , . . . . r '
15 , 1° I 5 ' t , I , ]J EL CENTRO 1940 N - S , ,'~
-1o
6 t EL CENTRO 1940 N-S /
~ ~ (c) - 6 ~ r , . . . . I • i . . . . i . . . .
0 5 10 15 20 25 30 35 SCCS
Fig. 5. (a) Ground acceleration, (b) velocity, and (c) displacement time histories of the El Centro 1940 record (N-S comp.).

Nonstationary ARMA modeling of seismic motions 421
2
0
,,-el
~ e 3 - ,, , 2 " ' ,
0 0 2 4 6 8 10 12 14 16 18 Sees
Fig. 6. ARMA(2, 1) model parameter estimates for the E02NS record.
continuous conversion relationships summarized in Tables 3 and 4, the time histories of the physical parameters corresponding to the ARMA(2, 1) model parameters of Fig. 6 have been computed and are depicted in Fig. 8. From Fig. 8(a), it can be seen that the predominant frequency Fg of the ground accelera- tion drops from 14 Hz to 7 Hz during the first 4 seconds of ground shaking, oscillates with an average value between 6 and 8 Hz in the middle portion of the ground motion, and finally drops to an average of 4 Hz at the end of the earthquake. In Fig. 8(b), the time history of the damping ratio parameter ~g indicates that the fre- quency bandwidth of the ground acceleration decreases during the first 3 seconds and then increases almost mono- tonically until the end of the record. The underlying SDOF model becomes overdamped ((g > 1) only in the last few seconds of the record. The evolution in time of the input ratio parameter 'sign ( (Cs /Cd)2 )V~[Cs~d)2[ ' is displayed in Fig. 8(c). It is observed that the input of the
:I ,.r--.o
• , , • ~ ~ ~ . ; . ,
4
3 ~ IteraUon # 4
~ e 21
0 I I ~ : 1 r 4
3 ~ Ir, c~ f ion # 5
o 2 4 6 8 10 12 1~* 1 ; 18 s ~
Fig. 7. Convergence of the iterative Kalman filtering scheme.
"", Kafman filter 15 " . . . . . . . Mov ing w i n d o w
F g I H z ] 10 " ' ,
5 " " -
0
3
40
±~(c/%)~ I ~o o I
0 2 4 6 8 10 12 14 18 18
Fig. 8. Time histories of physical parameters for the E02NS record.
underlying SDOF model is imaginary ((Cs/Cd)2< O) during the first 8 seconds and then becomes real-valued with the ratio Cs/Cd taking a large value (>> 1), which means physically that the dashpot support of the SDOF model shown in Fig. 2 is almost fixed.
The time history of the normalized (amplitude- demodulated) residuals produced by the fitting of the ARMA(2, 1) model is shown in Fig. 9(a). The residuals sample ACCF Pk calculated up to a lag-time equal to one-fifth of the duration of the E02NS record is plotted in Fig. 9(b). The periodogram of the residuals obtained using a Parzen taper and without smoothing is displayed in Fig. 9(c). Figure 10 is similar to Fig. 9, but corresponds to an ARMA(4,2) model fitted to the E02NS record. The two parallel dashed lines present in Figs 9 and 10 define the approximate 95% confidence interval for the sample ACCF F3k under the hypothesis that the residual process is purely random as indicated in eqn (25). It is observed from Fig. 9(b) that the residuals generated by the ARMA(2, 1) model fitted to the E02NS record possess some correlation structure at
I i 5 , i SMART I E '02 $ (Ev 39) ,
0
-~ [ " ' ; '8 ' ' ' ' ' ' ' 0 2 " 2 4 10 12 !4 16 18 sees
o, | . . . . . . . . . . . . , . . . . . I
- - -
(b) -0 .2 = *
o.1, SMART I : E-02 NS (Ev. 39
0 01 i
oom;
0 . 0 0 0 1
0 0 0 0 0 1 . . . . , . . . . , , . . . . , , 6 3 5 1270 H z
Fig. 9. Normalized residuals from the ARMA(2, 1) model fitted to the E02NS record: (a) time history, (b) sample
autocorrelation function, and (c) periodogram.

422 J.P. Conte, K.S. Pister, S.A. Mahin
0 2 4 6 B 10 12 14 16 18
o ~ v~'~--'-J-'~:~'~:x~t::a;r~~='~:v--~rr-~-" - l i (b) - 02 / , , ,
0 1 2 3 4 s e c s 01
SMA I E-02 NS (Ev 39 0.01 '
0001
0 .0001
000001 Hz
Fig. 10. Normalized residuals from the ARMA(4,2) model fitted to the E02NS record: (a) time history, (b) sample
autocorrelation function, and (c) periodogram.
small time-lags (~- < 0.20 sec). Figure 9(c) reveals a non- uniformity of the power spectral density of the under- lying residual process characterized by a partial spectral gap between 25 Hz and 40 Hz. By comparing Figs 9 and 10, it appears that the ARMA(4, 2) model is better than the ARMA(2, 1) model since its residuals are more uncorrelated. The results of the Portmanteau and '95% confidence interval' statistical tests are summarized in Table 5 for the residuals of the ARMA(2,1) and ARMA(4,2) models as well as for three computer- generated discrete Gaussian white-noises of the same duration (length). These results confirm the superiority of the ARMA(4, 2) model over the ARMA(2, 1) model since the former model has a smaller Portmanteau statistic value and a smaller percentage of t5 k outside the 95% confidence interval. To quantify the uncorrelation
or whitening effect of the ARMA filters, the statistical test values are also reported in Table 4 for the amplitude-demodulated E02NS record obtained by scaling the original E02NS record by the inverse of its estimated standard-deviation envelope. The same statis- tical tests have been performed on the residuals generated from fitting an ARMA(2, 1) model to the El Centro ground acceleration record (see Fig. 5(a)), and are reported in Table 6. From these results, it is observed that the representation of the El Centro record by an ARMA(2, 1) model is superior to the representation of the E02NS record by either an ARMA(2, 1) or an ARMA(4, 2) model. The normality tests performed on the normalized residuals generated from fitting an ARMA(2, 1) model to the E02NS record and to the E1 Centro record are also represented in Figs l l(a) and (b). In the case of the E02NS record, the linearity of the cumulative distribution of the residuals indicates that the underlying population of residuals is well represented by the Gaussian distribution. The same was observed for the ARMA(4, 2) model. However, in the case of the E1 Centro record, the underlying population of residuals is not Gaussian as shown in Fig. 1 l(b).
The normalized ARMA time-varying power spectral densities derived from the Kalman filter results are compared to the normalized moving periodogram estimate of the time-varying frequency content of the E02NS record. This comparison is shown in Fig. 12. It is observed that when a single predominant peak is present in the periodogram estimate, it is captured accurately by both the ARMA(2, 1) and ARMA(4, 2) models, see Figs 12(a), (b), and (c). On the other hand, when several spectral peaks of the same magnitude are present in the periodogram estimate, both the ARMA(2,1) and
Table 5. Statistical tests for the A R M A models fitted to the E02NS record
Model Q # DOFs Percentage of Pk outside 95%
conf. interval (%)
ARMA(2, 1) 883 375 16 1 ARMA(4, 2) 567 372 93 Discrete white-noise #1 293 378 3.2 Discrete white-noise #2 334 378 1.9 Discrete white-noise #3 358 378 4.5 Ampl.-demod. E02NS 4774 370
Table 6. Statistical tests for the A R M A model fitted to the El Centro 1940 record
Model Q # DOFs Percentage of Pk outside 95%
conf. interval (%)
ARMA(2, 1) 447 347 68 Discrete white-noise #1 273 350 2.6 Discrete white-noise #2 311 350 2.9 Discrete white-noise #3 322 350 4.6 Ampl.-demod. E1 Centro 4961 350

Nonstationary A R M A modeling o f seismic motions 423
2
T3 0 -
-2
-4 -4 4
SMART I E-02 NS (Ev 39) /
(a)
Standard normal
5 EL CENTRO 1940 N-S
0 (b)
-s I . -5
Standard normal
Fig. 11. Normality test of the normalized residuals correspond- ing to the ARMA(2, 1) models fitted to (a) the E02NS record and (b) the E1 Centro 1940 record.
0.5 f t - 1.5 sec (a) I
0 4 - - Periodogtllm t ...... ARMA(2.1) epsd
0 3 " I - - - - - ARMA(4.2) epltd I
0.1 , "
o.o ~ , ,~. i , 0.5
0.4- [i 0.3- 0.2- 0.1- 00 0.5
t -- 4.0 sec 0.4-
t - 2,5 =ec (b)
~-~, .~ .~
(c)
O 5 10 15 20 25 Freq. (Hertz)
0.5
0 .3~00 .20 .14 ,, t = 5.0,,, =ec (d)
0.0 ~:, .... , .... 0 .6 /
t -- 7.0 lee (e) 0.4 /
0 . 3 0.2
0.1 "'"".,
O 0 , . ~ . . . .
0.5 ~ t - 10.0 *ec (f) 0.4~7 0 .3
0 .2
0.1 -,
0 , 0 - : . , , . . . . 0 5 10 15 20 25
Freq. ( H e r t z )
Fig. 12. Comparison between normalized time-varying ARMA power spectral estimate and normalized moving periodogram
for the E02NS earthquake process.
ARMA(4,2) time-varying power spectral densities exhibit a single peak whose position and shape can be interpreted as some weighted average of the positions and shapes of the spectral peaks indicated by the periodogram (see Figs 12(d), (e), and (f)). Even though
the ARMA(4,2) model is bi-modal (can develop two spectral peaks), its Kalman filter estimate, in this particular example, was unimodal at all times. The graphic representation in frequency-time of the normalized ARMA(2, 1) power spectral density esti- mates for both the E02NS and the E1 Centro records are displayed in Fig. 13. These 3-D plots indicate the temporal variation of the frequency content of the ground shaking, commonly called frequency non- stationarity.
Artificial ground acceleration, velocity, and displace- ment corresponding to a single realization of the ARMA(2, I) model fitted to the E02NS and E1 Centro records are shown in Figs 14 and 15, respectively. It is observed that the nonstationary amplitude and fre- quency characteristics of the target records are well captured by the ARMA(2, 1) models. However, from the artificial ground velocity and displacement it is observed that the very low frequency content of the artificial ground motions remains too high in spite of the high-pass Butterworth filtering applied with a cut-off frequency at about 0-10Hz. This can be further corrected by increasing slightly the value of the cut-off frequency. The ARMA-simulated accelerogram repre- sented in Fig. 14(a) has been analysed, utilizing the same iterative Kalman filtering scheme which was used to estimate the ARMA model from the target record. The results are presented in Fig. 16 and show that the 'true' model parameters shown in Fig. 6 can be recovered relatively well from an artificial realization.
Stat i s t ics o f ground m o t i o n parameters
Using a sample of 100 artificial earthquake ground motions, the second order statistics (mean and coef- ficient-of-variation, c.o.v. = standard deviation/mean) of traditional ground motion parameters have been computed. These ground motion parameters include: peak ground acceleration (PGA), velocity (PGV), and displacement (PGD), root-mean-square acceleration (RMSA), velocity (RMSV), and displacement (RMSD),
(a)
O
(b)
Fig. 13. Normalized ARMA(2, 1) time-varying PSD estimate for (a) the E02NS record, and (b) the El Centro record.

424 J.P. Conte, K.S. Pister, S.A. Mahin
l O O
0
- ) o o i , , • i
( a )
• ' - - q l
-5 I . . . . . ' (b) ,
0 "
-I 0 2 4.
t ._ -_. f - _ (c) .
, ' , ' , • i , ,
8 1 0 12 1 4 16 1 8 s e e s
Fig. 14. ARMA(2, 1) artificial earthquake ground (a) accel- eration, (b) velocity, and (c) displacement corresponding to
the E02NS record.
1 6 0 .
-I00 ( a )
- 1 5 0 . . . . , . . . ,
2 0 A
.2o )l (b)
- 3 0 . . . . . ~ , . . . . , . . . . , . . . . . . .
1 5 ; ~'" \\
._= o .... ,, "-~ ~ .....
, .,' ( c )
- 1 5 . . . . , ' , ' ' r . . . . i ' , • • , . . . . 0 5 1 0 15 2 0 2 5 3 0 3 5 S e C S
Fig. 15. ARMA(2, l) artificial earthquake ground (a) accel- eration, (b) velocity, and (c) displacement corresponding to
the E1 Centro 1940 record.
• , . , . . . . r . . . . , . . . . i . . . . , . . . . r ~ ~ l • , . . . . i
I - . , . . i ¸ r , . . . . ~ " I . . . . I . . . . i . . . . ,
0 5 ~ - - ~
° 5
- 1 , . , . . . . , . . . . , . . i . . . . T . . . . ' . . . . ' . . . . r "
4. ~,
b - e
S e C S
Fig. 16. ARMA(2,1) model parameter estimates for an ARMA(2, 1) artificial realization of the E02NS earthquake
process.
and Housner spectral intensity* (SI). These statistical results are summarized in Table 7 for the ARMA(2, 1) models fitted to the E02NS and E1 Centro records. In the same table, they are compared with the deterministic ground motion parameter values corresponding to the target records, and it can be checked that the statistical interval 'mean + standard deviation' does not contain the parameter value of the target record in the case of PGV, PGD, RMSV, and RMSD due to the low frequency error of the A R M A model already men- tioned. The statistics of PGA, RMSA, and SI agree with the corresponding deterministic ground motion parameter values of the target records. From Table 7, it is observed that for a given earthquake process, the RMSA parameter is the least variable among the set of ground motion parameters considered. In particular, RMSA is found much less variable than PGA, which has been used extensively in the past and is still used as an indicator of damage potential for earthquakes. The choice of a ground motion parameter characterized by a large variability and obtained from a single earthquake realization is not reliable. Statistical analyses of the simulated ground motion parameters showed that their statistical distribution is well approximated by log- normal distributions.
C O N C L U S I O N
A stochastic system identification procedure based on iterative Kalman filtering is presented to estimate nonstationary A R M A models from actual earth-, quake accelerograms. Special attention is given to the ARMA(2, 1) model, a subset of which is covariance equivalent with the well-known continuous-time Kanai- Tajimi stochastic earthquake model. The complete set of parameter relationships between the discrete ARMA(2,1) and the continuous K-T models is presented. Therefore, the discrete-to-continuous con- versions allow the use of the proposed identification scheme to estimate the time-varying physical parameters of a K-T model non-stationary in both amplitude and frequency content. The irregular time histories of the resulting K-T model parameters can then be smooth- ened by least square fit of analytical functions before the nonstationary estimated K-T model can be used in analytical random vibration studies. Alternatively, the time histories of the physical parameters of the K-T model can be specified from engineering judgement and used as such in analytical random vibration studies or they can be converted into the time-varying parameters
= r2-50 PSV((, T) dT, where PSV(~, T) represents the * SI jo.lo pseudo-spectral velocity of the earthquake record for an SDOF oscillator of damping ratio ( = 0.05 and undamped natural period T.

Nonstationary A R M A modeling o f seismic motions
Table 7. Statistics of ground motion parameters from ARMA(2, 1) earthquake models
425
Parameter E02NS E1 Centro 1940
Target Mean c.o.v. Target Mean c.o.v.
PGA (in/sec 2) 78-26 PGV (in/sec) 4-50 PGD (in) 0.42 RMSA (in/sec 2) 11"90 RMSV (in/sec) 0.49 RMSD (in) 0.10 SI (in) 8'27
70-76 0.19 134.52 136.32 0-16 4.35 0.25 13.17 21.45 0-25 2.34 0.48 4.28 14.02 0-36 9.61 0.12 21.80 20-76 0.07 0.95 0.32 3.01 5-03 0.22 0-85 0.46 2.09 4-63 0.34
10-95 0.24 53.43 58.68 0.20
of the equivalent ARMA(2, 1) model using the continu- ous-to-discrete parameter conversions if Monte Carlo simulation studies are preferred.
Results of the application of the proposed identifi- cation procedure for two actual earthquake records are presented. The model validation tests performed are based on examination of the residuals, simulated ground motions (acceleration, velocity, and displacement), tem- poral variation of the ground motion frequency content, and statistics of traditional ground motion parameters.
It appears that time-varying A R M A models can be estimated very efficiently using iterative Kalman filtering and that they are able to capture well the nonstationary features of actual earthquake ground motions, especially the nonstationarity in frequency content. The latter, often neglected in past modeling of earthquake ground motions, can have very important effects on the seismic response of structures exhibiting inelastic degrading behavior.
These realistic A R M A ground motion models have been used to simulate the response of linear and nonlinear structures in order to test the validation of the earthquake model at the structural response level and to investigate how the structural response is influenced by ground motion and structural parameters when the inherent uncertainty contained in the earth- quake ground motion is accounted fo r ) °
A C K N O W L E D G E M E N T S
This research was supported in part by the National Science Foundat ion under Grant ENG-7810992. This financial support is gratefully acknowledged. The authors wish to thank D. Brillinger and R. Oliver of the University of California, Berkeley, for valuable suggestions during the course of this study.
REFERENCES
1. Abrahamson, N.A. et al. The SMART I accelerograph array (1980-1987): a review, Earthquake Spectra, 1987, 3(2), 263-287.
2. Anderson, B.D.O. & Moore, J.B. Optimal Filtering, Prentice-Hall, New Jersey, 1979.
3. Anderson, J.C. & Bertero, V.V. Uncertainties in establish- ing design earthquakes, Journal of the Structural Engineer- ing Division, ASCE, 1987, 113(8), 1709-1725.
4. Araya, R. & Der Kiureghian, A. Seismic hazard analysis: improved models, uncertainties and sensitivities, Report No. UCB/EERC-90/11, Earthquake Engineering Research Center, University of California, Berkeley, CA, 1990.
5. Box, G.E.P. & Jenkins, G.M. Time Series Analysis." Forecasting and Control, revised edition, Holden-Day, San Francisco, 1981.
6. Brillinger, D. Time Series Data Analysis and Theory, expanded edition, Holden-Day, San Francisco, 1981.
7. Cakmak, A.S., Sherif, R.I. & Ellis, G.W. Modeling earthquake ground motions in California using particular time-series method, International Journal of Soil Dynamics & Earthquake Engineering, 1985, 4(3), 124 131.
8. Chang, M.K., Kwiatkowski, J.W. & Nau, R.F. ARMA models for earthquake ground motions, International Journal of Earthquake Engineering & Structural Dynamics, 1982, 10, 651-662.
9. Clough, R.W. & Penzien, J. Dynamics of Structures, McGraw-Hill Book Co., Inc., New York, 1975.
10. Conte, J.P., Pister, K.S. & Mahin, S.A. Influence of the earthquake ground motion process and structural proper- ties on response characteristics of simple structures, Report No. UCB/EERC-90/08, Earthquake Engineering Research Center, University of California, Berkeley, CA, 1990.
11. Deodatis, D. & Shinozuka, M. Autoregressive model for nonstationary stochastic processes, Journal of the Engi- neering Mechanics Division, ASCE, 1988, 114(11), 1995 2012.
12. Gersch, W. & Liu, R. S-Z. Time-series methods for the synthesis of random vibration systems, ASME Trans. Appl. Mech., 1976, 159-165.
13. Gersch, W. & Kitagawa, G. A time varying AR coefficient model for modelling and simulating earthquake ground motion, International Journal of Earthquake Engineering & Structural Dynamics, 1985, 13, 243-254.
14. Housner, G.W. Statistics of pulses on strong-motion accelerograms, N.S.F. Seminar-Workshop on Strong Ground Motion, San Diego, California, 1978.
15. IMSL The International Mathematical and Statistical Library, User's Manual, version 1.1, January 1989.
16. Jurkevics, A. & Ulrych, T.J. Representing and simulating strong ground motion, Bulletin of the Seismological Society of America, 1978, 68(3), 781-801.
17. Kanai, K. Semi-empirical formula for seismic character- ization of the ground, Bulletin of Earthquake Research Institute, University of Tokyo, Tokyo, Japan, 1967, 35.
18. Kitagawa, G. Changing spectrum estimation, Journal of Sound & Vibration, 1983, 89, 433-445.
19. Kozin, F. & Natke, H.G. System identification techniques, Structural Safety, 1986, 3, 269 316.

426 J.P. Conte, K.S. Pister, S.A. Mahin
20. Liu, S.C. Evolutionary power spectral density of strong motion earthquakes, Bulletin of the Seismological Society of America, 1970, 60(3), 891-900.
21. Nau, R.F., Oliver, R.M. & Pister, K.S. Simulating and analysing artificial nonstationary earthquake ground motions, Bulletin of the Seismological Society of America, 1982, 72, 615-636.
22. Newmark, N.M. & Hall, W.J. Procedures and criteria for earthquake resistant design, Building Practices for Disaster Mitigation, National Bureau of Standards, Washington, D.C., Building Sciences Series 46, 1973, 1, 209-236.
23. Newmark, N.M. & Riddell, R. Inelastic spectra for seismic design, Proc. 7th Worm Conf. on Earthquake Engineering, Vol. 4, Istanbul, Turkey, 1980, pp. 129 136.
24. Page, C.G. Instantaneous power spectra, Journal of Applied Physics, 1952, 23(1), 103 106.
25. Papadimitriou, K. Stochastic characterization of strong
ground motion and applications to structural response, Report No. EERL 90-03, California Institute of Technol- ogy, Pasadena, CA, 1990.
26. Polhemus, N.W. & Cakmak, A.S., Simulation of earth- quake ground motion using ARMA models, International Journal of Earthquake Engineering & Structural Dynamics, 1981, 9, 343 354.
27. Spanos, P.D. ARMA algorithms for ocean wave modeling, Journal of Energy Resources Technology, ASME, 19~3, 105, 300 309.
28. Spanos, P.D. & Mignolet, M.P. Simulation of statiolaary random processes: two-stage MA to ARMA approach, Journal of the Engineering Mechanics Division, ASCE, 1990, 116(3), 620-641.
29. Tajimi, H. A standard method of determining the maximum response of a building structure during an earthquake, Proc. 2nd Worm Conf. on Earthquake Engineering, Vol. 2, Tokyo, Japan, 1960, pp. 781 798.